Embed Size (px)
Citation preview
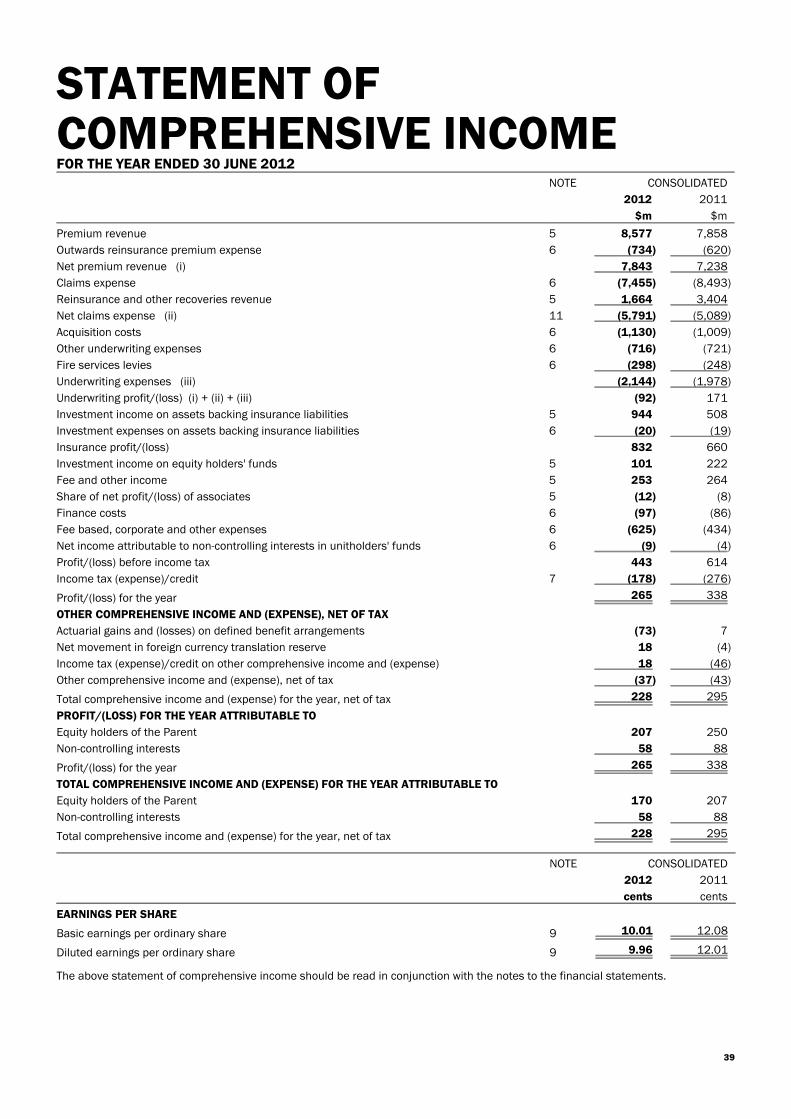
STATEMENT OFCOMPREHENSIVE INCOMEFOR THE YEAR ENDED 30 JUNE 2012
NOTE CONSOLIDATED
2012 2011
$m $m
Premium revenue 5 8,577 7,858
Outwards reinsurance premium expense 6 (734) (620)
Net premium revenue (i) 7,843 7,238
Claims expense 6 (7,455) (8,493)
Reinsurance and other recoveries revenue 5 1,664 3,404
Net claims expense (ii) 11 (5,791) (5,089)
Acquisition costs 6 (1,130) (1,009)
Other underwriting expenses 6 (716) (721)
Fire services levies 6 (298) (248)
Underwriting expenses (iii) (2,144) (1,978)
Underwriting profit/(loss) (i) + (ii) + (iii) (92) 171
Investment income on assets backing insurance liabilities 5 944 508
Investment expenses on assets backing insurance liabilities 6 (20) (19)
Insurance profit/(loss) 832 660
Investment income on equity holders' funds 5 101 222
Fee and other income 5 253 264
Share of net profit/(loss) of associates 5 (12) (8)
Finance costs 6 (97) (86)
Fee based, corporate and other expenses 6 (625) (434)
Net income attributable to non-controlling interests in unitholders' funds 6 (9) (4)
Profit/(loss) before income tax 443 614
Income tax (expense)/credit 7 (178) (276)
Profit/(loss) for the year 265 338
OTHER COMPREHENSIVE INCOME AND (EXPENSE), NET OF TAX
Actuarial gains and (losses) on defined benefit arrangements (73) 7
Net movement in foreign currency translation reserve 18 (4)
Income tax (expense)/credit on other comprehensive income and (expense) 18 (46)
Other comprehensive income and (expense), net of tax (37) (43)
Total comprehensive income and (expense) for the year, net of tax 228 295
PROFIT/(LOSS) FOR THE YEAR ATTRIBUTABLE TO
Equity holders of the Parent 207 250
Non-controlling interests 58 88
Profit/(loss) for the year 265 338
TOTAL COMPREHENSIVE INCOME AND (EXPENSE) FOR THE YEAR ATTRIBUTABLE TO
Equity holders of the Parent 170 207
Non-controlling interests 58 88
Total comprehensive income and (expense) for the year, net of tax 228 295
NOTE CONSOLIDATED
2012 2011
cents cents
EARNINGS PER SHARE
Basic earnings per ordinary share 9 10.01 12.08
Diluted earnings per ordinary share 9 9.96 12.01
The above statement of comprehensive income should be read in conjunction with the notes to the financial statements.
39
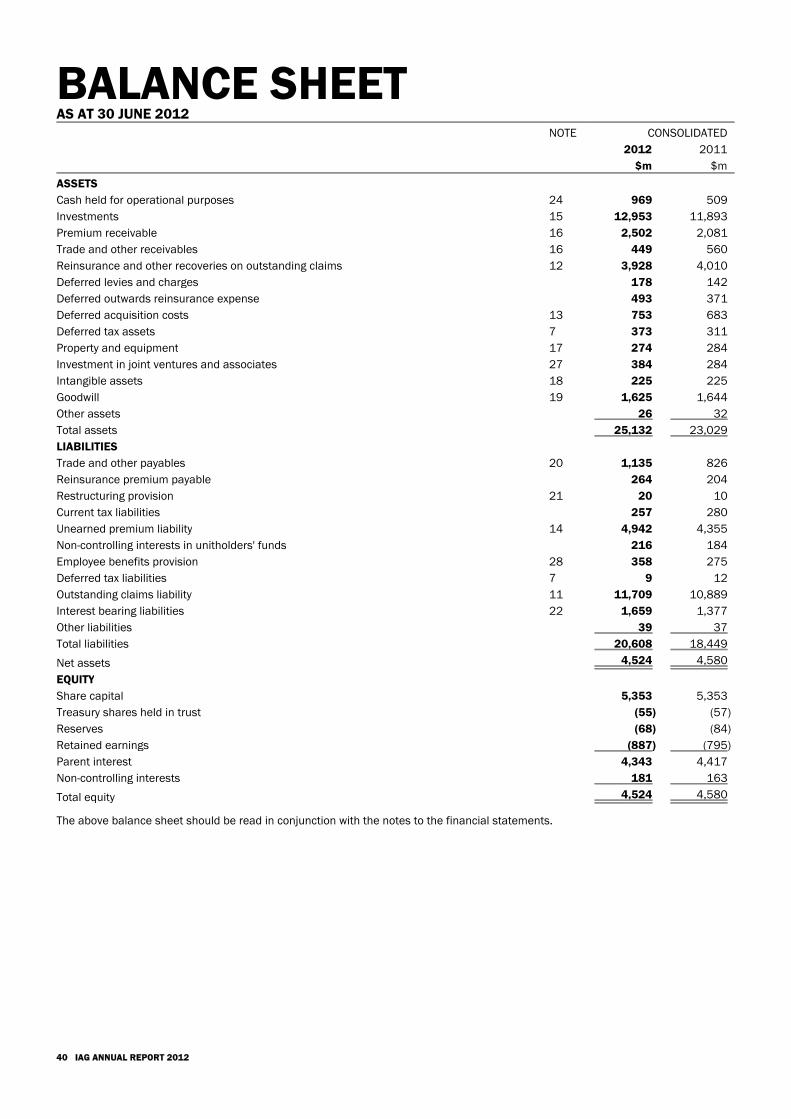
BALANCE SHEETAS AT 30 JUNE 2012
NOTE CONSOLIDATED
2012 2011
$m $m
ASSETS
Cash held for operational purposes 24 969 509
Investments 15 12,953 11,893
Premium receivable 16 2,502 2,081
Trade and other receivables 16 449 560
Reinsurance and other recoveries on outstanding claims 12 3,928 4,010
Deferred levies and charges 178 142
Deferred outwards reinsurance expense 493 371
Deferred acquisition costs 13 753 683
Deferred tax assets 7 373 311
Property and equipment 17 274 284
Investment in joint ventures and associates 27 384 284
Intangible assets 18 225 225
Goodwill 19 1,625 1,644
Other assets 26 32
Total assets 25,132 23,029
LIABILITIES
Trade and other payables 20 1,135 826
Reinsurance premium payable 264 204
Restructuring provision 21 20 10
Current tax liabilities 257 280
Unearned premium liability 14 4,942 4,355
Non-controlling interests in unitholders' funds 216 184
Employee benefits provision 28 358 275
Deferred tax liabilities 7 9 12
Outstanding claims liability 11 11,709 10,889
Interest bearing liabilities 22 1,659 1,377
Other liabilities 39 37
Total liabilities 20,608 18,449
Net assets 4,524 4,580
EQUITY
Share capital 5,353 5,353
Treasury shares held in trust (55) (57)
Reserves (68) (84)
Retained earnings (887) (795)
Parent interest 4,343 4,417
Non-controlling interests 181 163
Total equity 4,524 4,580
The above balance sheet should be read in conjunction with the notes to the financial statements.
40 IAG ANNUAL REPORT 2012
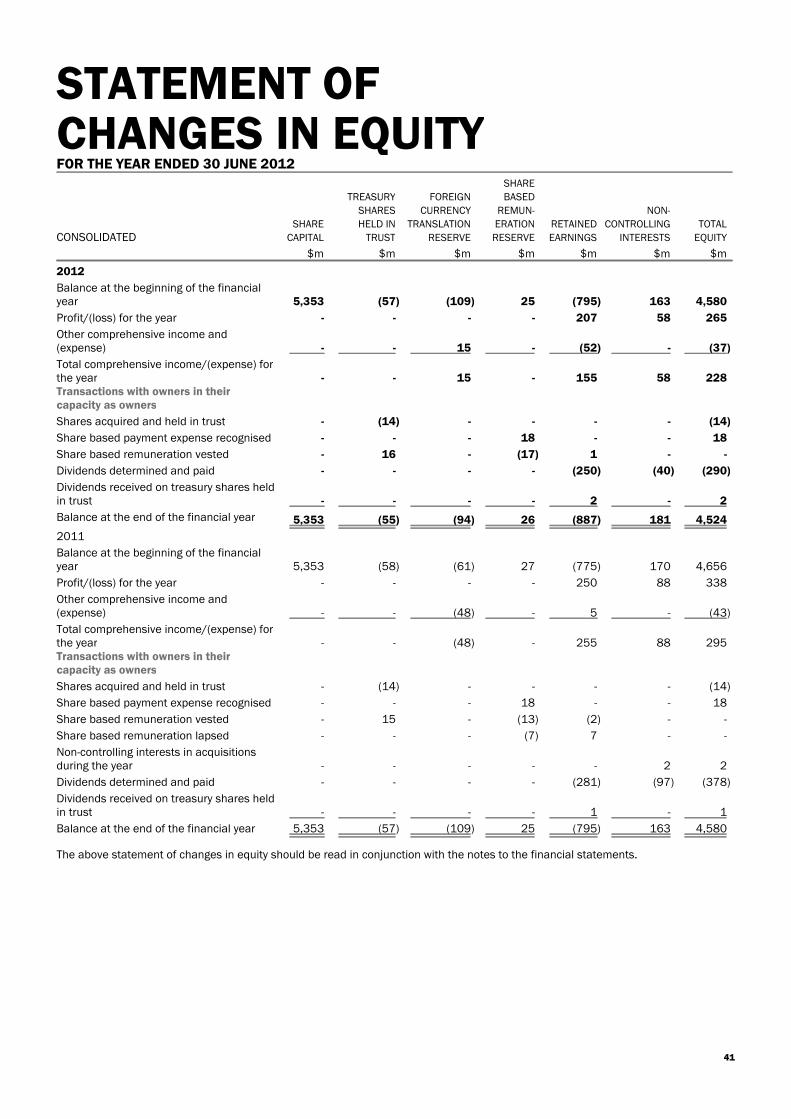
STATEMENT OFCHANGES IN EQUITYFOR THE YEAR ENDED 30 JUNE 2012
CONSOLIDATEDSHARE
CAPITAL
TREASURY
SHARES
HELD IN
TRUST
FOREIGN
CURRENCY
TRANSLATION
RESERVE
SHARE
BASED
REMUN-
ERATION
RESERVE
RETAINED
EARNINGS
NON-
CONTROLLING
INTERESTS
TOTAL
EQUITY
$m $m $m $m $m $m $m
2012
Balance at the beginning of the financialyear 5,353 (57) (109) 25 (795) 163 4,580
Profit/(loss) for the year - - - - 207 58 265
Other comprehensive income and(expense) - - 15 - (52) - (37)
Total comprehensive income/(expense) forthe year - - 15 - 155 58 228Transactions with owners in theircapacity as owners
Shares acquired and held in trust - (14) - - - - (14)
Share based payment expense recognised - - - 18 - - 18
Share based remuneration vested - 16 - (17) 1 - -
Dividends determined and paid - - - - (250) (40) (290)
Dividends received on treasury shares heldin trust - - - - 2 - 2
Balance at the end of the financial year 5,353 (55) (94) 26 (887) 181 4,524
2011
Balance at the beginning of the financialyear 5,353 (58) (61) 27 (775) 170 4,656
Profit/(loss) for the year - - - - 250 88 338
Other comprehensive income and(expense) - - (48) - 5 - (43)
Total comprehensive income/(expense) forthe year - - (48) - 255 88 295Transactions with owners in theircapacity as owners
Shares acquired and held in trust - (14) - - - - (14)
Share based payment expense recognised - - - 18 - - 18
Share based remuneration vested - 15 - (13) (2) - -
Share based remuneration lapsed - - - (7) 7 - -
Non-controlling interests in acquisitionsduring the year - - - - - 2 2
Dividends determined and paid - - - - (281) (97) (378)
Dividends received on treasury shares heldin trust - - - - 1 - 1
Balance at the end of the financial year 5,353 (57) (109) 25 (795) 163 4,580
The above statement of changes in equity should be read in conjunction with the notes to the financial statements.
41
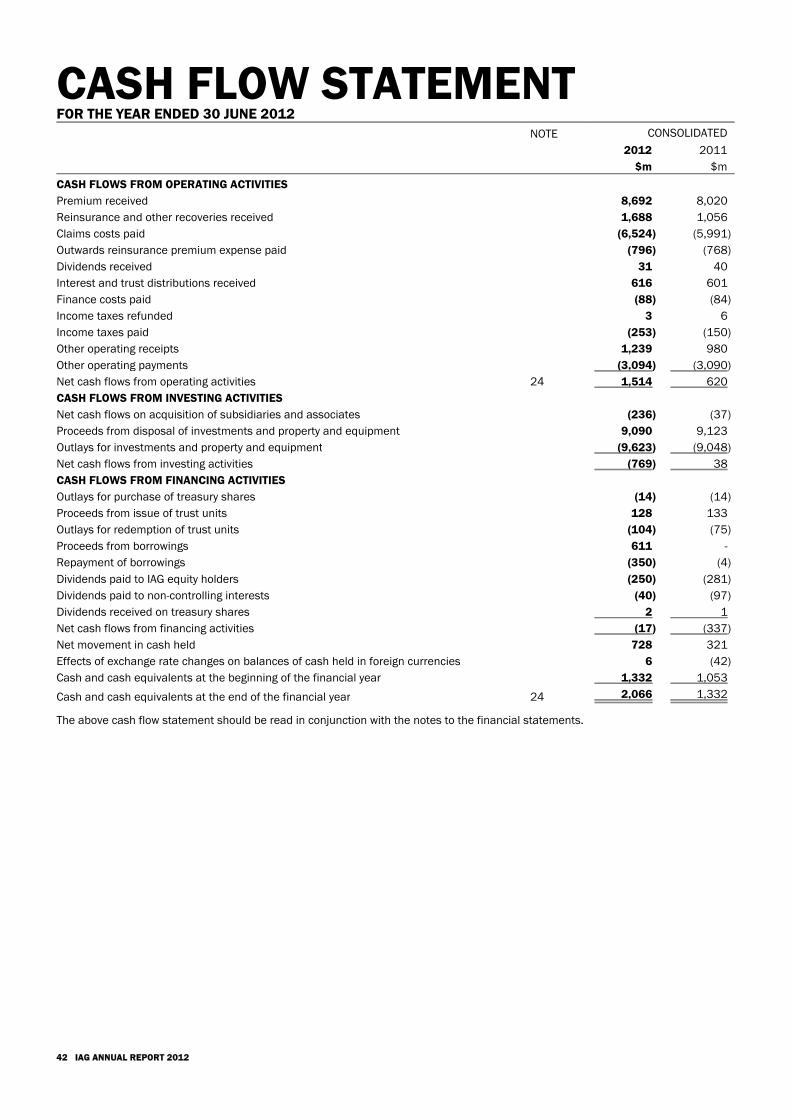
CASH FLOW STATEMENTFOR THE YEAR ENDED 30 JUNE 2012
NOTE CONSOLIDATED
2012 2011
$m $m
CASH FLOWS FROM OPERATING ACTIVITIES
Premium received 8,692 8,020
Reinsurance and other recoveries received 1,688 1,056
Claims costs paid (6,524) (5,991)
Outwards reinsurance premium expense paid (796) (768)
Dividends received 31 40
Interest and trust distributions received 616 601
Finance costs paid (88) (84)
Income taxes refunded 3 6
Income taxes paid (253) (150)
Other operating receipts 1,239 980
Other operating payments (3,094) (3,090)
Net cash flows from operating activities 24 1,514 620
CASH FLOWS FROM INVESTING ACTIVITIES
Net cash flows on acquisition of subsidiaries and associates (236) (37)
Proceeds from disposal of investments and property and equipment 9,090 9,123
Outlays for investments and property and equipment (9,623) (9,048)
Net cash flows from investing activities (769) 38
CASH FLOWS FROM FINANCING ACTIVITIES
Outlays for purchase of treasury shares (14) (14)
Proceeds from issue of trust units 128 133
Outlays for redemption of trust units (104) (75)
Proceeds from borrowings 611 -
Repayment of borrowings (350) (4)
Dividends paid to IAG equity holders (250) (281)
Dividends paid to non-controlling interests (40) (97)
Dividends received on treasury shares 2 1
Net cash flows from financing activities (17) (337)
Net movement in cash held 728 321
Effects of exchange rate changes on balances of cash held in foreign currencies 6 (42)
Cash and cash equivalents at the beginning of the financial year 1,332 1,053
Cash and cash equivalents at the end of the financial year 24 2,066 1,332
The above cash flow statement should be read in conjunction with the notes to the financial statements.
42 IAG ANNUAL REPORT 2012
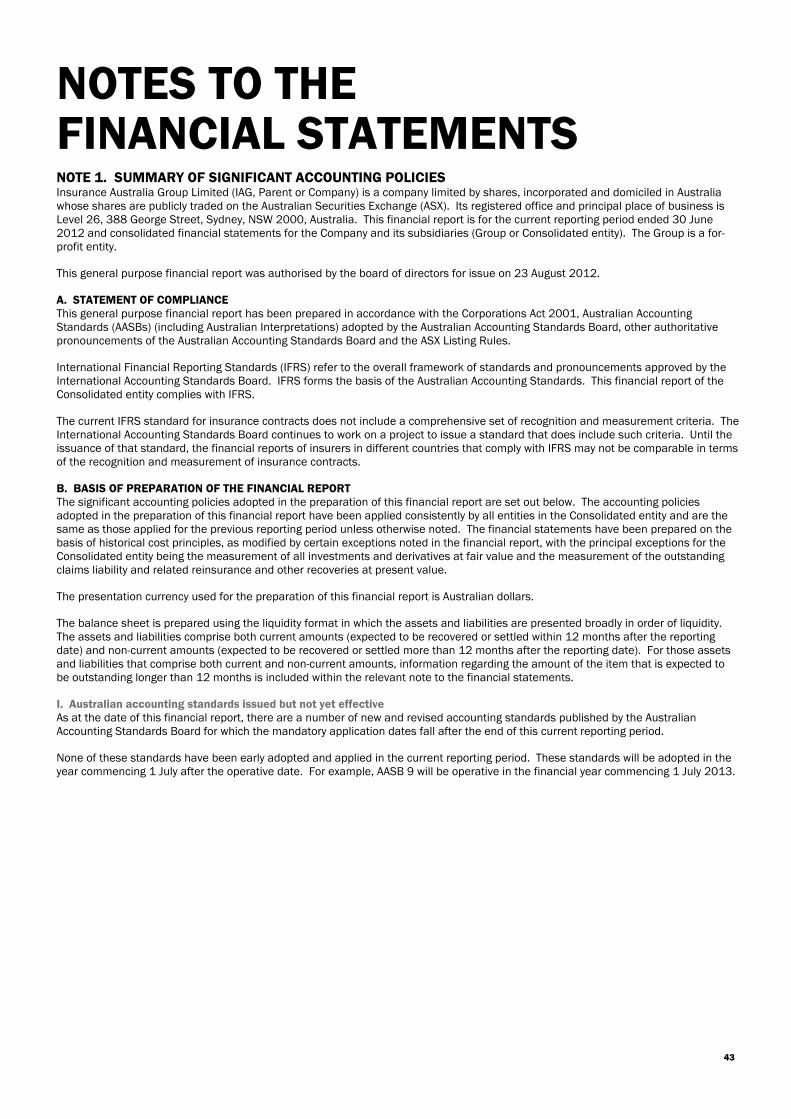
NOTES TO THEFINANCIAL STATEMENTSNOTE 1. SUMMARY OF SIGNIFICANT ACCOUNTING POLICIESInsurance Australia Group Limited (IAG, Parent or Company) is a company limited by shares, incorporated and domiciled in Australiawhose shares are publicly traded on the Australian Securities Exchange (ASX). Its registered office and principal place of business isLevel 26, 388 George Street, Sydney, NSW 2000, Australia. This financial report is for the current reporting period ended 30 June2012 and consolidated financial statements for the Company and its subsidiaries (Group or Consolidated entity). The Group is a for-profit entity.
This general purpose financial report was authorised by the board of directors for issue on 23 August 2012.
A. STATEMENT OF COMPLIANCEThis general purpose financial report has been prepared in accordance with the Corporations Act 2001, Australian AccountingStandards (AASBs) (including Australian Interpretations) adopted by the Australian Accounting Standards Board, other authoritativepronouncements of the Australian Accounting Standards Board and the ASX Listing Rules.
International Financial Reporting Standards (IFRS) refer to the overall framework of standards and pronouncements approved by theInternational Accounting Standards Board. IFRS forms the basis of the Australian Accounting Standards. This financial report of theConsolidated entity complies with IFRS.
The current IFRS standard for insurance contracts does not include a comprehensive set of recognition and measurement criteria. TheInternational Accounting Standards Board continues to work on a project to issue a standard that does include such criteria. Until theissuance of that standard, the financial reports of insurers in different countries that comply with IFRS may not be comparable in termsof the recognition and measurement of insurance contracts.
B. BASIS OF PREPARATION OF THE FINANCIAL REPORT The significant accounting policies adopted in the preparation of this financial report are set out below. The accounting policiesadopted in the preparation of this financial report have been applied consistently by all entities in the Consolidated entity and are thesame as those applied for the previous reporting period unless otherwise noted. The financial statements have been prepared on thebasis of historical cost principles, as modified by certain exceptions noted in the financial report, with the principal exceptions for theConsolidated entity being the measurement of all investments and derivatives at fair value and the measurement of the outstandingclaims liability and related reinsurance and other recoveries at present value.
The presentation currency used for the preparation of this financial report is Australian dollars.
The balance sheet is prepared using the liquidity format in which the assets and liabilities are presented broadly in order of liquidity.The assets and liabilities comprise both current amounts (expected to be recovered or settled within 12 months after the reportingdate) and non-current amounts (expected to be recovered or settled more than 12 months after the reporting date). For those assetsand liabilities that comprise both current and non-current amounts, information regarding the amount of the item that is expected tobe outstanding longer than 12 months is included within the relevant note to the financial statements.
I. Australian accounting standards issued but not yet effectiveAs at the date of this financial report, there are a number of new and revised accounting standards published by the AustralianAccounting Standards Board for which the mandatory application dates fall after the end of this current reporting period.
None of these standards have been early adopted and applied in the current reporting period. These standards will be adopted in theyear commencing 1 July after the operative date. For example, AASB 9 will be operative in the financial year commencing 1 July 2013.
43
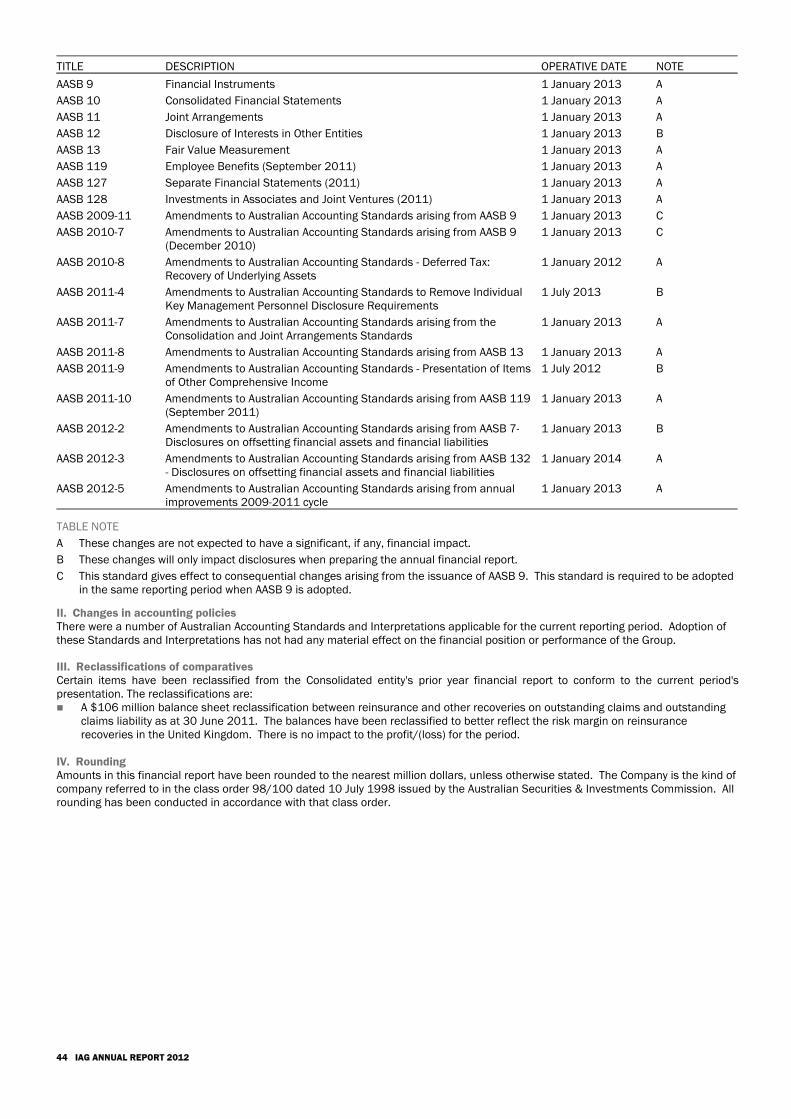
TITLE DESCRIPTION OPERATIVE DATE NOTE
AASB 9 Financial Instruments 1 January 2013 A
AASB 10 Consolidated Financial Statements 1 January 2013 A
AASB 11 Joint Arrangements 1 January 2013 A
AASB 12 Disclosure of Interests in Other Entities 1 January 2013 B
AASB 13 Fair Value Measurement 1 January 2013 A
AASB 119 Employee Benefits (September 2011) 1 January 2013 A
AASB 127 Separate Financial Statements (2011) 1 January 2013 A
AASB 128 Investments in Associates and Joint Ventures (2011) 1 January 2013 A
AASB 2009-11 Amendments to Australian Accounting Standards arising from AASB 9 1 January 2013 C
AASB 2010-7 Amendments to Australian Accounting Standards arising from AASB 9(December 2010)
1 January 2013 C
AASB 2010-8 Amendments to Australian Accounting Standards - Deferred Tax:Recovery of Underlying Assets
1 January 2012 A
AASB 2011-4 Amendments to Australian Accounting Standards to Remove IndividualKey Management Personnel Disclosure Requirements
1 July 2013 B
AASB 2011-7 Amendments to Australian Accounting Standards arising from theConsolidation and Joint Arrangements Standards
1 January 2013 A
AASB 2011-8 Amendments to Australian Accounting Standards arising from AASB 13 1 January 2013 A
AASB 2011-9 Amendments to Australian Accounting Standards - Presentation of Itemsof Other Comprehensive Income
1 July 2012 B
AASB 2011-10 Amendments to Australian Accounting Standards arising from AASB 119(September 2011)
1 January 2013 A
AASB 2012-2 Amendments to Australian Accounting Standards arising from AASB 7-Disclosures on offsetting financial assets and financial liabilities
1 January 2013 B
AASB 2012-3 Amendments to Australian Accounting Standards arising from AASB 132- Disclosures on offsetting financial assets and financial liabilities
1 January 2014 A
AASB 2012-5 Amendments to Australian Accounting Standards arising from annualimprovements 2009-2011 cycle
1 January 2013 A
TABLE NOTE
A These changes are not expected to have a significant, if any, financial impact.
B These changes will only impact disclosures when preparing the annual financial report.
C This standard gives effect to consequential changes arising from the issuance of AASB 9. This standard is required to be adoptedin the same reporting period when AASB 9 is adopted.
II. Changes in accounting policiesThere were a number of Australian Accounting Standards and Interpretations applicable for the current reporting period. Adoption ofthese Standards and Interpretations has not had any material effect on the financial position or performance of the Group.
III. Reclassifications of comparativesCertain items have been reclassified from the Consolidated entity's prior year financial report to conform to the current period'spresentation. The reclassifications are: A $106 million balance sheet reclassification between reinsurance and other recoveries on outstanding claims and outstanding
claims liability as at 30 June 2011. The balances have been reclassified to better reflect the risk margin on reinsurancerecoveries in the United Kingdom. There is no impact to the profit/(loss) for the period.
IV. RoundingAmounts in this financial report have been rounded to the nearest million dollars, unless otherwise stated. The Company is the kind ofcompany referred to in the class order 98/100 dated 10 July 1998 issued by the Australian Securities & Investments Commission. Allrounding has been conducted in accordance with that class order.
44 IAG ANNUAL REPORT 2012
C. PRINCIPLES OF CONSOLIDATION I. SubsidiariesConsolidation is the incorporation of the assets and liabilities of the Parent and all subsidiaries as at the reporting date and the resultsof the Parent and all subsidiaries for the period then ended as if they had operated as a single entity. The balances and effects ofintragroup transactions are eliminated from the consolidation. Subsidiaries are those entities controlled by the Parent. Control existswhen one company has the power, directly or indirectly, to govern the financial and operating policies of an entity so as to obtainbenefits from its activities. Control is presumed to exist when more than half of the voting power of an entity is owned either directly orindirectly. In assessing control, potential voting rights that are exercisable or convertible are taken into account. Where an entityeither began or ceased to be controlled during a financial reporting period, the results are included only from the date controlcommenced or up to the date control ceased.
The financial statements of all subsidiaries are prepared for consolidation for the same reporting period as the Parent, usingconsistent accounting policies. The financial statements of entities operating outside Australia that maintain accounting records inaccordance with overseas accounting principles are adjusted where necessary to comply with the significant accounting policies of theConsolidated entity.
Where a subsidiary is less than wholly owned, the equity interests held by external parties are presented separately as non-controllinginterests on the consolidated balance sheet, except where the subsidiary is a trust or similar entity for which the core equity ispresented as a liability (this is the case with the IAG Asset Management Wholesale Trusts that are subsidiaries, refer to the details ofsubsidiaries note) in which case the third party interest is presented separately on the consolidated balance sheet as a liability.
II. AssociatesAssociates, those entities over which significant influence is exercised and which are not intended for sale in the near future, areaccounted for using equity accounting method. Significant influence is presumed to exist where between 20% and 50% of the votingrights of an entity are held, but can also arise where less than 20% is held through active involvement and influencing policy decisionsaffecting the entity. The investment in associates is initially recognised at cost (fair value of consideration provided plus directlyattributable costs) and is subsequently adjusted for the post-acquisition change in the investor’s share of net assets of the investee.The investor’s share of the profit or loss of the investee is included in the profit or loss of the Consolidated entity and disclosed as aseparate line in the statement of comprehensive income. Distributions received reduce the carrying amount of the investment and arenot included as dividend revenue of the Consolidated entity. Movements in the total equity of the investee that are not recognised inthe profit or loss of the investee are recognised directly in equity of the Consolidated entity and disclosed in the statement of changesin equity. The investments are reviewed annually for impairment.
Where an entity either began or ceased to be an associate during the current financial reporting period, the investment is equityaccounted from the date significant influence commenced or up to the date significant influence ceased.
The financial statements of associates are adjusted where necessary to comply with the significant accounting policies of theConsolidated entity.
When the investor’s share of losses exceeds its interest in the investee, the carrying amount of the investment is reduced to nil andrecognition of further losses is discontinued except to the extent that the investor has incurred obligations or made payments, onbehalf of the investee.
III. Lloyd's syndicatesThe nature of Lloyd’s syndicates is such that even when one party provides the majority of capital, the syndicate as a whole is still notcontrolled for accounting purposes. Members of Lloyd's accept insurance business through syndicates on a separate basis for theirown profit and are not jointly responsible for each other's losses. Hence, even where the Group contributes the majority of capital for asyndicate, only the portion of the syndicate represented by the capital contribution is recognised in the consolidated financial report.
SIGNIFICANT ACCOUNTING POLICIES RELATED TO GENERAL INSURANCE CONTRACTSAll of the general insurance products and reinsurance products on offer, or utilised, meet the definition of an insurance contract (acontract under which one party, the insurer, accepts significant insurance risk from another party, the policyholder, by agreeing tocompensate the policyholder if a specified uncertain future event, the insured event, adversely affects the policyholder) and none ofthe contracts contains embedded derivatives or is required to be unbundled. Insurance contracts that meet the definition of afinancial guarantee contract are accounted for as insurance contracts. This means that all of the general insurance products areaccounted for in the same manner.
D. PREMIUM REVENUEPremium revenue comprises amounts charged to policyholders (direct premium) or other insurers (inwards reinsurance premium) forinsurance contracts. Premium includes amounts collected for levies and charges for which the amount to be paid by the insurer doesnot depend on the amounts collected, such as for fire services levies in Australia, but excludes stamp duties and taxes collected onbehalf of third parties, including the goods and services tax in Australia. Premium is recognised as earned from the date of attachmentof risk (generally the date a contract is agreed to but may be earlier if persuasive evidence of an arrangement exists) over the period ofthe related insurance contracts in accordance with the pattern of the incidence of risk expected under the contracts. The pattern ofthe risks underwritten is generally matched by the passing of time. Premium for unclosed business (business written close to reportingdate where attachment of risk is prior to reporting date and there is insufficient information to accurately identify the business) isbrought to account based on previous experience with due allowance for any changes in the pattern of new business and renewals.The unearned portion of premium is recognised as an unearned premium liability on the balance sheet.
Premium receivable is recognised as the amount due and is normally settled between 30 days and 12 months. The recoverability ofpremium receivable is assessed and provision is made for impairment based on objective evidence and having regard to past defaultexperience. Premium receivable is presented on the balance sheet net of any provision for impairment.
45
E. OUTWARDS REINSURANCEPremium ceded to reinsurers is recognised as an expense in accordance with the pattern of reinsurance service received. Accordingly,a portion of outwards reinsurance premium expense is treated as a prepayment and presented as deferred outwards reinsuranceexpense on the balance sheet at the reporting date.
F. CLAIMSThe outstanding claims liability is measured as the central estimate of the present value of expected future payments relating toclaims incurred at the reporting date with an additional risk margin to allow for the inherent uncertainty in the central estimate. Theliability is measured based on the advice of/valuations performed by, or under the direction of, the Appointed Actuary. The expectedfuture payments include those in relation to claims reported but not yet paid or not yet paid in full, claims incurred but not enoughreported (IBNER), claims incurred but not reported (IBNR) and the anticipated direct and indirect claims handling costs. The liability isdiscounted to present value using a risk free rate.
Claims expense represents claim payments adjusted for the movement in the outstanding claims liability.
The estimation of the outstanding claims liability involves a number of key assumptions and is the most critical accounting estimate.All reasonable steps are taken to ensure that the information used regarding claims exposures is appropriate. However, given theuncertainty in establishing the liability, it is likely that the final outcome will be different from the original liability established. Changesin claims estimates are recognised in profit or loss in the reporting period in which the estimates are changed.
G. REINSURANCE AND OTHER RECOVERIESReinsurance and other recoveries received or receivable on paid claims and on outstanding claims (notified and not yet notified) arerecognised as income. Reinsurance and other recoveries receivable includes the net GST receivable on outstanding claims andrecoveries. Reinsurance recoveries on paid claims are presented as part of trade and other receivables net of any provision forimpairment based on objective evidence for individual receivables. All recoveries receivable on outstanding claims are measured asthe present value of the expected future receipts calculated on the same basis as the outstanding claims liability. Reinsurance doesnot relieve the originating insurer of its liabilities to policyholders and is presented separately on the balance sheet.
H. ACQUISITION COSTSCosts associated with obtaining and recording general insurance contracts are referred to as acquisition costs. These costs includeadvertising expenses, commissions or brokerage paid to agents or brokers, premium collection costs, risk assessment costs and otheradministrative costs. Profit commission received from third party names relating to providing managing agency services to Lloyd'ssyndicates is also included in acquisition costs. Such costs are capitalised where they relate to the acquisition of new business or therenewal of existing business, are presented as deferred acquisition costs, and are amortised on the same basis as the earning patternof the premium over the period of the related insurance contracts. The balance of the deferred acquisition costs at the reporting daterepresents the capitalised acquisition costs relating to unearned premium.
I. LIABILITY ADEQUACY TESTThe liability adequacy test is an assessment of the carrying amount of the unearned premium liability and is conducted at eachreporting date. If current estimates of the present value of the expected future cash flows relating to future claims arising from therights and obligations under current general insurance contracts, plus an additional risk margin to reflect the inherent uncertainty inthe central estimate, exceed the unearned premium liability (net of reinsurance) less related deferred acquisition costs, then theunearned premium liability is deemed to be deficient. The test is performed at the level of a portfolio of contracts that are subject tobroadly similar risks and that are managed together as a single portfolio. Any deficiency arising from the test is recognised in profit orloss with the corresponding impact on the balance sheet recognised first through the write down of deferred acquisition costs for therelevant portfolio of contracts, with any remaining balance being recognised on the balance sheet as an unexpired risk liability.
J. LEVIES AND CHARGESLevies and charges, for which the amount paid does not depend on the amounts collected, as is the case with fire services levies inAustralia, are expensed on the same basis as the recognition of premium revenue. The portion relating to unearned premium istreated as a prepayment and presented as deferred levies and charges on the balance sheet. A liability for levies and charges payableis recognised on business written to the reporting date. Other levies and charges that are simply collected on behalf of third partiesare not recognised as income or expense in profit or loss.
SIGNIFICANT ACCOUNTING POLICIES APPLICABLE TO OTHER ACTIVITIESK. FEE AND OTHER INCOMEFee based revenue is brought to account on an accruals basis being recognised as revenue on a straight line basis in accordance withthe passage of time as the services are provided. Other income is recognised on an accruals basis.
L. LEASESThe majority of leases entered into are operating leases, where the lessor retains substantially all the risks and benefits of ownershipof the leased items. The majority of the lease arrangements are entered into as lessee for which the lease payments are recognisedas an expense on a straight line basis over the term of the lease. Certain sublease arrangements are entered into as the lessor forwhich the lease payments are recognised as revenue on a straight line basis over the term of the lease.
Lease incentives relating to the agreement of a new or renewed operating lease are recognised as an integral part of the netconsideration agreed for the use of the leased asset. Operating lease incentives received are initially recognised as a liability, arepresented as trade and other payables, and are subsequently reduced through recognition in profit or loss as an integral part of thetotal lease expense (lease payments are allocated between rental expense and reduction of the liability) on a straight line basis overthe period of the lease.
46 IAG ANNUAL REPORT 2012
M. TAXATIONI. Income taxIncome tax expense for a reporting period comprises current and deferred tax. Income tax is recognised in profit or loss except to theextent that it relates to items recognised directly in equity, in which case it is recognised in equity.
Current tax expense is the expected tax payable on the taxable income for the year, using tax rates for each jurisdiction, and anyadjustment to tax payable in respect of previous financial periods. Deferred tax expense is the change in deferred tax assets andliabilities between the reporting periods.
Deferred tax assets and liabilities are recognised using the balance sheet method for temporary differences between the carryingamounts of assets and liabilities for financial reporting purposes and the amounts used for taxation purposes, except in the followingcircumstances when no deferred tax asset or liability is recognised: temporary differences if they arose in a transaction, other than a business combination, that at the time of the transaction did not
affect either accounting profit or taxable profit or loss;
temporary differences between the carrying amount and tax bases of investments in subsidiaries where it is probable that thedifferences will not reverse in the foreseeable future; and
temporary differences relating to the initial recognition of goodwill.
The amount of deferred tax provided is based on the expected manner of realisation or settlement of the carrying amount of assetsand liabilities, using tax rates enacted or substantively enacted at reporting date. Deferred tax assets are recognised only to the extentthat it is probable that future taxable profits will be available against which the asset can be utilised.
II. Tax consolidationIAG and its Australian resident wholly owned subsidiaries adopted the tax consolidation legislation with effect from 1 July 2002 and aretherefore taxed as a single entity from that date. IAG is the head entity within the tax-consolidated group.
Any current tax liabilities (or assets) and deferred tax assets arising from unused tax losses of the subsidiaries are assumed by thehead entity in the tax-consolidated group and are recognised as amounts receivable/(payable) from/(to) other entities in the tax-consolidated group in conjunction with any tax funding arrangement amounts. Any difference between these amounts is recognised byIAG as an equity contribution or distribution.
All entities in the tax consolidated group have entered into a tax sharing agreement which, in the opinion of the Directors, limits thejoint and several liabilities of the wholly owned entities in the case of a default by the head entity.
The entities have also entered into a tax funding agreement under which the wholly owned entities fully compensate the Company forany current tax payable assumed.
III. Goods and services taxRevenue, expenses and assets are recognised net of the amount of goods and services tax (GST), except where the amount of GSTincurred is not recoverable. In these circumstances the GST is recognised as part of the cost of acquisition of the asset or as part ofan item of expense.
Receivables and payables are stated inclusive of GST. Cash flows are included in the cash flow statement on a gross basis.
N. INVESTMENTSInvestments comprise assets held to back insurance liabilities (also referred to as technical reserves) and assets that represent equityholders' funds. All investments are managed and performance evaluated on a fair value basis for both external and internal reportingpurposes in accordance with a documented risk management strategy.
All investments are designated as fair value through profit or loss upon initial recognition. They are initially recorded at fair value(being the cost of acquisition excluding transaction costs) and are subsequently remeasured to fair value at each reporting date.Changes in the fair value are recognised as realised or unrealised investment gains or losses in profit or loss. Purchases and sales ofinvestments are recognised on a trade date basis, being the date on which a commitment is made to purchase or sell the asset.Transaction costs for purchases of investments are expensed as incurred. Investments are derecognised when the rights to receivefuture cash flows from the assets have expired, or have been transferred, and substantially all the risks and rewards of ownershiphave transferred.
For securities traded in an active market, fair value is determined by reference to published bid price quotations. For securities tradedin a market that is not active, valuation techniques are used based on market observable inputs. In a limited number of instances,valuation techniques are based on non-market observable inputs.
Investment revenue is brought to account on an accruals basis. Revenue on investments in equity securities and property trusts isdeemed to accrue on the date the dividends/distributions are declared, which for listed equity securities is deemed to be the ex-dividend date.
47
O. INVESTMENT IN SUBSIDIARIESInvestment in subsidiaries is initially recognised at cost (fair value of consideration provided plus directly attributable costs) and issubsequently carried at the lower of cost and recoverable amount by the Parent entity. Costs incurred in investigating and evaluatingan acquisition up to the point of formal commitment to an acquisition are expensed as incurred. Where the carrying value exceeds therecoverable amount, an impairment charge is recognised in profit or loss which can subsequently be reversed in certain conditions.
Where an additional interest is purchased in an existing subsidiary, the acquisition is treated as a transaction between owners and hasno impact on the statement of comprehensive income.
Income from these investments, comprising dividends and trust distributions, is brought to account on an accruals basis. Dividendrevenue is accrued on the date the dividends are declared.
P. INVESTMENT IN JOINT VENTURES AND ASSOCIATESInvestment in joint ventures and associates is initially recognised at cost (fair value of consideration provided plus directly attributablecosts) by the entity holding the ownership interest, including attributed goodwill, and is subsequently carried in the entity’s financialstatements at the lower of cost and recoverable amount.
Q. DERIVATIVESThe Group uses a variety of derivatives to manage various risks. Derivatives are used solely to manage risk exposure and are not usedfor trading or speculation.
I. Derivatives without hedge accounting appliedDerivatives are initially recognised at trade date at fair value excluding transaction costs. The fair value is determined by reference tocurrent market quotes or generally accepted valuation principles.
Transaction costs for purchases of derivatives are expensed as incurred.
For derivatives that do not qualify for hedge accounting, the changes in fair value are immediately recognised in profit or loss. Thederivatives in relation to the investment operations are presented together with the underlying investments while the derivatives inrelation to corporate treasury transactions are presented as receivables when the fair value is positive, or as payable when the fairvalue is negative.
Where derivatives qualify for hedge accounting, the treatment is set out in section II.
II. Hedge accountingHedge accounting may be applied to derivatives designated as hedging instruments provided certain criteria are met. Certaintransactions have been designated as the following: Fair value hedge: hedge of a change in fair value of an asset or liability or an unrecognised firm commitment; or
Cash flow hedge: hedge of the variability in highly probable future cash flows attributable to a recognised asset or liability, or aforecast transaction; or
Net investment hedge: hedge of a net investment in a foreign operation.
To qualify for hedge accounting, at the inception of the hedge and throughout its life, each hedge must be expected to be highlyeffective. Actual effectiveness in the range of 80% to 125% must also be demonstrated on an ongoing basis. When it is determinedthat a derivative for which hedge accounting has been designated is not (or ceases to be) effective, hedge accounting is discontinuedprospectively from the date of ineffectiveness.
a. FAIR VALUE HEDGE Changes in the fair value of hedging instrument are recognised in profit or loss, together with changes in the fair value of the hedgedasset or liability that are attributable to the hedged risk.
b. CASH FLOW HEDGE The effective portion of changes in the fair value of derivatives that are designated and qualify as cash flow hedges is recognised inreserves as part of equity. Any gain or loss relating to an ineffective portion is immediately recognised in profit or loss.
When the forecast transaction that is hedged results in the recognition of a financial asset or a financial liability, the associated gainsand losses that had been deferred in equity are transferred into profit or loss in the same period or periods when the hedged itemaffects profit or loss. When the forecast transaction that is hedged results in the recognition of a non financial asset or a non financialliability, the associated gains and losses that had been deferred in equity are transferred from equity and included in the initialmeasurement of the cost of the asset or liability.
c. NET INVESTMENT HEDGEHedges of net investments in foreign operations are accounted for similarly to cash flow hedges. Any gain or loss on the hedginginstrument relating to the effective portion of the hedge is recognised in equity while the gain or loss relating to the ineffective portionis immediately recognised in profit or loss. Gains and losses accumulated in the equity reserve are recognised in profit or loss uponthe disposal of the foreign operation.
III. Embedded derivativesDerivatives embedded in other financial instruments or other non financial host contracts are treated separately when their risks andcharacteristics are not closely related to those of the host contract. Where an embedded derivative is required to be separated, it ismeasured at fair value and change in the fair value is recognised in profit or loss.
48 IAG ANNUAL REPORT 2012
R. TRADE AND OTHER RECEIVABLESTrade and other receivable are stated at the amounts to be received in the future, less any impairment losses. The amounts arediscounted where the effect of the time value of money is material. The recoverability of debts is assessed on an ongoing basis andprovision for impairment is made based on objective evidence and having regard to past default experience. The impairment charge isrecognised in profit or loss. Debts which are known to be uncollectible are written off.
S. PROPERTY AND EQUIPMENTProperty and equipment is initially recorded at cost which is the fair value of consideration provided plus incidental costs directlyattributable to the acquisition.
All items of property and equipment are carried at cost less accumulated depreciation and accumulated impairment charges.Depreciation is calculated using the straight line method to allocate the cost of assets less any residual value over the estimateduseful economic life.
The carrying amount of property and equipment is reviewed each reporting date. If any impairment indicates or exists, the item istested for impairment by comparing the recoverable amount of the asset or its cash generating unit to the carrying value. Where anexisting carrying value exceeds the recoverable amount, the difference is recognised in profit or loss.
The net gain or loss on disposal of property and equipment is recognised in profit or loss and is calculated as the difference betweenthe carrying amount of the asset at the time of disposal and the net proceeds.
T. BUSINESS COMBINATIONSBusiness combinations are accounted for using the acquisition method. The consideration transferred for the acquisition is the fairvalue of the assets transferred, the equity instruments issued and the liabilities incurred or assumed at the date of exchange. Theconsideration includes the fair value of any asset or liability resulting from a contingent consideration arrangement.
Identifiable assets acquired and liabilities and contingent liabilities assumed in a business combination are measured at fair value onthe acquisition date. The group measures any non-controlling interest, on a transaction-by-transaction basis, either at fair value or atthe non-controlling interest’s proportionate share of the fair value of the identifiable assets and liabilities.
Acquisition related costs are expensed as incurred.
If the business combination is achieved in stages, the acquisition fair value of the acquirer’s previously held equity interest in theacquiree is remeasured to fair value at the acquisition date through profit or loss.
Where settlement of any part of cash consideration is contingent upon some future event or circumstance, the estimated amountspayable in the future are discounted to their present value at the date of exchange. When the contingent consideration is classified asa liability, the impact on any subsequent changes in fair value is recognised as profit or loss in the statement of comprehensiveincome.
Where the initial accounting for a business combination is determined only provisionally by the first reporting date after acquisitiondate, the business combination is accounted for using those provisional values. Any subsequent adjustments to those provisionalvalues are recognised within 12 months of the acquisition date and are applied effective from the acquisition date.
U. INTANGIBLE ASSETSI. Acquired intangible assetsAcquired intangible assets are initially recorded at their cost at the date of acquisition being the fair value of the considerationprovided and, for assets acquired separately, incidental costs directly attributable to the acquisition. Intangible assets with finiteuseful lives are amortised on a straight line basis (unless the pattern of usage of the benefits is significantly different) over theestimated useful lives of the assets being the period in which the related benefits are expected to be realised (shorter of legal durationand expected economic life). Amortisation rates and residual values are reviewed annually and any changes are accounted forprospectively.
The carrying amount of intangible assets with finite useful lives is reviewed each reporting date by determining whether there is anindication that the carrying value may be impaired. If any such indication exists, the item is tested for impairment by comparing therecoverable amount of the asset or its cash generating unit to the carrying value. Where the recoverable amount is determined by thevalue in use, the projected net cash flows are discounted using a pre tax discount rate. For assets with indefinite useful lives, therecoverability of the carrying value of the assets is reviewed for impairment at each reporting date, or more frequently if events orchanges in circumstances indicate that it might be impaired. An impairment charge is recognised when the carrying value exceeds thecalculated recoverable amount. Impairment charges are recognised in profit or loss and may be reversed where there has been achange in the estimates used to determine the recoverable amount.
II. Software development expenditureSoftware development expenditure that meets the criteria for recognition as an intangible asset is capitalised on the balance sheetand amortised over its expected useful life, subject to impairment testing. Costs incurred in researching and evaluating a project up tothe point of formal commitment to a project are treated as research costs and are expensed as incurred. Only software developmentprojects with total budgeted expenditure of more than $2 million are considered for capitalisation or where such services are providedunder a comprehensive outsourcing agreement. Smaller projects and other costs are treated as maintenance costs, being an ongoingpart of maintaining effective computer systems, and are expensed as incurred.
49
All such capitalised costs are deemed to have an expected useful life of three years unless it can be clearly demonstrated for a specificproject that the majority of the net benefits are to be generated over a longer period. The capitalised costs are amortised on a straightline basis over the period following completion of a project or implementation of part of a project. The recoverability of the carryingamount of the asset is assessed in the same manner as for acquired intangible assets with finite useful lives.
V. GOODWILLGoodwill is initially measured as the excess of the purchase consideration over the fair value of the net identifiable assets andcontingent liabilities acquired and subsequently presented net of any impairment charges. Goodwill arising on acquisitions prior to 1July 2004 has been carried forward on the basis of its deemed cost being the net carrying amount as at that date.
For the purpose of impairment testing, goodwill is allocated to Cash Generating Units (CGUs). CGUs are determined principally basedon how goodwill is monitored by management. The carrying value of goodwill is tested for impairment at each reporting date.
Where the carrying value exceeds the recoverable amount, an impairment charge is recognised in profit or loss and cannotsubsequently be reversed. The recoverable amount of goodwill is determined by the present value of the estimated future cash flowsby using a pre-tax discount rate that reflects current market assessment of the risks specific to the CGUs.
At the date of disposal of a business, attributed goodwill is used to calculate the gain or loss on disposal.
W. TRADE AND OTHER PAYABLESTrade and other payables are carried at cost, which is the fair value of the consideration to be paid in the future for goods and servicesreceived. The amounts are discounted where the effect of the time value of money is material.
X. RESTRUCTURING PROVISIONA restructuring provision is recognised for the expected costs associated with restructuring where there is a detailed formal plan forrestructure and a valid expectation has been raised in those persons expected to be affected. The provision is based on the directexpenditure to be incurred which is both directly and necessarily caused by the restructuring, including termination benefits,decommissioning of information technology systems and exiting surplus premises, and does not include costs associated with ongoingactivities. The adequacy of the provision is reviewed regularly and adjusted if required. Revisions in the estimated amount of arestructuring provision are reported in the period in which the revision in the estimate occurs. The provision is discounted using a pretax discount rate where the effect of the time value of money is material. Where discounting is applied, the increase in the provisiondue to the passage of time is recognised as a finance cost.
Y. LEASE PROVISIONCertain operating leases for property require that the land and/or building be returned to the lessor in its original condition, however,the related operating lease payments do not include an element for the cost this will involve. The present value of the estimated futurecost for the plant and equipment to be removed and the premises to be returned to the lessor in its original condition are recognisedas a lease provision when the relevant alterations are made to the premises. The costs are capitalised as part of the cost of plant andequipment and then depreciated over the useful lives of the assets (refer to section S of the summary of significant accounting policiesnote).
Z. EMPLOYEE BENEFITSI. Wages and salaries, annual leave and sick leaveLiabilities for wages and salaries (including bonuses), annual leave and sick leave are recognised at the nominal amounts unpaid atthe reporting date using remuneration rates that are expected to be paid when these liabilities are settled, including on-costs. Aliability for sick leave is considered to exist only when it is probable that sick leave taken in the future will be greater than entitlementsthat will accrue in the future.
II. Long service leaveA liability for long service leave is recognised as the present value of estimated future cash outflows to be made in respect of servicesprovided by employees up to the reporting date. The estimated future cash outflows are discounted using interest rates on nationalgovernment guaranteed securities which have terms to maturity that match, as closely as possible, the estimated future cash outflows.Factors which affect the estimated future cash outflows such as expected future salary increases, experience of employee departuresand period of service, are incorporated in the measurement.
III. Share based incentive arrangementsShare based remuneration is provided in different forms to eligible employees and IAG directors. All of the arrangements are equitysettled share based payments. The fair value at grant date (the date at which the employer and the employee have a sharedunderstanding of the terms and conditions of the arrangement) is determined for each equity settled share based payment using avaluation model which excludes the impact of any non market vesting conditions. This fair value does not change over the life of theinstrument. At each reporting date during the vesting period (the period during which related employment services are provided), andupon the final vesting or expiry of the equity instruments, the total accumulated expense is revised based on the fair value at grantdate and the latest estimate of the number of equity instruments that are expected to vest based on non market vesting conditionsonly, and taking into account the expired portion of the vesting period. Changes in the total accumulated expense from the previousreporting date are recognised in profit or loss with a corresponding movement in an equity reserve. Upon exercise of the relevantinstruments, the balance of the share based remuneration reserve relating to those instruments is transferred within equity.
The different treatment of market and non market vesting conditions means that if an equity instrument does not vest because aparticipant ceases relevant employment then the accumulated expense charged in relation to that participant is reversed, but if anequity instrument does not vest only because a market condition is not met, the expense is not reversed.
50 IAG ANNUAL REPORT 2012
To satisfy obligations under the various share based remuneration plans, shares are generally bought on market at or near grant dateof the relevant arrangement and held in trust. Shares held in trust that are controlled for accounting purposes are treated as treasuryshares held in trust (refer to section AF of the summary of significant accounting policies note).
IV. SuperannuationFor defined contribution superannuation plans, obligations for contributions are recognised in profit or loss as they become payable.For defined benefit superannuation plans, the net financial position of the plans is recognised on the balance sheet and the movementin the net financial position is recognised in profit or loss, except for actuarial gains and losses (experience adjustments and changesin actuarial assumptions), which are recognised directly in retained earnings.
AA. INTEREST BEARING LIABILITIES AND FINANCE COSTSInterest bearing liabilities are initially recognised at fair value less transaction costs that are directly attributable to the transaction.After initial recognition the liabilities are carried at amortised cost using the effective interest method.
Finance costs include interest, which is accrued at the contracted rate and included in payables, amortisation of transaction costswhich are capitalised, presented together with the borrowings, and amortised over the life of the borrowings or a shorter period ifappropriate, and amortisation of discounts or premiums (the difference between the original proceeds, net of transaction costs, andthe settlement or redemption value of borrowings) over the term of the liabilities. Where interest payments are subject to hedgeaccounting, they are recognised as finance costs net of any effect of the hedge.
AB. FOREIGN CURRENCYI. Functional and presentation currencyItems included in the financial records are measured using the currency of the primary economic environment in which the entityoperates (functional currency). The financial statements are presented in Australian dollars, which is the presentation currency of theGroup.
II. Translation of foreign currency transactionsForeign currency transactions are translated into the functional currency using the exchange rates prevailing at the dates of thetransactions. Monetary assets and liabilities denominated in foreign currencies at reporting date, are translated to the functionalcurrency using reporting date exchange rates. Resulting exchange differences are recognised in profit or loss.
III. Translation of the financial results of foreign operationsThe financial position and performance of foreign operations with a functional currency other than Australian dollars are translated intothe presentation currency for inclusion in the consolidated financial statements. The assets and liabilities are translated usingreporting date exchange rates while equity items are translated using historical rates. Items from the statement of comprehensiveincome are translated using weighted average rates for the reporting period. Exchange differences arising from the translations arerecorded directly in equity in the foreign currency translation reserve. Goodwill and fair value adjustments arising on the acquisition ofa foreign operation are treated as assets and liabilities of the foreign operation and translated using reporting date exchange rates.
On the disposal of a foreign operation, the cumulative amount of the exchange differences deferred in the foreign currency translationreserve relating to that foreign operation is recognised in profit or loss.
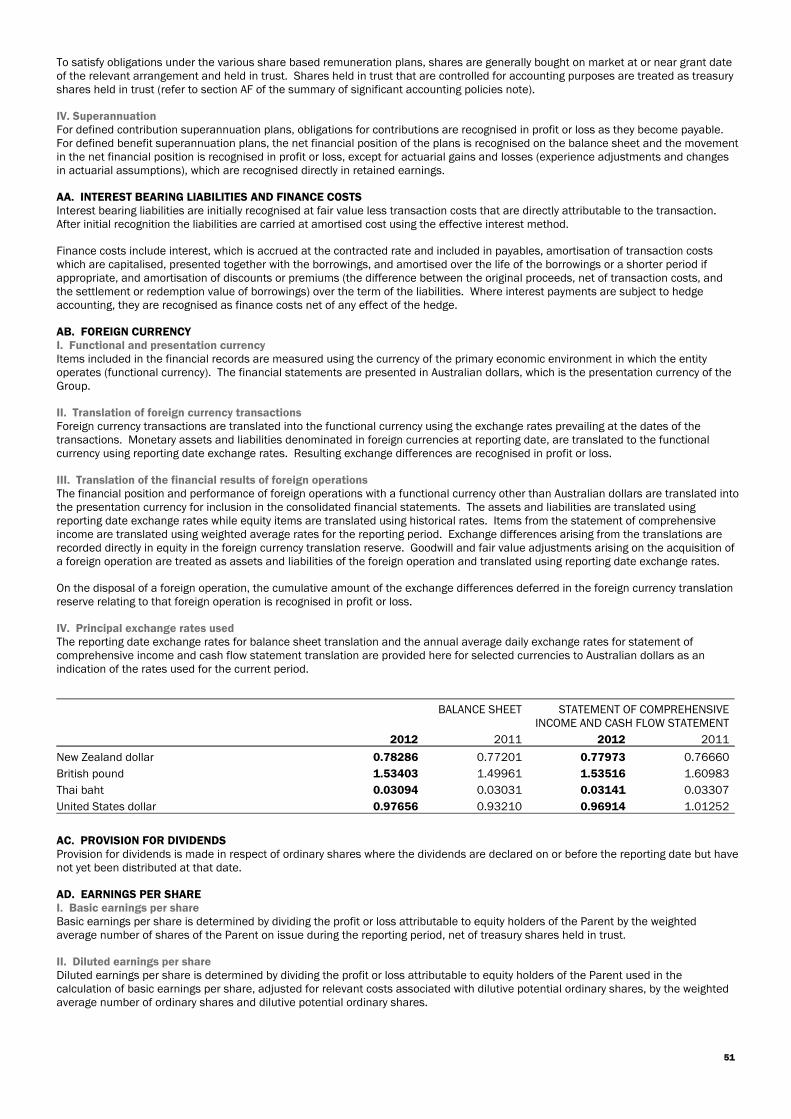
IV. Principal exchange rates usedThe reporting date exchange rates for balance sheet translation and the annual average daily exchange rates for statement ofcomprehensive income and cash flow statement translation are provided here for selected currencies to Australian dollars as anindication of the rates used for the current period.
BALANCE SHEET STATEMENT OF COMPREHENSIVEINCOME AND CASH FLOW STATEMENT
2012 2011 2012 2011
New Zealand dollar 0.78286 0.77201 0.77973 0.76660
British pound 1.53403 1.49961 1.53516 1.60983
Thai baht 0.03094 0.03031 0.03141 0.03307
United States dollar 0.97656 0.93210 0.96914 1.01252
AC. PROVISION FOR DIVIDENDSProvision for dividends is made in respect of ordinary shares where the dividends are declared on or before the reporting date but havenot yet been distributed at that date.
AD. EARNINGS PER SHAREI. Basic earnings per shareBasic earnings per share is determined by dividing the profit or loss attributable to equity holders of the Parent by the weightedaverage number of shares of the Parent on issue during the reporting period, net of treasury shares held in trust.
II. Diluted earnings per shareDiluted earnings per share is determined by dividing the profit or loss attributable to equity holders of the Parent used in thecalculation of basic earnings per share, adjusted for relevant costs associated with dilutive potential ordinary shares, by the weightedaverage number of ordinary shares and dilutive potential ordinary shares.
51
AE. SHARE CAPITALShares are classified as equity when there is no obligation to transfer cash or other assets to the holder. Transaction costs directlyattributable to the issue of equity instruments are shown in equity as a deduction from the proceeds, net of tax.
AF. TREASURY SHARES HELD IN TRUSTOrdinary shares of IAG that are controlled for accounting purposes by share based remuneration trusts that are subsidiaries of theConsolidated entity, are presented on the balance sheet as treasury shares held in trust. The shares are measured at cost (totalamount paid to acquire the shares including directly attributable costs), and are presented as a deduction from equity until they areotherwise dealt with. No gain or loss is recognised in profit or loss on the sale, cancellation or reissue of the shares. The shares arederecognised as treasury shares held in trust when the shares vest or are released to the participant.
NOTE 2. CRITICAL ACCOUNTING ESTIMATES AND JUDGEMENTSIn the process of applying the significant accounting policies, certain critical accounting estimates and assumptions are used, andcertain judgements are made.
The estimates and related assumptions are based on experience and other factors that are considered to be reasonable, the results ofwhich form the basis for judgements about the carrying values of assets and liabilities. Actual results may differ from these estimates.The estimates and underlying assumptions are reviewed on an ongoing basis. Revisions to accounting estimates are recognised in theperiod in which the estimates are revised, and future periods if relevant.
The areas where the estimates and assumptions involve a high degree of judgement or complexity and are considered significant tothe financial statements, listed together with reference to the notes to the financial statements where more information is provided,are: insurance contracts related:
claims, refer to note 11;
reinsurance and other recoveries on outstanding claims, refer to note 12; and
liability adequacy test, refer to note 14.B.
The estimation process of the gross cash flows for the recent natural catastrophe events in New Zealand is conducted in asimilar manner to that described above, but is subject to a high degree of uncertainty owing to the unique nature of theevents including the allocation of costs between the events for policies affected by multiple events, the decision processsurrounding the zoning of land for rebuilding and the estimated cost of the event relative to the size of the New Zealandeconomy.
There are other amounts relating to insurance contracts that are based on allocation methodologies supported byassumptions (e.g. deferred acquisition costs). The estimates relate to past events, do not incorporate forward lookingconsiderations, and generally do not change from year to year.
other: intangible assets and goodwill impairment testing, refer to notes 18 and 19;
acquired intangible assets initial measurement and determination of useful life, refer to notes 18 and 25;
income tax and related assets and liabilities, refer to note 7;
share based remuneration, refer to note 29; and
defined benefit superannuation arrangements, refer to note 30.
The accounting judgements made during the reporting period that did not involve estimations, other than described above, areconsidered to have had no significant impact on the amounts recognised in the financial report (2011–none).
NOTE 3. INSURANCE RISK MANAGEMENTA key risk from operating in the general insurance industry is the exposure to insurance risk arising from underwriting generalinsurance contracts. The insurance contracts transfer risk to the insurer by indemnifying the policyholders against adverse effectsarising from the occurrence of specified uncertain future events. There is a risk that the actual amount of claims to be paid in relationto contracts will be different to the amount estimated at the time a product was designed and priced. The Consolidated entity isexposed to this risk because the price for a contract must be set before the losses relating to the product are known. Hence theinsurance business involves inherent uncertainty. The Consolidated entity also faces other risks relating to the conduct of the generalinsurance business including financial risks (refer to the financial risk management note) and capital risks (refer to the capitalmanagement note).
A fundamental part of the Group's overall risk management strategy is the effective governance and management of the risks thatimpact the amount, timing and certainty of cash flows arising from insurance contracts.
52 IAG ANNUAL REPORT 2012
A. RISK MANAGEMENT FRAMEWORKThe Group has in place a dedicated group risk management function responsible for the development and maintenance of the riskmanagement framework. The risk management framework provides reasonable assurance that the Group’s material risks are beingprudently and soundly managed. At the same time it is acknowledged that all business activity entails risk so the focus is onmanagement of this risk rather than complete risk avoidance. The risk management framework is outlined in a written RiskManagement Strategy (RMS) which is in accordance with the prudential standards issued by the Australian Prudential RegulationAuthority (APRA). The RMS: is a high level, strategic document intended to describe key elements of the risk management framework;
describes board and management approved parameters (i.e. risk appetite) within which key decisions must be made;
is a key input into how regulators understand and assess the approach to risk management; and
forms the basis of twice yearly declarations provided by executives and senior management to the board.
The framework also includes clearly defined managerial responsibilities, details of the group level risk management related policiesand the key processes to identify, assess, monitor, report on and mitigate material risks, financial and non financial, likely to be faced.The group level policies for the management of risk are required to be applied by all businesses consistently across the Group andtake into consideration local circumstances in non-Australian jurisdictions. There is a transition period for newly acquired businessesto comply with these policies.
A review process is in place to ensure that the risk management framework remains appropriate and effective. The Group has aninternal audit function. As part of the internal audit plan there are reviews undertaken on various aspects of the risk managementframework usage in the business divisions. Standard & Poor’s (S&P) has rated the Group enterprise risk management program to be‘strong’.
The RMS is updated annually or as required to ensure it is materially correct and is approved by the board. It is resubmitted to APRAafter any material changes are made. A three year rolling business plan is also submitted to APRA after each annual review orwhenever material changes are made.
The framework also includes a written Reinsurance Management Strategy (REMS) which sets out key elements of the reinsurancemanagement framework, processes for setting and monitoring the maximum event retention (MER), processes for selecting,implementing, monitoring and reviewing reinsurance arrangements and identification, roles and responsibilities of those charged withmanagerial responsibility for the reinsurance management framework. The REMS is in accordance with the prudential standardsissued by APRA. The REMS is updated annually and approved by the board.
B. RISK MANAGEMENT OBJECTIVES AND POLICIES FOR MITIGATING INSURANCE RISKThe insurance activities primarily involve the underwriting of risks and the management of claims. A disciplined approach to riskmanagement is adopted rather than a premium volume or market share orientated approach. IAG believes this approach provides thegreatest long term likelihood of being able to meet the objectives of all stakeholders, including policyholders, lenders and equityholders.
The policies for the management of risk are applied consistently across the Group and take into consideration local circumstances innon-Australian jurisdictions. There is a transition period for newly acquired businesses to comply with these policies.
The key policies and processes put in place to mitigate insurance risk include the following.
I. Acceptance and pricing of riskThe underwriting of large numbers of less than fully correlated individual risks, across a range of classes of insurance businesses, indifferent regions reduces the variability in overall claims experience over time. Business divisions are set underwriting criteria coveringthe types of risks they are licensed to underwrite. Maximum limits are set for the acceptance of risk both on an individual contractbasis and for classes of business and specific risk groupings. Management information systems are maintained that provide up todate, reliable data on the risks to which the business is exposed at any point in time. Efforts are made, including plain language policyterms, to ensure there is no misalignment between what policyholders perceive will be paid when a policy is initially sold and what isactually paid when a claim is made.
Statistical models that combine historical and projected data are used to calculate premiums and monitor claims patterns for eachclass of business. The data used includes historical pricing and claims analysis for each class of business as well as currentdevelopments in the respective markets and classes of business. All data used is subject to rigorous verification and reconciliationprocesses. The models incorporate consideration of prevailing market conditions.
The table in section C of this note provides an analysis of gross written premium by region and product for the current and priorfinancial year demonstrating the limited exposure to the additional risks associated with long-tail classes of business.
II. ReinsuranceReinsurance is used to limit exposure to large single claims as well as accumulation of claims that arise from the same or similarevents.
53
Risks underwritten are also reinsured in order to stabilise earnings and protect capital resources. Each subsidiary that is an insurerhas its own reinsurance program and determines its own risk tolerances, subject to principles set out in the REMS. To facilitate thereinsurance process, manage counter party exposure and to create economies of scale, the Group has established a captivereinsurance operation comprising companies located in Australia, Singapore and Labuan. This operation acts as the reinsurer for theGroup by being the main buyer of the Group’s outwards reinsurance program. A key responsibility of the reinsurance operation is tomanage reinsurance and earnings volatility and the Group's exposure to catastrophe risk. The operation retains a portion of theintercompany business it assumes and retrocedes (passes on) the remainder to external reinsurers. The REMS provides that thereinsurance retention for catastrophe is not to exceed 4% of net earned premium.
While the majority of business ceded by the Consolidated entity’s subsidiaries is reinsured with the Group's captive reinsuranceoperation, individual business units do purchase additional reinsurance protection outside the Group. This generally relates tofacultative reinsurance covers.
The use of reinsurance introduces credit risk. The management of reinsurance includes the monitoring of reinsurers’ credit risk andcontrols the exposure to reinsurance counterparty default. Refer to the financial risk management note for further details.
a. CURRENT PROGRAMThe reinsurance operation purchases reinsurance on behalf of Group entities to cover a return period of at least APRA’s minimum of a1:250 year event on a single site basis but is authorised to elect to purchase covers up to a 1:250 year event on a whole of portfoliobasis. Dynamic financial analysis modelling is used to determine the optimal level at which reinsurance should be purchased forcapital efficiency, compared with the cost and benefits of covers available in the market.
The external reinsurance programs consist of a combination of the following reinsurance protection: a Group catastrophe cover which is placed in line with the strategy of buying to the level of a 1:250 year event on a modified
whole of portfolio basis. The catastrophe program is negotiated on an annual calendar year basis. Covers purchased aredynamic; the MER changes as total requirements change and as the reinsurance purchase strategy evolves;
an aggregate cover which protects against a frequency of attritional event losses in Australia, New Zealand, Asia and the UnitedKingdom and operates below the Group catastrophe cover;
specific catastrophe protection in respect of AMI New Zealand providing protection in excess of a 1:250 year event probability;
excess of loss and proportional reinsurances which provide "per risk" protection for retained exposures of the commercial propertyand engineering businesses in Australia, New Zealand, Thailand, Malaysia and the United Kingdom;
some proportional reinsurance of companies operating in Thailand and Malaysia as well as for the Group's engineering portfolio;
excess of loss reinsurance for all casualty portfolios including CTP, public liability, workers’ compensation and home ownerswarranty products; and
excess of loss reinsurance for all marine portfolios.
b. CHANGES DURING THE YEARThe limit of catastrophe cover purchased was increased to $4.7 billion. Should a loss event occur that is greater than $4.7 billion, theGroup could potentially incur a net loss greater than the MER. This would occur if the extent of the loss exceeded the upper limit ofcover provided by the reinsurance protection. The Group holds capital to mitigate the impact of this possibility. Further, specificprotection was purchased to provide cover up to NZD1.4 billion for catastrophe exposures generated through the acquisition of AMIInsurance in New Zealand.
At 30 June 2012, the Group MER for a first event arising from a catastrophe event was $150 million.
III. Claims management and provisioningInitial claims determination is managed by claims officers with the requisite degree of experience and competence with the assistance,where appropriate, of a loss adjustor or other party with specialist knowledge. It is the Group's policy to respond to and settle allgenuine claims quickly whenever possible and to pay claims fairly, based on policyholders' full entitlements.
Claims provisions are established using actuarial valuation models and include a risk margin for uncertainty (refer to the claims note).
C. CONCENTRATIONS OF INSURANCE RISKThe exposure to concentrations of insurance risk is mitigated by a portfolio diversified into many classes of business across differentregions and by the utilisation of reinsurance.
Concentration risk is particularly relevant in the case of catastrophes, usually natural disasters, which generally result in aconcentration of affected policyholders over and above the norm and which constitutes the largest individual potential financial loss.Catastrophe losses are an inherent risk of the general insurance industry that have contributed, and will continue to contribute, topotentially material year-to-year fluctuations in the results of operations and financial position. Catastrophes are caused by variousnatural events including earthquakes, bushfires, hailstorms, tropical storms and high winds. The Group is also exposed to certainhuman-made catastrophic events such as industrial accidents and building collapses. The nature and level of catastrophes in anyperiod cannot be predicted accurately but can be estimated through the utilisation of predictive models. The Group actively limits theaggregate insurance exposure to catastrophe losses in regions that are subject to high levels of natural catastrophes.
Each year, the Group sets its tolerance for concentration risk and purchases reinsurance in excess of these tolerances. Variousmodels are used to estimate the impact of different potential natural disasters and other catastrophes. The tolerance forconcentration risk is used to determine the MER which is the maximum net exposure to insurance risk determined appropriate for anysingle event with a given probability. The selected MER is determined based on the cost of purchasing the reinsurance and capitalefficiency.
54 IAG ANNUAL REPORT 2012
The tables below demonstrate the diversity of the Group’s operations by both region (noting that the insurance risks underwritten inAustralia are written in all states and territories) and product. The tables show risk concentrations before reinsurance.
CONSOLIDATED
2012 2011
% %
Australia 79 79
New Zealand 13 12
United Kingdom 6 7
Asia 2 2
100 100
The consolidated gross written premium increased by 11.7% to $8,992 million during the 2012 financial year.
Motor 34 35
Home 24 23
Short-tail commercial 19 18
CTP (motor liability) 11 12
Liability 5 5
Other short-tail 4 4
Workers' compensation 3 3
100 100
Specific processes for monitoring identified key concentrations are set out below.
RISK SOURCE OF CONCENTRATION RISK MANAGEMENT MEASURES
An accumulation of risks arising from anatural peril
Insured property concentrations Accumulation risk modelling, reinsuranceprotection
A large property loss Fire or collapse affecting one building or agroup of adjacent buildings
Maximum acceptance limits, property riskgrading, reinsurance protection
Multiple liability retentions being involved inthe same event
Response by a multitude of policies to theone event
Purchase of reinsurance clash protection
D. OPERATIONAL RISKOperational risk is the risk of loss resulting from inadequate or failed internal processes, people and systems or from external events.Operational risk can have overlaps with all of the other risk categories. When controls fail, operational risk events can cause injury,damage to reputation, have legal or regulatory implications or can lead to financial loss. The Group cannot expect to eliminate alloperational risks, but manages these by initiating an appropriate control framework and by monitoring and responding to potentialrisks, and thereby minimises exposure to such risks.
As outlined in the RMS, operational risk is to be identified and assessed on an ongoing basis. The capital management strategyincludes consideration of operational risk. Management and staff are responsible for identifying, assessing and managing operationalrisks in accordance with their roles and responsibilities. The Group has an internal audit function that reviews the effectiveness ofprocesses and procedures surrounding operational risk.
I. Regulatory and compliance riskThe general insurance operations of the Group are subject to regulatory supervision in the jurisdictions in which they operate. Theregulatory frameworks continue to evolve in a number of jurisdictions and at a minimum include requirements in relation to reserving,capital and the payment of dividends. The Group works closely with regulators and monitors regulatory developments acrossits international operations to assess any potential impact on the ongoing ability to meet the various regulatory requirements.
Throughout the current reporting period the Group has conformed with the requirements of its debt agreements, including all financialand non financial covenants (2011-full conformance).
The Group participates in two Lloyd's syndicates being Equity Red Star Motor Syndicate 218 (64.9% share of capacity) and Alba GroupSyndicate 4455 (100%-in run off). All members at Lloyd’s have joint and several liability and, in extreme cases, Lloyd’s can alsorequire ‘special contributions’ from members at the discretion of the Council of Lloyd’s to maintain the Central Fund. Lloyd's has an A'strong' rating issued by Standard & Poor's Rating Services.
E. ACQUISITION RISKAcquisition risks are principally managed by governance controls over the due diligence and subsequent integration process ofsignificant acquisitions. This includes performing due diligence appropriate to the entity's risk appetite for each target and by using ateam of relevant and appropriate subject matter experts to manage the integration process.
55
NOTE 4. FINANCIAL RISK MANAGEMENTThe Group's RMS, as outlined in the insurance risk management note, considers financial risk, focuses on the unpredictability offinancial markets and seeks to minimise potential adverse effects on financial performance. Key aspects of the processes establishedto mitigate financial risks include: having an Asset and Liability Committee constituted by the IAG Board and comprising key executives with relevant oversight
responsibilities that meets on a regular basis;
monthly stress testing undertaken to determine the impact of adverse market movements and the impact of any derivativepositions;
maintenance of an approved Group Credit Risk Policy and Group Foreign Exchange Policy which are reviewed at least annually;and
implementation of a Derivatives Risk Management Statement that considers the controls in the use of derivatives and sets outthe permissible use of derivatives in relation to investment strategies.
A. MARKET RISKMarket risk is the risk of adverse financial impact due to changes in the value or future cash flows of financial instruments fromfluctuations in foreign currency exchange rates, interest rates and equity prices.
I. Currency riska. NATURE OF THE RISKS AND HOW MANAGEDCurrency risk is the risk of loss arising from an unfavourable movement in market exchange rates. The Consolidated entity operatesinternationally and so is exposed to currency risk from various activities conducted in the normal course of business. Foreign currencyexposure is a centrally managed risk, with hedging coordinated at the corporate office. Refer to the derivatives note for further detailon the hedging arrangements used to manage currency risk.
The key currency risk exposures relate to the following:
i. Investment of equity holders' fundsThe investment of equity holders’ funds in assets denominated in currencies different to the functional currency of the investingsubsidiary. Note that assets held to back insurance liabilities are held in the same currency as the related insurance liabilitiesmitigating any net foreign exchange exposure.
ii. Interest bearing liabilitiesForeign currency denominated interest bearing liabilities are normally of a capital nature. Some of these have been designated ashedging instruments to manage the foreign currency risk associated with investments in foreign operations as noted below.
iii. Investment in foreign operationsNet investment in foreign operations through the translation of the financial position and performance of foreign operations that havea functional currency other than the Australian dollar with the key currencies being New Zealand dollars, British pounds, Indian rupees,Malaysian ringgit, Chinese renminbi and Thai baht.
b. CURRENCY RISK EXPOSUREThe financial impact from exposure to currency risk is reflected in the financial report through two mechanisms: translation of foreign currency transactions - these financial impacts relating primarily to investments are directly recognised in
profit and loss;
translation of the financial performance of foreign operations - these financial impacts are directly recognised in profit and loss;and
translation of the financial position of foreign operations - these financial impacts are recognised directly in equity in the foreigncurrency translation reserve and so have no impact on profit.
i. SensitivityThe following tables provide information regarding the exposure of the Consolidated entity to foreign currency risk. The sensitivityanalysis provided in the following tables demonstrates the effect of a change in one key assumption while other assumptions remainunchanged. In reality, there is a correlation between the assumptions and other factors. The sensitivities do not includeinterdependencies among the currencies, but rather show isolated exchange rate movements. The sensitivity analysis does not takeinto consideration that the assets and liabilities are actively managed and assume no action by management in response tomovements in the factor. Additionally, the financial position may vary at the time that any actual market movement occurs.
The impact on the measurement of various financial instruments held at reporting date of an instantaneous 10% depreciation of theAustralian dollar at reporting date compared with selected currencies, on profit before tax and equity, net of related derivatives, isprovided in the table below. An appreciation of the Australian dollar would have predominantly the opposite impact.
56 IAG ANNUAL REPORT 2012
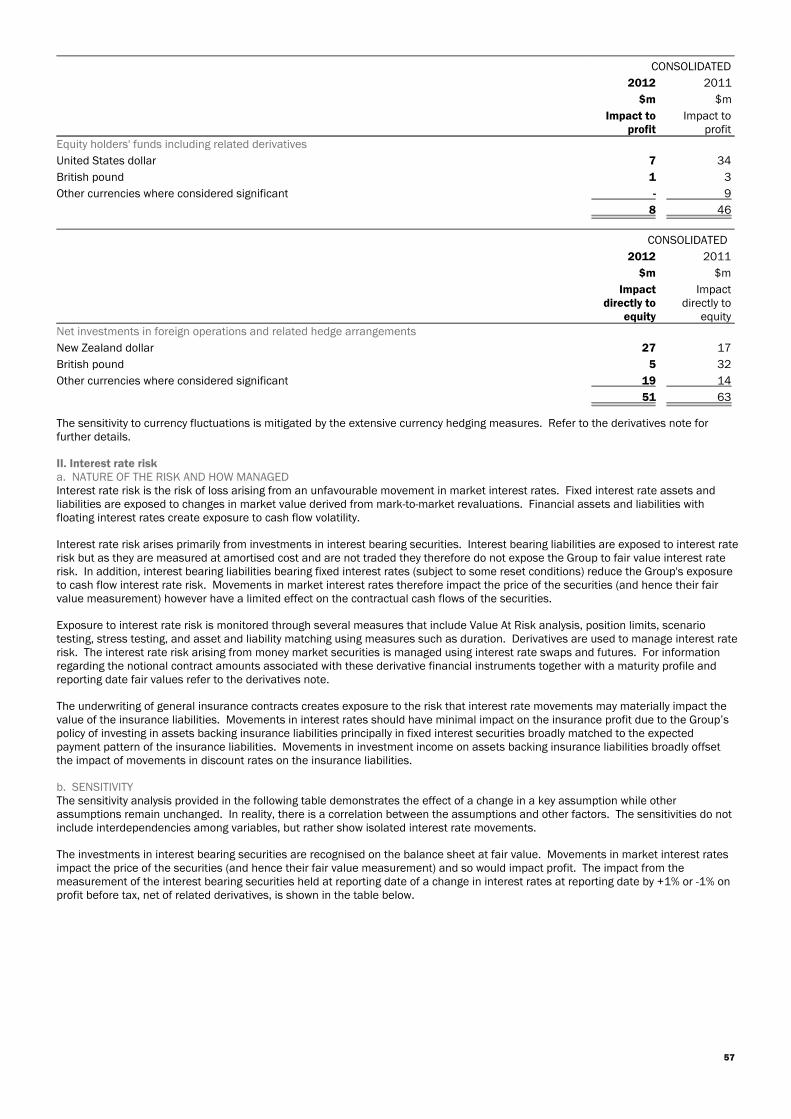
CONSOLIDATED
2012 2011
$m $m
Impact toprofit
Impact toprofit
Equity holders' funds including related derivatives
United States dollar 7 34
British pound 1 3
Other currencies where considered significant - 9
8 46
CONSOLIDATED
2012 2011
$m $m
Impactdirectly to
equity
Impactdirectly to
equityNet investments in foreign operations and related hedge arrangements
New Zealand dollar 27 17
British pound 5 32
Other currencies where considered significant 19 14
51 63
The sensitivity to currency fluctuations is mitigated by the extensive currency hedging measures. Refer to the derivatives note forfurther details.
II. Interest rate riska. NATURE OF THE RISK AND HOW MANAGEDInterest rate risk is the risk of loss arising from an unfavourable movement in market interest rates. Fixed interest rate assets andliabilities are exposed to changes in market value derived from mark-to-market revaluations. Financial assets and liabilities withfloating interest rates create exposure to cash flow volatility.
Interest rate risk arises primarily from investments in interest bearing securities. Interest bearing liabilities are exposed to interest raterisk but as they are measured at amortised cost and are not traded they therefore do not expose the Group to fair value interest raterisk. In addition, interest bearing liabilities bearing fixed interest rates (subject to some reset conditions) reduce the Group's exposureto cash flow interest rate risk. Movements in market interest rates therefore impact the price of the securities (and hence their fairvalue measurement) however have a limited effect on the contractual cash flows of the securities.
Exposure to interest rate risk is monitored through several measures that include Value At Risk analysis, position limits, scenariotesting, stress testing, and asset and liability matching using measures such as duration. Derivatives are used to manage interest raterisk. The interest rate risk arising from money market securities is managed using interest rate swaps and futures. For informationregarding the notional contract amounts associated with these derivative financial instruments together with a maturity profile andreporting date fair values refer to the derivatives note.
The underwriting of general insurance contracts creates exposure to the risk that interest rate movements may materially impact thevalue of the insurance liabilities. Movements in interest rates should have minimal impact on the insurance profit due to the Group’spolicy of investing in assets backing insurance liabilities principally in fixed interest securities broadly matched to the expectedpayment pattern of the insurance liabilities. Movements in investment income on assets backing insurance liabilities broadly offsetthe impact of movements in discount rates on the insurance liabilities.
b. SENSITIVITYThe sensitivity analysis provided in the following table demonstrates the effect of a change in a key assumption while otherassumptions remain unchanged. In reality, there is a correlation between the assumptions and other factors. The sensitivities do notinclude interdependencies among variables, but rather show isolated interest rate movements.
The investments in interest bearing securities are recognised on the balance sheet at fair value. Movements in market interest ratesimpact the price of the securities (and hence their fair value measurement) and so would impact profit. The impact from themeasurement of the interest bearing securities held at reporting date of a change in interest rates at reporting date by +1% or -1% onprofit before tax, net of related derivatives, is shown in the table below.
57
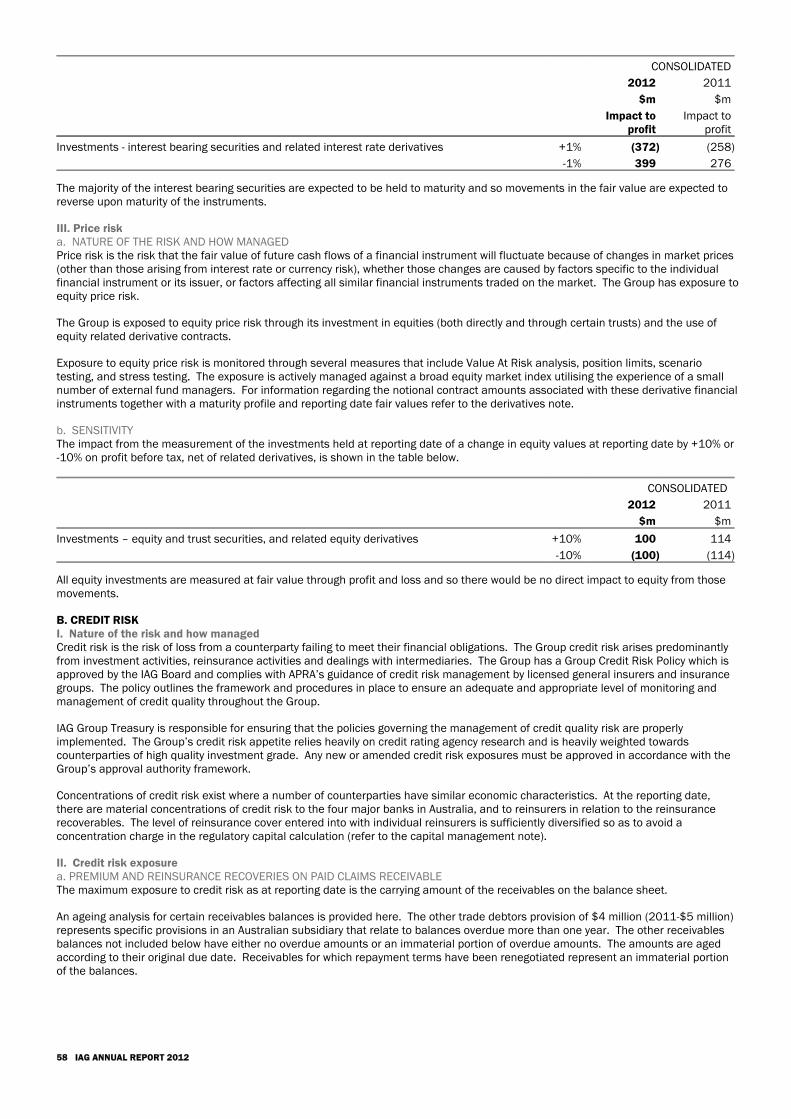
CONSOLIDATED
2012 2011
$m $m
Impact toprofit
Impact toprofit
Investments - interest bearing securities and related interest rate derivatives +1% (372) (258)
-1% 399 276
The majority of the interest bearing securities are expected to be held to maturity and so movements in the fair value are expected toreverse upon maturity of the instruments.
III. Price riska. NATURE OF THE RISK AND HOW MANAGEDPrice risk is the risk that the fair value of future cash flows of a financial instrument will fluctuate because of changes in market prices(other than those arising from interest rate or currency risk), whether those changes are caused by factors specific to the individualfinancial instrument or its issuer, or factors affecting all similar financial instruments traded on the market. The Group has exposure toequity price risk.
The Group is exposed to equity price risk through its investment in equities (both directly and through certain trusts) and the use ofequity related derivative contracts.
Exposure to equity price risk is monitored through several measures that include Value At Risk analysis, position limits, scenariotesting, and stress testing. The exposure is actively managed against a broad equity market index utilising the experience of a smallnumber of external fund managers. For information regarding the notional contract amounts associated with these derivative financialinstruments together with a maturity profile and reporting date fair values refer to the derivatives note.
b. SENSITIVITYThe impact from the measurement of the investments held at reporting date of a change in equity values at reporting date by +10% or-10% on profit before tax, net of related derivatives, is shown in the table below.
CONSOLIDATED
2012 2011
$m $m
Investments – equity and trust securities, and related equity derivatives +10%
-10%
100
(100)
114
(114)
All equity investments are measured at fair value through profit and loss and so there would be no direct impact to equity from thosemovements.
B. CREDIT RISKI. Nature of the risk and how managedCredit risk is the risk of loss from a counterparty failing to meet their financial obligations. The Group credit risk arises predominantlyfrom investment activities, reinsurance activities and dealings with intermediaries. The Group has a Group Credit Risk Policy which isapproved by the IAG Board and complies with APRA’s guidance of credit risk management by licensed general insurers and insurancegroups. The policy outlines the framework and procedures in place to ensure an adequate and appropriate level of monitoring andmanagement of credit quality throughout the Group.
IAG Group Treasury is responsible for ensuring that the policies governing the management of credit quality risk are properlyimplemented. The Group’s credit risk appetite relies heavily on credit rating agency research and is heavily weighted towardscounterparties of high quality investment grade. Any new or amended credit risk exposures must be approved in accordance with theGroup’s approval authority framework.
Concentrations of credit risk exist where a number of counterparties have similar economic characteristics. At the reporting date,there are material concentrations of credit risk to the four major banks in Australia, and to reinsurers in relation to the reinsurancerecoverables. The level of reinsurance cover entered into with individual reinsurers is sufficiently diversified so as to avoid aconcentration charge in the regulatory capital calculation (refer to the capital management note).
II. Credit risk exposurea. PREMIUM AND REINSURANCE RECOVERIES ON PAID CLAIMS RECEIVABLEThe maximum exposure to credit risk as at reporting date is the carrying amount of the receivables on the balance sheet.
An ageing analysis for certain receivables balances is provided here. The other trade debtors provision of $4 million (2011-$5 million)represents specific provisions in an Australian subsidiary that relate to balances overdue more than one year. The other receivablesbalances not included below have either no overdue amounts or an immaterial portion of overdue amounts. The amounts are agedaccording to their original due date. Receivables for which repayment terms have been renegotiated represent an immaterial portionof the balances.
58 IAG ANNUAL REPORT 2012
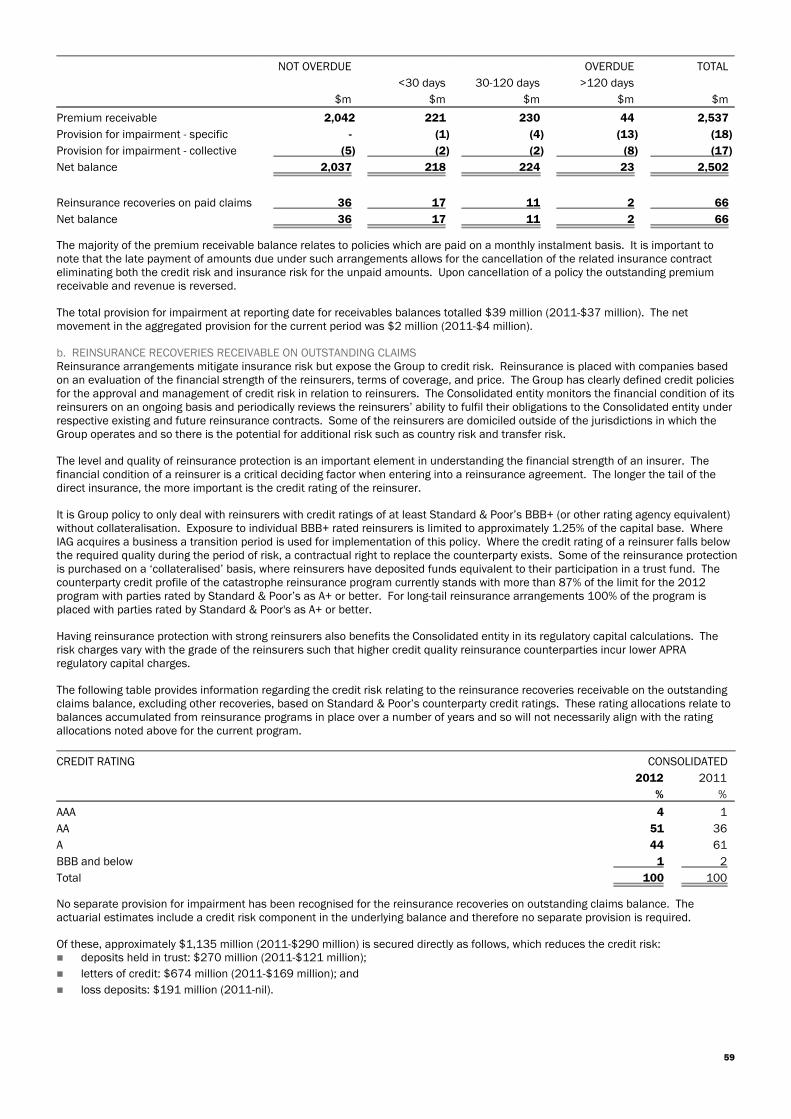
NOT OVERDUE OVERDUE TOTAL
<30 days 30-120 days >120 days
$m $m $m $m $m
Premium receivable 2,042 221 230 44 2,537
Provision for impairment - specific - (1) (4) (13) (18)
Provision for impairment - collective (5) (2) (2) (8) (17)
Net balance 2,037 218 224 23 2,502
Reinsurance recoveries on paid claims 36 17 11 2 66
Net balance 36 17 11 2 66
The majority of the premium receivable balance relates to policies which are paid on a monthly instalment basis. It is important tonote that the late payment of amounts due under such arrangements allows for the cancellation of the related insurance contracteliminating both the credit risk and insurance risk for the unpaid amounts. Upon cancellation of a policy the outstanding premiumreceivable and revenue is reversed.
The total provision for impairment at reporting date for receivables balances totalled $39 million (2011-$37 million). The netmovement in the aggregated provision for the current period was $2 million (2011-$4 million).
b. REINSURANCE RECOVERIES RECEIVABLE ON OUTSTANDING CLAIMSReinsurance arrangements mitigate insurance risk but expose the Group to credit risk. Reinsurance is placed with companies basedon an evaluation of the financial strength of the reinsurers, terms of coverage, and price. The Group has clearly defined credit policiesfor the approval and management of credit risk in relation to reinsurers. The Consolidated entity monitors the financial condition of itsreinsurers on an ongoing basis and periodically reviews the reinsurers’ ability to fulfil their obligations to the Consolidated entity underrespective existing and future reinsurance contracts. Some of the reinsurers are domiciled outside of the jurisdictions in which theGroup operates and so there is the potential for additional risk such as country risk and transfer risk.
The level and quality of reinsurance protection is an important element in understanding the financial strength of an insurer. Thefinancial condition of a reinsurer is a critical deciding factor when entering into a reinsurance agreement. The longer the tail of thedirect insurance, the more important is the credit rating of the reinsurer.
It is Group policy to only deal with reinsurers with credit ratings of at least Standard & Poor’s BBB+ (or other rating agency equivalent)without collateralisation. Exposure to individual BBB+ rated reinsurers is limited to approximately 1.25% of the capital base. WhereIAG acquires a business a transition period is used for implementation of this policy. Where the credit rating of a reinsurer falls belowthe required quality during the period of risk, a contractual right to replace the counterparty exists. Some of the reinsurance protectionis purchased on a ‘collateralised’ basis, where reinsurers have deposited funds equivalent to their participation in a trust fund. Thecounterparty credit profile of the catastrophe reinsurance program currently stands with more than 87% of the limit for the 2012program with parties rated by Standard & Poor’s as A+ or better. For long-tail reinsurance arrangements 100% of the program isplaced with parties rated by Standard & Poor's as A+ or better.
Having reinsurance protection with strong reinsurers also benefits the Consolidated entity in its regulatory capital calculations. Therisk charges vary with the grade of the reinsurers such that higher credit quality reinsurance counterparties incur lower APRAregulatory capital charges.
The following table provides information regarding the credit risk relating to the reinsurance recoveries receivable on the outstandingclaims balance, excluding other recoveries, based on Standard & Poor’s counterparty credit ratings. These rating allocations relate tobalances accumulated from reinsurance programs in place over a number of years and so will not necessarily align with the ratingallocations noted above for the current program.
CREDIT RATING CONSOLIDATED
2012 2011
% %
AAA 4 1
AA 51 36
A 44 61
BBB and below 1 2
Total 100 100
No separate provision for impairment has been recognised for the reinsurance recoveries on outstanding claims balance. Theactuarial estimates include a credit risk component in the underlying balance and therefore no separate provision is required.
Of these, approximately $1,135 million (2011-$290 million) is secured directly as follows, which reduces the credit risk: deposits held in trust: $270 million (2011-$121 million);
letters of credit: $674 million (2011-$169 million); and
loss deposits: $191 million (2011-nil).
59
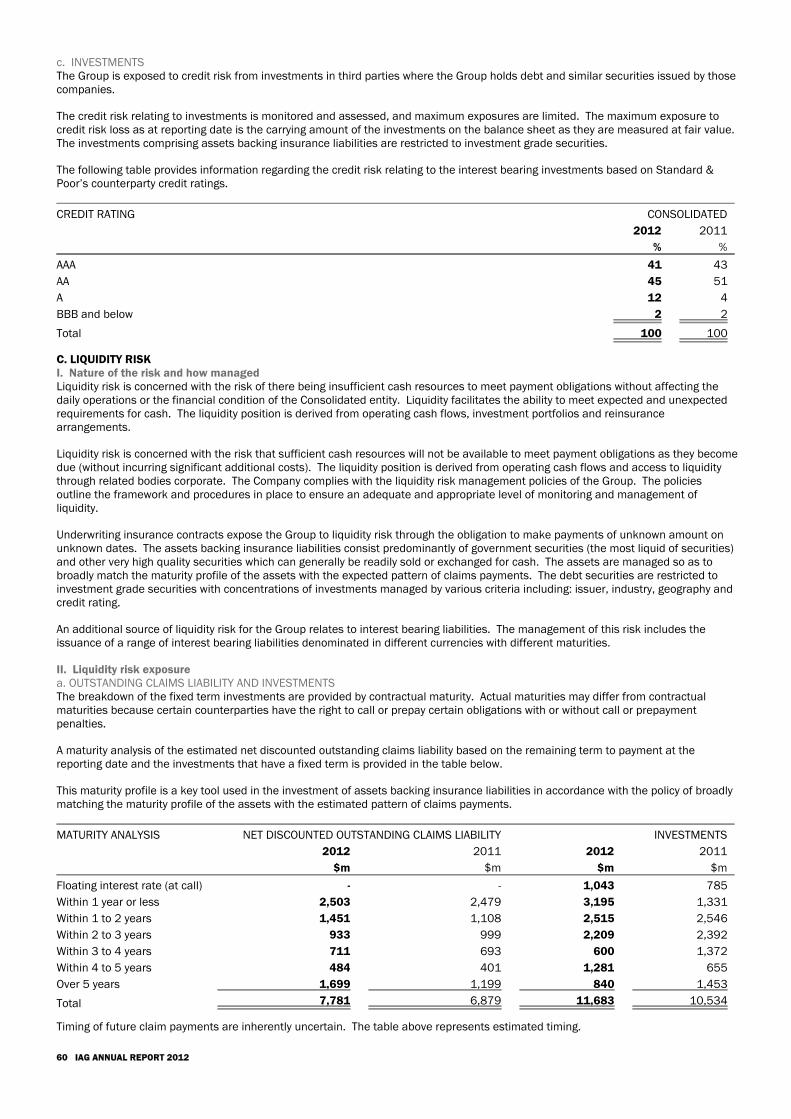
c. INVESTMENTSThe Group is exposed to credit risk from investments in third parties where the Group holds debt and similar securities issued by thosecompanies.
The credit risk relating to investments is monitored and assessed, and maximum exposures are limited. The maximum exposure tocredit risk loss as at reporting date is the carrying amount of the investments on the balance sheet as they are measured at fair value.The investments comprising assets backing insurance liabilities are restricted to investment grade securities.
The following table provides information regarding the credit risk relating to the interest bearing investments based on Standard &Poor’s counterparty credit ratings.
CREDIT RATING CONSOLIDATED
2012 2011
% %
AAA 41 43
AA 45 51
A 12 4
BBB and below 2 2
Total 100 100
C. LIQUIDITY RISKI. Nature of the risk and how managedLiquidity risk is concerned with the risk of there being insufficient cash resources to meet payment obligations without affecting thedaily operations or the financial condition of the Consolidated entity. Liquidity facilitates the ability to meet expected and unexpectedrequirements for cash. The liquidity position is derived from operating cash flows, investment portfolios and reinsurancearrangements.
Liquidity risk is concerned with the risk that sufficient cash resources will not be available to meet payment obligations as they becomedue (without incurring significant additional costs). The liquidity position is derived from operating cash flows and access to liquiditythrough related bodies corporate. The Company complies with the liquidity risk management policies of the Group. The policiesoutline the framework and procedures in place to ensure an adequate and appropriate level of monitoring and management ofliquidity.
Underwriting insurance contracts expose the Group to liquidity risk through the obligation to make payments of unknown amount onunknown dates. The assets backing insurance liabilities consist predominantly of government securities (the most liquid of securities)and other very high quality securities which can generally be readily sold or exchanged for cash. The assets are managed so as tobroadly match the maturity profile of the assets with the expected pattern of claims payments. The debt securities are restricted toinvestment grade securities with concentrations of investments managed by various criteria including: issuer, industry, geography andcredit rating.
An additional source of liquidity risk for the Group relates to interest bearing liabilities. The management of this risk includes theissuance of a range of interest bearing liabilities denominated in different currencies with different maturities.
II. Liquidity risk exposurea. OUTSTANDING CLAIMS LIABILITY AND INVESTMENTSThe breakdown of the fixed term investments are provided by contractual maturity. Actual maturities may differ from contractualmaturities because certain counterparties have the right to call or prepay certain obligations with or without call or prepaymentpenalties.
A maturity analysis of the estimated net discounted outstanding claims liability based on the remaining term to payment at thereporting date and the investments that have a fixed term is provided in the table below.
This maturity profile is a key tool used in the investment of assets backing insurance liabilities in accordance with the policy of broadlymatching the maturity profile of the assets with the estimated pattern of claims payments.
MATURITY ANALYSIS NET DISCOUNTED OUTSTANDING CLAIMS LIABILITY INVESTMENTS
2012 2011 2012 2011
$m $m $m $m
Floating interest rate (at call) - - 1,043 785
Within 1 year or less 2,503 2,479 3,195 1,331
Within 1 to 2 years 1,451 1,108 2,515 2,546
Within 2 to 3 years 933 999 2,209 2,392
Within 3 to 4 years 711 693 600 1,372
Within 4 to 5 years 484 401 1,281 655
Over 5 years 1,699 1,199 840 1,453
Total 7,781 6,879 11,683 10,534
Timing of future claim payments are inherently uncertain. The table above represents estimated timing.
60 IAG ANNUAL REPORT 2012
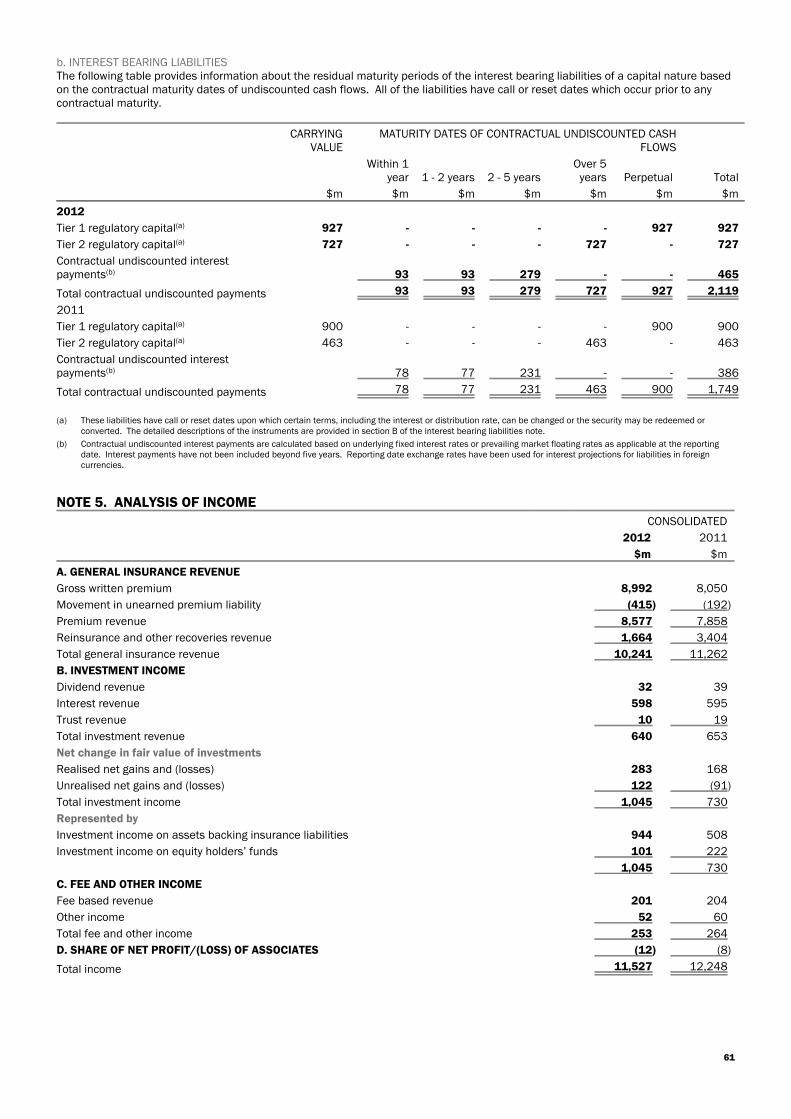
b. INTEREST BEARING LIABILITIESThe following table provides information about the residual maturity periods of the interest bearing liabilities of a capital nature basedon the contractual maturity dates of undiscounted cash flows. All of the liabilities have call or reset dates which occur prior to anycontractual maturity.
CARRYINGVALUE
MATURITY DATES OF CONTRACTUAL UNDISCOUNTED CASHFLOWS
Within 1year 1 - 2 years 2 - 5 years
Over 5years Perpetual Total
$m $m $m $m $m $m $m
2012
Tier 1 regulatory capital(a) 927 - - - - 927 927
Tier 2 regulatory capital(a) 727 - - - 727 - 727
Contractual undiscounted interestpayments(b) 93 93 279 - - 465
Total contractual undiscounted payments 93 93 279 727 927 2,119
2011
Tier 1 regulatory capital(a) 900 - - - - 900 900
Tier 2 regulatory capital(a) 463 - - - 463 - 463
Contractual undiscounted interestpayments(b) 78 77 231 - - 386
Total contractual undiscounted payments 78 77 231 463 900 1,749
(a) These liabilities have call or reset dates upon which certain terms, including the interest or distribution rate, can be changed or the security may be redeemed orconverted. The detailed descriptions of the instruments are provided in section B of the interest bearing liabilities note.
(b) Contractual undiscounted interest payments are calculated based on underlying fixed interest rates or prevailing market floating rates as applicable at the reportingdate. Interest payments have not been included beyond five years. Reporting date exchange rates have been used for interest projections for liabilities in foreigncurrencies.
NOTE 5. ANALYSIS OF INCOMECONSOLIDATED
2012 2011
$m $m
A. GENERAL INSURANCE REVENUE
Gross written premium 8,992 8,050
Movement in unearned premium liability (415) (192)
Premium revenue 8,577 7,858
Reinsurance and other recoveries revenue 1,664 3,404
Total general insurance revenue 10,241 11,262
B. INVESTMENT INCOME
Dividend revenue 32 39
Interest revenue 598 595
Trust revenue 10 19
Total investment revenue 640 653
Net change in fair value of investments
Realised net gains and (losses) 283 168
Unrealised net gains and (losses) 122 (91)
Total investment income 1,045 730
Represented by
Investment income on assets backing insurance liabilities 944 508
Investment income on equity holders’ funds 101 222
1,045 730
C. FEE AND OTHER INCOME
Fee based revenue 201 204
Other income 52 60
Total fee and other income 253 264
D. SHARE OF NET PROFIT/(LOSS) OF ASSOCIATES (12) (8)
Total income 11,527 12,248
61
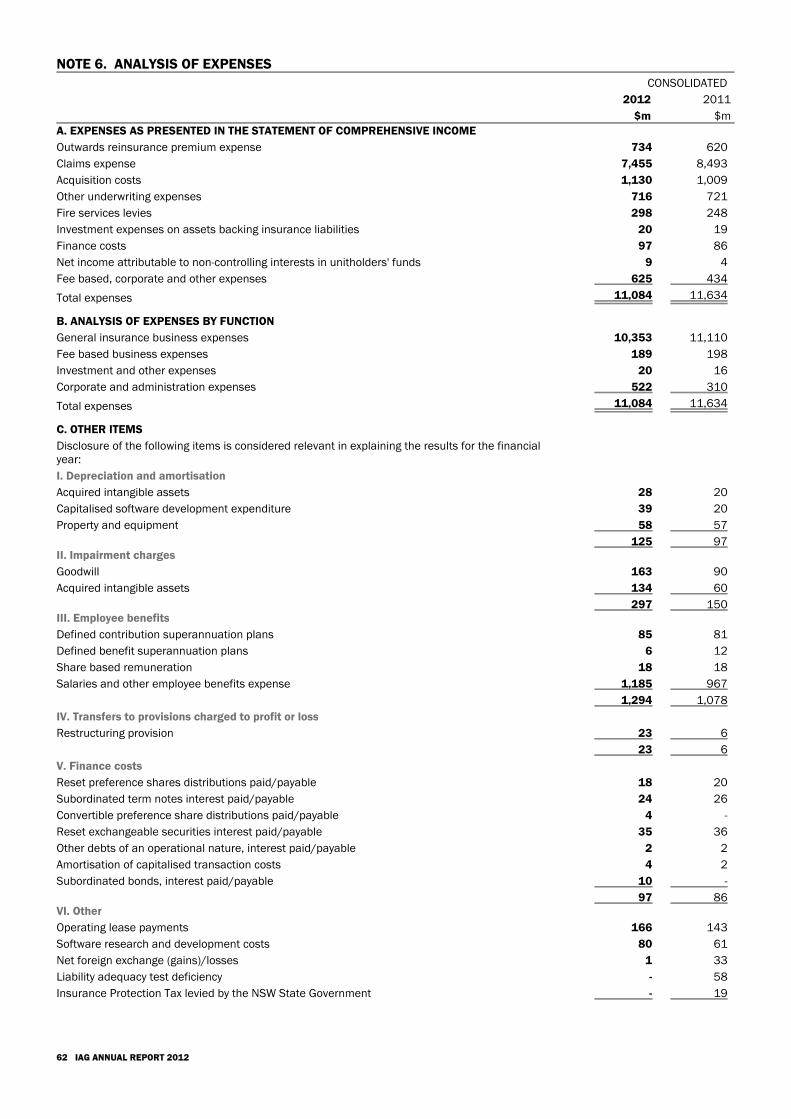
NOTE 6. ANALYSIS OF EXPENSESCONSOLIDATED
2012 2011
$m $mA. EXPENSES AS PRESENTED IN THE STATEMENT OF COMPREHENSIVE INCOME
Outwards reinsurance premium expense 734 620
Claims expense 7,455 8,493
Acquisition costs 1,130 1,009
Other underwriting expenses 716 721
Fire services levies 298 248
Investment expenses on assets backing insurance liabilities 20 19
Finance costs 97 86
Net income attributable to non-controlling interests in unitholders' funds 9 4
Fee based, corporate and other expenses 625 434
Total expenses 11,084 11,634
B. ANALYSIS OF EXPENSES BY FUNCTION
General insurance business expenses 10,353 11,110
Fee based business expenses 189 198
Investment and other expenses 20 16
Corporate and administration expenses 522 310
Total expenses 11,084 11,634
C. OTHER ITEMS
Disclosure of the following items is considered relevant in explaining the results for the financialyear:
I. Depreciation and amortisation
Acquired intangible assets 28 20
Capitalised software development expenditure 39 20
Property and equipment 58 57
125 97II. Impairment charges
Goodwill 163 90
Acquired intangible assets 134 60
297 150III. Employee benefits
Defined contribution superannuation plans 85 81
Defined benefit superannuation plans 6 12
Share based remuneration 18 18
Salaries and other employee benefits expense 1,185 967
1,294 1,078
IV. Transfers to provisions charged to profit or loss
Restructuring provision 23 6
23 6
V. Finance costs
Reset preference shares distributions paid/payable 18 20
Subordinated term notes interest paid/payable 24 26
Convertible preference share distributions paid/payable 4 -
Reset exchangeable securities interest paid/payable 35 36
Other debts of an operational nature, interest paid/payable 2 2
Amortisation of capitalised transaction costs 4 2
Subordinated bonds, interest paid/payable 10 -
97 86VI. Other
Operating lease payments 166 143
Software research and development costs 80 61
Net foreign exchange (gains)/losses 1 33
Liability adequacy test deficiency - 58
Insurance Protection Tax levied by the NSW State Government - 19
62 IAG ANNUAL REPORT 2012
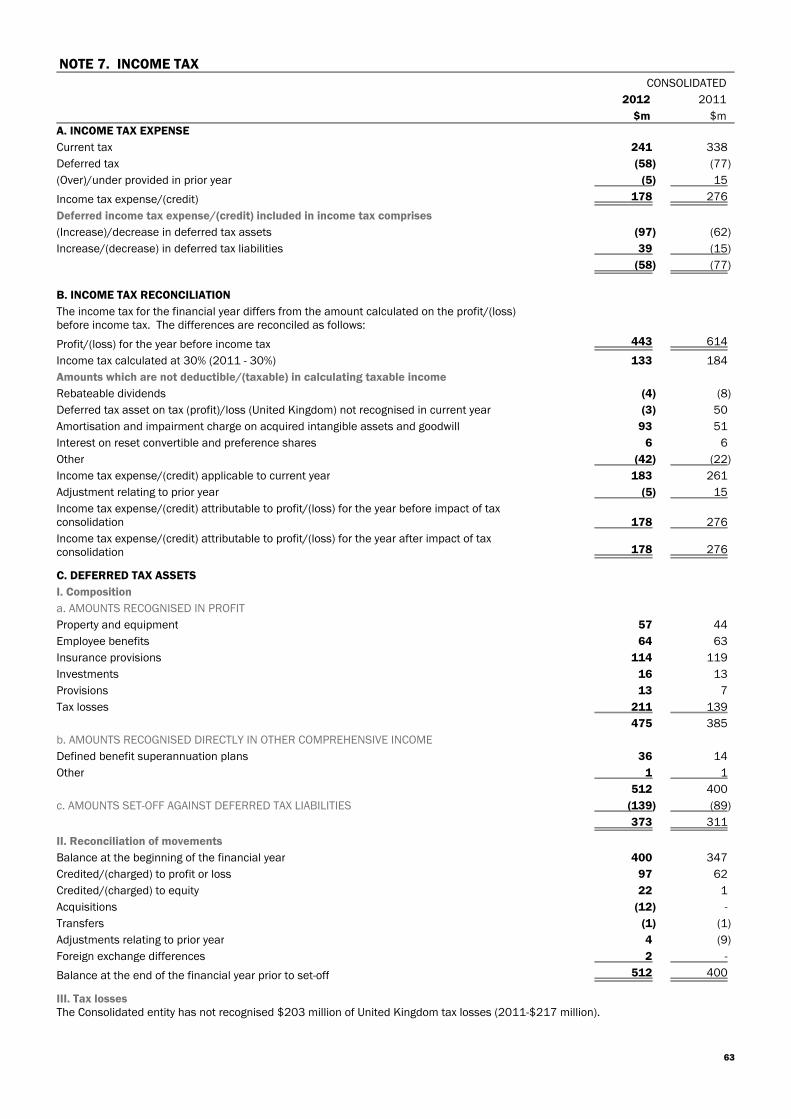
NOTE 7. INCOME TAXCONSOLIDATED
2012 2011
$m $mA. INCOME TAX EXPENSE
Current tax 241 338
Deferred tax (58) (77)
(Over)/under provided in prior year (5) 15
Income tax expense/(credit) 178 276
Deferred income tax expense/(credit) included in income tax comprises
(Increase)/decrease in deferred tax assets (97) (62)
Increase/(decrease) in deferred tax liabilities 39 (15)
(58) (77)
B. INCOME TAX RECONCILIATION
The income tax for the financial year differs from the amount calculated on the profit/(loss)before income tax. The differences are reconciled as follows:
Profit/(loss) for the year before income tax 443 614
Income tax calculated at 30% (2011 - 30%) 133 184
Amounts which are not deductible/(taxable) in calculating taxable income
Rebateable dividends (4) (8)
Deferred tax asset on tax (profit)/loss (United Kingdom) not recognised in current year (3) 50
Amortisation and impairment charge on acquired intangible assets and goodwill 93 51
Interest on reset convertible and preference shares 6 6
Other (42) (22)
Income tax expense/(credit) applicable to current year 183 261
Adjustment relating to prior year (5) 15
Income tax expense/(credit) attributable to profit/(loss) for the year before impact of taxconsolidation 178 276
Income tax expense/(credit) attributable to profit/(loss) for the year after impact of taxconsolidation 178 276
C. DEFERRED TAX ASSETS
I. Composition
a. AMOUNTS RECOGNISED IN PROFIT
Property and equipment 57 44
Employee benefits 64 63
Insurance provisions 114 119
Investments 16 13
Provisions 13 7
Tax losses 211 139
475 385
b. AMOUNTS RECOGNISED DIRECTLY IN OTHER COMPREHENSIVE INCOME
Defined benefit superannuation plans 36 14
Other 1 1
512 400
c. AMOUNTS SET-OFF AGAINST DEFERRED TAX LIABILITIES (139) (89)
373 311
II. Reconciliation of movements
Balance at the beginning of the financial year 400 347
Credited/(charged) to profit or loss 97 62
Credited/(charged) to equity 22 1
Acquisitions (12) -
Transfers (1) (1)
Adjustments relating to prior year 4 (9)
Foreign exchange differences 2 -
Balance at the end of the financial year prior to set-off 512 400
III. Tax lossesThe Consolidated entity has not recognised $203 million of United Kingdom tax losses (2011-$217 million).
63
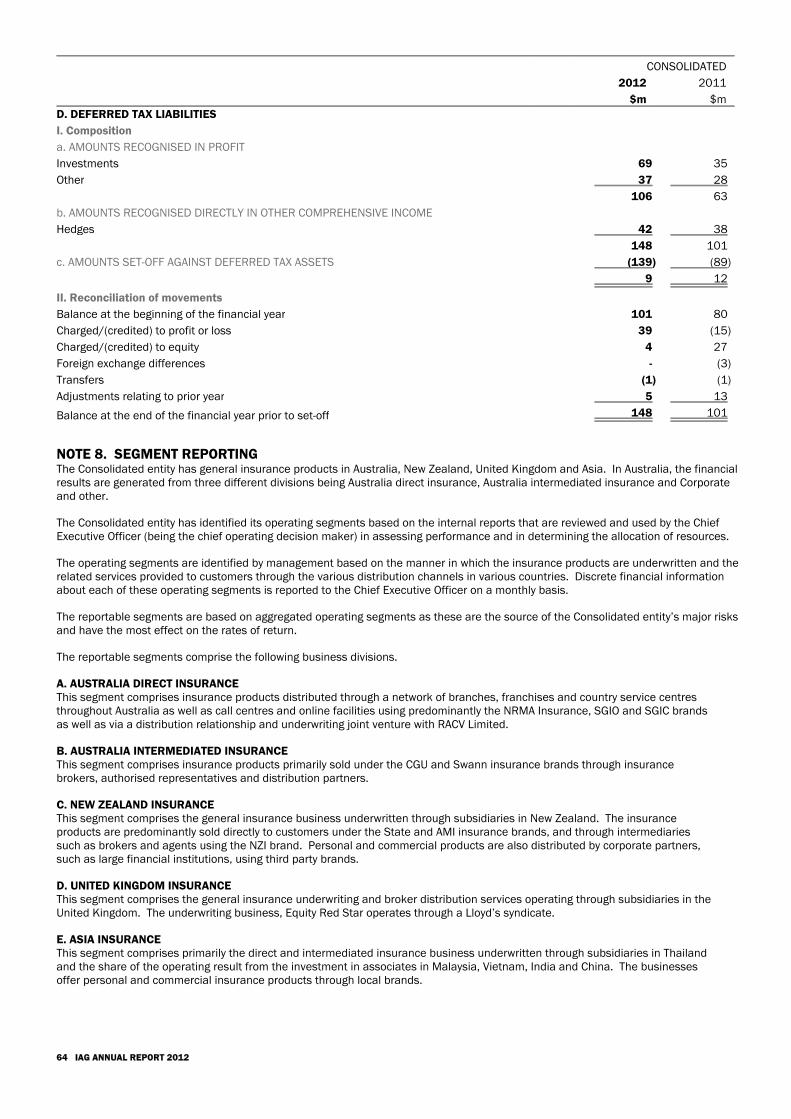
CONSOLIDATED
2012 2011
$m $mD. DEFERRED TAX LIABILITIES
I. Composition
a. AMOUNTS RECOGNISED IN PROFIT
Investments 69 35
Other 37 28
106 63
b. AMOUNTS RECOGNISED DIRECTLY IN OTHER COMPREHENSIVE INCOME
Hedges 42 38
148 101
c. AMOUNTS SET-OFF AGAINST DEFERRED TAX ASSETS (139) (89)
9 12
II. Reconciliation of movements
Balance at the beginning of the financial year 101 80
Charged/(credited) to profit or loss 39 (15)
Charged/(credited) to equity 4 27
Foreign exchange differences - (3)
Transfers (1) (1)
Adjustments relating to prior year 5 13
Balance at the end of the financial year prior to set-off 148 101
NOTE 8. SEGMENT REPORTINGThe Consolidated entity has general insurance products in Australia, New Zealand, United Kingdom and Asia. In Australia, the financialresults are generated from three different divisions being Australia direct insurance, Australia intermediated insurance and Corporateand other.
The Consolidated entity has identified its operating segments based on the internal reports that are reviewed and used by the ChiefExecutive Officer (being the chief operating decision maker) in assessing performance and in determining the allocation of resources.
The operating segments are identified by management based on the manner in which the insurance products are underwritten and therelated services provided to customers through the various distribution channels in various countries. Discrete financial informationabout each of these operating segments is reported to the Chief Executive Officer on a monthly basis.
The reportable segments are based on aggregated operating segments as these are the source of the Consolidated entity’s major risksand have the most effect on the rates of return.
The reportable segments comprise the following business divisions.
A. AUSTRALIA DIRECT INSURANCEThis segment comprises insurance products distributed through a network of branches, franchises and country service centresthroughout Australia as well as call centres and online facilities using predominantly the NRMA Insurance, SGIO and SGIC brandsas well as via a distribution relationship and underwriting joint venture with RACV Limited.
B. AUSTRALIA INTERMEDIATED INSURANCEThis segment comprises insurance products primarily sold under the CGU and Swann insurance brands through insurancebrokers, authorised representatives and distribution partners.
C. NEW ZEALAND INSURANCEThis segment comprises the general insurance business underwritten through subsidiaries in New Zealand. The insuranceproducts are predominantly sold directly to customers under the State and AMI insurance brands, and through intermediariessuch as brokers and agents using the NZI brand. Personal and commercial products are also distributed by corporate partners,such as large financial institutions, using third party brands.
D. UNITED KINGDOM INSURANCEThis segment comprises the general insurance underwriting and broker distribution services operating through subsidiaries in theUnited Kingdom. The underwriting business, Equity Red Star operates through a Lloyd’s syndicate.
E. ASIA INSURANCEThis segment comprises primarily the direct and intermediated insurance business underwritten through subsidiaries in Thailandand the share of the operating result from the investment in associates in Malaysia, Vietnam, India and China. The businessesoffer personal and commercial insurance products through local brands.
64 IAG ANNUAL REPORT 2012
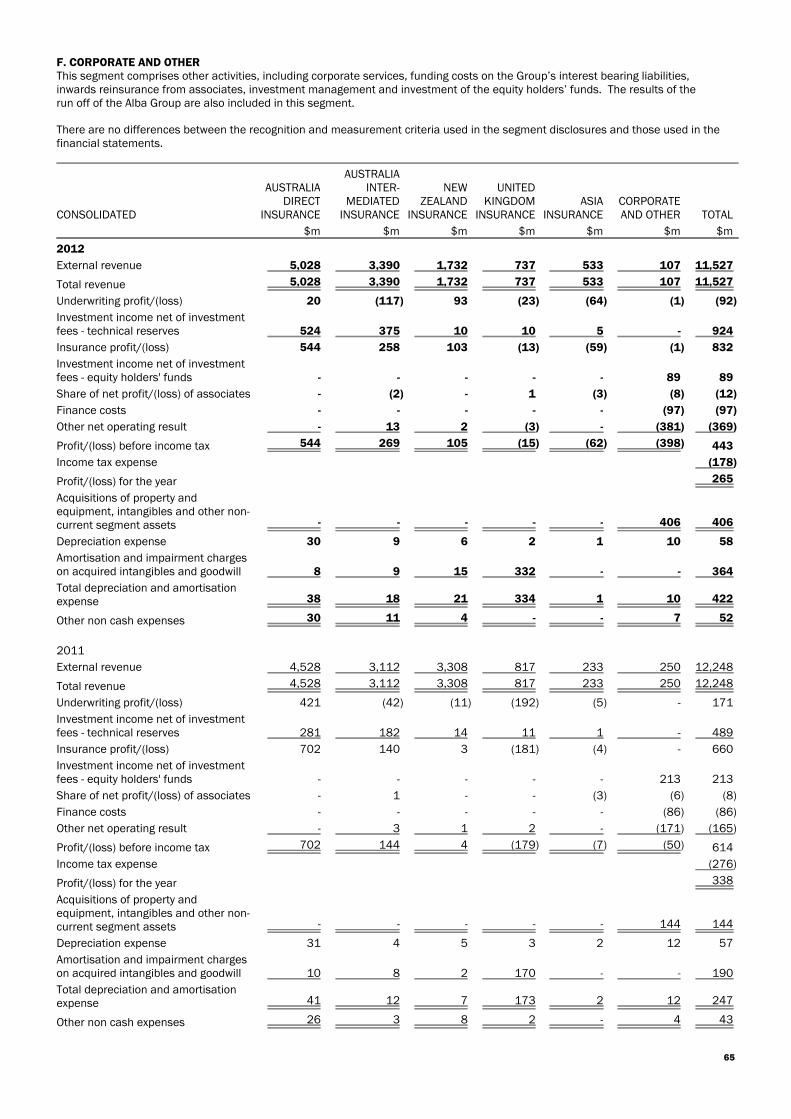
F. CORPORATE AND OTHERThis segment comprises other activities, including corporate services, funding costs on the Group’s interest bearing liabilities,inwards reinsurance from associates, investment management and investment of the equity holders’ funds. The results of therun off of the Alba Group are also included in this segment.
There are no differences between the recognition and measurement criteria used in the segment disclosures and those used in thefinancial statements.
CONSOLIDATED
AUSTRALIADIRECT
INSURANCE
AUSTRALIAINTER-
MEDIATEDINSURANCE
NEWZEALAND
INSURANCE
UNITEDKINGDOM
INSURANCEASIA
INSURANCECORPORATEAND OTHER TOTAL
$m $m $m $m $m $m $m
2012
External revenue 5,028 3,390 1,732 737 533 107 11,527
Total revenue 5,028 3,390 1,732 737 533 107 11,527
Underwriting profit/(loss) 20 (117) 93 (23) (64) (1) (92)
Investment income net of investmentfees - technical reserves 524 375 10 10 5 - 924
Insurance profit/(loss) 544 258 103 (13) (59) (1) 832
Investment income net of investmentfees - equity holders' funds - - - - - 89 89
Share of net profit/(loss) of associates - (2) - 1 (3) (8) (12)
Finance costs - - - - - (97) (97)
Other net operating result - 13 2 (3) - (381) (369)
Profit/(loss) before income tax 544 269 105 (15) (62) (398) 443
Income tax expense (178)
Profit/(loss) for the year 265
Acquisitions of property andequipment, intangibles and other non-current segment assets - - - - - 406 406
Depreciation expense 30 9 6 2 1 10 58
Amortisation and impairment chargeson acquired intangibles and goodwill 8 9 15 332 - - 364
Total depreciation and amortisationexpense 38 18 21 334 1 10 422
Other non cash expenses 30 11 4 - - 7 52
2011
External revenue 4,528 3,112 3,308 817 233 250 12,248
Total revenue 4,528 3,112 3,308 817 233 250 12,248
Underwriting profit/(loss) 421 (42) (11) (192) (5) - 171
Investment income net of investmentfees - technical reserves 281 182 14 11 1 - 489
Insurance profit/(loss) 702 140 3 (181) (4) - 660
Investment income net of investmentfees - equity holders' funds - - - - - 213 213
Share of net profit/(loss) of associates - 1 - - (3) (6) (8)
Finance costs - - - - - (86) (86)
Other net operating result - 3 1 2 - (171) (165)
Profit/(loss) before income tax 702 144 4 (179) (7) (50) 614
Income tax expense (276)
Profit/(loss) for the year 338
Acquisitions of property andequipment, intangibles and other non-current segment assets - - - - - 144 144
Depreciation expense 31 4 5 3 2 12 57
Amortisation and impairment chargeson acquired intangibles and goodwill 10 8 2 170 - - 190
Total depreciation and amortisationexpense 41 12 7 173 2 12 247
Other non cash expenses 26 3 8 2 - 4 43
65
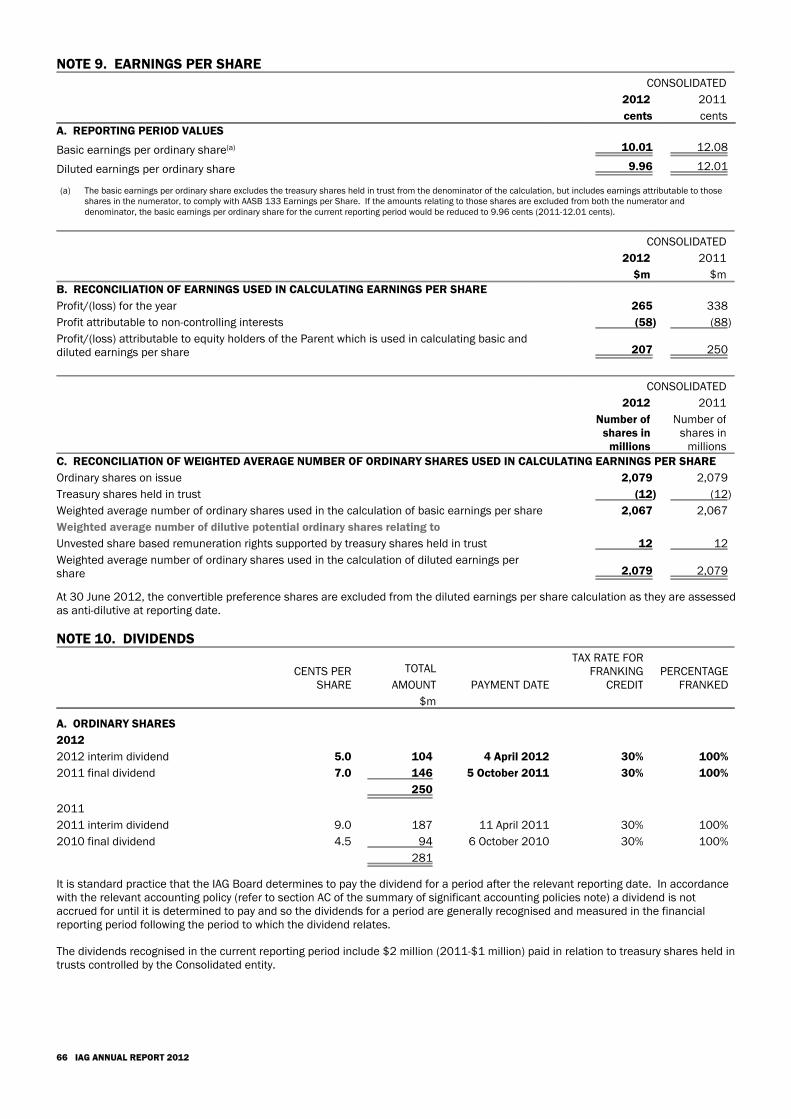
NOTE 9. EARNINGS PER SHARECONSOLIDATED
2012 2011
cents centsA. REPORTING PERIOD VALUES
Basic earnings per ordinary share(a) 10.01 12.08
Diluted earnings per ordinary share 9.96 12.01
(a) The basic earnings per ordinary share excludes the treasury shares held in trust from the denominator of the calculation, but includes earnings attributable to thoseshares in the numerator, to comply with AASB 133 Earnings per Share. If the amounts relating to those shares are excluded from both the numerator anddenominator, the basic earnings per ordinary share for the current reporting period would be reduced to 9.96 cents (2011-12.01 cents).
CONSOLIDATED
2012 2011
$m $mB. RECONCILIATION OF EARNINGS USED IN CALCULATING EARNINGS PER SHARE
Profit/(loss) for the year 265 338
Profit attributable to non-controlling interests (58) (88)
Profit/(loss) attributable to equity holders of the Parent which is used in calculating basic anddiluted earnings per share 207 250
CONSOLIDATED
2012 2011
Number ofshares in
millions
Number ofshares in
millionsC. RECONCILIATION OF WEIGHTED AVERAGE NUMBER OF ORDINARY SHARES USED IN CALCULATING EARNINGS PER SHARE
Ordinary shares on issue 2,079 2,079
Treasury shares held in trust (12) (12)
Weighted average number of ordinary shares used in the calculation of basic earnings per share 2,067 2,067
Weighted average number of dilutive potential ordinary shares relating to
Unvested share based remuneration rights supported by treasury shares held in trust 12 12
Weighted average number of ordinary shares used in the calculation of diluted earnings pershare 2,079 2,079
At 30 June 2012, the convertible preference shares are excluded from the diluted earnings per share calculation as they are assessedas anti-dilutive at reporting date.
NOTE 10. DIVIDENDS
CENTS PERSHARE
TOTAL
AMOUNT PAYMENT DATE
TAX RATE FORFRANKING
CREDITPERCENTAGE
FRANKED
$m
A. ORDINARY SHARES
2012
2012 interim dividend 5.0 104 4 April 2012 30% 100%
2011 final dividend 7.0 146 5 October 2011 30% 100%
250
2011
2011 interim dividend 9.0 187 11 April 2011 30% 100%
2010 final dividend 4.5 94 6 October 2010 30% 100%
281
It is standard practice that the IAG Board determines to pay the dividend for a period after the relevant reporting date. In accordancewith the relevant accounting policy (refer to section AC of the summary of significant accounting policies note) a dividend is notaccrued for until it is determined to pay and so the dividends for a period are generally recognised and measured in the financialreporting period following the period to which the dividend relates.
The dividends recognised in the current reporting period include $2 million (2011-$1 million) paid in relation to treasury shares held intrusts controlled by the Consolidated entity.
66 IAG ANNUAL REPORT 2012
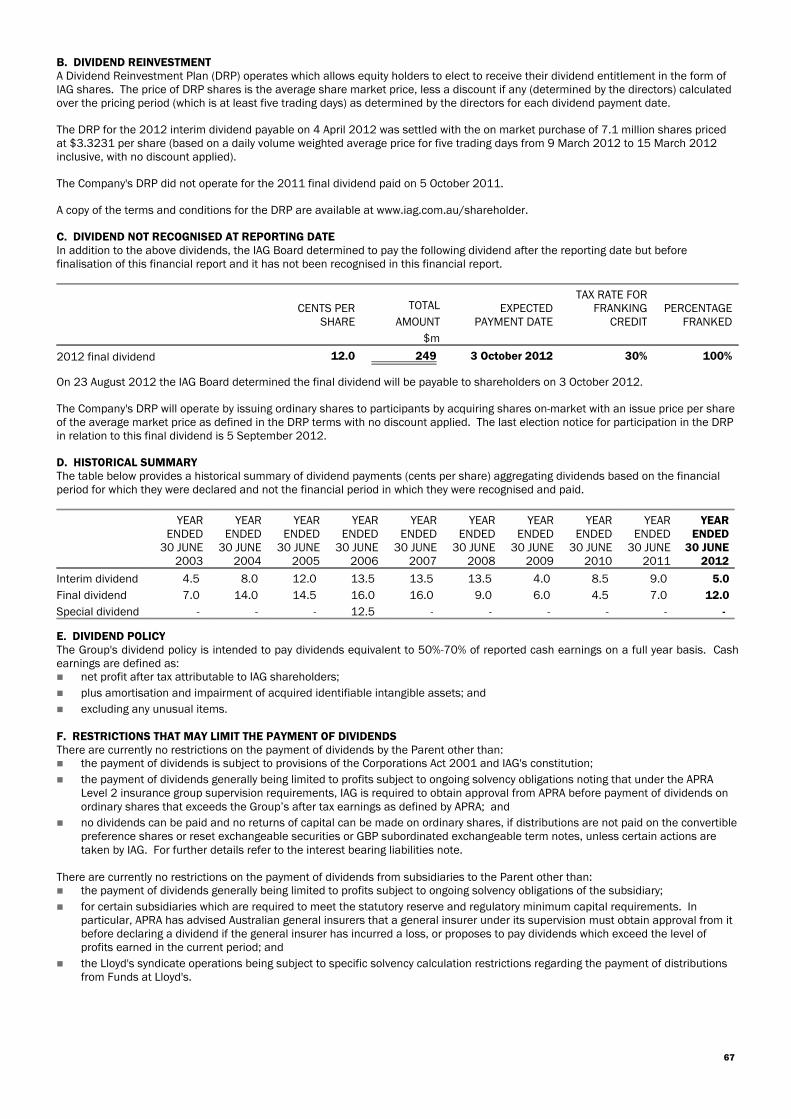
B. DIVIDEND REINVESTMENTA Dividend Reinvestment Plan (DRP) operates which allows equity holders to elect to receive their dividend entitlement in the form ofIAG shares. The price of DRP shares is the average share market price, less a discount if any (determined by the directors) calculatedover the pricing period (which is at least five trading days) as determined by the directors for each dividend payment date.
The DRP for the 2012 interim dividend payable on 4 April 2012 was settled with the on market purchase of 7.1 million shares pricedat $3.3231 per share (based on a daily volume weighted average price for five trading days from 9 March 2012 to 15 March 2012inclusive, with no discount applied).
The Company's DRP did not operate for the 2011 final dividend paid on 5 October 2011.
A copy of the terms and conditions for the DRP are available at www.iag.com.au/shareholder.
C. DIVIDEND NOT RECOGNISED AT REPORTING DATEIn addition to the above dividends, the IAG Board determined to pay the following dividend after the reporting date but beforefinalisation of this financial report and it has not been recognised in this financial report.
CENTS PERSHARE
TOTAL
AMOUNTEXPECTED
PAYMENT DATE
TAX RATE FORFRANKING
CREDITPERCENTAGE
FRANKED
$m
2012 final dividend 12.0 249 3 October 2012 30% 100%
On 23 August 2012 the IAG Board determined the final dividend will be payable to shareholders on 3 October 2012.
The Company's DRP will operate by issuing ordinary shares to participants by acquiring shares on-market with an issue price per shareof the average market price as defined in the DRP terms with no discount applied. The last election notice for participation in the DRPin relation to this final dividend is 5 September 2012.
D. HISTORICAL SUMMARYThe table below provides a historical summary of dividend payments (cents per share) aggregating dividends based on the financialperiod for which they were declared and not the financial period in which they were recognised and paid.
YEARENDED
30 JUNE2003
YEARENDED
30 JUNE2004
YEARENDED
30 JUNE2005
YEARENDED
30 JUNE2006
YEARENDED
30 JUNE2007
YEARENDED
30 JUNE2008
YEARENDED
30 JUNE2009
YEARENDED
30 JUNE2010
YEARENDED
30 JUNE2011
YEARENDED
30 JUNE2012
Interim dividend 4.5 8.0 12.0 13.5 13.5 13.5 4.0 8.5 9.0 5.0
Final dividend 7.0 14.0 14.5 16.0 16.0 9.0 6.0 4.5 7.0 12.0
Special dividend - - - 12.5 - - - - - -
E. DIVIDEND POLICYThe Group's dividend policy is intended to pay dividends equivalent to 50%-70% of reported cash earnings on a full year basis. Cashearnings are defined as: net profit after tax attributable to IAG shareholders;
plus amortisation and impairment of acquired identifiable intangible assets; and
excluding any unusual items.
F. RESTRICTIONS THAT MAY LIMIT THE PAYMENT OF DIVIDENDSThere are currently no restrictions on the payment of dividends by the Parent other than: the payment of dividends is subject to provisions of the Corporations Act 2001 and IAG's constitution;
the payment of dividends generally being limited to profits subject to ongoing solvency obligations noting that under the APRALevel 2 insurance group supervision requirements, IAG is required to obtain approval from APRA before payment of dividends onordinary shares that exceeds the Group’s after tax earnings as defined by APRA; and
no dividends can be paid and no returns of capital can be made on ordinary shares, if distributions are not paid on the convertiblepreference shares or reset exchangeable securities or GBP subordinated exchangeable term notes, unless certain actions aretaken by IAG. For further details refer to the interest bearing liabilities note.
There are currently no restrictions on the payment of dividends from subsidiaries to the Parent other than: the payment of dividends generally being limited to profits subject to ongoing solvency obligations of the subsidiary;
for certain subsidiaries which are required to meet the statutory reserve and regulatory minimum capital requirements. Inparticular, APRA has advised Australian general insurers that a general insurer under its supervision must obtain approval from itbefore declaring a dividend if the general insurer has incurred a loss, or proposes to pay dividends which exceed the level ofprofits earned in the current period; and
the Lloyd's syndicate operations being subject to specific solvency calculation restrictions regarding the payment of distributionsfrom Funds at Lloyd's.
67
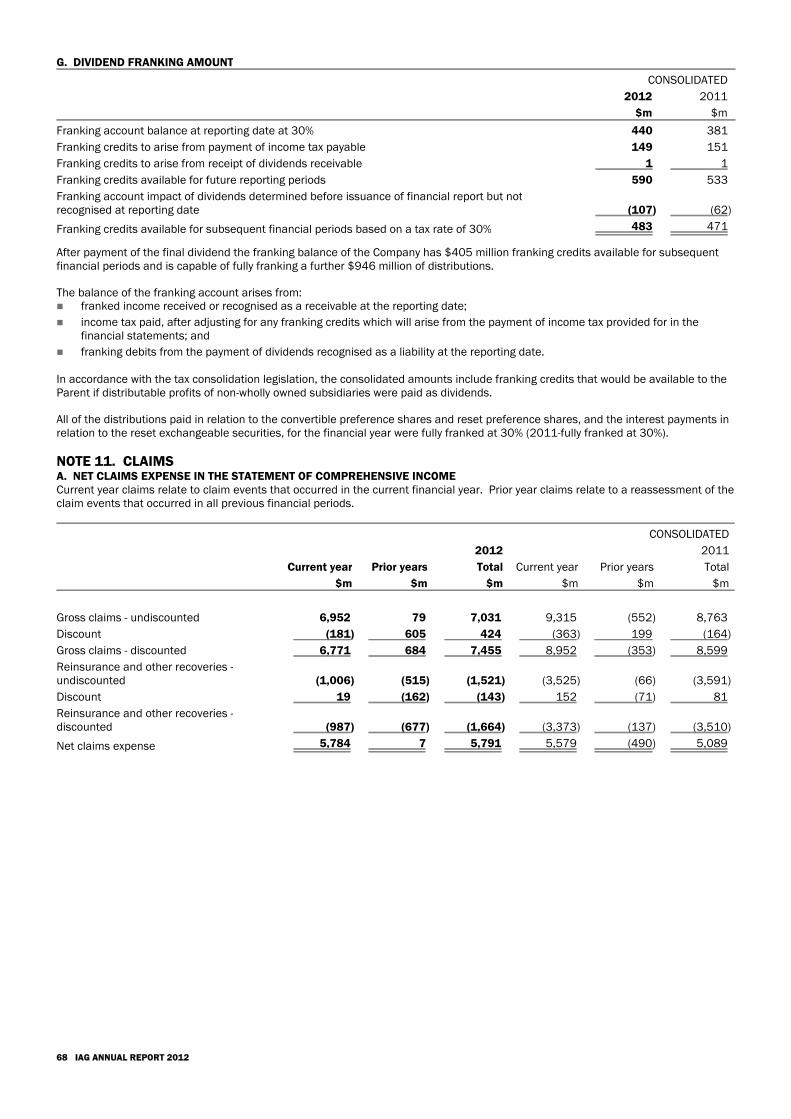
G. DIVIDEND FRANKING AMOUNT
CONSOLIDATED
2012 2011
$m $m
Franking account balance at reporting date at 30% 440 381
Franking credits to arise from payment of income tax payable 149 151
Franking credits to arise from receipt of dividends receivable 1 1
Franking credits available for future reporting periods 590 533
Franking account impact of dividends determined before issuance of financial report but notrecognised at reporting date (107) (62)
Franking credits available for subsequent financial periods based on a tax rate of 30% 483 471
After payment of the final dividend the franking balance of the Company has $405 million franking credits available for subsequentfinancial periods and is capable of fully franking a further $946 million of distributions.
The balance of the franking account arises from: franked income received or recognised as a receivable at the reporting date;
income tax paid, after adjusting for any franking credits which will arise from the payment of income tax provided for in thefinancial statements; and
franking debits from the payment of dividends recognised as a liability at the reporting date.
In accordance with the tax consolidation legislation, the consolidated amounts include franking credits that would be available to theParent if distributable profits of non-wholly owned subsidiaries were paid as dividends.
All of the distributions paid in relation to the convertible preference shares and reset preference shares, and the interest payments inrelation to the reset exchangeable securities, for the financial year were fully franked at 30% (2011-fully franked at 30%).
NOTE 11. CLAIMSA. NET CLAIMS EXPENSE IN THE STATEMENT OF COMPREHENSIVE INCOMECurrent year claims relate to claim events that occurred in the current financial year. Prior year claims relate to a reassessment of theclaim events that occurred in all previous financial periods.
CONSOLIDATED
2012 2011
Current year Prior years Total Current year Prior years Total
$m $m $m $m $m $m
Gross claims - undiscounted 6,952 79 7,031 9,315 (552) 8,763
Discount (181) 605 424 (363) 199 (164)
Gross claims - discounted 6,771 684 7,455 8,952 (353) 8,599
Reinsurance and other recoveries -undiscounted (1,006) (515) (1,521) (3,525) (66) (3,591)
Discount 19 (162) (143) 152 (71) 81
Reinsurance and other recoveries -discounted (987) (677) (1,664) (3,373) (137) (3,510)
Net claims expense 5,784 7 5,791 5,579 (490) 5,089
68 IAG ANNUAL REPORT 2012
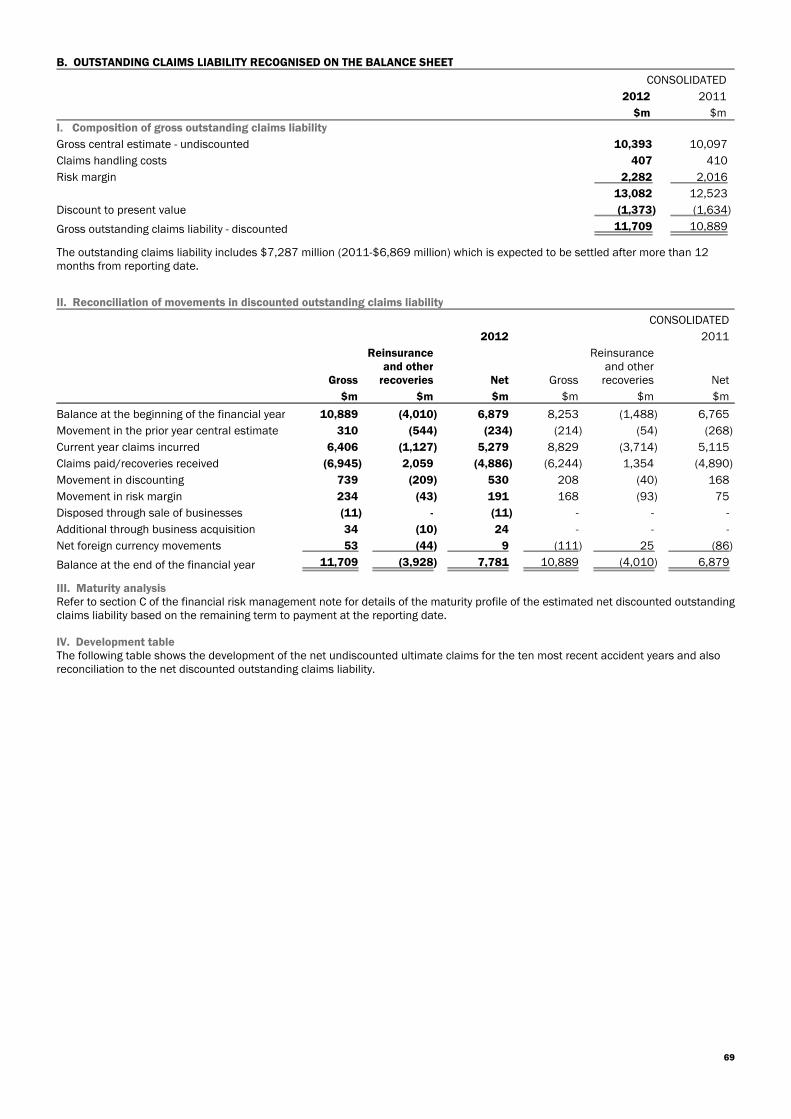
B. OUTSTANDING CLAIMS LIABILITY RECOGNISED ON THE BALANCE SHEET
CONSOLIDATED
2012 2011
$m $mI. Composition of gross outstanding claims liability
Gross central estimate - undiscounted 10,393 10,097
Claims handling costs 407 410
Risk margin 2,282 2,016
13,082 12,523
Discount to present value (1,373) (1,634)
Gross outstanding claims liability - discounted 11,709 10,889
The outstanding claims liability includes $7,287 million (2011-$6,869 million) which is expected to be settled after more than 12months from reporting date.
II. Reconciliation of movements in discounted outstanding claims liability
CONSOLIDATED
2012 2011
Gross
Reinsuranceand other
recoveries Net Gross
Reinsuranceand other
recoveries Net
$m $m $m $m $m $m
Balance at the beginning of the financial year 10,889 (4,010) 6,879 8,253 (1,488) 6,765
Movement in the prior year central estimate 310 (544) (234) (214) (54) (268)
Current year claims incurred 6,406 (1,127) 5,279 8,829 (3,714) 5,115
Claims paid/recoveries received (6,945) 2,059 (4,886) (6,244) 1,354 (4,890)
Movement in discounting 739 (209) 530 208 (40) 168
Movement in risk margin 234 (43) 191 168 (93) 75
Disposed through sale of businesses (11) - (11) - - -
Additional through business acquisition 34 (10) 24 - - -
Net foreign currency movements 53 (44) 9 (111) 25 (86)
Balance at the end of the financial year 11,709 (3,928) 7,781 10,889 (4,010) 6,879
III. Maturity analysisRefer to section C of the financial risk management note for details of the maturity profile of the estimated net discounted outstandingclaims liability based on the remaining term to payment at the reporting date.
IV. Development tableThe following table shows the development of the net undiscounted ultimate claims for the ten most recent accident years and alsoreconciliation to the net discounted outstanding claims liability.
69
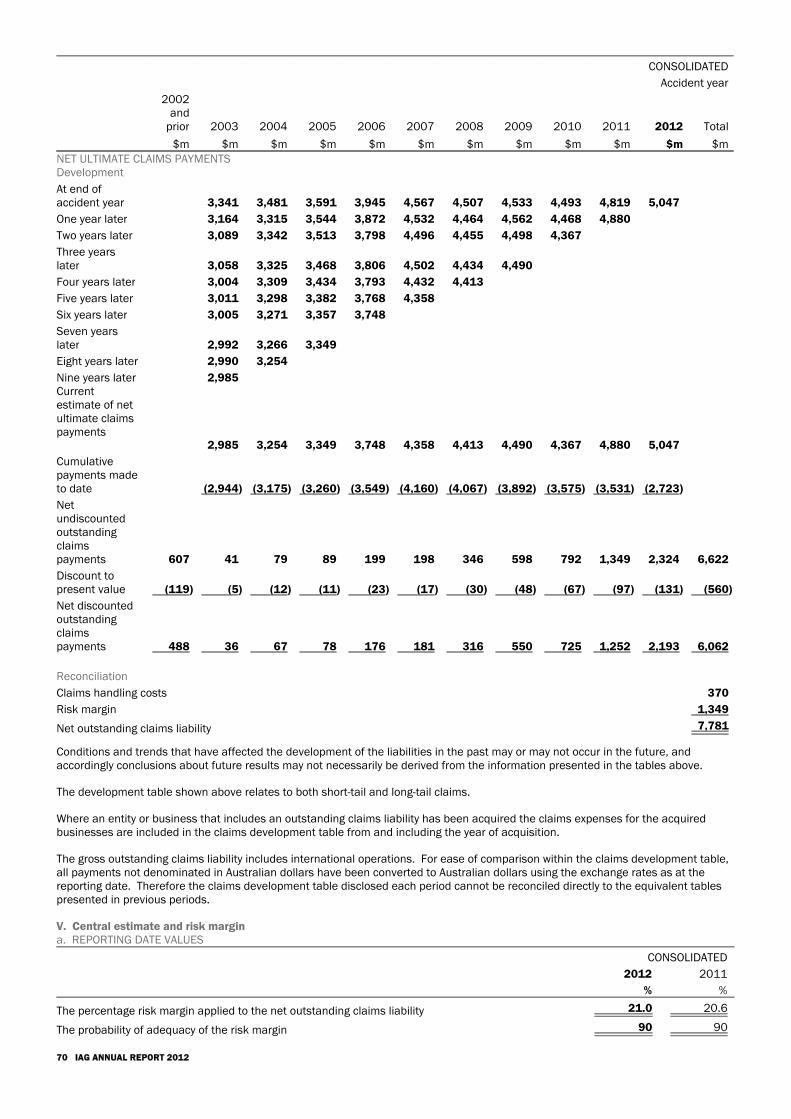
CONSOLIDATED
Accident year
2002and
prior 2003 2004 2005 2006 2007 2008 2009 2010 2011 2012 Total
$m $m $m $m $m $m $m $m $m $m $m $mNET ULTIMATE CLAIMS PAYMENTSDevelopment
At end ofaccident year 3,341 3,481 3,591 3,945 4,567 4,507 4,533 4,493 4,819 5,047
One year later 3,164 3,315 3,544 3,872 4,532 4,464 4,562 4,468 4,880
Two years later 3,089 3,342 3,513 3,798 4,496 4,455 4,498 4,367
Three yearslater 3,058 3,325 3,468 3,806 4,502 4,434 4,490
Four years later 3,004 3,309 3,434 3,793 4,432 4,413
Five years later 3,011 3,298 3,382 3,768 4,358
Six years later 3,005 3,271 3,357 3,748
Seven yearslater 2,992 3,266 3,349
Eight years later 2,990 3,254
Nine years later 2,985Currentestimate of netultimate claimspayments
2,985 3,254 3,349 3,748 4,358 4,413 4,490 4,367 4,880 5,047
Cumulativepayments madeto date (2,944) (3,175) (3,260) (3,549) (4,160) (4,067) (3,892) (3,575) (3,531) (2,723)
Netundiscountedoutstandingclaimspayments 607 41 79 89 199 198 346 598 792 1,349 2,324 6,622
Discount topresent value (119) (5) (12) (11) (23) (17) (30) (48) (67) (97) (131) (560)
Net discountedoutstandingclaimspayments 488 36 67 78 176 181 316 550 725 1,252 2,193 6,062
Reconciliation
Claims handling costs 370
Risk margin 1,349
Net outstanding claims liability 7,781
Conditions and trends that have affected the development of the liabilities in the past may or may not occur in the future, andaccordingly conclusions about future results may not necessarily be derived from the information presented in the tables above.
The development table shown above relates to both short-tail and long-tail claims.
Where an entity or business that includes an outstanding claims liability has been acquired the claims expenses for the acquiredbusinesses are included in the claims development table from and including the year of acquisition.
The gross outstanding claims liability includes international operations. For ease of comparison within the claims development table,all payments not denominated in Australian dollars have been converted to Australian dollars using the exchange rates as at thereporting date. Therefore the claims development table disclosed each period cannot be reconciled directly to the equivalent tablespresented in previous periods.
V. Central estimate and risk margina. REPORTING DATE VALUES
CONSOLIDATED
2012 2011
% %
The percentage risk margin applied to the net outstanding claims liability 21.0 20.6
The probability of adequacy of the risk margin 90 90
70 IAG ANNUAL REPORT 2012
b. PROCESSThe outstanding claims liability is determined based on three building blocks being: a central estimate of the future cash flows;
discounting for the effect of the time value of money; and
a risk margin for uncertainty.
i. Future cash flowsThe estimation of the outstanding claims liability is based on a variety of actuarial techniques that analyse experience, trends andother relevant factors. The expected future payments include those in relation to claims reported but not yet paid or not yet paid in full,claims incurred but not enough reported (IBNER), claims incurred but not reported (IBNR) and the anticipated direct and indirectclaims handling costs.
The estimation process involves using the Consolidated entity’s specific data, relevant industry data and more general economic data.Each class of business is usually examined separately and the process involves consideration of a large number of factors. Thesefactors may include the risks to which the business is exposed at a point in time, claim frequencies and average claim sizes, historicaltrends in the incidence and development of claims reported and finalised, legal, social and economic factors that may impact uponeach class of business, the key actuarial assumptions set out in section VI and the impact of reinsurance and other recoveries.
Different actuarial valuation models are used for different claims types and lines of business. The selection of the appropriateactuarial model takes into account the characteristics of a claim type and class of business and the extent of the development of eachpast accident period.
ii. DiscountingProjected future claims payments, both gross and net of reinsurance and other recoveries, and associated claims handling costs arediscounted to a present value using appropriate risk free discount rates.
iii. Risk marginThe central estimate of the outstanding claims liability is an estimate which is intended to contain no deliberate or conscious over orunder estimation and is commonly described as providing the mean of the distribution of future cash flows. It is consideredappropriate to add a risk margin to the central estimate in order for the claims liability to have an increased probability of sufficiency.The risk margin refers to the amount by which the liability recognised in the financial statements is greater than the actuarial centralestimate of the liability.
Uncertainties surrounding the outstanding claims liability estimation process include those relating to the data, actuarial models andassumptions, the statistical uncertainty associated with a general insurance claims runoff process, and risks external to IAG, forexample the impact of future legislative reform. Uncertainty from these sources is examined for each class of business and expressedas a volatility measure relative to the net central estimate. The volatility measure for each class is derived after consideration ofstatistical modelling and benchmarking to industry analysis. Certain product classes may be subject to the emergence of new types oflatent claims and such uncertainties are considered when setting the volatility, and hence the risk margin appropriate for thoseclasses.
The measure of the volatility is referred to as the coefficients of variation (CoV). The CoV is defined as the standard deviation of thedistribution of future cash flows divided by the mean.
The long-tail classes of business generally have the highest volatilities for outstanding claims as the longer average time for claims tobe reported and settled allows more time for sources of uncertainty to emerge. Short-tail classes generally have lower levels ofvolatility for outstanding claims.
The risk margin required to provide a given probability of adequacy for two or more classes of business or for two or more geographiclocations combined is likely to be less than the sum of the risk margins for the individual classes. This reflects the benefit ofdiversification.
The measure of the parameter used to derive the diversification benefit is referred to as correlation. The higher the correlationbetween two classes of business, the more likely it is that a negative outcome in one class will correspond to a negative outcome inthe other class. The correlations are adopted with regard to industry analysis, historical experience and the judgement of experiencedand qualified actuaries.
The determination of the overall risk margin takes into account the volatility of each class of business and the correlations betweenthe lines of business. The current risk margin, which has been determined after assessing the inherent uncertainty in the centralestimate and the prevailing market environment, results in an overall probability of adequacy for the outstanding claims liability of 90%(2011-90%).
71
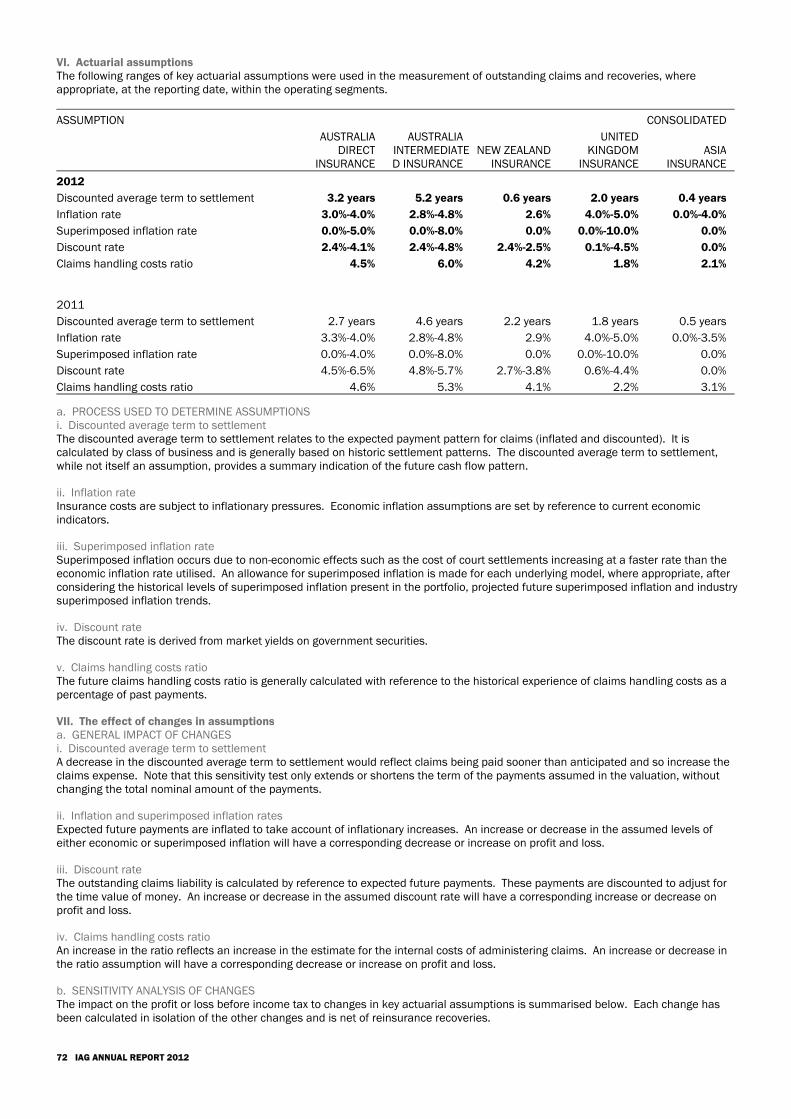
VI. Actuarial assumptionsThe following ranges of key actuarial assumptions were used in the measurement of outstanding claims and recoveries, whereappropriate, at the reporting date, within the operating segments.
ASSUMPTION CONSOLIDATED
AUSTRALIADIRECT
INSURANCE
AUSTRALIAINTERMEDIATED INSURANCE
NEW ZEALANDINSURANCE
UNITEDKINGDOM
INSURANCEASIA
INSURANCE
2012
Discounted average term to settlement 3.2 years 5.2 years 0.6 years 2.0 years 0.4 years
Inflation rate 3.0%-4.0% 2.8%-4.8% 2.6% 4.0%-5.0% 0.0%-4.0%
Superimposed inflation rate 0.0%-5.0% 0.0%-8.0% 0.0% 0.0%-10.0% 0.0%
Discount rate 2.4%-4.1% 2.4%-4.8% 2.4%-2.5% 0.1%-4.5% 0.0%
Claims handling costs ratio 4.5% 6.0% 4.2% 1.8% 2.1%
2011
Discounted average term to settlement 2.7 years 4.6 years 2.2 years 1.8 years 0.5 years
Inflation rate 3.3%-4.0% 2.8%-4.8% 2.9% 4.0%-5.0% 0.0%-3.5%
Superimposed inflation rate 0.0%-4.0% 0.0%-8.0% 0.0% 0.0%-10.0% 0.0%
Discount rate 4.5%-6.5% 4.8%-5.7% 2.7%-3.8% 0.6%-4.4% 0.0%
Claims handling costs ratio 4.6% 5.3% 4.1% 2.2% 3.1%
a. PROCESS USED TO DETERMINE ASSUMPTIONSi. Discounted average term to settlementThe discounted average term to settlement relates to the expected payment pattern for claims (inflated and discounted). It iscalculated by class of business and is generally based on historic settlement patterns. The discounted average term to settlement,while not itself an assumption, provides a summary indication of the future cash flow pattern.
ii. Inflation rateInsurance costs are subject to inflationary pressures. Economic inflation assumptions are set by reference to current economicindicators.
iii. Superimposed inflation rateSuperimposed inflation occurs due to non-economic effects such as the cost of court settlements increasing at a faster rate than theeconomic inflation rate utilised. An allowance for superimposed inflation is made for each underlying model, where appropriate, afterconsidering the historical levels of superimposed inflation present in the portfolio, projected future superimposed inflation and industrysuperimposed inflation trends.
iv. Discount rateThe discount rate is derived from market yields on government securities.
v. Claims handling costs ratioThe future claims handling costs ratio is generally calculated with reference to the historical experience of claims handling costs as apercentage of past payments.
VII. The effect of changes in assumptionsa. GENERAL IMPACT OF CHANGESi. Discounted average term to settlementA decrease in the discounted average term to settlement would reflect claims being paid sooner than anticipated and so increase theclaims expense. Note that this sensitivity test only extends or shortens the term of the payments assumed in the valuation, withoutchanging the total nominal amount of the payments.
ii. Inflation and superimposed inflation ratesExpected future payments are inflated to take account of inflationary increases. An increase or decrease in the assumed levels ofeither economic or superimposed inflation will have a corresponding decrease or increase on profit and loss.
iii. Discount rateThe outstanding claims liability is calculated by reference to expected future payments. These payments are discounted to adjust forthe time value of money. An increase or decrease in the assumed discount rate will have a corresponding increase or decrease onprofit and loss.
iv. Claims handling costs ratioAn increase in the ratio reflects an increase in the estimate for the internal costs of administering claims. An increase or decrease inthe ratio assumption will have a corresponding decrease or increase on profit and loss.
b. SENSITIVITY ANALYSIS OF CHANGESThe impact on the profit or loss before income tax to changes in key actuarial assumptions is summarised below. Each change hasbeen calculated in isolation of the other changes and is net of reinsurance recoveries.
72 IAG ANNUAL REPORT 2012
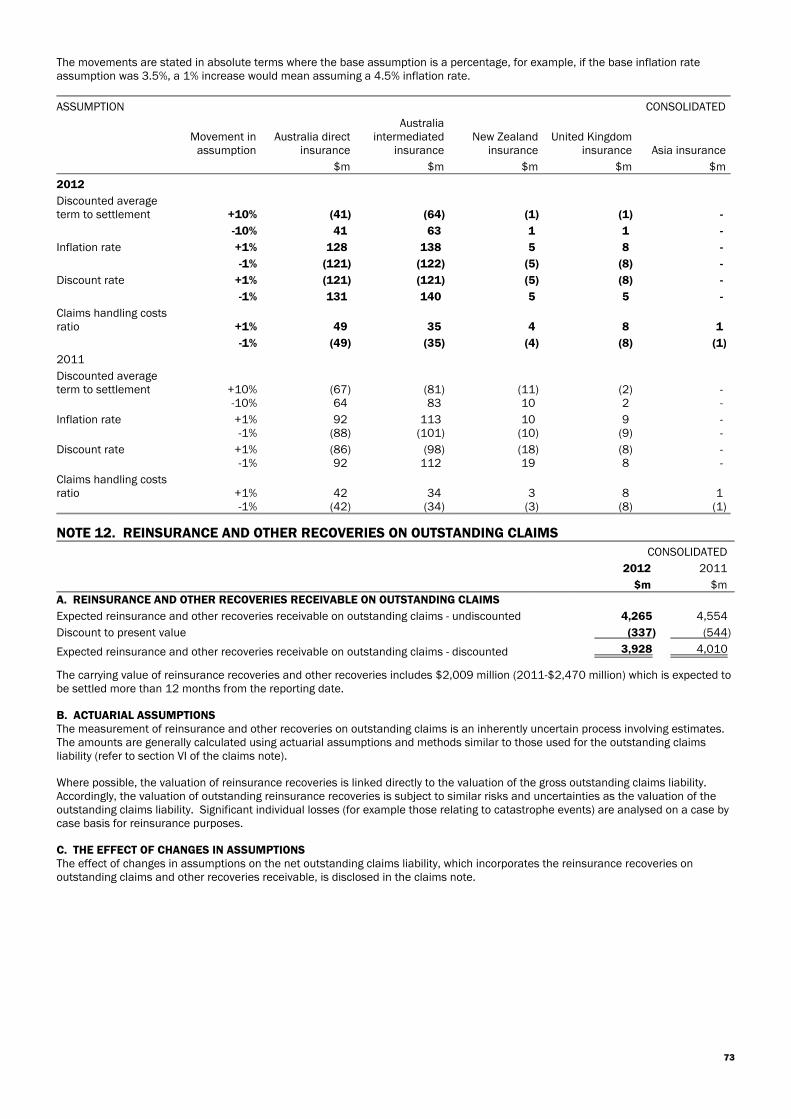
The movements are stated in absolute terms where the base assumption is a percentage, for example, if the base inflation rateassumption was 3.5%, a 1% increase would mean assuming a 4.5% inflation rate.
ASSUMPTION CONSOLIDATED
Movement inassumption
Australia directinsurance
Australiaintermediated
insuranceNew Zealand
insuranceUnited Kingdom
insurance Asia insurance
$m $m $m $m $m
2012
Discounted averageterm to settlement +10% (41) (64) (1) (1) -
-10% 41 63 1 1 -
Inflation rate +1% 128 138 5 8 -
-1% (121) (122) (5) (8) -
Discount rate +1% (121) (121) (5) (8) -
-1% 131 140 5 5 -
Claims handling costsratio +1% 49 35 4 8 1
-1% (49) (35) (4) (8) (1)
2011
Discounted averageterm to settlement +10% (67) (81) (11) (2) -
-10% 64 83 10 2 -
Inflation rate +1% 92 113 10 9 --1% (88) (101) (10) (9) -
Discount rate +1% (86) (98) (18) (8) --1% 92 112 19 8 -
Claims handling costsratio +1% 42 34 3 8 1
-1% (42) (34) (3) (8) (1)
NOTE 12. REINSURANCE AND OTHER RECOVERIES ON OUTSTANDING CLAIMSCONSOLIDATED
2012 2011
$m $mA. REINSURANCE AND OTHER RECOVERIES RECEIVABLE ON OUTSTANDING CLAIMS
Expected reinsurance and other recoveries receivable on outstanding claims - undiscounted 4,265 4,554
Discount to present value (337) (544)
Expected reinsurance and other recoveries receivable on outstanding claims - discounted 3,928 4,010
The carrying value of reinsurance recoveries and other recoveries includes $2,009 million (2011-$2,470 million) which is expected tobe settled more than 12 months from the reporting date.
B. ACTUARIAL ASSUMPTIONSThe measurement of reinsurance and other recoveries on outstanding claims is an inherently uncertain process involving estimates.The amounts are generally calculated using actuarial assumptions and methods similar to those used for the outstanding claimsliability (refer to section VI of the claims note).
Where possible, the valuation of reinsurance recoveries is linked directly to the valuation of the gross outstanding claims liability.Accordingly, the valuation of outstanding reinsurance recoveries is subject to similar risks and uncertainties as the valuation of theoutstanding claims liability. Significant individual losses (for example those relating to catastrophe events) are analysed on a case bycase basis for reinsurance purposes.
C. THE EFFECT OF CHANGES IN ASSUMPTIONSThe effect of changes in assumptions on the net outstanding claims liability, which incorporates the reinsurance recoveries onoutstanding claims and other recoveries receivable, is disclosed in the claims note.
73
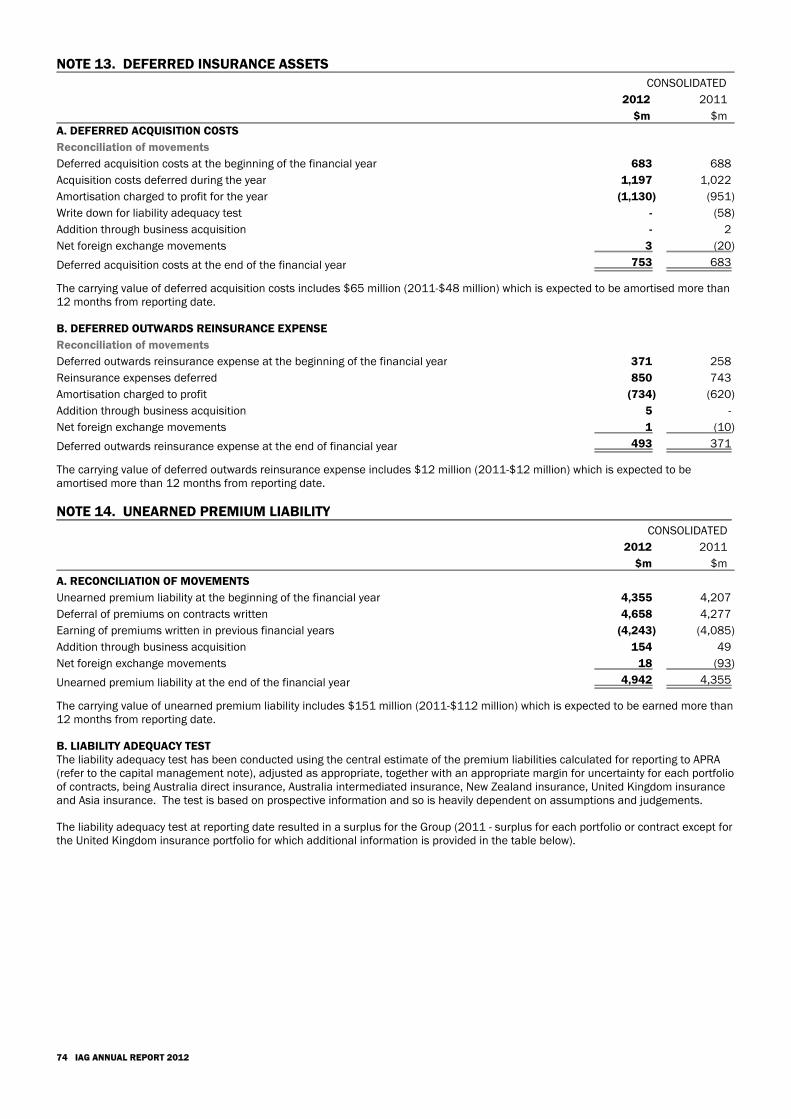
NOTE 13. DEFERRED INSURANCE ASSETSCONSOLIDATED
2012 2011
$m $mA. DEFERRED ACQUISITION COSTS
Reconciliation of movements
Deferred acquisition costs at the beginning of the financial year 683 688
Acquisition costs deferred during the year 1,197 1,022
Amortisation charged to profit for the year (1,130) (951)
Write down for liability adequacy test - (58)
Addition through business acquisition - 2
Net foreign exchange movements 3 (20)
Deferred acquisition costs at the end of the financial year 753 683
The carrying value of deferred acquisition costs includes $65 million (2011-$48 million) which is expected to be amortised more than12 months from reporting date.
B. DEFERRED OUTWARDS REINSURANCE EXPENSE
Reconciliation of movements
Deferred outwards reinsurance expense at the beginning of the financial year 371 258
Reinsurance expenses deferred 850 743
Amortisation charged to profit (734) (620)
Addition through business acquisition 5 -
Net foreign exchange movements 1 (10)
Deferred outwards reinsurance expense at the end of financial year 493 371
The carrying value of deferred outwards reinsurance expense includes $12 million (2011-$12 million) which is expected to beamortised more than 12 months from reporting date.
NOTE 14. UNEARNED PREMIUM LIABILITYCONSOLIDATED
2012 2011
$m $m
A. RECONCILIATION OF MOVEMENTS
Unearned premium liability at the beginning of the financial year 4,355 4,207
Deferral of premiums on contracts written 4,658 4,277
Earning of premiums written in previous financial years (4,243) (4,085)
Addition through business acquisition 154 49
Net foreign exchange movements 18 (93)
Unearned premium liability at the end of the financial year 4,942 4,355
The carrying value of unearned premium liability includes $151 million (2011-$112 million) which is expected to be earned more than12 months from reporting date.
B. LIABILITY ADEQUACY TESTThe liability adequacy test has been conducted using the central estimate of the premium liabilities calculated for reporting to APRA(refer to the capital management note), adjusted as appropriate, together with an appropriate margin for uncertainty for each portfolioof contracts, being Australia direct insurance, Australia intermediated insurance, New Zealand insurance, United Kingdom insuranceand Asia insurance. The test is based on prospective information and so is heavily dependent on assumptions and judgements.
The liability adequacy test at reporting date resulted in a surplus for the Group (2011 - surplus for each portfolio or contract except forthe United Kingdom insurance portfolio for which additional information is provided in the table below).
74 IAG ANNUAL REPORT 2012
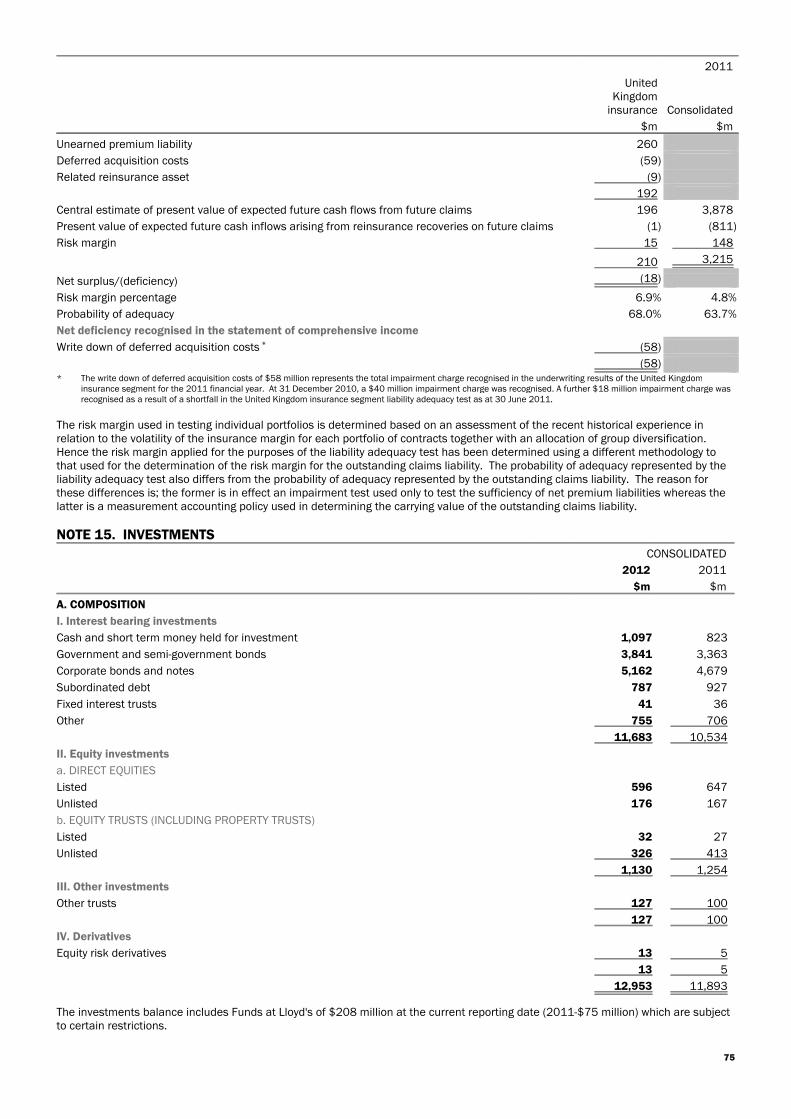
2011
UnitedKingdom
insurance Consolidated
$m $m
Unearned premium liability 260
Deferred acquisition costs (59)
Related reinsurance asset (9)
192
Central estimate of present value of expected future cash flows from future claims 196 3,878
Present value of expected future cash inflows arising from reinsurance recoveries on future claims (1) (811)
Risk margin 15 148
210 3,215
Net surplus/(deficiency) (18)
Risk margin percentage 6.9% 4.8%
Probability of adequacy 68.0% 63.7%
Net deficiency recognised in the statement of comprehensive income
Write down of deferred acquisition costs * (58)
(58)* The write down of deferred acquisition costs of $58 million represents the total impairment charge recognised in the underwriting results of the United Kingdom
insurance segment for the 2011 financial year. At 31 December 2010, a $40 million impairment charge was recognised. A further $18 million impairment charge wasrecognised as a result of a shortfall in the United Kingdom insurance segment liability adequacy test as at 30 June 2011.
The risk margin used in testing individual portfolios is determined based on an assessment of the recent historical experience inrelation to the volatility of the insurance margin for each portfolio of contracts together with an allocation of group diversification.Hence the risk margin applied for the purposes of the liability adequacy test has been determined using a different methodology tothat used for the determination of the risk margin for the outstanding claims liability. The probability of adequacy represented by theliability adequacy test also differs from the probability of adequacy represented by the outstanding claims liability. The reason forthese differences is; the former is in effect an impairment test used only to test the sufficiency of net premium liabilities whereas thelatter is a measurement accounting policy used in determining the carrying value of the outstanding claims liability.
NOTE 15. INVESTMENTSCONSOLIDATED
2012 2011
$m $m
A. COMPOSITION
I. Interest bearing investments
Cash and short term money held for investment 1,097 823
Government and semi-government bonds 3,841 3,363
Corporate bonds and notes 5,162 4,679
Subordinated debt 787 927
Fixed interest trusts 41 36
Other 755 706
11,683 10,534
II. Equity investments
a. DIRECT EQUITIES
Listed 596 647
Unlisted 176 167
b. EQUITY TRUSTS (INCLUDING PROPERTY TRUSTS)
Listed 32 27
Unlisted 326 413
1,130 1,254
III. Other investments
Other trusts 127 100
127 100
IV. Derivatives
Equity risk derivatives 13 5
13 5
12,953 11,893
The investments balance includes Funds at Lloyd's of $208 million at the current reporting date (2011-$75 million) which are subjectto certain restrictions.
75
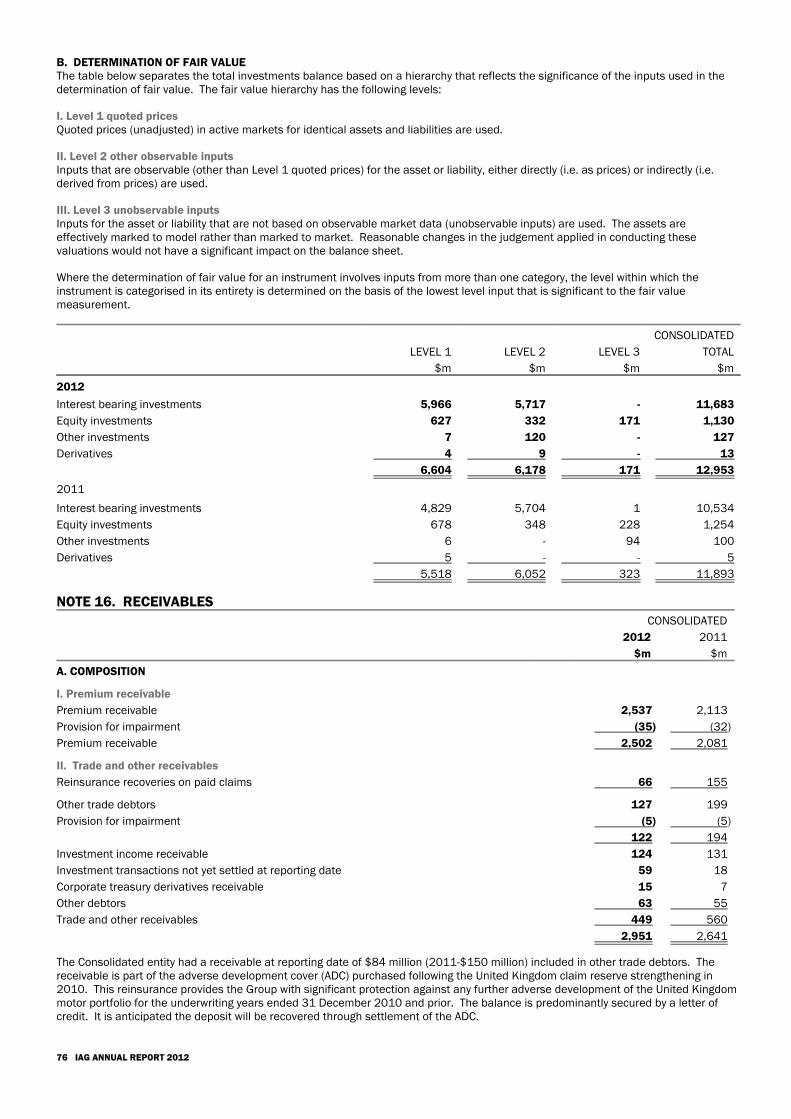
B. DETERMINATION OF FAIR VALUEThe table below separates the total investments balance based on a hierarchy that reflects the significance of the inputs used in thedetermination of fair value. The fair value hierarchy has the following levels:
I. Level 1 quoted pricesQuoted prices (unadjusted) in active markets for identical assets and liabilities are used.
II. Level 2 other observable inputsInputs that are observable (other than Level 1 quoted prices) for the asset or liability, either directly (i.e. as prices) or indirectly (i.e.derived from prices) are used.
III. Level 3 unobservable inputsInputs for the asset or liability that are not based on observable market data (unobservable inputs) are used. The assets areeffectively marked to model rather than marked to market. Reasonable changes in the judgement applied in conducting thesevaluations would not have a significant impact on the balance sheet.
Where the determination of fair value for an instrument involves inputs from more than one category, the level within which theinstrument is categorised in its entirety is determined on the basis of the lowest level input that is significant to the fair valuemeasurement.
CONSOLIDATED
LEVEL 1 LEVEL 2 LEVEL 3 TOTAL
$m $m $m $m
2012
Interest bearing investments 5,966 5,717 - 11,683
Equity investments 627 332 171 1,130
Other investments 7 120 - 127
Derivatives 4 9 - 13
6,604 6,178 171 12,953
2011
Interest bearing investments 4,829 5,704 1 10,534
Equity investments 678 348 228 1,254
Other investments 6 - 94 100
Derivatives 5 - - 5
5,518 6,052 323 11,893
NOTE 16. RECEIVABLESCONSOLIDATED
2012 2011
$m $m
A. COMPOSITION
I. Premium receivable
Premium receivable 2,537 2,113
Provision for impairment (35) (32)
Premium receivable 2,502 2,081
II. Trade and other receivables
Reinsurance recoveries on paid claims 66 155
Other trade debtors 127 199
Provision for impairment (5) (5)
122 194
Investment income receivable 124 131
Investment transactions not yet settled at reporting date 59 18
Corporate treasury derivatives receivable 15 7
Other debtors 63 55
Trade and other receivables 449 560
2,951 2,641
The Consolidated entity had a receivable at reporting date of $84 million (2011-$150 million) included in other trade debtors. Thereceivable is part of the adverse development cover (ADC) purchased following the United Kingdom claim reserve strengthening in2010. This reinsurance provides the Group with significant protection against any further adverse development of the United Kingdommotor portfolio for the underwriting years ended 31 December 2010 and prior. The balance is predominantly secured by a letter ofcredit. It is anticipated the deposit will be recovered through settlement of the ADC.
76 IAG ANNUAL REPORT 2012
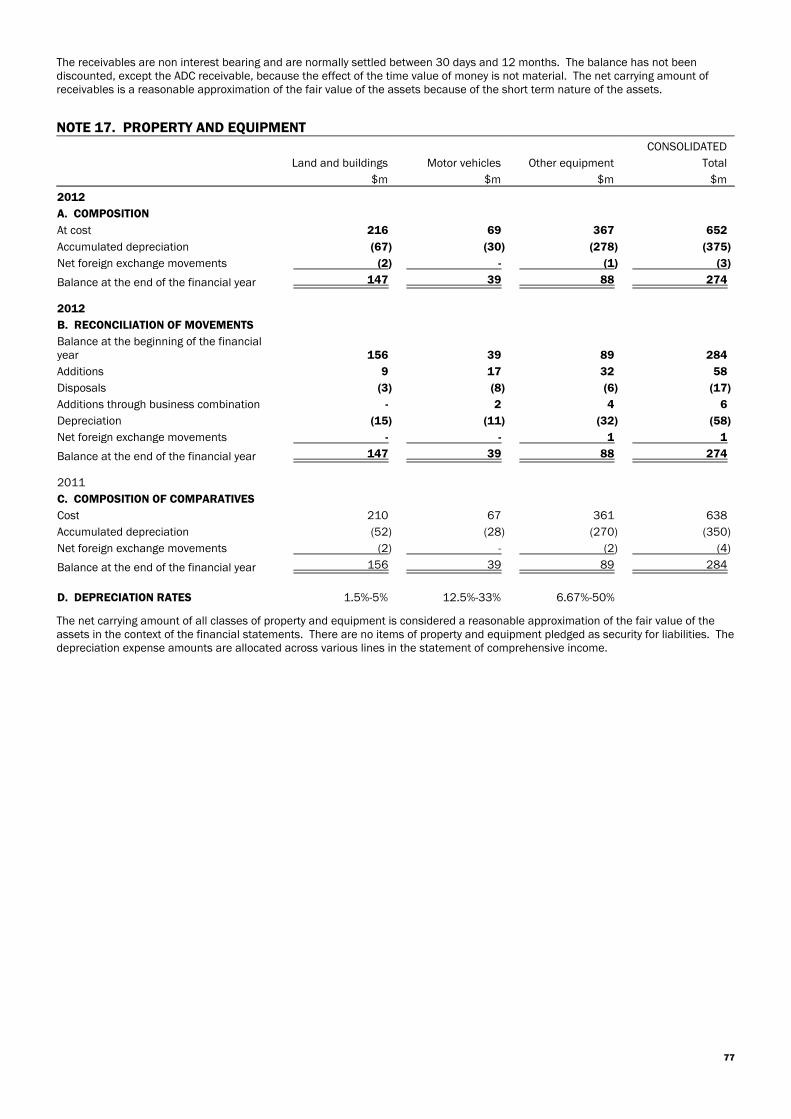
The receivables are non interest bearing and are normally settled between 30 days and 12 months. The balance has not beendiscounted, except the ADC receivable, because the effect of the time value of money is not material. The net carrying amount ofreceivables is a reasonable approximation of the fair value of the assets because of the short term nature of the assets.
NOTE 17. PROPERTY AND EQUIPMENT
Land and buildings Motor vehicles Other equipment
CONSOLIDATED
Total
$m $m $m $m
2012
A. COMPOSITION
At cost 216 69 367 652
Accumulated depreciation (67) (30) (278) (375)
Net foreign exchange movements (2) - (1) (3)
Balance at the end of the financial year 147 39 88 274
2012
B. RECONCILIATION OF MOVEMENTS
Balance at the beginning of the financialyear 156 39 89 284
Additions 9 17 32 58
Disposals (3) (8) (6) (17)
Additions through business combination - 2 4 6
Depreciation (15) (11) (32) (58)
Net foreign exchange movements - - 1 1
Balance at the end of the financial year 147 39 88 274
2011
C. COMPOSITION OF COMPARATIVES
Cost 210 67 361 638
Accumulated depreciation (52) (28) (270) (350)
Net foreign exchange movements (2) - (2) (4)
Balance at the end of the financial year 156 39 89 284
D. DEPRECIATION RATES 1.5%-5% 12.5%-33% 6.67%-50%
The net carrying amount of all classes of property and equipment is considered a reasonable approximation of the fair value of theassets in the context of the financial statements. There are no items of property and equipment pledged as security for liabilities. Thedepreciation expense amounts are allocated across various lines in the statement of comprehensive income.
77
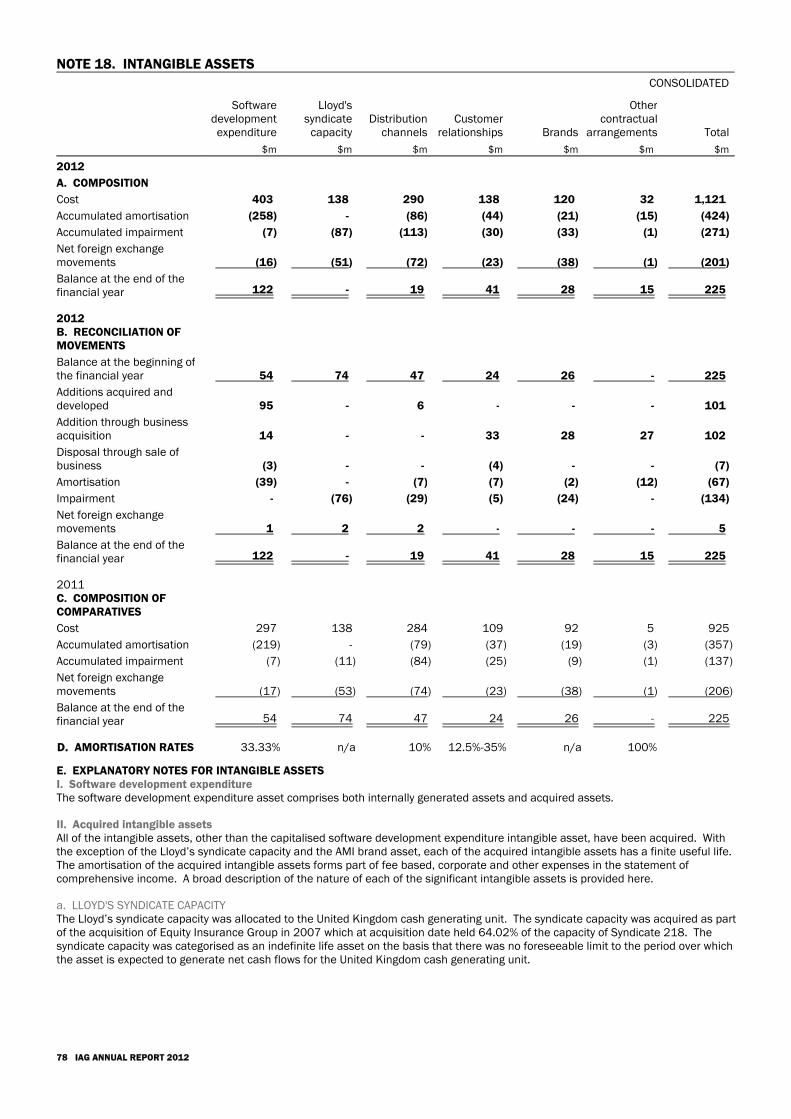
NOTE 18. INTANGIBLE ASSETSCONSOLIDATED
Softwaredevelopmentexpenditure
Lloyd'ssyndicate
capacityDistribution
channelsCustomer
relationships Brands
Othercontractual
arrangements Total
$m $m $m $m $m $m $m
2012
A. COMPOSITION
Cost 403 138 290 138 120 32 1,121
Accumulated amortisation (258) - (86) (44) (21) (15) (424)
Accumulated impairment (7) (87) (113) (30) (33) (1) (271)
Net foreign exchangemovements (16) (51) (72) (23) (38) (1) (201)
Balance at the end of thefinancial year 122 - 19 41 28 15 225
2012B. RECONCILIATION OFMOVEMENTS
Balance at the beginning ofthe financial year 54 74 47 24 26 - 225
Additions acquired anddeveloped 95 - 6 - - - 101
Addition through businessacquisition 14 - - 33 28 27 102
Disposal through sale ofbusiness (3) - - (4) - - (7)
Amortisation (39) - (7) (7) (2) (12) (67)
Impairment - (76) (29) (5) (24) - (134)
Net foreign exchangemovements 1 2 2 - - - 5
Balance at the end of thefinancial year 122 - 19 41 28 15 225
2011C. COMPOSITION OFCOMPARATIVES
Cost 297 138 284 109 92 5 925
Accumulated amortisation (219) - (79) (37) (19) (3) (357)
Accumulated impairment (7) (11) (84) (25) (9) (1) (137)
Net foreign exchangemovements (17) (53) (74) (23) (38) (1) (206)
Balance at the end of thefinancial year 54 74 47 24 26 - 225
D. AMORTISATION RATES 33.33% n/a 10% 12.5%-35% n/a 100%
E. EXPLANATORY NOTES FOR INTANGIBLE ASSETSI. Software development expenditureThe software development expenditure asset comprises both internally generated assets and acquired assets.
II. Acquired intangible assetsAll of the intangible assets, other than the capitalised software development expenditure intangible asset, have been acquired. Withthe exception of the Lloyd’s syndicate capacity and the AMI brand asset, each of the acquired intangible assets has a finite useful life.The amortisation of the acquired intangible assets forms part of fee based, corporate and other expenses in the statement ofcomprehensive income. A broad description of the nature of each of the significant intangible assets is provided here.
a. LLOYD'S SYNDICATE CAPACITYThe Lloyd’s syndicate capacity was allocated to the United Kingdom cash generating unit. The syndicate capacity was acquired as partof the acquisition of Equity Insurance Group in 2007 which at acquisition date held 64.02% of the capacity of Syndicate 218. Thesyndicate capacity was categorised as an indefinite life asset on the basis that there was no foreseeable limit to the period over whichthe asset is expected to generate net cash flows for the United Kingdom cash generating unit.
78 IAG ANNUAL REPORT 2012
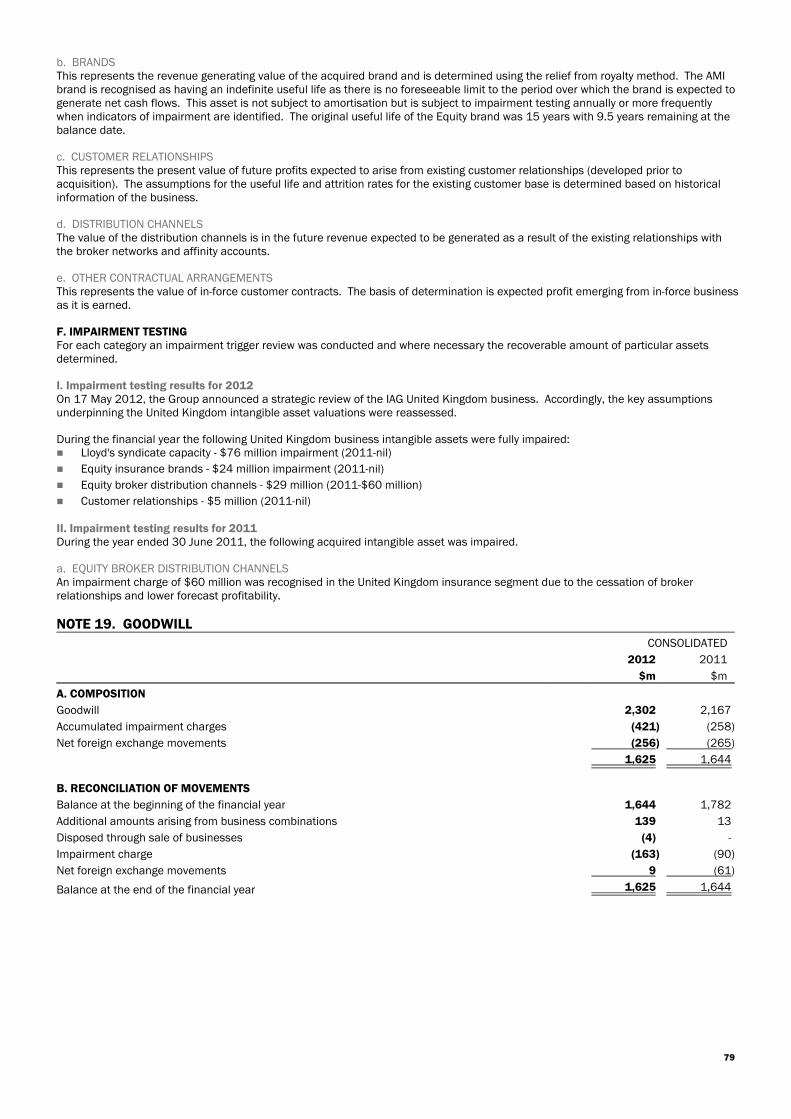
b. BRANDSThis represents the revenue generating value of the acquired brand and is determined using the relief from royalty method. The AMIbrand is recognised as having an indefinite useful life as there is no foreseeable limit to the period over which the brand is expected togenerate net cash flows. This asset is not subject to amortisation but is subject to impairment testing annually or more frequentlywhen indicators of impairment are identified. The original useful life of the Equity brand was 15 years with 9.5 years remaining at thebalance date.
c. CUSTOMER RELATIONSHIPSThis represents the present value of future profits expected to arise from existing customer relationships (developed prior toacquisition). The assumptions for the useful life and attrition rates for the existing customer base is determined based on historicalinformation of the business.
d. DISTRIBUTION CHANNELSThe value of the distribution channels is in the future revenue expected to be generated as a result of the existing relationships withthe broker networks and affinity accounts.
e. OTHER CONTRACTUAL ARRANGEMENTSThis represents the value of in-force customer contracts. The basis of determination is expected profit emerging from in-force businessas it is earned.
F. IMPAIRMENT TESTINGFor each category an impairment trigger review was conducted and where necessary the recoverable amount of particular assetsdetermined.
I. Impairment testing results for 2012On 17 May 2012, the Group announced a strategic review of the IAG United Kingdom business. Accordingly, the key assumptionsunderpinning the United Kingdom intangible asset valuations were reassessed.
During the financial year the following United Kingdom business intangible assets were fully impaired: Lloyd's syndicate capacity - $76 million impairment (2011-nil)
Equity insurance brands - $24 million impairment (2011-nil)
Equity broker distribution channels - $29 million (2011-$60 million)
Customer relationships - $5 million (2011-nil)
II. Impairment testing results for 2011During the year ended 30 June 2011, the following acquired intangible asset was impaired.
a. EQUITY BROKER DISTRIBUTION CHANNELSAn impairment charge of $60 million was recognised in the United Kingdom insurance segment due to the cessation of brokerrelationships and lower forecast profitability.
NOTE 19. GOODWILLCONSOLIDATED
2012 2011
$m $m
A. COMPOSITION
Goodwill 2,302 2,167
Accumulated impairment charges (421) (258)
Net foreign exchange movements (256) (265)
1,625 1,644
B. RECONCILIATION OF MOVEMENTS
Balance at the beginning of the financial year 1,644 1,782
Additional amounts arising from business combinations 139 13
Disposed through sale of businesses (4) -
Impairment charge (163) (90)
Net foreign exchange movements 9 (61)
Balance at the end of the financial year 1,625 1,644
79
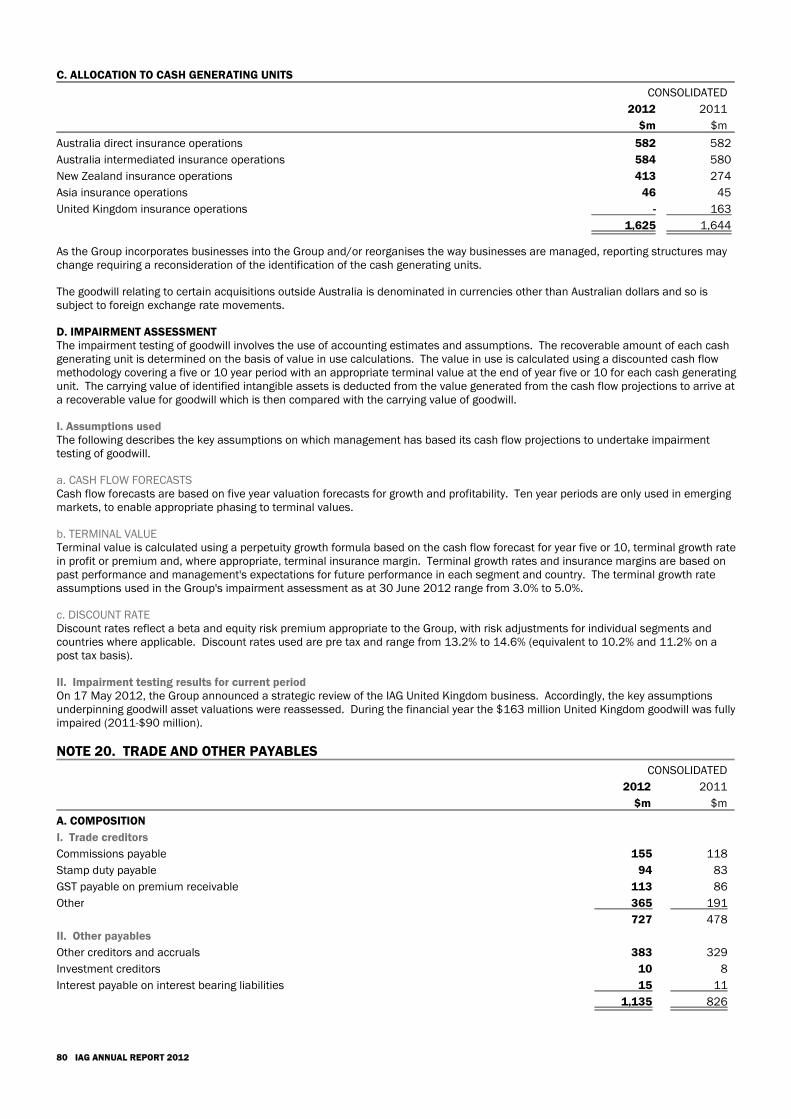
C. ALLOCATION TO CASH GENERATING UNITS
CONSOLIDATED
2012 2011
$m $m
Australia direct insurance operations 582 582
Australia intermediated insurance operations 584 580
New Zealand insurance operations 413 274
Asia insurance operations 46 45
United Kingdom insurance operations - 163
1,625 1,644
As the Group incorporates businesses into the Group and/or reorganises the way businesses are managed, reporting structures maychange requiring a reconsideration of the identification of the cash generating units.
The goodwill relating to certain acquisitions outside Australia is denominated in currencies other than Australian dollars and so issubject to foreign exchange rate movements.
D. IMPAIRMENT ASSESSMENTThe impairment testing of goodwill involves the use of accounting estimates and assumptions. The recoverable amount of each cashgenerating unit is determined on the basis of value in use calculations. The value in use is calculated using a discounted cash flowmethodology covering a five or 10 year period with an appropriate terminal value at the end of year five or 10 for each cash generatingunit. The carrying value of identified intangible assets is deducted from the value generated from the cash flow projections to arrive ata recoverable value for goodwill which is then compared with the carrying value of goodwill.
I. Assumptions usedThe following describes the key assumptions on which management has based its cash flow projections to undertake impairmenttesting of goodwill.
a. CASH FLOW FORECASTSCash flow forecasts are based on five year valuation forecasts for growth and profitability. Ten year periods are only used in emergingmarkets, to enable appropriate phasing to terminal values.
b. TERMINAL VALUETerminal value is calculated using a perpetuity growth formula based on the cash flow forecast for year five or 10, terminal growth ratein profit or premium and, where appropriate, terminal insurance margin. Terminal growth rates and insurance margins are based onpast performance and management's expectations for future performance in each segment and country. The terminal growth rateassumptions used in the Group's impairment assessment as at 30 June 2012 range from 3.0% to 5.0%.
c. DISCOUNT RATEDiscount rates reflect a beta and equity risk premium appropriate to the Group, with risk adjustments for individual segments andcountries where applicable. Discount rates used are pre tax and range from 13.2% to 14.6% (equivalent to 10.2% and 11.2% on apost tax basis).
II. Impairment testing results for current periodOn 17 May 2012, the Group announced a strategic review of the IAG United Kingdom business. Accordingly, the key assumptionsunderpinning goodwill asset valuations were reassessed. During the financial year the $163 million United Kingdom goodwill was fullyimpaired (2011-$90 million).
NOTE 20. TRADE AND OTHER PAYABLESCONSOLIDATED
2012 2011
$m $m
A. COMPOSITION
I. Trade creditors
Commissions payable 155 118
Stamp duty payable 94 83
GST payable on premium receivable 113 86
Other 365 191
727 478
II. Other payables
Other creditors and accruals 383 329
Investment creditors 10 8
Interest payable on interest bearing liabilities 15 11
1,135 826
80 IAG ANNUAL REPORT 2012
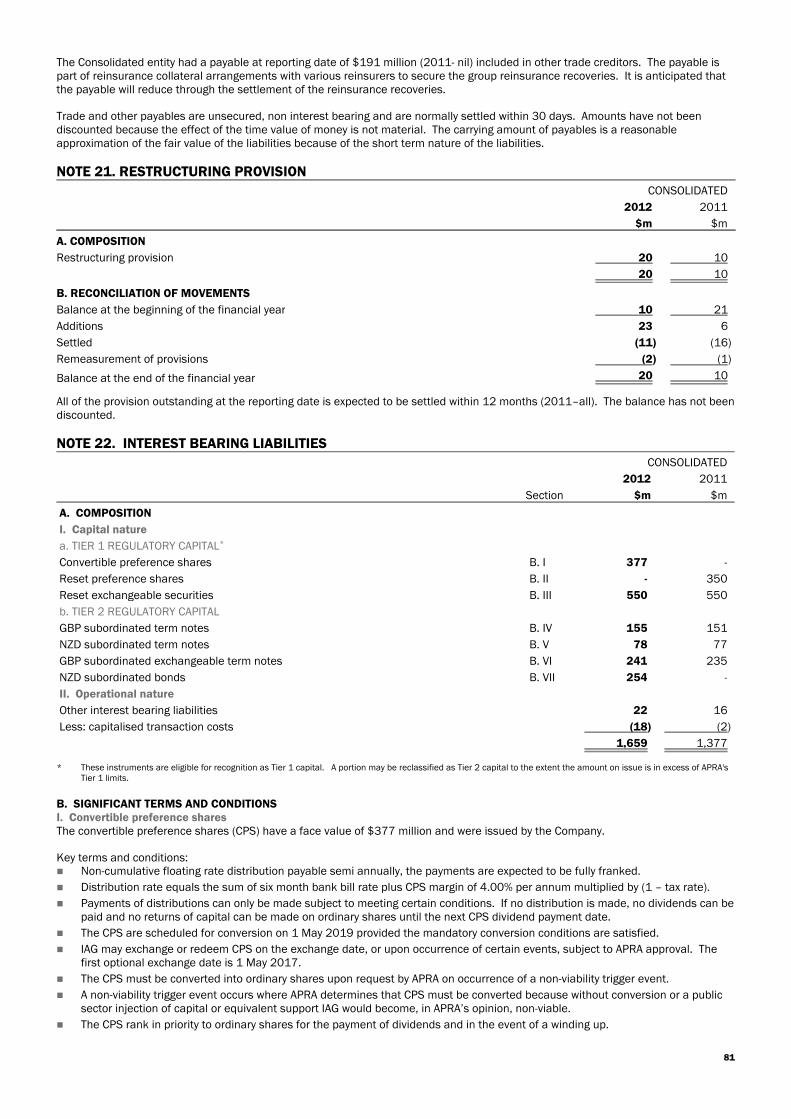
The Consolidated entity had a payable at reporting date of $191 million (2011- nil) included in other trade creditors. The payable ispart of reinsurance collateral arrangements with various reinsurers to secure the group reinsurance recoveries. It is anticipated thatthe payable will reduce through the settlement of the reinsurance recoveries.
Trade and other payables are unsecured, non interest bearing and are normally settled within 30 days. Amounts have not beendiscounted because the effect of the time value of money is not material. The carrying amount of payables is a reasonableapproximation of the fair value of the liabilities because of the short term nature of the liabilities.
NOTE 21. RESTRUCTURING PROVISIONCONSOLIDATED
2012 2011
$m $m
A. COMPOSITION
Restructuring provision 20 10
20 10
B. RECONCILIATION OF MOVEMENTS
Balance at the beginning of the financial year 10 21
Additions 23 6
Settled (11) (16)
Remeasurement of provisions (2) (1)
Balance at the end of the financial year 20 10
All of the provision outstanding at the reporting date is expected to be settled within 12 months (2011–all). The balance has not beendiscounted.
NOTE 22. INTEREST BEARING LIABILITIESCONSOLIDATED
2012 2011
Section $m $m
A. COMPOSITION
I. Capital nature
a. TIER 1 REGULATORY CAPITAL*
Convertible preference shares B. I 377 -
Reset preference shares B. II - 350
Reset exchangeable securities B. III 550 550
b. TIER 2 REGULATORY CAPITAL
GBP subordinated term notes B. IV 155 151
NZD subordinated term notes B. V 78 77
GBP subordinated exchangeable term notes B. VI 241 235
NZD subordinated bonds B. VII 254 -
II. Operational nature
Other interest bearing liabilities 22 16
Less: capitalised transaction costs (18) (2)
1,659 1,377
* These instruments are eligible for recognition as Tier 1 capital. A portion may be reclassified as Tier 2 capital to the extent the amount on issue is in excess of APRA'sTier 1 limits.
B. SIGNIFICANT TERMS AND CONDITIONSI. Convertible preference shares The convertible preference shares (CPS) have a face value of $377 million and were issued by the Company.
Key terms and conditions: Non-cumulative floating rate distribution payable semi annually, the payments are expected to be fully franked.
Distribution rate equals the sum of six month bank bill rate plus CPS margin of 4.00% per annum multiplied by (1 – tax rate).
Payments of distributions can only be made subject to meeting certain conditions. If no distribution is made, no dividends can bepaid and no returns of capital can be made on ordinary shares until the next CPS dividend payment date.
The CPS are scheduled for conversion on 1 May 2019 provided the mandatory conversion conditions are satisfied.
IAG may exchange or redeem CPS on the exchange date, or upon occurrence of certain events, subject to APRA approval. Thefirst optional exchange date is 1 May 2017.
The CPS must be converted into ordinary shares upon request by APRA on occurrence of a non-viability trigger event.
A non-viability trigger event occurs where APRA determines that CPS must be converted because without conversion or a publicsector injection of capital or equivalent support IAG would become, in APRA’s opinion, non-viable.
The CPS rank in priority to ordinary shares for the payment of dividends and in the event of a winding up.
81
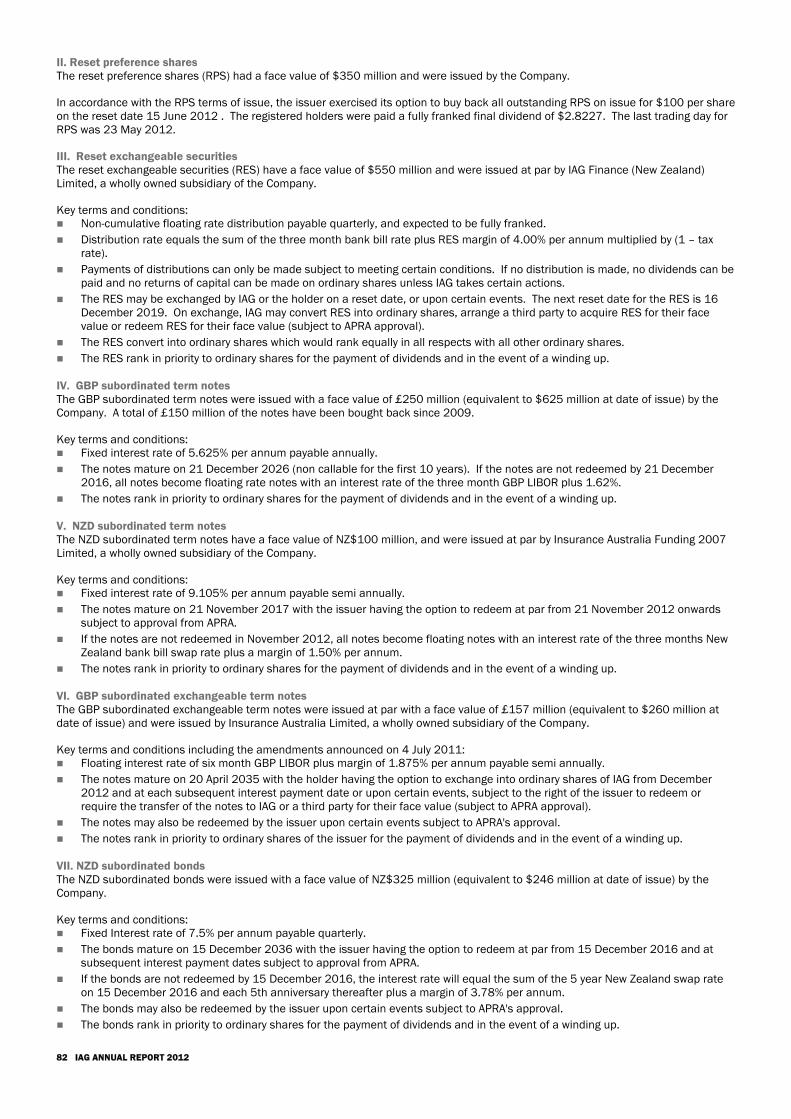
II. Reset preference sharesThe reset preference shares (RPS) had a face value of $350 million and were issued by the Company.
In accordance with the RPS terms of issue, the issuer exercised its option to buy back all outstanding RPS on issue for $100 per shareon the reset date 15 June 2012 . The registered holders were paid a fully franked final dividend of $2.8227. The last trading day forRPS was 23 May 2012.
III. Reset exchangeable securitiesThe reset exchangeable securities (RES) have a face value of $550 million and were issued at par by IAG Finance (New Zealand)Limited, a wholly owned subsidiary of the Company.
Key terms and conditions: Non-cumulative floating rate distribution payable quarterly, and expected to be fully franked.
Distribution rate equals the sum of the three month bank bill rate plus RES margin of 4.00% per annum multiplied by (1 – taxrate).
Payments of distributions can only be made subject to meeting certain conditions. If no distribution is made, no dividends can bepaid and no returns of capital can be made on ordinary shares unless IAG takes certain actions.
The RES may be exchanged by IAG or the holder on a reset date, or upon certain events. The next reset date for the RES is 16December 2019. On exchange, IAG may convert RES into ordinary shares, arrange a third party to acquire RES for their facevalue or redeem RES for their face value (subject to APRA approval).
The RES convert into ordinary shares which would rank equally in all respects with all other ordinary shares.
The RES rank in priority to ordinary shares for the payment of dividends and in the event of a winding up.
IV. GBP subordinated term notesThe GBP subordinated term notes were issued with a face value of £250 million (equivalent to $625 million at date of issue) by theCompany. A total of £150 million of the notes have been bought back since 2009.
Key terms and conditions: Fixed interest rate of 5.625% per annum payable annually.
The notes mature on 21 December 2026 (non callable for the first 10 years). If the notes are not redeemed by 21 December2016, all notes become floating rate notes with an interest rate of the three month GBP LIBOR plus 1.62%.
The notes rank in priority to ordinary shares for the payment of dividends and in the event of a winding up.
V. NZD subordinated term notesThe NZD subordinated term notes have a face value of NZ$100 million, and were issued at par by Insurance Australia Funding 2007Limited, a wholly owned subsidiary of the Company.
Key terms and conditions: Fixed interest rate of 9.105% per annum payable semi annually.
The notes mature on 21 November 2017 with the issuer having the option to redeem at par from 21 November 2012 onwardssubject to approval from APRA.
If the notes are not redeemed in November 2012, all notes become floating notes with an interest rate of the three months NewZealand bank bill swap rate plus a margin of 1.50% per annum.
The notes rank in priority to ordinary shares for the payment of dividends and in the event of a winding up.
VI. GBP subordinated exchangeable term notes The GBP subordinated exchangeable term notes were issued at par with a face value of £157 million (equivalent to $260 million atdate of issue) and were issued by Insurance Australia Limited, a wholly owned subsidiary of the Company.
Key terms and conditions including the amendments announced on 4 July 2011: Floating interest rate of six month GBP LIBOR plus margin of 1.875% per annum payable semi annually.
The notes mature on 20 April 2035 with the holder having the option to exchange into ordinary shares of IAG from December2012 and at each subsequent interest payment date or upon certain events, subject to the right of the issuer to redeem orrequire the transfer of the notes to IAG or a third party for their face value (subject to APRA approval).
The notes may also be redeemed by the issuer upon certain events subject to APRA's approval.
The notes rank in priority to ordinary shares of the issuer for the payment of dividends and in the event of a winding up.
VII. NZD subordinated bondsThe NZD subordinated bonds were issued with a face value of NZ$325 million (equivalent to $246 million at date of issue) by theCompany.
Key terms and conditions: Fixed Interest rate of 7.5% per annum payable quarterly.
The bonds mature on 15 December 2036 with the issuer having the option to redeem at par from 15 December 2016 and atsubsequent interest payment dates subject to approval from APRA.
If the bonds are not redeemed by 15 December 2016, the interest rate will equal the sum of the 5 year New Zealand swap rateon 15 December 2016 and each 5th anniversary thereafter plus a margin of 3.78% per annum.
The bonds may also be redeemed by the issuer upon certain events subject to APRA's approval.
The bonds rank in priority to ordinary shares for the payment of dividends and in the event of a winding up.
82 IAG ANNUAL REPORT 2012
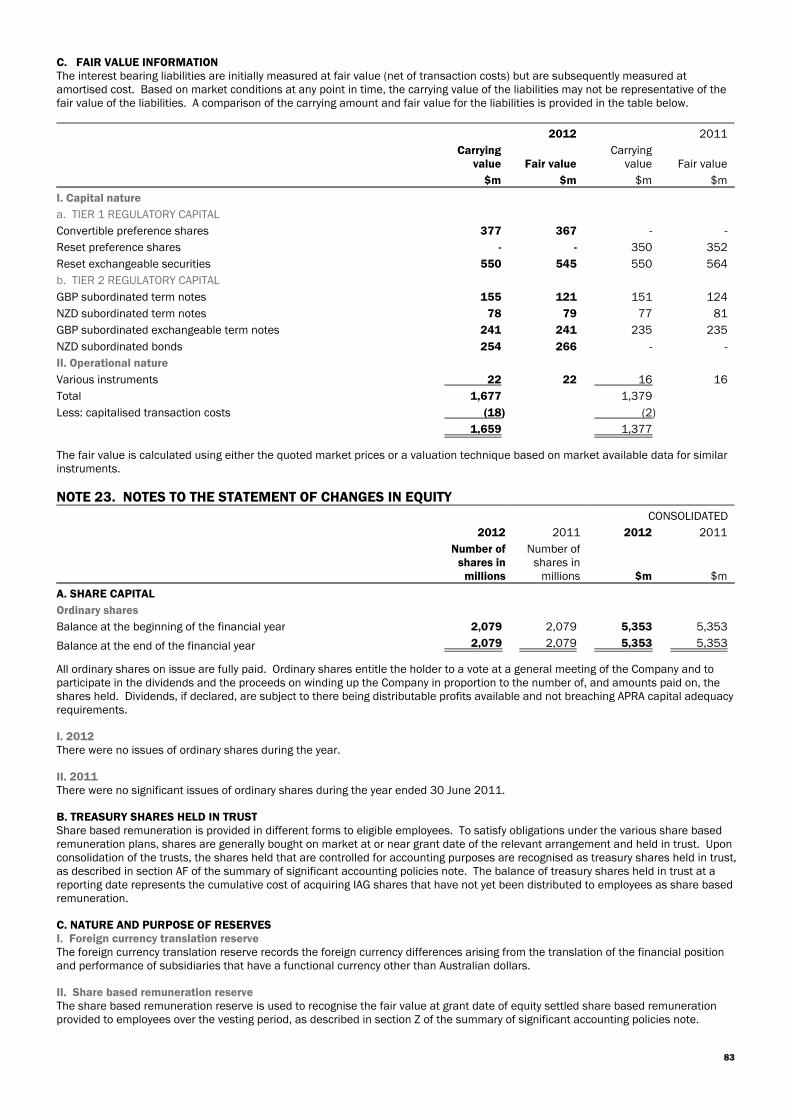
C. FAIR VALUE INFORMATIONThe interest bearing liabilities are initially measured at fair value (net of transaction costs) but are subsequently measured atamortised cost. Based on market conditions at any point in time, the carrying value of the liabilities may not be representative of thefair value of the liabilities. A comparison of the carrying amount and fair value for the liabilities is provided in the table below.
2012 2011
Carryingvalue Fair value
Carryingvalue Fair value
$m $m $m $m
I. Capital nature
a. TIER 1 REGULATORY CAPITAL
Convertible preference shares 377 367 - -
Reset preference shares - - 350 352
Reset exchangeable securities 550 545 550 564
b. TIER 2 REGULATORY CAPITAL
GBP subordinated term notes 155 121 151 124
NZD subordinated term notes 78 79 77 81
GBP subordinated exchangeable term notes 241 241 235 235
NZD subordinated bonds 254 266 - -
II. Operational nature
Various instruments 22 22 16 16
Total 1,677 1,379
Less: capitalised transaction costs (18) (2)
1,659 1,377
The fair value is calculated using either the quoted market prices or a valuation technique based on market available data for similarinstruments.
NOTE 23. NOTES TO THE STATEMENT OF CHANGES IN EQUITYCONSOLIDATED
2012 2011 2012 2011
Number ofshares in
millions
Number ofshares in
millions $m $m
A. SHARE CAPITAL
Ordinary shares
Balance at the beginning of the financial year 2,079 2,079 5,353 5,353
Balance at the end of the financial year 2,079 2,079 5,353 5,353
All ordinary shares on issue are fully paid. Ordinary shares entitle the holder to a vote at a general meeting of the Company and toparticipate in the dividends and the proceeds on winding up the Company in proportion to the number of, and amounts paid on, theshares held. Dividends, if declared, are subject to there being distributable profits available and not breaching APRA capital adequacyrequirements.
I. 2012There were no issues of ordinary shares during the year.
II. 2011There were no significant issues of ordinary shares during the year ended 30 June 2011.
B. TREASURY SHARES HELD IN TRUSTShare based remuneration is provided in different forms to eligible employees. To satisfy obligations under the various share basedremuneration plans, shares are generally bought on market at or near grant date of the relevant arrangement and held in trust. Uponconsolidation of the trusts, the shares held that are controlled for accounting purposes are recognised as treasury shares held in trust,as described in section AF of the summary of significant accounting policies note. The balance of treasury shares held in trust at areporting date represents the cumulative cost of acquiring IAG shares that have not yet been distributed to employees as share basedremuneration.
C. NATURE AND PURPOSE OF RESERVESI. Foreign currency translation reserveThe foreign currency translation reserve records the foreign currency differences arising from the translation of the financial positionand performance of subsidiaries that have a functional currency other than Australian dollars.
II. Share based remuneration reserveThe share based remuneration reserve is used to recognise the fair value at grant date of equity settled share based remunerationprovided to employees over the vesting period, as described in section Z of the summary of significant accounting policies note.
83
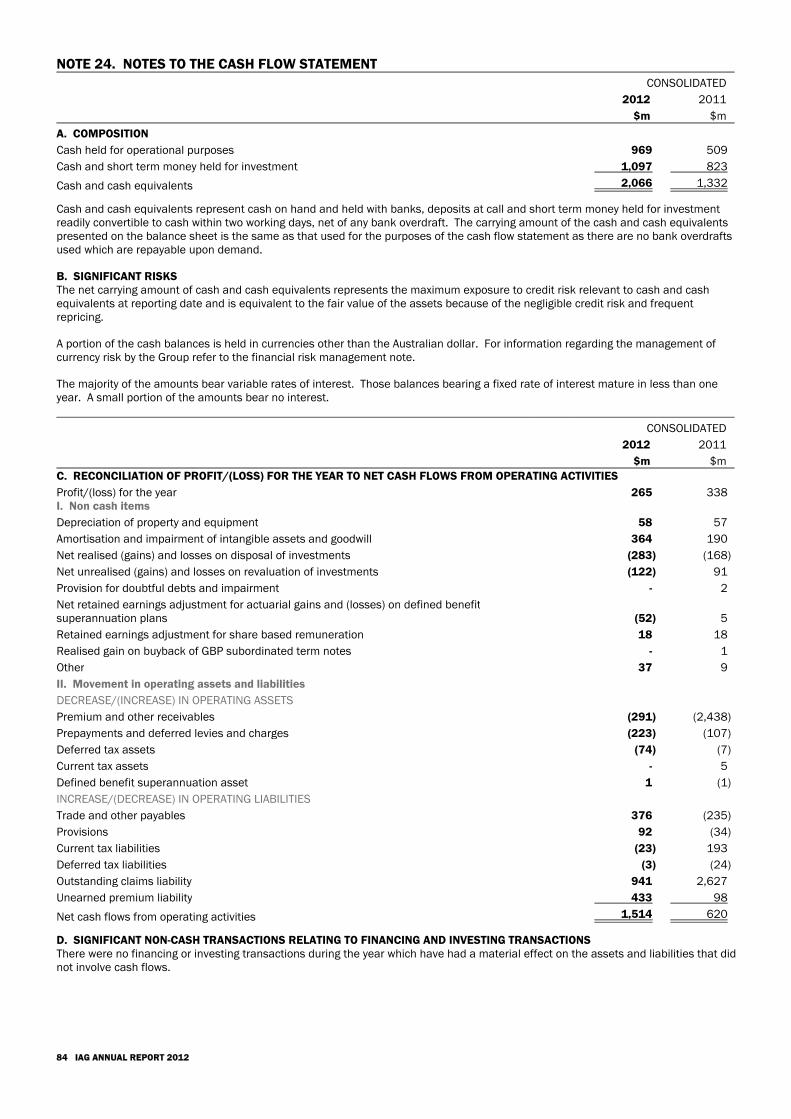
NOTE 24. NOTES TO THE CASH FLOW STATEMENTCONSOLIDATED
2012 2011
$m $m
A. COMPOSITION
Cash held for operational purposes 969 509
Cash and short term money held for investment 1,097 823
Cash and cash equivalents 2,066 1,332
Cash and cash equivalents represent cash on hand and held with banks, deposits at call and short term money held for investmentreadily convertible to cash within two working days, net of any bank overdraft. The carrying amount of the cash and cash equivalentspresented on the balance sheet is the same as that used for the purposes of the cash flow statement as there are no bank overdraftsused which are repayable upon demand.
B. SIGNIFICANT RISKSThe net carrying amount of cash and cash equivalents represents the maximum exposure to credit risk relevant to cash and cashequivalents at reporting date and is equivalent to the fair value of the assets because of the negligible credit risk and frequentrepricing.
A portion of the cash balances is held in currencies other than the Australian dollar. For information regarding the management ofcurrency risk by the Group refer to the financial risk management note.
The majority of the amounts bear variable rates of interest. Those balances bearing a fixed rate of interest mature in less than oneyear. A small portion of the amounts bear no interest.
CONSOLIDATED
2012 2011
$m $mC. RECONCILIATION OF PROFIT/(LOSS) FOR THE YEAR TO NET CASH FLOWS FROM OPERATING ACTIVITIES
Profit/(loss) for the year 265 338I. Non cash items
Depreciation of property and equipment 58 57
Amortisation and impairment of intangible assets and goodwill 364 190
Net realised (gains) and losses on disposal of investments (283) (168)
Net unrealised (gains) and losses on revaluation of investments (122) 91
Provision for doubtful debts and impairment - 2
Net retained earnings adjustment for actuarial gains and (losses) on defined benefitsuperannuation plans (52) 5
Retained earnings adjustment for share based remuneration 18 18
Realised gain on buyback of GBP subordinated term notes - 1
Other 37 9
II. Movement in operating assets and liabilities
DECREASE/(INCREASE) IN OPERATING ASSETS
Premium and other receivables (291) (2,438)
Prepayments and deferred levies and charges (223) (107)
Deferred tax assets (74) (7)
Current tax assets - 5
Defined benefit superannuation asset 1 (1)
INCREASE/(DECREASE) IN OPERATING LIABILITIES
Trade and other payables 376 (235)
Provisions 92 (34)
Current tax liabilities (23) 193
Deferred tax liabilities (3) (24)
Outstanding claims liability 941 2,627
Unearned premium liability 433 98
Net cash flows from operating activities 1,514 620
D. SIGNIFICANT NON-CASH TRANSACTIONS RELATING TO FINANCING AND INVESTING TRANSACTIONSThere were no financing or investing transactions during the year which have had a material effect on the assets and liabilities that didnot involve cash flows.
84 IAG ANNUAL REPORT 2012
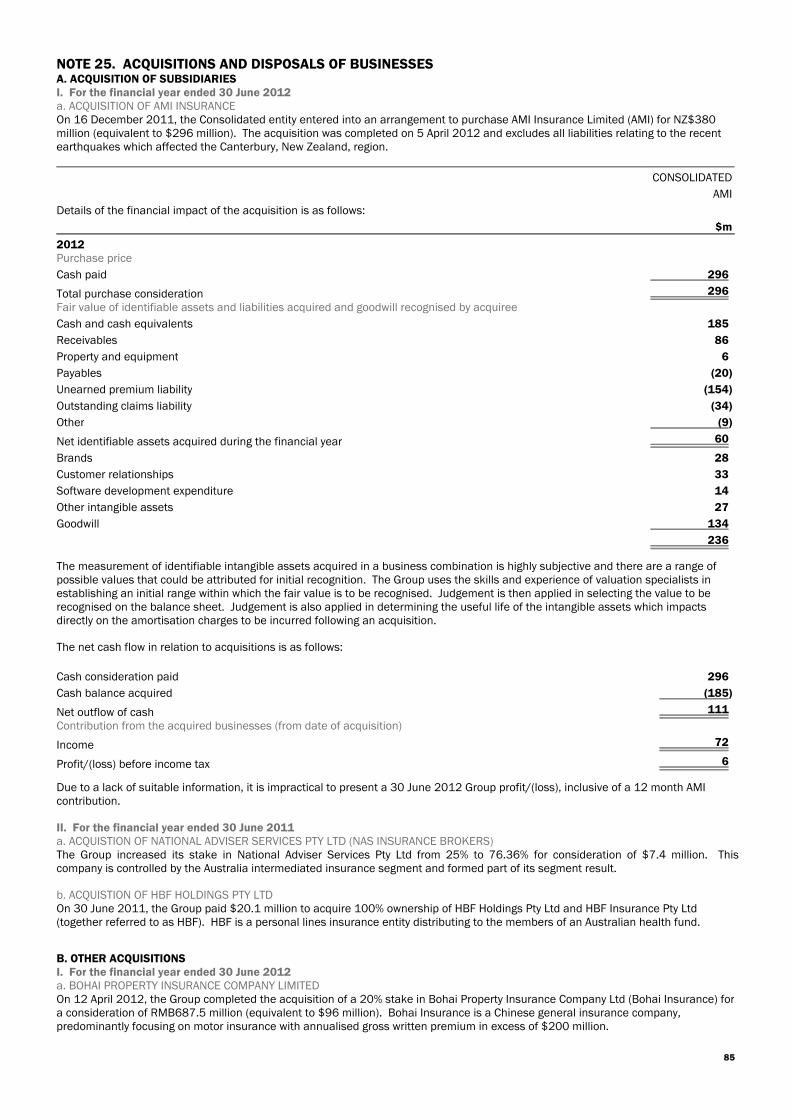
NOTE 25. ACQUISITIONS AND DISPOSALS OF BUSINESSESA. ACQUISITION OF SUBSIDIARIESI. For the financial year ended 30 June 2012a. ACQUISITION OF AMI INSURANCEOn 16 December 2011, the Consolidated entity entered into an arrangement to purchase AMI Insurance Limited (AMI) for NZ$380million (equivalent to $296 million). The acquisition was completed on 5 April 2012 and excludes all liabilities relating to the recentearthquakes which affected the Canterbury, New Zealand, region.
CONSOLIDATED
AMI
Details of the financial impact of the acquisition is as follows:
$m
2012Purchase price
Cash paid 296
Total purchase consideration 296
Fair value of identifiable assets and liabilities acquired and goodwill recognised by acquiree
Cash and cash equivalents 185
Receivables 86
Property and equipment 6
Payables (20)
Unearned premium liability (154)
Outstanding claims liability (34)
Other (9)
Net identifiable assets acquired during the financial year 60
Brands 28
Customer relationships 33
Software development expenditure 14
Other intangible assets 27
Goodwill 134
236
The measurement of identifiable intangible assets acquired in a business combination is highly subjective and there are a range ofpossible values that could be attributed for initial recognition. The Group uses the skills and experience of valuation specialists inestablishing an initial range within which the fair value is to be recognised. Judgement is then applied in selecting the value to berecognised on the balance sheet. Judgement is also applied in determining the useful life of the intangible assets which impactsdirectly on the amortisation charges to be incurred following an acquisition.
The net cash flow in relation to acquisitions is as follows:
Cash consideration paid 296
Cash balance acquired (185)
Net outflow of cash 111
Contribution from the acquired businesses (from date of acquisition)
Income 72
Profit/(loss) before income tax 6
Due to a lack of suitable information, it is impractical to present a 30 June 2012 Group profit/(loss), inclusive of a 12 month AMIcontribution.
II. For the financial year ended 30 June 2011a. ACQUISTION OF NATIONAL ADVISER SERVICES PTY LTD (NAS INSURANCE BROKERS)The Group increased its stake in National Adviser Services Pty Ltd from 25% to 76.36% for consideration of $7.4 million. Thiscompany is controlled by the Australia intermediated insurance segment and formed part of its segment result.
b. ACQUISTION OF HBF HOLDINGS PTY LTDOn 30 June 2011, the Group paid $20.1 million to acquire 100% ownership of HBF Holdings Pty Ltd and HBF Insurance Pty Ltd(together referred to as HBF). HBF is a personal lines insurance entity distributing to the members of an Australian health fund.
B. OTHER ACQUISITIONSI. For the financial year ended 30 June 2012a. BOHAI PROPERTY INSURANCE COMPANY LIMITEDOn 12 April 2012, the Group completed the acquisition of a 20% stake in Bohai Property Insurance Company Ltd (Bohai Insurance) fora consideration of RMB687.5 million (equivalent to $96 million). Bohai Insurance is a Chinese general insurance company,predominantly focusing on motor insurance with annualised gross written premium in excess of $200 million.
85
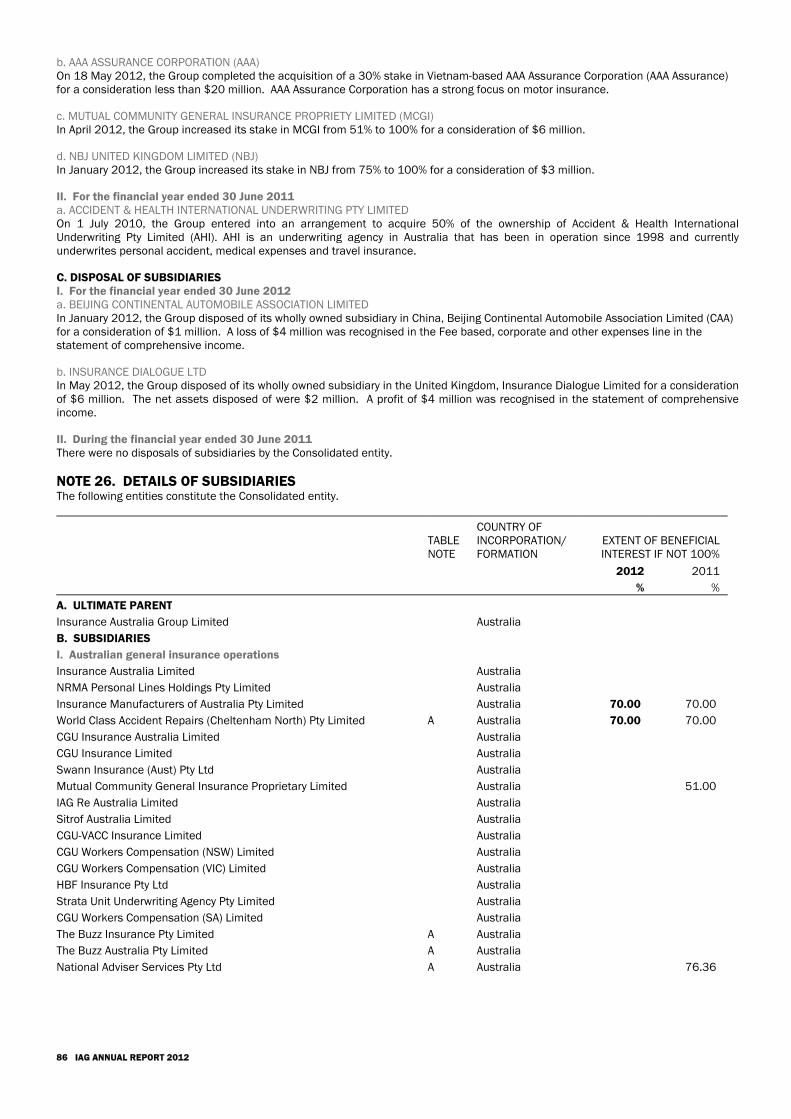
b. AAA ASSURANCE CORPORATION (AAA)On 18 May 2012, the Group completed the acquisition of a 30% stake in Vietnam-based AAA Assurance Corporation (AAA Assurance)for a consideration less than $20 million. AAA Assurance Corporation has a strong focus on motor insurance.
c. MUTUAL COMMUNITY GENERAL INSURANCE PROPRIETY LIMITED (MCGI)In April 2012, the Group increased its stake in MCGI from 51% to 100% for a consideration of $6 million.
d. NBJ UNITED KINGDOM LIMITED (NBJ)In January 2012, the Group increased its stake in NBJ from 75% to 100% for a consideration of $3 million.
II. For the financial year ended 30 June 2011a. ACCIDENT & HEALTH INTERNATIONAL UNDERWRITING PTY LIMITEDOn 1 July 2010, the Group entered into an arrangement to acquire 50% of the ownership of Accident & Health InternationalUnderwriting Pty Limited (AHI). AHI is an underwriting agency in Australia that has been in operation since 1998 and currentlyunderwrites personal accident, medical expenses and travel insurance.
C. DISPOSAL OF SUBSIDIARIESI. For the financial year ended 30 June 2012a. BEIJING CONTINENTAL AUTOMOBILE ASSOCIATION LIMITEDIn January 2012, the Group disposed of its wholly owned subsidiary in China, Beijing Continental Automobile Association Limited (CAA)for a consideration of $1 million. A loss of $4 million was recognised in the Fee based, corporate and other expenses line in thestatement of comprehensive income.
b. INSURANCE DIALOGUE LTDIn May 2012, the Group disposed of its wholly owned subsidiary in the United Kingdom, Insurance Dialogue Limited for a considerationof $6 million. The net assets disposed of were $2 million. A profit of $4 million was recognised in the statement of comprehensiveincome.
II. During the financial year ended 30 June 2011 There were no disposals of subsidiaries by the Consolidated entity.
NOTE 26. DETAILS OF SUBSIDIARIESThe following entities constitute the Consolidated entity.
TABLENOTE
COUNTRY OFINCORPORATION/FORMATION
EXTENT OF BENEFICIALINTEREST IF NOT 100%
2012 2011
% %
A. ULTIMATE PARENT
Insurance Australia Group Limited Australia
B. SUBSIDIARIES
I. Australian general insurance operations
Insurance Australia Limited Australia
NRMA Personal Lines Holdings Pty Limited Australia
Insurance Manufacturers of Australia Pty Limited Australia 70.00 70.00
World Class Accident Repairs (Cheltenham North) Pty Limited A Australia 70.00 70.00
CGU Insurance Australia Limited Australia
CGU Insurance Limited Australia
Swann Insurance (Aust) Pty Ltd Australia
Mutual Community General Insurance Proprietary Limited Australia 51.00
IAG Re Australia Limited Australia
Sitrof Australia Limited Australia
CGU-VACC Insurance Limited Australia
CGU Workers Compensation (NSW) Limited Australia
CGU Workers Compensation (VIC) Limited Australia
HBF Insurance Pty Ltd Australia
Strata Unit Underwriting Agency Pty Limited Australia
CGU Workers Compensation (SA) Limited Australia
The Buzz Insurance Pty Limited A Australia
The Buzz Australia Pty Limited A Australia
National Adviser Services Pty Ltd A Australia 76.36
86 IAG ANNUAL REPORT 2012
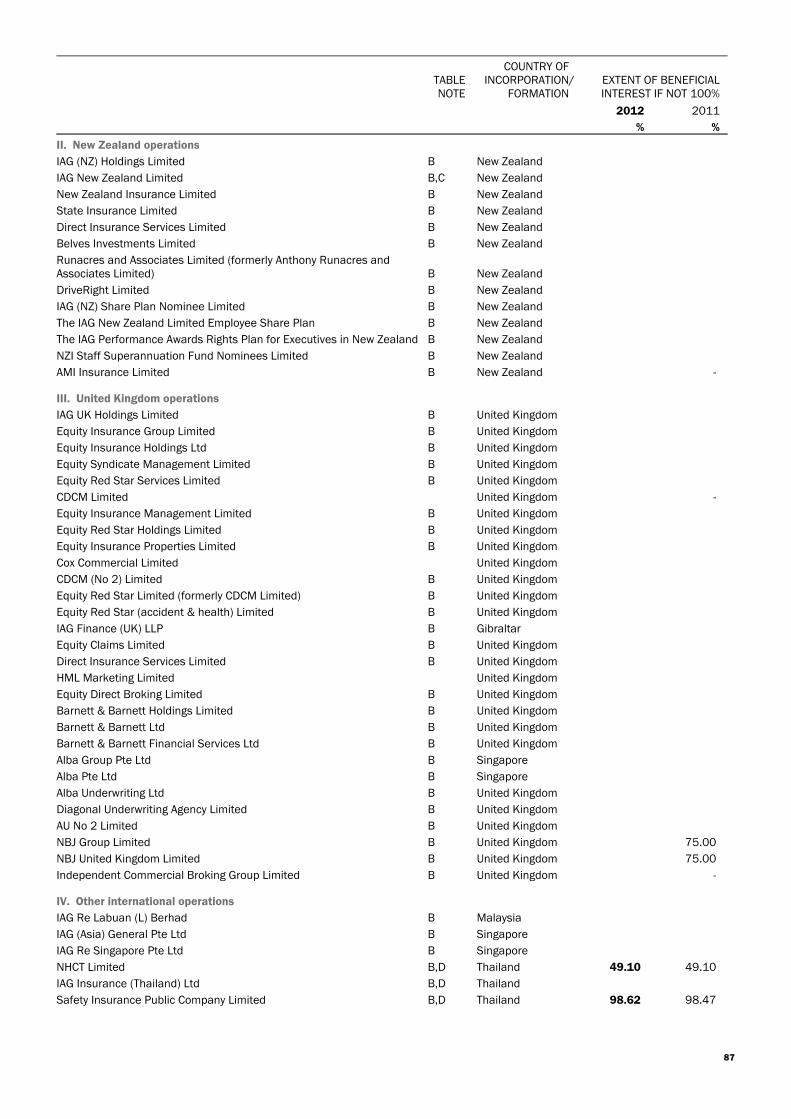
TABLENOTE
COUNTRY OFINCORPORATION/
FORMATIONEXTENT OF BENEFICIALINTEREST IF NOT 100%
2012 2011
% %
II. New Zealand operations
IAG (NZ) Holdings Limited B New Zealand
IAG New Zealand Limited B,C New Zealand
New Zealand Insurance Limited B New Zealand
State Insurance Limited B New Zealand
Direct Insurance Services Limited B New Zealand
Belves Investments Limited B New Zealand
Runacres and Associates Limited (formerly Anthony Runacres andAssociates Limited) B New Zealand
DriveRight Limited B New Zealand
IAG (NZ) Share Plan Nominee Limited B New Zealand
The IAG New Zealand Limited Employee Share Plan B New Zealand
The IAG Performance Awards Rights Plan for Executives in New Zealand B New Zealand
NZI Staff Superannuation Fund Nominees Limited B New Zealand
AMI Insurance Limited B New Zealand -
III. United Kingdom operations
IAG UK Holdings Limited B United Kingdom
Equity Insurance Group Limited B United Kingdom
Equity Insurance Holdings Ltd B United Kingdom
Equity Syndicate Management Limited B United Kingdom
Equity Red Star Services Limited B United Kingdom
CDCM Limited United Kingdom -
Equity Insurance Management Limited B United Kingdom
Equity Red Star Holdings Limited B United Kingdom
Equity Insurance Properties Limited B United Kingdom
Cox Commercial Limited United Kingdom
CDCM (No 2) Limited B United Kingdom
Equity Red Star Limited (formerly CDCM Limited) B United Kingdom
Equity Red Star (accident & health) Limited B United Kingdom
IAG Finance (UK) LLP B Gibraltar
Equity Claims Limited B United Kingdom
Direct Insurance Services Limited B United Kingdom
HML Marketing Limited United Kingdom
Equity Direct Broking Limited B United Kingdom
Barnett & Barnett Holdings Limited B United Kingdom
Barnett & Barnett Ltd B United Kingdom
Barnett & Barnett Financial Services Ltd B United Kingdom
Alba Group Pte Ltd B Singapore
Alba Pte Ltd B Singapore
Alba Underwriting Ltd B United Kingdom
Diagonal Underwriting Agency Limited B United Kingdom
AU No 2 Limited B United Kingdom
NBJ Group Limited B United Kingdom 75.00
NBJ United Kingdom Limited B United Kingdom 75.00
Independent Commercial Broking Group Limited B United Kingdom -
IV. Other international operations
IAG Re Labuan (L) Berhad B Malaysia
IAG (Asia) General Pte Ltd B Singapore
IAG Re Singapore Pte Ltd B Singapore
NHCT Limited B,D Thailand 49.10 49.10
IAG Insurance (Thailand) Ltd B,D Thailand
Safety Insurance Public Company Limited B,D Thailand 98.62 98.47
87
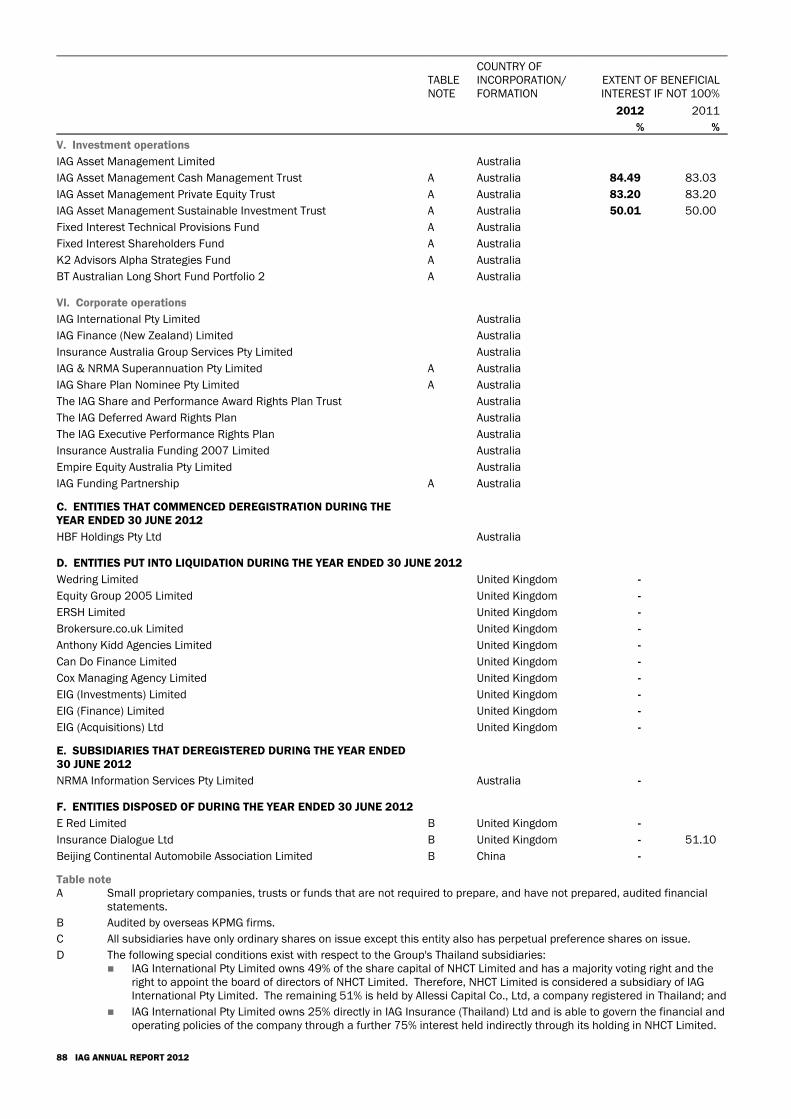
TABLENOTE
COUNTRY OFINCORPORATION/FORMATION
EXTENT OF BENEFICIALINTEREST IF NOT 100%
2012 2011
% %
V. Investment operations
IAG Asset Management Limited Australia
IAG Asset Management Cash Management Trust A Australia 84.49 83.03
IAG Asset Management Private Equity Trust A Australia 83.20 83.20
IAG Asset Management Sustainable Investment Trust A Australia 50.01 50.00
Fixed Interest Technical Provisions Fund A Australia
Fixed Interest Shareholders Fund A Australia
K2 Advisors Alpha Strategies Fund A Australia
BT Australian Long Short Fund Portfolio 2 A Australia
VI. Corporate operations
IAG International Pty Limited Australia
IAG Finance (New Zealand) Limited Australia
Insurance Australia Group Services Pty Limited Australia
IAG & NRMA Superannuation Pty Limited A Australia
IAG Share Plan Nominee Pty Limited A Australia
The IAG Share and Performance Award Rights Plan Trust Australia
The IAG Deferred Award Rights Plan Australia
The IAG Executive Performance Rights Plan Australia
Insurance Australia Funding 2007 Limited Australia
Empire Equity Australia Pty Limited Australia
IAG Funding Partnership A Australia
C. ENTITIES THAT COMMENCED DEREGISTRATION DURING THEYEAR ENDED 30 JUNE 2012
HBF Holdings Pty Ltd Australia
D. ENTITIES PUT INTO LIQUIDATION DURING THE YEAR ENDED 30 JUNE 2012
Wedring Limited United Kingdom -
Equity Group 2005 Limited United Kingdom -
ERSH Limited United Kingdom -
Brokersure.co.uk Limited United Kingdom -
Anthony Kidd Agencies Limited United Kingdom -
Can Do Finance Limited United Kingdom -
Cox Managing Agency Limited United Kingdom -
EIG (Investments) Limited United Kingdom -
EIG (Finance) Limited United Kingdom -
EIG (Acquisitions) Ltd United Kingdom -
E. SUBSIDIARIES THAT DEREGISTERED DURING THE YEAR ENDED30 JUNE 2012
NRMA Information Services Pty Limited Australia -
F. ENTITIES DISPOSED OF DURING THE YEAR ENDED 30 JUNE 2012
E Red Limited B United Kingdom -
Insurance Dialogue Ltd B United Kingdom - 51.10
Beijing Continental Automobile Association Limited B China -
Table noteA Small proprietary companies, trusts or funds that are not required to prepare, and have not prepared, audited financial
statements.
B Audited by overseas KPMG firms.
C All subsidiaries have only ordinary shares on issue except this entity also has perpetual preference shares on issue.
D The following special conditions exist with respect to the Group's Thailand subsidiaries: IAG International Pty Limited owns 49% of the share capital of NHCT Limited and has a majority voting right and the
right to appoint the board of directors of NHCT Limited. Therefore, NHCT Limited is considered a subsidiary of IAGInternational Pty Limited. The remaining 51% is held by Allessi Capital Co., Ltd, a company registered in Thailand; and
IAG International Pty Limited owns 25% directly in IAG Insurance (Thailand) Ltd and is able to govern the financial andoperating policies of the company through a further 75% interest held indirectly through its holding in NHCT Limited.
88 IAG ANNUAL REPORT 2012
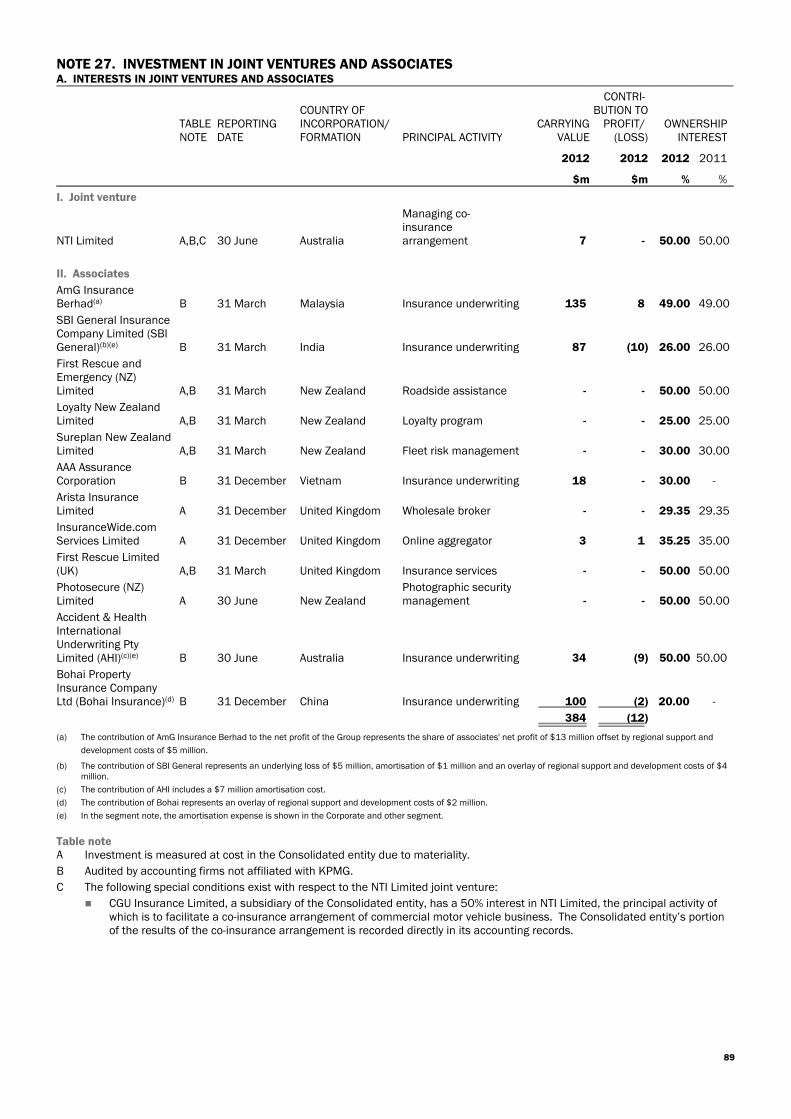
NOTE 27. INVESTMENT IN JOINT VENTURES AND ASSOCIATESA. INTERESTS IN JOINT VENTURES AND ASSOCIATES
TABLENOTE
REPORTINGDATE
COUNTRY OFINCORPORATION/FORMATION PRINCIPAL ACTIVITY
CARRYINGVALUE
CONTRI-BUTION TO
PROFIT/ (LOSS)
OWNERSHIPINTEREST
2012 2012 2012 2011
$m $m % %
I. Joint venture
NTI Limited A,B,C 30 June Australia
Managing co-insurancearrangement 7 - 50.00 50.00
II. Associates
AmG InsuranceBerhad(a) B 31 March Malaysia Insurance underwriting 135 8 49.00 49.00
SBI General InsuranceCompany Limited (SBIGeneral)(b)(e) B 31 March India Insurance underwriting 87 (10) 26.00 26.00
First Rescue andEmergency (NZ)Limited A,B 31 March New Zealand Roadside assistance - - 50.00 50.00
Loyalty New ZealandLimited A,B 31 March New Zealand Loyalty program - - 25.00 25.00
Sureplan New ZealandLimited A,B 31 March New Zealand Fleet risk management - - 30.00 30.00
AAA AssuranceCorporation B 31 December Vietnam Insurance underwriting 18 - 30.00 -
Arista InsuranceLimited A 31 December United Kingdom Wholesale broker - - 29.35 29.35
InsuranceWide.comServices Limited A 31 December United Kingdom Online aggregator 3 1 35.25 35.00
First Rescue Limited(UK) A,B 31 March United Kingdom Insurance services - - 50.00 50.00
Photosecure (NZ)Limited A 30 June New Zealand
Photographic securitymanagement - - 50.00 50.00
Accident & HealthInternationalUnderwriting PtyLimited (AHI)(c)(e) B 30 June Australia Insurance underwriting 34 (9) 50.00 50.00
Bohai PropertyInsurance CompanyLtd (Bohai Insurance)(d) B 31 December China Insurance underwriting 100 (2) 20.00 -
384 (12)
(a) The contribution of AmG Insurance Berhad to the net profit of the Group represents the share of associates' net profit of $13 million offset by regional support and
development costs of $5 million.
(b) The contribution of SBI General represents an underlying loss of $5 million, amortisation of $1 million and an overlay of regional support and development costs of $4million.
(c) The contribution of AHI includes a $7 million amortisation cost.
(d) The contribution of Bohai represents an overlay of regional support and development costs of $2 million.
(e) In the segment note, the amortisation expense is shown in the Corporate and other segment.
Table noteA Investment is measured at cost in the Consolidated entity due to materiality.
B Audited by accounting firms not affiliated with KPMG.
C The following special conditions exist with respect to the NTI Limited joint venture:
CGU Insurance Limited, a subsidiary of the Consolidated entity, has a 50% interest in NTI Limited, the principal activity ofwhich is to facilitate a co-insurance arrangement of commercial motor vehicle business. The Consolidated entity’s portionof the results of the co-insurance arrangement is recorded directly in its accounting records.
89
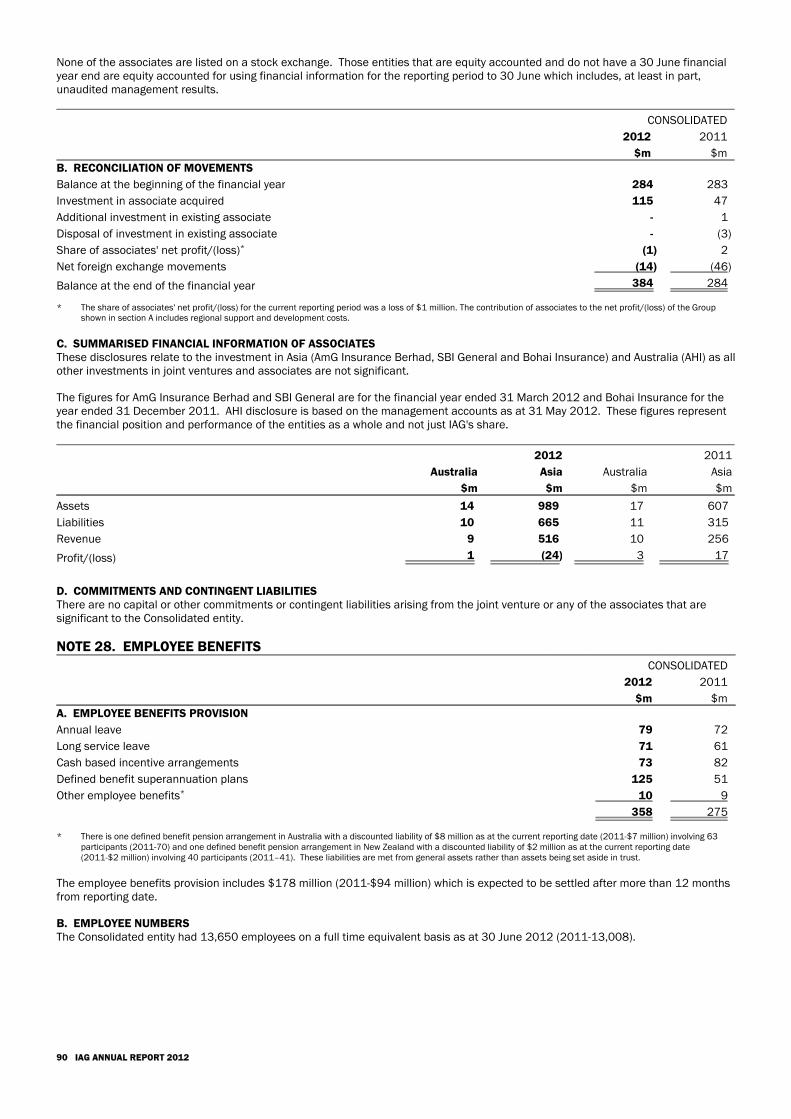
None of the associates are listed on a stock exchange. Those entities that are equity accounted and do not have a 30 June financialyear end are equity accounted for using financial information for the reporting period to 30 June which includes, at least in part,unaudited management results.
CONSOLIDATED
2012 2011
$m $mB. RECONCILIATION OF MOVEMENTS
Balance at the beginning of the financial year 284 283
Investment in associate acquired 115 47
Additional investment in existing associate - 1
Disposal of investment in existing associate - (3)
Share of associates' net profit/(loss)* (1) 2
Net foreign exchange movements (14) (46)
Balance at the end of the financial year 384 284
* The share of associates' net profit/(loss) for the current reporting period was a loss of $1 million. The contribution of associates to the net profit/(loss) of the Groupshown in section A includes regional support and development costs.
C. SUMMARISED FINANCIAL INFORMATION OF ASSOCIATESThese disclosures relate to the investment in Asia (AmG Insurance Berhad, SBI General and Bohai Insurance) and Australia (AHI) as allother investments in joint ventures and associates are not significant.
The figures for AmG Insurance Berhad and SBI General are for the financial year ended 31 March 2012 and Bohai Insurance for theyear ended 31 December 2011. AHI disclosure is based on the management accounts as at 31 May 2012. These figures representthe financial position and performance of the entities as a whole and not just IAG's share.
2012 2011
Australia
$m
Asia
$m
Australia
$m
Asia
$m
Assets 14 989 17 607
Liabilities 10 665 11 315
Revenue 9 516 10 256
Profit/(loss) 1 (24) 3 17
D. COMMITMENTS AND CONTINGENT LIABILITIESThere are no capital or other commitments or contingent liabilities arising from the joint venture or any of the associates that aresignificant to the Consolidated entity.
NOTE 28. EMPLOYEE BENEFITSCONSOLIDATED
2012 2011
$m $mA. EMPLOYEE BENEFITS PROVISION
Annual leave 79 72
Long service leave 71 61
Cash based incentive arrangements 73 82
Defined benefit superannuation plans 125 51
Other employee benefits* 10 9
358 275
* There is one defined benefit pension arrangement in Australia with a discounted liability of $8 million as at the current reporting date (2011-$7 million) involving 63participants (2011-70) and one defined benefit pension arrangement in New Zealand with a discounted liability of $2 million as at the current reporting date (2011-$2 million) involving 40 participants (2011–41). These liabilities are met from general assets rather than assets being set aside in trust.
The employee benefits provision includes $178 million (2011-$94 million) which is expected to be settled after more than 12 monthsfrom reporting date.
B. EMPLOYEE NUMBERSThe Consolidated entity had 13,650 employees on a full time equivalent basis as at 30 June 2012 (2011-13,008).
90 IAG ANNUAL REPORT 2012
C. CASH BASED INCENTIVE ARRANGEMENTSI. Short term incentive planThe short term incentive plan continued in operation during the current reporting period. Eligible employees have the capacity to earna proportion of their base pay as a cash incentive annually. The incentive opportunity is set depending on an employee's role andresponsibilities. The majority of employees are on a 10%, 15% or 20% plan. The incentive payments are determined based on anassessment of individual performance and achievement of a range of business unit and individual goals.
II. Insurance Manufacturers of Australia Pty Limited long term incentive schemeA long term incentive is available to senior employees of Insurance Manufacturers of Australia Pty Limited (IMA). This is a cash basedincentive arrangement involving hurdles relating to compound growth in the IMA underwriting result over a three year period.
NOTE 29. SHARE BASED REMUNERATIONThe provision of share based remuneration creates a link between shareholder value creation and rewarding employees. Share basedremuneration encourages employee share ownership, links employee reward to the performance of the Group and assists withretention of key personnel. This type of remuneration encourages employees to focus on creating shareholder value over the longerterm.
The obligations under share based payment arrangements are covered by the on market purchase of IAG ordinary shares which areheld in trust. The shares are purchased on or near grant date at the prevailing market price. The arrangements are managed using in-house trusts, one for Australia and one for New Zealand, which are controlled for accounting purposes and are subsidiaries of theConsolidated entity. The trustee for each trust is a subsidiary of the Consolidated entity. The trusts are administered by an externalcompany.
The number of shares purchased to cover each allocation of rights is determined by the trustee based on independent actuarialadvice. The trusts allow for excess shares purchased in relation to one plan to be used to meet obligations of the other plans at thetrustee’s discretion. The trusts held 13,219,481 shares as at 30 June 2012 (2011-12,439,032 shares) representing 0.64% (2011 -0.60%) of the issued share capital. This includes shares that are not controlled for accounting purposes and so not recognised astreasury shares.
Trading in IAG ordinary shares that are awarded under the share based remuneration arrangements is covered by the samerestrictions that apply to all forms of share ownership by employees. These restrictions limit an employee trading in IAG ordinaryshares when they are in a position to be aware, or are aware, of price sensitive information.
Share based remuneration is provided through a range of different plans each of which has different purposes and different rules. Theshare based remuneration expense amounts are included in the claims expense, other underwriting expenses, and fee based,corporate and other expenses lines in the statement of comprehensive income.
A. SENIOR MANAGEMENT AND EXECUTIVE SHARE PLANSThe senior management and executive share plan arrangements consist of two separate arrangements working together. These twoarrangements are the Deferred Award Rights Plan and the Executive Performance Rights Plan which are detailed below. The IAGNomination, Remuneration & Sustainability Committee approves the participation of each individual in the plans. Certain other shareplan arrangements remain in place but were closed to new offers in the prior reporting periods. Within each of these plans, thereremain outstanding rights to be settled with the most significant being the Performance Award Rights Plan.
I. Deferred Award Rights PlanThe Deferred Awards Rights Plan (DAR Plan) is the deferred portion of the short term incentive issued as rights over IAG ordinaryshares.
Key terms and conditions: The rights are granted for nil consideration, are non transferable, and can be settled only with existing IAG ordinary shares.
Holders do not receive dividends and do not have voting rights until the rights are exercised.
The vesting condition is not market related and requires the participant to continue in relevant employment.
Where the rights vest (the holder becomes entitled to exercise the right), the plan entitles participating employees to acquire oneIAG ordinary share for each right. The exercise price of all vested rights is a nominal value of $1 per tranche of rights exercised.
The rights vest after a period (current maximum is two years, with a three year maximum for rights granted before 1 July 2010) asdetermined by the IAG Board subject to the participants continuing in relevant employment for the full period. If there is a changeof control of IAG, the IAG Board has discretion to determine if and when rights should vest.
If the vesting condition is not met then the rights lapse. The rights also lapse where the holder chooses to forgo the rights, and allrights expire 10 years (for rights granted prior to 1 July 2009) or seven years (for rights granted after 1 July 2009) from grant datewhere they have not previously lapsed or been exercised.
91
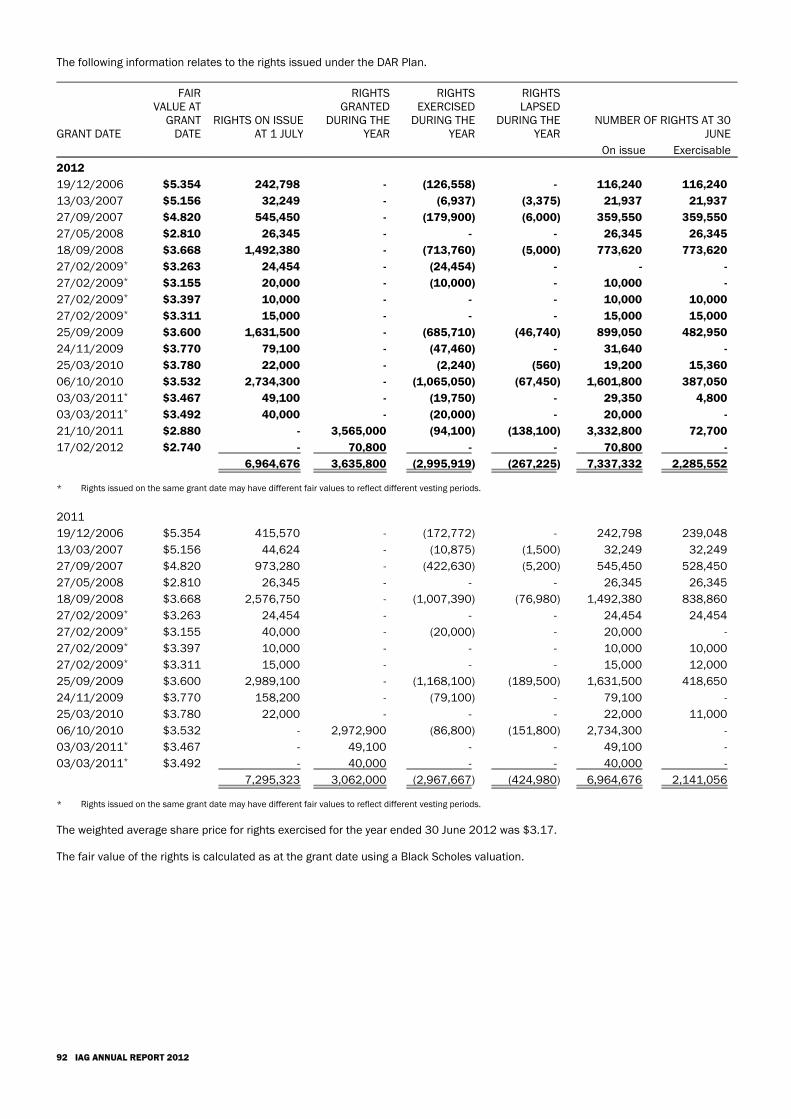
The following information relates to the rights issued under the DAR Plan.
GRANT DATE
FAIRVALUE AT
GRANTDATE
RIGHTS ON ISSUEAT 1 JULY
RIGHTSGRANTED
DURING THEYEAR
RIGHTSEXERCISED
DURING THEYEAR
RIGHTSLAPSED
DURING THEYEAR
NUMBER OF RIGHTS AT 30JUNE
On issue Exercisable
2012
19/12/2006 $5.354 242,798 - (126,558) - 116,240 116,240
13/03/2007 $5.156 32,249 - (6,937) (3,375) 21,937 21,937
27/09/2007 $4.820 545,450 - (179,900) (6,000) 359,550 359,550
27/05/2008 $2.810 26,345 - - - 26,345 26,345
18/09/2008 $3.668 1,492,380 - (713,760) (5,000) 773,620 773,620
27/02/2009* $3.263 24,454 - (24,454) - - -
27/02/2009* $3.155 20,000 - (10,000) - 10,000 -
27/02/2009* $3.397 10,000 - - - 10,000 10,000
27/02/2009* $3.311 15,000 - - - 15,000 15,000
25/09/2009 $3.600 1,631,500 - (685,710) (46,740) 899,050 482,950
24/11/2009 $3.770 79,100 - (47,460) - 31,640 -
25/03/2010 $3.780 22,000 - (2,240) (560) 19,200 15,360
06/10/2010 $3.532 2,734,300 - (1,065,050) (67,450) 1,601,800 387,050
03/03/2011* $3.467 49,100 - (19,750) - 29,350 4,800
03/03/2011* $3.492 40,000 - (20,000) - 20,000 -
21/10/2011 $2.880 - 3,565,000 (94,100) (138,100) 3,332,800 72,700
17/02/2012 $2.740 - 70,800 - - 70,800 -
6,964,676 3,635,800 (2,995,919) (267,225) 7,337,332 2,285,552
* Rights issued on the same grant date may have different fair values to reflect different vesting periods.
2011
19/12/2006 $5.354 415,570 - (172,772) - 242,798 239,048
13/03/2007 $5.156 44,624 - (10,875) (1,500) 32,249 32,249
27/09/2007 $4.820 973,280 - (422,630) (5,200) 545,450 528,450
27/05/2008 $2.810 26,345 - - - 26,345 26,345
18/09/2008 $3.668 2,576,750 - (1,007,390) (76,980) 1,492,380 838,860
27/02/2009* $3.263 24,454 - - - 24,454 24,454
27/02/2009* $3.155 40,000 - (20,000) - 20,000 -
27/02/2009* $3.397 10,000 - - - 10,000 10,000
27/02/2009* $3.311 15,000 - - - 15,000 12,000
25/09/2009 $3.600 2,989,100 - (1,168,100) (189,500) 1,631,500 418,650
24/11/2009 $3.770 158,200 - (79,100) - 79,100 -
25/03/2010 $3.780 22,000 - - - 22,000 11,000
06/10/2010 $3.532 - 2,972,900 (86,800) (151,800) 2,734,300 -
03/03/2011* $3.467 - 49,100 - - 49,100 -
03/03/2011* $3.492 - 40,000 - - 40,000 -
7,295,323 3,062,000 (2,967,667) (424,980) 6,964,676 2,141,056
* Rights issued on the same grant date may have different fair values to reflect different vesting periods.
The weighted average share price for rights exercised for the year ended 30 June 2012 was $3.17.
The fair value of the rights is calculated as at the grant date using a Black Scholes valuation.
92 IAG ANNUAL REPORT 2012
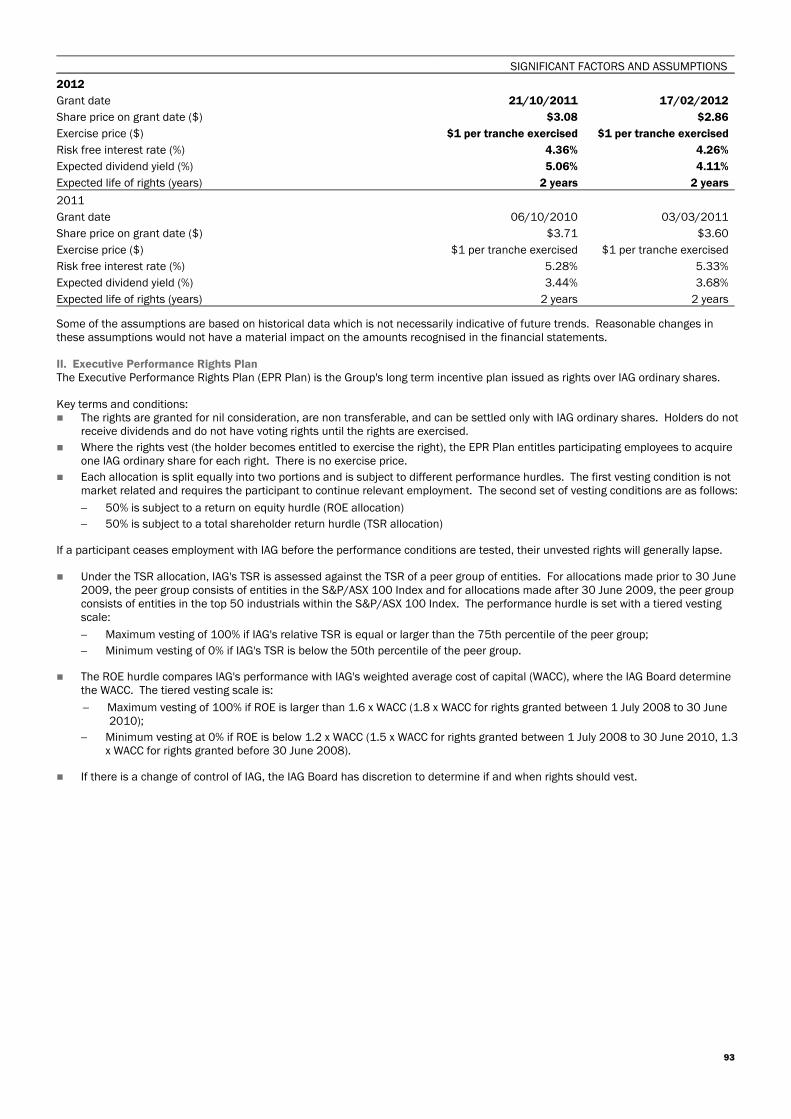
SIGNIFICANT FACTORS AND ASSUMPTIONS
2012
Grant date 21/10/2011 17/02/2012
Share price on grant date ($) $3.08 $2.86
Exercise price ($) $1 per tranche exercised $1 per tranche exercised
Risk free interest rate (%) 4.36% 4.26%
Expected dividend yield (%) 5.06% 4.11%
Expected life of rights (years) 2 years 2 years
2011
Grant date 06/10/2010 03/03/2011
Share price on grant date ($) $3.71 $3.60
Exercise price ($) $1 per tranche exercised $1 per tranche exercised
Risk free interest rate (%) 5.28% 5.33%
Expected dividend yield (%) 3.44% 3.68%
Expected life of rights (years) 2 years 2 years
Some of the assumptions are based on historical data which is not necessarily indicative of future trends. Reasonable changes inthese assumptions would not have a material impact on the amounts recognised in the financial statements.
II. Executive Performance Rights PlanThe Executive Performance Rights Plan (EPR Plan) is the Group's long term incentive plan issued as rights over IAG ordinary shares.
Key terms and conditions: The rights are granted for nil consideration, are non transferable, and can be settled only with IAG ordinary shares. Holders do not
receive dividends and do not have voting rights until the rights are exercised.
Where the rights vest (the holder becomes entitled to exercise the right), the EPR Plan entitles participating employees to acquireone IAG ordinary share for each right. There is no exercise price.
Each allocation is split equally into two portions and is subject to different performance hurdles. The first vesting condition is notmarket related and requires the participant to continue relevant employment. The second set of vesting conditions are as follows:
50% is subject to a return on equity hurdle (ROE allocation)
50% is subject to a total shareholder return hurdle (TSR allocation)
If a participant ceases employment with IAG before the performance conditions are tested, their unvested rights will generally lapse.
Under the TSR allocation, IAG's TSR is assessed against the TSR of a peer group of entities. For allocations made prior to 30 June2009, the peer group consists of entities in the S&P/ASX 100 Index and for allocations made after 30 June 2009, the peer groupconsists of entities in the top 50 industrials within the S&P/ASX 100 Index. The performance hurdle is set with a tiered vestingscale:
Maximum vesting of 100% if IAG's relative TSR is equal or larger than the 75th percentile of the peer group;
Minimum vesting of 0% if IAG's TSR is below the 50th percentile of the peer group.
The ROE hurdle compares IAG's performance with IAG's weighted average cost of capital (WACC), where the IAG Board determinethe WACC. The tiered vesting scale is:
Maximum vesting of 100% if ROE is larger than 1.6 x WACC (1.8 x WACC for rights granted between 1 July 2008 to 30 June2010);
Minimum vesting at 0% if ROE is below 1.2 x WACC (1.5 x WACC for rights granted between 1 July 2008 to 30 June 2010, 1.3x WACC for rights granted before 30 June 2008).
If there is a change of control of IAG, the IAG Board has discretion to determine if and when rights should vest.
93
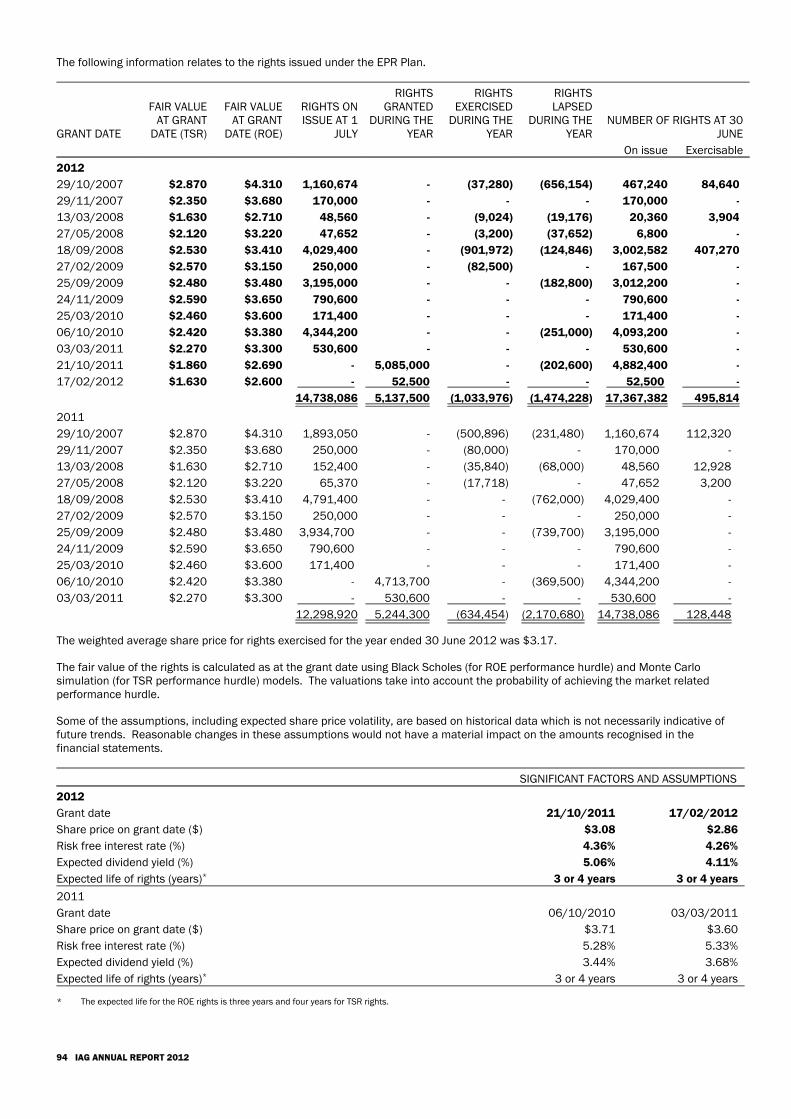
The following information relates to the rights issued under the EPR Plan.
GRANT DATE
FAIR VALUEAT GRANT
DATE (TSR)
FAIR VALUEAT GRANT
DATE (ROE)
RIGHTS ONISSUE AT 1
JULY
RIGHTSGRANTED
DURING THEYEAR
RIGHTSEXERCISED
DURING THEYEAR
RIGHTSLAPSED
DURING THEYEAR
NUMBER OF RIGHTS AT 30JUNE
On issue Exercisable
2012
29/10/2007 $2.870 $4.310 1,160,674 - (37,280) (656,154) 467,240 84,640
29/11/2007 $2.350 $3.680 170,000 - - - 170,000 -
13/03/2008 $1.630 $2.710 48,560 - (9,024) (19,176) 20,360 3,904
27/05/2008 $2.120 $3.220 47,652 - (3,200) (37,652) 6,800 -
18/09/2008 $2.530 $3.410 4,029,400 - (901,972) (124,846) 3,002,582 407,270
27/02/2009 $2.570 $3.150 250,000 - (82,500) - 167,500 -
25/09/2009 $2.480 $3.480 3,195,000 - - (182,800) 3,012,200 -
24/11/2009 $2.590 $3.650 790,600 - - - 790,600 -
25/03/2010 $2.460 $3.600 171,400 - - - 171,400 -
06/10/2010 $2.420 $3.380 4,344,200 - - (251,000) 4,093,200 -
03/03/2011 $2.270 $3.300 530,600 - - - 530,600 -
21/10/2011 $1.860 $2.690 - 5,085,000 - (202,600) 4,882,400 -
17/02/2012 $1.630 $2.600 - 52,500 - - 52,500 -
14,738,086 5,137,500 (1,033,976) (1,474,228) 17,367,382 495,814
2011
29/10/2007 $2.870 $4.310 1,893,050 - (500,896) (231,480) 1,160,674 112,320
29/11/2007 $2.350 $3.680 250,000 - (80,000) - 170,000 -
13/03/2008 $1.630 $2.710 152,400 - (35,840) (68,000) 48,560 12,928
27/05/2008 $2.120 $3.220 65,370 - (17,718) - 47,652 3,200
18/09/2008 $2.530 $3.410 4,791,400 - - (762,000) 4,029,400 -
27/02/2009 $2.570 $3.150 250,000 - - - 250,000 -
25/09/2009 $2.480 $3.480 3,934,700 - - (739,700) 3,195,000 -
24/11/2009 $2.590 $3.650 790,600 - - - 790,600 -
25/03/2010 $2.460 $3.600 171,400 - - - 171,400 -
06/10/2010 $2.420 $3.380 - 4,713,700 - (369,500) 4,344,200 -
03/03/2011 $2.270 $3.300 - 530,600 - - 530,600 -
12,298,920 5,244,300 (634,454) (2,170,680) 14,738,086 128,448
The weighted average share price for rights exercised for the year ended 30 June 2012 was $3.17.
The fair value of the rights is calculated as at the grant date using Black Scholes (for ROE performance hurdle) and Monte Carlosimulation (for TSR performance hurdle) models. The valuations take into account the probability of achieving the market relatedperformance hurdle.
Some of the assumptions, including expected share price volatility, are based on historical data which is not necessarily indicative offuture trends. Reasonable changes in these assumptions would not have a material impact on the amounts recognised in thefinancial statements.
SIGNIFICANT FACTORS AND ASSUMPTIONS
2012
Grant date 21/10/2011 17/02/2012
Share price on grant date ($) $3.08 $2.86
Risk free interest rate (%) 4.36% 4.26%
Expected dividend yield (%) 5.06% 4.11%
Expected life of rights (years)* 3 or 4 years 3 or 4 years
2011
Grant date 06/10/2010 03/03/2011
Share price on grant date ($) $3.71 $3.60
Risk free interest rate (%) 5.28% 5.33%
Expected dividend yield (%) 3.44% 3.68%
Expected life of rights (years)* 3 or 4 years 3 or 4 years
* The expected life for the ROE rights is three years and four years for TSR rights.
94 IAG ANNUAL REPORT 2012
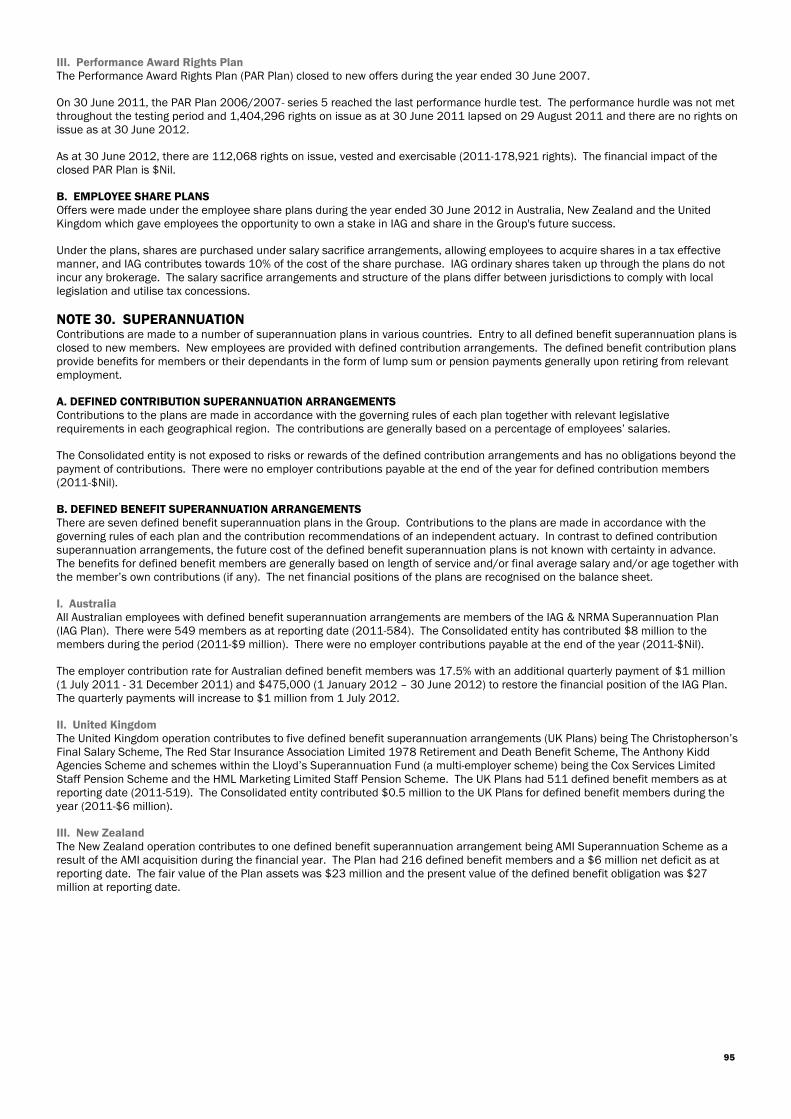
III. Performance Award Rights PlanThe Performance Award Rights Plan (PAR Plan) closed to new offers during the year ended 30 June 2007.
On 30 June 2011, the PAR Plan 2006/2007- series 5 reached the last performance hurdle test. The performance hurdle was not metthroughout the testing period and 1,404,296 rights on issue as at 30 June 2011 lapsed on 29 August 2011 and there are no rights onissue as at 30 June 2012.
As at 30 June 2012, there are 112,068 rights on issue, vested and exercisable (2011-178,921 rights). The financial impact of theclosed PAR Plan is $Nil.
B. EMPLOYEE SHARE PLANSOffers were made under the employee share plans during the year ended 30 June 2012 in Australia, New Zealand and the UnitedKingdom which gave employees the opportunity to own a stake in IAG and share in the Group's future success.
Under the plans, shares are purchased under salary sacrifice arrangements, allowing employees to acquire shares in a tax effectivemanner, and IAG contributes towards 10% of the cost of the share purchase. IAG ordinary shares taken up through the plans do notincur any brokerage. The salary sacrifice arrangements and structure of the plans differ between jurisdictions to comply with locallegislation and utilise tax concessions.
NOTE 30. SUPERANNUATIONContributions are made to a number of superannuation plans in various countries. Entry to all defined benefit superannuation plans isclosed to new members. New employees are provided with defined contribution arrangements. The defined benefit contribution plansprovide benefits for members or their dependants in the form of lump sum or pension payments generally upon retiring from relevantemployment.
A. DEFINED CONTRIBUTION SUPERANNUATION ARRANGEMENTSContributions to the plans are made in accordance with the governing rules of each plan together with relevant legislativerequirements in each geographical region. The contributions are generally based on a percentage of employees’ salaries.
The Consolidated entity is not exposed to risks or rewards of the defined contribution arrangements and has no obligations beyond thepayment of contributions. There were no employer contributions payable at the end of the year for defined contribution members(2011-$Nil).
B. DEFINED BENEFIT SUPERANNUATION ARRANGEMENTSThere are seven defined benefit superannuation plans in the Group. Contributions to the plans are made in accordance with thegoverning rules of each plan and the contribution recommendations of an independent actuary. In contrast to defined contributionsuperannuation arrangements, the future cost of the defined benefit superannuation plans is not known with certainty in advance.The benefits for defined benefit members are generally based on length of service and/or final average salary and/or age together withthe member’s own contributions (if any). The net financial positions of the plans are recognised on the balance sheet.
I. AustraliaAll Australian employees with defined benefit superannuation arrangements are members of the IAG & NRMA Superannuation Plan(IAG Plan). There were 549 members as at reporting date (2011-584). The Consolidated entity has contributed $8 million to themembers during the period (2011-$9 million). There were no employer contributions payable at the end of the year (2011-$Nil).
The employer contribution rate for Australian defined benefit members was 17.5% with an additional quarterly payment of $1 million(1 July 2011 - 31 December 2011) and $475,000 (1 January 2012 – 30 June 2012) to restore the financial position of the IAG Plan.The quarterly payments will increase to $1 million from 1 July 2012.
II. United KingdomThe United Kingdom operation contributes to five defined benefit superannuation arrangements (UK Plans) being The Christopherson’sFinal Salary Scheme, The Red Star Insurance Association Limited 1978 Retirement and Death Benefit Scheme, The Anthony KiddAgencies Scheme and schemes within the Lloyd’s Superannuation Fund (a multi-employer scheme) being the Cox Services LimitedStaff Pension Scheme and the HML Marketing Limited Staff Pension Scheme. The UK Plans had 511 defined benefit members as atreporting date (2011-519). The Consolidated entity contributed $0.5 million to the UK Plans for defined benefit members during theyear (2011-$6 million).
III. New ZealandThe New Zealand operation contributes to one defined benefit superannuation arrangement being AMI Superannuation Scheme as aresult of the AMI acquisition during the financial year. The Plan had 216 defined benefit members and a $6 million net deficit as atreporting date. The fair value of the Plan assets was $23 million and the present value of the defined benefit obligation was $27million at reporting date.
95
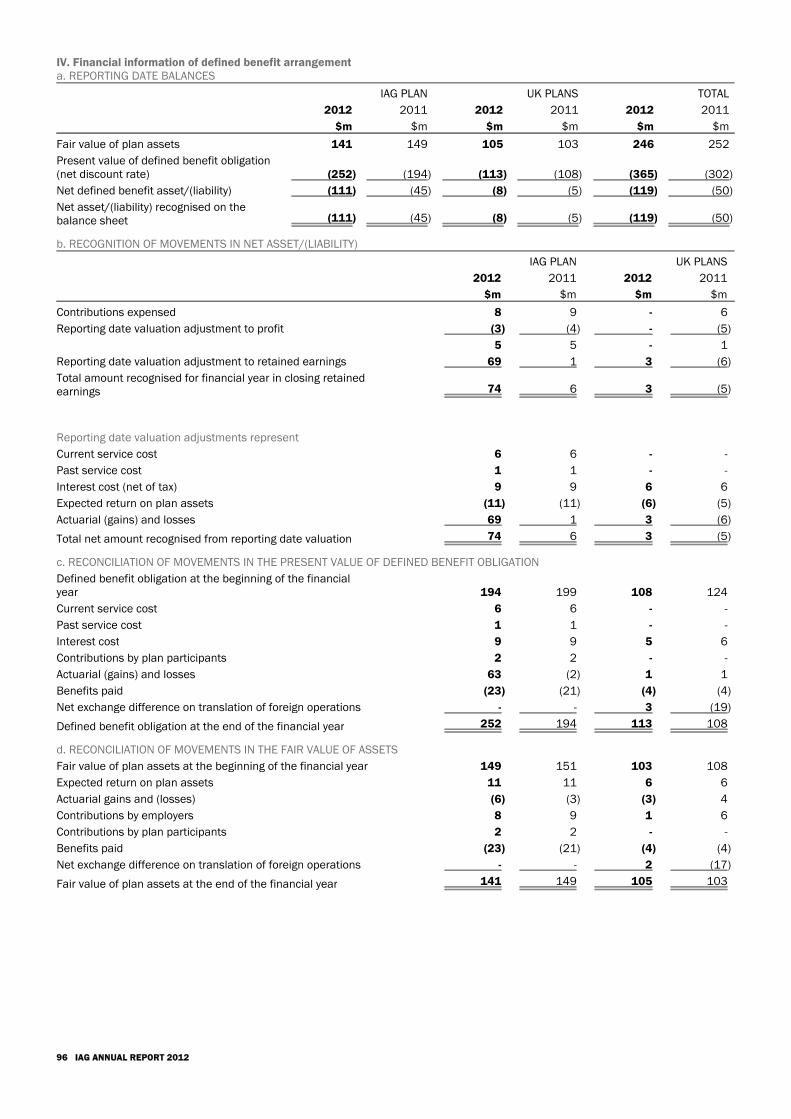
IV. Financial information of defined benefit arrangementa. REPORTING DATE BALANCES
IAG PLAN UK PLANS TOTAL
2012 2011 2012 2011 2012 2011
$m $m $m $m $m $m
Fair value of plan assets 141 149 105 103 246 252
Present value of defined benefit obligation(net discount rate) (252) (194) (113) (108) (365) (302)
Net defined benefit asset/(liability) (111) (45) (8) (5) (119) (50)
Net asset/(liability) recognised on thebalance sheet (111) (45) (8) (5) (119) (50)
b. RECOGNITION OF MOVEMENTS IN NET ASSET/(LIABILITY)
IAG PLAN UK PLANS
2012 2011 2012 2011
$m $m $m $m
Contributions expensed 8 9 - 6
Reporting date valuation adjustment to profit (3) (4) - (5)
5 5 - 1
Reporting date valuation adjustment to retained earnings 69 1 3 (6)
Total amount recognised for financial year in closing retainedearnings 74 6 3 (5)
Reporting date valuation adjustments represent
Current service cost 6 6 - -
Past service cost 1 1 - -
Interest cost (net of tax) 9 9 6 6
Expected return on plan assets (11) (11) (6) (5)
Actuarial (gains) and losses 69 1 3 (6)
Total net amount recognised from reporting date valuation 74 6 3 (5)
c. RECONCILIATION OF MOVEMENTS IN THE PRESENT VALUE OF DEFINED BENEFIT OBLIGATION
Defined benefit obligation at the beginning of the financialyear 194 199 108 124
Current service cost 6 6 - -
Past service cost 1 1 - -
Interest cost 9 9 5 6
Contributions by plan participants 2 2 - -
Actuarial (gains) and losses 63 (2) 1 1
Benefits paid (23) (21) (4) (4)
Net exchange difference on translation of foreign operations - - 3 (19)
Defined benefit obligation at the end of the financial year 252 194 113 108
d. RECONCILIATION OF MOVEMENTS IN THE FAIR VALUE OF ASSETS
Fair value of plan assets at the beginning of the financial year 149 151 103 108
Expected return on plan assets 11 11 6 6
Actuarial gains and (losses) (6) (3) (3) 4
Contributions by employers 8 9 1 6
Contributions by plan participants 2 2 - -
Benefits paid (23) (21) (4) (4)
Net exchange difference on translation of foreign operations - - 2 (17)
Fair value of plan assets at the end of the financial year 141 149 105 103
96 IAG ANNUAL REPORT 2012
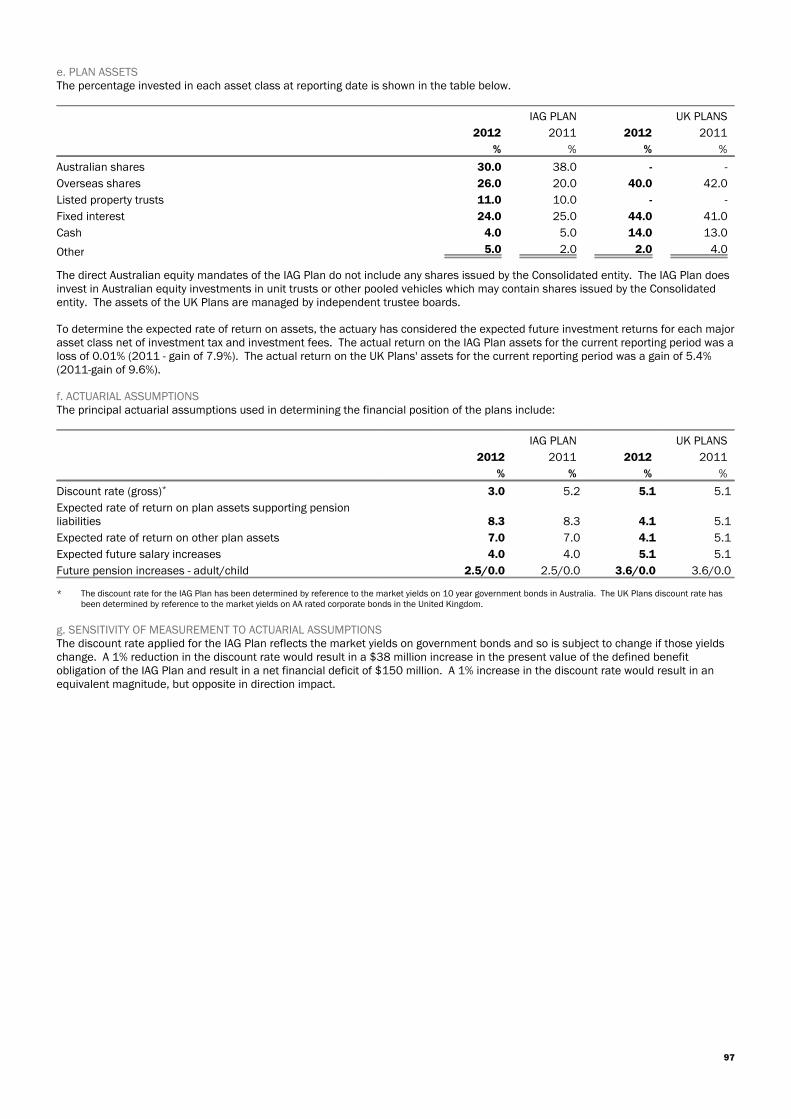
e. PLAN ASSETSThe percentage invested in each asset class at reporting date is shown in the table below.
IAG PLAN UK PLANS
2012 2011 2012 2011
% % % %
Australian shares 30.0 38.0 - -
Overseas shares 26.0 20.0 40.0 42.0
Listed property trusts 11.0 10.0 - -
Fixed interest 24.0 25.0 44.0 41.0
Cash 4.0 5.0 14.0 13.0
Other 5.0 2.0 2.0 4.0
The direct Australian equity mandates of the IAG Plan do not include any shares issued by the Consolidated entity. The IAG Plan doesinvest in Australian equity investments in unit trusts or other pooled vehicles which may contain shares issued by the Consolidatedentity. The assets of the UK Plans are managed by independent trustee boards.
To determine the expected rate of return on assets, the actuary has considered the expected future investment returns for each majorasset class net of investment tax and investment fees. The actual return on the IAG Plan assets for the current reporting period was aloss of 0.01% (2011 - gain of 7.9%). The actual return on the UK Plans' assets for the current reporting period was a gain of 5.4%(2011-gain of 9.6%).
f. ACTUARIAL ASSUMPTIONSThe principal actuarial assumptions used in determining the financial position of the plans include:
IAG PLAN UK PLANS
2012
%
2011
%
2012
%
2011
%
Discount rate (gross)* 3.0 5.2 5.1 5.1
Expected rate of return on plan assets supporting pensionliabilities 8.3 8.3 4.1 5.1
Expected rate of return on other plan assets 7.0 7.0 4.1 5.1
Expected future salary increases 4.0 4.0 5.1 5.1
Future pension increases - adult/child 2.5/0.0 2.5/0.0 3.6/0.0 3.6/0.0
* The discount rate for the IAG Plan has been determined by reference to the market yields on 10 year government bonds in Australia. The UK Plans discount rate hasbeen determined by reference to the market yields on AA rated corporate bonds in the United Kingdom.
g. SENSITIVITY OF MEASUREMENT TO ACTUARIAL ASSUMPTIONSThe discount rate applied for the IAG Plan reflects the market yields on government bonds and so is subject to change if those yieldschange. A 1% reduction in the discount rate would result in a $38 million increase in the present value of the defined benefitobligation of the IAG Plan and result in a net financial deficit of $150 million. A 1% increase in the discount rate would result in anequivalent magnitude, but opposite in direction impact.
97
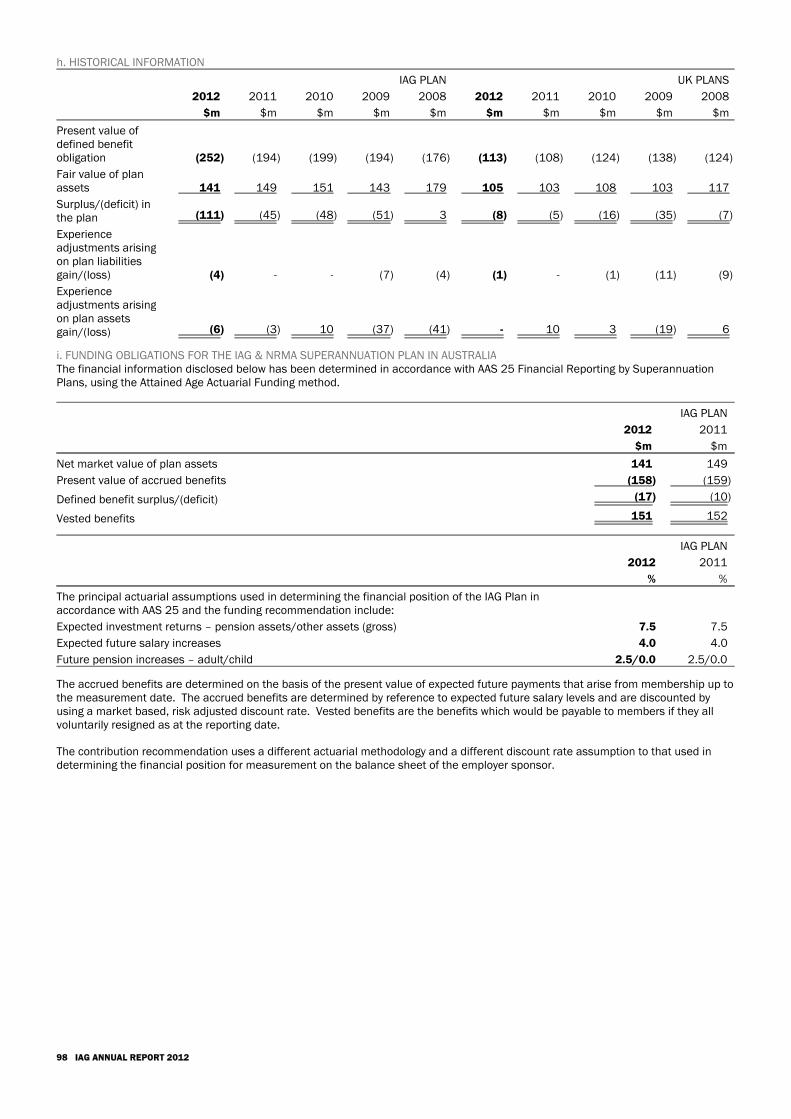
h. HISTORICAL INFORMATION
IAG PLAN UK PLANS
2012 2011 2010 2009 2008 2012 2011 2010 2009 2008
$m $m $m $m $m $m $m $m $m $m
Present value ofdefined benefitobligation (252) (194) (199) (194) (176) (113) (108) (124) (138) (124)
Fair value of planassets 141 149 151 143 179 105 103 108 103 117
Surplus/(deficit) inthe plan (111) (45) (48) (51) 3 (8) (5) (16) (35) (7)
Experienceadjustments arisingon plan liabilitiesgain/(loss) (4) - - (7) (4) (1) - (1) (11) (9)
Experienceadjustments arisingon plan assetsgain/(loss) (6) (3) 10 (37) (41) - 10 3 (19) 6
i. FUNDING OBLIGATIONS FOR THE IAG & NRMA SUPERANNUATION PLAN IN AUSTRALIAThe financial information disclosed below has been determined in accordance with AAS 25 Financial Reporting by SuperannuationPlans, using the Attained Age Actuarial Funding method.
IAG PLAN
2012 2011
$m $m
Net market value of plan assets 141 149
Present value of accrued benefits (158) (159)
Defined benefit surplus/(deficit) (17) (10)
Vested benefits 151 152
IAG PLAN
2012 2011
% %
The principal actuarial assumptions used in determining the financial position of the IAG Plan inaccordance with AAS 25 and the funding recommendation include:
Expected investment returns – pension assets/other assets (gross) 7.5 7.5
Expected future salary increases 4.0 4.0
Future pension increases – adult/child 2.5/0.0 2.5/0.0
The accrued benefits are determined on the basis of the present value of expected future payments that arise from membership up tothe measurement date. The accrued benefits are determined by reference to expected future salary levels and are discounted byusing a market based, risk adjusted discount rate. Vested benefits are the benefits which would be payable to members if they allvoluntarily resigned as at the reporting date.
The contribution recommendation uses a different actuarial methodology and a different discount rate assumption to that used indetermining the financial position for measurement on the balance sheet of the employer sponsor.
98 IAG ANNUAL REPORT 2012
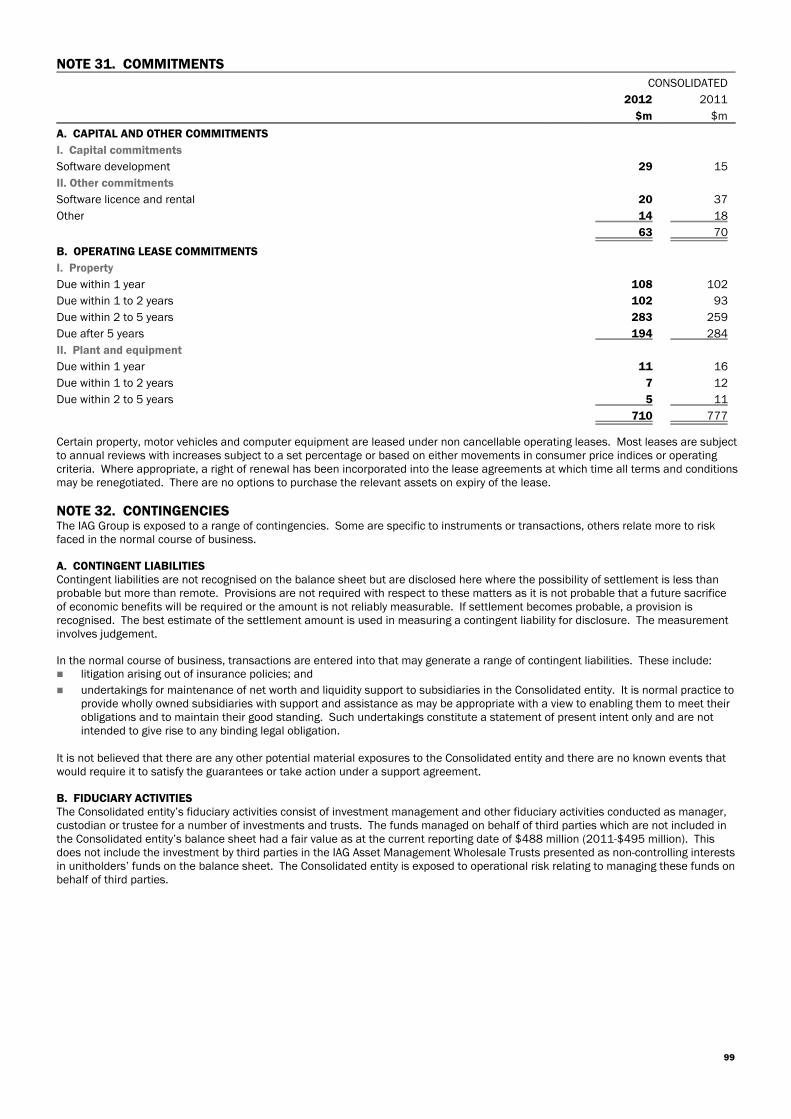
NOTE 31. COMMITMENTSCONSOLIDATED
2012 2011
$m $m
A. CAPITAL AND OTHER COMMITMENTS
I. Capital commitments
Software development 29 15
II. Other commitments
Software licence and rental 20 37
Other 14 18
63 70
B. OPERATING LEASE COMMITMENTS
I. Property
Due within 1 year 108 102
Due within 1 to 2 years 102 93
Due within 2 to 5 years 283 259
Due after 5 years 194 284
II. Plant and equipment
Due within 1 year 11 16
Due within 1 to 2 years 7 12
Due within 2 to 5 years 5 11
710 777
Certain property, motor vehicles and computer equipment are leased under non cancellable operating leases. Most leases are subjectto annual reviews with increases subject to a set percentage or based on either movements in consumer price indices or operatingcriteria. Where appropriate, a right of renewal has been incorporated into the lease agreements at which time all terms and conditionsmay be renegotiated. There are no options to purchase the relevant assets on expiry of the lease.
NOTE 32. CONTINGENCIESThe IAG Group is exposed to a range of contingencies. Some are specific to instruments or transactions, others relate more to riskfaced in the normal course of business.
A. CONTINGENT LIABILITIESContingent liabilities are not recognised on the balance sheet but are disclosed here where the possibility of settlement is less thanprobable but more than remote. Provisions are not required with respect to these matters as it is not probable that a future sacrificeof economic benefits will be required or the amount is not reliably measurable. If settlement becomes probable, a provision isrecognised. The best estimate of the settlement amount is used in measuring a contingent liability for disclosure. The measurementinvolves judgement.
In the normal course of business, transactions are entered into that may generate a range of contingent liabilities. These include: litigation arising out of insurance policies; and
undertakings for maintenance of net worth and liquidity support to subsidiaries in the Consolidated entity. It is normal practice toprovide wholly owned subsidiaries with support and assistance as may be appropriate with a view to enabling them to meet theirobligations and to maintain their good standing. Such undertakings constitute a statement of present intent only and are notintended to give rise to any binding legal obligation.
It is not believed that there are any other potential material exposures to the Consolidated entity and there are no known events thatwould require it to satisfy the guarantees or take action under a support agreement.
B. FIDUCIARY ACTIVITIESThe Consolidated entity’s fiduciary activities consist of investment management and other fiduciary activities conducted as manager,custodian or trustee for a number of investments and trusts. The funds managed on behalf of third parties which are not included inthe Consolidated entity’s balance sheet had a fair value as at the current reporting date of $488 million (2011-$495 million). Thisdoes not include the investment by third parties in the IAG Asset Management Wholesale Trusts presented as non-controlling interestsin unitholders’ funds on the balance sheet. The Consolidated entity is exposed to operational risk relating to managing these funds onbehalf of third parties.
99
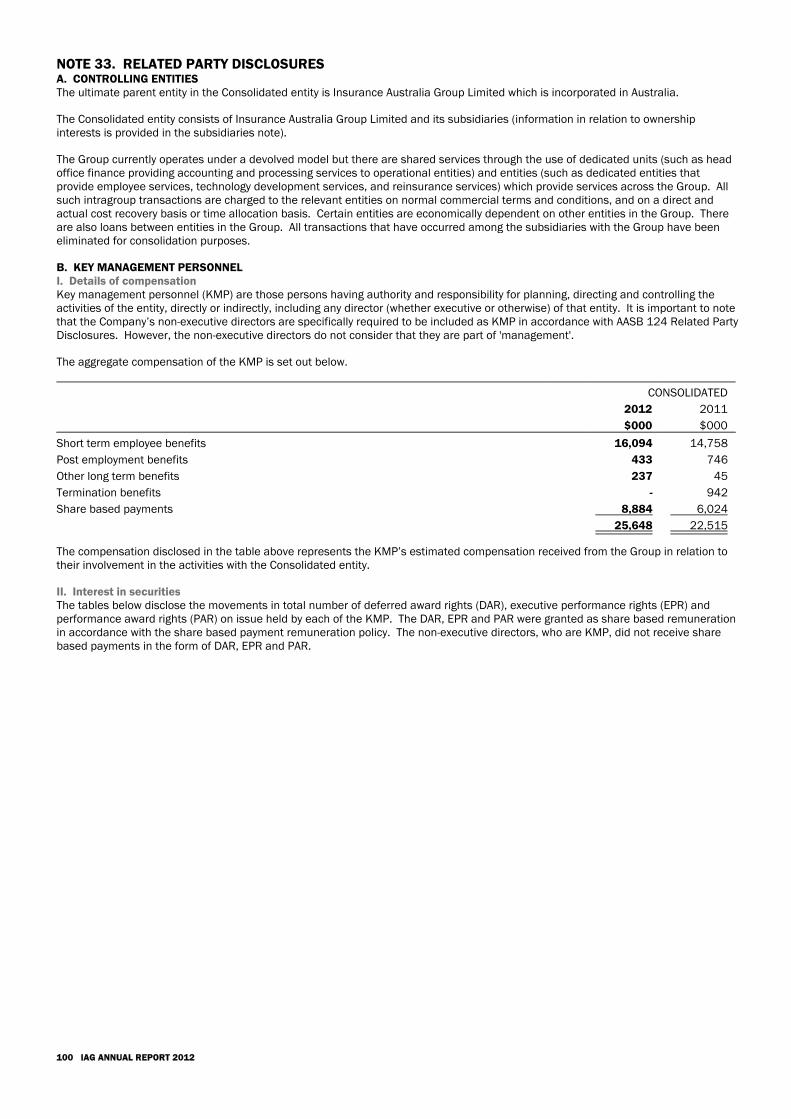
NOTE 33. RELATED PARTY DISCLOSURESA. CONTROLLING ENTITIESThe ultimate parent entity in the Consolidated entity is Insurance Australia Group Limited which is incorporated in Australia.
The Consolidated entity consists of Insurance Australia Group Limited and its subsidiaries (information in relation to ownershipinterests is provided in the subsidiaries note).
The Group currently operates under a devolved model but there are shared services through the use of dedicated units (such as headoffice finance providing accounting and processing services to operational entities) and entities (such as dedicated entities thatprovide employee services, technology development services, and reinsurance services) which provide services across the Group. Allsuch intragroup transactions are charged to the relevant entities on normal commercial terms and conditions, and on a direct andactual cost recovery basis or time allocation basis. Certain entities are economically dependent on other entities in the Group. Thereare also loans between entities in the Group. All transactions that have occurred among the subsidiaries with the Group have beeneliminated for consolidation purposes.
B. KEY MANAGEMENT PERSONNELI. Details of compensationKey management personnel (KMP) are those persons having authority and responsibility for planning, directing and controlling theactivities of the entity, directly or indirectly, including any director (whether executive or otherwise) of that entity. It is important to notethat the Company’s non-executive directors are specifically required to be included as KMP in accordance with AASB 124 Related PartyDisclosures. However, the non-executive directors do not consider that they are part of 'management'.
The aggregate compensation of the KMP is set out below.
CONSOLIDATED
2012 2011
$000 $000
Short term employee benefits 16,094 14,758
Post employment benefits 433 746
Other long term benefits 237 45
Termination benefits - 942
Share based payments 8,884 6,024
25,648 22,515
The compensation disclosed in the table above represents the KMP’s estimated compensation received from the Group in relation totheir involvement in the activities with the Consolidated entity.
II. Interest in securitiesThe tables below disclose the movements in total number of deferred award rights (DAR), executive performance rights (EPR) andperformance award rights (PAR) on issue held by each of the KMP. The DAR, EPR and PAR were granted as share based remunerationin accordance with the share based payment remuneration policy. The non-executive directors, who are KMP, did not receive sharebased payments in the form of DAR, EPR and PAR.
100 IAG ANNUAL REPORT 2012
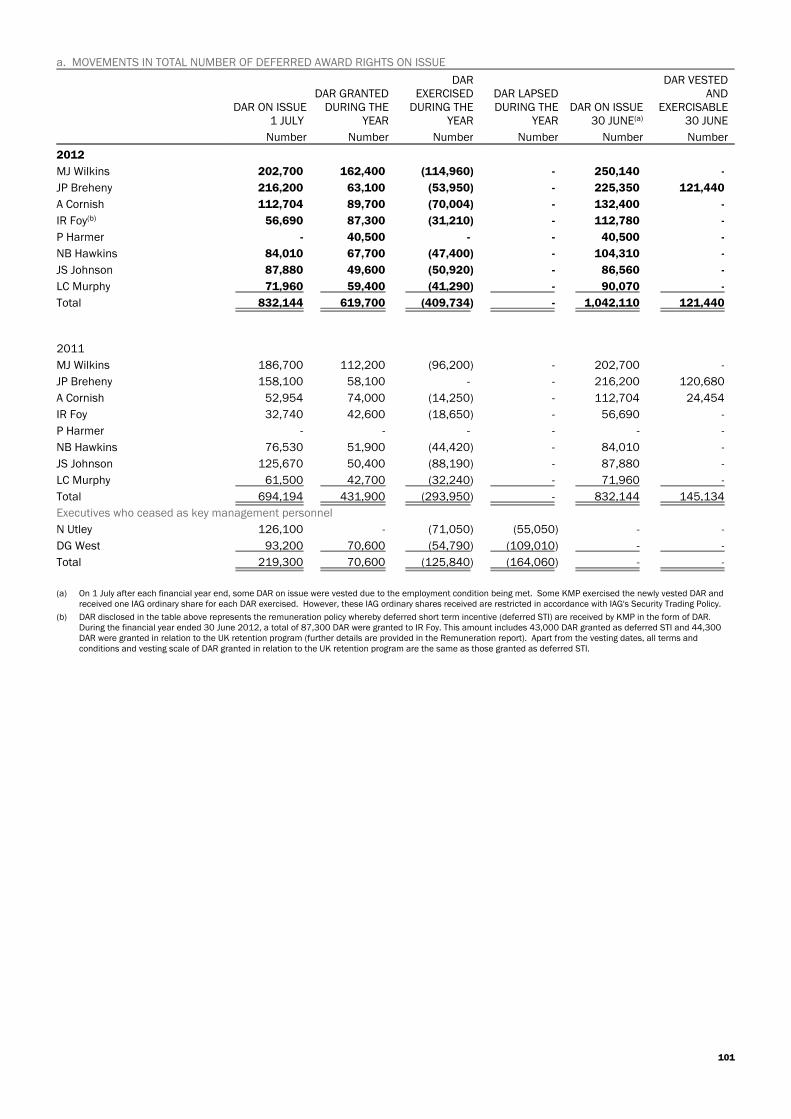
a. MOVEMENTS IN TOTAL NUMBER OF DEFERRED AWARD RIGHTS ON ISSUE
DAR ON ISSUE1 JULY
DAR GRANTEDDURING THE
YEAR
DAREXERCISED
DURING THEYEAR
DAR LAPSEDDURING THE
YEARDAR ON ISSUE
30 JUNE(a)
DAR VESTEDAND
EXERCISABLE30 JUNE
Number Number Number Number Number Number
2012
MJ Wilkins 202,700 162,400 (114,960) - 250,140 -
JP Breheny 216,200 63,100 (53,950) - 225,350 121,440
A Cornish 112,704 89,700 (70,004) - 132,400 -
IR Foy(b) 56,690 87,300 (31,210) - 112,780 -
P Harmer - 40,500 - - 40,500 -
NB Hawkins 84,010 67,700 (47,400) - 104,310 -
JS Johnson 87,880 49,600 (50,920) - 86,560 -
LC Murphy 71,960 59,400 (41,290) - 90,070 -
Total 832,144 619,700 (409,734) - 1,042,110 121,440
2011
MJ Wilkins 186,700 112,200 (96,200) - 202,700 -
JP Breheny 158,100 58,100 - - 216,200 120,680
A Cornish 52,954 74,000 (14,250) - 112,704 24,454
IR Foy 32,740 42,600 (18,650) - 56,690 -
P Harmer - - - - - -
NB Hawkins 76,530 51,900 (44,420) - 84,010 -
JS Johnson 125,670 50,400 (88,190) - 87,880 -
LC Murphy 61,500 42,700 (32,240) - 71,960 -
Total 694,194 431,900 (293,950) - 832,144 145,134
Executives who ceased as key management personnel
N Utley 126,100 - (71,050) (55,050) - -
DG West 93,200 70,600 (54,790) (109,010) - -
Total 219,300 70,600 (125,840) (164,060) - -
(a) On 1 July after each financial year end, some DAR on issue were vested due to the employment condition being met. Some KMP exercised the newly vested DAR andreceived one IAG ordinary share for each DAR exercised. However, these IAG ordinary shares received are restricted in accordance with IAG's Security Trading Policy.
(b) DAR disclosed in the table above represents the remuneration policy whereby deferred short term incentive (deferred STI) are received by KMP in the form of DAR.During the financial year ended 30 June 2012, a total of 87,300 DAR were granted to IR Foy. This amount includes 43,000 DAR granted as deferred STI and 44,300DAR were granted in relation to the UK retention program (further details are provided in the Remuneration report). Apart from the vesting dates, all terms andconditions and vesting scale of DAR granted in relation to the UK retention program are the same as those granted as deferred STI.
101
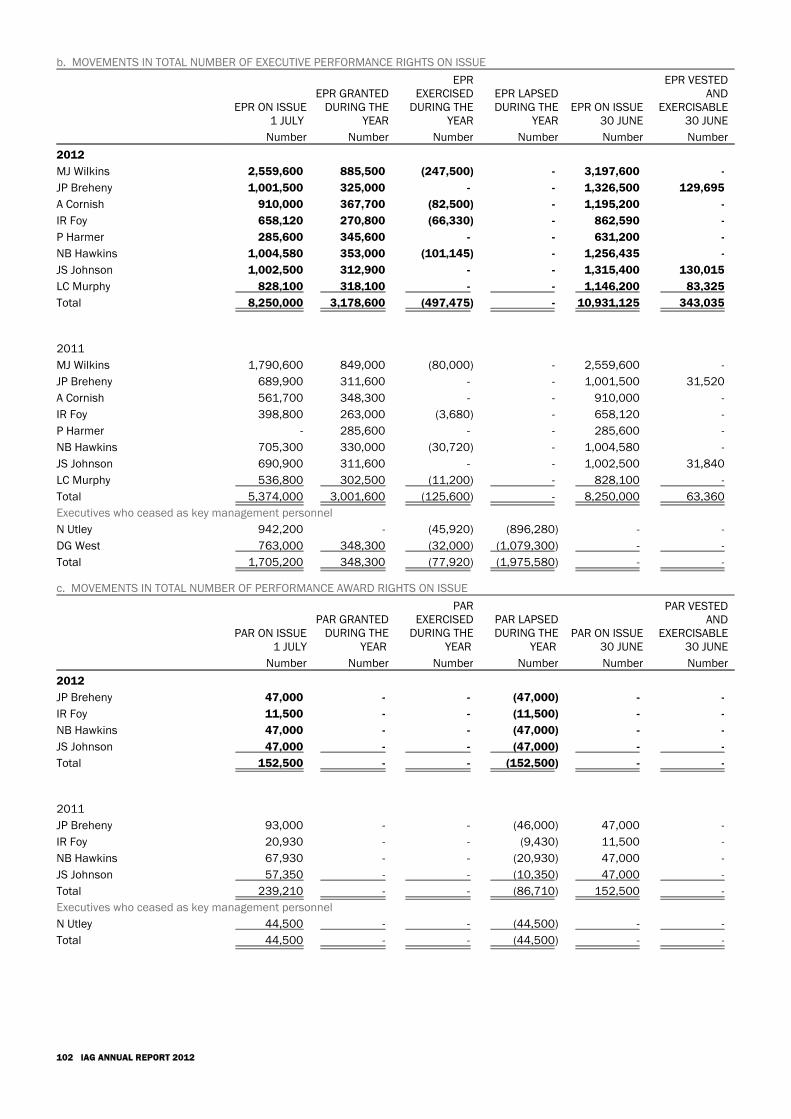
b. MOVEMENTS IN TOTAL NUMBER OF EXECUTIVE PERFORMANCE RIGHTS ON ISSUE
EPR ON ISSUE1 JULY
EPR GRANTEDDURING THE
YEAR
EPREXERCISED
DURING THEYEAR
EPR LAPSEDDURING THE
YEAREPR ON ISSUE
30 JUNE
EPR VESTEDAND
EXERCISABLE30 JUNE
Number Number Number Number Number Number
2012
MJ Wilkins 2,559,600 885,500 (247,500) - 3,197,600 -
JP Breheny 1,001,500 325,000 - - 1,326,500 129,695
A Cornish 910,000 367,700 (82,500) - 1,195,200 -
IR Foy 658,120 270,800 (66,330) - 862,590 -
P Harmer 285,600 345,600 - - 631,200 -
NB Hawkins 1,004,580 353,000 (101,145) - 1,256,435 -
JS Johnson 1,002,500 312,900 - - 1,315,400 130,015
LC Murphy 828,100 318,100 - - 1,146,200 83,325
Total 8,250,000 3,178,600 (497,475) - 10,931,125 343,035
2011
MJ Wilkins 1,790,600 849,000 (80,000) - 2,559,600 -
JP Breheny 689,900 311,600 - - 1,001,500 31,520
A Cornish 561,700 348,300 - - 910,000 -
IR Foy 398,800 263,000 (3,680) - 658,120 -
P Harmer - 285,600 - - 285,600 -
NB Hawkins 705,300 330,000 (30,720) - 1,004,580 -
JS Johnson 690,900 311,600 - - 1,002,500 31,840
LC Murphy 536,800 302,500 (11,200) - 828,100 -
Total 5,374,000 3,001,600 (125,600) - 8,250,000 63,360
Executives who ceased as key management personnel
N Utley 942,200 - (45,920) (896,280) - -
DG West 763,000 348,300 (32,000) (1,079,300) - -
Total 1,705,200 348,300 (77,920) (1,975,580) - -
c. MOVEMENTS IN TOTAL NUMBER OF PERFORMANCE AWARD RIGHTS ON ISSUE
PAR ON ISSUE1 JULY
PAR GRANTEDDURING THE
YEAR
PAREXERCISED
DURING THEYEAR
PAR LAPSEDDURING THE
YEARPAR ON ISSUE
30 JUNE
PAR VESTEDAND
EXERCISABLE30 JUNE
Number Number Number Number Number Number
2012
JP Breheny 47,000 - - (47,000) - -
IR Foy 11,500 - - (11,500) - -
NB Hawkins 47,000 - - (47,000) - -
JS Johnson 47,000 - - (47,000) - -
Total 152,500 - - (152,500) - -
2011
JP Breheny 93,000 - - (46,000) 47,000 -
IR Foy 20,930 - - (9,430) 11,500 -
NB Hawkins 67,930 - - (20,930) 47,000 -
JS Johnson 57,350 - - (10,350) 47,000 -
Total 239,210 - - (86,710) 152,500 -
Executives who ceased as key management personnel
N Utley 44,500 - - (44,500) - -
Total 44,500 - - (44,500) - -
102 IAG ANNUAL REPORT 2012
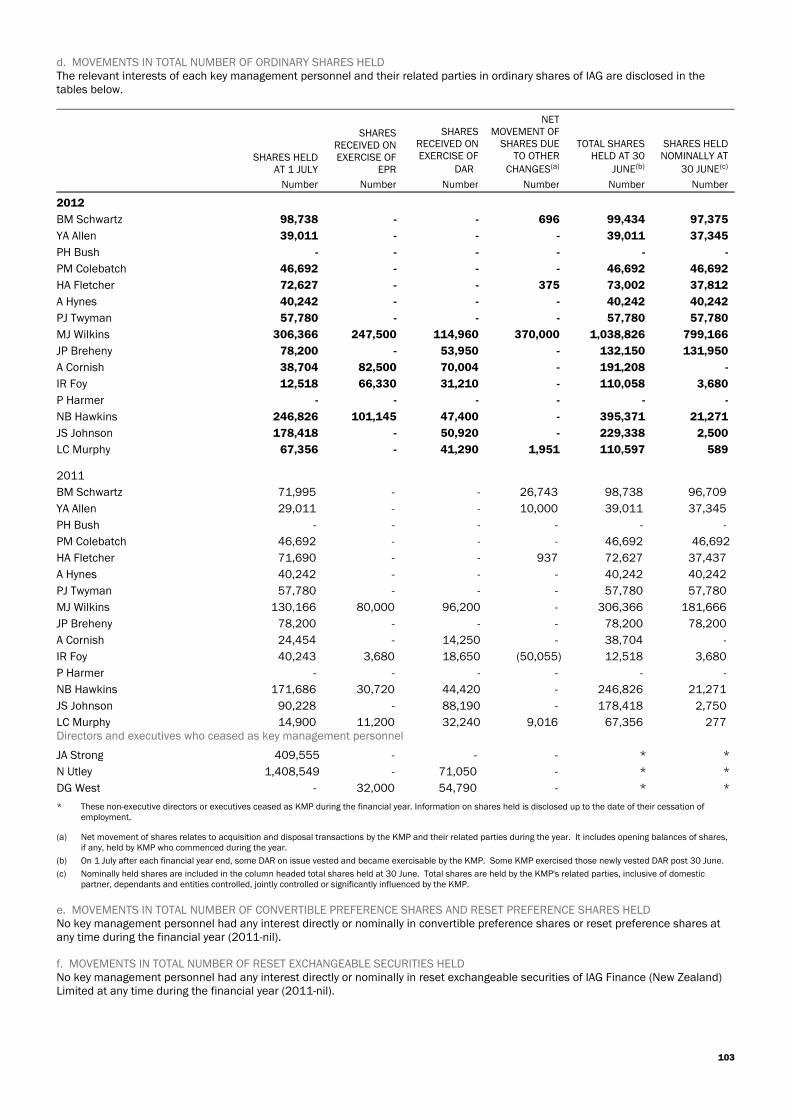
d. MOVEMENTS IN TOTAL NUMBER OF ORDINARY SHARES HELDThe relevant interests of each key management personnel and their related parties in ordinary shares of IAG are disclosed in thetables below.
SHARES HELDAT 1 JULY
SHARESRECEIVED ONEXERCISE OF
EPR
SHARESRECEIVED ONEXERCISE OF
DAR
NETMOVEMENT OF
SHARES DUETO OTHER
CHANGES(a)
TOTAL SHARESHELD AT 30
JUNE(b)
SHARES HELDNOMINALLY AT
30 JUNE(c)
Number Number Number Number Number Number
2012
BM Schwartz 98,738 - - 696 99,434 97,375
YA Allen 39,011 - - - 39,011 37,345
PH Bush - - - - - -
PM Colebatch 46,692 - - - 46,692 46,692
HA Fletcher 72,627 - - 375 73,002 37,812
A Hynes 40,242 - - - 40,242 40,242
PJ Twyman 57,780 - - - 57,780 57,780
MJ Wilkins 306,366 247,500 114,960 370,000 1,038,826 799,166
JP Breheny 78,200 - 53,950 - 132,150 131,950
A Cornish 38,704 82,500 70,004 - 191,208 -
IR Foy 12,518 66,330 31,210 - 110,058 3,680
P Harmer - - - - - -
NB Hawkins 246,826 101,145 47,400 - 395,371 21,271
JS Johnson 178,418 - 50,920 - 229,338 2,500
LC Murphy 67,356 - 41,290 1,951 110,597 589
2011
BM Schwartz 71,995 - - 26,743 98,738 96,709
YA Allen 29,011 - - 10,000 39,011 37,345
PH Bush - - - - - -
PM Colebatch 46,692 - - - 46,692 46,692
HA Fletcher 71,690 - - 937 72,627 37,437
A Hynes 40,242 - - - 40,242 40,242
PJ Twyman 57,780 - - - 57,780 57,780
MJ Wilkins 130,166 80,000 96,200 - 306,366 181,666
JP Breheny 78,200 - - - 78,200 78,200
A Cornish 24,454 - 14,250 - 38,704 -
IR Foy 40,243 3,680 18,650 (50,055) 12,518 3,680
P Harmer - - - - - -
NB Hawkins 171,686 30,720 44,420 - 246,826 21,271
JS Johnson 90,228 - 88,190 - 178,418 2,750
LC Murphy 14,900 11,200 32,240 9,016 67,356 277Directors and executives who ceased as key management personnel
JA Strong 409,555 - - - * *
N Utley 1,408,549 - 71,050 - * *
DG West - 32,000 54,790 - * *
* These non-executive directors or executives ceased as KMP during the financial year. Information on shares held is disclosed up to the date of their cessation ofemployment.
(a) Net movement of shares relates to acquisition and disposal transactions by the KMP and their related parties during the year. It includes opening balances of shares,if any, held by KMP who commenced during the year.
(b) On 1 July after each financial year end, some DAR on issue vested and became exercisable by the KMP. Some KMP exercised those newly vested DAR post 30 June.
(c) Nominally held shares are included in the column headed total shares held at 30 June. Total shares are held by the KMP's related parties, inclusive of domesticpartner, dependants and entities controlled, jointly controlled or significantly influenced by the KMP.
e. MOVEMENTS IN TOTAL NUMBER OF CONVERTIBLE PREFERENCE SHARES AND RESET PREFERENCE SHARES HELDNo key management personnel had any interest directly or nominally in convertible preference shares or reset preference shares atany time during the financial year (2011-nil).
f. MOVEMENTS IN TOTAL NUMBER OF RESET EXCHANGEABLE SECURITIES HELDNo key management personnel had any interest directly or nominally in reset exchangeable securities of IAG Finance (New Zealand)Limited at any time during the financial year (2011-nil).
103
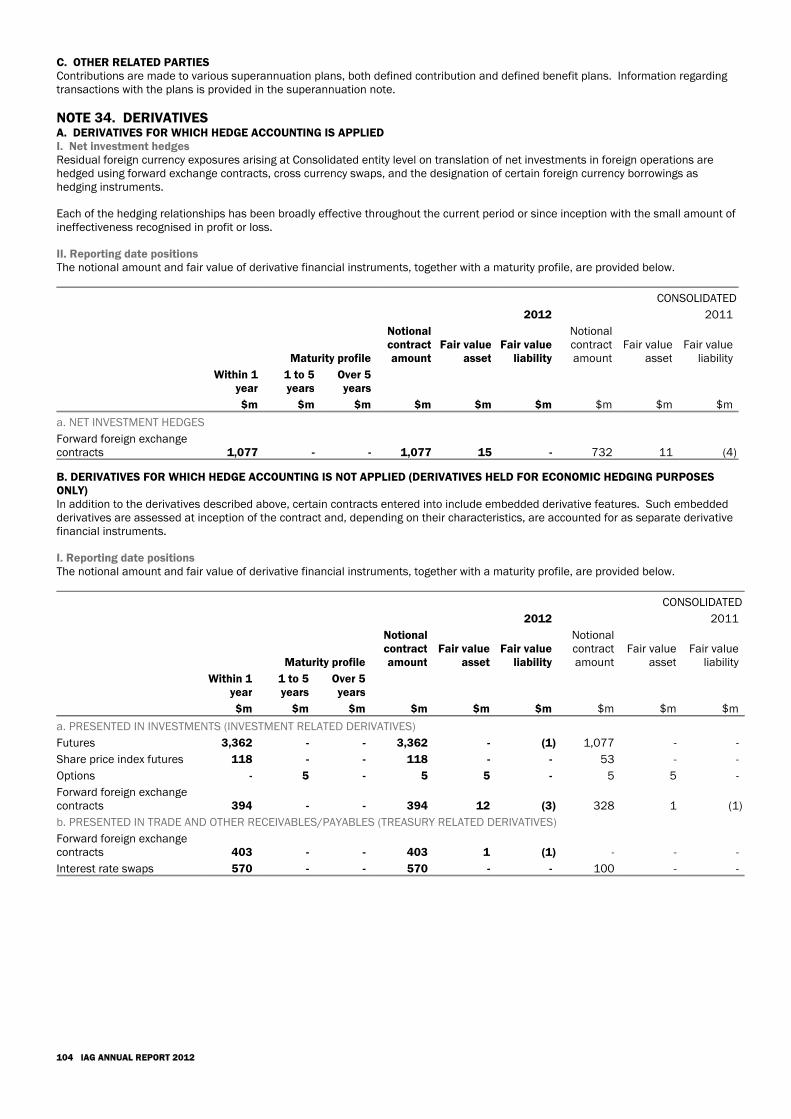
C. OTHER RELATED PARTIESContributions are made to various superannuation plans, both defined contribution and defined benefit plans. Information regardingtransactions with the plans is provided in the superannuation note.
NOTE 34. DERIVATIVESA. DERIVATIVES FOR WHICH HEDGE ACCOUNTING IS APPLIEDI. Net investment hedgesResidual foreign currency exposures arising at Consolidated entity level on translation of net investments in foreign operations arehedged using forward exchange contracts, cross currency swaps, and the designation of certain foreign currency borrowings ashedging instruments.
Each of the hedging relationships has been broadly effective throughout the current period or since inception with the small amount ofineffectiveness recognised in profit or loss.
II. Reporting date positionsThe notional amount and fair value of derivative financial instruments, together with a maturity profile, are provided below.
CONSOLIDATED
2012 2011
Maturity profile
Notionalcontractamount
Fair valueasset
Fair valueliability
Notionalcontractamount
Fair valueasset
Fair valueliability
Within 1year
$m
1 to 5years
$m
Over 5years
$m $m $m $m $m $m $m
a. NET INVESTMENT HEDGES
Forward foreign exchangecontracts 1,077 - - 1,077 15 - 732 11 (4)
B. DERIVATIVES FOR WHICH HEDGE ACCOUNTING IS NOT APPLIED (DERIVATIVES HELD FOR ECONOMIC HEDGING PURPOSESONLY)In addition to the derivatives described above, certain contracts entered into include embedded derivative features. Such embeddedderivatives are assessed at inception of the contract and, depending on their characteristics, are accounted for as separate derivativefinancial instruments.
I. Reporting date positionsThe notional amount and fair value of derivative financial instruments, together with a maturity profile, are provided below.
CONSOLIDATED
2012 2011
Maturity profile
Notionalcontractamount
Fair valueasset
Fair valueliability
Notionalcontractamount
Fair valueasset
Fair valueliability
Within 1year
$m
1 to 5years
$m
Over 5years
$m $m $m $m $m $m $m
a. PRESENTED IN INVESTMENTS (INVESTMENT RELATED DERIVATIVES)
Futures 3,362 - - 3,362 - (1) 1,077 - -
Share price index futures 118 - - 118 - - 53 - -
Options - 5 - 5 5 - 5 5 -
Forward foreign exchangecontracts 394 - - 394 12 (3) 328 1 (1)
b. PRESENTED IN TRADE AND OTHER RECEIVABLES/PAYABLES (TREASURY RELATED DERIVATIVES)
Forward foreign exchangecontracts 403 - - 403 1 (1) - - -
Interest rate swaps 570 - - 570 - - 100 - -
104 IAG ANNUAL REPORT 2012
NOTE 35. CAPITAL MANAGEMENTA. CAPITAL MANAGEMENT STRATEGYThe capital management strategy plays a central role in managing risk to create shareholder value whilst meeting the crucial andequally important objective of providing an appropriate level of capital to protect policyholders’ and lenders’ interests and satisfyregulators.
The Group actively considers its risk appetite through the holistic implementation of strategies around identified key risk levers ofunderwriting, reinsurance, capital, asset allocation and risk management. The target level of capitalisation for the Group is assessedby consideration of factors including: the probability of ruin over the next one to three years;
the probability of falling below the APRA minimum capital requirement (MCR) over the next one to three years;
other stakeholder perspectives on capitalisation, including rating agency capital models and associated ratings; and
domestic and international levels of capitalisation.
The amount of capital required that fulfils these risk appetite factors varies according to the business underwritten, extent ofreinsurance and asset allocation and is estimated using dynamic financial analysis modelling. For ease of communication, internallyand externally, the Group has translated the outcome into a multiple of MCR by applying the APRA prescribed methodology for a Level2 Insurance Group. On this basis, the Group has established a target capital of 1.45 to 1.50 times MCR.
Internal policies are in place to ensure significant deviations from this benchmark will result in the IAG Board considering how anyshortfall should be made good or any surplus utilised.
I. Regulatory capital All insurers within the Group that carry on insurance business in Australia are registered with APRA and are subject to prudentialstandards that set out the basis for calculating the MCR which is a minimum level of capital that the regulator deems must be held tomeet policyholder obligations. An insurer’s capital base is expected to be adequate for the size, business mix, complexity and riskprofile of its business and so the MCR utilises a risk based approach to capital adequacy. IAG uses the standardised framework forcalculating the MCR detailed in the relevant prudential standard and referred to as the prescribed method which is determined to bethe sum of the capital charges for insurance, investment, investment concentration and catastrophe concentration risk. It is the Grouppolicy to ensure that each of the licensed insurers maintains an adequate capital position from an entity perspective.
It is the Group policy to hold regulatory capital levels in excess of the MCR as required by APRA. The current target capital multiple forthe Group is 1.45 to 1.50 times (2011-1.45 to 1.50 times) the MCR. The policy also requires management to not take any action thatwould further reduce the capital multiple if an identified MCR is reached, currently set as 1.30 times MCR for the Group. APRA alsoimposes some restrictions on the composition of capital eligible to meet the MCR.
Capital calculations for regulatory purposes are based on the premium liabilities model which is different to the deferral and matchingmodel which underpins the measurement of assets and liabilities in the financial statements. The premium liabilities model assessesfuture claims payments arising from future events insured under existing policies. This differs to the measurement of the outstandingclaims liability on the balance sheet which considers claims relating to events that occur only up to and including the reporting date.
The Group has considered the implications of the proposed new regulatory environment applicable from 1 January 2013. The Grouphas determined to maintain a consistent risk appetite between the existing and new LAGIC regulatory regime. To achieve this underLAGIC IAG will set the target capital ranges from 1 January 2013 as: a total capital position equivalent to 1.4-1.6 times the Prescribed Capital Amount (PCA), which replaces the current MCR measure;
and
Common Equity Tier 1 capital of 0.9-1.1 times the PCA, compared to a proposed regulatory requirement of 0.6 times.
These target levels would be subject to review in light of any material changes between the draft and final issued standards.
II. Economic capitalIn conjunction with the considerations set out above, which are important to the functioning of the business, consideration is given tothe operational capital needs of the business. Targeting a capital multiple above the minimum regulatory requirement aims to ensurethe ongoing strength and security of the Group whilst suitably protecting policyholders and lenders.
An important influence on the capital levels is the payment of dividends. The Consolidated entity aims to maintain cash earningspayouts within a ratio range approved by the IAG Board (refer to the dividends note).
The capital objectives are achieved through dynamic management of the balance sheet and capital mix, the use of a risk based capitaladequacy framework for capital needs that relies on explicit quantification of uncertainty or risk, and the use of modelling techniquessuch as dynamic financial analysis which provide valuable input to the capital management process and provide the capacity toquantify and understand this risk/return trade off. The influence on capital needs of product mix, the reinsurance program,catastrophe exposure, investment strategy, profit margins and capital structure are all assessed through the dynamic financialanalysis modelling.
105
B. CAPITAL COMPOSITIONThe Group’s capital comprises ordinary equity and interest bearing liabilities. The balance sheet capital mix at reporting date was asshown in the table below.
CONSOLIDATED
Target 2012 2011
% % %
Ordinary equity less goodwill and intangible assets 60-70 62 66
Interest bearing liabilities - hybrid securities and debt 30-40 38 34
Total capitalisation 100 100
C. REGULATORY CAPITAL COMPLIANCEThe Company and the insurers within the Consolidated entity have at all times during the current and prior financial year complied withthe externally imposed capital requirements to which they are subject. The MCR calculation for the Consolidated entity provided belowis based on applying the APRA Level 2 Insurance Group requirements.
CONSOLIDATED
2012 2011
$m $m
I. Statutory capital
a. TIER 1 CAPITAL
i. Fundamental Tier 1 capital
Ordinary shares 5,353 5,353
Reserves (68) (84)
Non-controlling interests 181 163
Retained earnings (887) (795)
Excess technical provisions (net of tax)(a) 665 381
ii. Residual Tier 1 capital(e)
Hybrid equities 917 451
iii. Deductions from Tier 1 capital(b)
Treasury shares held in trust(c) (29) (32)
Goodwill (1,625) (1,644)
Intangible assets (225) (225)
Net deferred tax assets (364) (299)
Other (250) (262)
Total Tier 1 capital 3,668 3,007
b. TIER 2 CAPITAL
Ineligible Tier 1 capital 10 449
Subordinated term notes 710 461
Other 14 16
Total statutory capital 4,402 3,933
II. Minimum capital requirement
Insurance risk 1,495 1,410
Investment risk 886 911
Investment concentration risk(d) - -
Catastrophe concentration risk 150 175
Total minimum capital requirement 2,531 2,496
III. Minimum capital requirement multiple 1.74 1.58
.(a) The excess technical provisions represent the difference between the insurance liabilities incorporating a risk margin (refer to section B.IV of the claims note) on thebalance sheet based on the deferral and matching model and the insurance liabilities incorporating a risk margin equivalent to a probability of adequacy of 75% usedfor regulatory reporting purposes based on the premium liabilities model.
(b) Certain assets that are considered acceptable from an accounting perspective are, from a supervisory perspective, considered to be generally not available or ofreduced value should an insurer encounter difficulties. Holdings of such assets are therefore required to be deducted from the regulatory capital base.
(c) The portion of the treasury shares held in trust that does not meet eligibility criteria under APRA prudential standards.
(d) The investment concentration risk charge is zero reflecting that the holding of particular assets, including reinsurance recoveries, and exposure to a particularcounterparty, are sufficiently diversified for the purposes of the regulatory capital calculations.
(e) APRA currently has a limit of 15% for Innovative Tier 1 securities and a limit of 25% for all Residual Tier 1 securities (i.e. the aggregate of Innovative and Non-innovative Residual Tier 1 securities). As a consequence of replacing the Innovative reset preference shares (RPS) with the Non-innovative convertible preferenceshares (CPS) the full amount of CPS is included in Residual Tier 1 Capital.
106 IAG ANNUAL REPORT 2012
IV. Factors impacting the minimum capital requirement multipleThe Group’s estimated minimum capital requirement multiple (MCR multiple) at 30 June 2012 was 1.74. This compares to 1.58 at 30June 2011. The movement reflects the combined effect of the following: Higher capital base as a result of:
an increase in hybrid equities due to issue of New Zealand subordinated bonds and CPS offset by the redemption of RPS;and
an increase in excess technical provisions primarily due to premium strength by repricing key parts of the business portfolioto recover higher reinsurance and natural peril costs.
The minimum capital requirement increased marginally as a result of:
an increase in the insurance risk charge driven by a combination of GWP growth and the downwards movement in the yieldcurve;
a decrease in the investment risk charge, primarily due to the decreased reinsurance recovery balance as well as the capitalbenefit arising from collateral arrangements; and
a decrease in the catastrophe concentration risk charge following the placement of the 2012 reinsurance program.
The Group retained a capital position in excess of its long term benchmark, which is an MCR multiple of 1.45-1.50 times.
D. CREDIT RATINGKey wholly owned insurers within the Group had the following ratings published by Standard & Poor's (S&P) as at the current reportingdate. S&P reaffirmed these ratings on 16 February 2012.
ENTITY ISSUER CREDIT RATINGFINANCIAL STRENGTH
RATING
Parent
Insurance Australia Group Limited A+/Stable n/a
Licensed insurers
Insurance Australia Limited AA-/Stable AA-/Stable
IAG New Zealand Limited AA-/Stable AA-/Stable
CGU Insurance Limited AA-/Stable AA-/Stable
Swann Insurance (Aust) Pty Ltd AA-/Stable AA-/Stable
IAG Re Labuan (L) Berhad n/a A+/Stable
IAG Re Australia Limited AA-/Stable AA-/Stable
IAG Re Singapore Pte Ltd AA-/Stable AA-/Stable
NOTE 36. NET TANGIBLE ASSETSCONSOLIDATED
2012 2011
$ $
Net tangible assets per ordinary share 1.20 1.23
Net tangible assets per ordinary share has been determined using the net assets on the balance sheet adjusted for non-controllinginterests, intangible assets and goodwill.
NOTE 37. REMUNERATION OF AUDITORSCONSOLIDATED
2012 2011
$000 $000A. KPMG
I. Assurance services
Audit of the financial statements prepared for the Parent and subsidiaries 7,431 6,811
Audit of statutory returns in accordance with regulatory requirements 861 956
Other assurance services 405 438
8,697 8,205
II. Advisory services
In relation to other assurance, taxation and due diligence services 904 1,206
B. OTHER AUDITORS
I. Assurance services
Audit of the financial statements prepared for subsidiaries 57 24
II. Advisory services - 7
Total remuneration of auditors 9,658 9,442
107
NOTE 38. PARENT ENTITY DISCLOSURESThe ultimate parent entity in the Consolidated entity is IAG which is incorporated in Australia. The following information of the Parententity, IAG, is disclosed as required by the current regulatory requirements in Australia.
PARENT
2012 2011
$m $mA. FINANCIAL RESULTS
Profit/(loss) for the year 451 377
Total comprehensive income and (expense) for the year net of tax 449 377
B. FINANCIAL POSITION
Current assets 160 214
Total assets 8,254 7,658
Current liabilities 200 194
Total liabilities 1,853 1,457
C. SHAREHOLDERS' EQUITY
Share capital 5,353 5,353
Reserves (1) -
Retained earnings 1,049 848
Total shareholders' equity 6,401 6,201
Current liabilities exceeded current assets by $40 million as at 30 June 2012, primarily due to a net intercompany payable by theParent entity to its controlled entities. Due to the operation of a significant loan facility between the Parent and its controlled entitiesthe Parent entity has the ability to pay its debts as and when they become due and payable. Total assets of the Parent entity exceededtotal liabilities by $6,401 million.
In July 2012, subsequent to reporting date, an internal restructure of the Group was completed, resulting in all of the Group'sinsurance businesses being directly held by the parent entity, IAG.
D. CONTINGENT LIABILITIESContingent liabilities are not recognised on the balance sheet but are disclosed here where the possibility of settlement is less thanprobable but more than remote. Provisions are not required with respect to these matters as it is not probable that a future sacrificeof economic benefits will be required or the amount is not reliably measurable. If settlement becomes probable, a provision isrecognised. The best estimate of the settlement amount is used in measuring a contingent liability for disclosure. The measurementinvolves judgement.
There are no known material exposures to the Parent or events that would require it to satisfy the guarantees or take action under asupport agreement.
E. COMMITMENTSThe Parent has no material commitments.
NOTE 39. EVENTS SUBSEQUENT TO REPORTING DATEAs the following transactions occurred after reporting date and did not relate to conditions existing at reporting date, no account hasbeen taken of them in the financial statements for the current reporting period ended 30 June 2012.
A. FINAL DIVIDENDOn 23 August 2012, the IAG Board determined to pay a final dividend of 12 cents per share, 100% franked. The dividend will be paidon 3 October 2012. The dividend reinvestment plan will operate by acquiring shares on-market to participants with no discountapplied.
108 IAG ANNUAL REPORT 2012