Embed Size (px)
Citation preview

1
Statement of Accounts
Year Ending 31 March 2012

2
INDEPENDENT AUDITOR’S REPORT TO THE MEMBERS OF ALLERDALE BOROUGH COUNCIL Opinion on the Authority financial statements
I have audited the financial statements of Allerdale Borough Council for the year ended 31
March 2012 under the Audit Commission Act 1998. The financial statements comprise the
Movement in Reserves Statement, the Comprehensive Income and Expenditure Statement,
the Balance Sheet, the Cash Flow Statement and Collection Fund and the related notes. The
financial reporting framework that has been applied in their preparation is applicable law and
the CIPFA/LASAAC Code of Practice on Local Authority Accounting in the United Kingdom
2011/12. This report is made solely to the members of Allerdale Borough Council in accordance with Part II of the Audit Commission Act 1998 and for no other purpose, as set out in paragraph 48 of the Statement of Responsibilities of Auditors and Audited Bodies published by the Audit Commission in March 2010. Respective responsibilities of the Financial Services Manager and auditor As explained more fully in the Statement of the Financial Services Manager’s Responsibilities, the Financial Services Manager is responsible for the preparation of the Statement of Accounts, which includes the financial statements, in accordance with proper practices as set out in the CIPFA/LASAAC Code of Practice on Local Authority Accounting in the United Kingdom, and for being satisfied that they give a true and fair view. My responsibility is to audit and express an opinion on the financial statements in accordance with applicable law and International Standards on Auditing (UK and Ireland). Those standards require me to comply with the Auditing Practices Board’s Ethical Standards for Auditors. Scope of the audit of the financial statements An audit involves obtaining evidence about the amounts and disclosures in the financial statements sufficient to give reasonable assurance that the financial statements are free from material misstatement, whether caused by fraud or error. This includes an assessment of: whether the accounting policies are appropriate to the Authority’s circumstances and have been consistently applied and adequately disclosed; the reasonableness of significant accounting estimates made by the Financial Services Manager; and the overall presentation of the financial statements. In addition, I read all the financial and non-financial information in the explanatory foreword to identify material inconsistencies with the audited financial statements. If I become aware of any apparent material misstatements or inconsistencies I consider the implications for my report. Opinion on financial statements In my opinion the financial statements:
give a true and fair view of the financial position of Allerdale Borough Council as at 31 March 2012 and of its expenditure and income for the year then ended; and
have been prepared properly in accordance with the CIPFA/LASAAC Code of Practice on Local Authority Accounting in the United Kingdom 2011/12.
3
Opinion on other matters In my opinion, the information given in the explanatory foreword for the financial year for which the financial statements are prepared is consistent with the financial statements. Matters on which I report by exception I report to you if:
in my opinion the annual governance statement does not reflect compliance with ‘Delivering Good Governance in Local Government: a Framework’ published by CIPFA/SOLACE in June 2007;
I issue a report in the public interest under section 8 of the Audit Commission Act 1998;
I designate under section 11 of the Audit Commission Act 1998 any recommendation as one that requires the Authority to consider it at a public meeting and to decide what action to take in response; or
I exercise any other special powers of the auditor under the Audit Commission Act 1998.
I have nothing to report in these respects. Conclusion on Authority’s arrangements for securing economy, efficiency and effectiveness in the use of resources Respective responsibilities of the Authority and the auditor The Authority is responsible for putting in place proper arrangements to secure economy, efficiency and effectiveness in its use of resources, to ensure proper stewardship and governance, and to review regularly the adequacy and effectiveness of these arrangements. I am required under Section 5 of the Audit Commission Act 1998 to satisfy myself that the Authority has made proper arrangements for securing economy, efficiency and effectiveness in its use of resources. The Code of Audit Practice issued by the Audit Commission requires me to report to you my conclusion relating to proper arrangements, having regard to relevant criteria specified by the Audit Commission. I report if significant matters have come to my attention which prevent me from concluding that the Authority has put in place proper arrangements for securing economy, efficiency and effectiveness in its use of resources. I am not required to consider, nor have I considered, whether all aspects of the Authority’s arrangements for securing economy, efficiency and effectiveness in its use of resources are operating effectively. Scope of the review of arrangements for securing economy, efficiency and effectiveness in the use of resources I have undertaken my audit in accordance with the Code of Audit Practice, having regard to the guidance on the specified criteria, published by the Audit Commission in October 2011, as to whether the Authority has proper arrangements for:
securing financial resilience; and
challenging how it secures economy, efficiency and effectiveness. The Audit Commission has determined these two criteria as those necessary for me to consider under the Code of Audit Practice in satisfying myself whether the Authority put in place proper arrangements for securing economy, efficiency and effectiveness in its use of resources for the year ended 31 March 2012.

4
I planned my work in accordance with the Code of Audit Practice. Based on my risk assessment, I undertook such work as I considered necessary to form a view on whether, in all significant respects, the Authority had put in place proper arrangements to secure economy, efficiency and effectiveness in its use of resources. Conclusion On the basis of my work, having regard to the guidance on the specified criteria published by the Audit Commission in October 2011, I am satisfied that, in all significant respects, Allerdale Borough Council put in place proper arrangements to secure economy, efficiency and effectiveness in its use of resources for the year ended 31 March 2012.
Delay in certification of completion of the audit
I cannot formally conclude the audit and issue an audit certificate until I have completed the work necessary to address an objection. I am satisfied that this work does not have a material effect on the financial statements or on my value for money conclusion. Gina Martlew Appointed Auditor
September 2012
Audit Commission, Aspinall House, Aspinall Close, Middlebrook Bolton, BL6 6QQ

5
Allerdale Borough Council
Statement of Accounts 2011/2012
Contents
Section 1:-
Explanatory Foreword .......................................................................................................... 7
Statement of Responsibilities for the Statement of Accounts .................................................
Section 2: -
Core Financial Statements
Movement in Reserves …………………………………………………………………..............18
Comprehensive Income and Expenditure Statement…………………………………………
Balance Sheet………………………………………………………………………………..........21
Cash Flow Statement ......................................... …………………………………………………
Section 3: - The following notes are included in the accounts to aid the reader in the interpretation of the Core Financial Statement
Notes to the Financial Statement……………………………………………………….............23
Note 1 Accounting Policies…………………………………………………................23
Note 2 Critical Judgement in applying Accounting Policies…………….................44
Note 3 Assumptions made about the future and other major sources of
estimation uncertainty ………………………………………………... ……....45
Note 4 Adjustments between Accounting basis and Funding basis under Regulations ……………………………………………………………………..46
Note 5 Usable Reserves ……………………………………………………………….50
Unusable Reserves……………………………………………………………..53
Note 6 Reconciliation of Income and Expenditure Deficit to the Net Cash flow
from Operating Activities …………………………………………….. ……… 56
Note 7 Summary of all Property, Plant and Equipment …………………………… 59
Note 8 Capital Expenditure and Financing …………………………..………………76
Note 9 Commitments under Capital Contracts……………………………………….76
Note 10 Long Term Debtors …………………………………………………………… 77
Note 11 Debtors and Payments in Advance…………………………………………...77
Note 12 Inventories ……………………………………………………………………... 77
Note 13 Long Term Creditors ………………………………………………………….. 78

6
Note 14 Creditors and Receipts in Advance …………………………………………. 78
Note 15 Cash and Cash Equivalents ………………………………………………….78
Note 16 Investments………………………………………………………………….. 79
Note 17 External Borrowing …………………………………………………………… 79
Note 18 Financial Instruments ………………………………………………………… 80
Note 19 Trading Concerns …………………………………………………………….. 87
Note 20 Audit Costs ……………………………………………………………………. 88
Note 21 Members Allowances and Officers Remuneration ………………………. 89
Note 22 Related Party Transactions …………………………………………………. 92
Note 23 Leases ………………………………………………………………………… 93
Note 24 Service Expenditure Analysis ………………………………………………. 95
Note 25 Reconciliation to Net Cost of Services in the Comprehensive
Income and Expenditure Statement ……………………………………….. 96
Note 26 Reconciliation to Subjective Analysis …………………………………….. 97
Note 27 Provisions …………………………………………………………………….. 98
Note 28 Future Accounting Standards disclosure ………………………………… 99
Note 29 Pensions ………………………………………………………………………100
Note 30 Interest in Companies ……………………………………………………….104
Note 31 Trust Funds ………………………………………………………………….. 105
Note 32 Contingent Assets and Liabilities …………………………………………. 105
Note 33 Capital Grants Credited to Taxation and Non-Specific Grant Income …107
Note 34 Capital Receipts arising other than from Disposal of Fixed Asset ……. 108
Note 35 Major Items of Income and Expense………………………………………108
Note 36 Events after the Balance Sheet Date ……………………………………..108
Section 4: -
Supplementary Financial Statements
Collection Fund……………………………………………………………………….………… Notes to Collection Fund Account……………………………………………………………. 110 Section 5: - Other Statements Annual Governance Statement ……….………………………………………………………112
Glossary ……………………………………………………………………………………….. 126

7
Explanatory Foreword
1 Introduction to the Statement of Accounts 1.1 I am pleased to introduce Allerdale Borough Council’s Statement of Accounts for
2011/12, which summarises our financial affairs for the year from 1 April 2011 to 31 March 2012. The purpose of this foreword is to identify the key issues which the Council has faced through the past financial year and to give a narrative to help explain these. I have also looked forward to the future and explained the challenges that lie ahead for Allerdale and the plans to address these challenges.
1.2 Background to the Statements This is the second year in which the Council’s Statement of Accounts has been prepared on an International Financial Reporting (IFRS) basis. The main change in disclosures within the Accounts relate to the reporting of Heritage Assets. These are assets which have historical or artistic qualities and are held and maintained principally for their contribution to knowledge and culture. The overall value of the Council’s Heritage Assets at the end of the reporting period has been estimated at £924,000 and is shown separately on the balance sheet with an accompanying note.
1.3 Main Financial Statements
The Statement of Accounts comprises core financial statements and related notes along with supplementary financial statements. The core statements are as follows:-
The Statement of Responsibilities for the Statement of Accounts (page 17) This sets out the responsibilities of both the Council and its responsible Finance Officer for the preparation of the accounts. Movement in Reserves Statement (page 18) This statement shows the movement in the year on the different reserves held by the authority, analysed into ‘usable reserves’ (i.e. those that can be applied to fund expenditure or reduce local taxation) and other reserves. The Surplus or (Deficit) on the Provision of Services line shows the true economic cost of providing the authority’s services, more details of which are shown in the Comprehensive Income and Expenditure Statement. These are different from the statutory amounts required to be charged to the General Fund Balance for council tax setting purposes. The Net Increase/ Decrease before Transfers to Earmarked Reserves line shows the statutory General Fund Balance before any discretionary transfers to or from earmarked reserves undertaken by the Council.

8
The Comprehensive Income and Expenditure Account (page 20) This statement shows the accounting cost in the year of providing services in accordance with generally accepted accounting practices, rather than the amount to be funded from taxation. Authorities raise taxation to cover expenditure in accordance with regulations; this may be different from the accounting cost. The taxation position is shown in the Movement in Reserves Statement. Balance Sheet (page 21) The Balance Sheet shows the value as at the Balance Sheet date of the assets and liabilities recognised by the authority. The net assets of the authority (assets less liabilities) are matched by the reserves held by the authority. Reserves are reported in two categories. The first category of reserves are usable reserves, i.e. those reserves that the authority may use to provide services, subject to the need to maintain a prudent level of reserves and any statutory limitations on their use. The second category of reserves includes reserves that hold unrealised gains and losses. (For example Revaluation Reserve), where amounts would only become available to provide services if the assets are sold; and reserves that hold timing differences shown in the Movement in Reserves Statement line ‘Adjustments between accounting basis and funding basis under regulations’. Cash Flow Statement (page 22) This statement shows the changes in cash and cash equivalents of the authority during the reporting period. The statement shows how the authority generates and uses cash and cash equivalents by classifying cash flows as operating, investing and financing activities. The amount of cash flows arising from operating activities is a key indicator of the extent to which the operations of the authority are funded by way of taxation and grant income or from recipients of services provided by the authority. Investing activities represent the extent to which cash outflows have been made for resources which are intended to contribute to the authority’s future service delivery. Cash flows arising from financing activities are useful in predicting claims on future cash flows by providers of capital (i.e. borrowing) to the authority. Supplementary Financial Statements: Collection Fund (page 109) - this statement reflects the statutory obligation for billing authorities to maintain a separate Collection Fund. The statement shows the transactions of the authority in relation to the collection from taxpayers and distribution to local authorities and the Government of council tax and non-domestic rates. Annual Governance Statement – the Annual Governance Statement sets out the arrangements put in place by the Council to ensure legislative requirements, governance principles and management processes are within the law and proper standards, and that public money is safeguarded, properly accounted for, and used economically, efficiently and effectively.

9
1.4 Accounting for Non-Current Assets
o For 2011/12 the Council is required to change its accounting policy for Heritage Assets and recognise them at valuation, or in certain circumstances, at cost (depreciated where appropriate). Previously, Heritage Assets were either recognised as infrastructure assets or community assets (at cost) in the property, plant and equipment classification in the balance sheet or were not recognised on the balance sheet as cost information on the assets was not available.
The Councils accounting policies for recognition and measurement of Heritage Assets are set out in the Authority’s summary of significant accounting policies (see Note 11 on pages 31-33)
2. General Fund 2.1 The Council’s expenditure and income are defined either as revenue or capital.
Revenue is spending on, or income from, the day to day running of services. Net General Fund expenditure is met from the following sources: Government Grants National Non- Domestic Rates, collected locally and redistributed nationally Revenue Support Grant Collection Fund Collection Fund surpluses, arising from better than expected collection rates Council Tax collected from the borough’s residents General Fund Balances Earmarked Reserves
2.2 Issues during 2011/12 and Economic Outlook for 2012/13 2.2.1 The national and international economic climate, together with pressure to
significantly reduce public sector spending, continued to provide a very challenging financial environment for the Council during 2011/12.
2.2.2 Interest rates have continued at their low levels and levels of inflation have been
higher than originally forecast. 2.2.3 The effects of the economic climate on the values of Council owned property are
reflected in the accounts each year. The most significant change in property values reflected in these accounts related to the Council’s investment properties, which have been re-valued downwards by £9.0 million.
2.2.4 Following the Borough Council elections in May 2011, the control of the Council was
passed to the Labour group and a new Executive was appointed.

10
2.2.5 A new Council Plan was agreed and four specific priority areas were identified. These priority areas are those to which the Council will give extra attention
Reducing poverty
Economic Development
Town Centres
Sports, Arts and Leisure
2.2.6 During the year this Council, together with the County Council, has ensured the smooth handover of Derwent Forest for development.
2.2.7 Options for the successful future of the Carnegie Theatre have been looked at and it has been agreed to establish a Carnegie Project Board to undertake a detailed evaluation of the likely benefits of a transfer to a non-profit distributing organisation.
2.2.8 The medium term forecast has identified savings required of £3.5 million and a strategic approach has been adopted to approach this challenge. A Reducing Spend programme has been developed which considers spending under six headings and uses these headings, plus the generation of additional income to agree target reductions in each area.
2.2.9 The target savings by category can be summarised as follows:-
Target Reductions
£’s
Building Maintenance & Operational Costs 100,000
Management Structures 200,000
Administration Review 200,000
Efficiencies 500,000
Re-negotiate Contracts 1,000,000
Income Generation 200,000
Service Reductions 1,300,000
TOTAL TARGET SAVINGS
3,500,000
2.2.10 During 2011/12 a number of savings options have been developed and a restructure of the senior management team was proposed and agreed. A number of other staff restructures were agreed and these are currently on-going.
2.2.11 Looking forward the Council will continue to face significant financial challenges. There are currently a number of new initiatives that the government is either consulting on, or has proposals for. These initiatives are likely to have a significant impact on the Council and include:-
Business Rates Retention
Localising support for council tax
Technical reforms of council tax
Housing benefits reforms
New Homes Bonus
11
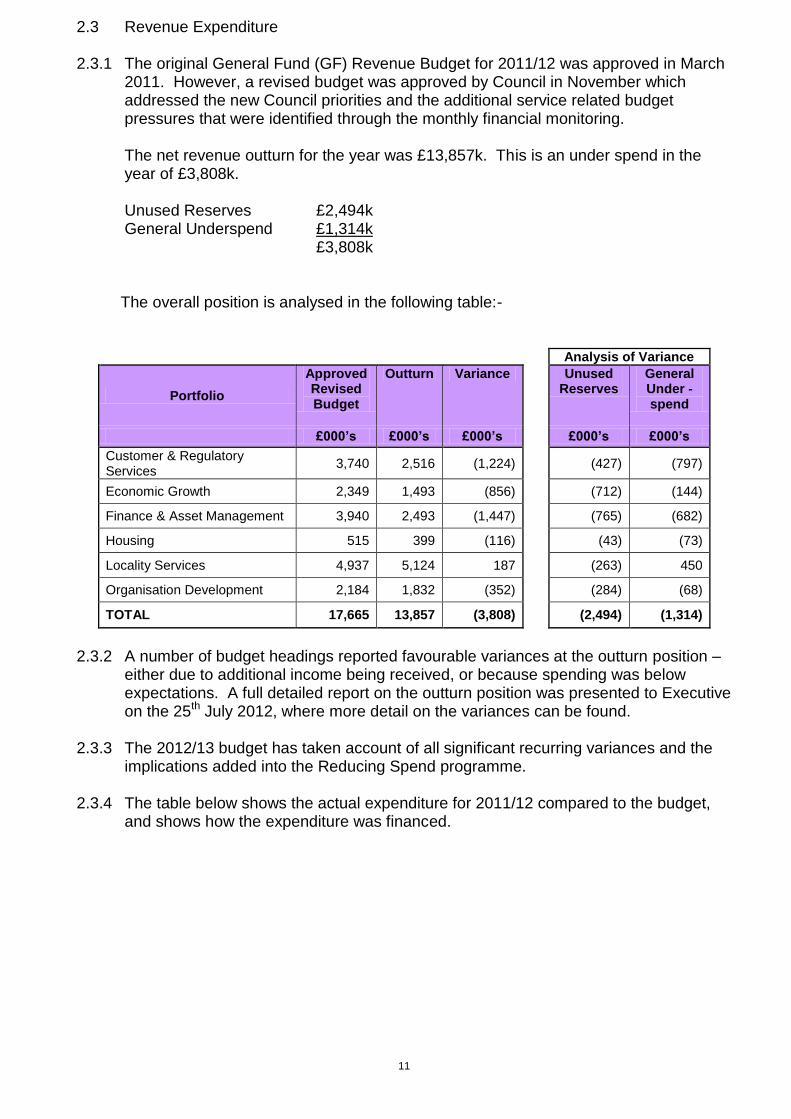
2.3 Revenue Expenditure
2.3.1 The original General Fund (GF) Revenue Budget for 2011/12 was approved in March 2011. However, a revised budget was approved by Council in November which addressed the new Council priorities and the additional service related budget pressures that were identified through the monthly financial monitoring.
The net revenue outturn for the year was £13,857k. This is an under spend in the
year of £3,808k. Unused Reserves £2,494k General Underspend £1,314k £3,808k
The overall position is analysed in the following table:-
Analysis of Variance
Portfolio
Approved Revised Budget
Outturn Variance Unused Reserves
General Under -spend
£000’s £000’s £000’s £000’s £000’s
Customer & Regulatory Services
3,740 2,516 (1,224)
(427) (797)
Economic Growth 2,349 1,493 (856) (712) (144)
Finance & Asset Management 3,940 2,493 (1,447) (765) (682)
Housing 515 399 (116) (43) (73)
Locality Services 4,937 5,124 187 (263) 450
Organisation Development 2,184 1,832 (352) (284) (68)
TOTAL 17,665 13,857 (3,808) (2,494) (1,314)
2.3.2 A number of budget headings reported favourable variances at the outturn position –
either due to additional income being received, or because spending was below expectations. A full detailed report on the outturn position was presented to Executive on the 25th July 2012, where more detail on the variances can be found.
2.3.3 The 2012/13 budget has taken account of all significant recurring variances and the
implications added into the Reducing Spend programme. 2.3.4 The table below shows the actual expenditure for 2011/12 compared to the budget,
and shows how the expenditure was financed.

12
Summary Position against Budget – 2011/12
Original
Budget
Revised
BudgetActual Variance
£'000 £'000 £'000 £'000
EXPENDITURE
Net expenditure on services 13,489 13,661 12,347 (1,314)
Earmarked Reserves 2,554 2,766 272 (2,494)
Net Parish Precepts 1,238 1,238 1,238 0
17,281 17,665 13,857 (3,808)
Council Tax Freeze Grant (112) (112) (114) (2)
17,169 17,553 13,743 (3,810)
FINANCING
Government Grants
- National Non Domestic Rates 6262 6262 6262 0
- Revenue Support Grant 1936 1936 1936 0
- New Homes Bonus 0 0 84 84
Collection Fund 0
- Collection Fund Surplus 84 84 84 0
- Council Tax 5804 5804 5804 0
General Fund Balances 529 484 124 *1 (360)
Earmarked Reserves 2,554 2,983 (551) *2 (3,534)
17,169 17,553 13,743 (3,810)
*1 Use of GF Balances *2 Use of Earmarked Reserves
Outturn 13,857,434
Movement in Reserves
Carry forward requests year end 379,913 Carry forward requests year end (379,913)
Additional contributions in year 146,471 Additional contributions in year (146,471)
Redundancy and Flood Scheme 1,100,000 Redundancy and Flood Scheme (1,100,000)
Expenditure from reserves (798,720) Expenditure from reserves 798,720
Released from reserves (277,329) Released from reserves 277,329
Council Tax Freeze grant - not service specific(114,161)
Financed by:-
RSG (1,935,565)
NNDR (6,261,880)
New Homes bonus (84,178)
Council Tax (5,887,849)
Use of GF Balances 124,136 Total Movement Earmarked (550,335)

13
Earmarked Reserves At the beginning of 2011/12 the Council had earmarked reserves totalling £3,009k. The reserves are created from past events that have allowed monies to be set-aside, such as budget carry forward requests or surpluses on budgets. The movement and reasons for this change can be summarised as follows:-
Movement on Earmarked Reserves during 2011/12
£'000 £'000
Opening Balance
Planned Expenditure 2011/12 (2,766)
Retained Reserves (243)
(3,009)
Contributions from Reserves
Transfers between Reserves 191
Released for planned expenditure 585
Additional Contributions from Reserve 214
990
Contributions to Reserves
Transfers between Reserves (191)
Budget Carry Forwards (380)
Additional Contributions to Reserve (147)
(718)
272
Additional Contributions to Reserve (1,100)
(1,100)
Released by SMT 60
Released to Support Budget 217
Released to cover Capital Expenditure 277
(823)
Total Revenue Movement in Reserves (551)
Released to cover Capital Expenditure 17
Total Movement in Reserves (534)
Closing Balance (3,543)
3. Capital Expenditure

14
Capital expenditure covers expenditure on long term projects, such as acquisition, improvement and enhancement of our assets. The table below shows capital expenditure for all services in 2011/12 compared to budget, and also shows where the expenditure was financed from. The revised budget reflects uncompleted schemes that have been carried forward from the previous year.
Original Budget
B/F from 2010/11
Additions / Reductions
Revised Budget
Planned carry
forward to 2012/13
Actual spend
2011/12
Variance
£'000 £’000 £’000 £'000 £’000 £’000 £’000
Expenditure
Private Sector Housing 427 1,005 159 1,591 722 518 351(*) Asset Management 28 663 1,870 2,561 2,371 29 161
Regeneration 0 232 (46) 186 91 95 0
Leisure 0 33 33 33 0 Information technology 354 69 423 164 158 101
809 2,002 1,983 4,794 3,381 800 613
Financing
Borrowing - Unsupported 0 0 0 0 0
Grants 427 1,387 1,968 3,782 2,669 586 527
Contributions 205 36 241 99 87 55
Capital Receipts 138 579 15 732 613 94 25
Revenue and Reserves 39 39 0 33 6
809 2,002 1,983 4,794 3,381 800 613
(*) Underspend on Private Sector Housing of £351k is to be carried forward with the £722k into 2012/13.
4. Collection Fund
4.1 Council Tax and National Non-Domestic Rates are collected and paid into the
Collection Fund. Payments are made from the fund to the National Business Rate Pool (for redistribution to local authorities nationally), and to Cumbria County Council, Cumbria Police Authority, and Parish Councils in the borough, and Allerdale Borough Council (General Fund) through precepts.
4.2 For 2011/12, Band D Council Tax was set at £1,499.56 (excluding parish precepts),
comprising the following:- £ Allerdale Borough Council 144.17 Cumbria County Council 1,161.50 Cumbria Police Authority 193.89 _______ 1,499.56
15
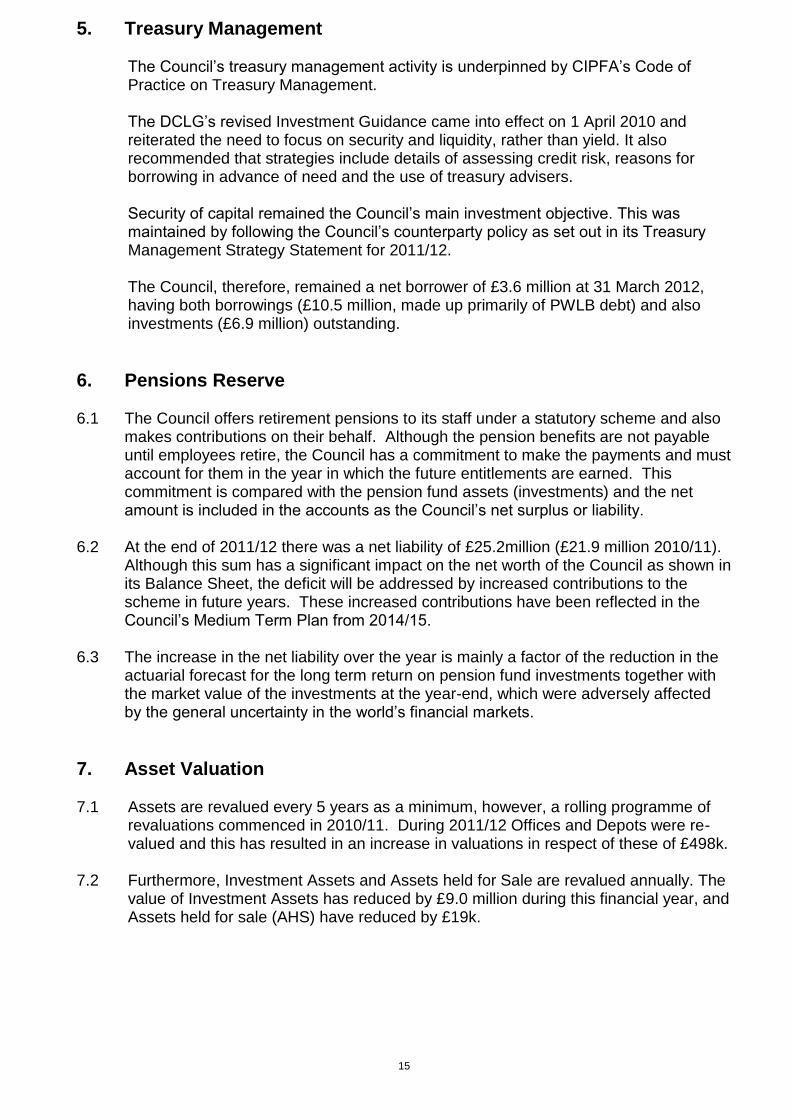
5. Treasury Management
The Council’s treasury management activity is underpinned by CIPFA’s Code of Practice on Treasury Management. The DCLG’s revised Investment Guidance came into effect on 1 April 2010 and reiterated the need to focus on security and liquidity, rather than yield. It also recommended that strategies include details of assessing credit risk, reasons for borrowing in advance of need and the use of treasury advisers. Security of capital remained the Council’s main investment objective. This was maintained by following the Council’s counterparty policy as set out in its Treasury Management Strategy Statement for 2011/12. The Council, therefore, remained a net borrower of £3.6 million at 31 March 2012, having both borrowings (£10.5 million, made up primarily of PWLB debt) and also investments (£6.9 million) outstanding.
6. Pensions Reserve 6.1 The Council offers retirement pensions to its staff under a statutory scheme and also
makes contributions on their behalf. Although the pension benefits are not payable until employees retire, the Council has a commitment to make the payments and must account for them in the year in which the future entitlements are earned. This commitment is compared with the pension fund assets (investments) and the net amount is included in the accounts as the Council’s net surplus or liability.
6.2 At the end of 2011/12 there was a net liability of £25.2million (£21.9 million 2010/11).
Although this sum has a significant impact on the net worth of the Council as shown in its Balance Sheet, the deficit will be addressed by increased contributions to the scheme in future years. These increased contributions have been reflected in the Council’s Medium Term Plan from 2014/15.
6.3 The increase in the net liability over the year is mainly a factor of the reduction in the
actuarial forecast for the long term return on pension fund investments together with the market value of the investments at the year-end, which were adversely affected by the general uncertainty in the world’s financial markets.
7. Asset Valuation 7.1 Assets are revalued every 5 years as a minimum, however, a rolling programme of
revaluations commenced in 2010/11. During 2011/12 Offices and Depots were re-valued and this has resulted in an increase in valuations in respect of these of £498k.
7.2 Furthermore, Investment Assets and Assets held for Sale are revalued annually. The value of Investment Assets has reduced by £9.0 million during this financial year, and Assets held for sale (AHS) have reduced by £19k.

16
8. Material events after the Balance Sheet date
From 31st March 2012 until the release of these accounts, the council has considered whether any significant event require disclosure. None have been identified.
9. Significant Change in Accounting Policy
Heritage Assets For 2011/12, the adoption of FRS 30 Heritage Assets in the Code is a change of accounting policy. This requires the publication of a Balance Sheet as at the beginning of the earliest comparative period (i.e. a third balance sheet) in the 2011/12 financial statements where the restatement for the measurement of Heritage Assets is material. In addition, the disclosures required by section 4.10.4 of the Code shall be provided for the comparative year in the 2011/12 financial statements.
Further information about the accounts is available from:
Catherine Nicholson
Financial Services Manager Allerdale House
New Bridge Road Workington
Cumbria CA14 3YJ

17
Statement of Responsibilities for the Statement of Accounts
Allerdale Borough Council’s Responsibilities The Authority is required to:
Make arrangements for the proper administration of its financial affairs and to secure that one of its officers has the responsibility for the administration of those affairs. In this authority, that officer is the Financial Services Manager.
Manage its affairs to secure economic, efficient and effective use of resources and safeguard its assets.
Approve the Statement of Accounts. In this Authority, that function is delegated to the Audit Committee.
Signed: Councillor Ashley Moore Dated: 28 September 2012
Audit Committee Chairman
The Financial Services Manager’s Responsibilities The Financial Services Manager is responsible for the preparation of the Authority’s Statement of Accounts in accordance with proper practices as set out in the CIPFA/LASAAC Code of Practice on Local Authority Accounting in the United Kingdom (the Code). In preparing this Statement of Accounts, the Financial Services Manager has:
Selected suitable accounting policies and then applied them consistently
Made judgements and estimates that were reasonable and prudent
Complied with the local authority Code.
The Financial Services Manager has also:
Kept proper accounting records which were up to date
Taken reasonable steps for the prevention and detection of fraud and other irregularities.
Having undertaken the above, the Financial Services Manager is satisfied that the statement of accounts presents a true and fair view of the financial position of the Council and its income and expenditure for the year ended 31
st March 2012.
Signed: Catherine Nicholson Dated: 28 September 2012 Financial Services Manager

18
Movement in Reserves Statement This Statement shows the movement in the year on the different reserves held by the authority, analysed into ‘usable reserves’ (i.e. those that can be applied to fund expenditure or reduce taxation) and ‘other reserves’. The ‘Surplus or (Deficit) on the provision of services’ line shows the true economic cost of providing the authority’s services, more details of which are shown in the Comprehensive Income and Expenditure Statement. These are different from the statutory amounts required to be charged to the General Fund Balance for Council Tax setting purposes. The ‘Net increase/ decrease before transfers to earmarked reserves’ line shows the statutory General Fund Balance before any discretionary transfers to or from earmarked reserves undertaken by the Council.
2010/11 Note General Earmarked Capital Capital Total Unusable Total
Fund GF Receipts Grants Usable Reserves Authority
Balance Reserves Reserve Unapplied Reserves Reserves
£'000 £'000 £'000 £'000 £'000 £'000 £'000
Balance at 1 April 2010 (Restated)
2,320 6,733 1,451 1,266 11,770 59,394 71,164
Surplus or (deficit) on provision of services (accounting basis)
CI&E (6,277) 0 0 0 (6,277) 0 (6,277)
Other Comprehensive Income and (Expenditure)
CI&E 0 0 0 0 0 5,253 5,253
Total Comprehensive Expenditure and Income
(6,277) 0 0 0 (6,277) 5,253 (1,024)
Adjustments between accounting basis & funding basis under regulations
4 6,007 0 (302) (55) 5,650 (5,647) 3
Net Increase /( Decrease) before Transfers to Earmarked Reserves
(270) 0 (302) (55) (627) (394) (1,021)
Transfers to / from Earmarked Reserves
5(i)a 3,724 (3,724) 0 0 0 0 0
Increase / (Decrease) in Year 3,454 (3,724) (302) (55) (627) (394) (1,021)
Balance at 31 March 2011 (Restated)
5,774 3,009 1,149 1,211 11,143 59,000 70,143

19
2011/12 Note General Earmarked Capital Capital Total Unusable Total
Fund GF Receipts Grants Usable Reserves Authority
Balance Reserves Reserve Unapplied Reserves Reserves
£'000 £'000 £'000 £'000 £'000 £'000 £'000
Balance at 1 April 2011 (Restated)
5,774 3,009 1,149 1,211 11,143 59,000 70,143
Surplus or (deficit) on provision of services (accounting basis)
1 (10,957) 0 0 0 (10,957) 0 (10,957)
Other Comprehensive Income and (Expenditure)
2 0 0 0 0 0 (2,439) (2,439)
Total Comprehensive Expenditure and Income
(10,957) 0 0 0 (10,957) (2,439) (13,396)
Adjustments between accounting basis & funding basis under regulations
4 11,367 0 (23) 82 11,426 (11,426) 0
Net Increase /( Decrease) before Transfers to Earmarked Reserves
410 0 (23) 82 469 (13,865) (13,396)
Transfers to / from Earmarked Reserves
5(i)a (534) 534 0 0 0 0 0
Increase / (Decrease) in Year (124) 534 (23) 82 469 (13,865) (13,396)
Balance at 31 March 2012 5,650 3,543 1,126 1,293 11,612 45,135 56,747
2011/12 Note General Earmarked Capital Capital Total Unusable Total
Fund GF Receipts Grants Usable Reserves Authority
Balance Reserves Reserve Unapplied Reserves Reserves
£'000 £'000 £'000 £'000 £'000 £'000 £'000
Balance at 1 April 2011 (Restated)
5,774 3,009 1,149 1,211 11,143 59,000 70,143
Surplus or (deficit) on provision of services (accounting basis)
* (10,552) 0 0 0 (10,552) 0 (10,552)
Other Comprehensive Income and (Expenditure) * 0 0 0 0 0 (2,439) (2,439)
Total Comprehensive Expenditure and Income
(10,552) 0 0 0 (10,552) (2,439) (12,991)
Adjustments between accounting basis & funding basis under regulations
4 10,962 0 (23) 82 11,021 (11,021) 0
Net Increase /( Decrease) before Transfers to Earmarked Reserves
410 0 (23) 82 469 (13,460) (12,991)
Transfers to / from Earmarked Reserves
5b (534) 534 0 0 0 0 0
Increase / (Decrease) in Year (124) 534 (23) 82 469 (13,460) (12,991)
Balance at 31 March 2012 5,650 3,543 1,126 1,293 11,612 45,540 57,152

20
Comprehensive Income and Expenditure Statement This Statement shows the economic cost in the year of providing services in accordance with generally accepted accounting practices, rather than amounts to be funded from taxation. Authorities raise taxation to cover expenditure in accordance with regulations; this may be different from the accounting cost. The taxation position is shown in the Movement in Reserves Statement.
2010/11 2011/12
Exp Restated
Inc Restated
Net Restated Note Exp Inc Net
£'000 £'000 £'000 £’000 £’000 £’000
9,282 (7,696) 1,586 Central Services to the Public 9,465 (8,084) 1,381
7,379 (2,863) 4,516 Cultural and Related Services 6,185 (2,848) 3,337
8,751 (3,132) 5,619 Environmental and Regulatory Services 8,075 (3,173) 4,902
2,129 (967) 1,162 Planning Services 1,857 (779) 1,078
3,032 (3,757) (725) Highways, Roads and Transportation 3,223 (3,626) (403)
27,355 (26,306) 1,049 Housing - Other Housing Services 27,824 (27,030) 794
2,629 (481) 2,148 Corporate & Democratic Core 2,530 (337) 2,193
288 0 288 Non Distributable Costs 96 0 96 (4,326) 0 (4,326) Exceptional Items - Past Services Cost
Pension
0 0 0
339 0 339 Exceptional Items - Redundancy 0 0 0 1,524 (3) 1,521 Services Transferred to Cumbria County
Council – Concessionary Travel
13 0 13
58,382 (45,205) 13,177 Cost Of Services 59,267 (45,878) 13,389
0 0 (36) (Gains) / Losses on Sale of Fixed Assets 7.14 648
0 0 1,158 Precepts paid to Parish Councils 1,238
0 0 120 Revaluation Gain or Loss on Assets held for sale 7.4 19
0 0 1,242 Other Operating Expenditure 0 0 1,905
0 0 737 Interest payable 730
0 0 (130) Interest & Investment Income (125)
47 (268) (221) (Surplus)/ Deficit from Trading undertakings & other operations 19 79 (250) (171)
0 0 8,020 Changes in Fair values of Investment Properties 7.3 9,048
0 0 1,295 Pension Interest Cost and Expected return on Pension Assets 913
9,701 Financing and Investment Income and Expenditure 79 (250) 10,395
0 0 (845) Recognised capital grants and contributions 33.0 (419)
0 0 (5,792) Income from Council Tax (5,916)
0 0 (1,887) Revenue Support Grant (2,134)
0 0 (35) Non service related Grants 0
0 0 (9,285) National Non Domestic Pool (6,262)
0 0 (17,844) Taxation and Non-Specific Grant Income (14,731)
6,276 (Surplus) or Deficit on Provision of Services 10,958
0 0 (2,722) Surplus or Deficit on revaluation of fixed assets (497)
0 0 (2,531) Actuarial (gains) / losses on pension assets / liabilities 2,936
0 0 0 Other Gains/ Losses 0
0 0 (5,253) Other Comprehensive Income and Expenditure 2,439
1,023 Total Comprehensive Income and Expenditure 13,396

21
Balance Sheet as at 31 March 2012
The Balance Sheet shows the value as at the Balance Sheet date of the assets and liabilities recognised by the authority. The net assets of the authority (assets less liabilities) are matched by the reserves held by the authority. Reserves are reported in two categories. The first category of reserves are usable reserves i.e. those reserves that the authority may use to provide services, subject to the need to maintain a prudent level of reserves and any statutory limitations on their use (for example the capital receipts reserve that may only be used to fund capital expenditure or repay debt). The second category of reserves are those that authority is not able to use to provide services. This category of reserves includes reserves that hold unrealised gains and losses (i.e. Revaluation Reserve), where amounts would only become available to provide services if the assets are sold; and reserves that hold timing differences shown in the Movement in Reserves Statement line “Adjustments between accounting basis and funding basis under regulations”.
Balance Sheet as at 31 March 2012
Restatement due to the introduction of Heritage Assets accounting requirements.
Restated Restated Note 31-Mar-12 01-Apr-10 31-Mar-11 £'000
£'000 £'000
52,078 53,428 Property, Plant & Equipment 7.0 51,402
792 868 Heritage Assets 7.2 924
30,240 40,028 Investment Property 7.3 30,981
406 521 Intangible Assets 7.1 423
20 20 Long Term Investments 16 20
100 70 Long Term Debtors 10 53
83,636 94,935 Long Term Assets 83,803
4,574 4,031 Short Term Investments 16 9
55 78 Stock 12 62
7,078 5,568 Short Term Debtors 11 5,043
550 11 Payments in Advance 11 35
840 2,314 Cash and Cash Equivalents 15 6,897
18,300 185 Assets held for sale 7.4 161
31,397 12,187 Current Assets 12,207
(883) (387) Short Term Borrowing 17 (391)
(3,089) (3,027) Short Term Creditors 14 (2,509)
(1,719) (853) Receipts in Advance 14 (528)
(94) (55) Provisions 27 (175)
(5,785) (4,322) Current Liabilities (3,603)
(20) 0 Long Term Creditors 13 0
(229) (653) Provisions 27 (401)
(10,169) (10,128) Long Term Borrowing 17 (10,085)
(27,666) (21,876) Defined Benefit Pension Scheme 29 (25,173)
0 0 Capital Grants Receipt in Advance 0
(38,084) (32,657) Long Term Liabilities (35,659)
71,164 70,143 Net Assets 56,748
11,770 11,143 Usable Reserves 5 (i) 11,613
59,394 59,000 Unusable Reserves 5 (ii) 45,135
71,164 70,143 Total Reserves 56,748
22
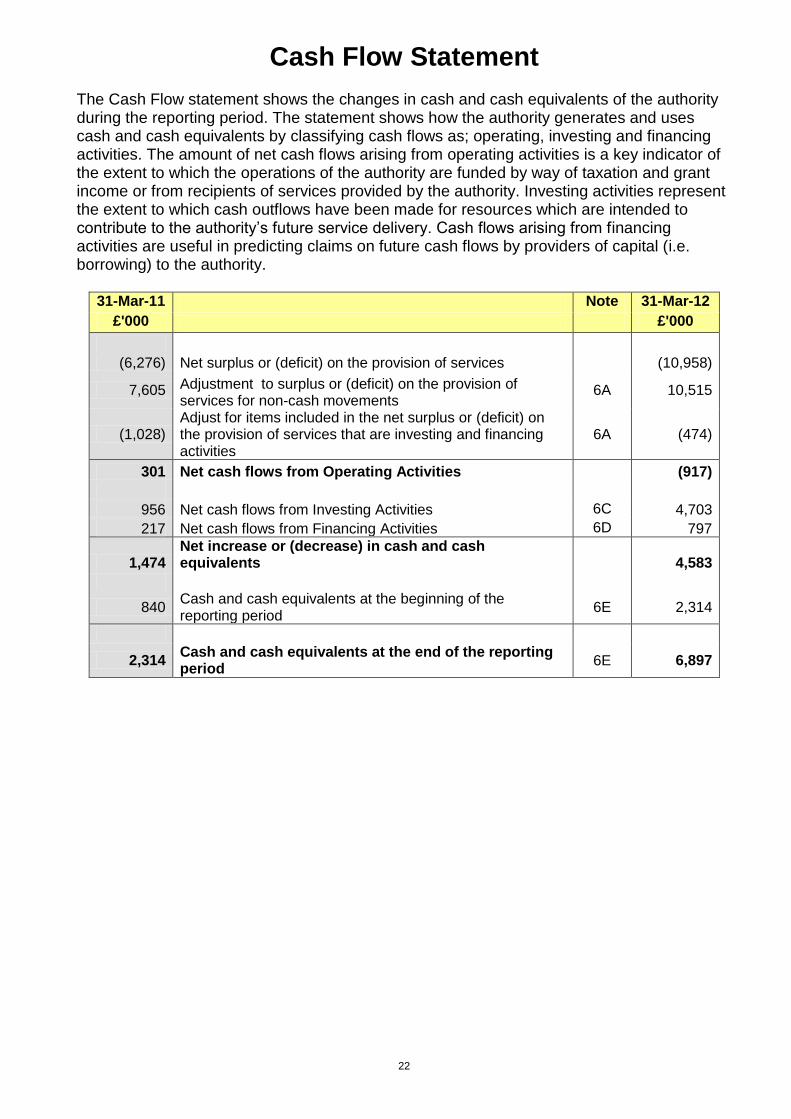
Cash Flow Statement
The Cash Flow statement shows the changes in cash and cash equivalents of the authority during the reporting period. The statement shows how the authority generates and uses cash and cash equivalents by classifying cash flows as; operating, investing and financing activities. The amount of net cash flows arising from operating activities is a key indicator of the extent to which the operations of the authority are funded by way of taxation and grant income or from recipients of services provided by the authority. Investing activities represent the extent to which cash outflows have been made for resources which are intended to contribute to the authority’s future service delivery. Cash flows arising from financing activities are useful in predicting claims on future cash flows by providers of capital (i.e. borrowing) to the authority.
31-Mar-11 Note 31-Mar-12
£'000 £'000
(6,276) Net surplus or (deficit) on the provision of services (10,958)
7,605 Adjustment to surplus or (deficit) on the provision of services for non-cash movements
6A 10,515
(1,028) Adjust for items included in the net surplus or (deficit) on the provision of services that are investing and financing activities
6A (474)
301 Net cash flows from Operating Activities (917)
956 Net cash flows from Investing Activities 6C 4,703
217 Net cash flows from Financing Activities 6D 797
1,474 Net increase or (decrease) in cash and cash equivalents
4,583
840 Cash and cash equivalents at the beginning of the reporting period
6E 2,314
2,314 Cash and cash equivalents at the end of the reporting period
6E 6,897

23
Notes to Financial Statements
1. Statement of Accounting Policies
1) General Principles
The Statement of Accounts summarised the Council’s transactions for the 2011/12 financial year and its position at the year-end of 31st March 2012. The Council is required to prepare an annual Statement of Accounts by the Accounts and Audit (England) Regulations 2011, which those regulations require to be prepared in accordance with proper accounting practices. These practices primarily comprise the Code of Practice on Local Authority Accounting in the United Kingdom 2011/12, and the Service Reporting Code of Practice 2010-11, supported by International Financial Reporting Standards (IFRS). The accounting convention adopted in the Statement of Accounts is principally historical cost, modified by the revaluation of certain categories of non-current assets and financial instruments.
2) Accruals of Income and Expenditure
Activity is accounted for in the year that it takes place, not simply when cash payment are made or received. In particular:
Fees, charges and rents due from customers are accounted for as income at the date the Council provides the relevant goods or services.
Supplies are recorded as expenditure when they are consumed – when there is a gap between the date supplies are received and their consumption; they are carried as stock on the Balance Sheet. An exception occurs in respect of payments for energy and other similar quarterly payments, which are charged at the date of the meter reading rather than being apportioned between financial years. This process is consistently applied each year and therefore does not have a material effect on the year’s accounts.
Interest receivable on investments and payable on borrowings is accounted for respectively as income and expenditure on the basis of the effective interest rate for the relevant financial instrument rather than the cash flows fixed or determined by the contract.
Where revenue and expenditure have been recognised but cash has not been received or paid, a debtor or creditor for the relevant amount is recorded in the Balance Sheet. Where debts may not be settled, the balance of debtors is written down and a charge made to revenue for the income that might not be collected.
24
3) Cash and Cash Equivalents Cash is represented by cash in hand and deposits with financial institutions repayable without penalty on notice of not more than 24 hours. Cash equivalents are highly liquid investments with maturities of 3 months or less at acquisition and that are readily convertible to known amounts of cash with insignificant risk of change in value. In the Cash Flow Statement, cash and cash equivalents are shown net of bank overdrafts that are repayable on demand and form an integral part of the Authority’s cash management.
4) Exceptional Items
When items of income and expense are material, their nature and amount is disclosed separately, either on the face of the Comprehensive Income and Expenditure Statement or in the notes to the accounts, depending on how significant the items are to understand the Authority’s financial performance.
5) Prior Period Adjustments, Changes in accounting Policies and Estimates and Errors
Prior period adjustments may arise as a result of a change in accounting policies or to correct a material error. Changes in accounting estimates are accounted for prospectively, i.e. in the current and future years affected by the change and do not give rise to a prior period adjustment. Changes in accounting policies are only made when required by proper accounting practices or the change provides more reliable or relevant information about the effects of transactions, other events and conditions on the Authority’s financial position or financial performance. Where a change is made, it is applied retrospectively (unless otherwise stated) by adjusting opening balances and comparative amounts for the prior periods as if the new policy had always been applied. Material errors discovered in prior period figures are corrected retrospectively by amending opening balances and comparative amounts for the prior period.

25
6) Charges to Revenue for Non-current Assets
Services, support services and trading accounts are debited with the following amounts to record the real cost of holding fixed assets during the year:
depreciation attributable to the assets used by the relevant service
revaluation and impairment losses on assets used by the service where there are no accumulated gains in the Revaluation Reserve against which they can be written off
amortisation of intangible assets attributable to the service. The Council is not required to raise council tax to fund depreciation, revaluation or impairment losses or amortisations. However, it is required to make an annual contribution from revenue towards the reduction in its overall borrowing requirement which is considered to be prudent. This is known as the Minimum Revenue Provision. Depreciation, impairment losses and amortisations are therefore replaced by revenue provision in the Movement in Reserves Statement, by way of an adjusting transaction with the Capital Adjustment Account for the difference between the two.
7) Employee Benefits Benefits payable during Employment
Short-term employee benefits are those due to be settled within 12 months of the year-end. Salaries, wages and other employment related payments are recognised as an expense for services in the year in which employees render service to the Council. An accrual is made for the cost of holiday entitlements earned by employees but not taken before the year-end which employees can carry forward into the next financial year.
Termination Benefits Termination benefits are amounts payable as a result of a decision by the Council to terminate an officer’s employment before the normal retirement date or an officer’s decision to accept voluntary redundancy and are charged on an accruals basis to the appropriate service in the Comprehensive Income and Expenditure Statement when the Council is demonstrably committed to the termination of the employment of an officer or group of officers or making an officer to encourage voluntary redundancy.
Post-Employment Benefits
Employees of the Council are members of the Local Government Pensions Scheme administered by Cumbria County Council. The scheme is a defined benefits scheme meaning that the scheme provides retirement lump sums and pensions earned as employees work for the Council and uses the following principles for accounting:

26
The liabilities of the Cumbria County Council pension scheme attributable to the Council are included in the Balance Sheet on an actuarial basis using the projected unit method – i.e. an assessment of the future payments that will be made in relation to retirement benefits earned to date by employees, based on assumptions about mortality rates, employee turnover rates, etc, and projections of projected earnings for current employees.
Liabilities are discounted to their value at current prices, using a discount rate prescribed by the scheme actuary.
The assets of the Cumbria County Council pension fund attributable to the Council are included in the Balance Sheet at their fair value:
o quoted securities – current bid price o unquoted securities – professional estimate o unitised securities – current bid price o property – market value
The change in the net pensions liability is analysed into seven components:
a) current service cost – the increase in liabilities as a result of years of service earned earlier this year – allocated in the Comprehensive Income and Expenditure Statement to the services for which the employees worked.
b) past service cost – the increase in liabilities arising from current year
decisions whose effect relates to years of service earned in earlier years – debited to the Surplus or Deficit on the Provision of Services in the Comprehensive Income and Expenditure Statement as part of Non Distributed Costs.
c) interest cost – the expected increase in the present value of liabilities during
the year as they move one year closer to being paid – debited to the Financing and Investment Income and Expenditure in the Comprehensive Income and Expenditure Statement.
d) expected return on assets – the annual investment return on the fund
assets attributable to the Council, based on an average of the expected long-term return – credited to the Financing and Investment Income and Expenditure in the Comprehensive Income and Expenditure Statement.
e) gains/losses on settlements and curtailments – the result of actions to
relieve the Council of liabilities or events that reduce the expected future service or accrual of benefits of employees – debited or credited to the Surplus or Deficit on the Provision of Services in the Comprehensive Income and Expenditure Statement as part of the Non Distributed Costs.
f) actuarial gains and losses – changes in the net pensions liability that arise
because events have not coincided with assumptions made at the last actuarial valuation or because the actuaries have updated their assumptions – debited to the Comprehensive Income and Expenditure Statement.

27
g) contributions paid to the Cumbria County Council pension fund – cash paid as employer’s contributions to the pension fund; not accounted for as an expense.
In relation to retirement benefits, statutory provisions require the General Fund Balance to be charged with the amount payable by the Authority to the pension fund or directly to pensioners in the year, not the amount calculated according to the relevant accounting standards. In the Movement in Reserves Statement, this means that there are appropriations to and from the Pensions Reserve to remove the notional debits and credits for retirement benefits and replace them with debits for the cash paid to the pension fund and pensioners and any such amounts payable but unpaid at the year-end. The negative balance that arises on the Pensions Reserve thereby measures the beneficial impact to the General Fund of being required to account for retirement benefits on the basis of cash flows rather than as benefits earned by employees. Discretionary Benefits The Council also has restricted powers to make discretionary awards of retirement benefits in the event of early retirements. Any liabilities estimated to arise as a result of an award to any member of staff are accrued in the year of the decision to make the award and accounted for using the same policies as are applied to the Local Government Pension Scheme.
8) Events after the Balance Sheet Date
Events after the Balance Sheet date are those events, both favourable and unfavourable, that occur between the end of the reporting period and the date when the Statement of Accounts is authorised for issue. Two types of events can be identified: Those that provide evidence of conditions that existed at the end of the reporting period – the Statement of Accounts is not adjusted to reflect such statements Those that are indicative of conditions that arose after the reporting period – the Statement of Accounts are not adjusted to reflect such events, but where a category of events would have a material effect, disclosure is made in the notes of the nature of the events and their estimated financial effect. Events taking place after the date of authorisation for issue are not reflected in the Statement of Accounts.

28
9) Financial Instruments
Financial Liabilities Financial liabilities are recognised on the Balance Sheet when the Council becomes party to the contractual provisions of a financial instrument and are initially measured at Fair value and are carried at their amortised cost. Financial liabilities are derecognised when the liability has been discharged, that is, the liability has been paid or has expired. Annual charges to the Financing and Investment Income and Expenditure line in the Comprehensive Income and Expenditure Statement for interest payable are based on the carrying amount of the liability, multiplied by the effective rate of interest. The effective interest rate is the rate that exactly discounts estimated future cash payments over the life of the borrowing to the amount at which it was originally recognised. For most of the borrowings that the Authority has, this means that the amount presented in the Balance Sheet is the outstanding principal repayable (plus accrued interest); and interest charged to the Comprehensive Income and Expenditure Statement is the amount payable for the year according to the loan agreement. Gains or losses on the repurchase or early settlement of borrowing are credited and debited to the Financing and Investment Income and Expenditure line in the Comprehensive Income and Expenditure Statement in the year of repurchase or settlement. Where premiums and discounts have been charged to the Comprehensive Income and Expenditure Statement, regulations allow the impact on the General Fund Balance to be spread over future years. The Authority has a policy of spreading the gain or loss over the term that was remaining on the loan against which the premium was payable or discount receivable when it was repaid. The reconciliation of amounts charged to the Comprehensive Income and Expenditure Statement to the net charge required against the General Fund Balance is managed by a transfer to or from the Financial Instruments Adjustment Account in the Movement in Reserves Statement.
Financial Assets Financial assets are classified into two types:
i) Loans and Receivables – assets that have fixed or determinable payments but
are not quoted in an active market.
ii) Available-for-sales assets – assets that have a quoted market price and/or do not have fixed or determinable payments.

29
i) Loans and Receivables Loans and receivables are recognised on the Balance Sheet when the Authority becomes a party to the contractual provisions of a financial instrument and are initially measured at fair value. They are subsequently measured at their amortised cost. Annual credits to the Financing and Investment Income and Expenditure line in the Comprehensive Income and Expenditure Statement for interest receivable are based on the carrying amount of the asset multiplied by the effective rate of interest for the instrument. For most of the loans that the Authority has made, this mean as that the amount presented in the Balance Sheet is the outstanding principal receivable (plus accrued interest) and interest credited to the Comprehensive Income and Expenditure Statement is the amount receivable for the year in the loan agreement. When a soft loan is made, a loss is recorded in the Comprehensive Income and Expenditure Statement (debited to the appropriate service) for the present value of interest that will be foregone over the life of the instrument. A soft loan is a loan made at less than market rates. ii) Available-for-sale Assets
Available-for-sale assets are recognised on the Balance Sheet when the Authority becomes a party to the contractual provisions of a financial instrument and are initially measured and carried at fair value. Where the asset has fixed or determinable payments, annual credits to the Financing and Investment Income and Expenditure line in the Comprehensive Income and Expenditure Statement for interest receivable are based on the amortised cost of the asset multiplied by the effective rate of interest for the instrument. Where there are no fixed or determinable payments, income (e.g. dividends) is credited to the Comprehensive Income and Expenditure Statement when it becomes receivable by the Authority.
The Council holds government stocks and private company shares of low value. These are held in the Balance Sheet at historic cost as the marginal difference between this and fair value is not considered material. The fair value position is set out in a note to the accounts. All other assets are maintained in the Balance Sheet at fair value. Values are based on the following principles:
instruments with quoted market prices – the market price
equity shares with no quoted market prices – estimated fair value, for shares acquired from third party. If no reliable estimate can be made, it is measured at cost less impairment.
The gain or loss arising from a change in the fair value of an available for sale asset is recognised in Other Comprehensive Income and taken to the Available for Sale Reserve except for impairment losses, which are recognised in Financing and Investment Income and Expenditure line in the Comprehensive Income and Expenditure Statement. Where assets are identified as impaired because of a likelihood arising from a past event that payments due under the contract will not be made (fixed or determinable

30
payments) or fair value falls below cost, the asset is written down and a charge made to the Financing and Investment Income and Expenditure line in the Comprehensive Income and Expenditure Statement. If the asset has fixed or determinable payments, the impairment loss is measured as the difference between the carrying amount and the present value of the revised future cash flows discounted at the asset’s original effective interest rate. Otherwise, the impairment loss is measured as any shortfall of fair value against the acquisition cost of the instrument (net of any principal repayment and amortisation). Any gains and losses that arise on the derecognition of the asset are credited or debited to the Financing and Investment income and expenditure line in the Comprehensive Income and Expenditure Statement, along with any accumulated gains or losses previously recognised in the Available-for-sale reserve.
Instruments Entered into Before 1 April 2006
The Council entered into a number of financial guarantees that are not required to be accounted for as financial instruments. These guarantees are reflected in the Statement of Accounts to the extent that provisions might be required or a contingent liability note is needed.
10) Government Grants and Contributions Whether paid on account, by instalments or in arrears, government grants and third party contributions and donations are recognised as due to the Authority when there is reasonable assurance that:
The Authority will comply with the conditions attached to the payments, and
The grants or contributions will be received.
Amounts recognised as due to the Council are not credited to the Comprehensive Income and Expenditure Statement until conditions attached to the grant or contribution have been satisfied. Conditions are stipulations that specify that the future economic benefits or service potential embodied in the asset in the form of the grant or contribution are required to be consumed by the recipient as specified, or future economic benefits or service potential must be returned to the transferor. Monies advanced as grants and contributions for which conditions have not been satisfied, are carried in the Balance sheet as creditors. When conditions are satisfied, the grant or contribution is credited to the relevant service line (attributable revenue grants and contributions) or Taxation and Non-specific Grant Income (non-ring fenced revenue grants and all capital grants) in the Comprehensive income and Expenditure Statement. Where capital grants are credited to the Comprehensive Income and Expenditure Statement, they are reversed out to the General Fund Balance in the Movement in Reserves Statement. Where the grant has yet to be used to finance capital expenditure, it is posted to the Capital Grants Unapplied Reserve. Where it has been applied, it is posted to Capital Adjustment Account. Amounts in Capital Grants Unapplied reserve are transferred to the Capital Adjustment Account once they have been applied to fund capital expenditure.

31
11) Heritage Assets
Tangible and Intangible Heritage Assets The Code of Practice on Local Authority Accounting 2011/12 has introduced a change in accounting policy in relation to the treatment of Heritage Assets held by the authority in the 2011/12 financial statements. Heritage Assets are those assets that are held by the authority principally for their cultural, environmental or historical associations. The Council’s Heritage Assets consist of:-
a number of historical sites;
monuments/statues;
nature reserves; and
various collections held within our museums at Maryport Maritime and Helena Thompson (individual registers are maintained by each museum of their collections). Further details of these assets along with the associated recognition and measurement of these are detailed within Note 7 to the financial statements (pages 61 and 65-73). It should be noted that another museum is operated in Keswick by the Keswick Museum & Art Gallery Trust on behalf of the Council, who are the sole trustee of the Registered Charity. The building, contents and collection are owned by the Trust and consequently these assets are reported on their balance sheet. The Council, in its role as sole trustee, has agreed to contribute a sum of £310,000 towards a major redevelopment of this museum for which Heritage Lottery Funding of £1.86 million has been granted. During 2010/11, the Council’s view, which was reported in its’ Financial Statements, was that it would not be cost effective to value the museums collections for the purpose of the requirements under FRS 30, as this would require the services of expert valuers. However, since the Council are now in the process of reviewing the future operations and management of the museums, it was considered necessary to value all of the museum artefacts. This was carried out during March 2012 by Mitchells Antiques & Fine Art Auctioneers and Valuers. Given that the museum artefacts account for the majority of the Council’s Heritage Assets held, it was felt, for completeness, that the remaining Heritage Assets should also be valued through the engagement of the Council’s Valuation Officer enabling disclosure of these Heritage Assets in the 2011/12 financial statements. In addition to the above, an indicative replacement cost was obtained from a commercial supplier for the mayoral chains and ceremonial mace owned by the Council. These will be introduced to the Balance Sheet at this value.

32
Recognition
The Council’s tangible Heritage Assets are those assets with historical, artistic, scientific, technological, geophysical or environmental qualities that are held and maintained principally for their contribution to knowledge and culture’.
The Council’s intangible Heritage Assets are those assets with cultural, environmental, or historical significance. Measurement
In the opinion of the Council Valuation Officer, conventional valuation methods are not generally appropriate for valuing Heritage Assets. This is because they may not have a market for sale, there are not likely to be any comparable sales of similar assets to relate to and they are not capable of producing a cash flow or income but rather are liabilities requiring maintenance. Equally, it is impossible to quantify what economic benefits they generate to the community in terms of attracting tourists, promoting education etc. Where valuation methods cannot be applied it is sufficient for the Council’s Valuation Officer to report that the asset cannot be valued in any meaningful way or to present a negative value to reflect the liability. Given this, the Council’s Heritage Assets in relation to historical sites, aged monuments and nature reserves have not been reported as assets in the balance sheet. The Heritage Asset in relation to the Workington Town Centre clock has been reported in the Council’s balance sheet at cost less depreciation. The Curwen Column, Downies statue, museum collections and civic regalia have been introduced and disclosed in the Balance Sheet at valuation. Information in relation to the different classifications of Heritage Assets, their description, significance and the valuations undertaken are reported and detailed within the Note 7 to the accounts (pages 61 and 65-73 Valuations in relation to the museum collections were undertaken in March 2012 by professional valuers (Mitchells Antiques & Fine Art Auctioneers and Valuers) with reference to appropriate commercial markets including recent transaction information from auctions where similar types of collections are regularly being purchased. The museum items have been grouped and reported in the balance sheet at market value. They have been disclosed as one overall collection regardless of whether the individual items within this collection are less than the Council’s de minimis value of £10,000.
The remaining Heritage Assets reported in the financial statements have been valued by the Council’s Valuation Officer. All valuations have been undertaken during April 2012.
Depreciation The majority of the Council’s tangible Heritage Assets have indefinite lives and therefore the Council does not consider it appropriate to charge depreciation. However where a useful life can be identified, straight line depreciation is applied. Depreciation is provided for in relation to the Council’s intangible Heritage Asset by allocating the value of the asset in the balance sheet to the period expected to benefit from its use. A description of this asset can be found in Note 7.9 to the accounts, page 71.

33
Acquisition, Preservation, Management and Disposal The Council have a responsive repair and maintenance programme in relation to its historical sites, monuments/statues and nature reserves. Acquisitions would only be made as part of a project, such as a town centre redevelopment or as part of a museum exhibition where this supported the cultural, environmental or historical associations of the Borough. To date, no disposals have taken place and it is unlikely this would happen due to the Heritage Assets principally being held in support of increasing knowledge, understanding and appreciation of the historical, artistic, scientific, technological, geophysical and environmental qualities of the Borough of Allerdale. Should a proposal to dispose of a Heritage Asset arise, (excluding museum artefacts for which the policy is detailed below), this would require the authorisation of Council Members. With respect to the Council’s Museums, these are currently managed by independent groups, which are companies limited by guarantee. Following on from reports to the Council by previous Heritage Managers, it was agreed that the Helena Thompson museum needed improvements and enhancements to enable it to maximise its income. The Council has committed £150,000 to this work, which is expected to commence in 2012/13. The museums’ collections are managed by collection care officers and curators as appointed by the group running the museum. To protect the Council interests, it gains support from an independently appointed professional curator who can advise on collection care, maintenance as well as on acquisitions and disposals according to the Council’s Acquisition and Disposal Policy. As is explained in the policy, assets in the collection are only disposed of where, in the opinion of the appointed officer with delegated responsibility, an item does not contribute to the interest and diversity of the Museum’s collection. The Museum groups maintain databases for the collections of Heritage Assets which records the nature, provenance and current location of each asset. Preservation Costs Expenditure which, in the Council’s view, is required to preserve or clearly prevent further deterioration of individual collection items is recognised in the Income and Expenditure account when it is incurred. Revaluation Programme Heritage Assets are revalued where there have been material changes in the value, and as a minimum every five years. Increases in valuations are matched by credits to the Revaluation reserve to recognise unrealised gains. Where decrease in values are identified, they are accounted for by:
Where there is a balance of revaluation gains for the assets in the Revaluation Reserve, the carrying amount of the asset is written down against that balance (up to the amount of the accumulated gains)
Where there is no balance or an insufficient balance in the Revaluation Reserve, the carrying amount of the asset is written down against the relevant service line in the Comprehensive Income and Expenditure Statement.

34
Impairment
The values of Heritage Assets are reviewed at the end of each financial year for evidence of reductions in value e.g. where an item has suffered physical deterioration or breakage or where doubt arise over its authenticity. Where impairment is identified as part of this review or as a result of a valuation exercise, the accounting entries mirror those for Property, Plant and Equipment.
12) Intangible Assets Expenditure on non-monetary assets that do not have physical substance but are controlled by the Authority as a result of past events (e.g. software licences) is capitalised when it is expected that future economic benefits or service potential will flow from the intangible asset to the Authority. Expenditures is capitalised where it can be measured reliably as attributable to the asset and is restricted to that incurred during the development phase (research expenditure cannot be capitalised). Expenditure on the development of websites is not capitalised if the website is solely or primarily intended to promote or advertise the Authority’s goods or services. Intangible assets are initially measured at cost. Amounts are only revalued where the fair value of the assets held by the Council can be determined by reference to an active market. The depreciable amount of an intangible asset is amortised over its useful life in the Comprehensive Income and Expenditure Statement. An asset is tested for impairment wherever there is an indication that the asset might be impaired – any losses recognised are posted to the relevant service line in the Comprehensive Income and Expenditure Statement. Any gain or loss arising on the disposal of an intangible asset is posted to the Other Operating Expenditure line in the Comprehensive Income and Expenditure Statement.
13) Interests in Companies and Other Entities
The Council has reviewed its material interests with external bodies in 2011/12 as required by the Code. This is to identify any subsidiaries, associates and jointly controlled entities. The Council has identified that although its interest in Maryport Developments Ltd falls within the definition of an associate company, this interest is not material. There is no need to comply with the Code, as to both disclosure and accounting principles, if the information is not material to the true and fair view of the financial statements and to the understanding of users. More information on this can be found in Note 30.

35
14) Investment Properties Investment properties are those that are used solely to earn rentals and/or for capital appreciation. The definition is not met if the property is used in any way to facilitate the delivery of services or production of goods or is held for sale. Investment properties are measured initially at cost and subsequently at fair value, based on the amount at which the asset could be exchanged between knowledgeable parties at arm’s length. Investment properties are not depreciated but are revalued annually according to market conditions at the year-end. Gains and losses on revaluation are posted to the Financing and Investment Income and Expenditure line in the Comprehensive Income and Expenditure Statement. The same treatment is applied to gains and losses on disposal. Rentals received in relation to investment properties are credited to the Financing and Investment Income line and result in a gain for the General Fund Balance. However, revaluation and disposal gains and losses are not permitted by statutory arrangements to have an impact on the General Fund balance. The gains and losses are therefore reversed out of the General Fund balance in the Movement in Reserves Statement and posted to the Capital Adjustment Accounts and (for any sale proceeds greater than £10,000) the Capital Receipts Reserve.
15) Inventories and Long term Contracts
Inventories are included in the Balance Sheet at the lower of cost and net realisable value as per IAS 2. Long term contracts are accounted for on the basis of charging the Surplus or Deficit on the Provisions of Services with the value of works and services received under the contract during the financial year.
16) Leases
Leases are classified as finance leases where the terms of the lease transfer substantially all the risks and rewards incidental to ownership of the property, plant or equipment from the lessor to lessee. All other leases are classified as operating leases. Where a lease covers both land and buildings, the land and buildings elements are considered separately for classification.

36
i) The Council as lessee Finance Leases Property, plant and equipment held under finance leases are recognised on the Balance Sheet at the commencement of the lease at its fair value (or the present value of the minimum lease payment, if lower). The asset recognised is matched by a liability for the obligation to pay the lessor. Indirect costs of the Authority are added to the carrying amount of the asset. Premiums paid on entry into a lease are applied to writing down the lease liability. Contingent rents are charged as expenses in the periods in which they are incurred. Lease payments are apportioned between:
a charge for the acquisition of the interest in the property, plant or equipment – applied to write down the lease liability, and
a finance charge, (debited to the Financing and Investment Income and Expenditure line in the Comprehensive Income and Expenditure Statement).
Property, Plant and Equipment recognised under finance leases is accounted for using the policies applied generally to such assets, subject to depreciation being charged over the lease term if this is shorter than the asset’s estimated useful life (where ownership of the asset does not transfer to the authority at the end of the lease period). The Authority is not required to raise council tax to cover depreciation or revaluation and impairment losses arising on leased assets. Instead, a prudent annual contribution is made from revenue funds towards the deemed capital investment in accordance with statutory requirements. Depreciation and revaluation and impairment losses are therefore substituted by a revenue contribution in the GF balance, by way of an adjusting transaction with the Capital Adjustment Account in the Movement in Reserves Statement for the difference between the two.
Operating Leases Rentals paid under operating leases are charged to the Comprehensive income and expenditure statement as an expense of the services benefitting from use of the leased property, plant or equipment. Charges are made on a straight-line basis over the life of the lease, generally meaning that rentals are charged when they become payable.
ii) The Council as lessor Finance Leases Where the Authority grants a finance lease over a property, plant or equipment, the relevant asset is written out of the Balance Sheet as a disposal. At the commencement of the lease, the carrying amount of the asset in the Balance Sheet (whether Property Plant and Equipment or Assets Held for Sale ) is written off to the Other Operating Expenditure line in the Expenditure in the Comprehensive Income and Expenditure Statement as part of the gain or loss on disposal.

37
A gain, representing the Authority’s net investment in the lease, is credited to the same line in the Comprehensive Income and Expenditure Statement also as part of the gain or loss on disposal (i.e. netted off against the carrying value of the asset at the time of disposal), matched by a lease (long term debtor) asset in the Balance Sheet. Lease rentals receivable are apportioned between:
a charge for the acquisition of the interest in the property- applied to write down the lease debtor (together with any premiums received), and
finance income (credited to the Financing and Investment Income line in the Comprehensive Income and Expenditure Statement).
The gain credited to the Comprehensive Income and Expenditure Statement on disposal is not permitted by statute to increase the General Fund Balance and is required to be treated as a capital receipt. Where a premium has been received, this is posted out of the General Fund Balance to the Capital Receipts Reserve in the Movement in Reserves Statement. Where the amount due in relation to the lease asset is to be settled by the payment of rentals in future financial years, this is posted out of the General Fund Balance to Deferred Capital Receipts Reserves in the Movement in Reserves Statement. When the future rentals are received the element for the capital receipt for the disposal of the asset is used to write down the lease debtor. At this point, the deferred capital receipts are transferred to the Capital Receipts Reserve. The written off value of disposals is not a charge against council tax, as the cost of non-current assets is fully provided for under separate arrangements for capital financing. Amounts are therefore appropriated to the Capital Adjustment Account from the General Fund Balance in the Movement in Reserves Statement.
Operating Leases Where the Authority grants an operating lease over a property or plant or equipment, the asset is retained in the Balance Sheet. Rental income is credited to the Other Operating Expenditure line in the Comprehensive Income and Expenditure Statement. Credits are made on a straight-line basis over the life of the lease, even if this does not match the pattern of payments (e.g. there is a premium paid at the commencement of the lease). Initial direct costs incurred in negotiating and arranging the lease are added to the carrying amount of the relevant asset and charged as an expense over the lease term on the same basis as rental income.
38
17) Overheads and Support Services
The costs of overheads and support services are charged to those that benefit from the supply or service in accordance with the costing principles of the CIPFA Service Reporting Code of Practice 2011/12 (SeRCOP). The total absorption costing principle is used – the full cost of overheads and support services are shared between users in proportion to the benefits received, with the exception of:
Corporate and Democratic Core – costs relating to the council’s status as a multi-functional, democratic organisation
Non Distributed Costs – the costs of discretionary benefits awarded to employees retiring early and any depreciation and impairment losses chargeable on non-operational premises
These two cost categories are separately identified in the Comprehensive Income and Expenditure Statement as part of Net Cost of Services.
18) Property, Plant and Equipment Assets that have physical substance and are held for use in the production or supply of goods or services, for rental to others, or for administrative purposes and that are expected to be used during more than one financial year are classified as Property, Plant and Equipment. Recognition Expenditure on the acquisition, creation or enhancement of Property, Plant and Equipment is capitalised on an accruals basis, provided that it is probable that the future economic benefits or service potential associated with the item will flow to the Authority and the item has a cost of at least £10,000 which can be measured reliably. Expenditure that maintains but does not add to an asset’s potential to deliver future economic benefits or service potential (i.e. repairs and maintenance) is charged as an expense when it is incurred. Measurement
Assets are initially measured at cost, comprising:
The purchase price
Any costs attributable to bringing the asset to the location and condition necessary for it to be capable of operating in the manner intended by management
The authority does not capitalise borrowing costs incurred whilst assets are under construction.

39
The cost of assets acquired other than by purchase is deemed to be its fair value; unless the acquisition does not have commercial substance (i.e. will not lead to a variation in the cash flows of the Authority). In latter case, where an asset is acquired via an exchange, the cost of acquisition is the carrying amount of the asset given up by the Authority. Assets are then carried in the Balance Sheet using the following measurement bases:
Land and non-specialised building – fair value or existing use value
Specialised Buildings – depreciated replacement cost
Infrastructure and community assets – depreciated historical cost
Vehicles, plant and equipment – depreciated historical cost (as a proxy for fair value)
Assets included in the Balance Sheet at fair value are revalued sufficiently regularly to ensure that their carrying amount is not materially different from their fair value at the year-end, but as a minimum every five years. Increases in valuations are matched by credits to the Revaluation Reserve to recognise unrealised gains. Where decreases in value are identified, they are accounted for by:
Where there is a balance of revaluation gains for the asset in the Revaluation Reserve, the carrying amount of the asset is written down against that balance (up to the amount of the accumulated gains).
Where there is no balance in the Revaluation Reserve or an insufficient balance, the carrying amount of the asset is written down against the relevant service line in the Comprehensive Income and Expenditure Statement.
The Revaluation Reserve contains revaluation gains recognised since 1st April 2007 only, the date of its formal implementation. Gains arising before that date have been consolidated into the Capital Adjustment Account.
Impairment The values of each category of assets and of material individual assets are reviewed at the end of each financial year for evidence of reductions in value. Where impairment is identified as part of this review or as a result of a valuation exercise, this is accounted for by:
Where there is a balance of revaluation gains for the asset in the Revaluation Reserve, the carrying amount is written down against that balance (up to the amount of gains)
Where there is no balance or an insufficient balance in the Revaluation Reserve, the carrying amount of the asset is written down against the relevant service line in the Comprehensive Income and Expenditure Statement.
Where an impairment loss is reversed subsequently, the reversal is credited to the relevant service lines in the Comprehensive Income and Expenditure Statement, up to the amount of the original loss, adjusted for depreciation that would have been charged if the loss had not been recognised.

40
Depreciation Depreciation is provided for on all property, plant and equipment (except for investment properties and assets held for sale), by allocating the value of the assets in the Balance Sheet to the periods expected to benefit from their use. The estimated useful lives of assets have been professionally derived by the Council’s Valuation Officer and were reviewed as part of the last full revaluation. Estimates of the useful life of each individual asset range from 5 to 70 years, although the majority of properties have an estimated useful life of between 15 and 30 years. Depreciation is calculated on the following bases: Operational Buildings 10-70 years Infrastructure Assets 15-70 years Operational Vehicles and plant 3-20 years Intangible assets 3-10 years Where an asset has new major components with different estimated useful lives and significant costs, these are depreciated separately. Revaluation gains are also depreciated, with an amount equal to the difference between the current value depreciation charged on assets and the depreciation that would have been chargeable based on their historical cost being transferred each year from the Revaluation Reserve to the Capital Adjustment Account.

41
19) Disposals and Non-current assets held for sale When it becomes probable that the carrying amount of an asset will be recovered
principally through a sale transaction rather than through its continuing use, it is reclassified as an Asset Held for Sale. The asset is revalued immediately before reclassification and then carried at the lower of this amount and fair value less costs to sell. Where there is a subsequent decrease to fair value less costs to sell, the loss is posted to the Other Operating Expenditure line in the Comprehensive Income and Expenditure Statement. Gains in fair value are recognised only up to the amount of any previous losses recognised in the Surplus or Deficit on Provision of Services. Depreciation is not charged on Assets Held for Sale.
If assets no longer meet the criteria to be classified as Assets Held for Sale, they are
reclassified back to non-current assets and valued at the lower of their carrying amount before they were classified as held for sale; adjusted for depreciation, amortisation or revaluations that would have been recognised had they not been classified as held for sale, and their recoverable amount at the date of the decision not to sell.
Assets that are to be abandoned or scrapped are not reclassified as Assets Held for
Sale. When an asset is disposed of or decommissioned, the carrying amount of the asset
in the Balance Sheets (whether PPE or Held for Sale) is written off to the Other Operating Expenditure line in the Comprehensive Income and Expenditure Statement as part of the gain or loss on disposal. Receipts from disposals (if any) are credited to the same line as part of the gain or loss on disposal (i.e. netted off against the carrying value of the asset at the time of disposal.) Any revaluation gains accumulated for the asset in the Revaluation Reserve are transferred to the Capital Adjustment Account.
Amounts received for a disposal in excess of £10,000 are categorised as capital
receipts. The balance of receipts is required to be credited to the Capital Receipts Reserve and can then only be used for new capital investment, or set aside to reduce the Authority’s underlying need to borrow (the capital financing requirement). Receipts are appropriated to the Reserve from the General Fund balance in the Movement in Reserves Statement.
The written off value of disposals is not a charge against council tax, as the cost of
non-current assets is fully provided for under separate arrangements for capital financing. Amounts are appropriated to the Capital Adjustment Account from the General Fund Balance in the Movement in Reserves Statement.
20) Provisions, Contingent Liabilities and Contingent Assets Provisions
Provisions are made where an event has taken place that gives the Authority a legal or constructive obligation that probably requires settlement by a transfer of economic benefits or service potential, and a reliable estimate can be made of the amount of the obligation. For instance, the Authority may be involved in a court case that could eventually result in the making of a settlement or the payment of compensation.

42
The amount recognised as a provision is the best estimate of the expenditure required to settle the obligation at the end of the reporting period, taking into account the risks and uncertainties. Provisions are charged as an expense to the appropriate service line in the Comprehensive Income and Expenditure Statement in the year that Authority becomes aware of the obligation. Where some or all of the payment required to settle a provision are expected to be recovered from another party (e.g. from an insurance claim) this is only recognised as income if it is virtually certain that reimbursements will be received if the Authority settles the obligation. The value of provision is reviewed at each balance sheet date to reflect current best estimates.
Contingent Assets A contingent asset arises where an event has taken place that gives the authority a possible asset whose existence will only be confirmed by the occurrence of one or more uncertain future events not wholly within the control of the Council. Contingent assets are not recognised in the Balance Sheet but disclosed in a note to the accounts where it is probably that there will be an inflow of economic benefits or service potential. Contingent assets are continually assessed to determine their position.
Contingent Liabilities
A contingent liability arises where an event has taken place that gives the authority a possible obligation whose existence will only be confirmed by the occurrence or otherwise of uncertain future events not wholly within the control of the authority. Contingent liabilities also arise in circumstances where a provision would otherwise be made but either it is not probably that an outflow of resources will be required or the amount of the obligation cannot be measured reliably. Contingent liabilities are not recognised in the Balance Sheet but disclosed in a note to the accounts. Contingent liabilities are subject to a continual assessment to determine their position.
21) Reserves
The Council sets aside specific amounts as reserves for future policy purposes or to cover contingencies. Reserves are created by appropriating amounts out of the General Fund Balance in the Movement in Reserves Statement. When expenditure to be financed from a reserve is incurred, it is charged to the appropriate service revenue account in that year to score against the Surplus or Deficit on the Provision of Services in the Comprehensive Income and Expenditure Statement. The reserve is then appropriated back into the General Fund Balance in the Movement in Reserves Statement so that there is no net charge against council tax for the expenditure.

43
Certain reserves are kept to manage the accounting processes for tangible fixed assets and retirement benefits and these do not represent usable resources for the Council.
22) Revenue Expenditure Funded from Capital under Statute Expenditure incurred during the year that may be capitalised under statutory provisions but does not result in the creation of fixed assets has been charged as expenditure to the relevant service in the Comprehensive Income and Expenditure Statement in the year. Where the Authority has determined to meet the cost of this expenditure from existing capital resources or by borrowing, a transfer in the Movement in Reserves Statement from the General Fund balance to the Capital Adjustment Account then reverses out the amounts charged so that there is no impact on the level of council tax.
23) VAT
Income and expenditure exclude any amounts related to VAT, as all VAT collected is payable to HM Revenues and Customs and all VAT paid is recoverable from it.

44
2. Critical Judgements in applying Accounting Policies
In applying the accounting policies set out in Note 1, the Council has had to make certain judgements about complex transactions or those involving uncertainty about future events. The critical judgements made in the Statement of Accounts are:
Whether a service partnering agreement with FOCSA for waste recycling is a service concession agreement:
The Council has made judgements on whether its contractual arrangements contain embedded leases, i.e. arrangements that do not have the legal status of a lease but convey a right to use an asset in return for payments where fulfilment of the arrangement is not dependent on the use of specific assets.
Allerdale BC considers that the service partnering agreement with FOCSA for refuse collection does not include a leasing arrangement as per IFRIC 4 – as fulfilment of the arrangement is dependant on the use of specific assets. The expenditure on the FOCSA contract is therefore included as expenditure for services within the Comprehensive Income and Expenditure Statement. It is recognised that this is our judgement, and that other practitioners may have made a different judgement about the accounting treatment. This alternative treatment could have resulted in the FOCSA arrangements being deemed to rely on the use of specific assets and conveying the right to use all but an insignificant amount of the asset – and therefore IAS 17 could apply. This alternative accounting treatment could have classified the arrangement as an operating lease, and this would have required an addition to our Leasing Note (23.2) for the value of the payment to FOCSA for the vehicles, which is estimated to be £421k of the total payment of £4.57m.
Whether assets are classified as Heritage Assets: The Council has made judgements on whether its assets should be reclassified as Heritage Assets in accordance with the definitions laid down in the Code of Practice. It is acknowledged that when applying those definitions to an asset, others may apply a different interpretation around the classification of these assets.
Whether land at Cloffocks should remain classified as investment property: Under the current Code of Practice, land held for a ‘currently undetermined future use’ can be included within investment property, and the land at the Cloffocks fits this description. It is recognised that this is our judgement and other practitioners may consider that the land should be classified as a Surplus Asset within Property, Plant and Equipment.
Uncertainties over Government grants: There is a high level of uncertainty about future levels of funding for local government; the Authority has determined that this uncertainty is not yet sufficient to provide an indication that the assets of the Authority might be impaired as a result of a need to close facilities and reduce levels of service provision. The Council has a Reducing Spend programme to address the anticipated reductions in grant funding.

45
3. Assumptions made about the future and other major sources of estimation uncertainty
The Statement of Accounts contains estimated figures that are based on
assumptions made by the Council about the future or that are otherwise uncertain. Estimates are made taking into account historical experience, current trends and other relevant factors. The items in the Council’s Balance sheet at 31 March 2012 for which there is a significant risk of material adjustment in the forthcoming financial year are as follows:
Item Uncertainties Effect if Actual Results differ from Assumptions
Property, Plant & Equipment
The current economic climate makes it uncertain that the authority will be able to sustain its current spending on repairs and maintenance, bringing into doubt the useful life of assets
If the useful life of assets is reduced, depreciation increases and the carrying amount of the assets falls. It is estimated that the annual depreciation charge for operational assets will increase by £266,000 per year, if useful lives had to be reduced by two years.
Doubtful Debts
A review of significant balances suggested that the estimated rate of default of 3% (£85,000) was appropriate. However, in the current economic climate, the collection rates can deteriorate.
The reduction in the collection rate might impact doubtful debts by doubling the impairment
Provisions
The Council has made three provisions in its accounts; £251,000 for insurance excesses, £175,000 for redundancy payments and has reduced the provision for the Curwen land slip to £150,000. It is not certain that the total amount of the provisions will be required.
Should the whole amount of the provisions not be required, then the unused balance will be credited to General Fund Reserves thereby decreasing revenue expenditure in 2012-13
Pensions Liability
Estimation of the net liability to pay pensions depends on a number of complex judgements relating to discount rate used, the projected rate of salary increase, changes in retirement age, mortality rates and expected return on pension fund assets. The pension fund actuaries provide the Council with expert advice regarding the assumptions to be applied.
The effects on the net pensions liability of changes in individual assumptions can be measured. For instance, a 0.1% increase in discount rate assumption would result in a decrease in the liability of £1,220,000.

46
4. Adjustment between Accounting basis & Funding basis under Regulations
General Capital Capital Unusable
2010/11 Fund Receipts Grants Reserves
Reserve Unapplied
£'000 £'000 £'000 £'000
Adjustments primarily involving
Capital Adjustment A/C:
Reversal of items debited/credited
to the Comprehensive Income
& Expenditure Statement
Depreciation and Impairment 1,540 (1,540)
of non-current assets
Revaluation losses 120 (120)
Movement in market value of Investment Properties 8,020 (8,020)
Amortisation of Intangible assets 153 (153)
Capital Grants & contributions (3) 3
Revenue exp funded from capital 208 (208)
under statute
Revenue contribution to finance capital (172) 172
Items not debited or credited to
the Comprehensive Income &
Expenditure Statement
Statutory provision for the financing (611) 611
of capital investment
9,255 0 0 (9,255)
Adjustments primarily involving
Capital Grant Unapplied a/c
Capital grants & contributions (842) 842
unapplied credited to Comprehensive
Income & Expenditure Statement
Application of grants to revenue 898 (897) 0
financing
56 0 (55) 0
Adjustments primarily involving
the Capital Receipts Reserve
Transfer of cash sale proceeds credited (36) 183 (147)
as part of gain/ loss on disposal

47
General Capital Capital Unusable
2010/11 Continued Fund Receipts Grants Reserves
Reserve Unapplied
£'000 £'000 £'000
Use of reserve to finance new capital (530) 530
expenditure
Capital Receipt against Debtors 45 (43)
Revenue expenditure funded from Capital Receipts
(36) (302) 0 340
Adjustments involving the
Financial Instrument
Adjustment a/c
Amount by which finance costs charged 26 (26)
to the Comprehensive Income &
Expenditure Statement are different
from finance costs chargeable in the
year per statutory requirements
26 0 0 (26)
Adjustments involving the
Pension Reserve
Reversal of items relating to retirement (1,639) 1,639
benefits debited or credited to the
Comprehensive Income & Expenditure
Statement
Employers pension contributions and direct payments to pensioners payable in the year (1,619) 1,619
(3,258) 0 0 3,258
Adjustments involving the
Collection Fund Adjustment A/c
Amount by which council tax income (65) 65
credited to the Comprehensive Income &
Expenditure Statement is different
from council tax income calculated
for the year as per statutory requirements
(65) 0 0 65
Adjustments involving the Employee
Benefit Reserve
Movement on Employee Short Term 29 (29)
Compensated Absences
29 0 0 (29)
Movement during the year 6,007 (302) (55) (5,647)
Restatement due to the introduction of Heritage Assets accounting requirements.

48
General Capital Capital Unusable
2011/12 Fund Receipts Grants Reserves
Reserve Unapplied
£'000 £'000 £'000 £'000
Adjustments primarily involving
Capital Adjustment A/C:
Reversal of items debited/credited
to the Comprehensive Income
& Expenditure Statement
Depreciation and Impairment of 1,798 (1,798)
non-current assets
Revaluation losses 48 (48)
Movement in the market value of
Investment Properties 9,048 (9,048)
Amortisation of Intangible assets 143 (143)
Capital Grants & contributions (2) 2
Revenue exp funded from capital under statute 345 (10) (335) 0
Cap expenditure to General Fund (17) 17
Items not debited or credited to
the Comprehensive Income &
Expenditure Statement
Statutory provision for the financing (586) 586
of capital investment
10,779 (10) (337) (10,432)
Adjustments primarily involving
Capital Grant Unapplied a/c
Capital grants & contributions (419) 419 0
unapplied credited to Comprehensive
Income & Expenditure Statement
Application of grants to revenue financing 0 0 0
(419) 0 419 0
Adjustments primarily involving
the Capital Receipts Reserve
Transfer of cash sale proceeds 648 54 (702)
credited as part of gain/ loss on
disposal
Use of reserve to finance new (82) 82
capital expenditure
Capital Receipt against Debtors 16 (16)
648 (12) 0 (636)

49
General Capital Capital Unusable
2011/12 Continued Fund Receipts Grants Reserves
Reserve Unapplied
£'000 £'000 £'000 £'000
Adjustments involving the
Financial Instrument
Adjustment a/c
Amount by which finance costs 26 (26)
charged to the Comprehensive
Income & Expenditure Statement
are different from finance costs
chargeable in the year per
statutory requirements
26 0 0 (26)
Adjustments involving the
Pension Reserve
Reversal of items relating to 1,951 (1,951)
retirement benefits debited or
credited to the Comprehensive
Income & Expenditure
Statement
Employers pension contributions and direct payments to pensioners payable in the year (1,590) 1,590
361 0 0 (361)
Adjustments involving the
Collection Fund Adjustment A/c
Amount by which council tax income credited (28) 28
to the Comprehensive Income & Expenditure
Statement is different from council tax
income calculated for the year as per
statutory requirements
(28) 0 0 28
Adjustments involving the Employee
Benefit Reserve
Movement on Employee Short Term
Compensated Absences
0 0 0 0
Movement during the year 11,367 (22) 82 (11,427)
Restatement due to the introduction of Heritage Assets accounting requirements.

50
5 (i) Usable Reserves
a) Earmarked Reserves
Changes to the management structure and responsibilities for Council priorities have resulted in the allocation of the brought forward reserves being reclassified.
2011/12 31.3.11 Increase Application Released 31.3.12
£’000 £’000 £’000 £’000 £’000
Flood Recovery 156 0 (113) 0 43 Cockermouth Flood Alleviation Scheme 0 100 0 0 100 Pot. Liability Re Town Centre Development 66 0 0 (66) 0
Revenues & Benefits 90 4 (19) (24) 51
New Technology Fund 233 0 (7) 0 226
LABGI 183 5 (94) 129 223
Grass Cutting 243 0 0 0 243
Redundancy Costs 0 1,000 (214) 0 786
Planning Delivery Fund 326 0 (72) 0 254
Planning 240 45 (46) 0 239
Regeneration 104 128 (78) (26) 128
Corporate Strategy Implementation 206 0 (27) (90) 89
Risk Assessment 113 5 (1) (33) 84
Insurance 103 46 0 0 149
Legal 46 196 (18) (2) 222
Housing 45 0 (45) 0 0
Democratic Services 111 26 (95) (3) 39
Customer & Regulatory Services 123 34 (6) 0 151
Economic Growth 36 0 (2) (1) 33
Financial Services 249 13 (142) (108) 12
Asset Management 81 139 0 0 220
Locality Services 170 37 (13) 0 194
Organisational Development 85 40 (15) (53) 57
3,009 1,818 (1,007) (277) 3,543
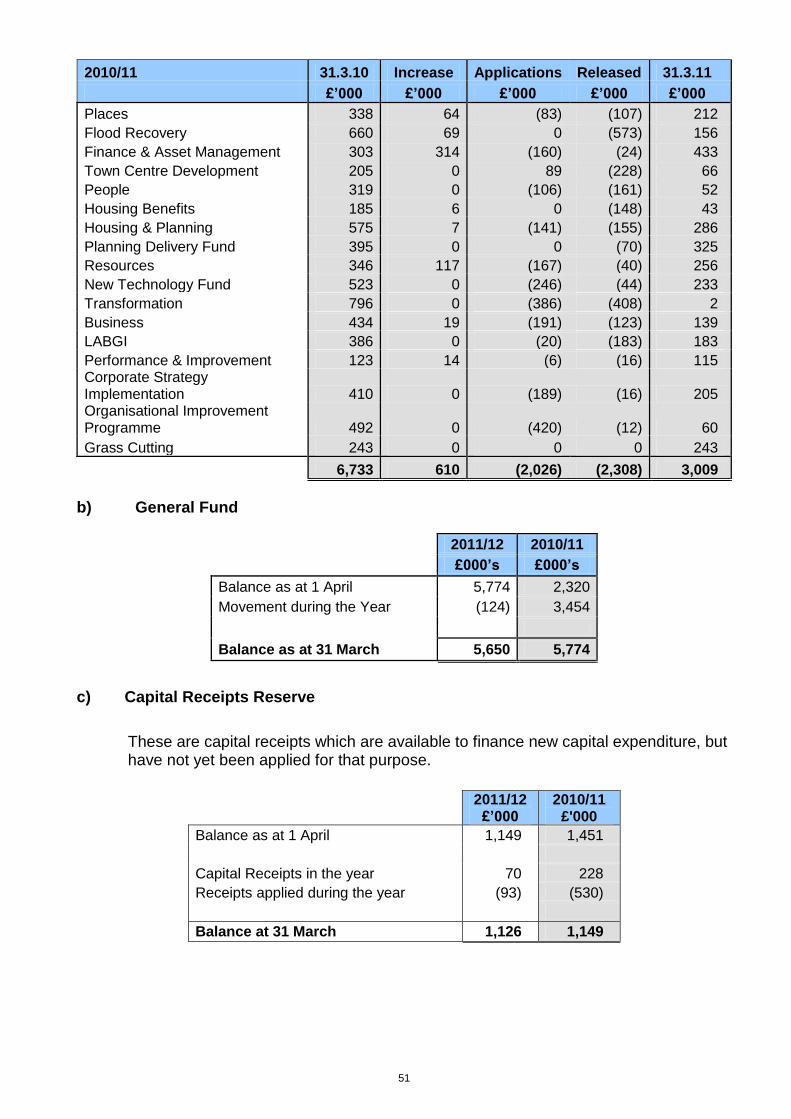
51
2010/11 31.3.10 Increase Applications Released 31.3.11
£’000 £’000 £’000 £’000 £’000
Places 338 64 (83) (107) 212
Flood Recovery 660 69 0 (573) 156
Finance & Asset Management 303 314 (160) (24) 433
Town Centre Development 205 0 89 (228) 66
People 319 0 (106) (161) 52
Housing Benefits 185 6 0 (148) 43
Housing & Planning 575 7 (141) (155) 286
Planning Delivery Fund 395 0 0 (70) 325
Resources 346 117 (167) (40) 256
New Technology Fund 523 0 (246) (44) 233
Transformation 796 0 (386) (408) 2
Business 434 19 (191) (123) 139
LABGI 386 0 (20) (183) 183
Performance & Improvement 123 14 (6) (16) 115 Corporate Strategy Implementation 410 0 (189) (16) 205 Organisational Improvement Programme 492 0 (420) (12) 60
Grass Cutting 243 0 0 0 243
6,733 610 (2,026) (2,308) 3,009
b) General Fund
2011/12 2010/11
£000’s £000’s
Balance as at 1 April 5,774 2,320
Movement during the Year (124) 3,454
Balance as at 31 March 5,650 5,774
c) Capital Receipts Reserve
These are capital receipts which are available to finance new capital expenditure, but have not yet been applied for that purpose.
2011/12 £’000
2010/11 £'000
Balance as at 1 April 1,149 1,451
Capital Receipts in the year 70 228
Receipts applied during the year (93) (530)
Balance at 31 March 1,126 1,149

52
d) Capital Grants Unapplied
Capital Grants Unapplied are grants received towards the funding of capital expenditure. The balance represents grants received but, as yet, not used to finance capital expenditure.
2011/12 2010/11
£’000 £'000
Balance as at 1 April 1,211 1,266
Reversal of Accrual from 2008/09 (163) 0
Capital Grants received 582 843
Used to finance Revenue Expenditure funded from Capital under Statute (335) (898)
Transferred to Capital Adjustment Account (2) 0
Balance at 31 March 1,293 1,211

53
5(ii) Unusable Reserves: a) Summary of Movements
Reserve
Restated Balance
as at 1 April 2011
Net Movement in the Year
Balance as at 31 March 2012
Purpose of Reserve Further Detail of Movements
£'000 £'000 £'000
Revaluation Reserve
12,654 (8) 12,646 Account for Revaluation of Assets above net book value
See note (5ii b) below
Capital Adjustment Account
68,055 (10,562) 57,493 Store of capital resources set aside to meet past expenditure
See note (5ii c) below
Financial Instruments Adjustment Account
102 (26) 76 Balancing account to allow for differences in statutory requirements and proper accounting practices for borrowings and investments
See note (5ii d) below
Deferred Capital Receipts
1 0 1 Proceeds from mortgages to be received at a future point
See note (5ii e) below
Employee Benefit Reserve
(97) (0) (97) Balancing account to reflect the accrual for unpaid holiday pay in the Balance Sheet
See note (5ii f) below
Pensions Reserve (21,876) (3,297) (25,173) Balancing account to
allow inclusion of Pensions Liability in the Balance Sheet
See note 29 below
Collection Fund Adjustment Account
161 28 189 Reflects the statutory requirement for billing authorities to maintain a separate Collection Fund
See note (5ii g) below
59,000 (13,865) 45,135
Restatement due to the introduction of Heritage Assets accounting requirements.

54
b) Revaluation Reserve
The Revaluation Reserve records gains on revaluation of fixed assets not yet realised through sales.
2011/12 Restated 2010/11
Published 2010/11
£’000 £'000 £’000
Balance as at 1 April 12,654 10,312 9,789
Revaluations during the year 555 2,707 2,627
Impairments during the year (42)
Disposals/Derecognition of Fixed Assets (16)
Historic Cost Adjustment (505) (380) (380)
IFRS adjustment
Introduction of Heritage Assets 15
Balance at 31 March 12,646 12,654 12,036
Restatement due to the introduction of Heritage Assets accounting requirements. c) Capital Adjustment Account
The Capital Adjustment Account records the sources of finance through which capital expenditure is funded.
2011/12 £’000
Restated 2010/11 £’000
Published
2010/11 £’000
Balance as at 1 April 68,054 76,711 76,711
Depreciation (1,763) (1,556) (1,560)
Amortisation of intangibles (142) (152) (152)
MRP 586 611 611
Revenue Expenditure Funded from Capital under Statute (345) (1,106) (1,106)
Capital receipts used for Financing of capital 82 322 322
Revenue contribution to capital 17 173 173
Capital receipt re long term debtor (15) (43) (43)
Historic cost adjustment 505 380 380
Disposal/Derecognition of Fixed Assets (702) (147) (147) Impairments (36) 13 13
Downward Valuation of Heritage Assets 0 (121) 0
Capital Receipts used for Revenue Expenditure 11 208 208
Cap Grants received and utilised 337 901 901
Revaluation Gain/(Loss) on Investment Property (9,047) (8,020) (8,020)
Revaluation Gain/(Loss) on Assets held for sale (19) (120) (120)
Revaluation Gain/(Loss) on Depots (29) 0
Balance at 31 March 57,494 68,054 68,171
Restatement due to the introduction of Heritage Assets accounting requirements.

55
d) Financial Instruments Adjustment Account
2011/12 2010/11
£000’s £000’s
Balance as at 1 April 102 129
Discount received 0 0
Discount amortised to revenue (38) (38)
Premiums amortised to revenue 11 11
Balance as at 31 March 75 102
e) Deferred Capital Receipts
2011/12 2010/11
£000’s £000's
Balance as at 1 April 1 1
Receipts 0 0
Balance as at 31 March 1 1
f) Employee Benefit Reserve
2011/12 2010/11
£000’s £000’s
Balance as at 1 April (97) (68)
Additions during the year (0) (29)
Balance as at 31 March (97) (97)
g) Collection Fund Adjustment Account
2011/12 2010/11
£000’s £000’s
Balance as at 1 April 161 97
Amount by which council tax income credited to the Comprehensive Income and Expenditure Statement is different from council tax income calculated for the year in accordance with statutory requirements 28 64
Balance as at 31 March 189 161

56
6.0 Reconciliation of Income and Expenditure Deficit to the Net Cash flow from Operating Activities:
6a Note A to the Cashflow Statement
2010/11 £000’s
2011/12 £000’s
2011/12 £000’s
(6,276) Net Surplus or (Deficit) on the Provision of Services (10,958)
Adjust net surplus or deficit on the provision of services for non cash movements
1,541 Depreciation 1,763
120 Impairment and downward valuations 9,576
152 Amortisation 142
Impairment losses on Loans & advance debited to surplus or deficit on the provision of services in year 0
Reductions in fair value of non PWLB Concessionary Loans 0
Material impairment losses on Investments debited to surplus or deficit on the provision of services in year 0
Adjustment for movements in fair value of investments classified as Fair Value through Profit & Loss a/c 0
Adjustment for internal interest charged 0
Losses or Gains on derecognition of loans and advances in year (7)
Reductions in fair value of Soft Loans (non Subsidiary) made in the year 0
Soft Loans (non Subsidiary)-Interest adjustment credited to I+E Account during year 0
Adjustments for effective interest rates 0
Increase/decrease in provision for impairments/doubtful debts re: Loans & Advances 0
Financial Guarantee Adjustments 0
Net PFI Debtor Adjustments 0
Increase/Decrease in Interest Creditors 1
(1,361) Increase/(Decrease) in Creditors (1,100)
43 (Increase)/Decrease in Interest and Dividend Debtors 22
1,840 (Increase)/Decrease in Debtors (384)
(23) (Increase)/Decrease in Inventories 16
(3,259) Movement in Pension Liability 361
385 Contributions to/(from) Provisions (132)
Unwinding the Discount on Deferred Receipts 0
Provision for Equal Pay 0
147 Carrying amount of non-current assets and non current assets held for sale, sold or derecognised 702
8,020 Movement in Investment Property Values (445)
7,605 10,515
Adjust for items included in the net surplus or deficit on the provision of services that are investing or financing activities
(845) Capital Grants credited to surplus or deficit on the provision of services (419)
Net adjustments from the sale of short and long term investments 0 Premiums or Discounts on the repayment of financial liabilities 0
(183) Proceeds from the sale of property plant and equipment, investment property and intangible assets (55)
(1,028) (474)
301 Net Cash Flows from Operating Activities (917)

57
6b Note B to the Cash Flow Statement - Cash Flows from Operating Activities (Interest)
Operating activities within the cashflow statement include the following cash flows relating to interest
2010/11 2011/12
£'000 £'000
130 Ordinary interest received 125
74 Opening Debtor 31
(31) Closing Debtor (9)
173 Interest Received 147
(737) Interest charge for year (730)
Opening Creditor (195)
Closing Creditor 196
(729)
6C Note C to the Cash Flow Statement – Cash Flows from Investing Activities
2010/11 Restated
2011/12 £000’s
2011/12 £000’s
(475) Purchase of Property, Plant and Equipment, Investment Property and Intangible Assets (102)
(58) Opening Capital Creditors (13)
13 Closing Capital Creditors 10
(519) Purchase of Property, Plant and Equipment, investment property and intangible assets
(105)
(25,363) Purchase of short term investments (26,230)
0 Purchase of long term investments 0
0 Purchase of Investments in Associates or Joint Ventures 0
0 Purchase of Investments in Subsidiaries 0
(25,363) Purchase of short and long term investments (26,230)
Long term loans granted 0
Capital Grants Repaid 0
Other payments for Investing Activities 0
173 Proceeds from the sale of property plant and equipment, investment property and intangible assets 42
173 42
25,863 Proceeds from the sale of short term investments 30,230
Proceeds from long term investments 0
Sale of Investments in Associates or Joint Ventures 0
0 Sale of Investments in Subsidiaries 0
25,863 Proceeds from short-term and long-term investments 30,230
53 Other capital cash receipts 28
750 Capital Grants Received 738
803 Other Receipts from Investing Activities 766
956 Total Cash Flows from Investing Activities 4,703

58
6d Note D to the Cashflow Statement – Cash Flows from Financing Activities
6e Note E – Makeup of Cash and Cash Equivalents
2011/12 2010/11
£'000 £'000
Cash and Bank Balances 12 4
Cash Investments - regarded as cash equivalents 6,885 3,091
Bank Overdraft 0 (781)
6,897 2,314
2010/11 Restated
2011/12 £000’s
2011/12 £000’s
0 Cash receipts of short and long term borrowing 0
764 Billing Authorities - Council Tax and NNDR adjustments 852
0 Precepting Authorities Only - Appropriation to/from Collection Fund Adjustment Account
(537) Repayment of Short-Term and Long-Term Borrowing (40)
Other receipts from financing activities
(10) Payments for the reduction of a finance lease liability (15)
0 Payments for the reduction of a PFI liability 0
(10) Cash payments for the reduction of the outstanding liabilities relating to finance leases and on-balance sheet PFI contracts
(15)
217 Total Cash Flows from Financing Activities 797
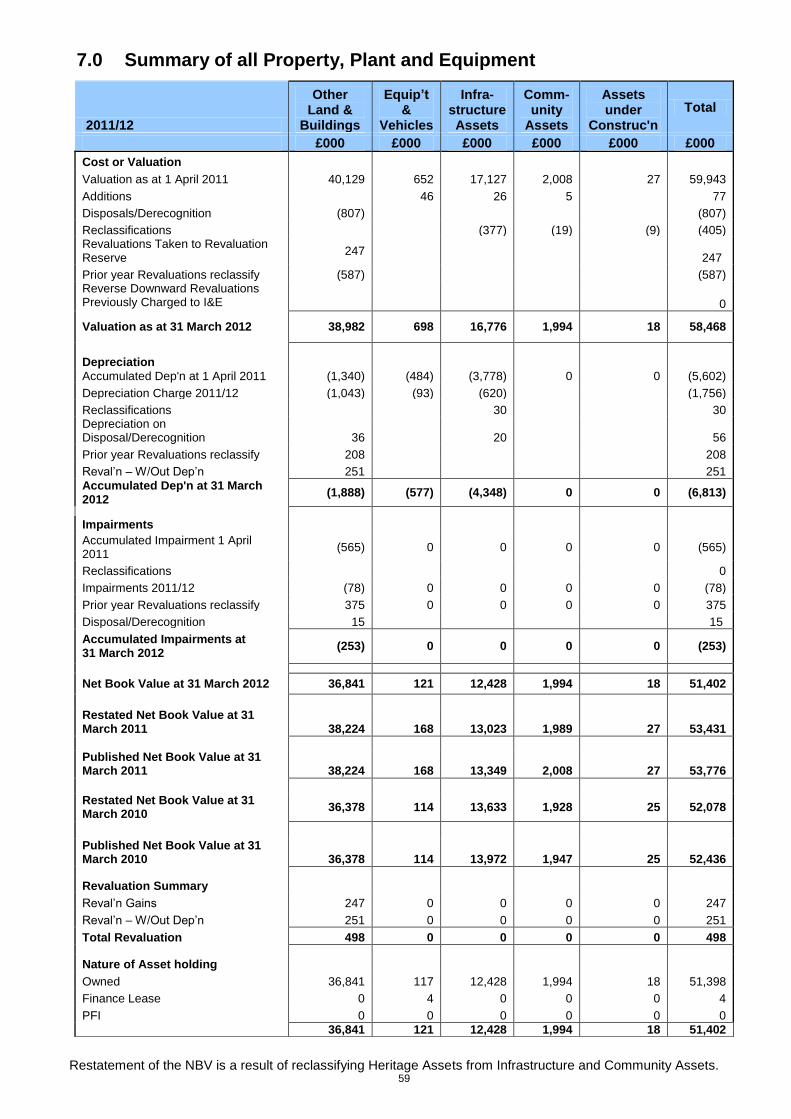
59
7.0 Summary of all Property, Plant and Equipment
Restatement of the NBV is a result of reclassifying Heritage Assets from Infrastructure and Community Assets.
2011/12
Other Land &
Buildings
Equip’t &
Vehicles
Infra- structure Assets
Comm-unity
Assets
Assets under
Construc'n
Total
£000 £000 £000 £000 £000 £000
Cost or Valuation
Valuation as at 1 April 2011 40,129 652 17,127 2,008 27 59,943
Additions 46 26 5 77
Disposals/Derecognition (807) (807)
Reclassifications (377) (19) (9) (405) Revaluations Taken to Revaluation Reserve
247 247
Prior year Revaluations reclassify (587) (587) Reverse Downward Revaluations Previously Charged to I&E
0
Valuation as at 31 March 2012 38,982 698 16,776 1,994 18 58,468
Depreciation Accumulated Dep'n at 1 April 2011 (1,340) (484) (3,778) 0 0 (5,602)
Depreciation Charge 2011/12 (1,043) (93) (620) (1,756)
Reclassifications 30 30 Depreciation on Disposal/Derecognition 36 20 56
Prior year Revaluations reclassify 208 208
Reval’n – W/Out Dep’n 251 251
Accumulated Dep'n at 31 March 2012
(1,888) (577) (4,348) 0 0 (6,813)
Impairments Accumulated Impairment 1 April 2011
(565) 0 0 0 0 (565)
Reclassifications 0
Impairments 2011/12 (78) 0 0 0 0 (78)
Prior year Revaluations reclassify 375 0 0 0 0 375
Disposal/Derecognition 15 15
Accumulated Impairments at 31 March 2012
(253) 0 0 0 0 (253)
Net Book Value at 31 March 2012 36,841 121 12,428 1,994 18 51,402
Restated Net Book Value at 31 March 2011 38,224 168 13,023 1,989 27 53,431
Published Net Book Value at 31 March 2011 38,224 168 13,349 2,008 27 53,776
Restated Net Book Value at 31 March 2010
36,378 114 13,633 1,928 25 52,078
Published Net Book Value at 31 March 2010 36,378 114 13,972 1,947 25 52,436
Revaluation Summary
Reval’n Gains 247 0 0 0 0 247
Reval’n – W/Out Dep’n 251 0 0 0 0 251
Total Revaluation 498 0 0 0 0 498
Nature of Asset holding
Owned 36,841 117 12,428 1,994 18 51,398
Finance Lease 0 4 0 0 0 4
PFI 0 0 0 0 0 0
36,841 121 12,428 1,994 18 51,402

60
7.1 Intangible Fixed Assets
Intangible assets are amortised over five years, using a straight line methodology.
2011/12 Software licences
Intellectual Property Total
£000 £000 £’000
Balance at 31 March 2010 1,184 70 1,254
Reclassifications for Heritage Assets (70) (70)
Cost or Valuation at 1 April 2010 1,184 0 1,184
Additions 257 0 257
Cost or valuation at 31 March 2011 1,441 0 1,441
Additions 24 24
Reclassifications from Assets under Construct’n 9 9
Cost or valuation at 31 March 2012 1,474 0 1,474
Amortisation at 31 March 2010 (776) (41) (817)
Reclassifications for Heritage Assets 41 41
Amortisation at 1 April 2010 (776) 0 (776)
Amortisation for the year (143) 0 (143)
Restated Amortisation at 1 March 2011 (919) 0 (919)
Amortisation for the year (132) 0 (132)
Amortisation 31 March 2012 (1,051) 0 (1,051)
Net book value at 31 March 2012 423 0 423
Restated Net book value at 31 March 2011 522 0 522
Published Net Book Value at 31 March 2010 410 28
438
Asset financing
Owned 423 0 423
Finance Leased 0 0 0
Total 31 March 2012 423 0 423
Restatement of the NBV is a result of reclassifying Heritage Assets from Intangible Assets.

61
7.2 Heritage Assets
2011/12 2010/11
Tangible Heritage Assets
Intangible Heritage Assets
Total Tangible Heritage Assets
Intangible Heritage Assets
Total
£000 £000 £000 £000 £000 £000
Cost or Valuation
Cost/Valuation as at 1 April 856 31 887 761 31 792
Additions 0 0 0 15 0 15
Disposals 0 0 0 0 0 0
Reclassifications 0 0 0 0 0 0
Revaluations Taken to Revaluation Reserve
73 0 73 80 0 80
Downward Revaluations 0 0 0 0 0 0
Reverse Downward Revaluations Previously Charged to I&E
0 0 0 0 0 0
Cost/Valuation as at 31 March 929 31 960 856 31 887
Depreciation Accumulated Dep'n at 1 April (8) (11) (19) 0 (11) (11)
Depreciation Charge (7) (10) (17) (8) 0 (8)
Reclassifications 0 0 0 0 0 0
Depreciation on Disposals 0 0 0 0 0 0
Reval’n – W/Out Dep’n 0 0 0 0 0 0
Accumulated Dep'n at 31 March (15) (21) (36) (8) (11) (19)
Impairments
Accumulated Impairment 1 April 0 0 0 0 0 0
Reclassifications 0 0 0 0 0 0
Impairments 0 0 0 0 0 0
Impairments (W/Out Dep’n) 0 0 0 0 0 0
Accumulated Impairments at 31 March 2012
0 0 0 0 0 0
Net Book Value at 31 March 2012
914 10 924
Net Book Value at 31 March 2011
848 20 868
Revaluation Summary
Reval’n Gains 73 0 73 80 0 80
Reval’n – W/Out Dep’n 0 0 0 0 0 0
Total Revaluation 73 0 73 80 0 80
Nature of Asset holding
Owned 914 10 924 848 20 868
Finance Lease 0 0 0 0 0 0
PFI 0 0 0 0 0 0
914 10 924 848 20 868

62
7.3 Investment Property
Total Total Total
£’000 £’000 £000
2011/12 2010/11 2009/10
Cost or valuation at 1 April 40,028 30,240 30,653
Additions / purchases 0 0
Reclassifications 0 17,955 0
Disposals 0 (147) (413)
Revaluations (9,047) (8,020) 0
Impairments 0 0
Reversal of impairments 0 0
At 31 March 30,981 40,028 30,240
Asset financing
Owned 30,981 40,028 30,240
Finance Leased 0 0 0
Total 31 March 30,981 40,028 30,240
Investment properties have been accounted for in accordance with IAS 40. They comprise land and buildings which are held for rental income or capital appreciation. Valuation reviews, in relation to the Council’s investment properties, commenced in April 2012 by the Council’s Valuation Officer who is a qualified Chartered Surveyor (Commercial Practice and Valuation) and has recent knowledge of the local area and experience of this valuation work. An external RICS Valuer, D Downing of Sanderson Weatherall was employed to undertake the valuation of the land known as The Cloffocks, Workington. This land has issues over mineral rights, for which an adjustment has been made by the Valuer. It is recognised that the Council’s future sale of this land is dependent upon the purchase of these rights and that the cost may differ from the allowance made in the valuation provided.
Beyond this, there are no restrictions on the Authority’s ability to realise the value inherent in its investment property or on the Authority’s right to the remittance of income and the proceeds of disposal. The Council has no contractual obligations to purchase, construct or develop investment property or repairs, maintenance or enhancement. The rental income and direct operating expenses from Investment Property are detailed in the table below: -
Direct Expenditure 2011/2012
£'000
Direct Income 2011/2012
£'000
Direct Expenditure 2010/2011
£'000
Direct Income
2010/2011 £'000
Trading Concerns 79 (250) 48 (268) Other Investment Properties 68 (213) 61 (206)
147 (463) 109 (474)

63
7.4 Assets held for sale
2011/12
£'000 2010/11
£'000 2009/10
£'000
Opening Balance at 1 April 185 18,300 18,015
Additions during the year 0 0 0
Disposals during the year (5) 0 0
Reclassifications 0 (17,995) 285
Revaluation (19) (120) 0
Impairment 0 0 0
Reversal of impairment 0 0 0
Closing Balance at 31 March 161 185 18,300
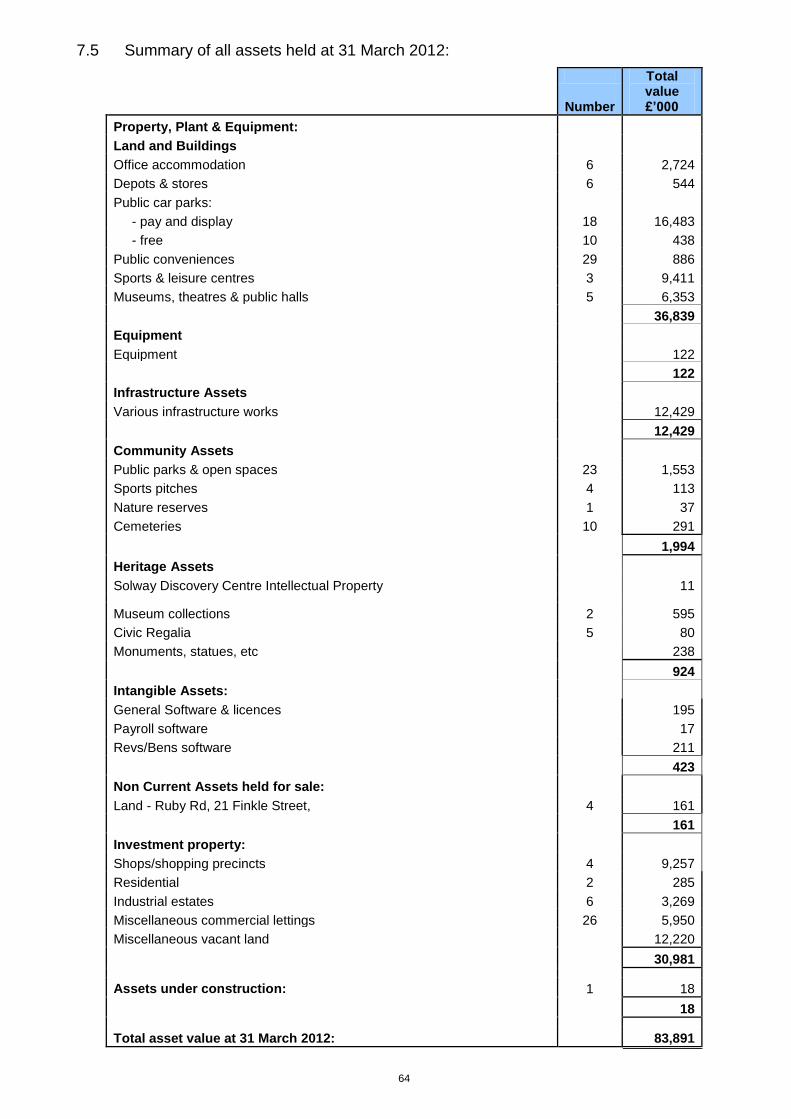
64
7.5 Summary of all assets held at 31 March 2012:
Total value
Number £’000
Property, Plant & Equipment:
Land and Buildings
Office accommodation 6 2,724
Depots & stores 6 544
Public car parks:
- pay and display 18 16,483
- free 10 438
Public conveniences 29 886
Sports & leisure centres 3 9,411
Museums, theatres & public halls 5 6,353
36,839
Equipment
Equipment 122
122
Infrastructure Assets
Various infrastructure works 12,429
12,429
Community Assets
Public parks & open spaces 23 1,553
Sports pitches 4 113
Nature reserves 1 37
Cemeteries 10 291
1,994
Heritage Assets
Solway Discovery Centre Intellectual Property 11
Museum collections 2 595
Civic Regalia 5 80
Monuments, statues, etc 238
924
Intangible Assets:
General Software & licences 195
Payroll software 17
Revs/Bens software 211
423
Non Current Assets held for sale:
Land - Ruby Rd, 21 Finkle Street, 4 161
161
Investment property:
Shops/shopping precincts 4 9,257
Residential 2 285
Industrial estates 6 3,269
Miscellaneous commercial lettings 26 5,950
Miscellaneous vacant land 12,220
30,981
Assets under construction: 1 18
18
Total asset value at 31 March 2012: 83,891

65
7.6 Heritage Assets a) Further information on the Council’s collections of Heritage Assets
During 2011/12, a change to the treatment in accounting for Heritage Assets has been implemented. As set out in our summary of significant accounting policies, the Council is required to change its accounting policy for Heritage Assets and recognise them at valuation, or in certain circumstances, at cost (depreciated where appropriate). Previously, Heritage Assets were either recognised as infrastructure assets (at costs less depreciation) or community assets in the property, plant and equipment classification in the balance sheet or were not recognised on the balance sheet as cost information on the assets was not available.
In applying the accounting policy, the Council has identified assets that were previously recognised as infrastructure and community assets at £358,000 should now be recognised as Heritage Assets and measured at £318,000 with a corresponding decrease in the Capital Adjustment Account (refer to table in 7.8). Intellectual property, in relation to the Solway Discovery interactive exhibition, has now been re-categorised as a Heritage Asset within the Balance Sheet at cost less depreciation of £32,000.
The Council has also recognised an additional £442,000 for the recognition of museum Heritage Assets that were not previously recognised in the Balance Sheet (refer to table in 7.8). This increase is recognised in the Revaluation Reserve. The 1 April 2010 and 31 March 2011 Balance Sheets and 2010/11 comparative figures have this been restated in the 2011/12 Statement of Accounts to apply this new policy.

66
The fully restated 1 April 2010 Balance Sheet is provided on page 21. The adjustments that have been made to that Balance Sheet over the version published in the 2010/11 Statement of Accounts are as follows:
Opening Balance as at 31 March
2010
Restatement Restated Balances as at
1 April 2010
£’000 £’000 £’000
Property Plant & Equipment 52,436 (358) 52,078
Intangible Assets 438 (32) 406
Heritage Assets 0 792 792
Long Term Assets 83,234 402 83,636
Total Net Assets 70,762 402 71,164
Unusable Reserves 58,992 402 59,394
Net Worth/Total Reserves 70,762 402 71,164
The £402,000 movement in Unusable Reserves comprises:-
Revaluation Reserve of £523,000
Capital Adjustment Account of (£121,000)
Comprehensive Income and Expenditure Statement During 2010/11, the value of the Council’s Museum Collections increased by £79,577. This was in line with the assessment of the Independent Valuer. In addition, a statue, with an acquisition cost of £15,000, was added to Heritage Assets. The Comprehensive Income and Expenditure Statement for 2010/11 has been restated to reflect this as follows. Effect on Comprehensive Income and Expenditure Statement 2010/11
As Previously
Stated 31-Mar-11
As Restated 31-Mar-11
Restatement 2011
£’000 £'000 £’000
Cost of Services 13,182 13,177 (5) Surplus/Deficit on Revaluation of Heritage Assets 0 (95) (95) Other Comprehensive (Income) and Expenditure (5,158) (5,253) (95) Total Comprehensive (Income) and Expenditure 1,124 1,023 (100)

67
Movement in Reserves Statement – Unusable Reserves 2010/11 The restatement of the relevant lines of the Movement in Reserves Statement, as at 31 March 2011, as a result of the application of this new accounting policy is presented in the table below:
As Previously Stated
31-Mar-11
As Restated 31-Mar-11
Restatement 2011
£’000 £'000 £’000
Balance as at the end of the previous reporting period – 31 March 2010 58,992 59,394 402
Other Comprehensive Income and Expenditure 5,158 5,253 95 Adjustments between the accounting basis and the funding basis under regulations (5,652) (5,647) 5
Increase/(decrease) in the year (494) (394) 100
Balance at the end of the current reporting period 31 March 2011 58,498 59,000 502
The resulting restated Balance Sheet for 31 March 2011 is provided on page 18. The adjustments that have been made to that Balance Sheet over the version published in the 2010/11 Statement of Accounts are as follows: Effect on Balance Sheet 31 March 2011
As Previously
Stated 31-Mar-11
As Restated 31-Mar-11
Restatement 2011
£’000 £'000 £’000
Property, Plant and Equipment 53,773 53,428 (345)
Intangible Assets 542 521 (21)
Heritage Assets 0 868 868
Long Term Assets 94,433 94,935 502
Total Net Assets 69,641 70,143 502
Unusable Reserves 58,498 59,000 502
Total Net Worth 69,641 70,143 502
The effect of the change in accounting policy in 2010/11 has been that Heritage Assets are reported at £868,000 on the Balance Sheet. This is recognised by the following movements: -
Revaluation Reserve of £618,000
Capital Adjustment Account of (£116,000)
Reclassification from PPE and Intangible of £366,000

68
7.7 Description of the Council’s collections of Heritage Assets
The Council maintain an asset management system in order to record all owned assets which are in excess of £10,000. The Council’s Heritage Assets consist of a number of historical sites, monuments/statues, nature reserves, civic regalia and various collections held within our museums at Maryport Maritime and Helena Thompson (individual registers are maintained by each museum of their collections). All heritage assets are held in support of increasing knowledge, understanding and appreciation of the historical, artistic, scientific, technological, geophysical and environmental qualities of the Borough of Allerdale and are accounted for as follows:- (i) Historical sites and Monuments/Statues The Council own a number of historical sites and monuments/statues, (26 in total), all of which contribute to the history of the Borough. The Council’s ancient historical sites are now, in the main, buried or ruins and consist of the Roman Cumbrian Coast defence (Milefortlet 21 Swarthy Hill), the famous Salt Pans of West Cumbria, Workington Hall in the grounds of Curwen Park, the iron lighthouse at Maryport and the Workington Pit heads, all of which have a significant historical and cultural background. The majority of the monuments/statues held by the Council are ‘in honour’ of significant local historical figures as well as memorials for those lost at war. In the opinion of the Council Valuation Officer, conventional valuation methods are not appropriate for valuing these assets. This is because they do not have a market for sale, there are not likely to be any comparable sales of similar assets to relate to and they are not capable of producing a cash flow or income but rather are liabilities requiring maintenance. Equally, it is impossible to quantify what economic benefits they generate to the community in terms of attracting tourists, promoting education etc. Therefore, these items have not been reported as assets in the balance sheet. More recently however, as part of the Workington Town Centre Development in 2006, monuments and statues were acquired including the Curwen Column and the Lookout Clock. These assets were reviewed by the Council’s Valuation Officer, during April 2012 and are reported in the 2011/12 restated balance sheet and associated notes at cost less depreciation where appropriate (refer to note 7.8 below). These items, which were previously categorised and reported as infrastructure assets within the Council’s financial statements and are now classified as Heritage Assets. (ii) Nature Reserves
The Council own five pockets of land which are classified as nature reserves. Two of these have been categorised as Heritage Assets as they have been recognised as areas with special scientific interest given the unique and rare wildlife they support. As with the historical sites and monuments, it is the opinion of the Council’s Valuation Officer that a valuation is not available for these assets given the lack of comparable market values and the diverse nature of the assets. As such, these assets have not been reported in the balance sheet.
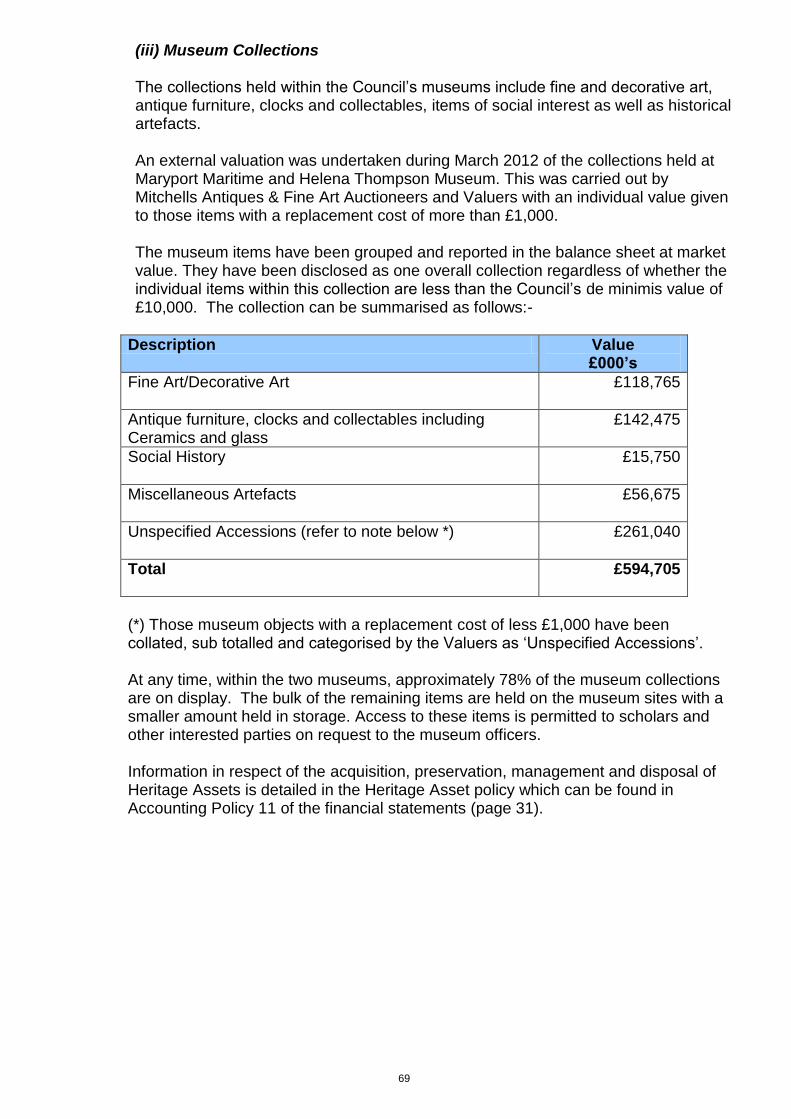
69
(iii) Museum Collections The collections held within the Council’s museums include fine and decorative art, antique furniture, clocks and collectables, items of social interest as well as historical artefacts. An external valuation was undertaken during March 2012 of the collections held at Maryport Maritime and Helena Thompson Museum. This was carried out by Mitchells Antiques & Fine Art Auctioneers and Valuers with an individual value given to those items with a replacement cost of more than £1,000. The museum items have been grouped and reported in the balance sheet at market value. They have been disclosed as one overall collection regardless of whether the individual items within this collection are less than the Council’s de minimis value of £10,000. The collection can be summarised as follows:-
Description Value £000’s
Fine Art/Decorative Art £118,765
Antique furniture, clocks and collectables including Ceramics and glass
£142,475
Social History £15,750
Miscellaneous Artefacts £56,675
Unspecified Accessions (refer to note below *) £261,040
Total £594,705
(*) Those museum objects with a replacement cost of less £1,000 have been collated, sub totalled and categorised by the Valuers as ‘Unspecified Accessions’. At any time, within the two museums, approximately 78% of the museum collections are on display. The bulk of the remaining items are held on the museum sites with a smaller amount held in storage. Access to these items is permitted to scholars and other interested parties on request to the museum officers. Information in respect of the acquisition, preservation, management and disposal of Heritage Assets is detailed in the Heritage Asset policy which can be found in Accounting Policy 11 of the financial statements (page 31).

70
7.8 Reconciliation of the Carrying Value of Tangible Heritage Assets Held
At Cost
At Valuation
Historical Sites/Monuments
Nature Reserves
Museum Collections
Civic Regalia
Total Assets
£’000 £’000 £’000 £’000 £’000
Cost & Valuation 1 Apr 2010 238 0 442 80 760 Additions 15 0 0 0 15 Disposals 0 0 0 0 0 Revaluation Impairment Losses/(Reversals)
0
0
0
0
80
0
0
0
80
0 Depreciation (8) 0 0 0 (8)
31 Mar 2011 245 0 522 80 847
Cost & Valuation 1 Apr 2011 245 0 522 80 847 Additions 0 0 0 0 0 Disposals 0 0 0 0 0 Revaluation Impairment Losses/(Reversals)
0
0
0
0
73
0
0
0
73
0 Depreciation (7) 0 0 0 (7)
31 Mar 2012 238 0 595 80 913
In the opinion of the Council Valuation Officer, conventional valuation methods are not generally appropriate for valuing Heritage Assets. This is because they may not have a market for sale, there are not likely to be any comparable sales of similar assets to relate to and they are not capable of producing a cash flow or income but rather are liabilities requiring maintenance. Equally, it is impossible to quantify what economic benefits they generate to the community in terms of attracting tourists, promoting education etc. Where valuation methods cannot be applied it is sufficient for the Council’s Valuation Officer to report that the asset cannot be valued in any meaningful way or to present a negative value to reflect the liability. Therefore, the Council’s Heritage Assets in relation to historical sites, aged monuments and nature reserves have not been reported as assets in the balance sheet. For those Heritage Assets recently acquired, these have been reported in the 2011/12 restated balance sheet and associated notes at cost (less depreciation where appropriate). The external valuer appointed by the Council, (Mitchells Antiques & Fine Art Auctioneers and Valuers), carried out a full valuation of the museum collections as at 31 March 2012. The valuations were based on commercial markets, including recent transaction information from auctions where similar types of collections are regularly purchased.

71
In addition to the above, an indicative replacement cost was obtained from a commercial supplier for the mayoral chains and ceremonial mace owned by the Council. These have been introduced to the Balance Sheet at this value. There has not been any additions, disposals or impairments of the Council’s Heritage Assets during the 2011/12 financial year. However, an upward valuation of the Council’s museum artefacts has taken place.
7.9 Reconciliation of the Carrying Value of Intangible Heritage Assets Held
Intellectual Property
£’000
At Cost 1 Apr 2010 32 Additions 0 Disposals 0 Revaluation Impairment Losses/(Reversals)
0
0 Depreciation (11)
31 Mar 2011 21
At Cost 1 Apr 2011 21 Additions 0 Disposals 0 Revaluation Impairment Losses/(Reversals)
0
0 Depreciation (11)
31 Mar 2012 10
The intellectual property is software for an interactive exhibition at the Solway Discovery Centre which provides information about the areas natural and cultural heritage.
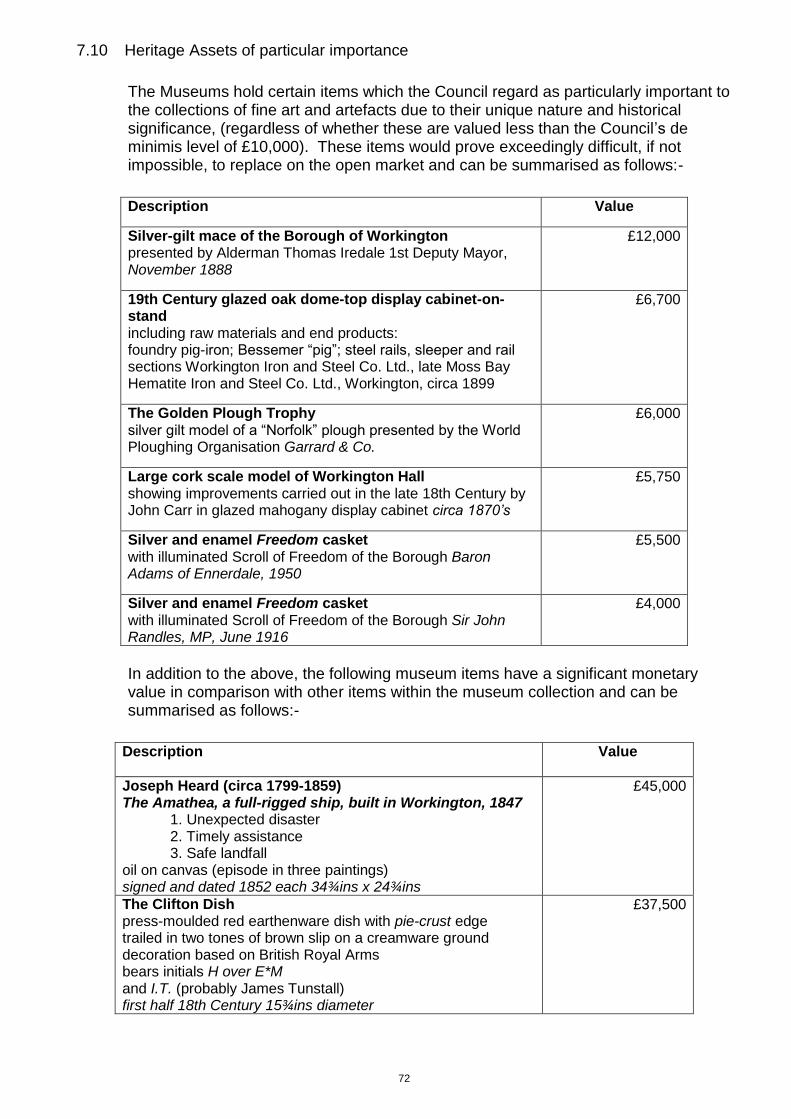
72
7.10 Heritage Assets of particular importance
The Museums hold certain items which the Council regard as particularly important to the collections of fine art and artefacts due to their unique nature and historical significance, (regardless of whether these are valued less than the Council’s de minimis level of £10,000). These items would prove exceedingly difficult, if not impossible, to replace on the open market and can be summarised as follows:-
Description Value
Silver-gilt mace of the Borough of Workington presented by Alderman Thomas Iredale 1st Deputy Mayor, November 1888
£12,000
19th Century glazed oak dome-top display cabinet-on-stand including raw materials and end products: foundry pig-iron; Bessemer “pig”; steel rails, sleeper and rail sections Workington Iron and Steel Co. Ltd., late Moss Bay Hematite Iron and Steel Co. Ltd., Workington, circa 1899
£6,700
The Golden Plough Trophy silver gilt model of a “Norfolk” plough presented by the World Ploughing Organisation Garrard & Co.
£6,000
Large cork scale model of Workington Hall showing improvements carried out in the late 18th Century by John Carr in glazed mahogany display cabinet circa 1870’s
£5,750
Silver and enamel Freedom casket with illuminated Scroll of Freedom of the Borough Baron Adams of Ennerdale, 1950
£5,500
Silver and enamel Freedom casket with illuminated Scroll of Freedom of the Borough Sir John Randles, MP, June 1916
£4,000
In addition to the above, the following museum items have a significant monetary value in comparison with other items within the museum collection and can be summarised as follows:-
Description Value
Joseph Heard (circa 1799-1859) The Amathea, a full-rigged ship, built in Workington, 1847 1. Unexpected disaster 2. Timely assistance 3. Safe landfall oil on canvas (episode in three paintings) signed and dated 1852 each 34¾ins x 24¾ins
£45,000
The Clifton Dish press-moulded red earthenware dish with pie-crust edge trailed in two tones of brown slip on a creamware ground decoration based on British Royal Arms bears initials H over E*M and I.T. (probably James Tunstall) first half 18th Century 15¾ins diameter
£37,500
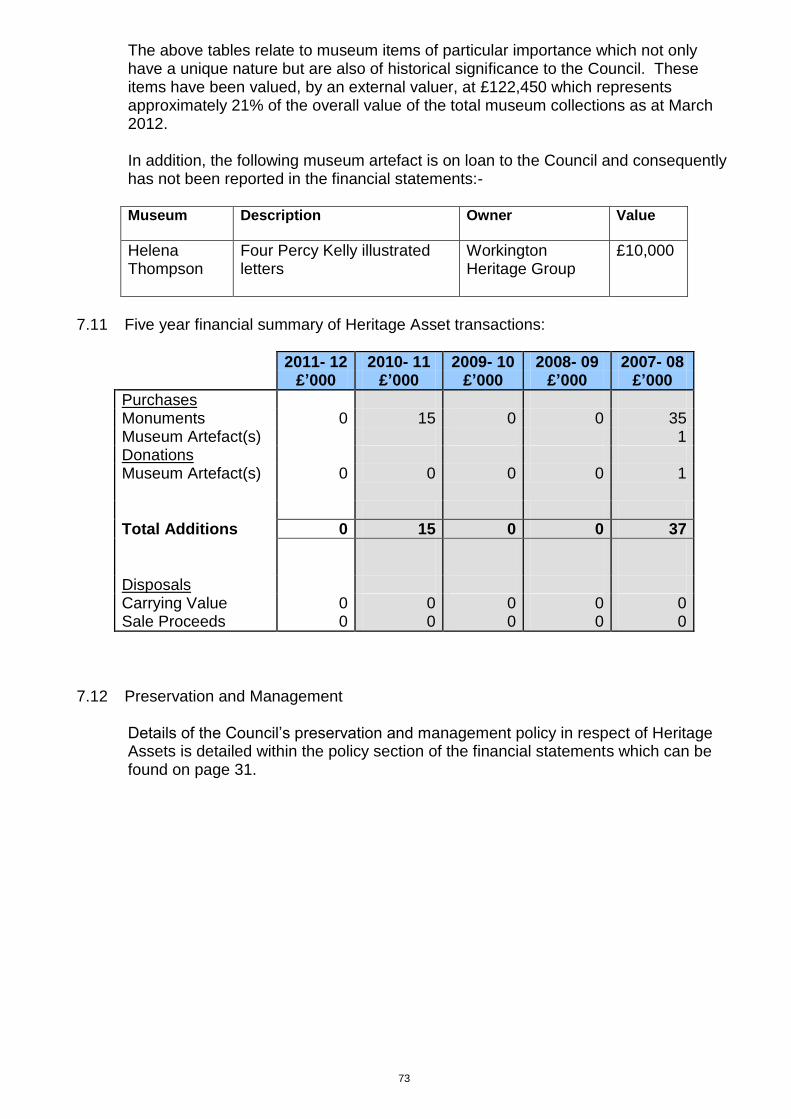
73
The above tables relate to museum items of particular importance which not only have a unique nature but are also of historical significance to the Council. These items have been valued, by an external valuer, at £122,450 which represents approximately 21% of the overall value of the total museum collections as at March 2012.
In addition, the following museum artefact is on loan to the Council and consequently has not been reported in the financial statements:-
Museum Description Owner Value
Helena Thompson
Four Percy Kelly illustrated letters
Workington Heritage Group
£10,000
7.11 Five year financial summary of Heritage Asset transactions:
2011- 12 2010- 11 2009- 10 2008- 09 2007- 08 £’000 £’000 £’000 £’000 £’000
Purchases Monuments 0 15 0 0 35 Museum Artefact(s) 1 Donations Museum Artefact(s)
0 0 0 0 1
Total Additions 0 15 0 0 37
Disposals Carrying Value 0 0 0 0 0 Sale Proceeds 0 0 0 0 0
7.12 Preservation and Management
Details of the Council’s preservation and management policy in respect of Heritage Assets is detailed within the policy section of the financial statements which can be found on page 31.

74
13 Depreciation
Depreciation is charged for all material Property, Plant and Equipment in compliance with IAS 16 and is calculated on a straight line basis. There have been no changes to the depreciation method used.
Cu
mu
lati
ve
De
pre
cia
tio
n
31 M
arc
h
2012
£’0
00
1,8
88
57
7
15
1,0
51
21
43
48
7,9
00
Resta
tem
en
t d
ue t
o r
ecla
ssific
atio
n o
f In
tan
gib
le a
nd
In
frastr
uctu
re A
sse
ts to
He
rita
ge
Asse
ts.
Ad
jus
tme
nt
to
Cu
mu
lati
ve
De
pre
cia
tio
n
201
1/1
2
£’0
00
(49
5)
0
0
0
0
0
(49
5)
An
nu
al
De
pre
cia
tio
n
201
1/1
2
£’0
00
1,0
43
93
8
13
2
10
62
0
1,9
06
Re
sta
ted
Cu
mu
lati
ve
De
pre
cia
tio
n
31 M
arc
h
2011
£’0
00
1,3
40
48
4
7
91
9
11
3,7
28
6,4
89
Pu
bli
sh
ed
Cu
mu
lati
ve
De
pre
cia
tio
n 3
1 M
arc
h
2011
£’0
00
1,3
40
48
4
0
96
8
0
3,7
78
6,5
70
Re
sta
ted
Cu
mu
lati
ve
De
pre
cia
tio
n
1 A
pri
l 2
01
0
£’0
00
1,1
25
41
6
0
77
6
0
3,1
08
5,4
25
Pu
bli
sh
ed
Cu
mu
lati
ve
De
pre
cia
tio
n
1 A
pri
l 2
01
0
£’0
00
1,1
25
41
6
0
81
5
0
3,1
46
5,5
02
La
nd
& B
uild
ing
s
Eq
uip
men
t &
Ve
hic
les
Herita
ge
Asse
ts
Tan
gib
le
Inta
ng
ible
Asse
ts
Herita
ge
Asse
ts
Inta
ng
ible
Infr
astr
uctu
re
Asse
ts
To
tal

75
7.14 Gains and Losses on Disposals of PPE
2011/12 2010/11 2009/10
Gains Losses Net Total
Gains Losses Net Total
Gains Losses Net Total
£’000 £’000 £’000 £’000 £’000 £’000 £’000 £’000 £’000
49 (698) (649) Disposals of Land & Buildings
77 (41) 36 0 (1,771) (1,771)
49 (698) (649) 77 (41) 36 0 (1,771) (1,771)
7.15 Outcome of Componentisation Procedures
The authority has not identified any material additional capital expenditure during the year which requires component accounting.
7.16 The following categories of asset were revalued as at 31 March 2012:
Assets held for sale were revalued at ‘Fair Value’ less costs to sell (if lower than the carrying amount of the asset) and their revaluation was undertaken by the Council’s Valuation Officer. Investment Properties were revalued at ‘Market Value’ – undertaken by the Council’s Valuation Officer, although one plot of land (the Cloffocks, Workington) was revalued by an external valuer. Offices and Depots (within the Property, Plant & Equipment category of asset) were also revalued by the Council’s Valuation Officer (on the basis of “Fair Value”), being the second stage of a rolling revaluation programme. All revaluations were undertaken in accordance with the Council’s Statement of Accounting Policies and the RICS “Red Book” 8th Edition March 2012. Significant assumptions made were: Some vacant land plots included in Investment Properties have been valued as potential housing sites on the assumption that planning approval will be granted in the future. No assumption has been made of any potential payments to extinguish mineral rights that may exist across these pieces of land. The revaluation of the Cloffocks site assumed that, in a future sale, planning approval would again be granted for retail purposes.

76
8) Capital Expenditure and Financing 8a
2011/12 2010/11 2009/10
£’000 £’000 £’000
Opening Capital Financing Requirement 14,344 14,955 15,589
Capital investment:-
Property Plant and Equipment 77 215 1,592
Intangible Assets 24 257 197
Investment Property 0 0 0
Revenue Expenditure Funded from Capital under Statute 612 1,826 2,527
Financing:-
Borrowing 0 0 (6)
Capital receipts (93) (529) (735)
Government grants and other contributions (587) (1,596) (3,336)
Sums set aside from revenue (33) (173) (239)
Minimum Revenue Provision (MRP) (586) (611) (634)
Reduction due to Long Term Debtor reduction 15 0 0
Reduction in Lease Liability 15 0 0
Closing Capital Financing Requirement 13,788 14,344 14,955
8b Capital Financing Requirement
Restatement due to introduction of Heritage Assets accounting requirements.
9) Commitments under Capital Contracts
There are no outstanding commitments under capital contracts as at 31 March 2012.
Published Bal sheet
at 31/3/10
Published Bal sheet
at 31/3/11
Restated Bal sheet
at 31/03/11
Movement 2011/12
Bal sheet at 31/3/12
£’000 £’000 £’000 £’000 £’000
Fixed assets 101,414 94,528 95,030 (11,139) 83,891 Long Term Debtors 70 42 42 (1) 41 Capital Adjustment Account (CAA) (76,711) (68,171) (68,054) 10,561 (57,493) Revaluation Reserve (9,788) (12,035) (12,654) 8 (12,646) Lease Liability (30) (20) (20) 15 (5)
Capital financing requirement: 14,955 14,344 14,344 (556) 13,788

77
10) Long Term Debtors
31/03/2012 31/03/2011 31/03/2010
£’000 £’000 £’000
Housing Associations 40 41 64
Mortgages 2 2 2
Officers' Car Loans 11 19 11
Commercial Organisations 0 8 23
53 70 100
11) Debtors and Payments in Advance
2011/12 2010/11 2009/10
£’000 £’000 £’000
Central Government bodies 1,789 339 2,387
Other Local Authorities 1,321 885 345
Public corporations & trading funds 0 0 0
NHS 3
Bodies external to general government 2,944 5,203 5,146
(i.e. all other bodies)
6,057 6,427 7,878
Provision for Bad and Doubtful
Debts
- Sundry (227) (144) (141)
- Council Tax (208) (200) (181)
- Benefits (579) (515) (478)
(1,014) (859) (800)
Total Debtors 5,043 5,568 7,078
Payments in Advance 35 11 550
5,078 5,579 7,628
12) Inventories
2011/12 2010/11 2009/10
£'000 £’000 £’000
Inventory 62 78 55

78
13) Long Term Creditors
2011/12 2010/11 2009/10
£'000 £'000 £'000
Finance Lease on Printers 0 0 (20)
0 0 (20)
14) Creditors and Receipts in Advance
2011/12 2010/11 2009/10
£’000 £’000 £’000
Creditors
Central Government bodies (228) (182) (58)
Other Local Authorities (1,157) (1,085) (1,315)
NHS Bodies 0 0 0
Public corporations and trading funds (46) (36) 0
Other Entities and Individuals (793) (1,434) (1,385)
HMRC (188) (192) (263)
Unpaid Holiday Pay (97) (97) (68)
(2,509) (3,026) (3,089)
Receipts In Advance
Receipts in Advance - General (405) (564) (1,589)
Receipts in Advance - Local Authority (1) (12) (5)
Receipts in Advance - Government Departments (45) (209) (64)
Receipts in Advance - NNDR 0 0 0
Receipts in Advance - Council Tax (77) (68) (61)
(528) (853) (1,719)
(3,037) (3,880) (4,808)
15) Cash and Cash Equivalents
2011/12 2010/11 2009/10
£’000 £’000 £’000
Cash at Bank 12 4 260
Short term Investments available for immediate encashment
6,885 3,091 580
Bank Overdraft 0 (781) 0
6,897 2,314 840

79
16) Investments
31.03.12 31.03.11 31.03.10
£’000 £’000 £’000
Long Term
Miscellaneous Bonds and Annuities 20 20 20
Short Term
Managed in-house 9 4,031 4,574
29 4,051 4,594
17) External Borrowing
Sources of Borrowing
As at 31 March 2012
As at 31 March 2011
As at 31 March 2010
£’000 £’000 £’000
Long Term Borrowing
Public Works Loan Board (9,984) (10,028) (10,069)
Local Bonds (30) (30) (30)
Trust Funds (70) (70) (70)
Total (10,084) (10,128) (10,169)
Short Term Borrowing (392) (387) (883)
(includes accrued interest)
(10,476) (10,515) (11,052)
Analysis of loans by maturity
As at 31 March 2012
£’000
As at 31 March 2011
£’000
As at 31 March 2010
£’000
Less than 1 year (392) (387) (883)
Between 1 & 2 years (148) (144) (141)
Between 2 & 5 years (170) (156) (143)
Between 5 & 10 years (402) (368) (338)
More than 10 years (9,364) (9,460) (9,547)
(10,476) (10,515) (11,052)

80
18) Financial Instruments (a) Financial Instruments - Classifications
The accounting standards in respect of financial instruments were incorporated into the Local Authority SORP in 2007. The 2011/12 Code of Practice notes that where they continue to be relevant, the transitional provisions of the UK standards adopted by the 2007 SORP remain.
The definition of a financial instrument is: ‘Any contract that gives rise to a financial asset of one entity and a financial liability or equity instrument of another entity’.
The term ‘financial instrument’ covers both financial assets and financial liabilities. These range from straightforward trade receivables and trade payables to more complex transactions such as financial guarantees, derivatives and embedded derivatives. The Council’s borrowing, finance leases, and investment transactions are also classified as financial instruments.
Financial Liabilities
A Financial Liability is an obligation to transfer economic benefits controlled by the Council and can be represented by a contractual obligation to deliver cash or financial assets or an obligation to exchange financial assets and liabilities with another entity that are potentially unfavourable to the Council.
The Council’s loan portfolio at year end consisted of PWLB and some direct borrowing. Under the 2011/12 Code of Practice these forms of borrowing are measured at amortised cost. This form of measurement does not change the amount of cash paid under the terms of the loan but can impact on the charge made to the Comprehensive Income and Expenditure Statement.
The Council also had other deferred liability commitments, represented by finance leases.
Financial Assets
A Financial Asset is a right to future economic benefits controlled by the Council that is represented by cash or other instruments or a contractual right to receive cash or another financial asset.
The three classifications for financial assets under the Code of Practice are:
Loans and Receivables;
Available for Sale; and
Fair Value through Profit or Loss. The Council’s portfolio of investments consists of fixed term deposits, money market funds, and call/notice accounts. Term deposits and call accounts are classed as ‘Loans and Receivables’ and are measured at amortised cost. This form of measurement does not change the amount of cash received under the terms of the investment. Trade Receivables (i.e. Trade Debtors) are classified as Loans and Receivables. These have been measured at cost on the Balance Sheet.
Money Market Funds are classified as Available for Sale.

81
Balances in money market funds and call accounts at 31st March 2012 are shown under ‘cash and cash equivalents’ in the Balance Sheet, as they represent highly liquid investments that are readily convertible to known amounts of cash, with an insignificant risk of changes in value. The Council does not have any investments required to be measured at Fair Value through Profit or Loss.
a) Categories of Financial Instruments
The following categories of Financial Instruments are carried on the Balance Sheet:
Long-term Current
2011/12 2010/11 2011/12 2010/11
£’000 £’000 £’000 £’000
Investments
Loans and receivables 20 20 884 4,935
Available for Sale financial assets 0 0 6,010 2,187
Unquoted equity investment at cost 0 0 0 0
Financial assets at fair value through profit and loss
0 0 0 0
Total Investments 20 20 6,894 7,122
Debtors
Loans and receivables 54 70 Financial assets carried at contract amounts 2,825 4,279
Total included in Debtors 54 70 2,825 4,279
Borrowings
Financial liabilities at amortised cost 10,084 10,128 392 387 Financial assets at fair value through profit and loss 0 0 0 0
Total included in borrowings 10,084 10,128 392 387
b) Material Soft Loans made by the Council
The Council does not have any Soft Loans.
Other Long-Term Liabilities
PFI and finance lease liabilities 5 20
Total other long-term liabilities 5 20
Creditors
Financial liabilities at amortised cost 0 0 1,225 1,868 Financial assets carried at contract amounts 0 0 0 0
Total Creditors 0 0 1,225 1,868

82
c) Gains and Losses on Financial Instruments
The Gains and Losses recognised in the Comprehensive Income and Expenditure Statement in 2011/12 and Movement in Reserve Statement (if appropriate) in relation to financial instruments are made up as follows:
2011/12 2010/11
Financial Liabilities Amortised
Cost
Financial Assets
Loans and Receivables
Financial Assets
Fair Value
Financial Liabilities Amortised
Cost
Financial Assets
Loans and Receivables
Financial Assets Fair
Value
£’000 £’000 £’000 £’000 £’000 £’000
Interest Costs 730 737
Impairment Losses (Bad Debt Provision)
227 0
Interest Payable and Similar Charges
730 227 0 737 0 0
Interest Income (125) (130)
Gains on Derecognition
Interest & Investment Income 0 (125) 0 0 (130) 0
Net Gain/(Loss) for year 730 102 0 737 (130) 0
c) d) Fair Value of Assets and Liabilities carried at Amortised Cost
Financial liabilities and financial assets represented by loans and receivables are carried in the Balance Sheet at amortised cost. Their fair value can be assessed by calculating the present value of the cash flows that will take place over the remaining term of the instruments, using the following assumptions:
The fair value of PWLB debt has been provided, for both 31 March 2011 and 31 March 2012 by the Public Works Loan Board. The figures have been calculated by reference to the premature repayments set of rates in force on those days
early repayment or impairment is not recognised
where an instrument will mature in the next 12 months, the carrying amount is assumed to approximate to fair value
the fair value of operational liabilities and receivables is taken to be the invoiced or billed amount.

83
The fair values calculated are as follows:
31-Mar-12 31-Mar-11
Carrying Amount
Fair value Carrying Amount
Fair Value
£'000 £'000 £'000 £'000
Financial Liabilities:
PWLB debt 10,028 18,219 10,068 15,651 Other 101 101 101 101 Financial Assets: Loans and receivables 83 83 4,121 4,136
Financial Liabilities The fair value is more than the carrying amount because the Council’s loan portfolio includes a number of fixed rate loans where the interest payable is more than the rates available for similar loans at the Balance Sheet date. This commitment to pay interest above current market rates increases the amount that the authority would have to pay if the lender requested or agreed to the early repayment of the loans. Financial Assets The fair value is the same as the carrying amount because the Council’s investment portfolio includes fixed rate investments where the interest receivable is identical to the rates available for similar loans at the Balance Sheet date.
e) Nature and Extent of Risks arising from Financial Instruments
The Council has adopted CIPFA’s Code of Practice on Treasury Management (and subsequent amendments) and complies with The Prudential Code for Capital Finance in Local Authorities (both revised in November 2011).
The Council’s activities expose it to a variety of financial risks:
credit risk – the possibility that other parties might fail to pay amounts due to the Council
liquidity risk – the possibility that the Council might not have funds available to meet its commitments to make payments
market risk – the possibility that financial loss might arise for the Council as a result of changes in such measures as interest rates.
The Council’s annual treasury management strategy focuses on those risks and seeks to minimise potential adverse effects on the resources available to fund services. The Council provides written principles for overall risk management, as well as written policies covering specific areas, such as interest rate risk, credit risk and the investment of surplus cash.

84
i) Credit Risk
Credit risk arises from deposits with banks and financial institutions, as well as credit exposures to the Council’s customers. Deposits are placed with the Debt Management Office, other local authorities, AAA-rated Money Market Funds and Banks and Building Societies of sufficiently high credit quality as set out in the Treasury Management Strategy. A limit of £4 million may be placed with any institution or group of institutions that are part of the same banking group. It must be noted that, although credit ratings remain a key source of information, the Council recognises that they have limitations and investment decisions are based on a range of credit indicators. All investments have been made in line with the Council’s Treasury Management Strategy Statement for 2011/12. Customers are encouraged to pay up front and the financial position and past experience of customers is monitored. The following analysis summarises the Council’s potential maximum exposure to credit risk, based on experience of default and uncollectability over the last three financial years, adjusted to reflect current market conditions.
Amount at 31 March
2012
Historical experience of
default
Historical experience adjusted for
market conditions at 31 March
2012
Estimated Maximum
exposure to default and
uncollectability
£'000 % % £'000
A B C (A X C)
Deposits with banks 6,885 0 0 0
and financial institutions
Customers (Debtors) 2,828 2.0 3.0 85
85
The Council does not expect any losses from non-performance by any of its counterparties in relation to deposits with banks and financial institutions.
The debt outstanding in respect of customers considered as part of the credit risk analysis relates to contractual debt and forms part of the total debtors figure within the balance sheet. The figure for customers’ debt is derived as follows:
£'000 £'000
Long Term Debtors 54
Debtors (Gross) 6,092
Payments in advance (361) 5,731
5,785
Non contractual debtors (2,957)
2,828

85
The Council makes provision to cover potential bad debts within its accounts. The level of provision at 31 March 2012 is as follows:
£'000
Balance at I April 2011 144
Increase in required provision 83
Balance at 31 March 2012 227
The Council generally expects its customers to settle outstanding accounts within 28 days. £1,205,397.93 of the outstanding debt is past its due date for payment. The aged debt analysis of this debt is as follows:
ii) Liquidity risk
As the Council has ready access to borrowings from the Public Works Loan Board, there is no significant risk that it will be unable to raise finance to meet its commitments under financial instruments. Instead, the risk is that the authority will need to replenish a significant proportion of its borrowings at a time of unfavourable interest rates. The strategy adopted to manage the position is to ensure a smooth maturity profile through a combination of careful planning of new loans taken out and, (where it is economic to do so), making early repayments, or rescheduling. There is currently a maturity peak of £5 million in 2056/57, however this is not considered a significant risk as it is anticipated that rescheduling opportunities will arise before the maturity date. The maturity analysis of financial liabilities is as follows:
All trade and other payables are due to be paid in less than one year.
£’000
1 to 6 months 876
6 to 12 months 51
Over 12 months 278
1,205
£’000
Less than 1 year - Creditors 2,536
- Borrowings 392
Between 1 and 2 years - 148
Between 2 and 5 years 170
Between 5 and 10 years 402
More than 10 years 9,364
13,012

86
iii) Market Risk Interest Rate Risk
The Council is exposed to risk in terms of its exposure to interest rate movements on its borrowings and investments. Movements in interest rates have a complex impact on the Council. For instance, a rise in interest rates would have the following effects:
borrowings at variable rates – the interest expense charged to the Income and Expenditure Account will rise
borrowings at fixed rates – the fair value of the liabilities borrowings will fall
investments at variable rates – the interest income credited to the Income and Expenditure Account will rise
investments at fixed rates – the fair value of the assets will fall.
Borrowings are not carried at fair value, so nominal gains and losses on fixed rate borrowings would not impact on the Comprehensive Income and Expenditure Statement or Movement in Reserves Statement. However, changes in interest payable and receivable on variable rate borrowings and investments will be posted to the Comprehensive Income and Expenditure Statement and affect the General Fund Balance pound for pound. Investments managed in house are not carried in the Balance Sheet at fair value, so nominal gains and losses on fixed rate financial instruments have no impact on the Comprehensive Income and Expenditure Statement or the Movement in Reserves Statement. The Council has a number of strategies for managing interest rate risk. The policy operated is to aim to permit up to a maximum of 100% of its borrowings in variable rate loans. During periods of falling interest rates, and where economic circumstances make it favourable, fixed loan rates may be repaid early to limit exposure to losses. The risk of loss is ameliorated by the fact that a proportion of government grant payable of financing costs will normally move with prevailing interest rates or the Council’s cost of borrowing and provide compensation for a proportion of any higher costs.
The Council undertakes its borrowing and investment function within parameters set out in its Treasury Management Strategy, which assess interest rate exposure to feed into the budget process and which is used to update the budget throughout the year. This allows any adverse changes to be accommodated. The analysis will also advise whether new borrowing taken out is fixed or variable.
According to this assessment strategy, at 31st March 2012, if interest rates had been 1% higher than the average of all variable rates, the financial effect would be:
£'000
Increase in interest payable on variable rate borrowings 0
Increase in interest receivable on variable rate investments 150
Impact on Comprehensive Income & Expenditure Statement 150
Increase/(Decrease) in fair value of fixed value
borrowings (no impact on CI & E Statement) 2,867

87
Although interest rates are at a historical low, the financial impact of a 1% fall in rates would be:
£'000
Decrease in interest payable on variable rate borrowings 0
Decrease in interest receivable on variable rate investments
(150)
Impact on Comprehensive Income & Expenditure Statement
(150)
Increase/(Decrease) in fair value of fixed value borrowings (no impact on CI & E Statement)
3,840
Cash and Cash Equivalents Cash compromises cash on hand and demand deposits. Cash will also include bank overdrafts that are repayable on demand and that are integral to the Council’s cash management.
Balances classified as “Cash Equivalents” fit the definition of being short-term, highly liquid investments that are readily convertible to known amounts of cash and which are subject to an insignificant risk of change in value. The net balance of cash and cash equivalents is made up of the following elements at Balance Sheet date:
2011/12 2010/11 2009/10
£’000 £’000 £’000
Cash and bank balances 12 4 260
Call accounts (same day access funds) 875 904 580
Money Market Funds 6,010 2,187
Bank overdraft 0 (781) 0
Total Cash & Cash Equivalents 6,897 2,314 840
19) Trading Concerns The Council operates a number of Industrial Estates within the Borough. The
financial results for the operation are as follows:
Trading Estates 2011/12 2010/11 2009/10
£’000 £’000 £’000
Expenditure 79 48 69
Income (250) (268) (230)
(Surplus)/Deficit (171) (220)
(161)

88
20) Audit Costs
In 2011/12, the Council incurred the following fees relating to external audit and inspection work:
2011/12 2010/11 2009/10
£’000 £’000 £’000
Fees payable to the Audit Commission with regard to external audit services carried out by the appointed auditor 107 122
113
Fees payable to the Audit Commission in respect of statutory inspection 0 0
0
Fees payable to the Audit Commission for the certification of grant claims and returns 36 31
60
Fees payable in respect of other services provided by the appointed auditor 0 0
0
143 153
173

89
21) Members’ Allowances and Officers Remuneration
a) The Authority paid the following amounts to members of the Council during the year.
b) The number of employees whose remuneration, excluding pension
contributions, was £50,000 or more, in bands of £5,000 was:
2011/12 £
2010/11 £
Salaries 159,297.38 163,659.64
Allowances 74,210.28 76,693.25
Expenses 10,843.04 14,884.10
Total 244,350.70 255,236.99
Remuneration Band Number of Employees
2011/12 2010/11
£50,000 - £54,999 0 2 £55,000 - £59,999 4 3 £60,000 - £64,999 0 0 £65,000 - £69,999 0 0 £70,000 - £74,999 1 0 £75,000 - £79,999 0 0 £80,000 - £84,999 0 0 £85,000 - £89,999 0 0 £90,000 - £94,999 0 0 £95,000 - £99,999 0 0 £100,000 - £104,999 1 1
TOTAL 6 6

90
Note 1 – The Deputy Chief Executive was appointed on 2 August 2010. The annualised salary was £71,000.
Note 2 – The Strategic Manager – Resources – was appointed on 21 June 2010. The annualised salary was £56,000.
Remuneration for Senior Employees 2011/12
Post Title
Salary (including fees and
allowances) Expense
Allowances
Compensation for loss of
office
Total Remuneration
excluding pension
contributions 2011/12
Pension contributions
Total Remuneration
including pension
contributions 2011/12
Chief Executive 99,999.96 1,646.14 0.00 101,646.10 22,299.96 123,946.06
Deputy Chief Executive
72,999.96 710.08 0.00 73,710.04 16,278.96 89,989.00
Strategic Manager Business
56,000.04 385.09 0.00 56,385.13 12,488.04 68,873.17
Strategic Manager People
56,000.04 842.64 0.00 56,842.68 12,488.04 69,330.72
Strategic Manager Places
56,000.04 261.09 0.00 56,261.13 12,488.04 68,749.17
Strategic Manager Resources
56,000.04 474.90 0.00 56,474.94 12,488.04 68,962.98
397,000.08 4,319.94 0.00 401,320.02 88,531.08 489,851.10
Remuneration for Senior Employees 2010/11
Post Title
Salary (including fees and
allowances) Expense
Allowances
Compensation for loss of
office
Total Remuneration
excluding pension
contributions 2010/11
Pension contributions
Total Remuneration
including pension
contributions 2010/11
Chief Executive 99,999.96 2,455.50 0.00 102,455.46 19,599.96 122,055.42
Deputy Chief Executive 47,142.50 7,052.26 0.00 54,194.76 9,239.95 63,434.71
Strategic Manager Business 52,833.31 2,688.43 0.00 55,521.74 10,485.98 66,007.72 Strategic Manager People 52,833.31 3,591.52 0.00 56,424.83 10,485.98 66,910.81 Strategic Manager Places 52,833.31 4,731.73 0.00 57,565.04 10,844.66 68,409.70 Strategic Manager Resources 43,555.59 7,624.26 0.00 51,179.85 8,536.92 55,716.77
349,197.98 28,143.70 0.00 377,341.68 69,193.45 446,535.13

91
The numbers of exit packages with total cost per band and total cost of the compulsory and other redundancies are set out in the table below:
Exit Packages 2011/12
Exit package cost band (including
special payments)
Number of compulsory
redundancies
Number of other
departures agreed
Total number of exit
packages by cost band
Total cost of exit packages in each
band
2010/11 2011/12 2010/11 2011/12 2010/11 2011/12 2010/11 2011/12
£0 - £20,000 3 3 3 0 6 3 £46,464.01 £18,609.73
£20,001 - £40,000 1 1 0 2 1 3 £35,544.82 £72,320.39
£40,001 - £60,000 0 0 0 0 0 0 £0 £0
£60,001 - £80,000 0 1 0 1 0 2 £0 £138,915.25
£80,001 - £100,000 0 0 0 0 0 0 £0 £0
£100,001 - £150,000 0 0 0 0 0 0 £0 £0
4 5 3 3 7 8 £82,008.83 £229,845.37
.

92
22) Related Party Transactions The 2010 Accounting Code of Practice requires information in respect of material transactions with related parties to be disclosed. A number of these transactions have already been disclosed within the financial statements as follows:
a) Transactions with Central Government and Parish Councils have been disclosed within the Comprehensive Income and Expenditure Statement, Cashflow Statement and Collection Fund Account.
b) Transactions with the County Council and Police Authority are disclosed in the Collection Fund Account
c) Transactions with the Pension Fund are disclosed in the Statement of Accounts and note 29.
The following are the material transactions with related parties, which were undertaken in 2011/12, and which are not disclosed elsewhere within the Accounts:
Related Party and Declared Relationships
Income Expenditure Balance at
Association
2011/12 Year end £ £ £
Carlisle Leisure 237,468 1,166,784 1 Board Member
Cumbria Law Centre (Carlisle) 84 60,837 1 Management Committee Member
Keswick Museum 0 48,698 1 Director
Maryport & North Allerdale Credit Union 0 14,197 1 Member
Maryport Developments Ltd 0 135,498 1 Director, 1 Chairperson
Maryport Festivals 17,102 16,396 1 Director, 1 Committee Member
North Allerdale Development Trust 0 25,000 1 Director who is a Trustee

93
23) Leases
23.1 Finance Lease The Council entered into a Leasing agreement with Xerox for 2 printers in 2003 which was classified as an Operating lease until 2009-10. Under new IFRS regulations it has been classified as a Finance Lease. The assets are carried under Property, Plant and Equipment in the Balance Sheet at the following amounts:
31-Mar-12 (£)
31-Mar-11 (£)
Equipment 4,940 14,800
The minimum lease payments are made up of the following amounts:
31-Mar-12 (£)
31-Mar-11 (£)
Finance Lease Liabilities Current 4,910 20,130 Non-Current Finance Costs Payable in the future 550 7,182
Minimum Lease Payments 5,460 27,312
23.2 Operating Lease
The Council uses some rental housing units for homeless people. It also rents a Multi-Storey car park in Workington as well as other car parks in Keswick The Council rents vehicles for its own use. The details of minimum lease payments are as follows:
ABC as Lessee of Operating leases
Future minimum rent payable < 1 yr
(£)
Future minimum rent payable btwn
2-5 yrs (£)
Future minimum rent
payable > 5 yrs (£)
Property Leases 323,892 955,792 5,325,665
Ground rent 14,000 0 0
Vehicles 31,362 8,185 0
369,254 963,977 5,325,665
The minimum lease payments include contingent rents, such as adjustments for rent reviews.

94
The Council acts as a lessor in respect of land and property owned by it and leased to tenants. The future minimum lease payments due under these arrangements are as follows:
ABC as Lessor of Operating leases
Future minimum payments
receivable < 1 yr (£)
Future minimum payments receivable
btwn 2-5 yrs (£)
Future minimum payments receivable
> 5 yrs (£)
Small Licence Allotment 26,098 0 0
Industrial Land 299,383 884,488 10,733,682
Shops/sub station 1,085,185 3,970,623 68,109,384
1,410,666 4,855,111 78,843,066
The minimum lease payments receivable included contingent rents, such as adjustments for rent reviews. In 2011/12, contingent rents received by the Authority after the rent reviews amounted to £400.

95
24) Service Expenditure Analysis
2011/12 Service Expenditure Analysis
Portfolios
Customer & Regulatory
Economic Growth
Organisational Development
Locality Services Total
Services
Fees, charges & other service income
(1,278) (1,459) (190) (6,415) (9,342)
Government grants (33,609) (262) 0 0 (33,871)
Support Service Recharges 0 0 0 (249) (249)
Total Income (34,887) (1,721) (190) (6,664) (43,462)
Employee expenses 32 347 88 115 582
Other operating expenses 33,307 1,197 46 9,292 43,841
Depreciation, Amortisation & Impairment
60 61 166 946 1,233
Support Service Recharges 3,114 2,238 1,254 2,570 9,176
Total operating expenses 36,512 3,843 1,554 12,923 54,831
Cost of Services 1,625 2,122 1,364 6,259 11,369
It is a requirement to provide detailed analysis of expenditure and income which totals at least 75% of the Net Cost of Services. The table above provides detail of 84.92% of the Net Cost of Services.
2010/11 Service Expenditure Analysis Portfolios
People Places Total
Fees, charges & other service income (978) (6,857) (7,835)
Government grants (32,513) 0 (32,513)
Support Service Recharges 0 (245) (245)
Total Income (33,491) (7,102) (40,593)
Employee expenses 2,057 1,297 3,354
Other operating expenses 34,098 10,728 44,826
Support Service Recharges 487 1,153 1,640
Total operating expenses 36,642 13,178 49,820
Cost of Services 3,151 6,076 9,227
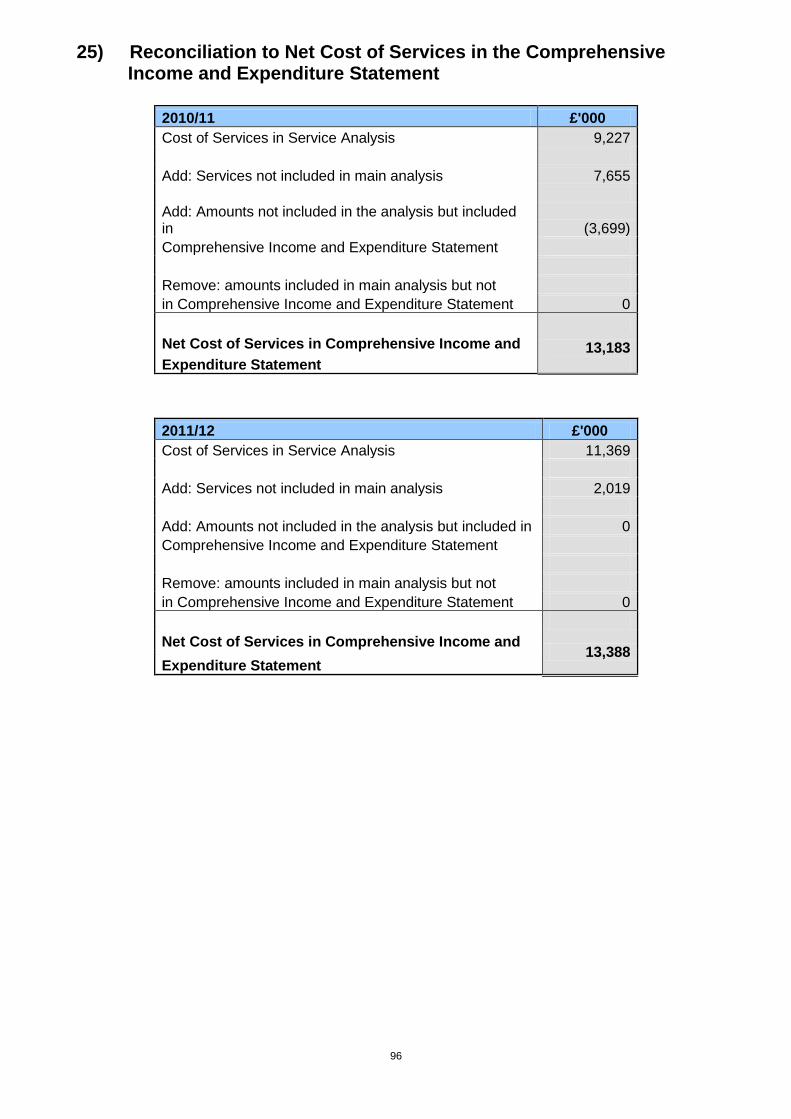
96
25) Reconciliation to Net Cost of Services in the Comprehensive Income and Expenditure Statement
2010/11 £'000
Cost of Services in Service Analysis 9,227
Add: Services not included in main analysis 7,655
Add: Amounts not included in the analysis but included in (3,699)
Comprehensive Income and Expenditure Statement
Remove: amounts included in main analysis but not
in Comprehensive Income and Expenditure Statement 0
Net Cost of Services in Comprehensive Income and 13,183 Expenditure Statement
2011/12 £'000
Cost of Services in Service Analysis 11,369
Add: Services not included in main analysis 2,019
Add: Amounts not included in the analysis but included in 0
Comprehensive Income and Expenditure Statement
Remove: amounts included in main analysis but not
in Comprehensive Income and Expenditure Statement 0
Net Cost of Services in Comprehensive Income and 13,388
Expenditure Statement

97
26) Reconciliation to Subjective Analysis
Reconciliation to Subjective Service Services Not Not Net Cost Corporate Total
Analysis Analysis not in reported
to included of Amounts
2011/12 Analysis Mngm't in I&E Services
Fees, charges & other service income
(9,342) (2,194) 0 0 (11,536) (6,432) (17,968)
Interest and investment income 0 0 0 0 0 0 0
Income from council tax 0 0 0 0 0 (5,916) (5,916)
Government grants and contributions (33,871) (80) 0 0 (33,951) (2,553) (36,504)
Recharges (249) (143) 0 0 (392) 0 (392)
Total Income (43,462) (2,417) 0 0 (45,879) (14,901) (60,780)
Employee expenses 582 377 0 0 959 0 959
Other service expenses 43,841 1,771 0 0 45,612 0 45,612
Depreciation, Amortisation & Impairment
1,233 574 0 0 1,807 0 1,807
Support Service recharges 9,176 1,714 0 0 10,890 0 10,890
Revaluations 0 0 0 0 0 9,067 9,067
Interest Payments 0 0 0 0 0 605 605
Precepts & Levies 0 0 0 0 0 1,238 1,238
Pension Interest costs 0 0 0 0 0 913 913
Exceptional items 0 0 0 0 0 0 0
(Gain) or Loss on Disposal of Fixed Assets
0 0 0 0 0 648 648
Total operating expenses 54,831 4,436 0 0 59,267 12,471 71,738
(Surplus) or deficit on the provision of services
11,369 2,019 0 0 13,388 (2,430) 10,958
Reconciliation to Subjective Service Services Not Not Net Cost Corporate Total
Analysis Analysis not in reported
to included of Amounts
2010/11 Analysis Mngm't in I&E Services
Fees, charges & other service income (7,835) (3,906) 0 0 (11,741) (9,506) (21,247)
Interest and investment income 0 0 0 0 0 0 0
Income from council tax 0 0 0 0 0 (5,792) (5,792)
Government grants and contributions (32,513) (529) 0 0 (33,042) (2,768) (35,810)
Recharges (245) (177) 0 0 (422) 0 (422)
Total Income (40,593) (4,612) 0 0 (45,205) (18,066) (63,271)
Employee expenses 3,354 4,469 0 0 7,823 0 7,823
Other service expenses 44,826 9,062 0 0 53,888 0 53,888
Support Service recharges 1,640 (1,264) 0 0 376 0 376
Revaluations 0 0 0 0 0 8,140 8,140
Interest Payments 0 0 0 0 0 607 607
Precepts & Levies 0 0 0 0 0 1,158 1,158
Pension Interest costs 0 0 0 0 0 1,295 1,295
Exceptional Items 0 (3,699) 0 0 (3,699) 0 (3,699)
(Gain) or Loss on Disposal of Fixed Assets 0 0 0 0 0 (35) (35)
Total operating expenses 49,820 8,568 0 0 58,388 11,165 69,553
(Surplus) or deficit on the provision of services 9,227 3,956 0 0 13,183 (6,901) 6,282

98
27) Provisions
Liabilities in the Balance Sheet include the following provisions:
Long Term Short Term
£’000 £’000
2011/12 2010/11 2009/10 2011/12 2010/11 2009/10
Insurance Excess Provision (251) (242) (222) 0 0 (20)
Early Retirement 0 0 (8) 0 0 0
Government Departments 0 0 0 0 0 (19)
Curwen Land Slip (150) (411) 0 0 0 0
Job Evaluation 0 0 0 0 (55) (55)
Redundancy & Pension 0 0 0 (175) 0 0
(401) (653) (230) (175) (55) (94)
It is envisaged that the majority of the provisions detailed below may take place during 2012/13, however the Council do have a reducing spend programme up to 2014/15. Insurance Within the provisions shown on the Balance Sheet is an amount of £251,000 which has been set aside to meet uninsured liabilities, such as the £5,000 excess on the Council’s Public Liability and Employer’s Liability insurance in respect of notified claims and claims incurred but not reported. There has been a £9,000 increase on this provision during the year.
Notified Claims At 31 March 2012, the gross estimated value of settlement costs in respect of outstanding notified liability claims was £231,444. Of this, the Council is liable to pay £67,521 and the Council’s insurers the balance of £163,923. Claims incurred but not reported: At 31 March 2012, the Council’s estimated liability in respect of claims incurred but not reported was £115,000. Curwen Land Slip
A landslip has occurred on land which is within the ownership of the Council. The Council previously accounted for a provision of £411,000 for the potential costs of reinstating the land. After tender for a revised scheme and subject to any unforeseen issues, i.e. ground conditions and access, the revised provision is now stated as £150,000.

99
Redundancy & Pension The authority’s Comprehensive Income and Expenditure Statement includes a provision of £175,000 for employee termination benefits these had been agreed as at the 31 March 2012. The provision is detailed as follows £97,000 redundancy costs and £78,000 employer pension costs. The number of exit packages with total cost per band and total cost of the compulsory and other redundancies are set out in the table in Note 21 page 91.
28) Future Accounting Standards disclosures
The adoption of IFRS 7 – Financial Instruments Disclosures results in a change of accounting policy. The Code of Practice for 2012 introduced a change in accounting treatment of Financial Instruments held by the Council. In the financial statements for 2012/13, the effect of the change will be assessed and where necessary the comparative figures restated. However, it is not expected that this change will have a material impact on the financial statements of this Council.

100
29) Pensions
Participation in Pension Schemes As part of the terms and conditions of employment of its’ officers and other employees, the Council offers post employment (retirement) benefits. Although these benefits will not actually be payable until employees retire, the Council has a commitment to make these payments that needs to be disclosed at the time that employees earn their future entitlement.
Allerdale Borough Council participates in the Local Government Pension Scheme
for civilian employees, administered by Cumbria County Council. This is a funded defined benefit scheme, meaning that the Council and employees pay contributions into a fund, calculated at a level intended to balance the pensions liabilities with investment assets.
Transactions Relating to Retirement Benefits The Council recognises the cost of retirement benefits in the reported cost of services when they are earned by employees, rather than when the benefits are eventually paid as pensions. However, the charge the Council is required to make against council tax is based on the cash payable in the year, so the real cost of post employment (retirement) benefits is reversed out in the General Fund via the Movement in Reserves Statement. The following transactions have been made in the Comprehensive Income and Expenditure Statement and the General Fund Balance via the Movement in Reserves Statement during the year:
Local Government Pension Scheme
2011/12 2010/11 2009/10
Comprehensive Income and Expenditure Statement £'000 £'000 £'000
Cost of Services
7 current service cost 942 1,104 843
8 past service costs (gains) 0 (4,326) 0 9 curtailment costs 96 288 785
Financing and Investment Income and Expenditure
10 interest cost 3,751 4,066 3,791
11 expected return on assets in the scheme (2,838) (2,771) (2,200)
Total Post Employment Benefit Charged to the Surplus or Deficit on the Provision of Services 1,951 (1,639) 3,219
Other Post Employment Benefit Charged to the Comprehensive Income and Expenditure Statement actuarial (gains) and losses 2,936 (2,531) 8,573
Total Post Employment Benefit Charged to the Comprehensive Income and Expenditure Statement 4,887
(4,170) 11,792
Movement in Reserves Statement 12 reversal of net charges made to the Surplus or Deficit for
the Provision of Services for post employment benefits in accordance with the Code (1,951) 1,639 (3,219)
Actual amount charged against the General Fund Balance for pensions in the year:
13 employers' contributions payable to scheme 1,590 1,619 2,264

101
The cumulative amount of actuarial gains and losses recognised in the Comprehensive Income and Expenditure Statement to the 31st March 2012 is £11,052,000.
Assets and Liabilities in relation to Post Employment Benefits Reconciliation of present value of the scheme liabilities:
Local Government Pension Scheme
2011/12 2010/11 2009/10
£'000 £'000 £'000
Opening balance as at 1 April 68,707 73,494 54,354
Current Service Cost 942 1,104 843
Interest Cost 3,751 4,066 3,791
Contributions by scheme participants 392 395 477
Actuarial Gains / Losses 2,425 (3,023) 16,473
Benefits Paid (2,362) (3,291) (3,229)
Past Service Costs 0 (4,326) 0
Curtailments 96 288 785
Closing Balance as at 31st
March 73,951 68,707 73,494
Reconciliation of present value of the scheme assets:
Local Government Pension Scheme
2011/12 2010/11 2009/10
£’000 £’000 £'000
Opening balance as at 1st April 46,829 45,827 36,215
Expected rate of return 2,838 2,771 2,200
Actuarial gains and losses (511) (492) 7,900
Employer contributions 1,590 1,619 2,264
Contributions by scheme participants 392 395 477
Benefits Paid (2,362) (3,291) (3,229)
Closing balance as at 31st
March 48,776 46,829 45,827
The expected return on scheme assets is determined by considering the expected returns available on the assets underlying the current investment policy. Expected yields on fixed interest investments are based on gross redemptions yields as at the Balance Sheet date. Expected returns on equity investments reflect long-term real rates of return experienced in the respective markets. The actual return on the scheme plan assets is £2,327,000 in 2011/12 (£3,498,000 in 2010/11.)

102
Scheme History The liabilities show the underlying commitments that the authority has in the long-run to pay post employment (retirement) benefits. The total liability of £ 25.1 million has a substantial impact on the net worth of the authority as recorded in the Balance Sheet. However, statutory arrangements for funding the deficit mean that the financial position of the Council remains healthy, as the deficit on the local government scheme will be made good by increased contributions over the remaining working life of employees (i.e. before payments fall due), as assessed by the scheme actuary.
The total contributions expected to be made to the Cumbria County Council Pension Scheme by the Council in the year to 31 March 2013 is £1.5 million. Basis for Estimating Assets and Liabilities Liabilities have been assessed on an actuarial basis using the projected unit credit method, an estimate of the pensions that will be payable in future years dependent on assumptions about mortality rates, salary levels, etc. The County Council Fund liabilities have been assessed by Mercers Human Resource Consulting Limited, an independent firm of actuaries, estimates for the County Council Fund being based on the latest full valuation of the scheme at 31 March 2010.
Local Government Pension Scheme
2011/12 £’000
2010/11 £’000
2009/10 £’000
2008/09 £’000
2007/08 as
restated £’000
Present value of liabilities 73,951 68,707 73,494 54,354 64,329
Fair value of assets 48,776 46,829 45,827 36,215 45,027
Surplus / (deficit) in the scheme (25,175) (21,878) (27,667) (18,139) (19,302)
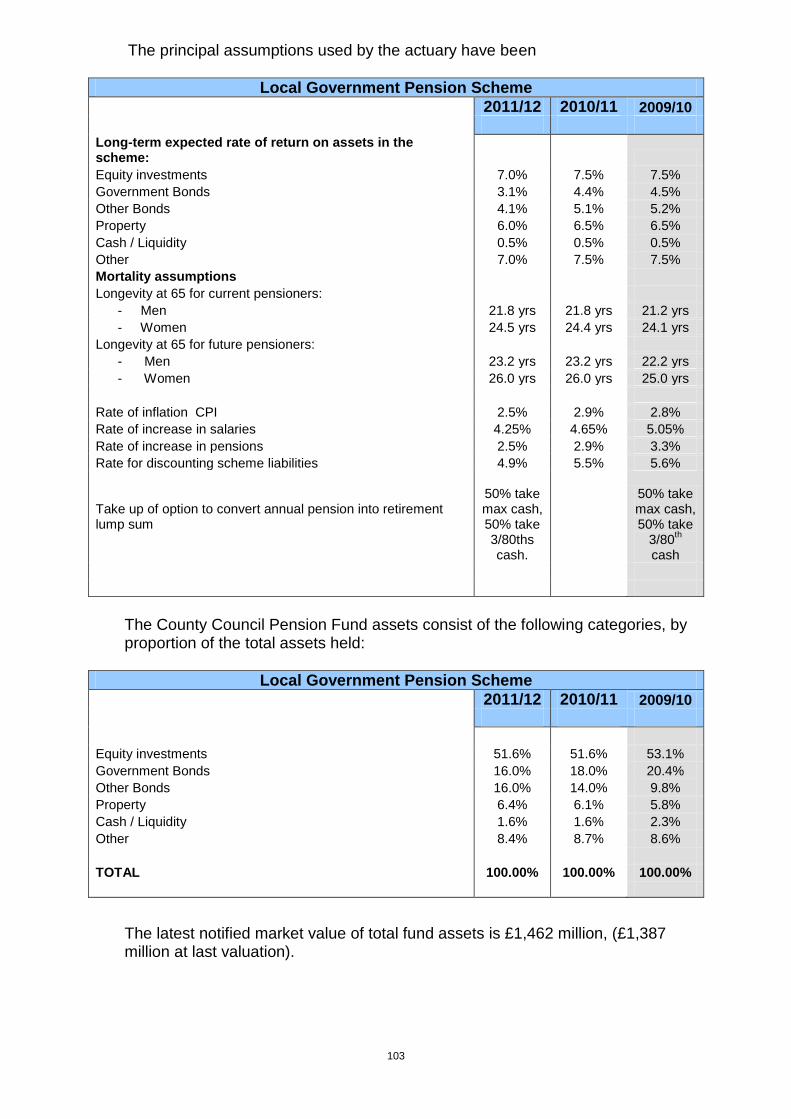
103
The principal assumptions used by the actuary have been
Local Government Pension Scheme
2011/12 2010/11 2009/10 Long-term expected rate of return on assets in the scheme:
Equity investments 7.0% 7.5% 7.5%
Government Bonds 3.1% 4.4% 4.5%
Other Bonds 4.1% 5.1% 5.2%
Property 6.0% 6.5% 6.5%
Cash / Liquidity 0.5% 0.5% 0.5%
Other 7.0% 7.5% 7.5%
Mortality assumptions
Longevity at 65 for current pensioners:
- Men 21.8 yrs 21.8 yrs 21.2 yrs
- Women 24.5 yrs 24.4 yrs 24.1 yrs
Longevity at 65 for future pensioners:
- Men 23.2 yrs 23.2 yrs 22.2 yrs
- Women 26.0 yrs 26.0 yrs 25.0 yrs
Rate of inflation CPI 2.5% 2.9% 2.8%
Rate of increase in salaries 4.25% 4.65% 5.05%
Rate of increase in pensions 2.5% 2.9% 3.3%
Rate for discounting scheme liabilities 4.9% 5.5% 5.6%
Take up of option to convert annual pension into retirement lump sum
50% take max cash, 50% take 3/80ths cash.
50% take max cash, 50% take
3/80th
cash
The County Council Pension Fund assets consist of the following categories, by proportion of the total assets held:
Local Government Pension Scheme
2011/12 2010/11 2009/10
Equity investments 51.6% 51.6% 53.1%
Government Bonds 16.0% 18.0% 20.4%
Other Bonds 16.0% 14.0% 9.8%
Property 6.4% 6.1% 5.8%
Cash / Liquidity 1.6% 1.6% 2.3%
Other 8.4% 8.7% 8.6%
TOTAL 100.00% 100.00% 100.00%
The latest notified market value of total fund assets is £1,462 million, (£1,387 million at last valuation).

104
History of experience gains and losses
The actuarial gains identified as movements on the Pensions Reserve in 2011/12 can be analysed into the following categories, measured as a percentage of assets or liabilities at 31 March 2012:
Local Government Pension Scheme
2011/12 2010/11 2009/10 2008/09
2007/08 as
restated
Differences between the expected and actual return on assets
(1.0)% (1.05)% (17.2)% (30.4)% (8.4)%
Experience gains and losses on liabilities (3.3%) (4.4)% (22.4)% (24.2)% 6.0%
Further information can be found in Cumbria County Council’s Superannuation Funds Annual Report which is available upon request from the Treasurer’s Department, The Courts, Carlisle, Cumbria, CA3 8NA.
30) Interest in Companies
At the start of the financial year the Council owned 9.5% of the share capital of Maryport Developments Ltd, a company engaged upon the economic regeneration of the town of Maryport. Following the demise of the regional development agencies, the North West Development Agency (NWDA) exited from the company and the remaining shares were reallocated amongst County Council, Allerdale Council and Energy Coast West Cumbria. The Council now holds 33.6% of the shares. The company is a private limited company and the Council’s liability is limited to its share of share capital. The net assets of the company as at 31 March 2012 are £963,228 (draft). Although the company does fall within the definition of an associate over which we have significant control, it has not been included in the Group boundary and group accounts prepared, on the grounds it is not material. A copy of the accounts of Maryport Development Ltd can be obtained from: -
The Company Secretary Maryport Development Company
Marine Road Maryport Cumbria
CA15 8AY
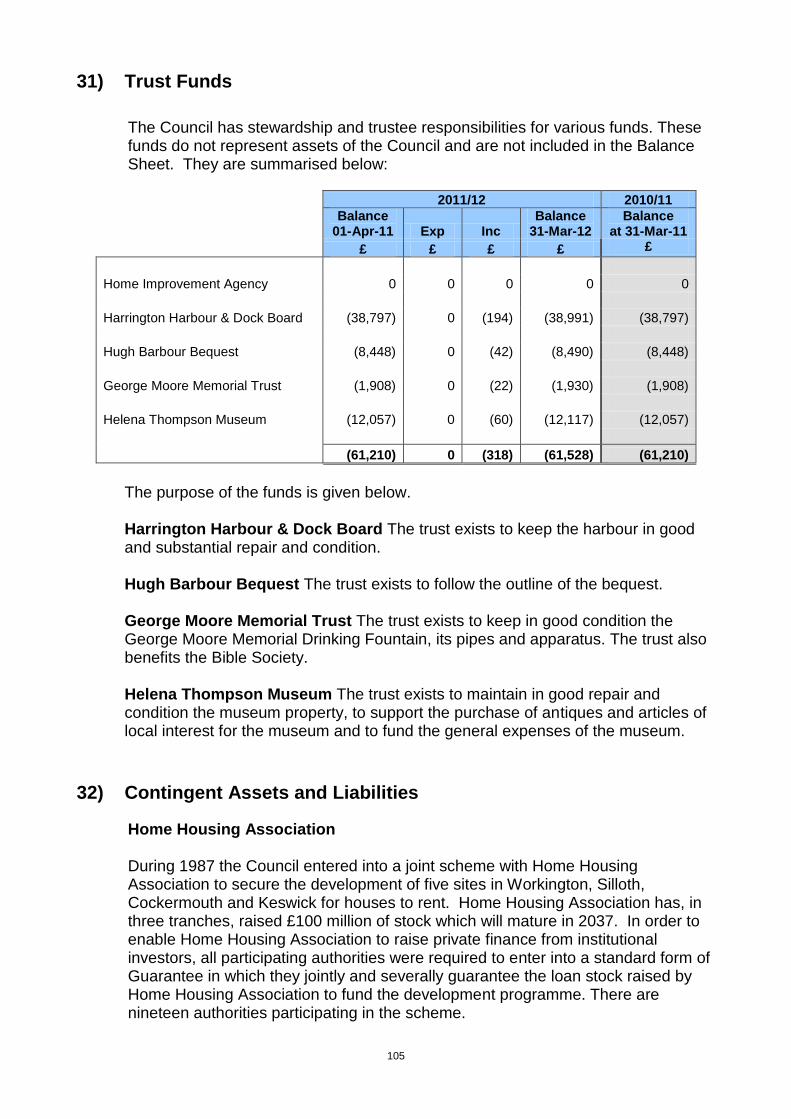
105
31) Trust Funds
The Council has stewardship and trustee responsibilities for various funds. These funds do not represent assets of the Council and are not included in the Balance Sheet. They are summarised below:
2011/12 2010/11
Balance
01-Apr-11 Exp Inc Balance
31-Mar-12 Balance
at 31-Mar-11
£ £ £ £ £
Home Improvement Agency 0 0 0 0 0
Harrington Harbour & Dock Board (38,797) 0 (194) (38,991) (38,797)
Hugh Barbour Bequest (8,448) 0 (42) (8,490) (8,448)
George Moore Memorial Trust (1,908) 0 (22) (1,930) (1,908)
Helena Thompson Museum (12,057) 0 (60) (12,117) (12,057)
(61,210) 0 (318) (61,528) (61,210)
The purpose of the funds is given below. Harrington Harbour & Dock Board The trust exists to keep the harbour in good and substantial repair and condition. Hugh Barbour Bequest The trust exists to follow the outline of the bequest. George Moore Memorial Trust The trust exists to keep in good condition the George Moore Memorial Drinking Fountain, its pipes and apparatus. The trust also benefits the Bible Society. Helena Thompson Museum The trust exists to maintain in good repair and condition the museum property, to support the purchase of antiques and articles of local interest for the museum and to fund the general expenses of the museum.
32) Contingent Assets and Liabilities
Home Housing Association During 1987 the Council entered into a joint scheme with Home Housing Association to secure the development of five sites in Workington, Silloth, Cockermouth and Keswick for houses to rent. Home Housing Association has, in three tranches, raised £100 million of stock which will mature in 2037. In order to enable Home Housing Association to raise private finance from institutional investors, all participating authorities were required to enter into a standard form of Guarantee in which they jointly and severally guarantee the loan stock raised by Home Housing Association to fund the development programme. There are nineteen authorities participating in the scheme.

106
The total liability to be guaranteed by participating authorities will be £100 million. This will continue in force until 2037 when the loan stock falls due to be repaid. The strict liability of each authority under guarantee would be £100 million and, because the liability is joint and several, authorities would obviously not be prepared to expose themselves to the risk, however remote, of having to meet the full liability of the borrowing under their individual guarantee. There is a Counter Indemnity and Contribution arrangement whereby each participating Authority undertakes to reimburse any other authority or authorities paying more than their proportionate share of the guarantee. An authority’s proportionate share is determined by reference to the estimated development expenditure in that authority’s area. If the Guarantee were called in, the worst situation for the Council would be that once it had recovered any contribution from other authorities, it would be left to fund no more than the cost of the development in its own area. This cost would be offset wholly, or partly, by the sums recovered from repossessing the units from Home Housing Association and selling them on. The latest schedule of guarantee levels indicates the Council’s Estimated Development Expenditure at £4,106,000 from an overall total of £84,100,000. Municipal Mutual Insurance In 1992/93 the Council’s insurers, Municipal Mutual Insurance (MMI), ceased trading and entered into a scheme of arrangement. This arrangement enabled MMI to continue to deal with and pay liability claims arising from incidents up to 1993 with the aim of achieving a solvent run off. Under the scheme of arrangement if a solvent run off is not achievable a percentage of claims payments made since 1993 could be clawed back by MMI. The latest indications are that a solvent run-off may not be achieved. In the event that it is not, potential liabilities remain in respect of: three claims received since 2008/9 with an outstanding estimated cost of £30,692, if not met by MMI; potential clawback estimated at 20% of net claim payments totalling £334,000 made by MMI since 1993; and the cost of any new claims which may arise, should this not be met by MMI. Group Repair Scheme – Workington In response to complaints in respect of the Group Repair Schemes carried out in Workington, the Council commissioned an independent survey and report to be undertaken on the issues raised by the complainants. An initial assessment of the costs of rectification and any potential compensation has been estimated at £150,000. The Council considers that the Contractors are responsible for any rectification works and associated costs and have sent a copy of the report to the relevant contractors. Option Agreement – Land at Workington In 2006 the Council entered into two option agreements in respect of land at Workington. An Option Notice was served on the Council on 30th December 2010. The Council has considered this Option Notice invalid, however the developer disagrees with this view. The Council is currently in negotiations with the developer in respect of the Council owned land, however there remains a possibility that a Completion Notice could be served on the Council and legal proceedings could follow.

107
Car Parking A contract is in place for the provision of car parking within part of Workington town centre. The authority is seeking Counsel opinion on the operation of this contract and if legal proceedings commence this could result in an asset, in the form of additional payments, due to the Council. There is however, likely to be a counter claim and therefore the potential for a liability with regards to this.
33) Capital Grants Credited to Taxation and Non-Specific Grant
Income
2011/12 2010/11
£'000 £'000
DCLG- Housing Allocation 0 747
DCLG- Disabled Facilities Grant 388 54
Maryport THI 32 44
Total 419 845
Revenue Grants credited to Services in Comprehensive Income & Expenditure Statement:
2011/12 £’000
2010/11 £’000
Housing Benefit Administration 768 739
Housing Benefit Fraud Investigation 0 17
Council Tax Subsidy 7,262 7,027
Area of Outstanding Natural Beauty 168 163
Enterprise Coaches 100 0
Contaminated Land investigations 10 28
NNDR Cost of Collection Allowance 183 182
Business Rate Deferral Scheme 0 11
Homelessness prevention 80 56
DWP – Rent Allowances 25,275 23,759
Planning Development Grant 0 17
33,846 31,999

108
34) Capital Receipts arising other than from Disposal of Fixed Asset
Statutorily defined capital receipts that do not arise from the disposal of a fixed asset are credited to the Income and Expenditure Account, as Other Gains, with a consequent credit to the Capital Receipts Reserve from the General Fund Balance and are shown as a reconciling item on the Movement in Reserves Statement.
Payments received in 2011/12 totalled £43,000 and can be summarised as follows:-
£10,500 in respect of a repayment of renovation assistance grant
£32,000 from the sale of small plots of land which were previously valued below the Council’s de minimis value of £10,000, and therefore not reported on the Council’s balance sheet.
35) Major Items of Income and Expense
The following are the major items appearing in the Comprehensive Income and Expenditure Statement:
£653k derecognised from Property, Plant and Equipment. This is as the Council is the sole trustee of Keswick Museum and not the owner. The building will be recognised on the balance sheet of the Keswick Museum Trust.
£261k reduction in the provision for Curwen land slip due to a review of the best estimate of the expenditure required to rectify the land.
36) Events After the Balance Sheet Date
The Statement of Accounts was certified by the Financial Services Manager, (Catherine Nicholson) on 29 June 2012. Events taking place after this date are not reflected in the Statements, or Notes. Where an event taking place before this date provided information about conditions existing at 31 March 2012, the figures in the Statements, or Notes, have been adjusted in all material aspects to reflect the impact of this information as appropriate.
From 31 March 2012, until the release of these accounts, the Council has considered whether any significant events require disclosure. None have been identified.

109
Collection Fund
Income and Expenditure Account 2011/12
2010/11 £’000
2011/12 £’000
2011/12 £’000
Note
Income
42,351 Income from Council Tax 42,624 2 Transfers from General Fund
7,108 - Council Tax Benefits 7,163 2 20,811 Income collectable from business ratepayers 23,124 3
70,270 72,911
Expenditure Precepts 4
36,757 - Cumbria County Council 37,326 6,136 - Cumbria Police Authority 6,231 5,727 - Allerdale Borough Council 5,888
48,620 49,445 Business rates 3
20,629 Payment to National Pool 22,941 182 Costs of collection 183
20,811 23,124 Bad and doubtful debts/appeals
156 - Write offs 135 137 - Provisions (15)
293 120
69,724 72,689
546 Movement on fund balance – Surplus /(Deficit) 222 825 Surplus as at 1 April 2011 1,371
1,371 Surplus as at 31 March 2012 1,594 5

110
Notes to Collection Fund Account
1 General
These accounts represent the statutory requirement to establish and maintain a separate fund for the collection and distribution of amounts due in respect of Council Tax and National Non-Domestic Rates (NNDR).
2 Council Tax
Council Tax income derives from charges raised according to the value of residential properties, which have been classified into eight valuation bands, calculated using estimated 1 April 1991 values for this specific purpose. Individual charges are calculated by estimating the amount of income required to be taken from the Collection Fund by Cumbria County Council, Cumbria Police Authority and Allerdale Borough Council for the forthcoming year and dividing this by the Council Tax Base. The Council Tax Base represents the total number of properties in each band, with allowance for discounts, adjusted by a proportion to convert the number to a Band D equivalent, (32,486 for 2011/12), having taken account of the estimated collection rate for the year, (97.5% for 2011/12). The basic amount of Council Tax for a Band D property, (£1,499.56 for 2011/12), is multiplied by the proportion specified for the particular band to give an individual amount due. The following table shows the Band D Equivalent Chargeable Dwellings, the Tax Base and the basis of Council Tax bills for Bands A to H, taking account of the relevant proportion of Band D for each band:
Proportion of Band D
Basic amount of Council Tax
£’000
Band D equivalent number of chargeable dwellings
Band A 6/9 999.70 12,298 Band B 7/9 1,166.32 4,926 Band C 8/9 1,332.94 5,428 Band D 9/9 1,499.56 4,595 Band E 11/9 1,832.80 3,089 Band F 13/9 2,166.03 1,398 Band G 15/9 2,499.26 723
Band H 18/9 2,999.12 29
Equivalent Chargeable Dwellings 32,486
Tax Base: 97.5% of Chargeable Dwellings 31,674
The income of £49,787,458 for 2011/12 is receivable from the following sources:
£
Billed to Council Tax payers 42,624,300
Council Tax Benefit 7,163,158
49,787,458

111
3 National Non-Domestic Rates NNDR is organised on a national basis. The Government specifies an amount and, subject to the effects of transitionary arrangements, local businesses pay rates calculated by multiplying their rateable value by that amount. For 2011/12, there are two poundages, namely the basic 43.3, (41.4 in 2010/11) and 42.6, (40.7 in 2010/11), for properties subject to small business rate relief. The Council is responsible for collecting rates due from the ratepayers in its area but pays the proceeds into an NNDR pool administered by the Government. The Government redistributes the sums paid into the pool back to Local Authorities’ General Funds on the basis of a fixed amount per head of population. The NNDR income, after reliefs and provisions, of £23,123,577.50 for 2011/12, was based on a total rateable value as at 31 March 2012, for the Council’s area, of £69,108,775 (£68,162,790 in 2010/11).
4 Precepts and Demands The amount shown below represents the precepting authorities’ demands on the Collection Fund:
£
Allerdale Borough Council 5,887,849
Cumbria County Council 37,326,382
Cumbria Police Authority 6,230,964
5 Contributions to Collection Fund Surpluses and Deficits The balance carried forward relating to Council Tax, (£1,593,946), will be distributed to the precepting authorities as follows:
£
Allerdale Borough Council 188,881
Cumbria County Council 1,204,784
Cumbria Police Authority 200,281

112
Annual Governance Statement 2011/12
1 Scope of responsibility 1.1 Allerdale Borough Council is responsible for ensuring that its business is conducted
in accordance with the law and proper standards, and that public money is safeguarded and properly accounted for, and used economically, efficiently and effectively. Allerdale Borough Council also has a duty under the Local Government Act 1999 to make arrangements to secure continuous improvement in the way in which its functions are exercised, having regard to a combination of economy, efficiency and effectiveness.
1.2 In discharging this overall responsibility, Allerdale Borough Council is responsible
for putting in place proper arrangements for the governance of its affairs, facilitating the effective exercise of its functions, and making arrangements for the management of risk.
1.3 Allerdale Borough Council has approved and adopted a code of corporate
governance, which is consistent with the principles of the CIPFA/SOLACE Framework Delivering Good Governance in Local Government. A copy of the code is on our website at http://www.allerdale.gov.uk/council-and-democracy/councillors-democracy-election/policies-and-plans.aspx . This statement explains how Allerdale Borough Council has complied with the code and also meets the requirements of regulation 4(2) of the Accounts and Audit Regulations 2011 in relation to the publication of a statement on internal control. It builds on last years Annual Governance Statement; changes outlined within this statement have been made to enhance, not replace existing arrangements for governance.
2 The purpose of the governance framework 2.1 The governance framework comprises the systems and processes, and culture and
values, by which the authority is directed and controlled and its activities through which it accounts to, engages with and leads the community. It enables the authority to monitor the achievement of its priorities and to consider whether those priorities have led to the delivery of appropriate, cost effective services.
2.2 The system of internal control is a significant part of that framework and is designed
to manage risk to a reasonable level. It cannot eliminate all risk of failure to achieve policies, aims and objectives and can therefore only provide reasonable and not absolute assurance of effectiveness. The system of internal control is based on an ongoing process designed to identify and prioritise the risks to the achievement of Allerdale Borough Council’s policies, aims and objectives, to evaluate the likelihood of those risks being realised and the impact should they be realised, and to manage them efficiently, effectively and economically.
2.3 The governance framework has been in place at Allerdale Borough Council for the
year ended 31 March 2012 and up to the date of approval of the statement of accounts.

113
3 Application of Governance Principles
3.1 The Council has reviewed its core principles set out in its Code of Governance, and has addressed the supporting principles as follows:
Focussing on the purpose of the authority and on outcomes for the
community, including citizens and service users, and creating and implementing a vision for the local area:
The Council has:
a. made a clear statement of the authority’s purpose and vision in the three year Council Plan: Council Commitment to Local Priorities 2012 – 2015 and will use it as a basis for corporate and service planning;
b. developed and implemented a Performance Management Framework for delivering and monitoring the Council Plan
c. reviewed on a regular basis the authority’s vision for the local area and its impact on the authority’s governance arrangements;
d. a Medium Term Financial Plan and budgets that are soundly based and are designed to deliver the Council’s priorities;
e. given consideration to improvements in processes to assess how the quality of service for users is to be measured and ensure that the information needed to review service quality effectively and regularly is available;
f. established a process to review all Council services focussing on the priorities of the authority which were developed following consultation with citizens and service users.
Members and officers working together to achieve a common purpose with
clearly defined functions and roles:
The Council has:
a. established a Constitution Review Group to assist in reviewing its Constitution to ensure that roles and responsibilities of members and officers are clarified and provided training session to Members and put in place plans to develop an ongoing training programme to ensure members and officers are aware of their roles.
b. set out a clear statement of the respective roles and responsibilities of the Council’s Executive committee and it’s members, and the authority’s approach towards putting this into practice;
c. set out a clear statement of the respective roles and responsibilities of the Council’s other committees, members and senior officers;
d. developed arrangements to ensure effective communication between members and officers in their respective roles;
e. ensured that regular, recorded meetings between the Leader and Chief Executive take place and developed a protocol to ensure that the Leader and Chief Executive negotiate their respective roles early in their relationship and that a shared understanding of roles and objectives is maintained;

114
f. set out the terms and conditions for remuneration of members and officers and an effective structure for managing the process including an effective remuneration panel;
g. ensured that its vision, strategic plans, priorities and targets are developed through robust mechanisms, and in consultation with the local community and other key stakeholders, and that they are clearly articulated and disseminated;
h. when working in partnerships: ensured that there is clarity about the legal status of the partnership; ensured that the roles and responsibilities of the partners are agreed so that there is effective leadership and accountability; and ensured that Allerdale representatives make clear to partners the extent of their authority to bind their organisations to partner decisions;
i. ensured that effective mechanisms exist to monitor service delivery;
j. determined a scheme of delegated and reserved powers within the constitution and ensured that it is monitored and updated when required;
k. ensured that effective management arrangements are in place at the top of the organisation;
l. made the Chief Executive responsible and accountable to the authority for all aspects of operational management;
m. made arrangements for a Section 151 Officer to be responsible to the authority for ensuring that appropriate advice is given on all financial matters, for keeping proper financial records and accounts, and for maintaining an effective system of internal financial control;
n. made arrangements for a Monitoring Officer to be responsible to the authority for ensuring that agreed procedures are followed and that all applicable statutes, regulations and other relevant statements of good practice are complied with.
Promoting the values of the authority and demonstrating the values of good
governance through behaviour:
The Council has:
a. arranged a Leadership and Culture training programme for the Council’s Service Managers the principles of which can be filtered down through the Council and its staff.
b. established an Employee Engagement Group to improve the staff engagement in respect of the Council Plan and priorities and to improve communications, relations and to encourage staff suggestions in respect of reducing spend and achieving savings.
c. established a Values Working Group to review the Council’s values and agree shared values, including leadership values, both for the Council and its staff, reflecting public expectations about the conduct and behaviour of individuals and groups within and associated with the Council.
d. put in place plans to use the Council’s shared values to act as a guide for decision making and as a basis for developing positive and trusting relationships within the Council;
e. developed and adopted formal codes of conduct defining standards of personal behaviour;

115
f. developed and maintained an effective standards committee that acts as the main means to raise awareness and take the lead in ensuring high standards of conduct are firmly embedded within the local culture;
g. put in place arrangements to ensure that members and staff of the Council are not influenced by prejudice, bias or conflicts of interest in dealing with different stakeholders and put in place appropriate processes to ensure that they continue to operate in practice;
h. put in place arrangements to ensure that procedures and operations are designed in conformity with appropriate ethical standards, and to monitor their continuing compliance in practice;
Taking informed and transparent decisions that are subject to effective
scrutiny and risk management:
The Council has:
a. developed and maintained an effective scrutiny function which encourages constructive challenge and enhances the authority’s performance overall;
b. developed and maintained open and effective mechanisms for documenting evidence for decisions and recording the criteria, rationale and considerations on which decisions are based;
c. put in place arrangements so that conflicts of interest on behalf of members and employees can be avoided and put in place appropriate processes to ensure that they continue to operate in practice;
d. put in place arrangements for whistle blowing to which staff and members have access, and made provision for all those contracting with the authority within standard tender documentation;
e. put in place effective, transparent and accessible arrangements for dealing with complaints;
f. developed and maintained an effective audit committee which is independent of the executive and scrutiny functions;
g. developed and maintained an effective standards committee which lies at the heart of decision making and awareness raising on standards issues;
h. ensured that those making decisions are provided with information that is fit for the purpose – relevant, timely and gives clear explanations of technical issues and their implications;
i. developed effective arrangements for determining the remuneration of senior staff;
j. ensured that professional advice on legal and financial matters is available and recorded well in advance of decision making and used appropriately when decisions have significant legal or financial implications;
k. developed a simplified approach to the corporate risk management framework based on a revised Risk Management Strategy to ensure that risk management is embedded into the culture of the authority, with members and managers at all levels recognising that risk management is part of their job;
l. actively recognised the limits of lawful activity placed on them by the ultra vires doctrine but also strived to utilise its powers to the full benefit of its communities;

116
m. observed all specific legislative requirements placed upon it, as well as the requirements of general law, and in particular integrated the key principles of administrative law – rationality, legality and natural justice, into its procedures and decision making;
n. when working in partnerships, put in place protocols for working together which include a shared understanding of the respective roles and responsibilities of each organisation;
o. when working in partnerships, ensured that there are robust procedures for scrutinising decisions and behaviour and that these decisions and behaviour are compliant with any local authority rules/codes or comply with any rules/codes developed for the purpose of the partnership;
Developing the capacity and capability of members to be effective and
ensuring that officers, including statutory officers, also have the capability and capacity to deliver effectively:
The Council has:
a. developed a workforce strategy 2011-2014 to ensure that the Council is developing the appropriate capacity and capability to deliver its objectives;
b. ensured that the statutory officers have the skills, resources and support necessary to perform effectively in their roles and that these roles are properly understood throughout the authority;
c. provided induction programmes tailored to individual needs and opportunities for members and officers to update their knowledge on a regular basis. A comprehensive induction programme has been implemented for new Councillors following the elections;
d. developed skills on a continuing basis to improve performance, including the ability to scrutinise and challenge and to recognise when outside expert advice is needed, in line with the member development strategy;
e. put in place effective arrangements designed to encourage individuals from all sections of the community to engage with, contribute to and participate in the work of the authority;
f. begun to develop career structures for leading members and officers to encourage participation and development;
Engaging with local people and other stakeholders to ensure robust local
public accountability:
The Council has:
a. made clear to itself, all staff and the community, to whom it is accountable and for what;
b. established clear channels of communication with all sections of the community and stakeholders and put in place monitoring arrangements to ensure that they operate effectively;
c. put in place effective systems to protect the rights of staff and ensured that policies for whistle blowing, which are accessible to staff and members,

117
d. and guidance for those contracting with the authority, together with and arrangements for the support of whistle blowers, are in place;
e. developed and maintained a clear policy on how staff and their representatives are consulted and involved in decision making;
f. developed a six monthly report to Council on scrutiny and audit function activity;
g. ensured that the authority as a whole is open and accessible to the community, service users and its staff and ensured that it made a commitment to openness and transparency in all its dealings, including partnerships, subject only to the need to preserve confidentiality in those specific circumstances where it is proper and appropriate to do so;
h. Ensure that engagement and consultation undertaken by any partnership is planned with regard to methodology, target audience and required outcomes, using existing mechanisms and groups where appropriate.
3.2 To identify the principal risks to the achievement of its objectives, the Council has
reviewed the systems and processes in place for the identification and management of strategic and operational risk.
3.3 To identify and evaluate the key controls to manage the strategic risks, the Council
has reviewed its system of internal control, including systems and procedures to mitigate principal risks.
3.4 To obtain assurance on the effectiveness of key controls, the Council has obtained
assurance statements from appropriate internal and external assurance providers. 3.5 The Council has made arrangements to evaluate assurances and identify gaps in the
controls and assurances.
4 Review of effectiveness 4.1 Allerdale Borough Council has responsibility for conducting, at least annually, a
review of the effectiveness of its governance framework, including the system of internal control. The review of effectiveness is informed by the work of the strategic management team within the authority, who have responsibility for the development and maintenance of the governance environment; the Internal Audit Manager’s annual report, (Appendix 1); and also by comments made by the external auditors and other review agencies and inspectorates.
4.2 The main role in maintaining and reviewing effectiveness is through the Audit
Committee, which has responsibility to provide independent assurance on the adequacy of the risk management framework and the associated control environment, independent scrutiny of the authority’s financial and non-financial performance to the extent that it affects the authority’s exposure to risk and weakens the control environment and to oversee the financial reporting process, including the operations of Internal Audit.

118
Other key roles are undertaken by: Council The Council is responsible for adopting the authority’s constitution, including codes of conduct, approving the policy framework and approving and monitoring the authority’s overall framework of accountability and control. Executive The Executive is responsible for discharging Executive functions in accordance with the policy framework and budget, also for approving the authority’s risk management policy statement and strategy, and for reviewing the effectiveness of risk management. Scrutiny Committees The Scrutiny Committees are responsible for scrutinising policies and performance.
Standards Committee The Standards Committee is responsible for promoting and maintaining standards of conduct. Strategic Management Team In January 2012 the Council agreed a new structure for the Council’s Senior Management Team. To replace the Strategic Management Team consisting of the Chief Executive, Deputy Chief Executive, Strategic Manager (Business), Strategic Manager (People), Strategic Manager (Places) and Strategic Manager (Resources). The new structure consists of the Chief Executive and two Corporate Directors, one of whom has designated Deputy Chief Executive responsibilities for an initial interim period of 6 months. The Council believes that the new structure will help to realise ambitions for further improvement and the aspiration for Allerdale to become one of the best Councils in the North West. It will improve the leadership of the organisation by being more outward focussed and driving change and performance across the organisation. The changes proposed will also enable the requirement to reduce management costs to be met in accordance with the Council’s recently agreed three year budget strategy. The Council has a duty to comply with the key principles contained in the CIPFA Statement on the Role of the Chief Financial Officer in Local Government (2010).
The role of Chief Finance Officer (CFO) currently sits with the Financial Services Manager, who is an experienced and qualified accountant.
Although this post was not a Strategic Manager, the Chief Executive invited the CFO to attend, advise and participate at all Strategic Management Team meetings, and have a direct reporting line to the Chief Executive on all S151 related issues.

119
The Chief Executive has also invited the Monitoring Officer to attend, advise and participate at all Strategic Management Team meetings. The Council is currently reviewing the Service Manager structure and has proposed a re-structure which will be progressed in accordance with the appropriate Council polices. Service Manager Group The Service Manager Group will work collaboratively to deliver the Council Plan. The Service Manager Group will work to achieve continuous improvement and value for money. Internal Audit The internal audit function is exercised through the Internal Audit service. An effective audit of the Council’s accounting records and control systems, in accordance with the Accounts and Audit Regulations 2011, is maintained through this means. The level and type of audit cover has regard to the characteristics and relative risks of the activities involved and supports the work of the external audit service. External Audit The external audit work of the Council is undertaken by the Audit Commission, the main duties being governed by section 15 of the Local Government Finance Act 1982, as amended by section 5 of the Audit Commission Act 1998. Close liaison with the external auditor offers a degree of assurance on the authority’s arrangements for managing risk and its control systems, and through this means strengthens governance arrangements. Asset Transfer Group The Council’s Asset Transfer Group consists of a cross-cutting corporate group of officers which ensures that the Council adopts a holistic approach in the disposal of Council assets. Governance Group The Council’s Governance Group consists of a corporate group of officers with responsibilities that feed into the Council’s control environment. The group meets throughout the year to assess the processes in place which provide the supporting information necessary to produce a Governance statement and to review progress on actions planned to address improvements in governance arrangements.
4.3 In drawing up the statement, advice has been obtained on any issues identified by
the various contributory parties to the review of the effectiveness of the governance framework, as set out above. Any significant issues are set out below, and a plan to address weaknesses and ensure continuous improvement of the system is in place.

120
5. Significant governance issues and planned improvements 5.1 Through the review of effectiveness of the Council’s governance framework three
areas for improvement have been identified. 5.2 It is proposed to address those matters considered to be significant to further
enhance the Council’s governance arrangements over the coming year. It is believed that this action will satisfy the need for improvements that were identified in the review of effectiveness and their implementation will be monitored and reviewed.
5.3 A number of actions were identified following the review conducted in respect of
2010/11 and progress on these was monitored throughout 2011/12. These actions were completed.
The assurance process has also identified some awareness issues around certain Council policies and procedures, such as the Theft, Fraud, Corruption and Bribery Response Plan. Specific opportunities for improvement in governance and internal controls identified as part of the assurance processes detailed above have been addressed or are included in action plans for the relevant managers.
6. Action Plan 6.1 Significant identified governance issues are outlined in the following table, along with
proposed actions to be taken to address these in 2012/13
Issue Action Timescale Responsible Officer
1. Scheme of Delegation
There will be a comprehensive review of the Scheme of Delegation following the restructure at the Senior Management level
Nov 2012 Governance and Audit Manager
2. Review of Council Policies to ensure they reflect the Council’s structure and roles and responsibilities within the structure.
There will be a review of key policies following the restructure at Senior Management level to ensure that they reflect the new structure and roles and responsibilities.
Dec 2012 Governance and Audit Manager
3. Risk Management To monitor the implementation of the Recommendations in the Risk Management Review 2012/13 to ensure that risk management is embedded
March 2013
Governance and Audit Manager

121
Conclusions We are satisfied that the steps outlined on the above action plan will address the need for improvements that were identified in our review of effectiveness and will monitor their implementation and operation as part of our next annual review. Signed Leader of Allerdale Borough Council Signed Chief Executive
into the culture of the authority, with members and managers at all levels recognising that risk management is part of their job

122
Appendix 1 Compliance with the Delivering Good Governance in Local Government Framework
in 2011/12 Allerdale Borough Council – Internal Audit
1.0 Introduction 1.1 The Council adopted the Good Governance Standard for Public Services in 2005.
The standard provides a national framework for assessing good governance practice. In addition CIPFA/SOLACE has published an update to the standard – a Framework for Delivering Good Governance in Local Government – to make the original standard directly relevant to Local Government. Internal Audit is required to carry out an annual independent review, to provide assurance on the adequacy and effectiveness of corporate governance arrangements and the extent of compliance with the approved standard.
1.2 During the financial year 2010/11 Internal Audit performed an independent review
of the overall corporate governance framework within the organisation with the review resulting in an Internal Audit opinion of ‘good’ and agreement for the ten recommendations within the draft report to be implemented as agreed actions.
A follow up review has been carried out during 2011/12 to establish that the agreed actions have been implemented. This review identified that 5 actions had been fully completed, one action was cancelled as it was no longer relevant, 2 actions were not due for implementation at the time of the follow up, and 2 actions were further reported on within the report as requiring additional work to be performed, as follows:
The Local Code of Corporate Governance requires further review to incorporate all the requirements of the Application Note issued in March 2010.
The Governance section of the document store should be removed or the action reinstated in Covalent until the action is fully complete.
The current position with regard to the above is that all actions have been fully implemented, the Governance section has been removed from the document store and the Local Code of Corporate Governance has been reviewed to incorporate the requirements of the application note.
In addition, as part of the follow up review, 2 further recommendations were accepted to be implemented as agreed actions. At the time of writing this report one of these actions was not due for implementation and the approach to the completion of assurance statements has reverted back to Service Managers, therefore issues resulting from this exercise will be included within the Council’s 2012 Annual Governance Statement.

123
1.3 In addition the Internal Audit Manager is a member of the Council’s Corporate
Governance working group and as such has been able to maintain a ‘hands on’ approach in establishing that adequate arrangements are in place and that appropriate action has been/is being taken in respect of the action plan devised as a result of drafting the 2010/11 Annual Governance Statement.
A full review of Corporate Governance is due to be undertaken during Q3 of 2012/13 and as well as confirming the implementation of the two actions resulting from the 2011/12 follow up report will consider and evaluate the Governance arrangements in place as a result of the new senior management structure.
Internal Audit have reviewed all the Council’s material systems as part of their 2011/12 annual plan and these reviews have assisted in informing the Internal Audit Manager’s opinion on the adequacy of the arrangements in place for the delivery of good governance.
2.0 Key Findings 2.1 Within the CIPFA/SOLACE framework there are several requirements of the
Council, these relate to:
Ensuring that partnerships are underpinned by a common vision of their work that is understood and agreed by all partners.
Putting in place effective arrangements to identify and deal with failure in service delivery.
Measuring the environmental impact of policies, plans and decisions.
Ensuring effective leadership throughout the authority and being clear about executive and non-executive functions and of the roles and responsibilities of the scrutiny function.
Making a Chief Executive responsible and accountable to the authority for all aspects of operational management.
Developing protocols to ensure that the Leader and Chief Executive negotiate their respective roles early in the relationship and that a shared understanding of roles and objectives is maintained.
When working in partnership:
Ensure there is clarity about the legal status of the partnership.
Ensure that representatives of organisations both understand and make clear to all other partners the extent of their authority to bind their organisation to partner decisions.
Developing and maintaining an effective Standards Committee.

124
In pursuing the vision of a partnership, agree a set of values against which decision-making and actions can be judged.
Developing and maintaining an effective scrutiny function, which encourages constructive challenge and enhances the authority’s performance overall and that of any organisation for which it is responsible.
Developing and maintaining an effective Audit Committee (or equivalent), which is independent of the Executive and scrutiny functions, or make other appropriate arrangements for the discharge of the functions of such a committee.
Using their legal powers to the full benefit of the citizens and communities in their area.
Actively recognising the limits of lawful activity placed on them by, for example, the ultra vires doctrine but also striving to utilise their powers to the full benefit of their communities.
Recognising the limits of lawful action and observing both the specific requirements of legislation and the general responsibilities placed on authorities by public law.
Observing all specific legislative requirements placed upon them, as well as the requirements of general law, and in particular to integrate the key principles of good administrative law, rationality, legality and natural justice into their procedures and decision-making processes.
2.2 The 2011/12 Annual Governance Statement identified two areas for development
within Allerdale Borough Council to assist the organisation meeting the requirements identified in the CIPFA/SOLACE framework. In order that these were appropriately addressed an action plan was devised, including the time frame and officer responsible for implementation. The action plan included the following areas:
Business Continuity
Partnership.
Business Continuity - the council has been working closely with Zurich to develop and commence implementation of an action plan to ensure that Business Continuity and Crisis Management plans exist in all service areas and are monitored, updated and tested by March 2013. Currently work is continuing but Zurich has held a training session, worked with managers to assist in identifying their priorities and have developed and issued draft plans for service managers to consider. Partnerships – the proposed Internal Audit review did not go ahead as currently the main partnerships that the Council are involved in are those with FOCSA/ISS (Environmental Partnership) and Carlisle Leisure Ltd which are subject to their own internal audit reviews. The main area that this topic has historically covered is the Local Strategic Partnership which is in no longer in existence. Consideration and evaluation of this area will be performed and monitored as the localism agenda develops.

125
3.0 Conclusion 3.1 From the evidence gathered by the Corporate Governance working group, the
assurance statements completed by Service Managers and the work undertaken by the Internal Audit Section throughout the year it is my considered opinion that the overall control environment within the Council in order to fulfil the corporate governance arrangements for Delivering Good Governance in the Local Government Framework is good.
Steve McMahon Internal Audit Manager June 2012

126
Glossary of Terms Accounting Policies Accounting policies are the principles, conventions, rules and practices applied by the Council that specify how the effects of transactions and other events are to be reflected in its financial statements. An accounting policy will, for example, specify the estimation basis for the allocation of support service costs. Accounting Period The period of time covered by the accounts that is normally the year commencing on 1st April. Accruals Sums included in the accounts to cover income and expenditure attributable to the accounting period, but for which payment has not been received or made by 31st March. Actuarial Gains and Losses For a defined benefit pension scheme, the changes in actuarial deficits or surpluses that arise because events have not coincided with the actuarial assumptions made for the last valuation (experience gains and losses) or the actuarial assumptions have changed. Amortisation The reduction in the value of an asset over its life. Agency Services Services that are performed by or for another authority or public body, where the authority responsible for the service reimburses the authority carrying out the work for the cost of that work. Area Based Grants (ABG) ABG is a non ring-fenced general grant, which has no restrictions imposed upon its usage. ABG is received directly by the council from the government. Assets Items of worth that are measurable in terms of value. Current assets are ones that may change in value on a day-to-day basis (ie. stocks). Fixed assets are assets that yield benefit to the Council for a period of more than one year (i.e. land). Balances The reserves of the Council, which include the accumulated surplus of income over expenditure. Balance Sheet A statement of the recorded assets, liabilities and other balances as they stand in monetary terms, at the end of an accounting period. Billing Authority A local authority responsible for collecting the Council Tax and business rates from within its district boundaries (the Council is a billing authority).

127
Budget A statement defining the Council’s policy expressed in financial terms. This includes both revenue and capital. Business Rates/ National Non Domestic Rates (NNDR) Income collected from business ratepayers, based on a national rate in the pound set by Central Government multiplied by the rateable value of the premises they occupy. This national rate is collected by local Councils on behalf of Central Government and is redistributed from the NNDR pool among all Local Authorities on the basis of population. Cash and Cash Equivalents Cash comprises cash in hand and deposits with any financial institution repayable without penalty on notice of not more than 24 hours (deposit held a call) and bank overdrafts. Cash equivalents are short term, highly liquid investments with maturities of 3 months or less at acquisition, that are readily convertible to known amounts of cash. Cash Flow Statement: A statement summarising the inflows and outflows of cash, arising from transactions between the council and third parties, for revenue and capital purposes. Capital Charge The charge to services for the use of fixed assets. As a minimum, the capital charge must cover the annual provision for depreciation, where appropriate, based on the useful life of the asset. Capital Expenditure Expenditure on the acquisition or enhancement of fixed assets that have a long-term value to the Council. This includes grants or advances paid to third parties to assist them in acquiring or enhancing their own fixed assets. Capital Receipts Money received from the sale of a capital asset or repayment of an advance. CIPFA The Chartered Institute of Public Finance and Accountancy Collection Fund The fund maintained by the Council into which are paid the amounts of Council Tax and Non-Domestic Rates that it collects, out of which are to be paid precepts issued by precepting authorities, its own demands and payments into the NNDR pool. Community Assets These are assets that the Council intends to hold in perpetuity, which have no determinable finite useful life and may have restrictions on their disposal. Examples include parks and works of art. Consistency: The concept that the accounting treatment of like items, within an accounting period, and from one period to the next, is the same.

128
Contingent Assets A contingent asset is a possible asset which could arise following the occurrence of a future event outside Allerdale Borough Council’s control. Contingent Liabilities A contingent liability is a possible liability which could arise following the occurrence of a future event outside Allerdale Borough Council’s control or is a present obligation where it is not possible to measure the outcome with sufficient reliability. Component Accounting In some cases there are significant elements of an asset that will not last as long as the rest of the asset e.g., a flat roof of a building in comparison to the life, of the rest of the building. Where there is more that one significant part of the same asset which has the same useful life and depreciation method, such parts may be grouped in determining the depreciation charge. In practice this can be achieved by only separately accounting for significant components that have different useful lives and / or depreciation methods. Council Tax A tax levied by the local council, which is the billing authority, on households within its area and distributed to the County Council, Police and Fire Authorities, and to the Council’s own General Fund. Council Tax Bands All domestic properties in a Local Authority’s area are valued by Central Government’s Valuation Office Agency and placed in one of 8 bands ranging from A to H. Each Band is averaged out in relation to Band D, Bands A to C paying less, and Bands E to H paying more on an increasing scale. Creditors Amounts owed by the Council for goods and services provided, where payment has not been made at the date of the balance sheet. Current Assets The assets held by an organisation that will be realised within 12 months of the balance sheet date. e.g. stock, cash and debtors. Current Liability The liabilities held by an organisation that will be repaid within 12 months of the balance sheet date example, creditors, overdrafts. Current Service Cost The increase in present value of a defined benefit pension scheme’s liabilities expected to arise from employee service in the current financial year. Curtailments For a defined benefit pension scheme, an event that reduces the expected years of future service of present employees or reduces the accrual of defined benefits for a number of employees for some or all of their future service. DCLG Department for communities and local Government.

129
De Minimis A term generally used to describe something that is too small to be considered. Debtors Sums of money owed to the Council but not received at the date of the balance sheet. Deferred Charges Items of capital expenditure that do not result in, or remain matched by, tangible fixed assets. These are written off to revenue in the year in which the expenditure is incurred. Defined Benefit Scheme A pension or other retirement benefit scheme other than a defined contribution scheme. Usually, the scheme rules define the benefits independently of the contributions payable and the benefits are not directly related to the investments of the scheme. The scheme may be funded or unfunded. Defined Contribution Scheme A pension or other retirement benefit scheme, into which an employer pays regular contributions fixed as an amount or percentage of pay and will have no legal or constructive obligation to pay further contributions if the scheme does not have sufficient assets to pay all employee benefits relating to employee service in the current and prior periods. Depreciated Replacement Cost A method of valuation that provides a proxy for the market value of specialist properties. Depreciation The measure of the wearing out, consumption or other reduction in the useful economic life of a fixed asset. Discretionary Benefits Retirement Benefits which the employer has no legal, contractual or constructive obligation to award and are awarded under the Council’s discretionary powers. Earmarked Reserves Amounts set aside for a specific purpose to meet future commitments or potential liabilities, for which it is not appropriate to establish provisions. Expected Return on Pension Assets For a funded defined benefit pension scheme, the average return, including both income and changes in fair value but net of scheme expenses, expected over the remaining life of the related obligation on the actual assets held by the scheme. Expenditure Amounts paid by the Council for goods received or services rendered of either a capital or revenue nature. This does not necessarily involve a cash payment - expenditure is deemed to have been incurred once the goods or services have been received even if they have not been paid for.

130
Fair Value The fair value of an asset is the price at which it could be exchanged in an arm’s length transaction less, where applicable, any grants receivable towards the purchase or use of the asset. Fees and Charges Income arising from the provision of services e.g. the use of leisure facilities. Financial Instrument A contract which gives rise to a financial asset of one entity and a financial liability, or equity instrument, of another. Finance Lease A lease that transfers all of the risks and rewards of ownership of an asset to the lessee. Fixed Asset – An asset that yield benefits to the local authority and the services it provides for a period of more than one year, for example, land, buildings and equipment. Fixed Asset Revaluation Account: This account contains surpluses and losses arising from the periodic valuation of fixed assets. Formula Grant The main grant paid by central government to a local authority towards the costs of all its services. International Financial Reporting Standards (IFRS) International Financial Reporting Standards are principle based standards, interpretations and the framework adopted by the international Accounting Standards Board (IASB). Many of these standards now apply to local authorities and any departure from these must be disclosed in the published accounts. Gearing A measure of the impact on council taxes of increasing budgets. This varies widely between local authorities. An authority that meets 25% of its budget through council tax is said to have a gearing of 4.0. Therefore, a 1% increase in budget would lead to a 4% increase in council tax. General Fund The total services of the Council except for the Housing Revenue Account and the Collection Fund. Council Tax, Government Grants and NNDR meet the net cost of this. General Reserves The amounts put aside, but not allocated to meet any future spending commitments. The Council’s main General Reserves are its General Fund and Housing Revenue Account balances. Housing Benefit Financial help given to local authority or private tenants whose income falls below prescribed amounts. Central government finances about 95% of the cost of benefits to non-HRA tenants (‘rent allowances’) and the whole of the cost of benefits to HRA tenants. Some local authorities operate ‘local schemes’ whereby they finance allowances in excess of the standard payments

131
Housing Subsidy The Government grant paid to housing authorities Impairment A reduction in the value of a tangible fixed asset below its value brought forward in the balance sheet. Intangible Assets Assets that do not have physical substance but are identifiable and controlled by the Council. E.g. IT software. Intangible Heritage Assets An intangible heritage asset is an intangible asset with cultural, environmental or historical significance. Examples of intangible heritage assets include recordings of significant historical events. Income Amounts due to the Council for goods supplied or services rendered of either a capital or revenue nature. This does not necessarily involve cash being received - income is deemed to have been earned once the goods or services have been supplied even if the cash has not been received. Infrastructure Assets These are inalienable assets, expenditure on which is recoverable only by continued use of the asset created. Examples of such assets are highways and footpaths. Interest Cost (Pensions) For a defined benefit scheme, the expected increase during the period in the present value of the scheme liabilities because the benefits are one period closer to settlement. Investment Properties Interest in land or buildings that is held for investment potential, any rental income being negotiated at arm’s length. Jointly Controlled Entities Entities established with contractual or binding arrangements whereby two or more parties are committed to undertake an activity that is subject to their joint control, with strategic financial and operating decisions relating to the activity requiring the unanimous consent of the parties sharing control. LABGI Local Authority Business Growth Incentive, money received by the council to regenerate business. Leasing The method of financing the provision of various capital assets to discharge the Council's functions outside normal borrowing procedures. There are different types of lease available, of which the following are most commonly used: Operating leases may generally be described as those that do not provide for the property in the asset to transfer to the authority and where the authority estimates on the commencement date, that the value of the asset on the termination date of the lease, will be at least equal to 10% of its value at the commencement date.

132
These leases are exempt from classification as a credit arrangement. Finance leases are leases that transfer substantially all the risks and rewards of ownership to the lessee. This is presumed to occur if, at the start of the lease, the present value of the total of lease payments amount to all of the value of the leased asset. Liabilities Amounts due to individuals or organisations that will have to be paid at some time in the future. Current liabilities are usually payable within one year of the balance sheet date. Long Term Borrowing / investment Borrowing / investment repayable after more than 12 months. Minimum Revenue Provision This is the minimum amount that must be charged to an authority's Statement of Movement on General Fund balance each year and set aside as a provision for credit liabilities. National Non-Domestic Rate (NNDR) All non-domestic properties have been valued and the Government determines national rate poundage each year, which are payable to all local authorities. Local authorities collect the non-domestic rate but the proceeds are pooled and distributed by the Government. Net Book Value The amount at which fixed assets are included in the balance sheet, i.e. their historic value or current valuation less depreciation. Non-Operational Assets Tangible fixed assets held by the Council but not directly occupied, used or consumed in the delivery of services. Examples of non-operational assets include investment properties and assets that are surplus to requirements pending sale or development. Office for National Statistics The government agency responsible for compiling, analysing and disseminating many of the United Kingdom’s economic, social and demographic statistics including the Retail Price Index, trade figures and labour market data as well as the periodic census of the population and health statistics. Operational Assets Fixed assets occupied, used or consumed by the Council in direct delivery of services for which it has a statutory or discretionary responsibility. Operating Lease An operating lease is a rental agreement that places all of the risks and rewards of ownership of an asset with the lessor. Past Service Cost For a defined benefit pension scheme, the increase in present value of the scheme liabilities related to employee service in prior periods arising in the current period as a result of the introduction of, or improvement to, retirement benefits.

133
Precept The amount levied by the various joint authorities (e.g. police authority), which is collected by the Council on their behalf. Precepting Authorities Those Authorities who are not Billing Authorities, e.g. “major” Authorities such as the County Council and Police and Fire Authorities and “local Precepting Authorities” such as Parish, Town or Community Councils. Provisions These are sums set aside to meet liabilities or losses that have been incurred but where the amount and/or timing of such costs are uncertain. Public Works Loan Board (PWLB) A Government agency that lends money to local authorities at lower interest rates than those generally available from the private sector. Local authorities are able to borrow a proportion of their requirements to finance capital expenditure from this source. Reserves Amounts set aside to meet the cost of specific future expenditure. Earmarked reserves are set aside to meet revenue or capital needs in the future. The level of general fund (revenue) reserves is considered in relation to the risks and uncertainties facing the council when it is setting its annual budget. Related Party Transactions A related party transaction is the transfer of assets or liabilities or the performance of services by, to or for a related party irrespective of whether a charge is made Revenue Contributions The method of financing capital expenditure directly from revenue. Revenue Expenditure Expenditure incurred on the day-to-day running of the Council. This mainly includes employee costs, general running expenses and capital financing costs. Revenue Support Grant (RSG) A grant paid by the Government to each local authority to help to finance its general expenditure. The grant helps to bridge the gap between Council Tax and redistributed NNDR income and the total assessment of the Council's need to spend. Retail Price Index The main domestic measure of inflation in the UK. It measures the average change in the prices of goods and services purchased by most households in the UK. Ring-fenced Grants These grants fund particular services or initiatives considered a national priority, and must be spent on a particular service. Short Term Borrowing/ Investments Borrowing and investments repayable on demand or within 12 months. Statement of Recommended Practice (SORP) The Code of Practice on Local Authority Accounting in the United Kingdom.

134
Section 151 Officer (S151): The section 151 officer is required by the Local Government Act 1972 and by the Accounts and Audit Regulations 2003, to ensure that the Council's budgeting, financial management and accounting practices meet relevant statutory and professional requirements. Stocks Raw materials and consumable items that the Council has purchased to use on a continuing basis and has not used by the end of the financial year. Small Business Rate Relief The scheme offers rate relief at 50% to eligible properties up to £6,000 rateable value, with relief decreasing at the rate of around 1 per cent per £120 of rateable value up to 0% at £12,000. Eligible properties with rateable values between £12,001 and £17,999 (£24,499 in Greater London) do not have to contribute to the cost of the rate relief scheme. As a temporary measure, during 2012-13 only the Government have set the amount of relief at 100% for eligible properties up to £6,000 rateable value. Support Services The costs of departments that provide professional and administrative assistance to services. Tangible Fixed Asset This is defined as a physical fixed asset and includes land, buildings, plant and machinery. These are held for use for by the authority for a period over more than one year. Tangible Heritage Assets A tangible asset with historical, artistic, scientific, technological, geophysical or environmental qualities that is held and maintained principally for its contribution to knowledge and culture. Tax Base The number of Band D equivalent properties in a local authority’s area. An authority’s tax base is taken into account when it calculates its council tax and when central government calculates allocations of formula grant. Useful Life The period over which the local authority will derive benefits from the use of a tangible fixed asset. Unallocated Reserves Reserves held by an authority which may be used for any purpose. Work in Progress The cost of work done up to the end of the financial year on an uncompleted project.


![0 0] Supplement to Official Gazetteagency' with regard to that investor's investment or proposed investment where the investor is not satisfied with the decision of the public sector](https://img.pdfslide.us/doc/110x75/5f271b4ba4086a79e858ce84/0-0-supplement-to-official-gazette-agency-with-regard-to-that-investors-investment.jpg)