Embed Size (px)
Citation preview

State Transit-Oriented Development (TOD) Planning and Implementation Project for
the Island of O‘ahu
Prepared for:
Office of Planning Department of Business, Economic Development and Tourism
Prepared by:
July 2020

Study Context and Potential Impacts of the COVID-19 Pandemic
This report was drafted between December 2019 and July 2020, with reference to consultations, data collection, and analyses between the third quarter of 2018 and the first weeks of 2020. From approximately February 2020, the COVID-19 pandemic caused major economic, social, and business disruptions in Hawai‘i, as it did worldwide. At the time of this writing, little data exists on the pandemic’s impacts on development markets and financing, and the timing of recovery is uncertain.
The development visions presented herein reflect the long-term goals and aspirations of public agencies and private parties anticipated for each TOD priority area. Many of the projects described would not be expected to materialize for years or even decades of this study. The assessments presented in this report are tied to future implementation of the desired projects, and while some could be delayed, for purposes of this study, it is assumed that in this longer-term framework, conditions affecting such development in Hawai‘i could have recovered to be within the range of outcomes described herein. Nevertheless, prior to implementation of any particular project or financial mechanism, as for any development, the conclusions presented herein should be reviewed in the context of current market, economic, fiscal, political, and social environments.
State TOD Planning & Implementation Project, Island of O‘ahu
i
Acknowledgments The contributions and assistance from the following departments, agencies, and stakeholders in the preparation of the State Transit-Oriented Development Planning and Implementation Project for the Island of O‘ahu are gratefully acknowledged.
• State of Hawai‘i, Office of the Governor • State of Hawai‘i, Stadium Authority • State of Hawai‘i, Department of Agriculture • State of Hawai‘i, Department of Accounting
and General Services • State of Hawai‘i, Department of Education • State of Hawai‘i, Department of Hawaiian
Home Lands • State of Hawai‘i, Department of Land and
Natural Resources • State of Hawai‘i, Hawai‘i Community
Development Authority • State of Hawai‘i, Hawai‘i Housing Finance
and Development Corporation • State of Hawai‘i, Hawai‘i Public Housing
Authority • State of Hawai‘i, Department of Public Safety • State of Hawai‘i, Department of
Transportation • State of Hawai‘i, Office of Planning • University of Hawai‘i System • University of Hawai‘i West O‘ahu
• University of Hawai‘i, Honolulu Community College
• City and County of Honolulu, Department of Planning and Permitting
• City and County of Honolulu, Department of Transportation Services
• City and County of Honolulu, Department of Design and Construction
• City and County of Honolulu, Department of Environmental Services
• City and County of Honolulu, Department of Facility Maintenance
• City and County of Honolulu, Board of Water Supply
• Hawaiian Electric Company, Inc. • Kamehameha Schools • DR Horton • TOD Council Developer Representative, Bill
Brizee, AHL • TOD Council Housing Advocate, Betty Lou
Larson, Catholic Charities • United States of America, Department of the
Navy
State TOD Planning & Implementation Project, Island of O‘ahu

ii
Table of ContentsEXECUTIVE SUMMARY ......................................................................................................................................................... 1
1 STUDY OVERVIEW ....................................................................................................................................................... 9
1.1 BACKGROUND ................................................................................................................................................................ 9 1.1.1 TOD Context: State of Hawai‘i Strategic Plan for Transit-Oriented Development ................................................. 9 1.1.2 TOD Context: City and County of Honolulu Neighborhood TOD Plans ................................................................. 10
1.2 STUDY PURPOSE ........................................................................................................................................................... 11 1.3 SCOPE ......................................................................................................................................................................... 11 1.4 STUDY TEAM, ROLES, AND TOD COUNCIL ENGAGEMENT ...................................................................................................... 11
1.4.1 Hawai‘i Interagency Council for Transit-Oriented Development (TOD Council) ................................................... 11 1.4.2 Project Coordinating Committee (PCC) ................................................................................................................ 12 1.4.3 TOD Priority Area Permitted Interaction Groups (TOD Priority Area Work Groups) ............................................ 12
1.5 STUDY PROCESS AND SCHEDULE ....................................................................................................................................... 13 1.6 STUDY APPROACH AND COMPONENTS .............................................................................................................................. 13
1.6.1 Preferred Land Use Scenario and TOD Potential .................................................................................................. 13 1.6.2 Infrastructure Requirements and Costs ............................................................................................................... 14 1.6.3 Infrastructure Funding Needs and Timeframes ................................................................................................... 17 1.6.4 Infrastructure Financing Options and Financial Analysis ..................................................................................... 18
1.7 ASSUMPTIONS AND CAVEATS ........................................................................................................................................... 18
2 EAST KAPOLEI TOD PRIORITY AREA ........................................................................................................................... 19
2.1 TOD CONTEXT: CITY AND COUNTY OF HONOLULU EAST KAPOLEI NEIGHBORHOOD TOD PLAN .................................................... 19 2.2 PREFERRED LAND USE SCENARIO AND TOD POTENTIAL ........................................................................................................ 19
2.2.1 Major Landowners and TOD Projects in the East Kapolei TOD Priority Area ....................................................... 24 2.3 EAST KAPOLEI TOD PRIORITY AREA INFRASTRUCTURE ASSESSMENT ........................................................................................ 26
2.3.1 Sewer System ....................................................................................................................................................... 26 2.3.2 Water System ....................................................................................................................................................... 28 2.3.3 Drainage System .................................................................................................................................................. 32 2.3.4 Storm Water Quality ............................................................................................................................................ 33 2.3.5 Roadways and Circulation .................................................................................................................................... 34 2.3.6 Electrical and Telecommunication Systems ......................................................................................................... 36 2.3.7 Public Schools ....................................................................................................................................................... 38 2.3.8 Sustainability and District Systems ...................................................................................................................... 38
2.4 EAST KAPOLEI TOD PRIORITY AREA ROUGH ORDER OF MAGNITUDE (ROM) INFRASTRUCTURE COSTS .......................................... 39 2.5 KEY INFRASTRUCTURE ISSUES FOR THE EAST KAPOLEI TOD PRIORITY AREA............................................................................... 42
3 HĀLAWA-STADIUM TOD PRIORITY AREA .................................................................................................................. 45
3.1 TOD CONTEXT: CITY AND COUNTY OF HONOLULU HĀLAWA AREA TOD PLAN .......................................................................... 45 3.2 PREFERRED LAND USE SCENARIO AND TOD POTENTIAL ........................................................................................................ 45
3.2.1 Major Landowners and TOD Projects in the Hālawa-Stadium TOD Priority Area ................................................ 50 3.3 HĀLAWA-STADIUM TOD PRIORITY AREA INFRASTRUCTURE ASSESSMENT ................................................................................ 51
3.3.1 Sewer System ....................................................................................................................................................... 52 3.3.2 Water System ....................................................................................................................................................... 54 3.3.3 Drainage System .................................................................................................................................................. 55 3.3.4 Storm Water Quality ............................................................................................................................................ 56 3.3.5 Roadways and Circulation .................................................................................................................................... 57 3.3.6 Electrical and Telecommunication Systems ......................................................................................................... 59 3.3.7 Public Schools ....................................................................................................................................................... 61 3.3.8 Sustainability and District Systems ...................................................................................................................... 61
3.4 HĀLAWA-STADIUM TOD PRIORITY AREA ROUGH ORDER OF MAGNITUDE (ROM) INFRASTRUCTURE COSTS .................................. 62 3.5 KEY INFRASTRUCTURE ISSUES FOR THE HĀLAWA-STADIUM TOD PRIORITY AREA ....................................................................... 65
4 IWILEI-KAPĀLAMA TOD PRIORITY AREA .................................................................................................................... 67
State TOD Planning & Implementation Project, Island of O‘ahu
iii
4.1 TOD CONTEXT: CITY AND COUNTY OF HONOLULU KALIHI AND DOWNTOWN NEIGHBORHOOD TOD PLANS AND IWILEI/KAPĀLAMA TRANSIT-ORIENTED DEVELOPMENT INFRASTRUCTURE NEEDS ASSESSMENT ........................................................................................... 67 4.2 PREFERRED LAND USE SCENARIO AND TOD POTENTIAL ........................................................................................................ 68
4.2.1 Preferred Land Use Scenario ................................................................................................................................ 68 4.2.2 Potential Limitations to TOD Potential ................................................................................................................ 68 4.2.3 Major Landowners and TOD Projects in Iwilei-Kapālama TOD Priority Area ....................................................... 77
4.3 IWILEI-KAPĀLAMA TOD PRIORITY AREA INFRASTRUCTURE ASSESSMENT .................................................................................. 78 4.3.1 Sewer System ....................................................................................................................................................... 79 4.3.2 Water System ....................................................................................................................................................... 81 4.3.3 Drainage System .................................................................................................................................................. 82 4.3.4 Storm Water Quality ............................................................................................................................................ 86 4.3.5 Roadways and Circulation .................................................................................................................................... 87 4.3.6 Electrical and Telecommunication Systems ......................................................................................................... 90 4.3.7 Public Schools ....................................................................................................................................................... 93 4.3.8 Sustainability and District Systems ...................................................................................................................... 94
4.4 IWILEI-KAPĀLAMA TOD PRIORITY AREA ROUGH ORDER OF MAGNITUDE (ROM) INFRASTRUCTURE COSTS .................................... 94 4.5 KEY INFRASTRUCTURE ISSUES FOR THE IWILEI-KAPĀLAMA TOD PRIORITY AREA ......................................................................... 99
5 INFRASTRUCTURE FINANCING ................................................................................................................................. 101
5.1 FINANCING STUDY OBJECTIVES AND OVERVIEW ................................................................................................................ 101 5.2 FINANCING STUDY CONDITIONS AND PARAMETERS ............................................................................................................ 102 5.3 ANTICIPATED DEVELOPMENT AND VALUE CREATION .......................................................................................................... 102 5.4 ESTIMATED INFRASTRUCTURE COSTS BY TOD PRIORITY AREA .............................................................................................. 104
5.4.1 East Kapolei TOD Priority Area Estimated Infrastructure Costs ......................................................................... 104 5.4.2 Hālawa-Stadium TOD Priority Area Estimated Infrastructure Costs .................................................................. 106 5.4.3 Iwilei-Kapālama TOD Priority Area Estimated Infrastructure Costs ................................................................... 107
5.5 CORRIDOR APPROACH .................................................................................................................................................. 108 5.6 OVERALL FUNDING REQUIREMENTS FOR THE THREE TOD PRIORITY AREAS ............................................................................ 109 5.7 PHASE 1 FINANCIAL ANALYSIS (2020-2029) ................................................................................................................... 110 5.8 CONVENTIONAL AND ALTERNATIVE FUNDING APPROACHES ................................................................................................. 110
5.8.1 Existing Funding Approaches ............................................................................................................................. 110 5.8.2 Alternative Funding Approaches ........................................................................................................................ 111 5.8.3 Financing Goals for the TOD Priority Areas ........................................................................................................ 113 5.8.4 Alternative Tools Considered ............................................................................................................................. 113
5.9 FINANCING ANALYSIS ................................................................................................................................................... 114 5.9.1 Model Assumptions ............................................................................................................................................ 114 5.9.2 Scenario 1: Status Quo (Phases 1-3, 2020 through 2049) .................................................................................. 115 5.9.3 Benchmark Assessment of Alternative Tools ..................................................................................................... 116 5.9.4 Scenario 2: Alternate Tools (Phase 1, 2020-2029) ............................................................................................. 117 5.9.5 Scenario 3: Preferred Scenario with Gap Funding (Phase 1, 2020-2029) ........................................................... 119 5.9.6 Policy Considerations Relative to Tools Considered ........................................................................................... 120 5.9.7 Other Potential Funding Sources ........................................................................................................................ 121
5.10 CONCLUSION .............................................................................................................................................................. 121
6 REGIONAL INFRASTRUCTURE PLANNING CONSIDERATIONS: SUSTAINABILITY, DISTRICT SYSTEMS, AND FLEXIBLE ADAPTATION PATHWAYS (FAP) ....................................................................................................................................... 123
6.1 SUSTAINABILITY .......................................................................................................................................................... 123 6.2 DISTRICT SYSTEMS ....................................................................................................................................................... 126 6.3 A DYNAMIC APPROACH TO INFRASTRUCTURE PLANNING: FLEXIBLE ADAPTATION PATHWAYS (FAP)............................................ 128
6.3.1 Dynamic Approach to Infrastructure Planning ................................................................................................... 128 6.3.2 Iwilei-Kapālama TOD Priority Area Study Example ............................................................................................ 129 6.3.3 Evaluating Pathways .......................................................................................................................................... 131 6.3.4 Benefits and Recommendations......................................................................................................................... 131 6.3.5 Conclusions ........................................................................................................................................................ 132
State TOD Planning & Implementation Project, Island of O‘ahu

iv
7 SUMMARY AND NEXT STEPS ................................................................................................................................... 133
7.1 INFRASTRUCTURE SYSTEMS AND PRIORITIES ...................................................................................................................... 133 7.1.1 Prioritization ...................................................................................................................................................... 133 7.1.2 Critical Path Analysis .......................................................................................................................................... 134 7.1.3 District-Regional Systems ................................................................................................................................... 134 7.1.4 Flexible Adaptation Pathway Approach ............................................................................................................. 135
7.2 FINANCING APPROACHES .............................................................................................................................................. 135 7.2.1 Expand and Refine Development View .............................................................................................................. 136 7.2.2 Update and Refine Funding Needs and Tools .................................................................................................... 136 7.2.3 Feasibility Analysis ............................................................................................................................................. 136 7.2.4 Mechanisms for Managing Funds ...................................................................................................................... 137 7.2.5 Legal Review ...................................................................................................................................................... 137 7.2.6 Other Options Raised ......................................................................................................................................... 137 7.2.7 COVID-19 Impacts .............................................................................................................................................. 138
7.3 COORDINATED APPROACHES AND COLLABORATION ........................................................................................................... 138
8 REFERENCES ............................................................................................................................................................ 139
APPENDICES .................................................................................................................................................................... 141
State TOD Planning & Implementation Project, Island of O‘ahu
v
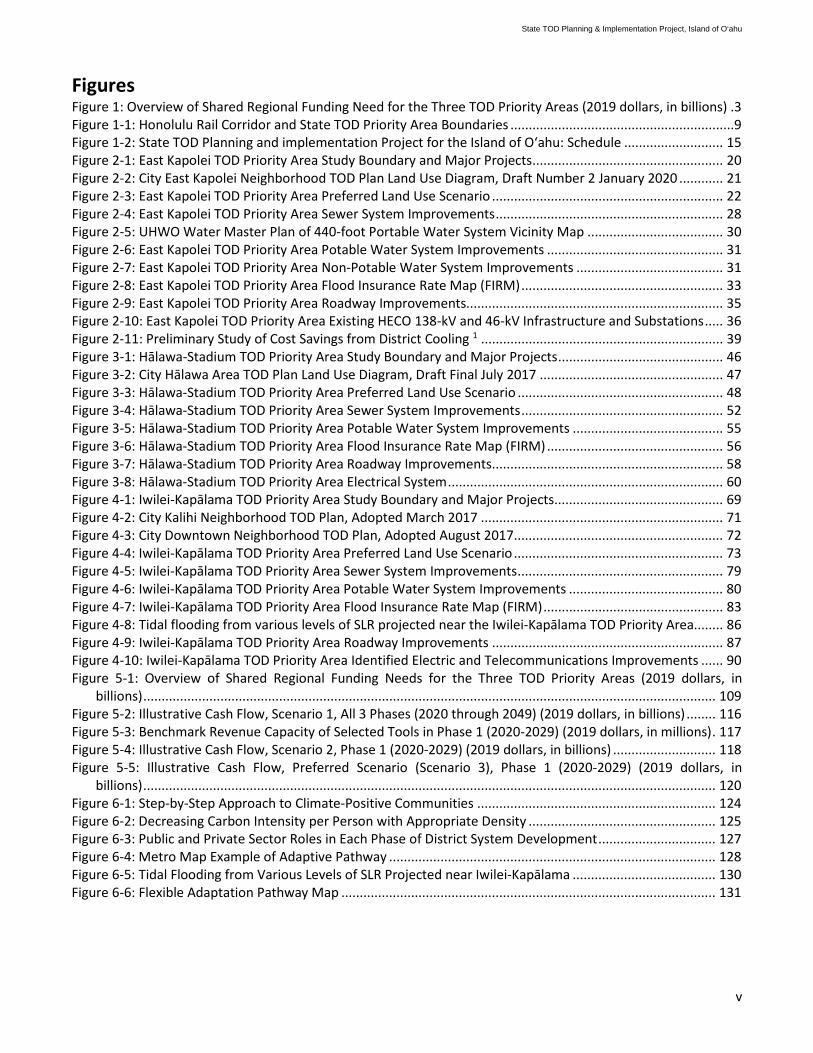
Figures Figure 1: Overview of Shared Regional Funding Need for the Three TOD Priority Areas (2019 dollars, in billions) .3 Figure 1-1: Honolulu Rail Corridor and State TOD Priority Area Boundaries .............................................................9 Figure 1-2: State TOD Planning and implementation Project for the Island of O‘ahu: Schedule ........................... 15 Figure 2-1: East Kapolei TOD Priority Area Study Boundary and Major Projects .................................................... 20 Figure 2-2: City East Kapolei Neighborhood TOD Plan Land Use Diagram, Draft Number 2 January 2020 ............ 21 Figure 2-3: East Kapolei TOD Priority Area Preferred Land Use Scenario ............................................................... 22 Figure 2-4: East Kapolei TOD Priority Area Sewer System Improvements .............................................................. 28 Figure 2-5: UHWO Water Master Plan of 440-foot Portable Water System Vicinity Map ..................................... 30 Figure 2-6: East Kapolei TOD Priority Area Potable Water System Improvements ................................................ 31 Figure 2-7: East Kapolei TOD Priority Area Non-Potable Water System Improvements ........................................ 31 Figure 2-8: East Kapolei TOD Priority Area Flood Insurance Rate Map (FIRM) ....................................................... 33 Figure 2-9: East Kapolei TOD Priority Area Roadway Improvements...................................................................... 35 Figure 2-10: East Kapolei TOD Priority Area Existing HECO 138-kV and 46-kV Infrastructure and Substations ..... 36 Figure 2-11: Preliminary Study of Cost Savings from District Cooling 1 .................................................................. 39 Figure 3-1: Hālawa-Stadium TOD Priority Area Study Boundary and Major Projects ............................................. 46 Figure 3-2: City Hālawa Area TOD Plan Land Use Diagram, Draft Final July 2017 .................................................. 47 Figure 3-3: Hālawa-Stadium TOD Priority Area Preferred Land Use Scenario ........................................................ 48 Figure 3-4: Hālawa-Stadium TOD Priority Area Sewer System Improvements ....................................................... 52 Figure 3-5: Hālawa-Stadium TOD Priority Area Potable Water System Improvements ......................................... 55 Figure 3-6: Hālawa-Stadium TOD Priority Area Flood Insurance Rate Map (FIRM) ................................................ 56 Figure 3-7: Hālawa-Stadium TOD Priority Area Roadway Improvements ............................................................... 58 Figure 3-8: Hālawa-Stadium TOD Priority Area Electrical System ........................................................................... 60 Figure 4-1: Iwilei-Kapālama TOD Priority Area Study Boundary and Major Projects .............................................. 69 Figure 4-2: City Kalihi Neighborhood TOD Plan, Adopted March 2017 .................................................................. 71 Figure 4-3: City Downtown Neighborhood TOD Plan, Adopted August 2017 ......................................................... 72 Figure 4-4: Iwilei-Kapālama TOD Priority Area Preferred Land Use Scenario ......................................................... 73 Figure 4-5: Iwilei-Kapālama TOD Priority Area Sewer System Improvements ........................................................ 79 Figure 4-6: Iwilei-Kapālama TOD Priority Area Potable Water System Improvements .......................................... 80 Figure 4-7: Iwilei-Kapālama TOD Priority Area Flood Insurance Rate Map (FIRM) ................................................. 83 Figure 4-8: Tidal flooding from various levels of SLR projected near the Iwilei-Kapālama TOD Priority Area........ 86 Figure 4-9: Iwilei-Kapālama TOD Priority Area Roadway Improvements ............................................................... 87 Figure 4-10: Iwilei-Kapālama TOD Priority Area Identified Electric and Telecommunications Improvements ...... 90 Figure 5-1: Overview of Shared Regional Funding Needs for the Three TOD Priority Areas (2019 dollars, in
billions) ............................................................................................................................................................ 109 Figure 5-2: Illustrative Cash Flow, Scenario 1, All 3 Phases (2020 through 2049) (2019 dollars, in billions) ........ 116 Figure 5-3: Benchmark Revenue Capacity of Selected Tools in Phase 1 (2020-2029) (2019 dollars, in millions) . 117 Figure 5-4: Illustrative Cash Flow, Scenario 2, Phase 1 (2020-2029) (2019 dollars, in billions) ............................ 118 Figure 5-5: Illustrative Cash Flow, Preferred Scenario (Scenario 3), Phase 1 (2020-2029) (2019 dollars, in
billions) ............................................................................................................................................................ 120 Figure 6-1: Step-by-Step Approach to Climate-Positive Communities ................................................................. 124 Figure 6-2: Decreasing Carbon Intensity per Person with Appropriate Density ................................................... 125 Figure 6-3: Public and Private Sector Roles in Each Phase of District System Development ................................ 127 Figure 6-4: Metro Map Example of Adaptive Pathway ......................................................................................... 128 Figure 6-5: Tidal Flooding from Various Levels of SLR Projected near Iwilei-Kapālama ....................................... 130 Figure 6-6: Flexible Adaptation Pathway Map ...................................................................................................... 131
State TOD Planning & Implementation Project, Island of O‘ahu
vi
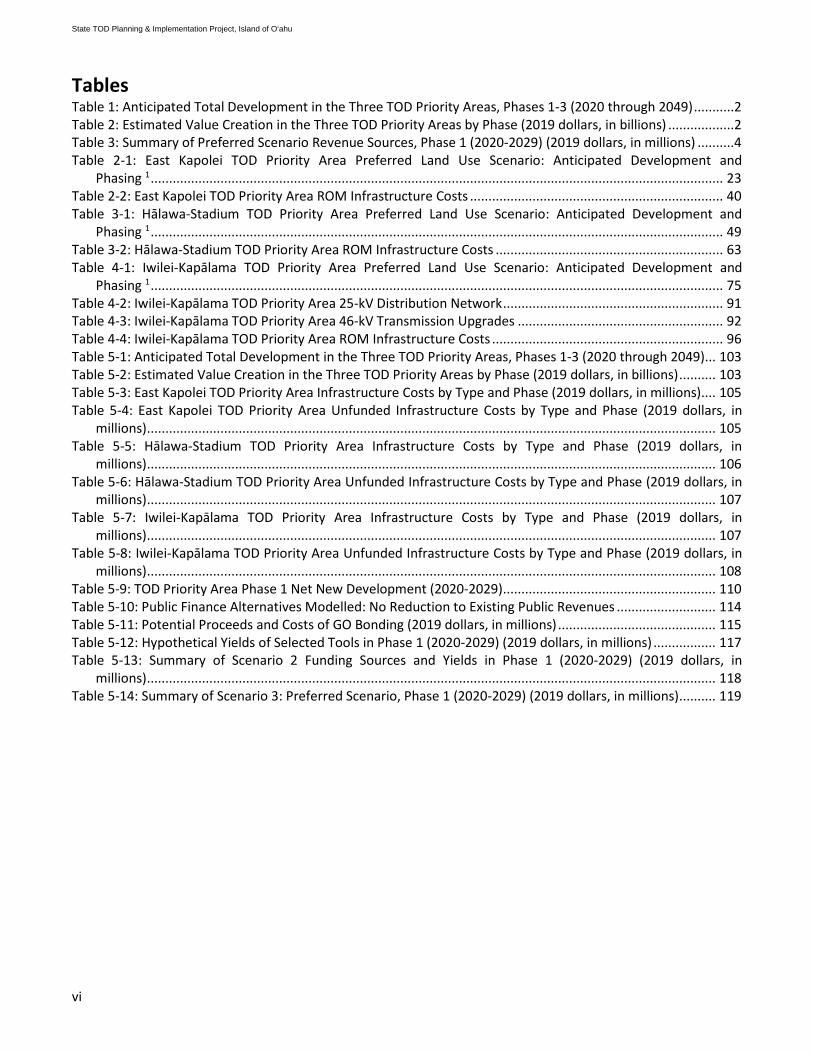
Tables Table 1: Anticipated Total Development in the Three TOD Priority Areas, Phases 1-3 (2020 through 2049) ...........2 Table 2: Estimated Value Creation in the Three TOD Priority Areas by Phase (2019 dollars, in billions) ..................2 Table 3: Summary of Preferred Scenario Revenue Sources, Phase 1 (2020-2029) (2019 dollars, in millions) ..........4 Table 2-1: East Kapolei TOD Priority Area Preferred Land Use Scenario: Anticipated Development and
Phasing 1 ............................................................................................................................................................ 23 Table 2-2: East Kapolei TOD Priority Area ROM Infrastructure Costs ..................................................................... 40 Table 3-1: Hālawa-Stadium TOD Priority Area Preferred Land Use Scenario: Anticipated Development and
Phasing 1 ............................................................................................................................................................ 49 Table 3-2: Hālawa-Stadium TOD Priority Area ROM Infrastructure Costs .............................................................. 63 Table 4-1: Iwilei-Kapālama TOD Priority Area Preferred Land Use Scenario: Anticipated Development and
Phasing 1 ............................................................................................................................................................ 75 Table 4-2: Iwilei-Kapālama TOD Priority Area 25-kV Distribution Network ............................................................ 91 Table 4-3: Iwilei-Kapālama TOD Priority Area 46-kV Transmission Upgrades ........................................................ 92 Table 4-4: Iwilei-Kapālama TOD Priority Area ROM Infrastructure Costs ............................................................... 96 Table 5-1: Anticipated Total Development in the Three TOD Priority Areas, Phases 1-3 (2020 through 2049) ... 103 Table 5-2: Estimated Value Creation in the Three TOD Priority Areas by Phase (2019 dollars, in billions) .......... 103 Table 5-3: East Kapolei TOD Priority Area Infrastructure Costs by Type and Phase (2019 dollars, in millions) .... 105 Table 5-4: East Kapolei TOD Priority Area Unfunded Infrastructure Costs by Type and Phase (2019 dollars, in
millions) ........................................................................................................................................................... 105 Table 5-5: Hālawa-Stadium TOD Priority Area Infrastructure Costs by Type and Phase (2019 dollars, in
millions) ........................................................................................................................................................... 106 Table 5-6: Hālawa-Stadium TOD Priority Area Unfunded Infrastructure Costs by Type and Phase (2019 dollars, in
millions) ........................................................................................................................................................... 107 Table 5-7: Iwilei-Kapālama TOD Priority Area Infrastructure Costs by Type and Phase (2019 dollars, in
millions) ........................................................................................................................................................... 107 Table 5-8: Iwilei-Kapālama TOD Priority Area Unfunded Infrastructure Costs by Type and Phase (2019 dollars, in
millions) ........................................................................................................................................................... 108 Table 5-9: TOD Priority Area Phase 1 Net New Development (2020-2029) .......................................................... 110 Table 5-10: Public Finance Alternatives Modelled: No Reduction to Existing Public Revenues ........................... 114 Table 5-11: Potential Proceeds and Costs of GO Bonding (2019 dollars, in millions) ........................................... 115 Table 5-12: Hypothetical Yields of Selected Tools in Phase 1 (2020-2029) (2019 dollars, in millions) ................. 117 Table 5-13: Summary of Scenario 2 Funding Sources and Yields in Phase 1 (2020-2029) (2019 dollars, in
millions) ........................................................................................................................................................... 118 Table 5-14: Summary of Scenario 3: Preferred Scenario, Phase 1 (2020-2029) (2019 dollars, in millions) .......... 119
State TOD Planning & Implementation Project, Island of O‘ahu
vii
Appendices Appendix A – Consultation Meeting List Appendix B – Anticipated TOD Land Use Development Methodology Appendix C – Land Use Development Numbers, Infrastructure Requirements, and Costs Tables Appendix D – Infrastructure Study for Transit-Oriented Development in State East Kapolei, Hālawa-Stadium, and
Iwilei-Kapālama TOD Priority Areas (R.M. Towill Corporation) Appendix E – Electrical and Telecommunications Infrastructure Needs Assessment (Ron N.S. Ho and Associates,
Inc.) Appendix F – Final Summary Report: State TOD Planning and Implementation for the Island of O‘ahu
Transportation Analysis (Fehr & Peers) Appendix G – TOD Financial Analysis (DTA) Appendix H – State TOD Planning and Implementation for the Island of O‘ahu, Sustainability and Neighborhood-
Serving Systems (Arup) Appendix I – State TOD Planning and Implementation for the Island of O‘ahu, Flexible Adaptation Pathways: An
Approach for Sea Level Rise and Flood Infrastructure (Arup) Appendix J – Project Coordinating Committee (PCC), TOD Priority Area Permitted Interaction Group (TOD Priority
Area Work Groups), and TOD Council Meeting Materials and Notes
State TOD Planning & Implementation Project, Island of O‘ahu
viii
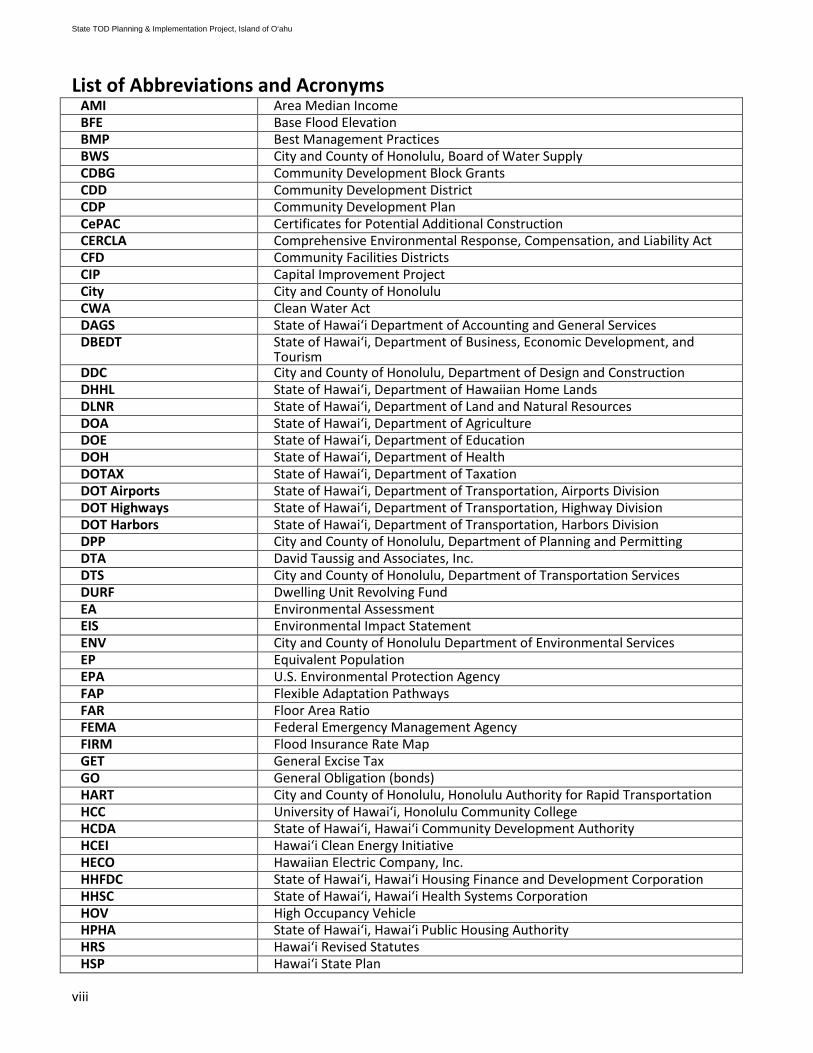
List of Abbreviations and Acronyms AMI Area Median Income BFE Base Flood Elevation BMP Best Management Practices BWS City and County of Honolulu, Board of Water Supply CDBG Community Development Block Grants CDD Community Development District CDP Community Development Plan CePAC Certificates for Potential Additional Construction CERCLA Comprehensive Environmental Response, Compensation, and Liability Act CFD Community Facilities Districts CIP Capital Improvement Project City City and County of Honolulu CWA Clean Water Act DAGS State of Hawai‘i Department of Accounting and General Services DBEDT State of Hawai‘i, Department of Business, Economic Development, and
Tourism DDC City and County of Honolulu, Department of Design and Construction DHHL State of Hawai‘i, Department of Hawaiian Home Lands DLNR State of Hawai‘i, Department of Land and Natural Resources DOA State of Hawai‘i, Department of Agriculture DOE State of Hawai‘i, Department of Education DOH State of Hawai‘i, Department of Health DOTAX State of Hawai‘i, Department of Taxation DOT Airports State of Hawaiʻi, Department of Transportation, Airports Division DOT Highways State of Hawai‘i, Department of Transportation, Highway Division DOT Harbors State of Hawai‘i, Department of Transportation, Harbors Division DPP City and County of Honolulu, Department of Planning and Permitting DTA David Taussig and Associates, Inc. DTS City and County of Honolulu, Department of Transportation Services DURF Dwelling Unit Revolving Fund EA Environmental Assessment EIS Environmental Impact Statement ENV City and County of Honolulu Department of Environmental Services EP Equivalent Population EPA U.S. Environmental Protection Agency FAP Flexible Adaptation Pathways FAR Floor Area Ratio FEMA Federal Emergency Management Agency FIRM Flood Insurance Rate Map GET General Excise Tax GO General Obligation (bonds) HART City and County of Honolulu, Honolulu Authority for Rapid Transportation HCC University of Hawai‘i, Honolulu Community College HCDA State of Hawai‘i, Hawaiʻi Community Development Authority HCEI Hawaiʻi Clean Energy Initiative HECO Hawaiian Electric Company, Inc. HHFDC State of Hawai‘i, Hawai‘i Housing Finance and Development Corporation HHSC State of Hawai‘i, Hawai‘i Health Systems Corporation HOV High Occupancy Vehicle HPHA State of Hawai‘i, Hawai‘i Public Housing Authority HRS Hawai‘i Revised Statutes HSP Hawai‘i State Plan
State TOD Planning & Implementation Project, Island of O‘ahu

ix
HUD U.S. Housing and Urban Development IPD-T Interim Planned Development-Transit kV Kilo-volt LIHTC Low-Income Housing Tax Credits LRDP Long Range Development Plan MG Million Gallon MGD Millions of gallons per day MP Master Plan NASED New Aloha Stadium Entertainment District NEPA United States, National Environmental Policy Act NOAA United States, National Oceanic and Atmospheric Administration NPDES National Pollutant Discharge Elimination System OCCC O‘ahu Community Correctional Center OP Office of Planning, Department of Business, Economic Development, and
Tourism, State of Hawai‘i OR&L O‘ahu Railroad & Land Company P3 Public-Private Partnership PCC Project Coordinating Committee PILOT Payment in Lieu of Taxes PSD State of Hawai‘i, Department of Public Safety PUC Public Utilities Commission PUC DP Primary Urban Center Development Plan RMT R.M. Towill CorporationROH Revised Ordinances of Honolulu ROM Rough Order of Magnitude ROW Right-of-Way RPT Real Property Tax SA Stadium Authority, State of Hawai‘i, Department of Accounting and General
Services SCA Sewer Connection Application SF Square Footage SLR Sea Level Rise State State of Hawaiʻi State Strategic Plan for TOD State of Hawaiʻi Strategic Plan for Transit-Oriented Development, 2018 STIP State Transportation Improvement Program SWAC Honolulu Seawater Air Conditioning SWQR Storm Water Quality Reports TIAR Traffic Impact Analysis Report TIF Tax Increment Financing TMK Tax Map Key TOD Transit-Oriented Development TOD Council Hawaiʻi Interagency Council for Transit-Oriented Development UH University of Hawai‘i UHWO University of Hawai‘i West O‘ahu WRF Water Recycling Facility WWPS Wastewater Pump Station WWTP Wastewater Treatment Plant
State TOD Planning & Implementation Project, Island of O‘ahu

x
Glossary of Terms Committed funds Money or other resources that have been dedicated or obligated for specific
objectives (Merriam-Webster Dictionary, 2020). Construction costs The costs involved in building and landscaping capital facilities, including any
consultant or staff services required and built-in equipment (Hawaiʻi State Legislature, 2020).
Dig once Policies or approaches that allow for and/or encourage coordination between government agencies and utility companies in order to decrease the frequency of right of way excavation required to install infrastructure. (Modified definition from (Coleman, 2017) and (United States Government Accountability Office, 2012))
External or Outside funds Refers to money that a company, firm, department, or agency raises by from any source other than itself (Financial Dictionary, 2020).
Financing In this public finance context, refers to the act or process of raising upfront capital in order to expedite development by providing funds earlier than would otherwise be available. This typically involves borrowing or otherwise leveraging future revenue streams (DTA, 2019).
Full faith and credit The recognition and enforcement of the public acts, records, and judicial proceedings of one state by another (Merriam-Webster Dictionary, 2020).
Funded As used herein, refers to projects for which funding sources have already been identified. These are conventionally 2- and 6-year CIP funds, utility revenue bonds, highway or school impact fees and other legislative funds provided to the DOE (See also “Unfunded”).
Funding In this public finance context, refers to the revenue stream or other source of monies that are set apart to support for a specific development objective. It may be monies that are immediately available, such as appropriations, or monies that will derive from a future revenue stream and be used to repay financing (DTA, 2019).
Infrastructure For the purposes of this project, infrastructure is broadly defined to include roadways and highways, pedestrian and bike facilities, wastewater, water, storm water and drainage systems, energy and telecommunications, including broadband, transit and bus systems and facilities, and public schools (Office of Planning, 2018).
Investment Refers to the cost and source of financing for the planning, design, and construction—and possibly, operations and maintenance—of capital improvement projects (Office of Planning, 2018).
Net New Development The total new inventory, less any demolitions that would need to occur to accommodate the new development.
Pay-as-you-go An approach in which revenues from general appropriations or a dedicated funding source are applied to target projects as the funds are generated or as they become available
Status quo Refers to the existing state of affairs, especially as related to policies and practices (Merriam-Webster Dictionary, 2020).
Total or Gross Development Any new unit or facility built within the TOD priority areas Underwriting The analysis and assurance of source revenues Unfunded As used herein, refers to that portion of estimated required infrastructure
costs that has not been provided for via traditional funding sources (see also “Funded”).
Value Capture/Value Creation Refers to a policy approach that enables State and county governments to recover and reinvest land value increases resulting from public investment and other government actions. Funds can only be made available when subject to recapture by State and county governments (Lincoln Institute of Land Policy, 2018).
State TOD Planning & Implementation Project, Island of O‘ahu
1
Executive Summary
This study identifies infrastructure and other public investments required to advance State of Hawaiʻi (State) TOD goals within three State TOD priority areas on O‘ahu, and recommends financing tools to support TOD implementation in these areas. The TOD priority areas are East Kapolei, Hālawa-Stadium and Iwilei-Kapālama, as identified in the State of Hawaiʻi Strategic Plan for Transit-Oriented Development from 2018 (State Strategic Plan for TOD). The focus is on infrastructure facilities that serve regional- or area-wide scales to best capture economies of scale and ensure that public resources are invested in a cost-effective manner in State and City and County of Honolulu (City) efforts to realize the broader public benefits of TOD.
This study sets forth a rationale for addressing all three TOD priority areas as a whole in a “corridor-wide approach”, rather than relying on a status quo approach that often puts agencies and regions in competition with one another for limited public resources.
The findings presented herein provide essential information and a very important resource for the State to identify, support, and track actions to facilitate shared infrastructure investments and department/agency development projects, and is intended to facilitate the implementation and update of the State Strategic Plan for TOD for those projects along the rail corridor on O‘ahu.
Interagency and Interjurisdictional Approach With assistance from the State Office of Planning (OP) and the Hawaiʻi Interagency Council for Transit-Oriented Development (TOD Council), the study convened leaders and senior representatives of State and County departments and agencies with landholding interests, other major landowners, and TOD Council stakeholder representatives in a process to identify infrastructure needs in the three TOD priority areas. The study team would like to acknowledge and express thanks for the extensive and sustained efforts and productive interagency and interjurisdictional (City, State, and private sector) conversations that enabled and underlie the study approach.
Through this coordinated approach, a broad, long-term corridor approach for region-serving infrastructure investment was identified ,which can be used to target immediate, area-, or agency-specific needs going forward. This interagency and interjurisdictional collaboration was vital to this process and will continue to be vital going forward, to ensure efficient implementation of infrastructure projects that will benefit not only State landowners, but private and broader civic interests as well.
While each of the three TOD priority areas has different infrastructure needs and timelines, the study as a whole identifies opportunities for collaboration on infrastructure investments and provides information to develop an overall strategy for infrastructure investment and delivery that is more predictable, integrated, and reliable than what the current system provides.
State Goals for the TOD Priority Areas The various State agencies with landholdings in the three TOD priority areas serve unique missions, and seek to use their assets within these areas to enhance or expand services and/or generate income to support their missions, while supporting TOD goals that consider environmental, planning, and other public goals. A sampling of such goals to be addressed within these areas includes development of facilities to support enhanced programs and enrollment at the University of Hawaiʻi West O‘ahu (UHWO) and Honolulu Community College (HCC) campuses; revenues to support natural resource conservation for the Department of Land and Natural Resources (DLNR); stadium redevelopment and affiliated economic development and revenue-generating entertainment uses for Stadium Authority (SA); and meeting the need for more affordable housing for native Hawaiians served by the Department of Hawaiian Home Lands (DHHL) and low- to moderate-income residents served by the Hawaiʻi Public Housing Authority (HPHA) and the Hawaiʻi Housing Finance and Development Corporation (HHFDC).
State TOD Planning & Implementation Project, Island of O‘ahu
2
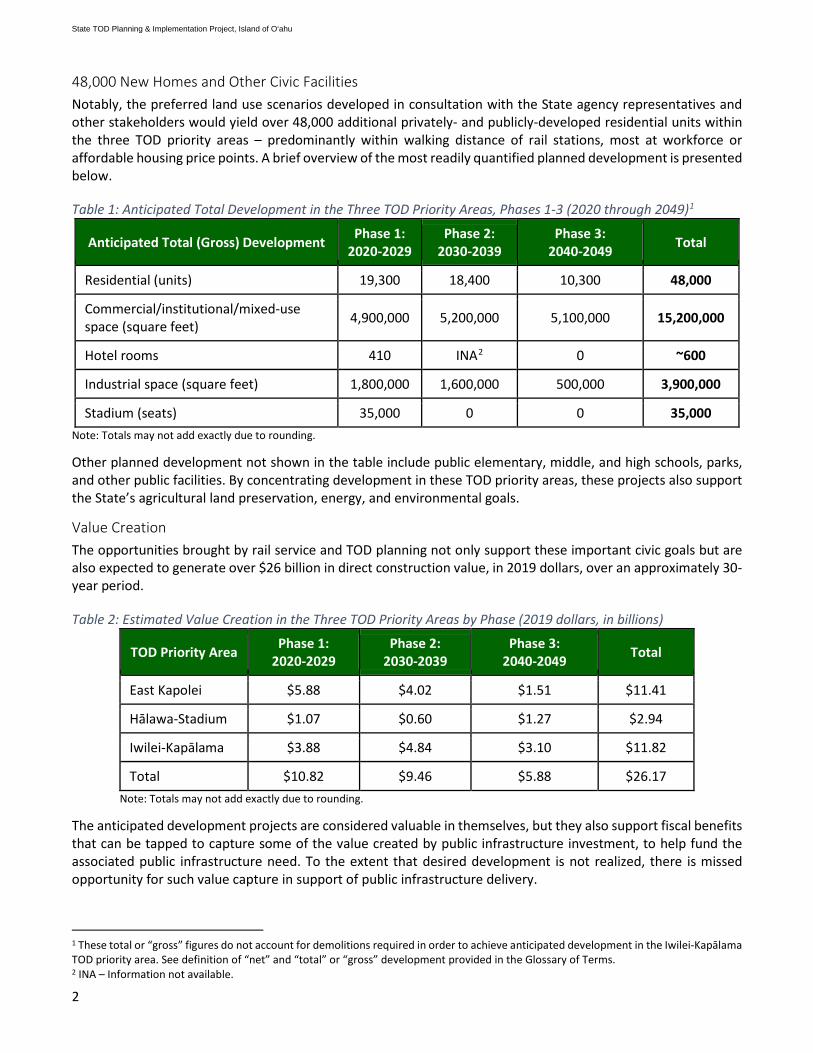
48,000 New Homes and Other Civic Facilities Notably, the preferred land use scenarios developed in consultation with the State agency representatives and other stakeholders would yield over 48,000 additional privately- and publicly-developed residential units within the three TOD priority areas – predominantly within walking distance of rail stations, most at workforce or affordable housing price points. A brief overview of the most readily quantified planned development is presented below.
Table 1: Anticipated Total Development in the Three TOD Priority Areas, Phases 1-3 (2020 through 2049)1
Anticipated Total (Gross) Development Phase 1: 2020-2029
Phase 2: 2030-2039
Phase 3: 2040-2049 Total
Residential (units) 19,300 18,400 10,300 48,000
Commercial/institutional/mixed-use space (square feet) 4,900,000 5,200,000 5,100,000 15,200,000
Hotel rooms 410 INA2 0 ~600
Industrial space (square feet) 1,800,000 1,600,000 500,000 3,900,000
Stadium (seats) 35,000 0 0 35,000 Note: Totals may not add exactly due to rounding.
Other planned development not shown in the table include public elementary, middle, and high schools, parks, and other public facilities. By concentrating development in these TOD priority areas, these projects also support the State’s agricultural land preservation, energy, and environmental goals.
Value Creation The opportunities brought by rail service and TOD planning not only support these important civic goals but are also expected to generate over $26 billion in direct construction value, in 2019 dollars, over an approximately 30-year period.
Table 2: Estimated Value Creation in the Three TOD Priority Areas by Phase (2019 dollars, in billions)
TOD Priority Area Phase 1: 2020-2029
Phase 2: 2030-2039
Phase 3: 2040-2049 Total
East Kapolei $5.88 $4.02 $1.51 $11.41
Hālawa-Stadium $1.07 $0.60 $1.27 $2.94
Iwilei-Kapālama $3.88 $4.84 $3.10 $11.82
Total $10.82 $9.46 $5.88 $26.17 Note: Totals may not add exactly due to rounding.
The anticipated development projects are considered valuable in themselves, but they also support fiscal benefits that can be tapped to capture some of the value created by public infrastructure investment, to help fund the associated public infrastructure need. To the extent that desired development is not realized, there is missed opportunity for such value capture in support of public infrastructure delivery.
1 These total or “gross” figures do not account for demolitions required in order to achieve anticipated development in the Iwilei-Kapālama TOD priority area. See definition of “net” and “total” or “gross” development provided in the Glossary of Terms. 2 INA – Information not available.
State TOD Planning & Implementation Project, Island of O‘ahu

3
Infrastructure Need and Costs It goes without saying that State goals such as the provision of substantial new housing, and the value that new development will create, will be jeopardized if the underlying regional infrastructure systems are not upgraded and implemented in a timely manner beforehand. Infrastructure systems evaluated in this study included shared, or regional-serving wastewater, water, storm water and drainage systems, roadways and highways including multimodal and transit facilities, energy and telecommunications including broadband, and public schools.3
Specific infrastructure needs for each TOD priority area are discussed in Sections 2.4, 3.4, and 4.4 of this report.
The cost of the additional regional infrastructure required to support State agency goals in the three TOD priority areas is estimated at $4.93 billion over the next 30 years, in 2019 dollars. To date, an estimated $1.74 billion in funding has been identified from existing funding sources, including 2- and 6-year Capital Improvement Project (CIP) funds, anticipated yields of sewer and water revenue bonds, ‘Ewa Highway Impact Fees, and anticipated Department of Education (DOE) funding. This leaves an unfunded balance, or remaining cost after accounting for the existing funding sources, of some $3.19 billion.
Given the long lead time required for infrastructure financing and development, an effective investment strategy is needed and is critical to ensure that system capacities can be upgraded efficiently, so that inadequate infrastructure does not become a barrier to meeting important public goals in these TOD priority areas. The public finance consulting firm, David Taussig and Associates, Inc. (DTA), was engaged to evaluate financing tools or mechanisms4 that could be considered by the State and/or City in funding the necessary public infrastructure.
Recommended Financing Tools DTA was charged with evaluating and recommending tools that could be viable options for government to bridge funding shortfalls while meeting stated goals of State agencies and other stakeholders in the TOD priority areas. Numerous issues and challenges unique to this development were addressed with the support of agency participants and other regional stakeholders during discussions and in DTA’s research. These included the multi-jurisdictional nature of the infrastructure projects (City and State); concerns for political viability and public acceptance; land ownership status; timing and the availability of funds, among others.
DTA’s analysis focused on Phase 1 (2020-2029) infrastructure funding needs, because of their immediacy, and because the design options, costs, and available funding resources are most well-known in the near-term. However, the tools and concepts identified are relevant for application to subsequent development phases and costs as well. The promising tools and strategies identified may also offer corollary lessons to meeting public goals in other TOD areas in the State.
3 The study focus was on typically utility- and transportation-related infrastructure plus DOE schools. Various other community infrastructure not addressed in this study include the additional police and fire stations, public parks, and libraries that may be desired to support new development. 4 Financing “tools” and “mechanisms” are used interchangeably in this report.
Figure 1: Overview of Shared Regional Funding Need for the Three TOD Priority Areas (2019 dollars, in billions)
$1.24
$0.47 $0.04
$0.55
$0.96 $1.68
$ 1 . 7 9 BP H A S E 1
( 2 0 2 0 - 2 0 2 9 )
$ 1 . 4 2 BP H A S E 2
( 2 0 3 0 - 2 0 3 9 )
$ 1 . 7 2 BP H A S E 3
( 2 0 4 0 - 2 0 4 9 )
Funded Unfunded
State TOD Planning & Implementation Project, Island of O‘ahu

4
DTA and the study team concluded that three value capture tools were most promising to address the $0.55 billion in unfunded infrastructure need for Phase 1 (2020-2029) development. These tools entail no new taxes. Rather, they would capture a share of the future revenues from taxes on new development in the three TOD priority areas. The selected tools and their recommended capture rates are:
• 100% of General Excise Taxes (GET) on development expenditures related to new construction within the TOD priority areas;
• 50% of GET on spending at new retail, space leasing, and hotel operations within the TOD priority areas; and
• 30% of the additional County Real Property Taxes (RPT) collected on new development within the TOD priority areas.
Together these three value capture methods appear able to generate $0.79 billion over time; however, most revenues would not be collected until facilities are actually developed and operating.
Recognizing that infrastructure capacity is required before project development can be completed, the combination of recommended tools still left a near-term shortfall of some $0.22 billion. Some of the study stakeholders suggested an O‘ahu-wide GET surcharge for the short-term purpose of addressing this funding gap. As a surcharge, the proposed additional tool would not impact current revenues to the State general fund, but it would represent a tax increase spread among O‘ahu residents and visitors. Based on historical GET collections, a 0.1% surcharge on O‘ahu GET revenue for just 10 years could be expected to generate approximately $50 million per year, or $0.5 billion over the ten-year period the surcharge would be in effect, more than filling this funding gap.
Table 3: Summary of Preferred Scenario Revenue Sources, Phase 1 (2020-2029) (2019 dollars, in millions)
Revenue Sources % of New Revenue Allocated to Fund Infrastructure
New Revenue Allocated to Fund Infrastructure
(in Millions) Construction GET 100% $227.6
Ongoing GET 50% $486.2
Property Taxes 30% $80.9 Community Facilities District (CFD) Special Tax 0% $0.0
GET Surcharge Additional 0.1% GET for 10 Years $500.0
Total NA $1,294.7 Source: DTA, 2020
By filling the gap of the initially negative cash flows of Scenario 2, the GET surcharge in this Scenario allows the more gradual value capture revenue yields to accumulate. Thus, in addition to mitigating the early shortfalls, this surcharge also generated a surplus in future years that could be applied to Phases 2 (2030-2039) and 3 (2040-2049), or to other TOD investments or needs. As modelled, Phase 1 (2020-2029) would generate a surplus of approximately $0.4 billion by 2031, and another approximately $0.4 billion by 2041.
The study team recognizes that the four identified tools are not the only potentially viable alternatives, and each entails policy and implementation considerations that are discussed further in the report. Several other potential funding sources are noted in Section 5.8 of the study report.
Development Plans and Key Issues by TOD Priority Area This section provides a high-level summary of the key stakeholders, development opportunities, issues, and infrastructure needs specific to each of the three TOD priority areas.
State TOD Planning & Implementation Project, Island of O‘ahu
5
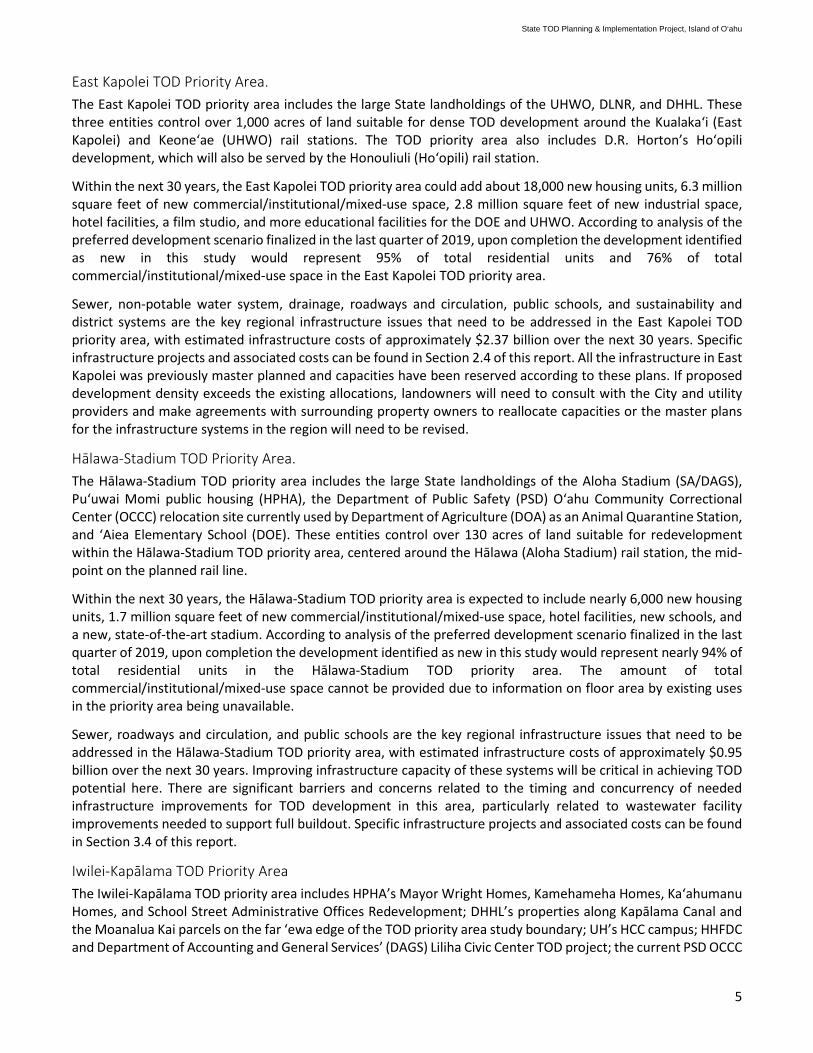
East Kapolei TOD Priority Area. The East Kapolei TOD priority area includes the large State landholdings of the UHWO, DLNR, and DHHL. These three entities control over 1,000 acres of land suitable for dense TOD development around the Kualaka‘i (East Kapolei) and Keone‘ae (UHWO) rail stations. The TOD priority area also includes D.R. Horton’s Ho‘opili development, which will also be served by the Honouliuli (Ho‘opili) rail station.
Within the next 30 years, the East Kapolei TOD priority area could add about 18,000 new housing units, 6.3 million square feet of new commercial/institutional/mixed-use space, 2.8 million square feet of new industrial space, hotel facilities, a film studio, and more educational facilities for the DOE and UHWO. According to analysis of the preferred development scenario finalized in the last quarter of 2019, upon completion the development identified as new in this study would represent 95% of total residential units and 76% of total commercial/institutional/mixed-use space in the East Kapolei TOD priority area.
Sewer, non-potable water system, drainage, roadways and circulation, public schools, and sustainability and district systems are the key regional infrastructure issues that need to be addressed in the East Kapolei TOD priority area, with estimated infrastructure costs of approximately $2.37 billion over the next 30 years. Specific infrastructure projects and associated costs can be found in Section 2.4 of this report. All the infrastructure in East Kapolei was previously master planned and capacities have been reserved according to these plans. If proposed development density exceeds the existing allocations, landowners will need to consult with the City and utility providers and make agreements with surrounding property owners to reallocate capacities or the master plans for the infrastructure systems in the region will need to be revised.
Hālawa-Stadium TOD Priority Area. The Hālawa-Stadium TOD priority area includes the large State landholdings of the Aloha Stadium (SA/DAGS), Puʻuwai Momi public housing (HPHA), the Department of Public Safety (PSD) Oʻahu Community Correctional Center (OCCC) relocation site currently used by Department of Agriculture (DOA) as an Animal Quarantine Station, and ‘Aiea Elementary School (DOE). These entities control over 130 acres of land suitable for redevelopment within the Hālawa-Stadium TOD priority area, centered around the Hālawa (Aloha Stadium) rail station, the mid-point on the planned rail line.
Within the next 30 years, the Hālawa-Stadium TOD priority area is expected to include nearly 6,000 new housing units, 1.7 million square feet of new commercial/institutional/mixed-use space, hotel facilities, new schools, and a new, state-of-the-art stadium. According to analysis of the preferred development scenario finalized in the last quarter of 2019, upon completion the development identified as new in this study would represent nearly 94% of total residential units in the Hālawa-Stadium TOD priority area. The amount of total commercial/institutional/mixed-use space cannot be provided due to information on floor area by existing uses in the priority area being unavailable.
Sewer, roadways and circulation, and public schools are the key regional infrastructure issues that need to be addressed in the Hālawa-Stadium TOD priority area, with estimated infrastructure costs of approximately $0.95 billion over the next 30 years. Improving infrastructure capacity of these systems will be critical in achieving TOD potential here. There are significant barriers and concerns related to the timing and concurrency of needed infrastructure improvements for TOD development in this area, particularly related to wastewater facility improvements needed to support full buildout. Specific infrastructure projects and associated costs can be found in Section 3.4 of this report.
Iwilei-Kapālama TOD Priority Area The Iwilei-Kapālama TOD priority area includes HPHA’s Mayor Wright Homes, Kamehameha Homes, Kaʻahumanu Homes, and School Street Administrative Offices Redevelopment; DHHL’s properties along Kapālama Canal and the Moanalua Kai parcels on the far ‘ewa edge of the TOD priority area study boundary; UH’s HCC campus; HHFDC and Department of Accounting and General Services’ (DAGS) Liliha Civic Center TOD project; the current PSD OCCC
State TOD Planning & Implementation Project, Island of O‘ahu

6
site; and Department of Transportation, Harbors Division (DOT Harbors) facilities. These State entities control several hundred acres of land identified for redevelopment and harbor expansion, centered around four planned rail stations: Kūwili (Iwilei), Niuhelewai (Kapālama), Mokauea (Kalihi), and Kahauiki (Hauiki) (Middle Street Transit Center).
Within the next 30 years, the Iwilei-Kapālama TOD priority area is expected to include nearly 24,000 new housing units, nearly 7.2 million square feet of new commercial/institutional/mixed-use space, and nearly 1.1 million square feet of new industrial space. Overall, the number of housing units is anticipated to increase, while the total amount of commercial/institutional and industrial space is expected to remain constant or decrease as the lands underlying such uses transition to residential or mixed-uses. According to analysis of the preferred development scenario finalized in the last quarter of 2019, upon completion the State and Kamehameha Schools’ Kapālama Kai and other redevelopment properties would represent 55% of overall new residential development and 7.5% of overall new commercial/institutional/mixed-use space within the Iwilei-Kapālama TOD priority area.
Sewer, electrical system capacity, drainage, and public schools are the key regional infrastructure issues that need to be addressed in the Iwilei-Kapālama TOD priority area with estimated infrastructure costs of approximately $1.58 billion over the next 30 years. Improving infrastructure capacity of these systems will be critical in achieving TOD potential. There are significant barriers and concerns related to the timing and concurrency of needed infrastructure improvements for TOD development in this area, particularly related to wastewater facility improvements needed to support full buildout in this TOD priority area. Specific infrastructure projects and associated costs can be found in Section 4 of this report. The Iwilei-Kapālama TOD priority area will also be acutely impacted by anticipated sea level rise (SLR). A Flexible Adaptation Pathway (FAP) Approach was developed by Arup to consider long-term impacts of SLR on infrastructure systems, and its application and value to investment in infrastructure improvements that could address SLR are discussed further in Section 4.4 of this report.
Regional Infrastructure Planning Considerations. Section 6 of the report presents two long-term infrastructure planning approaches, District Systems and Flexible Adaptation Pathways (FAP), related to climate change, sustainability, and resiliency that could help to address timing, cost, and approach to infrastructure planning for the future development of the State TOD priority areas.
District infrastructure systems create a network of services that capitalize on synergies and economies of scale to provide shared energy, water, goods movement, and waste services that cannot be captured at the level of individual buildings. The proposed Honolulu Seawater Air Conditioning Project is an example of a district system. The baseline cost assessments for the TOD priority areas in this study have not incorporated system optimization in the form of district systems. As a result, there remains opportunity for TOD stakeholders to advance such systems to the benefit of each TOD priority area as well as to the general public.
FAP approaches, on the other hand, are tied to an evolving knowledge base and can be used to address uncertain future conditions such as larger-scale storm and coastal flooding, as well as SLR and extreme heat. As outlined in Section 6.3, the FAP approach considers interdependencies between programs, identifies tipping points for actions, and provides clear logic for sequencing additional planning and technical studies.
Summary and Next Steps Ultimately, the findings of this study provide an important resource for the State to identify, support, and track actions necessary to facilitate shared infrastructure investments and individual State agency development projects. The findings are also intended to support the implementation and update of the State Strategic Plan for TOD for those projects along the rail corridor on O‘ahu. To implement these ideas in a cost effective and coordinated manner, key decisions and next steps remain for agencies, decision-makers, and the public. Next steps are considered in detail in Section 7, and will entail further work towards:
• Maintenance of an effective forum for interagency and interjurisdictional discourse and cooperation, with likely future outreach to broader community stakeholder groups;
State TOD Planning & Implementation Project, Island of O‘ahu

7
• Infrastructure system prioritization through critical path analysis and identification of opportunities to implement district/regional systems and FAP approaches;
• Further vetting of financing strategies to support unfunded infrastructure needs, with attention to legal, logistical, and cash flow considerations, as well as robust analyses and public discourse regarding their fiscal, political, social, and economic viability and fairness;
• Financial tool implementation planning, including consideration of the appropriate entities and mechanisms for collecting, managing, and disbursing funds to produce the required infrastructure in the most timely and cost-efficient manner; and,
• Coordinated approaches and collaboration to foster the creation of vibrant, walkable, and equitable TOD communities – collaboration that should continue and be fostered between State and City departments and agencies and the private for-profit and non-profit developers working as partners to deliver the visions to these TOD priority areas.
Observations on Potential Impacts of the COVID-19 Pandemic As noted at the outset of this report, the conclusions presented herein are largely based on conversations, consultations, and research conducted between the third quarter of 2018 and the first weeks of 2020. Since that time, the COVID-19 pandemic has dramatically changed the social, economic, fiscal, social, and market environments applicable to all citizens and State and county governments in Hawai‘i, as elsewhere in the world. Accordingly, the analyses and conclusions presented herein should be reviewed prior to implementation. While the longer-term impacts of COVID-19 are not knowable now, the pandemic’s impacts need to be monitored with respect to:
• Changes in public and governmental priorities, as well as the financial and fiscal resources available to individuals, business, and government;
• Its devastating impact on the visitor industry, with most hotel facilities remaining closed, and support enterprises such as restaurants and entertainment severely impacted;
• Any perceptible shifts in market tastes for various development types, including higher density recreational and living environments;
• Population loss or out-migration, as people find more immediate employment opportunities in locales that are less dependent on tourism;
• The infusion of federal funds to Hawai‘i, as to other states; • Significant declines in interest rates applicable to borrowing and lending; and • The pace of completion of the City’s rail project.
State TOD Planning & Implementation Project, Island of O‘ahu

8
This page intentionally left blank.
State TOD Planning & Implementation Project, Island of O‘ahu

9
1 Study Overview
Figure 1-1: Honolulu Rail Corridor and State TOD Priority Area Boundaries
1.1 Background The twenty-mile long Honolulu Rail Transit Project, which extends from East Kapolei to Ala Moana Center, is the largest public works project in the history of the State. The corridor is home to over 60 percent of O‘ahu’s population and over 40 percent of O‘ahu’s jobs are located within this corridor (OP/HHFDC, 2018). State agencies have identified over twenty-five State properties and institutions along the Honolulu rail corridor that could leverage access to rail to increase the value and reach of their facilities and programs. These include three University of Hawai‘i (UH) System campuses, the State’s multi-purpose Aloha Stadium, State-owned commercial and agency office facilities, and affordable housing projects (OP/HHFDC, 2018).
1.1.1 TOD Context: State of Hawai‘i Strategic Plan for Transit-Oriented Development Spurred by the tremendous opportunities and challenges for redevelopment along the transit corridor, the State Legislature passed Act 130, Session Laws of Hawai‘i 2016 (Act), establishing the TOD Council to coordinate effective and efficient transit-oriented development (TOD) planning not only on O‘ahu but statewide. The TOD Council serves to facilitate implementation of State smart growth and TOD objectives of maximizing the benefits of redevelopment of State lands in areas served by public transit, supporting the revitalization of neighborhoods, increasing inventories of affordable housing, improving worker access to jobs, and reducing fossil fuel consumption in the transportation sector (OP/HHFDC, 2018).
One of the TOD Council’s primary responsibilities is to “develop and implement a State strategic plan for TOD, including mixed-use and affordable and rental housing.” As a result, the State of Hawai‘i Strategic Plan for Transit-Oriented Development (State Strategic Plan for TOD) was prepared in 2017 and subsequently updated in 2018 (OP/HHFDC, 2018). The State Strategic Plan for TOD identifies three State TOD priority areas along the rail corridor – East Kapolei, Hālawa-Stadium, and Iwilei-Kapālama. Elements common to the three TOD priority areas are described in the State Strategic Plan for TOD as:
• A critical mass of State lands and State facilities in the process of expansion or needing redevelopment; • Alignment with City plans for planned growth; • Proximity to other major landowners with properties of value; • The opportunity for sharing the cost of infrastructure and civic improvements among parties; and • The potential for State investments to catalyze other investments that could result in tangible
improvements in the life and form of the communities being served (OP/HHFDC, 2018).
State TOD Planning & Implementation Project, Island of O‘ahu
10
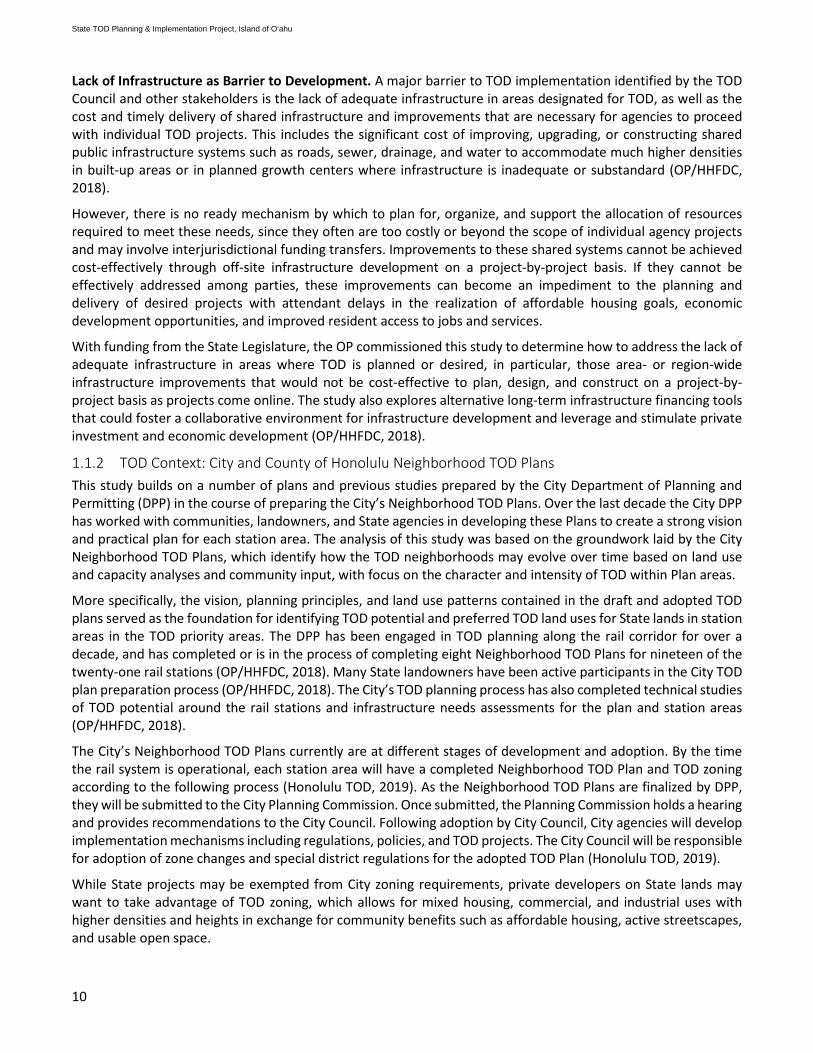
Lack of Infrastructure as Barrier to Development. A major barrier to TOD implementation identified by the TOD Council and other stakeholders is the lack of adequate infrastructure in areas designated for TOD, as well as the cost and timely delivery of shared infrastructure and improvements that are necessary for agencies to proceed with individual TOD projects. This includes the significant cost of improving, upgrading, or constructing shared public infrastructure systems such as roads, sewer, drainage, and water to accommodate much higher densities in built-up areas or in planned growth centers where infrastructure is inadequate or substandard (OP/HHFDC, 2018).
However, there is no ready mechanism by which to plan for, organize, and support the allocation of resources required to meet these needs, since they often are too costly or beyond the scope of individual agency projects and may involve interjurisdictional funding transfers. Improvements to these shared systems cannot be achieved cost-effectively through off-site infrastructure development on a project-by-project basis. If they cannot be effectively addressed among parties, these improvements can become an impediment to the planning and delivery of desired projects with attendant delays in the realization of affordable housing goals, economic development opportunities, and improved resident access to jobs and services.
With funding from the State Legislature, the OP commissioned this study to determine how to address the lack of adequate infrastructure in areas where TOD is planned or desired, in particular, those area- or region-wide infrastructure improvements that would not be cost-effective to plan, design, and construct on a project-by-project basis as projects come online. The study also explores alternative long-term infrastructure financing tools that could foster a collaborative environment for infrastructure development and leverage and stimulate private investment and economic development (OP/HHFDC, 2018).
1.1.2 TOD Context: City and County of Honolulu Neighborhood TOD Plans This study builds on a number of plans and previous studies prepared by the City Department of Planning and Permitting (DPP) in the course of preparing the City’s Neighborhood TOD Plans. Over the last decade the City DPP has worked with communities, landowners, and State agencies in developing these Plans to create a strong vision and practical plan for each station area. The analysis of this study was based on the groundwork laid by the City Neighborhood TOD Plans, which identify how the TOD neighborhoods may evolve over time based on land use and capacity analyses and community input, with focus on the character and intensity of TOD within Plan areas.
More specifically, the vision, planning principles, and land use patterns contained in the draft and adopted TOD plans served as the foundation for identifying TOD potential and preferred TOD land uses for State lands in station areas in the TOD priority areas. The DPP has been engaged in TOD planning along the rail corridor for over a decade, and has completed or is in the process of completing eight Neighborhood TOD Plans for nineteen of the twenty-one rail stations (OP/HHFDC, 2018). Many State landowners have been active participants in the City TOD plan preparation process (OP/HHFDC, 2018). The City’s TOD planning process has also completed technical studies of TOD potential around the rail stations and infrastructure needs assessments for the plan and station areas (OP/HHFDC, 2018).
The City’s Neighborhood TOD Plans currently are at different stages of development and adoption. By the time the rail system is operational, each station area will have a completed Neighborhood TOD Plan and TOD zoning according to the following process (Honolulu TOD, 2019). As the Neighborhood TOD Plans are finalized by DPP, they will be submitted to the City Planning Commission. Once submitted, the Planning Commission holds a hearing and provides recommendations to the City Council. Following adoption by City Council, City agencies will develop implementation mechanisms including regulations, policies, and TOD projects. The City Council will be responsible for adoption of zone changes and special district regulations for the adopted TOD Plan (Honolulu TOD, 2019).
While State projects may be exempted from City zoning requirements, private developers on State lands may want to take advantage of TOD zoning, which allows for mixed housing, commercial, and industrial uses with higher densities and heights in exchange for community benefits such as affordable housing, active streetscapes, and usable open space.
State TOD Planning & Implementation Project, Island of O‘ahu

11
1.2 Study Purpose The purpose of this study is to identify investment needs, funding, and potential timeframes for critical infrastructure and other improvements needed to realize State TOD goals along the rail corridor, with an emphasis on the three State TOD priority areas of East Kapolei, Hālawa-Stadium, and Iwilei-Kapālama. While each of the three TOD priority areas has different infrastructure needs and timelines, the study as a whole identifies opportunities for collaboration on infrastructure investments and provides information to develop an overall strategy for infrastructure delivery that will benefit TOD project implementation on State lands and in surrounding communities.
This study identifies the infrastructure and investments, focusing on shared region-serving investments, required to advance development of State TOD projects along the rail line. It also aims to identify and examine potential financing alternatives for these investments, with particular attention to the potential for using value capture mechanisms to tap the value created by development made possible by the provision of public infrastructure to help offset the upfront cost of that infrastructure. In Kaka‘ako, the Hawai‘i Community Development Authority (HCDA) has invested over $226 million in infrastructure improvements, which has enabled over $6 billion in construction permit value and generated over $40 million in RPT.
The findings of the study as a whole will provide an important tool for the State to identify, support, and track actions to facilitate shared infrastructure investments and individual State agency development projects, and is intended to facilitate the implementation and update of the State Strategic Plan for TOD, for those projects along the rail corridor on O‘ahu.
1.3 Scope In the course of this study, the Study Team surveyed and convened representatives of State agencies and other stakeholders in the three TOD priority areas; compiled information on their near-and long-term mission and goals for transit-oriented development in these priority areas; prepared, evaluated, and identified future development alternatives; and assessed the shared infrastructure needed to implement these scenarios. The study also highlights needed agency coordination and order of magnitude costs associated with this infrastructure implementation. The specific systems and level of need vary by region.
The findings herein identify delivery and funding gaps that could impede individual project development if conventional financing means are followed (“status quo”). The study also provides recommendations for alternative funding and delivery mechanisms and timeframes for meeting project development needs.
1.4 Study Team, Roles, and TOD Council Engagement PBR HAWAII & Associates, Inc. (PBR HAWAII) was selected by the State as the consultant for the planning effort. PBR HAWAII assembled a multi-disciplinary team of consultants to provide professional expertise and assistance in completing this study including: civil engineering (R.M. Towill Corporation), development financing and alternative delivery methods (DTA), transportation planning (Fehr & Peers), TOD master planning and urban design (Callison RTKL), electrical engineering (Ronald N.S. Ho & Associates), and green infrastructure and sustainable systems design (Arup), and meeting outreach and facilitation (Elizabeth Kent).
PBR HAWAII and their consultant team (Planning Team) worked closely with representatives from the OP project team through the entirety of the planning process to seek guidance and direction in completing the study. Together the Planning Team and the OP project team crafted a comprehensive strategy to engage the TOD Council, a Project Coordinating Committee (PCC), and three Permitted Interaction Groups (TOD Priority Area Work Groups), one for each TOD priority area, in the study. Each work group is described in more detail below.
1.4.1 Hawai‘i Interagency Council for Transit-Oriented Development (TOD Council) Through its regularly scheduled meetings and activities, the TOD Council serves as the primary forum for the coordination of statewide TOD policy, funding, and program needs. The TOD Council is comprised of 25 members,
State TOD Planning & Implementation Project, Island of O‘ahu

12
including representatives from State agencies, the four counties, State Senate, State House of Representatives, and the business, housing, and development communities. The directors of OP and HHFDC serve as the co-chairs of the TOD Council.
Progress reports on the study were presented to the TOD Council to solicit input and further guidance from Council members on information, issues, and particular tools being examined in the study.
1.4.2 Project Coordinating Committee (PCC) A PCC was formed to provide guidance and high-level coordination for the study. The PCC consisted of representatives from OP, HHFDC, DAGS, UHWO, and the City DPP.
1.4.3 TOD Priority Area Permitted Interaction Groups (TOD Priority Area Work Groups) The TOD Council formed three TOD Priority Area Work Groups to offer in-depth and targeted multi-agency and stakeholder discussions of regional and project implementation issues needed to advance project development. A work group was formed for each of the three TOD priority areas – East Kapolei, Hālawa-Stadium, and Iwilei-Kapālama. The work groups identified and considered both project-specific and regional issues, coordination of infrastructure improvements, the feasibility and progress of TOD projects, interagency needs, and refinement of development schedules and needed actions (OP/HHFDC, 2018). TOD Council members assigned to each TOD Priority Area Work Group were as follows. Other non-Council stakeholders involved in development in a TOD priority area were invited to participate in respective work groups.
East Kapolei Permitted Interaction Group (referred to as the East Kapolei Work Group)
1) Office of Planning 2) Hawai‘i Housing Finance & Development Corporation 3) University of Hawai‘i 4) Department of Hawaiian Home Lands Director 5) Department of Land and Natural Resources 6) Department of Education 7) Department of Transportation 8) Hawai‘i Community Development Authority 9) City and County of Honolulu 10) Office of the Governor
Hālawa-Stadium Permitted Interaction Group (referred to as the Hālawa-Stadium Work Group)
1) Office of Planning 2) Hawai‘i Housing Finance and Development Corporation 3) Stadium Authority 4) Department of Accounting and General Services 5) Hawai‘i Public Housing Authority 6) Department of Education 7) Department of Public Safety 8) Department of Transportation 9) Hawai‘i Community Development Authority 10) City and County of Honolulu 11) Housing Advocate 12) Developer Representative
Iwilei-Kapālama Permitted Interaction Group (referred to as the Iwilei-Kapālama Work Group)
1) Office of Planning 2) Hawai‘i Housing Finance and Development Corporation 3) Department of Accounting and General Services 4) Hawai‘i Public Housing Authority 5) Department of Hawaiian Home Lands
State TOD Planning & Implementation Project, Island of O‘ahu

13
6) University of Hawai‘i 7) Department of Education 8) Department of Transportation 9) Hawai‘i Community Development Authority 10) City and County of Honolulu 11) Developer Representative 12) Housing Advocate
1.5 Study Process and Schedule The study was initiated in June 2018 and final data compilation and analysis was substantially completed by December 2019. The study was split into two phases and required extensive consultation and collaboration with State and City departments and agencies, the TOD Council, the PCC, TOD priority area work groups and their working members, as well as with other landowners and TOD stakeholders in each TOD priority area.
Phase 1 of the study incorporated design charrettes to work through landowner development plans by priority area. During the charrettes, participants worked together to consider alternate development scenarios and discussed department and agency missions that would need to be supported by the scenarios. These discussions, along with subsequent consultation and confirmation, led to definition of a preferred land use scenario for each TOD priority area that served as the basis for the rest of the study.
The meetings for Phase 2 of the study focused on identifying and discussing infrastructure needs, timing, and costs as they relate to the preferred land use scenario for each TOD priority area from Phase 1. The infrastructure needs assessment was followed by a financial analysis of infrastructure funding and financing resources and needs, which incorporated presentations and discussions on alternative financing mechanisms.
The overall project process and schedule is illustrated in Figure 1-2. Icons in Figure 1-2 highlight the meetings held and topics covered throughout the study. A complete list of meetings can be found in Appendix A. Meeting notes and materials for the PCC, TOD priority area work groups, and TOD Council meetings can be found in Appendix J.
Through the compilation of anticipated land use development plans, land capacity models, and a rich collaborative approach, the study identified regional-serving infrastructure, other localized improvements, and alternative financing mechanisms for shared infrastructure necessary to support development of State TOD projects within the three TOD priority areas on O‘ahu.
1.6 Study Approach and Components An initial step for the study was to define the study area boundaries for the TOD priority areas. The boundaries for each of the priority areas were defined based on the respective City TOD Plans’ maps, the location of State TOD projects and other State parcels in proximity to planned rail stations, and input from the PCC. Further, the identified study boundaries needed to consider the larger, regional infrastructure systems to which localized infrastructure improvements are connected and function interdependently. This broader regional approach was also intended to avoid incremental infrastructure planning, design, and construction, and to support efficient funding and delivery of infrastructure through coordinated multi-agency and State/County planning efforts for each TOD priority area.
1.6.1 Preferred Land Use Scenario and TOD Potential In order to determine the infrastructure system improvements needed for both individual projects and regional or area-wide investments and to enable identification of new TOD opportunities over time, a preferred land use scenario for each TOD priority area was modeled. The preferred land use scenario model for each TOD priority area identifies residential development by dwelling unit, and commercial/institutional/mixed-use, or industrial space by square footage (SF). Further, the modeling identified three, ten-year development phases (2020-2029, 2030-2039, and 2040-2049) to understand how infrastructure may need to be developed over time, and to
State TOD Planning & Implementation Project, Island of O‘ahu

14
organize investments needed in the short-term and over time as development progresses and resources become available.
The land use scenario for each TOD priority area incorporates the City’s neighborhood TOD plans and State and major landowner’s proposed plans for development, as identified through consultation. When specific development plans were not available or only available in a conceptual stage, typical density development standards were applied to estimate residential units and commercial mixed-use SF.
Throughout the study, the land use scenario modeling served as a communication tool to identify development assumptions, to spark conversation during consultation and collaboration, and to represent the location, pace, and magnitude of specific projects that the civil engineers then used to calculate infrastructure requirements.
1.6.2 Infrastructure Requirements and Costs For the purposes of this study, infrastructure is broadly defined to include wastewater, water, storm water and drainage systems, roadways and highways including multimodal and transit facilities, energy and telecommunications including broadband, and public schools. The utility providers responsible for these various infrastructure systems are the City Department of Environmental Services (ENV) for wastewater, the City Board of Water Supply (BWS) for water service, the City Department of Facilities Maintenance (DFM) for drainage, the City Department of Transportation Services (DTS) and the State Department of Transportation, Highways Division (DOT Highways) for transportation, Hawaiian Electric Company, Inc. (HECO) for electricity, and the DOE for public schools.
Based on the land use scenario for each TOD priority area, infrastructure requirements were calculated by analyzing changes in peak demand, or infrastructure loads, resulting from the anticipated development identified in the land use model. The engineering analysis identified critical infrastructure necessary to enable timely buildout of the planned projects in the TOD priority areas (OP/HHFDC, 2018). The estimated demand is based on current standards and do not account for improvements in resource efficiency of buildings or infrastructure. Depending on the final development plan of each landowner, the utility requirement may differ.
The following parameters and standards were used in determining infrastructure system needs and costs for the three TOD priority areas. Additional attention is paid to regulatory requirements associated with State Public Utilities Commission (PUC) approvals of electrical system improvements.
Sewer. The design criteria for the sewer demand calculations are based on the criteria stated in the ENV Wastewater System Design Standards, July 2017.
Water Demand. The design criteria for the water demand calculations are based on the criteria stated in the BWS standards, dated 2002.
Drainage. For the on-site drainage, the design recurrence interval is 10-year for drainage area of 100 acres or less using the rational method per the City’s Storm Drainage Standards, dated August 2017.
Electrical and Telecommunications. In the future, all TOD priority areas, will be part of the City’s adopted TOD Special District. The City’s TOD Special District boundaries are forthcoming and will likely vary from the TOD priority area study boundaries identified in this study.
Under an existing ordinance related to special districts generally, projects located on properties within the special district would be required to install new electric and telecommunication facilities underground (Revised Ordinances of Honolulu, Chapter 22). Existing overhead facilities installed prior to the addition of a station area to the TOD Special District may remain overhead and, if necessary, may be repaired and supplemented if such actions do not alter the character of such lines. HECO may replace their lines but the voltage of these HECO distribution lines must remain the same.
State TOD Planning & Implementation Project, Island of O‘ahu
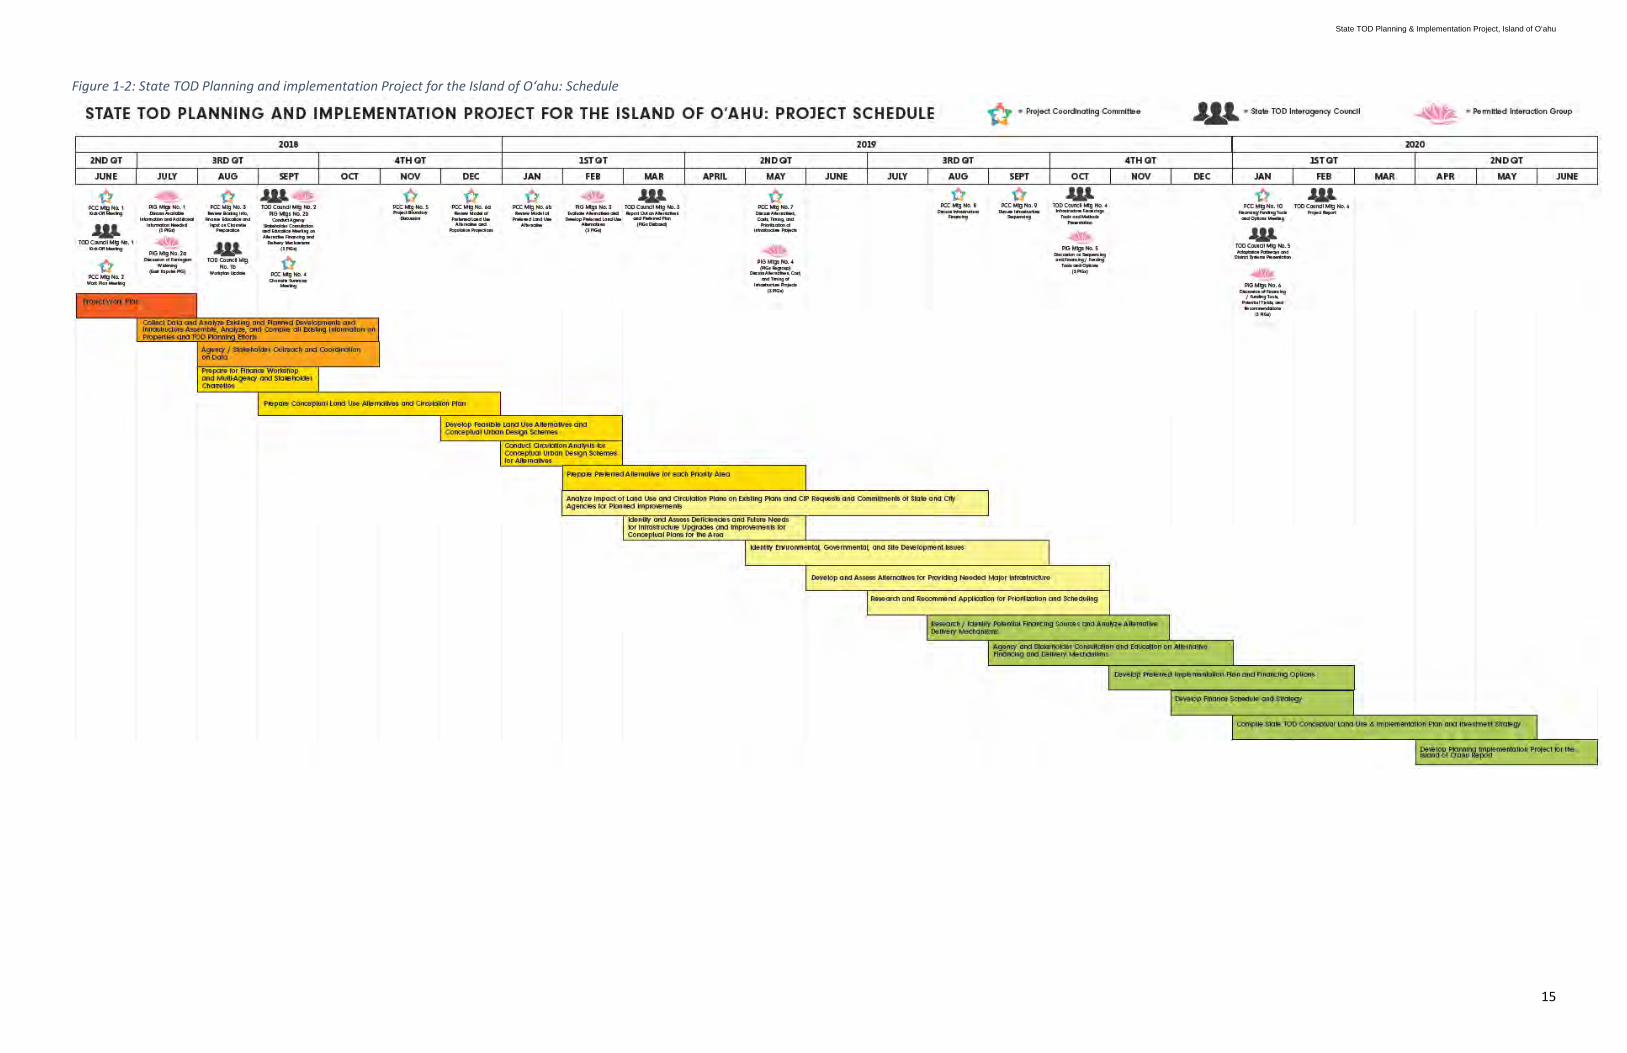
15
Figure 1-2: State TOD Planning and implementation Project for the Island of O‘ahu: Schedule
State TOD Planning & Implementation Project, Island of O‘ahu

16
This page intentionally left blank.
State TOD Planning & Implementation Project, Island of O‘ahu
17
HECO will also evaluate the impact of new commercial and residential development, as they are designed and constructed, on the electrical loads and HECO’s available distribution system capacity. When HECO identifies the need for a new substation or a substantial substation upgrade, a three- to five-year planning and approval process begins. This process includes securing PUC approval for the development of a new substation; budgeting the construction costs; designing the substation and 46-kV line extensions; and permitting of the substation construction. If additional 46-kV sub-transmission capacity is required to support the new substation deployments, HECO would also need to identify where the 46-kV capacity would originate and the alignments for the new 46-kV infrastructure.
In general, new substation development, substation upgrades, and the 46-kV infrastructure expansion are considered HECO “system” improvements, meaning that HECO funds construction of these items. Further, in addition to PUC approval for new substations and associated transmission lines, a trigger expenditure amount of $2,500,000 requires PUC oversight and approval of HECO rate-base funding.
Once the required infrastructure and capacity improvements were identified, rough order of magnitude (ROM) costs were developed and previously identified CIP requests were compiled to assess the additional public investments needed to facilitate and support TOD on State-owned parcels in proximity to rail stations on O‘ahu.
The needed infrastructure improvements were grouped into one of the following three categories to be able to focus on those regional-serving improvements and costs that could be cost-shared or incorporated into an overall TOD infrastructure investment strategy.
• Regional improvements: Improvements that will provide benefits and enhancement to the region, not just for specific TOD projects.
• Regional/project improvements: These are improvements consisting of on-site and/or off-site improvements required to support individual TOD project needs and that also benefit the region.
• Project improvements: These are typical on-site improvements consisting of backbone road, drainage, sewer, water, landscape, electrical, storm water quality, and other ancillary development that benefit the individual project.
ROM costs associated with projects identified as regional improvements or regional/project improvements, as well as future DOE schools and regional electrical system improvements, were included in the analysis of the total infrastructure costs and financing alternatives for each TOD priority area and the three areas as a whole. The costs of the identified regional-serving infrastructure, in 2019 dollars, are summarized in each TOD priority area section of this report. These cost estimates include infrastructure improvements needed to service individual TOD projects, but do not include onsite improvements such as building, demolition, and soft costs for individual TOD projects.
1.6.3 Infrastructure Funding Needs and Timeframes Individual development projects within the TOD priority areas generally cannot fund the regional infrastructure required to support them because of the magnitude of costs for infrastructure, timing of facility development, and range of amenities desired to achieve State goals, such as affordable housing and enhanced community facilities. The infrastructure analysis and associated funding needs and timeframes focused on the execution of TOD at a regional- or area-wide scale to better capture the benefits of TOD, and ensure that public resources are not overextended to the point that they do not have the desired impact (OP/HHFDC, 2018).
Sections 2 through 4 of this report provide more information on the regional infrastructure needs and cost assessments for each TOD priority area, the anticipated timing to support long- and short-term development, and whether infrastructure projects are identified as funded or unfunded.
‘Funded’, as used herein, refers to projects for which funding sources have already been committed, allocated, or otherwise identified by the responsible agency. These are conventionally 2- and 6-year CIP funds, utility revenue bonds, highway or school impact fees, and other legislative funds as provided to the DOE. ‘Unfunded’ refers to
State TOD Planning & Implementation Project, Island of O‘ahu

18
that portion of estimated required infrastructure costs that has not been provided for via traditional funding sources.
1.6.4 Infrastructure Financing Options and Financial Analysis Finally, the study examined and developed financial tools and cost-sharing models for region-serving infrastructure improvements that would be necessary to enable identified TOD projects to move forward and support effective TOD implementation in the TOD priority areas (OP/HHFDC, 2018). The study considered overall State funding and objectives since the funding needs and the ability for each TOD priority area to generate revenue varies between areas and over time as the scale and mix of development in each area changes.
The financing information compiled and analyzed in this study lays the foundation for the development of an implementation and investment strategy for the TOD priority areas. The information compiled includes development timetables, costs, and financing strategies for unfunded infrastructure improvements, with a focus on potential cash flow for needed infrastructure expenditures and alternative revenue sources within the first phase of development between 2020-2029. This financial analysis is discussed in Section 4.
1.7 Assumptions and Caveats The study and analyses were framed by several key assumptions.
• The assessment assumes that TOD will modify the concentration and location of O‘ahu’s population but will not affect the overall population levels anticipated in the City’s General Plan.
• The study does not consider or reflect new technologies or improvements to efficiencies in infrastructure design or construction.
• The cost estimates and financial analyses do not account for potential strategies to address climate change and SLR, even though many such strategies may be required in the future.
• The development plans identified by agencies and individual landowners, which underlie the preferred land use scenarios, have not necessarily been evaluated in terms of market or financial feasibility.
Readers are advised that scenario planning inevitably entails uncertainty, and future changes to development plans, taxation policies, or other inputs may modify the specific findings in this study.
Further, this report was drafted between December 2019 and July 2020, with reference to consultations, data collection, and analyses between the third quarter of 2018 and the first weeks of 2020. From approximately February 2020, the COVID-19 pandemic caused major economic, social, and business disruptions in Hawai‘i, as it did worldwide. At the time of this writing, little data exists on the pandemic’s impacts on development markets and financing, and the timing of recovery is uncertain.
The development visions presented herein reflect the long-term goals and aspirations of public agencies and private parties anticipated for each TOD priority area. Many of the projects described would not be expected to materialize for years or even decades of this study. The assessments presented in this report are tied to future implementation of the desired projects, and while some could be delayed, for purposes of this study, it is assumed that in this longer-term framework, conditions affecting such development in Hawai‘i could have recovered to be within the range of outcomes described herein. Nevertheless, prior to implementation of any particular project or financial mechanism, as for any development, the conclusions presented herein should be reviewed in the context of current market, economic, fiscal, political, and social environments.
State TOD Planning & Implementation Project, Island of O‘ahu
19
2 East Kapolei TOD Priority Area
The study boundary for the East Kapolei TOD priority area shown in Figure 2-1 was selected to include planned State projects that will impact service capacity of shared regional infrastructure systems serving the area. The boundary was drawn to include privately-held properties with TOD potential that were identified in the City’s draft East Kapolei Neighborhood TOD Plan (2010). The TOD priority area includes the large State landholdings of the UHWO, DLNR, and DHHL. These three entities control over 1,000 acres of land suitable for dense TOD development around the Kualaka‘i (East Kapolei) and Keone‘ae (UHWO) rail stations (OP/HHFDC, 2018). The TOD priority area also includes D.R. Horton’s Ho‘opili development, which will also be served by the Honouliuli (Ho‘opili) rail station.
2.1 TOD Context: City and County of Honolulu East Kapolei Neighborhood TOD Plan This study builds upon the groundwork of the City’s East Kapolei Neighborhood TOD Plan, which identifies the character and intensity of TOD within the Plan area and is based on land use and capacity analyses and community input as to how these communities may evolve over time. Preparation of the East Kapolei Neighborhood TOD Plan was started in 2009, and the East Kapolei Neighborhood TOD Plan Public Review Draft Number 1 was released in April 2010. The City’s draft East Kapolei Neighborhood TOD Plan is founded on principles that seek to create a dynamic mixed-use urban environment, provide a variety of housing choices, foster gathering places, and increase connections and access throughout the East Kapolei Neighborhood TOD Plan area.
The development analysis for this study was completed in November 2019 using the East Kapolei Neighborhood TOD Public Review Draft Number 1 (2010) as the basis for potential TOD buildout. At the time of this study, the East Kapolei Neighborhood TOD Plan was being updated. The Public Review Draft Number 2 released in January 2020 incorporates more intensive land use patterns and more defined road networks, development blocks, and key streets. While this report acknowledges the East Kapolei Neighborhood TOD Plan Draft Number 2 updates, the underlying study’s land use model, infrastructure assessment, and financial analysis are based on the 2010 draft and do not account for the land use and roadway refinements in the 2020 Public Review Draft.
Draft Number 2 maintains the same vision as the 2010 plan with additional recommendations to change existing development standards to support higher density development, as identified in Figure 2-2. The land use designations identified in the East Kapolei Neighborhood TOD Plan are predominantly BMX-3 Community Business Mixed-use District, A-2 Medium Density Apartment District, P-2 General Preservation District, and R-3.5 and R-5 Residential Districts. Consistent with TOD practices, the amendments included in the Public Review Draft Number 2 identify higher density and mixed-uses closer to the stations, while farther away medium- and lower-density development is expected. Generally, the height of buildings will be highest closer to the rail transit stations, with lower heights and density the further one moves away from the rail transit station.
2.2 Preferred Land Use Scenario and TOD Potential The preferred land use scenario for the East Kapolei TOD priority area analyzed for this study represents anticipated development based on existing and proposed plans for State-owned parcels, a design charrette, and the Ho‘opili master plan. It represents the most plausible land use pattern and density for State TOD and other landowner projects in the TOD priority area and provides a reasonable baseline for identifying infrastructure needs and costs for State TOD buildout over time.
Information on potential TOD buildout for the TOD priority area was obtained through consultation with State landowners and D.R. Horton, which is developing the Ho‘opili project. The East Kapolei Permitted Interaction Group (East Kapolei Work Group) also supported further refinement of the preferred land use scenario by the consultant team, as needed, to incorporate additional project-specific information obtained from individual agencies.
State TOD Planning & Implementation Project, Island of O‘ahu
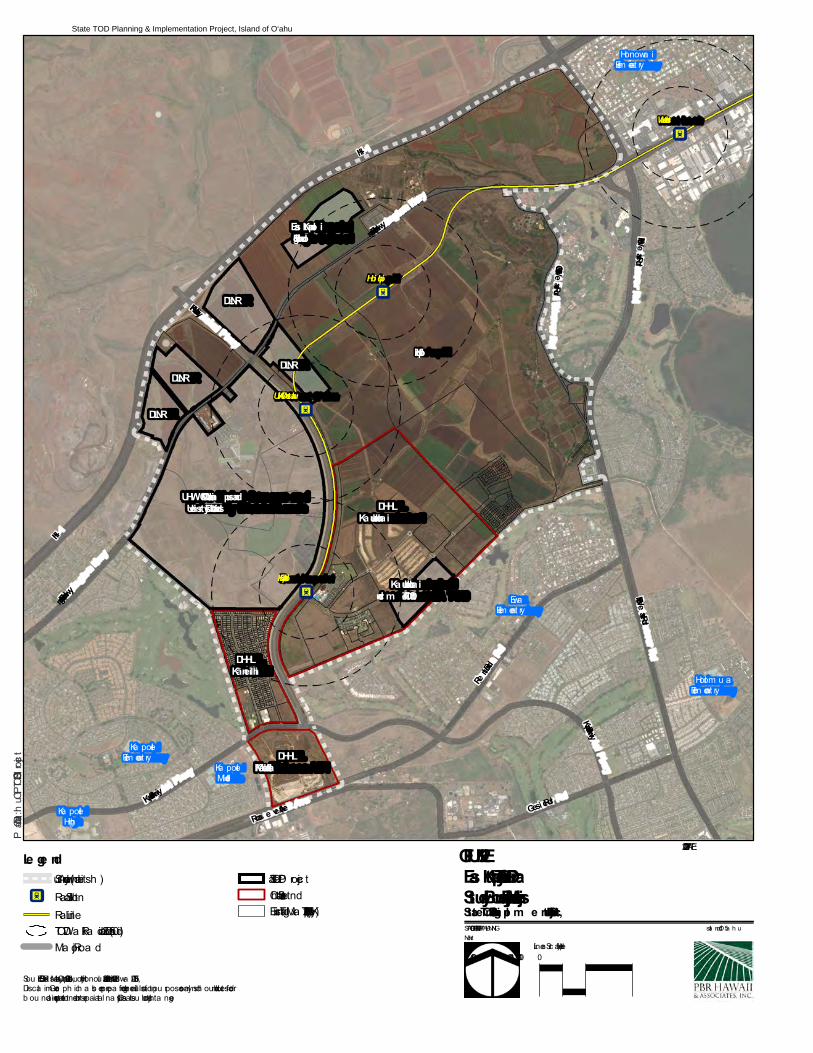
H-1Farrington Hwy
Fort Weaver Rd
Kualakai Pkwy
Honowa iElem enta ry
EwaElem enta ry
Holom u aElem enta ry
Ka poleiElem enta ry
Ka poleiHigh
Ka poleiMiddle
Eas t Kapole i High School
DLNR
DLNR
UHWO Makai Cam pus and Unive rs ity Dis trict Lands
DLNR
H-1
Ho'opili
Roos eve lt Av
eKapole i Pkwy
Renton Rd
Old Fort Weaver Rd
Ge is er Rd
Farrington Hwy
DLNR
Kapole i Pkwy
Fort We ave r Rd
West LochWest Loch
Ho‘opiliHo‘opili
UH West O‘ahuUH West O‘ahu
East KapoleiEast Kapolei
Sou rce: ESRI Ba se Ma ps, 2016. City a nd Cou nty of Honolu lu , 2013 a nd 2018. Sta te of Ha wa i‘i, 2018.Discla im er: Gra ph ic h a s been prepa red for genera l illu stra tion pu rposes only a nd sh ou ld not be u sed forb ou nda ry interpreta tions or oth er spa tia l a na lysis. Da ta is su b ject to c h a nge.
Path: Q:\Oahu\OP TOD\GIS\Project
Le ge ndStu dy Area (wh ite da sh )
X Ra il Sta tionRa il LineTOD Wa lk Ra diu s (0.25 a nd 0.5 m i)Ma jor Roa d
Sta te TOD P rojectOth er Sta te La ndExisting Ta x Ma p Key (TMK) (2018)
DATE: 7/22/2020 FIGURE 2-1:Eas t Kapole i TOD Priority Are a:Study Boundary and Major Proje ctsSTATE OF HAWAI'I, OFFICE OF P LANNING Isla nd of O‘a h uNorth
Linea r Sc a le (feet)0 600 1,200 2,400
State TOD Planning & Im ple m e ntation Proje ct, O'ahu
DHHL Ka Makana Ali‘i
DHHL Kāne hili
Ka‘uluokaha‘i Incre m e nt IIA TOD
DHHL Ka‘uluokaha‘i
State TOD Planning & Implementation Project, Island of O‘ahu

21
Figure 2-2: City East Kapolei Neighborhood TOD Plan Land Use Diagram, Draft Number 2 January 2020
State TOD Planning & Implementation Project, Island of O‘ahu

H-1Farrington Hwy
Fort Weaver Rd
Kualakai Pkw y
HonowaiEle m e ntary
EwaEle m e ntary
Holom uaEle m e ntary
Kapole iEle m e ntary
Kapole iHigh
Kapole iMid d le
East Kapole i High School
DLNR
DLNR
UHWO Campus and Unive rs ity District Lands
DLNR
H-1
Ho'opili
Roos eve lt Av
eKapole i Pkwy
Renton Rd
Old Fort Weaver Rd
Ge is er Rd
Farrington Hw y
DLNR
Ele m e ntarySc hool
Ele m e ntarySc hool
Ele m e ntarySc hool
Ele m e ntarySc hool
Mid d leSc hool
Mid d leSc hool
Kapole i Pkw y
Fort We ave r Rd
Ho‘ae‘aeHo‘ae‘ae
HonouliuliHonouliuli
Keone‘aeKeone‘ae
Kualaka‘iKualaka‘i
FIGURE 2-3:East Kapole i TOD Priority Are a:Pre fe rr e d Land Us e Sce narioSTATE O F HAW AI'I, O FFICE O F PLANNING Island of O ‘ahuNorth
Line ar Sc ale (fe e t)0 1,200 2,400 4,800
DATE: 7/22/2020
Sourc e : ESRI Base Maps, 2016. City and County of Honolulu, 2013 and 2018. State of Hawai‘i, 2018.East Kapole i Ne ighborhood TO D Plan Public R e vie w Draft #1. Disclaim e r: Graphic has be e n pre pare d for ge ne ral illustration purpose s only and should not be use d for boundary inte rpre tationsor othe r spatial analysis. Data is subje c t to c hange .
State TOD Planning & Imple me ntation Proje ct, O'ahu
Path: Q:\Oahu\OP TOD\GIS\Project\East Kapolei\Final Report\2-3 EK_Preferred Land Use Scenario.mxd
Le ge ndStud y Are a (white d ash)
X Rail StationRail LineMajor RoadState TO D Proje c tO the r State Land
Anticipate d Land Us e sApartm e ntApt. Mixe d -UseCom m e rc ialIndustrial Mixe d -Use
Mixe d -Use HighCom m unity Fac ilitie sSingle -Fam ilyUtilitie sInstitutional and UDLParks and O pe n Spac e sSc hools
DHHL Ka Makana Ali‘i
DHHL Kāne hili
Ka‘uluokaha‘i Incre me nt IIA TOD
DHHL Ka‘uluokaha‘i
State TOD Planning & Implementation Project, Island of O‘ahu
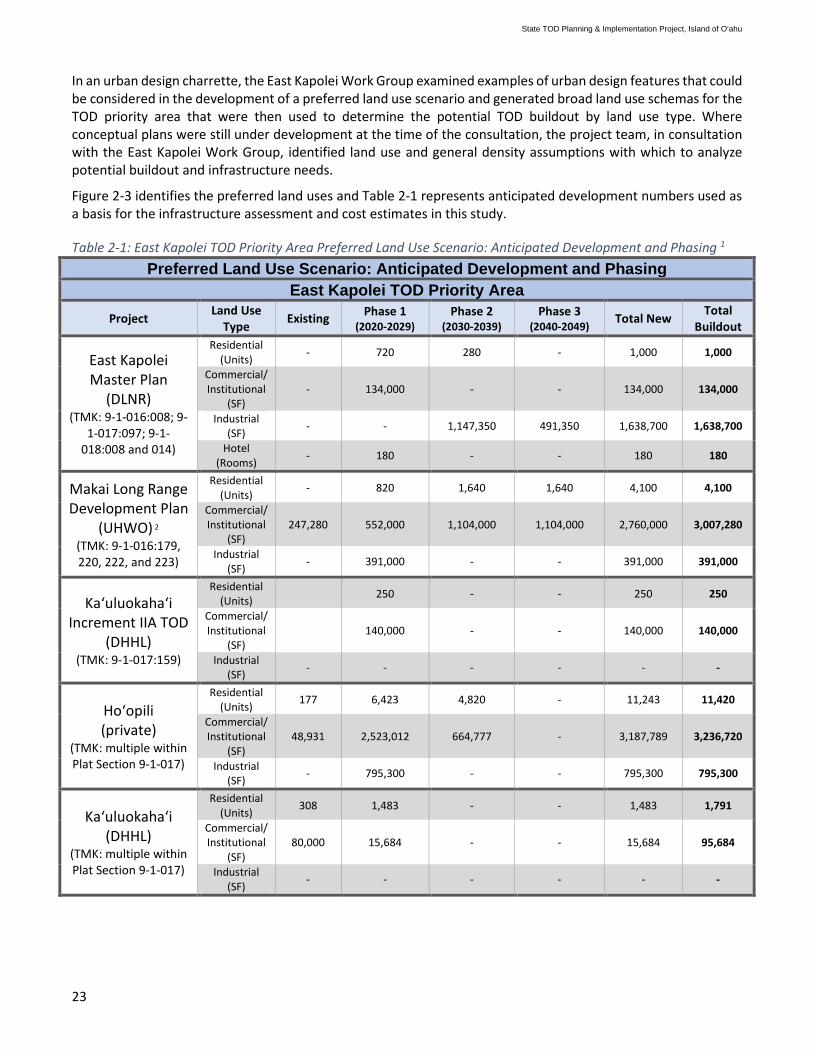
23
In an urban design charrette, the East Kapolei Work Group examined examples of urban design features that could be considered in the development of a preferred land use scenario and generated broad land use schemas for the TOD priority area that were then used to determine the potential TOD buildout by land use type. Where conceptual plans were still under development at the time of the consultation, the project team, in consultation with the East Kapolei Work Group, identified land use and general density assumptions with which to analyze potential buildout and infrastructure needs.
Figure 2-3 identifies the preferred land uses and Table 2-1 represents anticipated development numbers used as a basis for the infrastructure assessment and cost estimates in this study.
Table 2-1: East Kapolei TOD Priority Area Preferred Land Use Scenario: Anticipated Development and Phasing 1 Preferred Land Use Scenario: Anticipated Development and Phasing
East Kapolei TOD Priority Area Project Land Use
Type Existing Phase 1 (2020-2029)
Phase 2 (2030-2039)
Phase 3 (2040-2049) Total New Total
Buildout
East Kapolei Master Plan
(DLNR) (TMK: 9-1-016:008; 9-
1-017:097; 9-1-018:008 and 014)
Residential (Units) - 720 280 - 1,000 1,000
Commercial/Institutional
(SF) - 134,000 - - 134,000 134,000
Industrial (SF) - - 1,147,350 491,350 1,638,700 1,638,700
Hotel (Rooms) - 180 - - 180 180
Makai Long Range Development Plan
(UHWO) 2 (TMK: 9-1-016:179, 220, 222, and 223)
Residential (Units) - 820 1,640 1,640 4,100 4,100
Commercial/Institutional
(SF) 247,280 552,000 1,104,000 1,104,000 2,760,000 3,007,280
Industrial (SF) - 391,000 - - 391,000 391,000
Ka‘uluokaha‘i Increment IIA TOD
(DHHL) (TMK: 9-1-017:159)
Residential (Units) 250 - - 250 250
Commercial/Institutional
(SF) 140,000 - - 140,000 140,000
Industrial (SF) - - - - - -
Ho‘opili (private)
(TMK: multiple within Plat Section 9-1-017)
Residential (Units) 177 6,423 4,820 - 11,243 11,420
Commercial/Institutional
(SF) 48,931 2,523,012 664,777 - 3,187,789 3,236,720
Industrial (SF) - 795,300 - - 795,300 795,300
Ka‘uluokaha‘i (DHHL)
(TMK: multiple within Plat Section 9-1-017)
Residential (Units) 308 1,483 - - 1,483 1,791
Commercial/Institutional
(SF) 80,000 15,684 - - 15,684 95,684
Industrial (SF) - - - - - -
State TOD Planning & Implementation Project, Island of O‘ahu

24
Preferred Land Use Scenario: Anticipated Development and Phasing East Kapolei TOD Priority Area
Project Land Use Type Existing Phase 1
(2020-2029) Phase 2
(2030-2039) Phase 3
(2040-2049) Total New Total Buildout
Ka Makana Ali‘i (DHHL)
(TMK: 9-1-016:142)
Residential (Units) - - - - - -
Commercial/Institutional
(SF) 1,400,000 - - - - 1,400,000
Industrial (SF) - - - - - -
Kānehili (DHHL) (TMK: multiple within Plat Sections 9-1-151,
152, and 153)
Residential (Units) 359 44 - - 44 403
Commercial/Institutional
(SF) 123,833 100,000 - - 100,000 223,833
Industrial (SF) - - - - - -
Hawai‘i Tokai International
College (private) (TMK: 9-1-016:221)
Residential (Units) - - - - - -
Commercial/Institutional
(SF) 91,808 - - - - 91,808
Industrial (SF) - - - - - -
TOTALS
Residential (Units) 844 9,740 6,740 1,640 18,120 18,964
Commercial/Institutional
(SF) 1,991,852 3,464,696 1,768,777 1,104,000 6,337,473 8,329,325
Industrial (SF) - 1,186,300 1,147,350 491,350 2,825,000 2,825,000
Hotel (Rooms) - 180 - - 180 180
1 Development estimates based on 2019 consultation; subject to change. 2 The anticipated residential development in this assessment was based on the previously approved 2018 Proposed UHWO Campus Land Plan, as presented to the Board of Regents, and is subject to change.
2.2.1 Major Landowners and TOD Projects in the East Kapolei TOD Priority Area The State TOD Projects and large private development projects identified in the preferred land use scenario analyzed for this study are described below and proposed buildout by land use type for major projects in the study area is provided in Table 2-1. As seen in Table 2-1, within a period of approximately thirty years, the TOD priority area is expected to include 18,000 new housing units, 6.3 million square feet of new commercial/institutional/mixed-use space, 2.8 million square feet of new industrial space, hotel facilities, a film studio, and the expansion of education facilities for DOE and UHWO. Upon completion, this development would represent 95% of total residential units and 76% of total commercial/institutional/mixed-use space in the East Kapolei TOD priority area.
Department of Land and Natural Resources (DLNR) Master Plan (MP)
The DLNR has four large parcels along Farrington Highway totaling approximately 175 acres, for which DLNR is preparing a conceptual master plan that can incorporate TOD elements. DLNR development is separated into three areas: the 36-acre Transit Station TOD Mixed-Use parcel, the 59-acre Kualaka‘i East parcel, and two Kualaka‘i
State TOD Planning & Implementation Project, Island of O‘ahu
25
West parcels totaling 73 acres. The parcels are currently vacant and the conceptual master plan, which proposes to redevelop the parcels with industrial, residential, and mixed-use facilities, is still being finalized.
Currently DLNR is negotiating with D.R. Horton for a land exchange (approximately 11 acres) between the Kualaka‘i West and the Transit Station TOD Mixed-Use properties to create a larger park and ride and improved development opportunities next to the Keone‘ae (UHWO) Station.
University of Hawai‘i West O‘ahu (UHWO) Makai Long Range Development Plan (LRDP)
The UHWO makai lands (approximately 500 acres) are located south of Farrington Highway and west of Kualaka‘i Parkway. The current UHWO campus is approximately 40 acres and the rest of the land is vacant. UHWO’s existing campus is expected to grow with the addition of multiple new educational facilities, and potentially, campus housing for students and staff. The anticipated development included in this assessment was based on the previously approved 2018 Proposed UHWO Campus Land Plan, as presented to the Board of Regents, and is subject to change.
Based on the 2018 Proposed Campus Land Plan, part of the UHWO makai lands, identified as the University District Lands, are proposed for mixed-use development under a public-private partnership (P3). The residential development associated with this partnership was based on the 2018 Proposed Campus Land Plan and is subject to change. The Department of Business, Economic Development, and Tourism (DBEDT) is also looking at a portion of the site for a proposed State film studio. The campus expansion and University District Lands are still in the planning phase although previous infrastructure allocations have been provided.
Department of Hawaiian Home Lands (DHHL)
DHHL is maintaining their master plan effort to build single-family and low-density residential units in their two major residential communities in East Kapolei – Kānehili and Ka‘uluokaha‘i. Kānehili is a single-family residential project, located ‘ewa of Kualaka‘i Parkway, that is underway and has only a few parcels left to be developed. Ka‘uluokaha‘i is located across from the Kānehili project and consists mainly of single-family residential units and low-density apartments. DHHL’s primary TOD project is Ka‘uluokaha‘i increment II-A, a 32.6-acre site identified for a mixed-use, affordable rental housing project proposed for native Hawaiian beneficiaries in the proximity of the Kualaka‘i (East Kapolei) Station. The DHHL landholdings also include Ka Makana Ali‘i, a large-scale commercial development within the TOD priority area study boundary.
D.R. Horton’s Ho‘opili
D.R. Horton’s Ho‘opili development is a master planned, mixed-use community on over 1,500 acres, with nearly 12,000 homes, 3.2 million square feet of commercial space, and 795,000 square feet of industrial space planned. The facilities will include a variety of housing options, community facilities, commercial, and mixed-use space. Construction is underway mauka of Keahumoa Parkway where diverse housing types are being developed.
Department of Education (DOE)
Due to the anticipated amount of development and the forecasted population increase, the DOE is anticipating at least seven new schools will be needed in East Kapolei. Land is set aside for one elementary school and one middle school in Ka‘uluokaha‘i and three elementary schools, one middle school, and one high school, East Kapolei High School, in Ho‘opili. UHWO5 will still have to provide new schools to meet the demand for school capacity based on their final development plans and agreements with DOE.
5 The anticipated residential development included in this assessment was based on the previously approved 2018 Proposed UHWO Campus Land Plan, as presented to the Board of Regents, and is subject to change.
State TOD Planning & Implementation Project, Island of O‘ahu
26
2.3 East Kapolei TOD Priority Area Infrastructure Assessment While this study focuses on regional-serving infrastructure systems such as water, sewer, drainage, electrical, mobility and roadways to support the preferred land use scenario, individual projects will have infrastructure costs related to on-site improvements and connection to off-site systems including upgrade or replacement of aged and undersized facilities. Public schools are included in this study because TOD buildout in this TOD priority area will increase area student population and will require significant State investment to accommodate such growth.
All the infrastructure in East Kapolei was previously master planned and capacities have been reserved according to these plans. The prior infrastructure master planning efforts involved State agencies, City departments, and large landowners in the TOD priority area. If proposed development density exceeds the existing allocations, landowners will need to consult the with City and utility providers and make agreements with surrounding property owners to reallocate capacities or the existing master plans for the infrastructure systems in the region will need to be revised.
The major regional infrastructure needs for the East Kapolei TOD priority area are summarized below, with associated costs detailed in Table 2-2. More information on the infrastructure needs and estimated costs can be found in the subconsultant studies in Appendix D through Appendix F.
2.3.1 Sewer System Existing Conditions. The initial wastewater system for East Kapolei was based on the master plan completed by the Estate of James Campbell for the City of Kapolei, Makakilo, Ko Olina, and the State. The master plan was extended into East Kapolei by the State in the 1980s and included DHHL, UHWO, and D.R. Horton for Ho‘opili. The master plan included wastewater demand for UHWO’s mauka and makai campus properties. The regional wastewater master plans were recently updated by DHHL and D.R. Horton.
Based on these master plans, the entire area from Ko Olina to the Honouliuli Wastewater Treatment Plant (WWTP) is served by trunk sewers along the former O‘ahu Railroad & Land Company (OR&L) railroad right-of-way (ROW). The system was sized based on anticipated demand per parcel. Any increase in density, such is proposed in the East Kapolei Public Review Draft 2, that requires additional sewer capacity will require negotiations with adjacent landowners or potentially an upgrade to the existing trunk sewers. Additionally, the City sewer system cannot be oversized in anticipation of future development. Inadequate flow frequently results in early corrosion of pipes and equipment. Sewer capacity must be provided incrementally over time, ideally just ahead of demand (OP/HHFDC, 2018).
East Kapolei is currently served by an existing trunk sewer along Kualaka‘i Parkway, referred to as “Kualaka‘i Trunk Sewer” hereafter), with sizes ranging from 30-inch to 42-inch, which was constructed by DHHL (Figure 2-4). The existing Kualaka‘i Trunk Sewer does not extend to Farrington Highway, ending near the intersection of Kualaka‘i Parkway and Keahumoa Parkway. Based on the Wastewater Master Plan for East Kapolei prepared by Community Planning and Engineering, Inc. (2006), the Kualaka‘i Trunk Sewer will be extended mauka, referred to as “Kualaka‘i Trunk Sewer Extension” hereafter, to accommodate future development. An existing sewer system serving the UHWO Makai property, with pipe sizes ranging from 12-inch to 24-inch, connects to the existing Kualaka‘i Trunk Sewer, near the intersection of Kualaka‘i Parkway and Keahumoa Parkway.
For the DLNR Transit Station TOD Mixed-Use parcel, the sewer demand was included in the design of the Ho‘opili backbone sewer system according to the Ho‘opili Sewage Master Plan (R.M. Towill Corporation, 2017). This was due to uncertainties of the Kualaka‘i Trunk Sewer Extension at that time and was negotiated between DLNR and D.R. Horton to convey sewer flow from this parcel through the Ho‘opili backbone sewer system. The Ho‘opili backbone sewer system connects to an existing 36-inch trunk sewer along Keahumoa Parkway and Mango Tree Road, referred to as “Keahumoa Trunk Sewer” hereafter. The Keahumoa Trunk Sewer ultimately connects to the existing Kualaka‘i Trunk Sewer at a location approximately 1,400 feet mauka of intersection of Kapolei Parkway and Kualaka‘i Parkway. The Keahumoa Trunk Sewer serves development at the DLNR Transit Station TOD Mixed-Use site, D.R. Horton’s Ho‘opili, and DHHL’s Ka‘uluokaha‘i.
State TOD Planning & Implementation Project, Island of O‘ahu
27
For the DLNR Kualaka‘i East parcel, there is an existing 15-inch stub for the future connection to the Kualaka‘i Trunk Sewer Extension, when it is constructed. Currently there is no existing sewer system along Farrington Highway to connect the DLNR Kualaka‘i West parcels to the future Kualaka‘i Trunk Sewer Extension. The D.R. Horton Gateway Lot has a permanent 24-inch sewer line crossing Farrington Highway and a temporary connection through the UHWO Makai sewer system (Figure 2-4) to the existing Kualaka‘i Trunk Sewer. The temporary connection will be disconnected when the Kualaka‘i Trunk Sewer Extension is constructed (Community Planning and Engineering, Inc., 2006).
In Kapolei and East Kapolei, the wastewater master plans used equivalent population (EP) to allocate density to the master plan parcels. The same methodology is applied in this study. The estimated sewer EP, calculated from the previously approved sewer master plans and anticipated development numbers for East Kapolei, are summarized in Table 4 of Appendix D. Infrastructure Improvements Needed. An analysis of the existing regional sewer system capacity was performed with the anticipated sewer demand from East Kapolei development (Attachment A of Appendix D). The improvements are summarized below.
Keahumoa Trunk Sewer Improvements
A portion of the existing Keahumoa Trunk Sewer requires upsizing from 36-inch to 42-inch due to the increase in EPs from development of the DLNR Transit Station Mixed-Use, D.R. Horton Ho‘opili, and DHHL Ka‘uluokaha‘i properties. The timing of Keahumoa Trunk Sewer Improvements to support new development may occur in Phase 1, 2020-2029, and will require coordination among the aforementioned participating parties.
Kualaka‘i Trunk Sewer Extension
The existing Kualaka‘i Trunk Sewer terminates at the intersection of Kualaka‘i Parkway and Keahumoa Parkway and presently serves UHWO Makai and DHHL. This trunk sewer must be extended to the intersection of Kualaka‘i Parkway and Farrington Highway with a 30-inch pipeline in order to support development of DLNR Kualaka‘i East and West. The construction of the Kualaka‘i Trunk Sewer Extension is anticipated to occur in Phase 2 (2030-2039) prior to Kualaka‘i East and West development.
New 18-inch Farrington Highway Sewer
A new 18-inch sewer system along Farrington Highway connecting to the Kualaka‘i Trunk Sewer Extension is required to provide sewer service for the DLNR Kualaka‘i West development. The construction of this new 18-inch sewer system is anticipated to occur from Phase 2 (2030-2039) to 3 (2040-2049), following the DLNR Kualaka‘i West project schedule.
Results from the analysis show that the aforementioned sewer system improvements are required to support East Kapolei development (Figure 2-4).
Kualaka‘i Trunk Sewer Upgrade and the Kapolei Interceptor Sewer Upgrade
The existing Wastewater Master Plan for East Kapolei allocates sewer demand to all potential development in the region by EP. Due to the increase in EPs from the DLNR, DHHL, D.R. Horton, and UHWO Makai development, a portion of the existing Kualaka‘i Trunk Sewer (30-inch) and the Kapolei Interceptor Sewer (42-inch) going to the Honouliuli WWTP will require upsizing to 36-inch and 48-inch, respectively.
If UHWO Mauka is significantly downsized, this upgrade of the existing Kualaka‘i Trunk Sewer and Kapolei Interceptor Sewer will not be required to service the development projects of DLNR, D.R. Horton, DHHL, and UHWO Makai. Preliminary computations indicate that the EP of UHWO Mauka would need to be reduced by approximately 1.37 MGD in order to avoid having to upgrade the existing trunk sewers, assuming there is no reduction in EP for the mauka D.R. Horton property.
State TOD Planning & Implementation Project, Island of O‘ahu
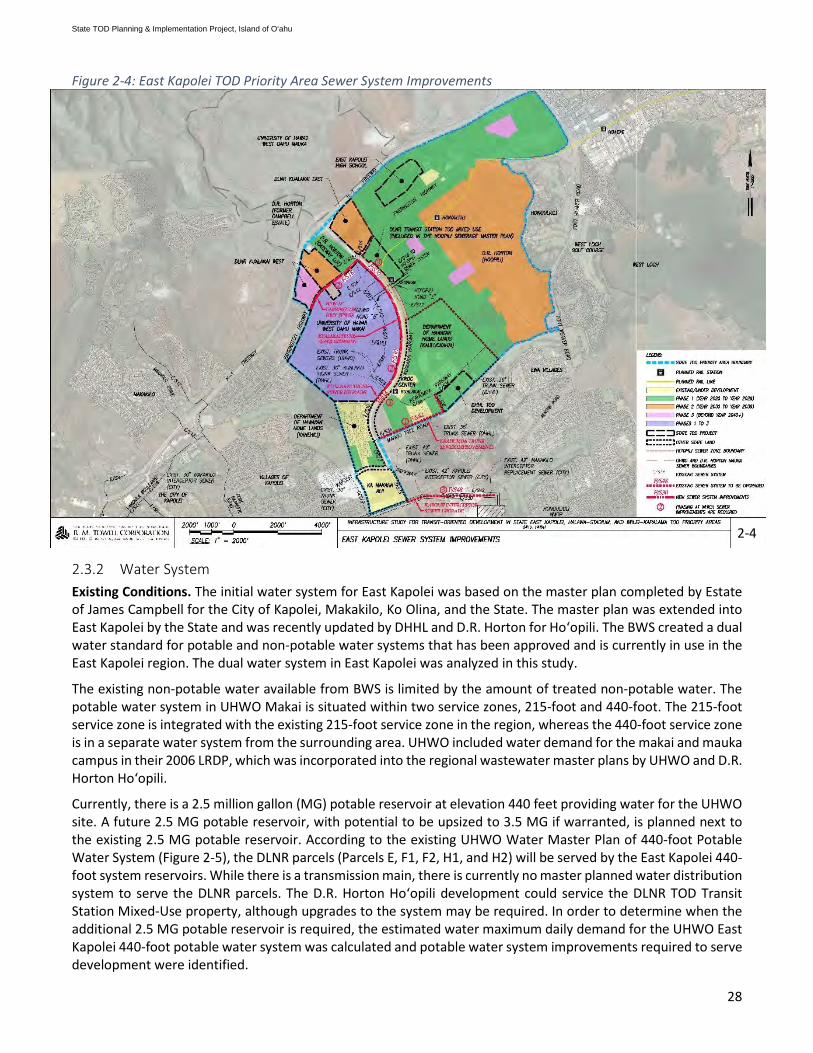
28
Figure 2-4: East Kapolei TOD Priority Area Sewer System Improvements
2.3.2 Water System Existing Conditions. The initial water system for East Kapolei was based on the master plan completed by Estate of James Campbell for the City of Kapolei, Makakilo, Ko Olina, and the State. The master plan was extended into East Kapolei by the State and was recently updated by DHHL and D.R. Horton for Ho‘opili. The BWS created a dual water standard for potable and non-potable water systems that has been approved and is currently in use in the East Kapolei region. The dual water system in East Kapolei was analyzed in this study.
The existing non-potable water available from BWS is limited by the amount of treated non-potable water. The potable water system in UHWO Makai is situated within two service zones, 215-foot and 440-foot. The 215-foot service zone is integrated with the existing 215-foot service zone in the region, whereas the 440-foot service zone is in a separate water system from the surrounding area. UHWO included water demand for the makai and mauka campus in their 2006 LRDP, which was incorporated into the regional wastewater master plans by UHWO and D.R. Horton Ho‘opili.
Currently, there is a 2.5 million gallon (MG) potable reservoir at elevation 440 feet providing water for the UHWO site. A future 2.5 MG potable reservoir, with potential to be upsized to 3.5 MG if warranted, is planned next to the existing 2.5 MG potable reservoir. According to the existing UHWO Water Master Plan of 440-foot Potable Water System (Figure 2-5), the DLNR parcels (Parcels E, F1, F2, H1, and H2) will be served by the East Kapolei 440-foot system reservoirs. While there is a transmission main, there is currently no master planned water distribution system to serve the DLNR parcels. The D.R. Horton Ho‘opili development could service the DLNR TOD Transit Station Mixed-Use property, although upgrades to the system may be required. In order to determine when the additional 2.5 MG potable reservoir is required, the estimated water maximum daily demand for the UHWO East Kapolei 440-foot potable water system was calculated and potable water system improvements required to serve development were identified.
2-4
State TOD Planning & Implementation Project, Island of O‘ahu
29
The existing BWS non-potable water systems are located along Fort Weaver Road and Mango Tree Road that runs from the Honouliuli Water Recycling Facility (WRF) to the West Loch Golf Course (Figure 2-7). An existing 16-inch main is currently stubbed out on both sides of Kualaka‘i Parkway at UHWO Road “B”. The existing non-potable water supply from BWS is limited by the amount of treated non-potable water produced at the BWS water treatment facility. ENV and BWS are working to increase the amount of available non-potable water. In the interim, BWS is supplementing the non-potable water system with potable water.
Infrastructure Improvements Needed. Projected water demand is based on the anticipated development numbers in Table 2-1. As much as 3.6 million gallons per day (MGD) of water could be needed by full buildout over the next 30-40 years. Development in the first 10 years, Phase 1, of the study would require around 0.95 MGD, with an increase of 1.09 and 1.545, inclusive of UHWO Mauka, in Phases 2 and 3 respectively, as the area builds out.
For the DLNR Transit Station TOD Mixed-Use parcel, the on-site potable water system may connect to the existing 20-inch water line at the intersection of Farrington Highway and Kualaka‘i Parkway, utilizing the East Kapolei 440-foot potable water system per the UHWO Water Master Plan. However, this will require construction of a new water line (approximately 800 linear feet) along Farrington Highway as well as coordination with the BWS and UHWO (Figure 2-6). The on-site potable water connection to the BWS system is included in the project-related infrastructure costs and construction is anticipated to be in Phase 1 identified in this study (2020-2029).
One potential alternative is to connect to the existing 12-inch potable water line at Ho‘opili Road “E” utilizing the Honouliuli 440-foot system (Figure 2-6) provided that the Honouliuli 440-foot system has adequate storage to accommodate the additional demand. This will reduce the demand from the East Kapolei 440-foot system. However, this connection will require coordination with the BWS and D.R. Horton. The same existing 12-inch potable water line is currently connected to the East Kapolei 440-foot system near the intersection of Kualaka‘i Parkway and Ho‘opili Road “E”, with a water valve opened temporarily during the interim condition. When D.R. Horton completes the construction of a new tank for the Honouliuli 440-foot system, the water valve will be closed and only activated during an emergency condition.
A second potential alternative is utilizing the existing 12-inch potable water line for connection to the East Kapolei 440-foot system and installing a valve separating the East Kapolei 440-foot system and Honouliuli 440-foot system. This will require coordination with the BWS and D.R. Horton.
For DLNR Kualaka‘i East and Kualaka‘i West parcels, the on-site water system will connect to the East Kapolei 440-foot system per the UHWO Water Master Plan. The on-site water connection to the BWS system is anticipated to be in Phases 2 (2030-2039) and 3 (2040-2049) as identified in this study.
For DHHL TOD development, by eliminating any increase in water demand to the level determined in the approved water master plan, the on-site potable water system can connect to the existing 16-inch potable water line at Keahumoa Parkway without any required upgrade to the East Kapolei 215-foot system.
The existing 2.5 MG potable reservoir can accommodate development up to Phase 2 (maximum daily demand is 2.142 MG). An additional 2.5 MG potable reservoir is required in Phase 3 for the UHWO East Kapolei 440-foot system in order to support UHWO and DLNR development. The project schedule and construction costs shall be coordinated between UHWO and DLNR.
Currently, the BWS has CIP projects planned for the potable water system in East Kapolei. The ‘Ewa Shaft Tunnel Improvements will enhance the regional potable water supply with construction anticipated to occur in Phase 1 (2020-2029).
State TOD Planning & Implementation Project, Island of O‘ahu
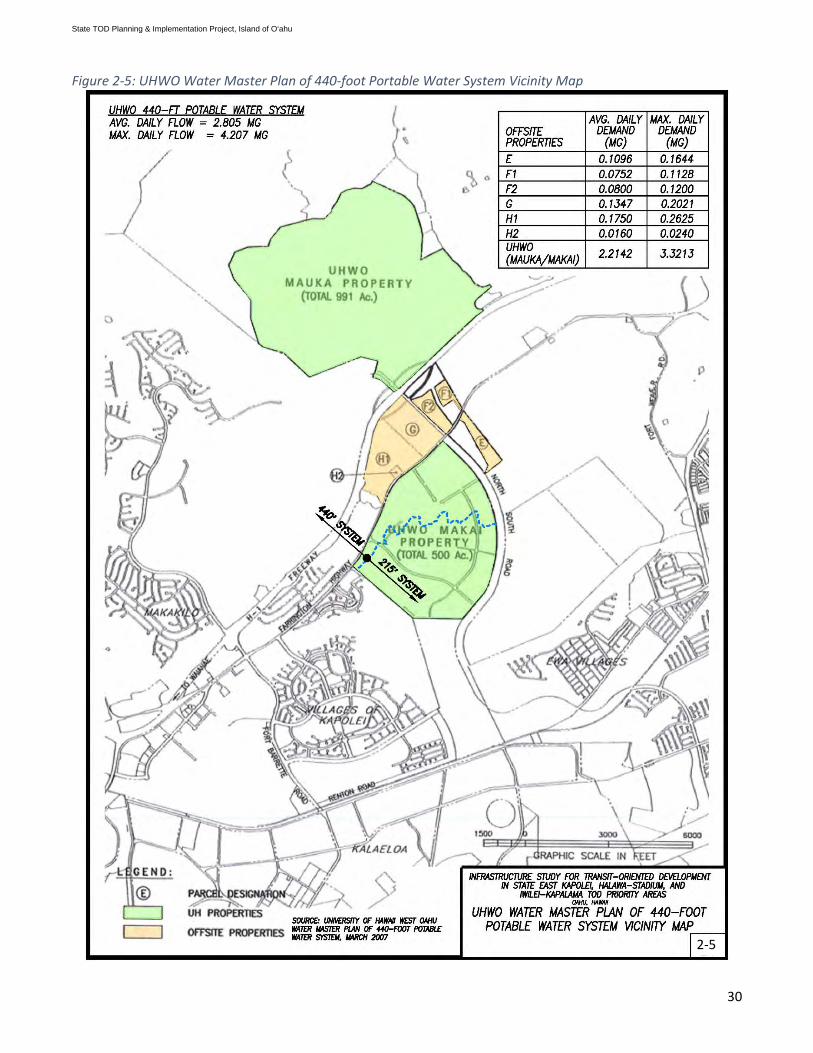
30
Figure 2-5: UHWO Water Master Plan of 440-foot Portable Water System Vicinity Map
2-5
State TOD Planning & Implementation Project, Island of O‘ahu

31
Figure 2-6: East Kapolei TOD Priority Area Potable Water System Improvements
Figure 2-7: East Kapolei TOD Priority Area Non-Potable Water System Improvements
2-6
2-7
State TOD Planning & Implementation Project, Island of O‘ahu

32
In addition, the BWS plans to construct a 3.0 MG non-potable reservoir (East Kapolei 215-foot system) next to the existing 4.0 MG potable reservoir (East Kapolei 215-foot system) mauka of the DLNR Kualaka‘i West parcel (Figure 2-7). The BWS also plans to construct a new 16-inch main from the 3.0 MG non-potable reservoir, running along Farrington Highway and Kualaka‘i Parkway, to the existing connection point near the intersection of Kualaka‘i Parkway and Keahumoa Parkway. Construction of the 3.0 MG non-potable reservoir and 16-inch water main is anticipated in the 2020-2029 Phase 1 timeframe.
2.3.3 Drainage System Existing Conditions. The East Kapolei TOD parcels are within the Kaloʻi Gulch Watershed, which has been studied by all development along the reach from the ocean to the H-1 Freeway. Drainage master plans were prepared by Ocean Pointe, ‘Ewa by Gentry, ‘Ewa Villages, East Kapolei, DOT, UHWO, and D.R. Horton Ho‘opili. These site-specific drainage master plans are based on the ‘Ewa Villages Drainage Master Plan.
Two major gulches, Kaloʻi Gulch and Hunehune Gulch shown in Figure 2-8, carry runoff from mauka to makai. Kaloʻi Gulch is situated at the east portion of the TOD priority area and enters the DLNR Kualaka‘i East parcel through two 12-foot by 12-foot box culverts under the H-1 Freeway. Runoff continues south and enters the DLNR Transit Station TOD Mixed-Use parcel under an existing bridge crossing at Farrington Highway. Kaloʻi Gulch ultimately connects to the realigned Kaloʻi Channel built to the east of Kualaka‘i Parkway.
Similarly, Hunehune Gulch is situated at the western portion of the TOD priority area and passes through DLNR Kualaka‘i West parcels through an existing 96-inch pipe culvert under the H-1 Freeway. Downstream of the H-1 Freeway, Hunehune Gulch continues south, crossing under an existing bridge at Farrington Highway, and continues south to the UHWO Makai parcels.
Infrastructure Improvements Needed. According to the Federal Emergency Management Agency (FEMA) Flood Insurance Rate Map (FIRM), the TOD priority area is located in Zone D, an area of undetermined flood hazard (Figure 2-8). No flood hazard analysis was performed. However, the drainage improvements at Kaloʻi Gulch within the DLNR parcels, and Hunehune Gulch within the DLNR and UHWO Makai parcels will serve both regional and project-related purposes, thereby controlling the 100-year flood to reduce flood hazards in the region. Planned improvements to the Kaloʻi Gulch and Hunehune Gulch will consist of the following items.
Kaloʻi Gulch • Improvements to Kaloʻi Gulch to contain the design flow • New culvert crossing in DLNR Kualaka‘i East internal road • New bridge at Farrington Highway
Hunehune Gulch • Improvements and realignment to Hunehune Gulch to contain the design flow and to redirect flow
away from the land being exchanged with D.R. Horton. • New culvert crossing in DLNR Kualaka‘i West internal road • New culvert crossing at Farrington Highway
In addition to controlling storm water runoff from large storms, the City requires all new development to provide infrastructure to control the increase in peak flow when new impervious surfaces are proposed.
For the DLNR Transit Station TOD Mixed-Use parcel, Honolulu Authority for Rapid Transportation (HART) is required to provide 1,000 parking stalls at the future park and ride site near the transit station. In order to accommodate this peak flow reduction requirement, detention basins are typically proposed. However, a detention basin will significantly reduce total developable area of the parcels and potentially increase the amount of structured parking needed in the future. For the short-term, subsurface retention chambers engineered for installation below surface parking lots can be installed beneath the proposed parking lot, provided that no structures and buildings are placed directly above the underground chambers. These chambers are not normally meant to have a building over them, however, provisions can be made for installation of subsurface retention chambers that can support a building in the future and still be maintainable. Cisterns or subsurface retention
State TOD Planning & Implementation Project, Island of O‘ahu
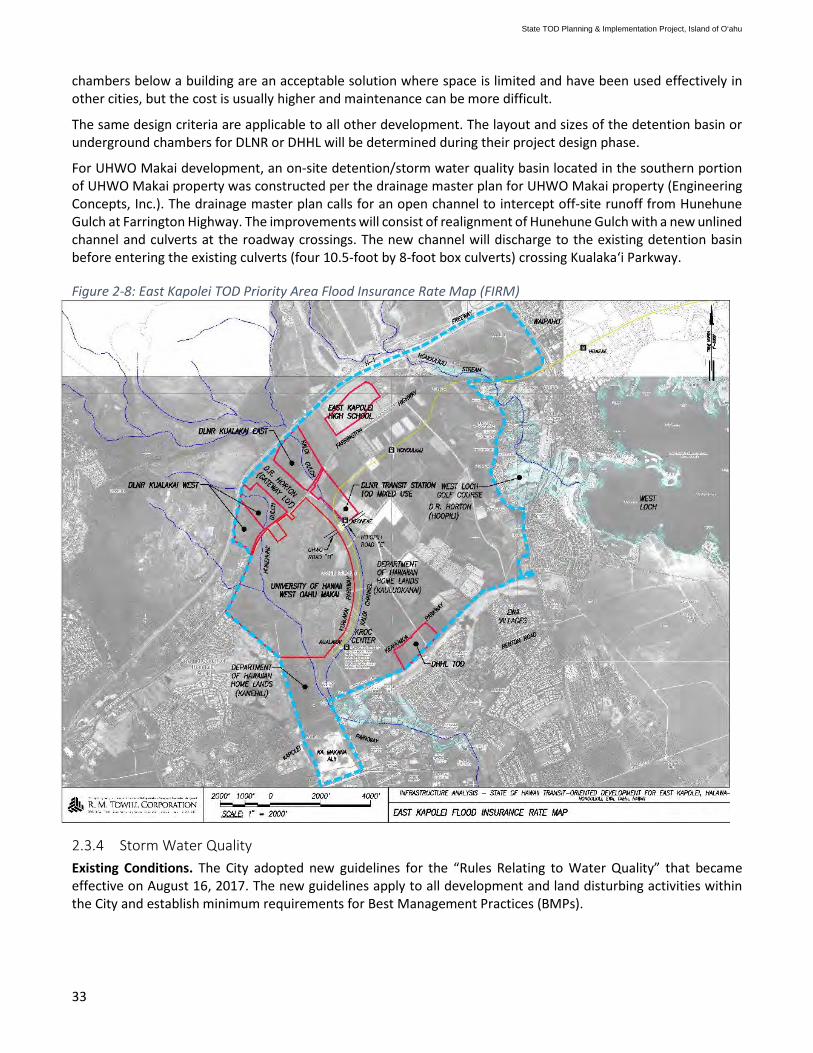
33
chambers below a building are an acceptable solution where space is limited and have been used effectively in other cities, but the cost is usually higher and maintenance can be more difficult.
The same design criteria are applicable to all other development. The layout and sizes of the detention basin or underground chambers for DLNR or DHHL will be determined during their project design phase.
For UHWO Makai development, an on-site detention/storm water quality basin located in the southern portion of UHWO Makai property was constructed per the drainage master plan for UHWO Makai property (Engineering Concepts, Inc.). The drainage master plan calls for an open channel to intercept off-site runoff from Hunehune Gulch at Farrington Highway. The improvements will consist of realignment of Hunehune Gulch with a new unlined channel and culverts at the roadway crossings. The new channel will discharge to the existing detention basin before entering the existing culverts (four 10.5-foot by 8-foot box culverts) crossing Kualaka‘i Parkway.
Figure 2-8: East Kapolei TOD Priority Area Flood Insurance Rate Map (FIRM)
2.3.4 Storm Water Quality Existing Conditions. The City adopted new guidelines for the “Rules Relating to Water Quality” that became effective on August 16, 2017. The new guidelines apply to all development and land disturbing activities within the City and establish minimum requirements for Best Management Practices (BMPs).
State TOD Planning & Implementation Project, Island of O‘ahu

34
Post-construction treatment control BMPs may include retention measures, biofiltration, and BMPs for alternative compliance. The location and method of the post-construction treatment control BMPs will be determined during a project’s design phase.
Infrastructure Improvements Needed. DLNR, DHHL, and UHWO development will be classified as Priority A projects, which will require Storm Water Quality Reports (SWQR) to be submitted to the DPP for review and approval prior to issuance of a building, grading, grubbing, and/or stockpile permit for development. As applicable, low impact development solutions, such as capturing runoff from rooftops or impervious surfaces and conveying them to rain gardens and catchment basins, and other green infrastructure solutions should be implemented.
For retention BMPs, detention basins or underground chambers described in Appendix D can be used for both flood control and storm water quality purposes provided that the soil infiltration rate meets the minimum requirement of 0.5 inches an hour and the ground water table is below the detention basin and underground chambers’ invert.
2.3.5 Roadways and Circulation Existing Conditions. The H-1 Freeway (State) is the primary corridor connecting West O‘ahu to downtown Honolulu. Kualaka‘i Parkway (State) and Farrington Highway (predominantly State, with a City-owned portion between Kapolei Golf Course and Fort Weaver Road) are the two major regional roadways within the TOD priority area. Kualaka‘i Parkway (State) is a divided highway with a raised median, connecting H-1 Freeway and Kapolei Parkway, and is owned by the State. The City-owned portion of Farrington Highway, between Kapolei Golf Course and Fort Weaver Road (State), is a two-lane undivided highway. The City is currently in the planning stage for the Farrington Highway Widening project and the draft Environment Assessment (EA) is expected to be completed in 2020 with anticipated construction in Phase 1 of this study (2020-2029). The Farrington Highway Widening project will widen the existing highway to four lanes (two lanes in each direction) with potential for six lanes in the future, if warranted.
All TOD projects that propose increases in density above the previous master plans will be required to update their transportation master plans and traffic impact analysis reports (TIAR).
Infrastructure Improvements Needed. For new development, the City will require a TIAR to evaluate the potential traffic impacts to the region. Potential improvements may include improvements to major intersection and roadway improvements in the vicinity of each TOD project site. In addition, the DTS has several projects planned in East Kapolei. The following items are identified in this study as potential regional/project improvements (Figure 2-9). The final locations are subject to change.
Department of Land and Natural Resources (DLNR) Improvements • One intersection at Farrington Highway connecting to the on-site backbone roads for Transit Station
TOD Mixed-Use and Kualaka‘i East. • One intersection at Kualaka‘i Parkway connecting to the on-site backbone roads in Kualaka‘i East. D.R.
Horton is currently working with the DOT Highwaysto improve the western portion of the intersection to be a signalized T-intersection. However, DOT Highways will require the T-intersection to be a right-in/right-out intersection if traffic conditions impact the H-1 Freeway traffic flow in the future. DLNR development will need to coordinate with DOT Highways to determine the scope of the intersection improvements during the design phase.
• Two intersections at Farrington Highway connecting to the on-site backbone roads in Kualaka‘i West. The east intersection will connect the DLNR on-site backbone roads to the UHWO campus entry road. The west intersection is to provide additional access to the project site from Farrington Highway. The final locations will be coordinated between DLNR and the City.
Department of Hawaiian Home Lands (DHHL) TOD Improvements • Three existing T-intersections at Keahumoa Parkway connecting to the on-site backbone roads may
be improved to full signalized intersections.
State TOD Planning & Implementation Project, Island of O‘ahu

35
Figure 2-9: East Kapolei TOD Priority Area Roadway Improvements
University of Hawaiʻi West Oʻahu (UHWO) Makai Improvements • An east-west connector road with one intersection at Kualaka‘i Parkway and one intersection at
Farrington Highway. • A north-south connector road with one intersection at Kualaka‘i Parkway. • Farrington Highway Frontage.
D.R. Horton Ho‘opili Improvements • Various roadways within Ho‘opili connecting to Kualaka‘i Parkway, Farrington Highway, and Fort
Weaver Road.
Complete Streets Considerations and Department of Transportation Services (DTS) Improvements As part of the City’s Complete Streets Program, the DTS has identified pedestrian, bicycle, and bus access improvements necessary to help riders reach the rail stations (OP/HHFDC, 2018). In particular, they have identified the following projects:
• Conversion of existing temporary bus stops on Keahumoa Parkway, new bus bays and crosswalk improvements along Kualaka‘i Parkway fronting Kualaka‘i (East Kapolei) Rail Station and Keone‘ae (UHWO) Rail Station. At the time of this study, DTS has yet to determine the exact locations of the new bus bays and crosswalk improvements.
• Completion of a shared-Use Path along Kualaka‘i Parkway between Farrington Highway and Kapolei Parkway (north segment of 3,700 feet from Ho‘opili to Farrington Highway and 1,100-foot segment south of Kroc Center).
2-9
State TOD Planning & Implementation Project, Island of O‘ahu
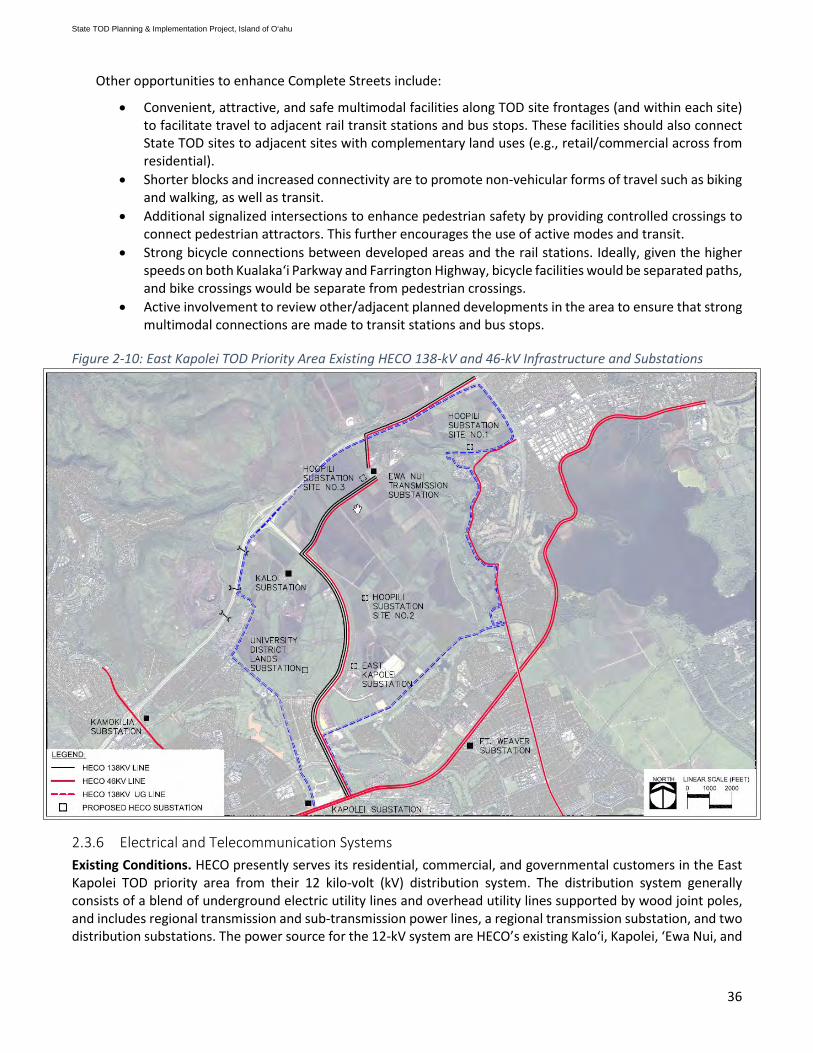
36
Other opportunities to enhance Complete Streets include:
• Convenient, attractive, and safe multimodal facilities along TOD site frontages (and within each site) to facilitate travel to adjacent rail transit stations and bus stops. These facilities should also connect State TOD sites to adjacent sites with complementary land uses (e.g., retail/commercial across from residential).
• Shorter blocks and increased connectivity are to promote non-vehicular forms of travel such as biking and walking, as well as transit.
• Additional signalized intersections to enhance pedestrian safety by providing controlled crossings to connect pedestrian attractors. This further encourages the use of active modes and transit.
• Strong bicycle connections between developed areas and the rail stations. Ideally, given the higher speeds on both Kualaka‘i Parkway and Farrington Highway, bicycle facilities would be separated paths, and bike crossings would be separate from pedestrian crossings.
• Active involvement to review other/adjacent planned developments in the area to ensure that strong multimodal connections are made to transit stations and bus stops.
Figure 2-10: East Kapolei TOD Priority Area Existing HECO 138-kV and 46-kV Infrastructure and Substations
2.3.6 Electrical and Telecommunication Systems Existing Conditions. HECO presently serves its residential, commercial, and governmental customers in the East Kapolei TOD priority area from their 12 kilo-volt (kV) distribution system. The distribution system generally consists of a blend of underground electric utility lines and overhead utility lines supported by wood joint poles, and includes regional transmission and sub-transmission power lines, a regional transmission substation, and two distribution substations. The power source for the 12-kV system are HECO’s existing Kaloʻi, Kapolei, ‘Ewa Nui, and
State TOD Planning & Implementation Project, Island of O‘ahu

37
Kamokila Substations6. Hawaiian Telcom and Charter Spectrum also provide telecommunications services via these overhead and underground lines.
For new development projects, Hawaiian Telcom and Charter Spectrum typically require developers to provide underground telecommunications duct system infrastructure, also known as support structures, but will provide the cabling at their cost. These utility companies can also replace the existing overhead and underground legacy trunking facilities with fiber optic cables and supplement existing fiber optic cable facilities with additional structures where they are deemed necessary.
Infrastructure Improvements Needed. The improvements proposed in this section focus primarily on electrical capacity because current telecommunication technology generally allows Hawaiian Telcom and Charter Spectrum to provide additional capacity to accommodate growth, as deemed necessary, without new infrastructure. The necessary electrical improvements identified by this analysis include: increasing the quantity of existing 12-kV distribution lines extending from existing or proposed distribution substations, providing additional 46-kV transmission line extensions for the proposed substations, and developing additional distribution substations.
Under an existing City ordinance related to special districts generally, projects located on properties within a special district would be required to install new electric and telecommunication facilities underground (Revised Ordinances of Honolulu, Chapter 22). Discussions regarding the implications of this ordinance to the City’s forthcoming TOD Special District are ongoing. Finally, a three- to five-year planning and approval process involving the PUC is necessary for any new substation or substantial substation upgrades, and PUC oversight would be triggered for any expenditure amount of $2.5 million or greater for necessary improvements and for approval of HECO rate-base funding.
Distribution Substations
During the master planning process for Ho‘opili, DHHL East Kapolei, and UHWO7, HECO substation needs were identified and sites were tentatively selected. HECO is currently planning to construct a new substation, Ho‘opili Substation Site Number 2 and has a parcel near the existing Kroc Center that can be developed into the East Kapolei Substation. Additional tentative substation locations have been identified for future development of Ho‘opili Substation Sites Numbers 1 and 3 within Ho‘opili and one additional substation site located within UHWO properties.
If additional 46-kV sub-transmission capacity is required to support the new substation deployments, HECO would also need to identify where the 46-kV capacity would originate as well as the alignments for the new 46-kV infrastructure.
46-kV Transmission Improvements
To support the proposed substations and expansion of the existing substations, HECO would need to evaluate the capacity of its 46-kV infrastructure and determine whether an additional 46-kV transmission alignment and circuit would be needed. If a new 46-kV circuit is required, it would emanate from the ‘Ewa Nui Transmission substation due to its proximity. The cost for installation of HECO 46-kV infrastructure and circuits is considered to be a “system” cost, which is typically borne by HECO, and depends on which alternative is deemed to be the most viable and cost efficient.
However, once the City East Kapolei TOD Special District is established, any 46-kV alignment under consideration would be required to be underground. For example, if development occurs within the established TOD Special District, all the 46-kV sub-transmission circuits feeding the proposed substation
6 Pending submission of service requests triggered by TOD redevelopment, a request has been made to HECO for verification of the remaining capacity in these substations. A response was received on April 8, 2020 and is included as Attachment 2 to Appendix E. 7 The anticipated residential development in this assessment was based on the previously approved 2018 Proposed UHWO Campus Land Plan, as presented to the Board of Regents, and is subject to change.
State TOD Planning & Implementation Project, Island of O‘ahu

38
in the UHWO property would need to be placed underground. The cost to construct and cable an underground 46-kV duct line within Farrington Highway between ‘Ewa Nui Transmission Substation and Kaloʻi Substation is $13,000,000. Due to the creation of the TOD special district and its requirement for all new electrical lines to be placed underground, it is not clear how this cost would be distributed amongst TOD priority area landowners because the City, private developers, and HECO have not formally negotiated cost allocations. It is not apparent that HECO would agree to absorb the cost to underground a 46-kV line because under current City ordinances they can be placed overhead. For these reasons, the $13,000,000 was included in this study’s cost estimate.
12-kV Improvements
During master planning processes, HECO also provides input for the complement of conduits that will be required to extend 12-kV underground distribution facilities from the proposed substation locations to provide electric power to master planned development. Specific 12-kV conduits have not been identified as part of this project because most if not all of the 12-kV distribution system expansion costs would be the responsibility of the respective developers rather than a shared cost amenable to community development or improvement district funding.
2.3.7 Public Schools Infrastructure Improvements Needed. The DOE is anticipating at least seven new schools in East Kapolei. Five will be located on Ho‘opili lands: three elementary schools, one middle school, and one high school. Two will be located on DHHL Ka‘uluokaha‘i parcels: one elementary school and one middle school. The DOE is coordinating with UHWO8 and DLNR on school demand triggered by their development plans.
Construction of Phase 1 of the East Kapolei Middle School within Ka‘uluokaha‘i, near the Kroc Center, is expected to be completed and open for the 2020-2021 school year. The new schools within Ho‘opili will be built, as needed, on land that was provided by the developer. Because of growing enrollment in the Kapolei region, the DOE is accelerating its plans to build the new East Kapolei High School within Ho‘opili on a site above Farrington Highway. The East Kapolei High School subdivision was approved on September 27, 2019. Transfer of the property to DOE will occur at a future date.
2.3.8 Sustainability and District Systems Existing Conditions. The East Kapolei TOD priority area is among the drier and hotter ecosystems on O‘ahu. As such, it is anticipated that heat stress and water stress may be exacerbated under changed climate. With significant new buildout and the most dense development in the East Kapolei TOD priority area yet to occur, it is among the most conducive of the TOD priority areas for neighborhood-serving/district systems, as described in Section 6 and Appendix H. Further, UHWO already has in operation a district thermal cooling and a district photovoltaic system on their lands.
Sustainable Infrastructure Recommendations. The mix of residential and commercial construction allow for synergies in thermal, electrical, and water infrastructure – leveraging the diversity of demand across the different uses. Neighborhood-serving infrastructure systems would also offer a means to reduce the utility cost burden on disposable income, which increases affordability for residents of the TOD priority area.
In particular, the large amount of development, warm climate, UHWO’s existing central plant, and significant density around transit stations suggest a district cooling system could be economically viable. A preliminary study by Arup of a district cooling system serving the East Kapolei TOD priority area found that nearly $50 million in savings of utility costs for TOD priority area residents might be realized (Figure 2-11).
8 The anticipated residential development included in this assessment was based on the previously approved 2018 Proposed UHWO Campus Land Plan, as presented to the Board of Regents, and is subject to change.
State TOD Planning & Implementation Project, Island of O‘ahu

39
Finally, building design to promote shaded paths, planning for green space, and neighborhood-serving systems offer opportunity to improve resilience through better resource management and community connection.
Specific observations on sustainability challenges and opportunities for the East Kapolei TOD priority area are provided in the Arup report in Appendix H, Sustainability and Neighborhood-Serving Systems.
Figure 2-11: Preliminary Study of Cost Savings from District Cooling 1
Source: Arup, 2020 1 Additional savings in maintenance and operation are not shown. 2 O&M – Operations and Maintenance 3 CAPEX – Capital Expenditure 4 REPEX – Replacement Expenditure
2.4 East Kapolei TOD Priority Area Rough Order of Magnitude (ROM) Infrastructure Costs As can be seen in Table 2-2, the infrastructure projects needed to support the anticipated land use scenario buildout in the East Kapolei TOD priority area were categorized in one of three categories as follows:
• Regional improvements: Improvements that will provide benefits and enhancement to the region, not just for specific TOD projects.
• Regional/project improvements: These are improvements consisting of on-site and/or off-site improvements required to support individual TOD project needs and that also benefit the region.
• Project improvements: These are typical on-site improvements consisting of backbone road, drainage, sewer, water, landscape, electrical, storm water quality, and other ancillary development that benefit the individual project.
Table 2-2 lists those projects determined to be regional improvements and regional/project improvements that significantly impact or are essential to TOD development in this priority area. ROM infrastructure costs associated with these two categories of projects as well as for future DOE schools and regional electrical systems improvements needed in the East Kapolei TOD priority area were included in the cost and financing analysis of this study. The regional/project sewer improvements costs assume that UHWO Mauka development will maintain the demand per the approved sewer master plan (no reduction in sewer EP). The infrastructure costs (2019 dollars), not including building, demolition, and soft costs, are summarized in Table 2-2 and the detailed breakdown is included in Appendix D, Attachment B. Table 2-2.
2 2
3
4
State TOD Planning & Implementation Project, Island of O‘ahu

40
Table 2-2: East Kapolei TOD Priority Area ROM Infrastructure Costs
Improvement Type Phase 1
(2020-2029) ($million)
Phase 2 (2030-2039)
($million)
Phase 3 (2040-2049)
($million)
TBD ($million) Funded
Regional/Project Sewer Improvements Keahumoa Trunk Sewer Improvements (upsize from 36-inch to 42-inch) 3.3 - - - No
Kualaka‘i Trunk Sewer Extension (30-inch) - 5.79 - - No New 18-inch Sewer System along Farrington Highway - 3.01 - - No Kualaka‘i Trunk Sewer Upgrade (upsize from 30-inch to 36-inch) - - 0.92 - No Kapolei Interceptor Sewer Upgrade (upsize from 42-inch to 48-inch) - - 6.24 - No
Regional Water Improvements ‘Ewa Shaft Tunnel Improvements 50.0 - - - Yes East Kapolei 215-Foot System, 3.0 MG Non-Potable Water Reservoir 9.1 - - - Yes
Kualaka‘i Parkway 16-inch Recycle Water Main 3.6 - - - Yes East Kapolei 440-Foot System, 2.5 MG Potable Water Reservoir - - 7.58 - No East Kapolei 440-Foot System, 3.5 MG Potable Water Reservoir (needed unless UH Mauka reduces MP demand) - - 10.62 - No
Regional/Project Drainage Improvements DLNR Transit Station Mixed-Use (Kaloi Gulch) 18.77 - - - No DLNR Kualaka‘i East and Kualaka‘i West TMK: 9-1-018: 008 (Kaloʻi Gulch and Hunehune Gulch) - 11.12 - - No
UHWO Makai (Hunehune Gulch) 8.39 - - - No Regional/Project Roadway Improvements
DLNR Transit Station Mixed-Use (Intersection) 5.75 - - - No D.R. Horton Ho‘opili 122 feet ROW Backbone Road 42.3 - - - Yes D.R. Horton Ho‘opili 108 feet ROW Backbone Road - 35.32 - - Yes D.R. Horton Ho‘opili 78 feet ROW Backbone Road 30.33 43.32 - - Yes UHWO Makai, East-West Connector Road (108 feet ROW Backbone Road and Intersection) 44.64 - - - No
UHWO Makai, North-South Connector Road (78 feet ROW Backbone Road and Intersection) - 32.41 - - No
UHWO Makai, Farrington Highway Frontage - - 38.2 - No
State TOD Planning & Implementation Project, Island of O‘ahu
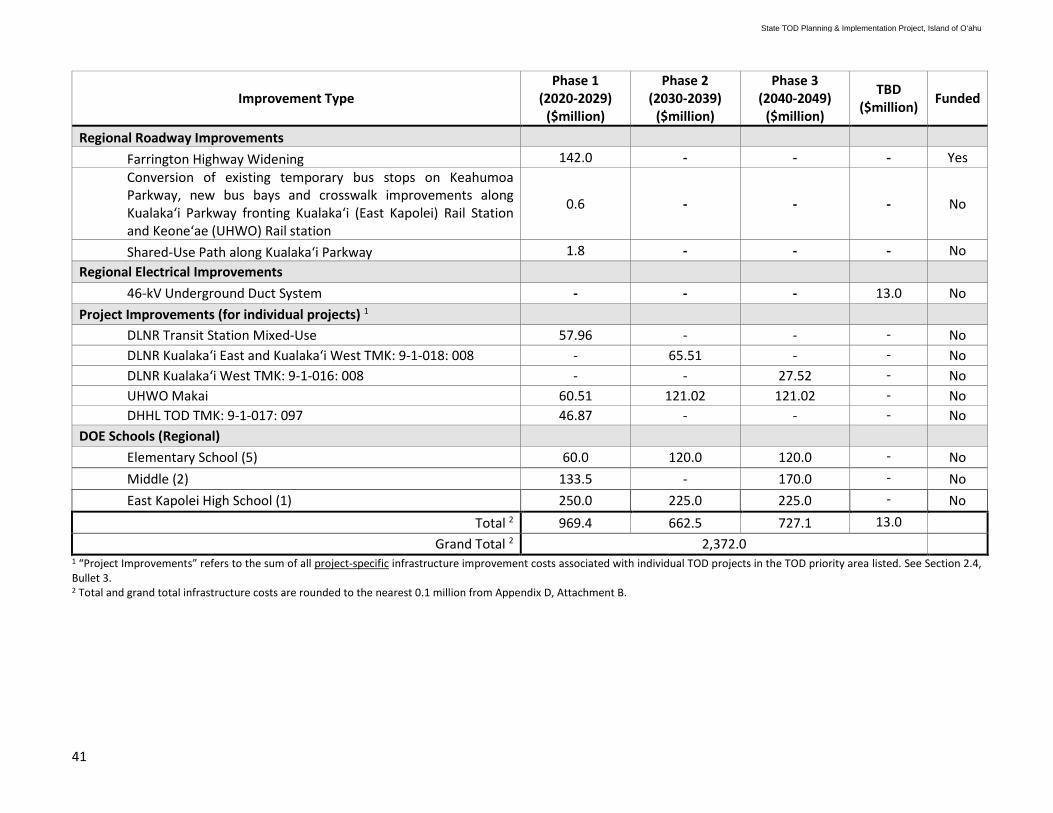
41
Improvement Type Phase 1
(2020-2029) ($million)
Phase 2 (2030-2039)
($million)
Phase 3 (2040-2049)
($million)
TBD ($million) Funded
Regional Roadway Improvements Farrington Highway Widening 142.0 - - - Yes Conversion of existing temporary bus stops on Keahumoa Parkway, new bus bays and crosswalk improvements along Kualaka‘i Parkway fronting Kualaka‘i (East Kapolei) Rail Station and Keone‘ae (UHWO) Rail station
0.6 - - - No
Shared-Use Path along Kualaka‘i Parkway 1.8 - - - No Regional Electrical Improvements
46-kV Underground Duct System - - - 13.0 No Project Improvements (for individual projects) 1
DLNR Transit Station Mixed-Use 57.96 - - - No DLNR Kualaka‘i East and Kualaka‘i West TMK: 9-1-018: 008 - 65.51 - - No DLNR Kualaka‘i West TMK: 9-1-016: 008 - - 27.52 - No UHWO Makai 60.51 121.02 121.02 - No DHHL TOD TMK: 9-1-017: 097 46.87 - - - No
DOE Schools (Regional) Elementary School (5) 60.0 120.0 120.0 - No Middle (2) 133.5 - 170.0 - No East Kapolei High School (1) 250.0 225.0 225.0 - No
Total 2 969.4 662.5 727.1 13.0 Grand Total 2 2,372.0
1 “Project Improvements” refers to the sum of all project-specific infrastructure improvement costs associated with individual TOD projects in the TOD priority area listed. See Section 2.4, Bullet 3. 2 Total and grand total infrastructure costs are rounded to the nearest 0.1 million from Appendix D, Attachment B.
State TOD Planning & Implementation Project, Island of O‘ahu
42
As shown in Table 2-2, the infrastructure costs for Phases 1 (2020-2029), 2 (2030-2039), and 3 (2040-2049), as identified in this study, are $969.4 million, $662.5 million, and $727.1 million, respectively. The regional electrical improvements costs associated with undergrounding are $13 million, but the phasing plan is undetermined at the time of this study. The total infrastructure costs anticipated for the East Kapolei TOD priority area are approximately $2.37 billion.
2.5 Key Infrastructure Issues for the East Kapolei TOD Priority Area Sewer, non-potable water system, drainage, roadways and circulation, public schools, and sustainability and district systems are the key regional infrastructure issues that need to be addressed in the East Kapolei TOD priority area. All the infrastructure in East Kapolei was previously master planned and capacities have been reserved according to the plans, meaning that it has been developed to accommodate specific development and populations ranges based on various planning efforts throughout the years. To go above and beyond these existing allocations, landowners will have to consult with the City and utility providers, make agreements with surrounding property owners to reallocate capacities, or existing infrastructure plans in the region would need to be reconsidered and a new master plan developed.
Sewer. The entire area from Ko Olina to the Honouliuli WWTP is served by trunk sewers along the OR&L Railroad easement based on previously approved master plans. The existing Wastewater Master Plan for East Kapolei provides sewer allocations to existing development projects in the East Kapolei TOD priority area. Current sewer trunks serve UHWO, DHHL and Ho‘opili parcels. However, if there is an increase in EPs for development on the DLNR parcels, other properties allowed additional density as proposed in the Public Review Draft 2 of the City’s East Kapolei TOD Plan, or at UHWO Makai9, then a portion of the existing trunk sewer and interceptor sewer going to the Honouliuli WWTP will require upsizing.
Water. This region uses a dual water system due to the availability of non-potable water and the BWS work with developers to create a dual water system standard. The existing non-potable water available from the BWS is limited by the amount of treated non- potable water available to the BWS water treatment facility. The ENV and BWS are working to increase the amount of non-potable water.
Drainage. Two major gulches, Kaloʻi Gulch and Hunehune Gulch, carry runoff from mauka to makai and will require drainage improvements to serve regional and project-related purposes. The major drainage improvements at Kaloʻi Gulch within the DLNR parcels and Hunehune Gulch within the DLNR and UHWO Makai parcels include design flow, redirection of flow, new culverts, bridge crossings, and drainage crossings through major roadways. In addition, the City requires all new development to provide infrastructure to control the increase in peak flow when new impermeable surfaces are proposed. Project-specific storm water improvements will be dealt with on a project-by-project basis.
Roadways and Circulation. Potential improvements may include major intersection and roadway improvements, connectivity to new development, and access to major roadways in the vicinity of each TOD project site. With regard to mobility and transportation, the Farrington Highway Widening project is one of the major roadways improvements being planned at the time of this study. All projects within the TOD priority area that propose increases in density above previous master plans will be required to update their transportation master plans and TIARs.
Public Schools. The DOE is anticipating that at least seven new schools will be needed to provide additional school capacity for future residential development and the forecasted population increase in the East Kapolei TOD priority area. Because of growing enrollment in the Kapolei region, the DOE is accelerating its plans to build the new East Kapolei High School within Ho‘opili on a site above Farrington Highway. The East Kapolei High School subdivision was approved on September 27, 2019. Transfer of the property to DOE will occur at a future date.
9 The anticipated residential development included in this assessment was based on the previously approved 2018 Proposed UHWO Campus Land Plan, as presented to the Board of Regents, and is subject to change.
State TOD Planning & Implementation Project, Island of O‘ahu

43
Sustainability and District Systems. The mix of residential and commercial uses allow for synergies in thermal, electrical, and water infrastructure – leveraging the diversity of demand across the different uses. Major landowners in the East Kapolei TOD priority area have the ability to move forward with district system approaches since there are fewer parties and stakeholders that would need to be involved in joint action. In some cases, such as the UHWO lands, there may be no or very limited barriers to expansion of district systems.
However, there is a risk of not capitalizing on the use of sustainable systems due to a lack of timely intersection between the various development projects. Ongoing coordination between development projects would be needed to promote and encourage district systems in the East Kapolei TOD priority area.
State TOD Planning & Implementation Project, Island of O‘ahu

44
.
This page intentionally left blank.
State TOD Planning & Implementation Project, Island of O‘ahu
45
3 Hālawa-Stadium TOD Priority Area
The study boundary for the Hālawa-Stadium TOD priority area shown in Figure 3-1 was selected to include planned State projects that will impact service capacity of shared regional infrastructure systems serving the area. The boundary was drawn to include privately-held properties with TOD potential that were identified in the City’s draft Hālawa Area TOD Plan (2017).
The TOD priority area includes large State landholdings: the Aloha Stadium Property (SA/DAGS); Puʻuwai Momi public housing (HPHA); the PSD OCCC relocation site currently used by Department of Agriculture (DOA) as an Animal Quarantine Station; and ‘Aiea Elementary School (DOE). These entities control over 130 acres of land suitable for redevelopment within the Hālawa-Stadium TOD priority area, centered around the Hālawa (Aloha Stadium) rail station, the mid-point on the planned rail line. Potential private development such as at Hālawa View Apartments, Stadium Marketplace (former Kmart site), and Stadium Mall (Ice Palace site) are also included in this study. Federal facilities and single-family residential areas are included in the Hālawa-Stadium TOD priority area study boundary. However, it is assumed that no development or redevelopment will occur on these properties and they are not included in the redevelopment analysis for this study.
3.1 TOD Context: City and County of Honolulu Hālawa Area TOD Plan This study builds upon the groundwork of the City’s Hālawa Area TOD Plan, which identifies the character and intensity of TOD within the Plan area and is based on land use and capacity analyses and community input as to how these communities may evolve over time. Preparation of the Hālawa Area TOD Plan was started in March 2015 and the Draft Final Plan was released in July 2017. The City’s draft Hālawa TOD plan is founded on principles that seek to create a sports, entertainment, and retail destination with a strong connection between Aloha Stadium and the rail station – a working district that would offer residential opportunities, community and cultural gathering places, and a green network for active connections within the Plan area. One of three proposed land use plans contained in the City’s draft Hālawa Area TOD Plan is shown in Figure 3-2.
The development analysis for this study was completed in November 2019 using the Hālawa Area TOD Plan Draft Final (2017) as the basis for potential TOD buildout. In 2019, the plan was submitted to Council for adoption and was undergoing review at the time of this study.
3.2 Preferred Land Use Scenario and TOD Potential The preferred land use scenario for the Hālawa-Stadium TOD priority area analyzed for this study represents anticipated development based on plans being prepared for State-owned parcels, a design charrette focusing on the creation of a sports/entertainment district, and the development of an opportunity sites model based on current use and future TOD zoning potential as proposed in the City’s draft Hālawa Area TOD Plan. The preferred land-use scenario represents the most plausible land use pattern and density for State TOD and other landowner projects in the TOD priority area and provides a reasonable baseline for identifying infrastructure needs and costs for State TOD buildout over time.
Information on potential TOD buildout for the TOD priority area was obtained through consultation with State landowners and the development model utilized by the project team. The Hālawa-Stadium Permitted Interaction Group (Hālawa-Stadium Work Group) also supported further refinement of the preferred land use scenario by the consultant team, as needed, to incorporate additional project-specific information obtained from individual agencies.
State TOD Planning & Implementation Project, Island of O‘ahu

X
Kamehameha Hw y
HalawaHalawa
OCCCRelocation
PuuwaiMomi
Stadium Site
Aiea ElementarySchool
Aiea Intermed iate
WeblingElementary
Makalapa Elementary
Federal
Hālawa ViewApartments Stadium
MarketplaceStadium Mall
H-201
H-201
Salt Lake BlvdH-1
H-3
H-1
Sourc e : Esri, Maxar, Ge oEye , Earthstar Ge ograp hics, CN ES/Airb us DS, U SDA, U SGS, Ae roGRID,IGN , and the GIS U se r Com m unityPa
th: Q:\Oahu\OP TOD\GIS\Project\Halawa\Final Re port\3-1 HS_TOD Priority Are a.mxd
Assum p tion for analysis: N e w ve rtical sc hool locate d in Puuwai Mom i p arc e l. Re d e ve lop m e nt in Fe d e ral land s and single fam ily p arc e ls is not assum e d . Sourc e : ESRI Base Map s, 2016. City and County of Honolulu, 2013 and 2018. State of Hawai‘i, 2018. Disclaim e r: Grap hic has b e e n p re p are d for ge ne ral illustration p urp ose s only and should not b e use d for b ound ary inte rp re tations or othe r sp atial analysis. Sub je ct to change .
FIGURE 3-1:Hālawa-Stad ium TOD Priority Area:Stud y Bound ary and Major ProjectsSTATE OF HAW AI'I, OFFICE OF PLAN N IN G Island of O‘ahuN orth
Line ar Scale (fe e t)0 600 1,200 2,400
DATE: 7/22/2020
State TOD Planning & Implementation Project, O'ahu
LegendStud y Are a (white d ash)
X Rail StationRail LineTOD W alking Rad ius (0.25 & 0.5 m i)Major Road
State TOD Proje ctOthe r State LandExisting Tax Map Ke y (TMK) (2018)
State TOD Planning & Implementation Project, Island of O‘ahu

47
Figure 3-2: City Hālawa Area TOD Plan Land Use Diagram, Draft Final July 2017
State TOD Planning & Implementation Project, Island of O‘ahu
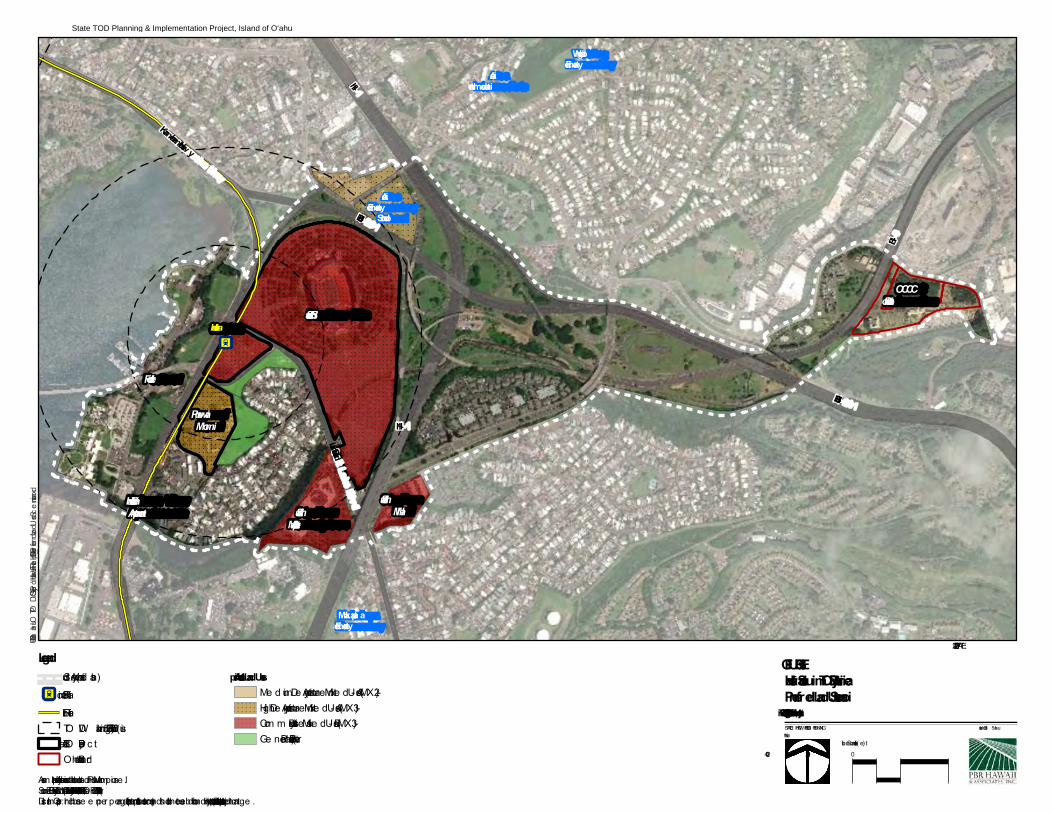
X
Kamehameha Hw y
HalawaHalawa
OCCCRelocation
PuuwaiMomi
Stadium Site
Aiea ElementarySchool
Aiea Intermed iate
WeblingElementary
Mak alap a Elementary
Federal
Hālawa ViewApartments Stadium
MarketplaceStadium Mall
H-201
H-201
Salt Lak e BlvdH-1
H-3
H-1
Path: Q:\Oahu\OP TO D\GIS\Project\Halawa\Final Re port\3-3 HS_Pre ferred Land Use Sce nario.mxd
Assum p tion for analysis: Ne w ve rtical sc hool locate d in Puuwai Mom i p arc e l.Sourc e : ESRI Base Map s, 2016. City and County of Honolulu, 2013 and 2018. State of Hawai‘i, 2018. Halawa Are a TO D Plan (Draft Final 2017).Disclaim e r: Grap hic has b e e n p re p are d for ge ne ral illustration p urp ose s only and should not b e use d for b ound ary inte rp re tations or othe r sp atial analysis. Sub je ct to c hange .
FIGURE 3-3:Hālawa-Stad ium TOD Priority Area:Preferred Land Use ScenarioSTATE O F HAW AI'I, O FFICE O F PLANNING Island of O ‘ahuNorth
Line ar Scale (fe e t)0 600 1,200 2,400
DATE: 7/22/2020
State TOD Planning & Imp lementation Project, O'ahu
LegendStud y Are a (white d ash)
X Rail StationRail LineTO D W alking Rad ius (0.25 & 0.5 m i)State TO D Proje ctO the r State Land
Anticip ated Land UsesMe d ium De nsity Ap artm e nt Mixe d -Use (AMX -2)High De nsity Ap artm e nt Mixe d -Use (AMX -3)Com m unity Busine ss Mixe d -Use (BMX -3)Ge ne ral Pre se rvation (P-2)
State TOD Planning & Implementation Project, Island of O‘ahu
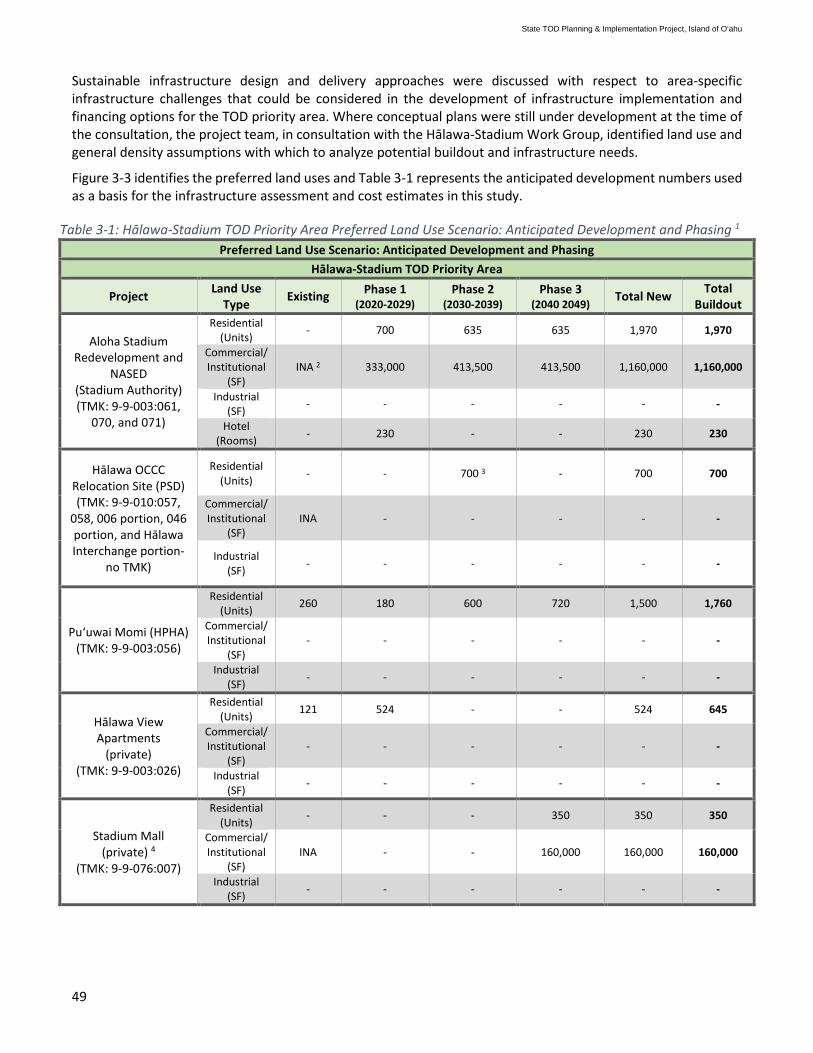
49
Sustainable infrastructure design and delivery approaches were discussed with respect to area-specific infrastructure challenges that could be considered in the development of infrastructure implementation and financing options for the TOD priority area. Where conceptual plans were still under development at the time of the consultation, the project team, in consultation with the Hālawa-Stadium Work Group, identified land use and general density assumptions with which to analyze potential buildout and infrastructure needs.
Figure 3-3 identifies the preferred land uses and Table 3-1 represents the anticipated development numbers used as a basis for the infrastructure assessment and cost estimates in this study.
Table 3-1: Hālawa-Stadium TOD Priority Area Preferred Land Use Scenario: Anticipated Development and Phasing 1 Preferred Land Use Scenario: Anticipated Development and Phasing
Hālawa-Stadium TOD Priority Area
Project Land Use Type Existing Phase 1
(2020-2029) Phase 2
(2030-2039) Phase 3
(2040 2049) Total New Total Buildout
Aloha Stadium Redevelopment and
NASED (Stadium Authority) (TMK: 9-9-003:061,
070, and 071)
Residential (Units) - 700 635 635 1,970 1,970
Commercial/Institutional
(SF) INA 2 333,000 413,500 413,500 1,160,000 1,160,000
Industrial (SF) - - - - - -
Hotel (Rooms) - 230 - - 230 230
Hālawa OCCC Relocation Site (PSD) (TMK: 9-9-010:057,
058, 006 portion, 046 portion, and Hālawa Interchange portion-
no TMK)
Residential (Units) - - 700 3 - 700 700
Commercial/Institutional
(SF) INA - - - - -
Industrial (SF) - - - - - -
Puʻuwai Momi (HPHA) (TMK: 9-9-003:056)
Residential (Units) 260 180 600 720 1,500 1,760
Commercial/Institutional
(SF) - - - - - -
Industrial (SF) - - - - - -
Hālawa View Apartments
(private) (TMK: 9-9-003:026)
Residential (Units) 121 524 - - 524 645
Commercial/Institutional
(SF) - - - - - -
Industrial (SF) - - - - - -
Stadium Mall (private) 4
(TMK: 9-9-076:007)
Residential (Units) - - - 350 350 350
Commercial/Institutional
(SF) INA - - 160,000 160,000 160,000
Industrial (SF) - - - - - -
State TOD Planning & Implementation Project, Island of O‘ahu
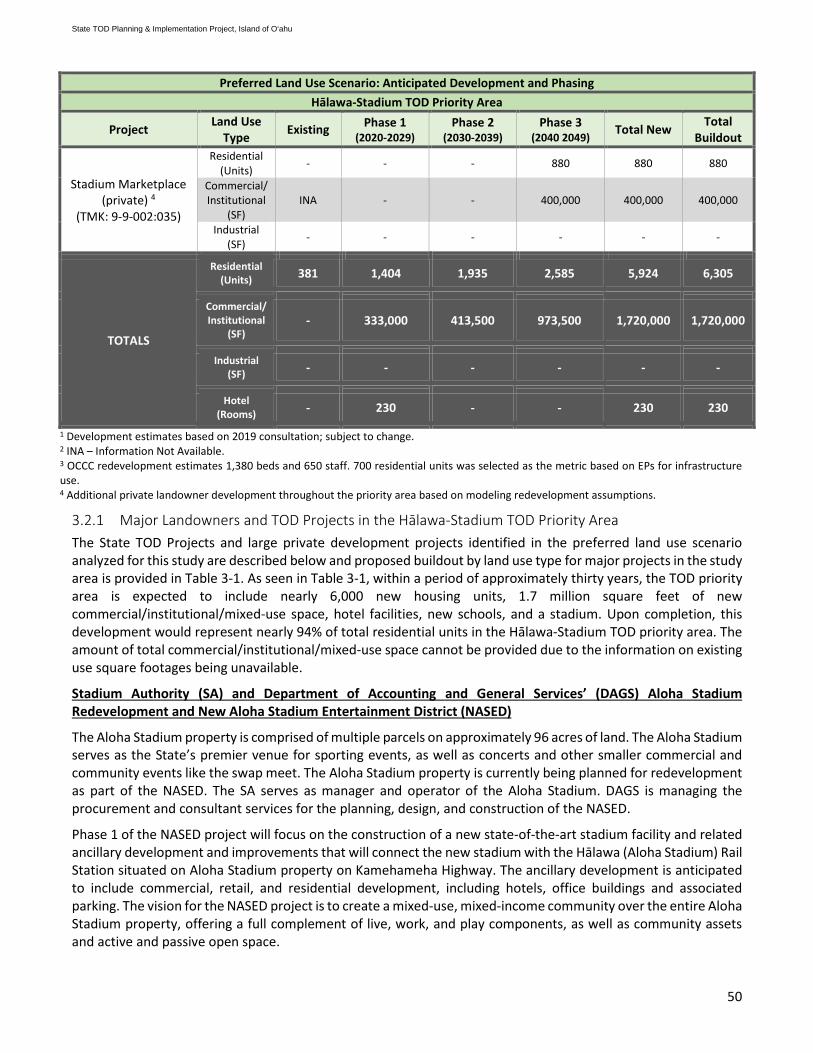
50
Preferred Land Use Scenario: Anticipated Development and Phasing Hālawa-Stadium TOD Priority Area
Project Land Use Type Existing Phase 1
(2020-2029) Phase 2
(2030-2039) Phase 3
(2040 2049) Total New Total Buildout
Stadium Marketplace (private) 4
(TMK: 9-9-002:035)
Residential (Units) - - - 880 880 880
Commercial/Institutional
(SF) INA - - 400,000 400,000 400,000
Industrial (SF) - - - - - -
TOTALS
Residential (Units) 381 1,404 1,935 2,585 5,924 6,305
Commercial/Institutional
(SF) - 333,000 413,500 973,500 1,720,000 1,720,000
Industrial (SF) - - - - - -
Hotel (Rooms) - 230 - - 230 230
1 Development estimates based on 2019 consultation; subject to change. 2 INA – Information Not Available. 3 OCCC redevelopment estimates 1,380 beds and 650 staff. 700 residential units was selected as the metric based on EPs for infrastructure use. 4 Additional private landowner development throughout the priority area based on modeling redevelopment assumptions.
3.2.1 Major Landowners and TOD Projects in the Hālawa-Stadium TOD Priority Area The State TOD Projects and large private development projects identified in the preferred land use scenario analyzed for this study are described below and proposed buildout by land use type for major projects in the study area is provided in Table 3-1. As seen in Table 3-1, within a period of approximately thirty years, the TOD priority area is expected to include nearly 6,000 new housing units, 1.7 million square feet of new commercial/institutional/mixed-use space, hotel facilities, new schools, and a stadium. Upon completion, this development would represent nearly 94% of total residential units in the Hālawa-Stadium TOD priority area. The amount of total commercial/institutional/mixed-use space cannot be provided due to the information on existing use square footages being unavailable.
Stadium Authority (SA) and Department of Accounting and General Services’ (DAGS) Aloha Stadium Redevelopment and New Aloha Stadium Entertainment District (NASED)
The Aloha Stadium property is comprised of multiple parcels on approximately 96 acres of land. The Aloha Stadium serves as the State’s premier venue for sporting events, as well as concerts and other smaller commercial and community events like the swap meet. The Aloha Stadium property is currently being planned for redevelopment as part of the NASED. The SA serves as manager and operator of the Aloha Stadium. DAGS is managing the procurement and consultant services for the planning, design, and construction of the NASED.
Phase 1 of the NASED project will focus on the construction of a new state-of-the-art stadium facility and related ancillary development and improvements that will connect the new stadium with the Hālawa (Aloha Stadium) Rail Station situated on Aloha Stadium property on Kamehameha Highway. The ancillary development is anticipated to include commercial, retail, and residential development, including hotels, office buildings and associated parking. The vision for the NASED project is to create a mixed-use, mixed-income community over the entire Aloha Stadium property, offering a full complement of live, work, and play components, as well as community assets and active and passive open space.
State TOD Planning & Implementation Project, Island of O‘ahu

51
Department of Public Safety (PSD) and Department of Accounting and General Services (DAGS) Hālawa OCCC Relocation
In 2018, it was announced that the DOA’s Animal Quarantine Center property is the preferred location for the new OCCC. The relocation of OCCC to Hālawa will result in a significant change in the use of those parcels and an increase in associated infrastructure will be needed to support the new facility.
The proposed OCCC will provide a modern facility that provides a safe, secure, healthy, and humane environment for the care and custody of adult offenders. The scenario analysis assumed that the Hālawa OCCC facility relocation of 1,044 new detention beds would occur in Phase 2 (2030-2039).
Hawaiʻi Public Housing Authority’s (HPHA) Puʻuwai Momi Public Housing
Located adjacent to the Aloha Stadium property, Puʻuwai Momi is comprised of 27 two- and three-story townhome buildings providing a total of 260 housing units with one- to four-bedrooms per unit. One single-story common area building houses administrative offices. HPHA proposes to redevelop the 11.5-acre site into a mixed-income, mixed-use development, with an increase in housing units. The scenario analyzed for the Puʻuwai Momi public housing property assumed that development would be built at the maximum allowable heights and FAR proposed for mixed-use residential development in the City’s draft Hālawa Area TOD Plan.
Department of Education (DOE)
Public school capacity will need to be increased to accommodate additional residential development in the TOD priority area. The DOE is considering vertical school options as well as increasing capacity at existing nearby schools, such as ‘Aiea Elementary School.
Private and Other Properties
In addition to the State TOD projects, the following private projects and parcels with development potential that were identified in the City’s draft Hālawa Area TOD Plan were included in the preferred development scenario to better understand the potential regional impacts to infrastructure. For the purposes of this study, no development was expected in the existing single-family and multi-family residential areas and federal lands within or in proximity to the TOD priority area.
• Hālawa View Apartments was modeled as being redeveloped in Phase 1 (2020-2029) with an increase of 524 residential units for total of almost 650. Hālawa View Apartments has been working with the HHFDC to get financing for redevelopment.
• Stadium Marketplace was modeled as being redeveloped in Phase 3 (2040-2049) to include business mixed-use with an emphasis on commercial, office and residential uses.
• Stadium Mall was modeled as being redeveloped in Phase 3 (2040-2049) to include business mixed-use with an emphasis on commercial, office, and residential uses.
3.3 Hālawa-Stadium TOD Priority Area Infrastructure Assessment While this study focuses on regional-serving infrastructure systems such as water, sewer, drainage, electrical, mobility and roadways to support the preferred land use scenario, individual projects will have infrastructure costs related to on-site improvements and connections to off-site systems, including upgrade or replacement of aged and undersized facilities. Public schools are also included in this study because TOD buildout in this TOD priority area will increase area student population and will require significant State investment to accommodate such growth.
The major regional infrastructure needs for the Hālawa-Stadium TOD priority area are summarized below, with associated costs detailed in Table 3-2. More information on the infrastructure needs and estimated costs can be found in the subconsultant studies in Appendix D through Appendix F.
State TOD Planning & Implementation Project, Island of O‘ahu
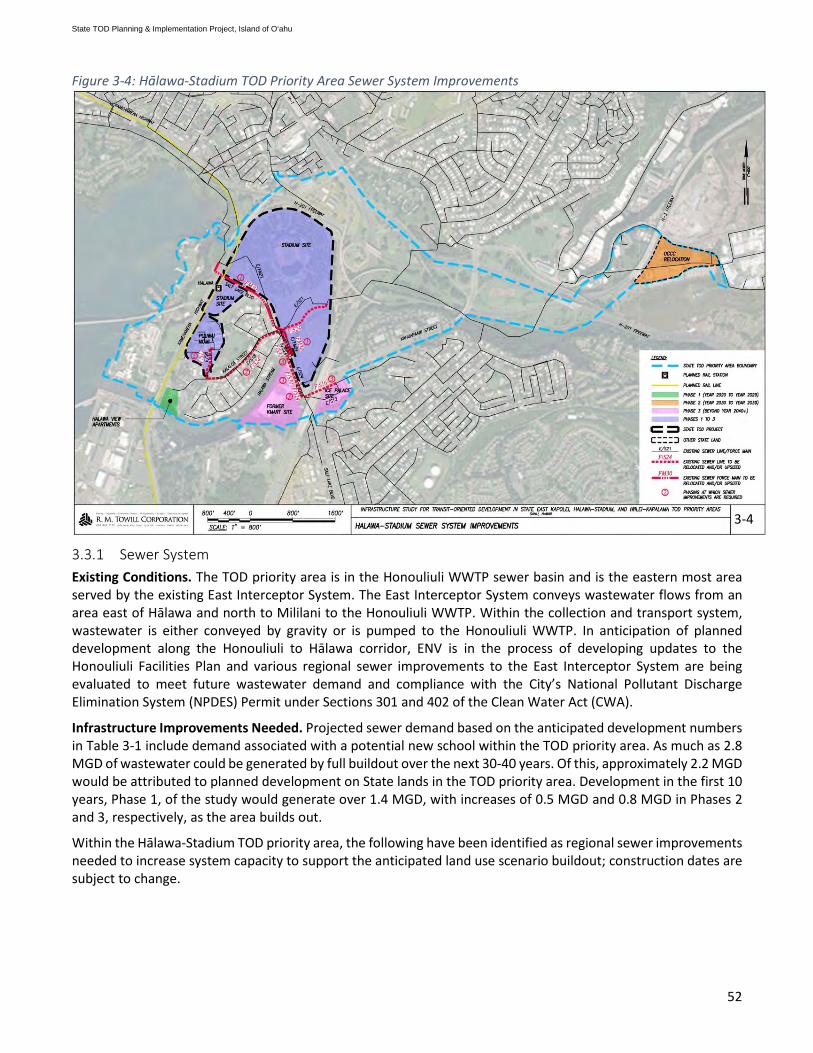
52
Figure 3-4: Hālawa-Stadium TOD Priority Area Sewer System Improvements
3.3.1 Sewer System Existing Conditions. The TOD priority area is in the Honouliuli WWTP sewer basin and is the eastern most area served by the existing East Interceptor System. The East Interceptor System conveys wastewater flows from an area east of Hālawa and north to Mililani to the Honouliuli WWTP. Within the collection and transport system, wastewater is either conveyed by gravity or is pumped to the Honouliuli WWTP. In anticipation of planned development along the Honouliuli to Hālawa corridor, ENV is in the process of developing updates to the Honouliuli Facilities Plan and various regional sewer improvements to the East Interceptor System are being evaluated to meet future wastewater demand and compliance with the City’s National Pollutant Discharge Elimination System (NPDES) Permit under Sections 301 and 402 of the Clean Water Act (CWA).
Infrastructure Improvements Needed. Projected sewer demand based on the anticipated development numbers in Table 3-1 include demand associated with a potential new school within the TOD priority area. As much as 2.8 MGD of wastewater could be generated by full buildout over the next 30-40 years. Of this, approximately 2.2 MGD would be attributed to planned development on State lands in the TOD priority area. Development in the first 10 years, Phase 1, of the study would generate over 1.4 MGD, with increases of 0.5 MGD and 0.8 MGD in Phases 2 and 3, respectively, as the area builds out.
Within the Hālawa-Stadium TOD priority area, the following have been identified as regional sewer improvements needed to increase system capacity to support the anticipated land use scenario buildout; construction dates are subject to change.
3-4
State TOD Planning & Implementation Project, Island of O‘ahu
53
Hālawa Wastewater Pump Station (WWPS) Force Main System Improvements
The project includes rehabilitation work for the existing force main and work at the pump station. Construction is to be completed at the time of this study.
Hālawa WWPS (New)
A new Hālawa WWPS with a higher capacity would replace the existing Hālawa WWPS. The location of the new Hālawa WWPS may remain the same or be relocated, depending on the layout of the proposed Aloha Stadium redevelopment. Construction is anticipated in Phase 2 (2030-2039).
Hālawa Force Main (New)
A new force main would replace the existing force main to the discharge junction box at the new Hālawa WWPS. Construction is anticipated in Phase 2 (2030-2039).
Because of the limited capacities of the sewer facilities downstream of the Hālawa-Stadium TOD priority area, in addition to the aforementioned regional sewer improvements, the following improvements to the East Interceptor system from Waipahu and Honouliuli to Hālawa are required to support development beyond the first phase of Aloha Stadium redevelopment. These regional sewer improvements will rehabilitate, upgrade, and/or expand the existing sewer conveyance system to accommodate the anticipated regional growth. Work on the system improvements is commencing from the Waipahu/Honouliuli end, with the Hālawa improvements scheduled for the final stages of the overall project. The costs of these regional improvements are provided, but they will not be borne solely by the developers within the Hālawa-Stadium TOD priority area.
Pearl City WWPS, Force Main, and Sewer System Alternative
The project includes miscellaneous site improvements to the existing WWPS. Construction is planned to be completed in the Phase 1 (2020-2029) timeframe.
Waipahu WWPS Force Main
A new third force main would be constructed for the Waipahu WWPS to provided improved system capacity and reliability. Construction is anticipated in Phase 1 (2020-2029).
Waipahu WWPS Force Mains Rehabilitation
The existing dual force mains at Waipahu WWPS would be rehabilitated. Construction is anticipated in Phase 1 (2020-2029).
Pearl City/Waipahu Sewer Tunnel
A new trenchless gravity sewer line from Pearl City WWPS to Waipahu WWPS would be constructed. Construction is anticipated in Phase 2 (2030-2039).
Pearl City/Waipahu Tunnel WWPS
A new pump station would be constructed in the vicinity of the existing Waipahu WWPS. Construction is anticipated in Phase 1 (2020-2029).
Pearl City and Waimalu Trunk Sewers
The project would upgrade or replace the existing trunk sewers between Waimalu WWPS and Hālawa WWPS. Construction is anticipated in Phase 2 (2030-2039).
Waimalu WWPS Force Main (New)
A new force main would replace the existing force main at the existing Waimalu WWPS. Construction is anticipated in Phase 2 (2030-2039).
State TOD Planning & Implementation Project, Island of O‘ahu
54
Waimalu WWPS Reconstruct/Replace
The existing Waimalu WWPS would be upgraded or replaced. Construction is anticipated in Phase 2 (2030-2039).
Based on communications with ENV and the sewer calculations, it is estimated that the existing regional sewer system can accommodate either the potential OCCC relocation project wastewater demand of 0.142 MGD or the improvement or replacement of the existing Aloha Stadium and ancillary facilities up to 0.142 MGD, but not the entire redevelopment of the Aloha Stadium property. The City DPP Wastewater Branch has approved a Sewer Connection Application (SCA) for the potential OCCC relocation and the Hālawa View Apartments projects.
Regional/project-related sewer improvements necessary to upgrade or realign existing wastewater facilities to connect to the planned Hālawa WWPS and force main are shown in Figure 3-4 (figure does not include ENV regional sewer improvements) and described below. The construction may follow the project phasing schedule.
• The existing force main through the Stadium site will have to be upsized. Due to Stadium construction and/or ancillary development, this force main may have to be relocated sooner to be in Phase 1 (2020-2029).
• The existing sewer lines along Kalaloa Street will have to be upsized to accommodate development at the Puʻuwai Momi site.
• The on-site sewer lines within the Stadium Mall site will have to be relocated in order to align with the proposed roadways.
• The existing gravity lines from the intersection of Salt Lake Boulevard and Kahuapāʻani Street to Hālawa WWPS will have to be sized to accommodate any future redevelopment of the Stadium Marketplace and Stadium Mall sites.
• The existing sewer line within the Stadium site, mauka of Hālawa Stream, will have to be upsized and relocated in order to align with the proposed roadways.
Other than the Hālawa View Apartments and potential OCCC relocation site, other projects must wait until the ENV regional wastewater improvements along Kamehameha Highway from Waipahu are completed, or construct temporary facilities for sewer collection. The estimated sewer demand of 0.142 MGD can possibly be allocated to the existing ancillary facilities (force main/gravity sewer line) as the proposed Aloha Stadium will generate less demand than the existing stadium. ENV is modelling the new sewer demand to determine how much additional development the existing system can accommodate. It may be possible to work with the City and DOH to construct and operate a temporary treatment plant on the Stadium site until the East Interceptor corridor improvement projects are completed. The temporary treatment plant would need to haul its solids to the Sand Island WWTP and may need to discharge raw or treated sewage in an emergency.
3.3.2 Water System Existing Conditions. The water system in the TOD priority area has capacity to serve the proposed development over all phases (2020 through 2049). The water systems in the Hālawa-Stadium TOD priority area are owned and operated by the BWS. The BWS has multiple projects in its capital program that will address current deficiencies and increase capacity.
Infrastructure Improvements Needed. Projected water demand is based on the anticipated development numbers in Table 3-1. Between 3.5 MGD average daily demand and up to 5.24 MGD maximum daily demand of water could be needed by full buildout over the next 30-40 years. Development in the first 10 years, Phase 1, of the study would require between 1.68 and 2.52 MGD, with an increase between 0.67 and 0.82 in Phase 2, and 1.15 and 1.73 in Phase 3, as the area builds out. The calculations also include a potential new school within the TOD priority area. The sizing of the water system must deliver the BWS required flow for fire protection.
State TOD Planning & Implementation Project, Island of O‘ahu
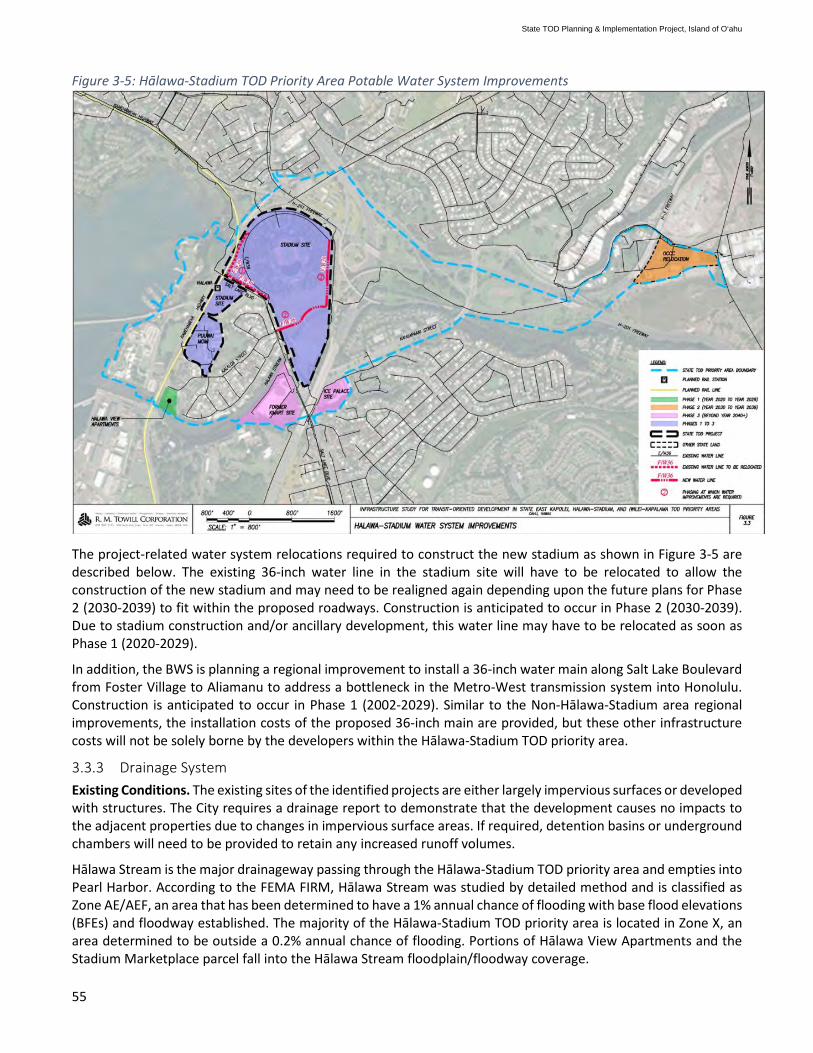
55
Figure 3-5: Hālawa-Stadium TOD Priority Area Potable Water System Improvements
The project-related water system relocations required to construct the new stadium as shown in Figure 3-5 are described below. The existing 36-inch water line in the stadium site will have to be relocated to allow the construction of the new stadium and may need to be realigned again depending upon the future plans for Phase 2 (2030-2039) to fit within the proposed roadways. Construction is anticipated to occur in Phase 2 (2030-2039). Due to stadium construction and/or ancillary development, this water line may have to be relocated as soon as Phase 1 (2020-2029).
In addition, the BWS is planning a regional improvement to install a 36-inch water main along Salt Lake Boulevard from Foster Village to Aliamanu to address a bottleneck in the Metro-West transmission system into Honolulu. Construction is anticipated to occur in Phase 1 (2002-2029). Similar to the Non-Hālawa-Stadium area regional improvements, the installation costs of the proposed 36-inch main are provided, but these other infrastructure costs will not be solely borne by the developers within the Hālawa-Stadium TOD priority area.
3.3.3 Drainage System Existing Conditions. The existing sites of the identified projects are either largely impervious surfaces or developed with structures. The City requires a drainage report to demonstrate that the development causes no impacts to the adjacent properties due to changes in impervious surface areas. If required, detention basins or underground chambers will need to be provided to retain any increased runoff volumes.
Hālawa Stream is the major drainageway passing through the Hālawa-Stadium TOD priority area and empties into Pearl Harbor. According to the FEMA FIRM, Hālawa Stream was studied by detailed method and is classified as Zone AE/AEF, an area that has been determined to have a 1% annual chance of flooding with base flood elevations (BFEs) and floodway established. The majority of the Hālawa-Stadium TOD priority area is located in Zone X, an area determined to be outside a 0.2% annual chance of flooding. Portions of Hālawa View Apartments and the Stadium Marketplace parcel fall into the Hālawa Stream floodplain/floodway coverage.
State TOD Planning & Implementation Project, Island of O‘ahu

56
Infrastructure Improvements Needed. In accordance with the City floodplain ordinance (ROH Chapter 21A, Flood Hazard Areas), the projects on these parcels must demonstrate that the proposed development will not cause an increase in BFEs.
In addition, the City has plans for a dredging project to remove the sediment built up in Hālawa Stream and restore stream capacity. At the time of the study, this project was pending due to permits required for ocean disposal of dredged sediment.
Figure 3-6: Hālawa-Stadium TOD Priority Area Flood Insurance Rate Map (FIRM)
3.3.4 Storm Water Quality Existing Conditions. The City adopted new guidelines for storm water quality that became effective on August 16, 2017. The new guidelines apply to all development and land disturbing activities within the City and establish minimum requirements for BMPs.
Post-construction treatment control BMPs may include retention measures, biofiltration, and BMPs for alternative compliance. The location and method of the post-construction treatment control BMPs will be determined during a project’s design phase.
Infrastructure Improvements Needed. The City will require storm water treatment to be installed on-site. Underground chambers may be the preferred option due to space limitations. As applicable, low impact development solutions, such as capturing runoff from rooftops or impervious surfaces and conveying them to rain gardens and catchment basins, and other green infrastructure solutions should be implemented.
3-6
State TOD Planning & Implementation Project, Island of O‘ahu

57
3.3.5 Roadways and Circulation Existing Conditions. The H-1 and H-201 Freeways (State) are the two primary corridors connecting the Hālawa-Stadium TOD priority area to downtown Honolulu, and Kamehameha Highway (State) is the major regional roadway.
Infrastructure Improvements Needed. For new development, the City will require a TIAR to evaluate the potential traffic impacts to the region. Potential improvements may include improvements to major intersections and roadways in the vicinity of each TOD project site that serve both regional and project-related purposes. The following items are identified in this study as potential improvements (Figure 3-7); final locations are subject to change.
Stadium Site Roadway Improvements • Stadium backbone road (Stadium loop, 84-foot ROW). • One intersection at Kamehameha Highway and one intersection at Salt Lake Boulevard connecting to
the Stadium backbone road, that goes through the existing stadium parcel. • Salt Lake Boulevard and Kamehameha Highway Intersection Improvements. • Makai backbone road from Salt Lake Boulevard to Kamehameha Highway (84-foot ROW), between
the existing residential neighborhood and the parcel where the rail station is located. • One intersection at Kamehameha Highway (north of Puʻuwai Momi) and one intersection at Salt Lake
Boulevard connecting to the makai backbone road. • New backbone road connecting Stadium site roadways to Salt Lake Boulevard (78-foot ROW). • One intersection at Salt Lake Boulevard connecting to the aforementioned new backbone road. • Pedestrian bridge improvements (pedestrian bridge overpass at H-1 Freeway from the Stadium site
to the existing ‘Aiea Elementary School). • Two new bridges over Hālawa Stream.
Puʻuwai Momi Roadway Improvements • One intersection at Kamehameha Highway. • One intersection at Kohomua Street.
Hālawa View Apartments Roadway Improvements • Minor improvements at Kalaloa Street and access driveway to the project site.
Stadium Marketplace Site Roadway Improvements • One intersection at Salt Lake Boulevard and Kahuapāʻani Street.
Stadium Mall Site Roadway Improvements • One intersection at Salt Lake Boulevard. • Two intersections at Kahuapāʻani Street.
Other Related Improvements These improvements are recommended to enhance the traffic flow in the Hālawa-Stadium TOD priority area and are not related to specific TOD projects (not shown in Figure 3-7).
• Salt Lake Boulevard Widening (Maluna Street to Ala Lilikoi Street, CIP). Costs are provided, but it should be noted that this cost should not be solely borne by the developers within the Hālawa-Stadium TOD priority area.
• Modifying the section of Salt Lake Boulevard between Kamehameha Highway and Puʻuloa Road to include bus only lanes and/or bicycle lanes to better serve the rail station and adjacent neighborhoods, and to improve non-auto access to the Hālawa-Stadium TOD priority area.
• Developing an off-street shared use path on the mauka side of Salt Lake Boulevard between Kamehameha Highway and Kahuapāʻani Street to help facilitate access to the Pearl Harbor Historic Trail.
State TOD Planning & Implementation Project, Island of O‘ahu

58
• Developing an off-street shared use path on the Diamond Head side of Kamehameha Highway from the Hālawa Stream bridge to the rail station to connect the TOD sites, and to help facilitate access to the Pearl Harbor Historic Trail.
• Providing additional traffic calming on Kalaloa Street to minimize impacts from additional vehicle traffic generated by State TOD development.
• Complete Streets improvements along Kamehameha Highway. • Elevated pedestrian crossings at Kamehameha Highway (3).
Figure 3-7: Hālawa-Stadium TOD Priority Area Roadway Improvements
Complete Streets Considerations As much as the confluence of State highways provide exceptional access to and from the Hālawa-Stadium TOD priority area, these wide, vehicular corridors also act as barriers to non-vehicular travel and create an unsafe environment for pedestrian-scale movement. Bicycle and pedestrian connections are limited in the Hālawa-Stadium TOD priority area. Existing facilities include the partially completed Pearl Harbor Historic Trail. The Pearl Harbor waterfront is generally disconnected from the rest of the TOD priority area, due to both current security considerations, as well as the potential danger in crossing Kamehameha Highway.
It is likely that in any scenario for development, an internal Complete Streets network would need to be created within the stadium site and other large parcels. Additional bicycle and pedestrian facilities should also better connect attractions and interface with the rail station and Aloha Stadium.
Other opportunities to enhance Complete Streets include:
• Providing extensive tree canopies to enhance the walking environment. • Ensuring that the potential OCCC relocation site does not preclude future bus transit access, and
support development of community shuttle service to connect to the future rail station.
3-7
State TOD Planning & Implementation Project, Island of O‘ahu

59
• Reconfiguring the one-way couplet around the proposed Hālawa (Aloha Stadium) rail station site to better connect the rail station to the Stadium site. This could include changing the one-way, ʻewa-bound section of Salt Lake Boulevard Diamond Head of Kamehameha Highway to a narrow two-lane street and making the makai section of Salt Lake Boulevard a two-way roadway.
3.3.6 Electrical and Telecommunication Systems Existing Conditions. HECO presently serves its residential, commercial, and government customers in the Hālawa-Stadium TOD priority area from their 12-kV distribution system. The distribution system generally consists of a blend of underground electric utility lines and overhead utility lines supported by both wood and metal joint poles, and includes regional transmission and sub-transmission power lines, a transmission substation, and three distribution substations in the Hālawa-Stadium TOD priority area. The power source for the 12-kV system are HECO’s existing Makalapa, Hila, ‘Aiea, and Quarry Substations10. Hawaiian Telcom and Charter Spectrum also provide telecommunications services via these overhead and underground lines.
For new development projects, Hawaiian Telcom and Charter Spectrum typically require developers to provide underground telecommunications duct system infrastructure, also known as support structures, but will provide the cabling at their cost. These utility companies can also replace the existing overhead and underground legacy trunking facilities with fiber optic cables and supplement existing fiber optic cable facilities with additional structures where they are deemed necessary.
Infrastructure Improvements Needed. The improvements proposed in this section focus primarily on electrical capacity because current telecommunication technology generally allows Hawaiian Telcom and Charter Spectrum to provide additional capacity to accommodate growth without new infrastructure. The necessary electrical improvements identified by this analysis include: increasing the capacity of the existing 12-kV distribution lines (reconductor or “up conductor”), providing additional 46-kV transmission lines, and providing distribution substation capacity, developing either a 138-25-kV substation or a 46-12-kV substation.
This study provides a regional perspective on redevelopment that could allow HECO to provide better input to the Aloha Stadium redevelopment master planning and other area redevelopment efforts. HECO’s current development policy is that HECO can only allocate funding for projects that HECO designs and pays for when it receives requests for service from developers. As a PUC-regulated utility, HECO must be agnostic in its allocation of capacity from its existing 12-kV distribution system, which might accommodate some of the smaller parcels within the TOD priority area.
Depending on the capacity of HECO’s existing 12-kV system, it appears that the redevelopment of the Aloha Stadium and/or Puʻuwai Momi properties would be the trigger for implementation of developer and HECO system improvements. If a substation site can be identified, the redevelopment of a combination of some of the smaller parcels may also trigger improvements.
Under an existing City ordinance related to special districts generally, projects located on properties within a special district would be required to install new electric and telecommunication facilities underground (Revised Ordinances of Honolulu, Chapter 22). Discussions regarding the implications of this ordinance to the City’s forthcoming TOD Special District are ongoing. Finally, a three- to five-year planning and approval process involving the PUC is necessary for any new substation or substantial substation upgrades, and PUC oversight would be triggered for any expenditure amount of $2.5 million or greater for necessary improvements and for approval of HECO rate-base funding.
12-kV Improvements
The proposed TOD redevelopment in most cases will significantly increase the proposed TOD priority area loading. Reconductoring of the 12-kV overhead lines will, at best, only provide incremental capacity gains.
10 Pending submission of service requests triggered by TOD redevelopment, a request has been made to HECO for verification of the remaining capacity in these substations. A response was received on December 12, 2019 and is included as Attachment 2 to Appendix E.
State TOD Planning & Implementation Project, Island of O‘ahu

60
To accommodate the increased load in the TOD priority area, HECO may indicate that a new 46-12-kV substation site be identified in the vicinity of the Aloha Stadium. There are several existing 46-kV sub-transmission lines that could be used to support a substation in that vicinity.
However, the Hālawa (Aloha Stadium) Transit Station, anticipated at the time of the study to come online in 2020, is also connected to the existing 12-kV infrastructure along Kamehameha Highway. While HECO has planned for this load, when operational it will likely require a significant amount of the existing spare capacity in the 12-kV distribution system. HECO may also determine that a second substation transformer is needed at the Quarry Substation11 in order to support the redevelopment of the State Animal Quarantine Station site for the new OCCC facility.
The costs for expansion of either a 12-kV or 25-kV distribution system are $3.5 million for off-site redevelopment costs of Puʻuwai Momi and $3 million for off-site redevelopment costs of Stadium Mall and Stadium Marketplace properties. Although the latter cost is the similar to the former, the length of the duct system and cabling requirement is higher. Some cost savings could be achieved if the duct line is built in conjunction with an underground 46-kV duct line in Salt Lake Boulevard. If a 46-kV underground duct line is not required, the Stadium Mall and Stadium Marketplace redevelopment off-site costs would cost $4 million.
Figure 3-8: Hālawa-Stadium TOD Priority Area Electrical System
25-kV Distribution Substation
Development of a 138-25-kV substation site on or near the Aloha Stadium property would provide sufficient capacity for the proposed redevelopment while creating additional capacity in the Hila, Quarry, and ʻAiea Substations when the existing loads are disconnected from the 12-kV system and transferred to this proposed new substation. There are currently 138-kV lines in and around the Hālawa-Stadium TOD priority area that could serve this substation, and the amount of underground 25-kV distribution
11 HECO has confirmed that the Quarry Substation is a “system” substation. HECO needs to evaluate whether additional land is required for installation of a second substation transformer.
State TOD Planning & Implementation Project, Island of O‘ahu
61
infrastructure necessary would be minimized because the majority of the proposed TOD redevelopment would be proximal. Another advantage would be increased capacity of the 12-kV distribution system to support redevelopment of the State Quarantine Station and other properties within the TOD priority area without the need to extend 25-kV infrastructure to the Quarantine Station site.
A possibility that should be investigated and discussed between DOT Highways and HECO for development of either a 138-25-kV or a 46-12-kV substation site to support the Hālawa-Stadium TOD priority area redevelopment would be the technical feasibility of utilizing space below the H-1 viaduct structure as a possible substation site. If feasible, this would limit the impact of the substation site requirement on developable land, but would likely necessitate seismic retrofitting of the viaduct structure and, to mitigate the risk of fire below the viaduct, require a substation building structure similar to Archer Substation and Kamoku Substation. HECO may determine that the costs for both the seismic retrofit and the substation building would need to be borne by contributions from the TOD priority area development.
If HECO elects to develop a 138-25-kV substation, it is probable that no additional infrastructure would need to be developed as there are currently two 138-kV circuits, Waiau-Makalapa #1 and #2, in the vicinity of the site.
46-kV Transmission Upgrades
If HECO elects to develop a 46-12-kV substation to support the TOD redevelopment, it would need to evaluate the capacity of the existing 46-kV lines and determine whether an additional 46-kV transmission alignment and circuit would be needed. If a new 46-kV circuit is required, it would originate from the Makalapa Transmission substation due to its proximity.
Since both Bougainville Drive and Salt Lake Boulevard currently contain overhead 138- and 46-kV lines, the additional 46-kV overhead line, if needed, could be either constructed overhead along the north (mauka) side of Salt Lake Boulevard or placed underground within Salt Lake Boulevard. The former appears possible as most of Salt Lake Boulevard appears to be outside of the TOD priority area. While the ROM cost to construct and cable an underground 46-kV duct line within Salt Lake Boulevard from Makalapa Transmission Substation to Aloha Stadium is $11 million.
The cost for installation of HECO 46-kV infrastructure and circuits is considered to be a “system” cost, which is typically borne by HECO, and depends on which alternative is deemed to be the most viable and cost efficient. However, once the City’s Hālawa TOD Special District is established, any 46-kV alignment under consideration would be required to be underground. It is not clear how costs would be distributed amongst TOD priority area landowners because the City, private developers, and HECO have not formally negotiated cost allocations. It is not apparent that HECO would agree to absorb the cost to underground a 46-kV line because under current City ordinances they can be placed overhead, leaving the bulk of any additional costs for undergrounding to be funded by some other means. For these reasons, the $11 million for undergrounding electrical lines was included in the cost estimate.
3.3.7 Public Schools Infrastructure Improvements Needed. The DOE is anticipating that one or two new schools will be needed to provide additional school capacity for future residential development and the forecasted population increase in the Hālawa-Stadium TOD priority area. The DOE is open to considering vertical school options on lands within the TOD priority area, but a vertical school would be subject to Board of Education approval. The DOE is also looking at the possibility of increasing school capacity at existing nearby schools. If a vertical school and/or increased capacity at other schools are not possible, approximately 12 acres of State land would need to be set aside for an elementary school site.
3.3.8 Sustainability and District Systems Existing Conditions. The infrastructure cost analysis in this study assumes no improvements in resource efficiency in buildings or infrastructure.
State TOD Planning & Implementation Project, Island of O‘ahu

62
Sustainable Infrastructure Recommendations. The significant control of the State’s developable properties presents a rare opportunity for visionary action that a smaller landowner would never be able to match. As such, efforts to construct new development to reasonably high performance standards, such as LEED Gold or better, offer opportunities to save significantly on infrastructure costs. More details on sustainable infrastructure systems s and specific observations on sustainability challenges and opportunities for the Hālawa-Stadium TOD priority area are provided in the Arup report, Sustainability and Neighborhood-Serving Systems, in Appendix H.
In particular, influxes of large numbers of visitors to the Hālawa-Stadium TOD priority area will strain neighborhood-serving systems that must meet peak demand on event occasions as well as lower daily demand throughout the year. This low utilization will challenge cost-effectiveness for systems that serve the site or event-visitor population. This challenge is exacerbated by the Hālawa-Stadium TOD priority area sewer system capacity limitations, significant cost of upgrades, and uncertainty in utilization associated with buildout progression. Given the high cost of wastewater infrastructure and the likely over-sizing based on inefficient water use assumptions, it is likely that a significant cost savings and low-risk path could be identified by planning for water treatment technologies and effluent management to achieve a targeted water treatment cost and associated capacity.
3.4 Hālawa-Stadium TOD Priority Area Rough Order of Magnitude (ROM) Infrastructure Costs As can be seen in Table 3-2, the infrastructure projects needed to support the anticipated land use scenario buildout in the Hālawa-Stadium TOD priority area were categorized in one of three categories as follows:
• Regional improvements: Improvements that will provide benefits and enhancement to the region, not just for specific TOD projects.
• Regional/project improvements: These are improvements consisting of on-site and/or off-site improvements required to support the project needs and benefit the region.
• Project improvements: These are typical on-site improvements consisting of backbone road, drainage, sewer, water, landscape, electrical, storm water quality, and other ancillary development that benefit the individual project.
Table 3-2 lists those projects determined to be regional improvements and regional/project improvements that significantly impact or are essential to TOD development in this priority area. The ROM infrastructure costs associated with these two categories of projects as well as for future DOE schools and regional electrical systems improvements needed in the Hālawa-Stadium TOD priority area were included in the cost and financing analysis of this study.
The infrastructure costs (2019 dollars), not including building, demolition, and soft costs, are summarized in Table 3-2 and the detailed breakdown is included in Appendix D, Attachment B.
As shown in Table 3-2, the infrastructure costs for Phases 1 (2020-2029), 2 (2030-2039), and 3 (2040-2049) of the Hālawa-Stadium TOD priority area are $158.8 million, $155.5 million, and $75.4 million, respectively. The regional electrical improvements costs associated with undergrounding are $11 million, but the phasing plan is undetermined at the time of this study. The total infrastructure costs anticipated for the Hālawa-Stadium TOD priority area are approximately $400.7 million.
The infrastructure improvement costs for Phases 1 (2020-2029) and 2 (2030-2039) of the Non-Hālawa-Stadium area are $241.3 million and $309.8 million, respectively. No costs are attributed to Phase 3 (2040-2049) of the Non-Hālawa-Stadium area. The total infrastructure costs anticipated for the Non-Hālawa-Stadium area are approximately $551.1 million.
The grand total infrastructure costs for all three phases for both the Hālawa-Stadium TOD priority area and Non-Hālawa-Stadium area is $951.8 million.
State TOD Planning & Implementation Project, Island of O‘ahu

63
Table 3-2: Hālawa-Stadium TOD Priority Area ROM Infrastructure Costs
Improvement Type Phase 1
(2020-2029) ($million)
Phase 2 (2030-2039)
($million)
Phase 3 (2040-2049)
($million)
TBD ($million) Funded
Hālawa-Stadium TOD Priority Area Improvements Regional Sewer Improvements
Hālawa WWPS Force Main System Improvements 4.6 - - - Yes Hālawa WWPS (New) - 18.26 - - No Hālawa FM (New) - 7.51 - - No Temporary WWTP for Phase 1 (2020-2029) 15.0 - - - No
Regional/Project Sewer Improvements Relocation and Upgrade of Existing Sewer 1 7.55 - - - No
Regional/Project Water Improvements Relocation and Upgrade of Existing Water Main (Stadium) - 4.43 - - No
Regional Drainage Improvements Hālawa Stream Dredging 5.1 - - - Yes
Regional/Project Roadway Improvements Complete Street along Kamehameha Highway 20.0 - - - No Elevated Pedestrian Crossings at Kamehameha Highway 11.0 - - - No Stadium Site 33.1 6.0 - - No Stadium Marketplace Site - - 6.0 - No
Regional Roadway Improvements Modify the section of Salt Lake Blvd. between Kamehameha Highway and Puʻuloa Road to include bus only and/or bicycle lanes 0.36 - - - No
Off-street shared use path on the mauka side of Salt Lake Blvd. between Kamehameha Highway and Kahuapāʻani Street 6.0 - - - No
Off-street shared use path on the Diamond Head side of Kamehameha Highway from the Hālawa Stream bridge to the rail station 4.8 - - - No
Traffic calming on Kalaloa Street 0.6 - - - No Regional Electrical Improvements
46-kV Underground Duct System 11.0 No Project Improvements (for individual projects) 2
Stadium Site 43.79 49.9 23.08 - No Puʻuwai Momi 2.76 9.37 10.85 - No
State TOD Planning & Implementation Project, Island of O‘ahu
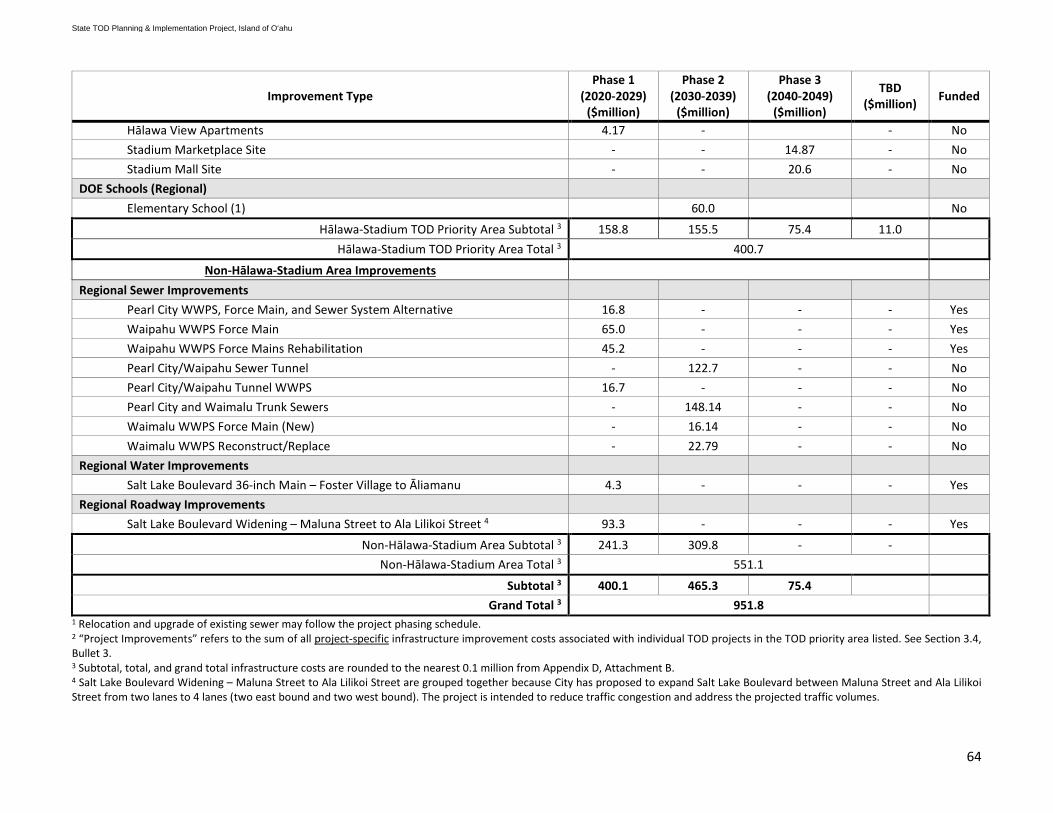
64
Improvement Type Phase 1
(2020-2029) ($million)
Phase 2 (2030-2039)
($million)
Phase 3 (2040-2049)
($million)
TBD ($million) Funded
Hālawa View Apartments 4.17 - - No Stadium Marketplace Site - - 14.87 - No Stadium Mall Site - - 20.6 - No
DOE Schools (Regional) Elementary School (1) 60.0 No
Hālawa-Stadium TOD Priority Area Subtotal 3 158.8 155.5 75.4 11.0 Hālawa-Stadium TOD Priority Area Total 3 400.7
Non-Hālawa-Stadium Area Improvements Regional Sewer Improvements
Pearl City WWPS, Force Main, and Sewer System Alternative 16.8 - - - Yes Waipahu WWPS Force Main 65.0 - - - Yes Waipahu WWPS Force Mains Rehabilitation 45.2 - - - Yes Pearl City/Waipahu Sewer Tunnel - 122.7 - - No Pearl City/Waipahu Tunnel WWPS 16.7 - - - No Pearl City and Waimalu Trunk Sewers - 148.14 - - No Waimalu WWPS Force Main (New) - 16.14 - - No Waimalu WWPS Reconstruct/Replace - 22.79 - - No
Regional Water Improvements Salt Lake Boulevard 36-inch Main – Foster Village to Āliamanu 4.3 - - - Yes
Regional Roadway Improvements Salt Lake Boulevard Widening – Maluna Street to Ala Lilikoi Street 4 93.3 - - - Yes
Non-Hālawa-Stadium Area Subtotal 3 241.3 309.8 - - Non-Hālawa-Stadium Area Total 3 551.1
Subtotal 3 400.1 465.3 75.4 Grand Total 3 951.8
1 Relocation and upgrade of existing sewer may follow the project phasing schedule. 2 “Project Improvements” refers to the sum of all project-specific infrastructure improvement costs associated with individual TOD projects in the TOD priority area listed. See Section 3.4, Bullet 3. 3 Subtotal, total, and grand total infrastructure costs are rounded to the nearest 0.1 million from Appendix D, Attachment B. 4 Salt Lake Boulevard Widening – Maluna Street to Ala Lilikoi Street are grouped together because City has proposed to expand Salt Lake Boulevard between Maluna Street and Ala Lilikoi Street from two lanes to 4 lanes (two east bound and two west bound). The project is intended to reduce traffic congestion and address the projected traffic volumes.
State TOD Planning & Implementation Project, Island of O‘ahu
65
3.5 Key Infrastructure Issues for the Hālawa-Stadium TOD Priority Area Sewer, roadways and circulation, and public schools are the key regional infrastructure issues that need to be addressed in the Hālawa-Stadium TOD priority area. Improving infrastructure capacity of these systems will be critical in achieving TOD potential. There are significant barriers and concerns related to the timing and concurrency of needed infrastructure improvements for TOD development in this area, particularly related to wastewater facility improvements needed to support full buildout here.
Sewer. The existing regional sewer system is near capacity and cannot accommodate the increased density envisioned for the TOD priority area under the City’s draft Hālawa Area TOD Plan or that of State projects in the area. In anticipation of future development in the Hālawa-Stadium area, ENV is in the process of developing updates to the Honouliuli Facilities Plan, and various regional sewer improvements are being evaluated to meet future wastewater demand and compliance with the City’s NPDES Permit under Section and Sections 301 and 402 of the CWA.
Other than Hālawa View Apartments and OCCC relocation, other projects must wait until the regional wastewater improvements along Kamehameha Highway from Waipahu/Honouliuli are completed or construct temporary facilities for sewer collection. The estimated sewer demand of 0.142 MGD can possibly be allocated to the existing ancillary facilities (force main/gravity sewer line) as the proposed Aloha Stadium will generate less demand than the existing. ENV is modelling the new sewer demand to determine how much additional development the existing system can accommodate. It may be possible to work with the City and DOH on a temporary treatment plant that could be constructed on the Stadium site. The temporary treatment plant would need to haul its solids to the Sand Island WWTP and may need to discharge raw or treated sewage in an emergency.
Water. The BWS has multiple projects in its capital program that will address current deficiencies and increase capacity. In addition, specific improvements will be needed to support the increased water needs, such as the relocation of the existing 36-inch water line in the Stadium site to allow the construction of the new stadium and to fit within the proposed roadways.
Roadways and Circulation. Highway and road configurations pose particular challenges to promoting non-vehicular travel and pedestrian movement, and connecting the various federal and State destinations surrounding the rail station. Another issue to be addressed is the need for a new urban street network with pedestrian amenities for safe, convenient access through the TOD priority area, as well as mitigating impacts on highway on- and off-ramp operations.
Potential roadway and circulation improvements may impact major intersections and roadways that serve both regional and project-related purposes in the vicinity of each TOD project site. For new development, the City will require a TIAR to evaluate the potential traffic impacts to the region. Improvements will be needed to existing intersections that connect to the main area connectors and new intersections will need to be constructed to connect to planned backbone roads. Other regional improvements include Salt Lake Boulevard Widening and intersection improvements that may be needed to accommodate an increase in traffic associated with full buildout.
Electrical. HECO has indicated that an additional distribution substation site will be required to support the proposed redevelopment within the Hālawa-Stadium TOD priority area. Once there is a signed development agreement, HECO will need to begin planning and implementing ways to increase capacity in the TOD priority area for the NASED.
Public Schools. The DOE is anticipating that one or two new schools will be needed to provide additional school capacity for future residential development and the forecasted population increase in the Hālawa-Stadium TOD priority area. Plans for increasing existing school capacity and/or the identification of potential sites for a new school will be needed to accommodate planned TOD-related residential development.
Sustainability and District Systems. The infrastructure cost analysis in this study assumes no improvements in resource efficiency in buildings or infrastructure. Efforts to construct new development to reasonably high
State TOD Planning & Implementation Project, Island of O‘ahu

66
performance standards, such as LEED Gold or better, offer opportunities to save significantly on infrastructure costs.
Additionally, influxes of large numbers of visitors to the Hālawa-Stadium TOD priority area will strain neighborhood-serving systems that must meet peak demand on event occasions as well as lower daily demand throughout the year. This low utilization will challenge cost-effectiveness for systems that serve the site or event-visitor population. This challenge is exacerbated by the Hālawa-Stadium TOD priority area sewer system capacity limitations, significant cost of upgrades, and uncertainty in utilization associated with buildout progression. Given the high cost of wastewater infrastructure and the likely over-sizing based on inefficient water use assumptions, it is likely that a significant cost savings and low-risk path could be identified by planning for water treatment technologies and effluent management to achieve a targeted water treatment cost and associated capacity.
Other considerations. There are also environmental concerns that must be accounted for in redevelopment plans, including the presence of a military fuel pipeline along Kamehameha Highway and a former dry-cleaning establishment on Navy property in proximity to State lands. Ground monitoring wells on the stadium property is part of an ongoing Comprehensive Environmental Response, Compensation, and Liability Act (CERCLA) requirement to detect any potential pipeline contamination, and environmental monitoring continues at the former dry-cleaning establishment site.
State TOD Planning & Implementation Project, Island of O‘ahu
67
4 Iwilei-Kapālama TOD Priority Area
The study boundary for the Iwilei-Kapālama TOD priority area shown in Figure 4-1 was selected to include planned State projects that will impact service capacity of shared regional infrastructure systems serving the area. The boundary was drawn to include privately-held properties with TOD potential that were identified in the City’s Kalihi and Downtown Neighborhood TOD Plans (both adopted in 2017).
The TOD priority area includes the large State landholdings of the HPHA’s Mayor Wright Homes, Kamehameha Homes, Kaahumanu Homes, and School Street Administrative Offices Redevelopment; DHHL’s properties along Kapālama Canal and the Moanalua Kai parcels on the far ‘ewa edge of the TOD priority area study boundary; UH’s HCC; HHFDC and DAGS’ Liliha Civic Center; the site of the PSD OCCC; and DOT Harbors. These State entities control several hundred acres of land identified for TOD development and harbor expansion, centered around four planned rail stations: Kūwili (Iwilei), Niuhelewai (Kapālama), Mokauea (Kalihi), and Kahauiki (Hauiki) (Middle Street Transit Center). Also within a half mile or 10-minute walk of the Iwilei-Kapālama TOD priority area study boundary are the planned Āhua (Lagoon Drive) rail station on the ‘ewa edge of the TOD priority area and Holau (Hōlau, Ho‘olau) (Chinatown) rail station on the Diamond Head edge of the TOD priority area.
Potential private redevelopment is identified in this study using an opportunity sites model based on current use and future TOD zoning potential of properties, as proposed in the City’s Kalihi and Downtown Neighborhood TOD Plans. Finally, single family residential areas are included in the Iwilei-Kapālama TOD priority area study boundary, however they are not included in the redevelopment analysis unless the lot is greater than five thousand square feet and has been identified for rezoning in the City Neighborhood TOD Plans.
4.1 TOD Context: City and County of Honolulu Kalihi and Downtown Neighborhood TOD Plans and Iwilei/Kapālama Transit-Oriented Development Infrastructure Needs Assessment
This study builds upon the groundwork of the City’s Kalihi and Downtown Neighborhood TOD Plans, which identify the character and intensity of TOD within the Plan areas and are based on land use and capacity analyses and community input as to how these communities may evolve over time. Preparation of the Kalihi and Downtown Neighborhood TOD Plans was started in 2011 and the Plans were adopted in March and August 2017 respectively, with many State landowners being active participants in the Plan preparation process. Diagrams of the land use plan for the Kalihi Neighborhood TOD Plan can be found in Figure 4-2, and for the Downtown Neighborhood TOD Plan in Figure 4-3.
The City’s Kalihi Neighborhood TOD Plan is founded on principles that seek to revitalize Kalihi by improving public safety and the quality of public spaces, maintaining and enhancing existing community diversity, and increasing connections and access throughout the Plan area. The City’s Downtown Neighborhood TOD Plan is founded on principles that seek to create a vibrant mixed-use downtown, provide a variety of housing choices, provide quality public improvements, and increase connections and access throughout the Plan area.
In developing these Neighborhood TOD Plans, the City identified the Iwilei and Kapālama TOD priority area as an area of major growth and undertook an infrastructure needs assessment to support TOD in proximity to these rail stations. This study utilized the City’s Iwilei/Kapālama Transit-Oriented Development Infrastructure Needs Assessment12 (IKTODINA, 2018) to identify some initial development numbers, which were then refined and verified with landowners throughout this study. Due to an expanded TOD priority area study boundary, the initial infrastructure needs identified in the City’s study were finetuned and some additional regional infrastructure needs identified. Lastly, this study also expanded on the City’s effort through the ongoing coordination and workshop efforts that brought landowners, departments, and agencies together to discuss and identify land uses, synergies, and impacts of overall regional development.
12 The City’s Iwilei-Kapālama Infrastructure Needs Assessment study can be found online at their website using the following link http://www.honolulu.gov/rep/site/dpptod/iwilei_docs/IKTODINA_No-appx_Aug2018.pdf.
State TOD Planning & Implementation Project, Island of O‘ahu

68
The development analysis for this study was completed in November 2019 using the Kalihi and Downtown Neighborhood TOD Plans (both adopted in 2017) as the basis for potential TOD buildout. Additional input from DPP’s TOD group was incorporated during the analysis portion of this study.
4.2 Preferred Land Use Scenario and TOD Potential
4.2.1 Preferred Land Use Scenario The preferred land use scenario for the Iwilei-Kapālama TOD priority area analyzed for this study represents anticipated development based on existing and proposed plans for State-owned parcels, a design charrette, and the development of an opportunity sites model based on current and future TOD zoning potential as proposed in the City’s Kalihi and Downtown Neighborhood TOD Plans. It represents the most plausible land use pattern and density for State TOD and other landowner projects in the TOD priority area and provides a reasonable baseline for identifying infrastructure needs and costs for State TOD buildout over time. Due to the low-density character of existing development, proximity to downtown, and State land ownership, the Iwilei-Kapālama TOD priority area is expected to experience the second highest levels of TOD in the rail corridor, behind East Kapolei.
Information on potential TOD buildout for the TOD priority area was obtained through consultation with State landowners, Kamehameha Schools, which is developing the Kapālama Kai project, and the development model utilized by the project team to identify redevelopment opportunity sites. The Iwilei-Kapālama Permitted Interaction Group (Iwilei-Kapālama Work Group) also supported further refinement of the preferred land use scenario by the consultant team, as needed, to incorporate additional project-specific information obtained from individual agencies.
In an urban design charrette, the Iwilei-Kapālama Work Group generated broad land use schemas for the TOD priority area that were then used to determine the potential TOD buildout by land use type and sustainable infrastructure design and delivery approaches were discussed with respect to area-specific infrastructure challenges. Where conceptual plans were still under development at the time of the consultation, the project team, in consultation with the Iwilei-Kapālama Work Group, identified land use and general density assumptions with which to analyze potential buildout and infrastructure needs.
Figure 4-4 identifies the preferred land uses and Table 4-1 represents the anticipated development numbers used as a basis for the infrastructure assessment and cost estimates in this study.
4.2.2 Potential Limitations to TOD Potential Hazardous Materials. Given the industrial history of the Iwilei-Kapālama area, hazardous materials, such as lead and petroleum, may be present on many parcels due to past or present activities. The presence of hazardous materials can pose air and water quality and fire threats, add time and cost to redevelopment and infrastructure projects, and limit siting of residential uses or school facilities.
Landowners should undertake a Phase I Environmental Site Assessment (ESA) to identify potential or existing contamination liabilities for properties that may have had industrial uses in the TOD priority area. Depending on the results of the Phase I ESA, a Phase II ESA may be required to test the chemical makeup and possible contamination of soil, groundwater, and vapor on-site.
Airport Airspace Limitations. Another limitation in the Iwilei-Kapālama TOD priority area is height restrictions imposed by Department of Transportation, Airports Division (DOT Airports)13 in accordance with Federal Aviation Administration guidelines for protection of airport air space of the Daniel K. Inouye International Airport. These height restrictions vary throughout the Iwilei-Kapālama TOD priority area due to horizontal and conical approach surfaces.
13 At the time of this study, the guidance for determination of height restrictions was the Airport Airspace Drawing approved by the Director of Transportation on April 7, 2017, within the Daniel K. Inouye International Airport Layout Plan.
State TOD Planning & Implementation Project, Island of O‘ahu
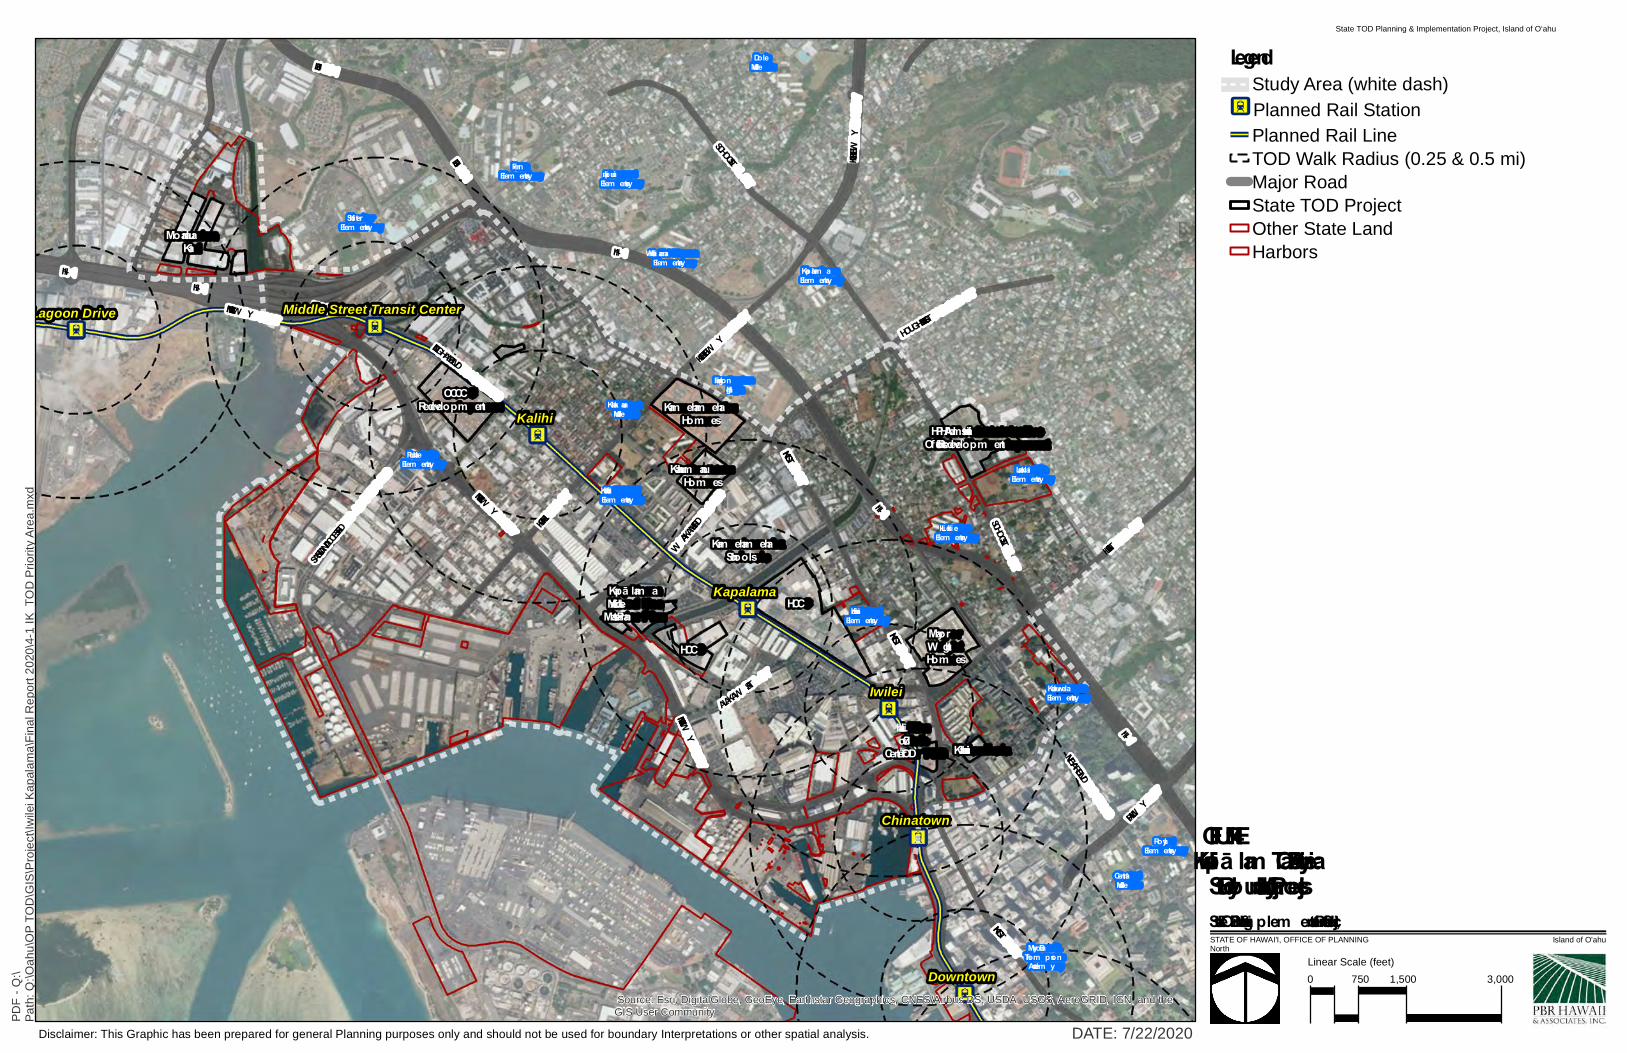
MoanaluaKai
OCCCRedevelopm ent Kam eham eha
Hom es
Kaahum anuHom es
Kapā lam aMixed UseMaster Plan
HCC
MayorW rightHom es
HPHA Adm inistrativeOffices Redevelopm ent
LilihaCivic
Center TOD Kalanihuia
HCC
Kam eham ehaSchools
H-1
NIMITZ HW Y
H-201
LIKELIKE HWY
LIKELIKE HWY
DILLINGHAM BLVD
PALI HWY
NIMITZ HW Y
H-201
H-1
H-1
H-1
H-1
KALIHI ST
HOUGHTAILIN
G ST
LILIHA ST
SCHOOL ST
SCHOOL ST
KING ST
VINEYARD BLVD
W AIAKAMILO RD
KING ST
SAND ISLAND ACCESS RD
NIMITZ HW Y
KING STALAKAWA ST
Dole Middle
Royal Elem entary
Central Middle
Kalak aua Middle
Fern Elem entary
Farrington High
Shafter Elem entary
Puuhale Elem entary
Linapuni Elem entary
Lik elik e Elem entary
Lanak ila Elem entary
Kapalam a Elem entary
Kaiulani Elem entary
Kauluwela Elem entary
Kalihi Kai Elem entary
Kalihi W aena Elem entary
Myron B. Thom pson Academ y
KAM
Kalihi
Iwilei
Kapalama
Downtown
Chinatown
Lagoon Drive Middle Street Transit Center
Source: Esri, DigitalGlobe, GeoEye, Earthstar Geographics, CNES/Airbus DS, USDA, USGS, AeroGRID, IGN, and theGIS User Community
STATE OF HAWAI'I, OFFICE OF PLANNING Island of O'ahu
FIGURE 4-1:Iwilei-Kapā lam a TOD Priority Area:Study Boundary and Major ProjectsNorth
Linear Scale (feet)0 750 1,500 3,000
Path
: Q:\O
ahu\
OP
TOD
\GIS
\Pro
ject
\Iwile
i Kap
alam
a\Fi
nal R
epor
t 202
0\4-
1 IK
_TO
D P
riorit
y Ar
ea.m
xdPD
F - Q
:\
Disclaimer: This Graphic has been prepared for general Planning purposes only and should not be used for boundary Interpretations or other spatial analysis. DATE: 7/22/2020
State TOD Planning & Im plem entation Project, O'ahu
LegendStudy Area (white dash)
X Planned Rail StationPlanned Rail LineTOD Walk Radius (0.25 & 0.5 mi)Major RoadState TOD ProjectOther State LandHarbors
State TOD Planning & Implementation Project, Island of O‘ahu

70
This page intentionally left blank.
State TOD Planning & Implementation Project, Island of O‘ahu

71
Figure 4-2: City Kalihi Neighborhood TOD Plan, Adopted March 2017
State TOD Planning & Implementation Project, Island of O‘ahu

72
Figure 4-3: City Downtown Neighborhood TOD Plan, Adopted August 2017
State TOD Planning & Implementation Project, Island of O‘ahu

MoanaluaKai
OCCCRedevelopm ent Kam eham eha
Hom es
Kaahum anuHom es
Kapā lam aMixed UseMaster Plan
HCC
MayorW rightHom es
HPHA Adm inistrativeOffices Redevelopm ent
LilihaCivic
Center TOD Kalanihuia
HCC
Kam eham ehaSchools
Dole Middle
Linapuni Elem entary
Fern Elem entary
Shafter Elem entary
Puuhale Elem entary
Kalak aua Middle
Kalihi Kai Elem entary
Farrington High
Kapalam a Elem entary
Lanak ila Elem entary
Lik elik e Elem entary
Kaiulani Elem entary
Kauluwela Elem entary
Royal Elem entary
Central Middle
Myron B. Thom pson Academ y
H-1
NIMITZ HW Y
H-201
LIKELIKE HWY
LIKELIKE HWY
DILLINGHAM BLVD
PALI HWY
NIMITZ HW Y
H-201
H-1
H-1
H-1
H-1
KALIHI ST
HOUGHTAILIN
G ST
LILIHA ST
SCHOOL ST
SCHOOL ST
KING ST
VINEYARD BLVD
W AIAKAMILO RD
KING ST
SAND ISLAND ACCESS RD
NIMITZ HW Y
KING STALAKAWA ST
Kalihi
Iwilei
Kapalama
Downtown
Chinatown
Lagoon Drive Middle Street Transit Center
Source: Esri, DigitalGlobe, GeoEye, Earthstar Geographics, CNES/Airbus DS, USDA, USGS, AeroGRID, IGN, and theGIS User Community
STATE OF HAWAI'I, OFFICE OF PLANNING Island of O'ahu
FIGURE 4-4:Iwilei-Kapā lam a TOD Priority Area:Preferred Land Use ScenarioNorth
Linear Scale (feet)0 750 1,500 3,000
Path
: Q:\O
ahu\
OP
TOD
\GIS
\Pro
ject
\Iwile
i Kap
alam
a\Fi
nal R
epor
t 202
0\4-
4 IK
_Pre
ferre
d La
nd U
se S
cena
rio.m
xdPD
F - Q
:\
Disclaimer: This Graphic has been prepared for general Planning purposes only and should not be used for boundary Interpretations or other spatial analysis. DATE: 7/22/2020
State TOD Planning & Im plem entation Project, O'ahu
LegendStudy Area (white dash)
X Planned Rail StationPlanned Rail LineTOD Walk Radius (0.25 & 0.5 mi)Major RoadState TOD ProjectOther State LandHarbors
Anticipated Land UsesIndustrialIndustrial Mixed-Use ResidentialHigh Density Residential Public ParkPublic/Quasi Public
! ! ! !
! ! ! !
! ! ! ! Urban Mixed-Use High! ! ! !
! ! ! ! Urban Mixed-Use Medium
State TOD Planning & Implementation Project, Island of O‘ahu

74
This page intentionally left blank.
State TOD Planning & Implementation Project, Island of O‘ahu
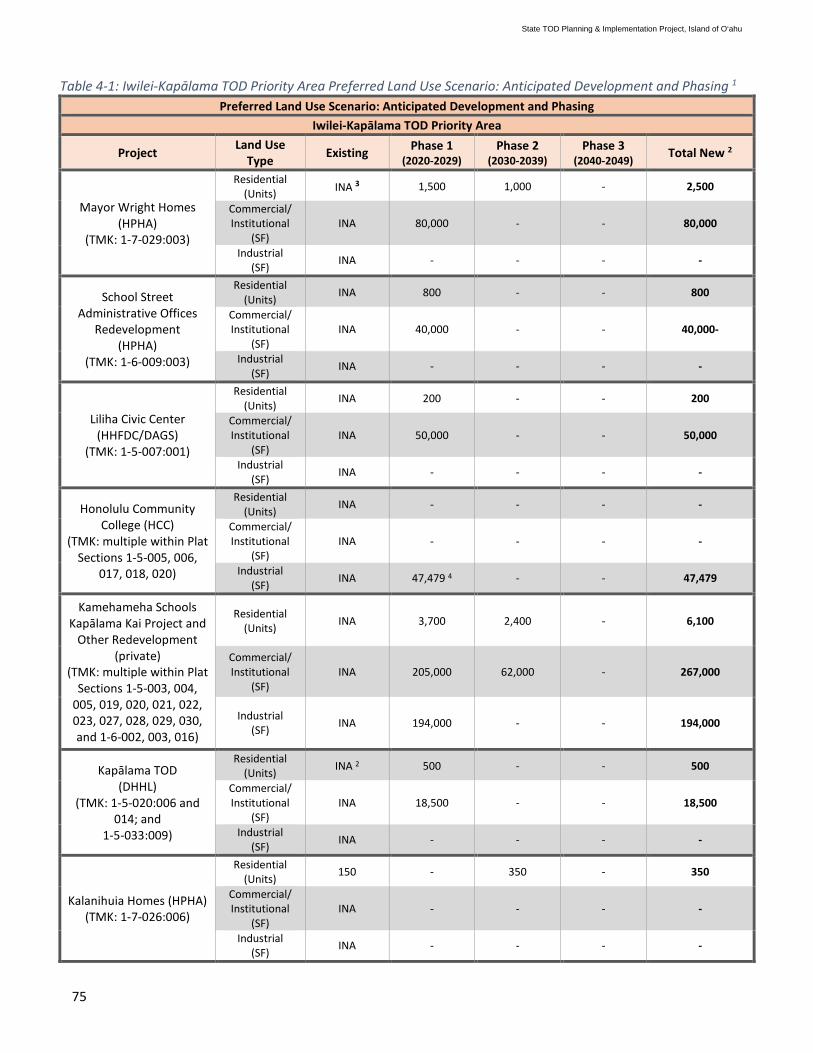
75
Table 4-1: Iwilei-Kapālama TOD Priority Area Preferred Land Use Scenario: Anticipated Development and Phasing 1 Preferred Land Use Scenario: Anticipated Development and Phasing
Iwilei-Kapālama TOD Priority Area
Project Land Use Type Existing Phase 1
(2020-2029) Phase 2
(2030-2039) Phase 3
(2040-2049) Total New 2
Mayor Wright Homes (HPHA)
(TMK: 1-7-029:003)
Residential (Units) INA 3 1,500 1,000 - 2,500
Commercial/ Institutional
(SF) INA 80,000 - - 80,000
Industrial (SF) INA - - - -
School Street Administrative Offices
Redevelopment (HPHA)
(TMK: 1-6-009:003)
Residential (Units) INA 800 - - 800
Commercial/ Institutional
(SF) INA 40,000 - - 40,000-
Industrial (SF) INA - - - -
Liliha Civic Center (HHFDC/DAGS)
(TMK: 1-5-007:001)
Residential (Units) INA 200 - - 200
Commercial/ Institutional
(SF) INA 50,000 - - 50,000
Industrial (SF) INA - - - -
Honolulu Community College (HCC)
(TMK: multiple within Plat Sections 1-5-005, 006,
017, 018, 020)
Residential (Units) INA - - - -
Commercial/ Institutional
(SF) INA - - - -
Industrial (SF) INA 47,479 4 - - 47,479
Kamehameha Schools Kapālama Kai Project and
Other Redevelopment (private)
(TMK: multiple within Plat Sections 1-5-003, 004,
005, 019, 020, 021, 022, 023, 027, 028, 029, 030, and 1-6-002, 003, 016)
Residential (Units) INA 3,700 2,400 - 6,100
Commercial/ Institutional
(SF) INA 205,000 62,000 - 267,000
Industrial (SF) INA 194,000 - - 194,000
Kapālama TOD (DHHL)
(TMK: 1-5-020:006 and 014; and
1-5-033:009)
Residential (Units) INA 2 500 - - 500
Commercial/ Institutional
(SF) INA 18,500 - - 18,500
Industrial (SF) INA - - - -
Kalanihuia Homes (HPHA) (TMK: 1-7-026:006)
Residential (Units) 150 - 350 - 350
Commercial/ Institutional
(SF) INA - - - -
Industrial (SF) INA - - - -
State TOD Planning & Implementation Project, Island of O‘ahu
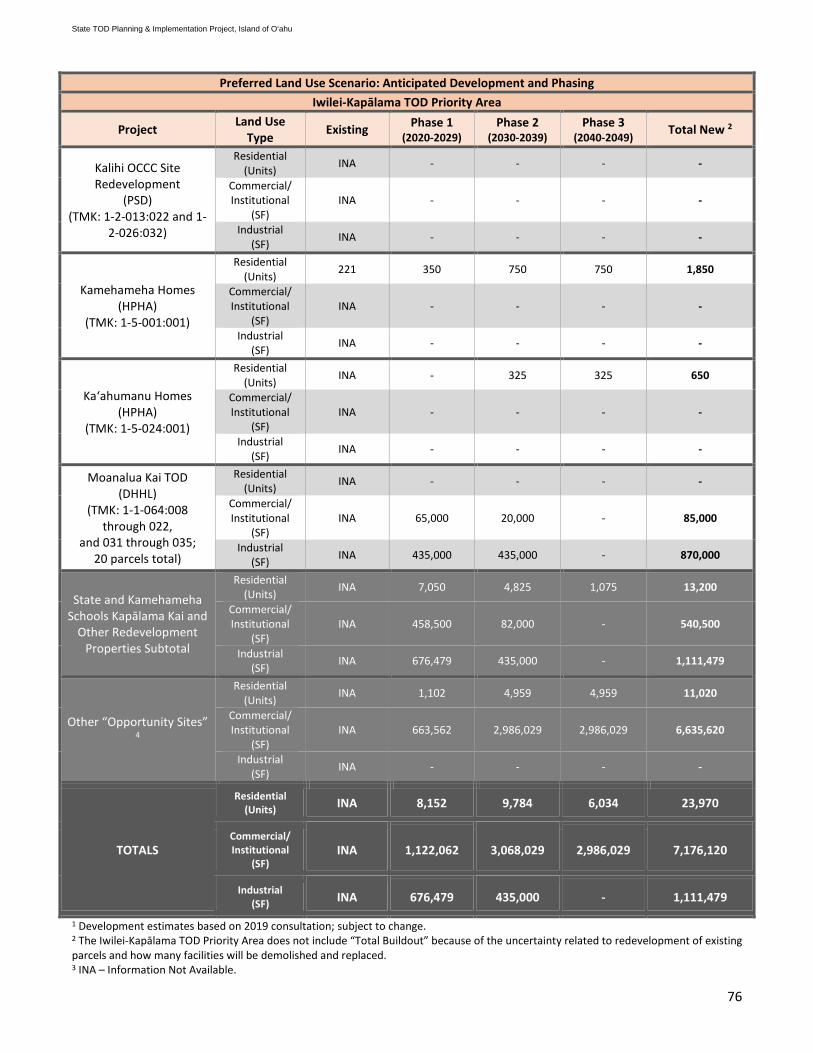
76
Preferred Land Use Scenario: Anticipated Development and Phasing Iwilei-Kapālama TOD Priority Area
Project Land Use Type Existing Phase 1
(2020-2029) Phase 2
(2030-2039) Phase 3
(2040-2049) Total New 2
Kalihi OCCC Site Redevelopment
(PSD) (TMK: 1-2-013:022 and 1-
2-026:032)
Residential (Units) INA - - - -
Commercial/ Institutional
(SF) INA - - - -
Industrial (SF) INA - - - -
Kamehameha Homes (HPHA)
(TMK: 1-5-001:001)
Residential (Units) 221 350 750 750 1,850
Commercial/ Institutional
(SF) INA - - - -
Industrial (SF) INA - - - -
Kaʻahumanu Homes (HPHA)
(TMK: 1-5-024:001)
Residential (Units) INA - 325 325 650
Commercial/ Institutional
(SF) INA - - - -
Industrial (SF) INA - - - -
Moanalua Kai TOD (DHHL)
(TMK: 1-1-064:008 through 022,
and 031 through 035; 20 parcels total)
Residential (Units) INA - - - -
Commercial/ Institutional
(SF) INA 65,000 20,000 - 85,000
Industrial (SF) INA 435,000 435,000 - 870,000
State and Kamehameha Schools Kapālama Kai and
Other Redevelopment Properties Subtotal
Residential (Units) INA 7,050 4,825 1,075 13,200
Commercial/ Institutional
(SF) INA 458,500 82,000 - 540,500
Industrial (SF) INA 676,479 435,000 - 1,111,479
Other “Opportunity Sites” 4
Residential (Units) INA 1,102 4,959 4,959 11,020
Commercial/ Institutional
(SF) INA 663,562 2,986,029 2,986,029 6,635,620
Industrial (SF) INA - - - -
TOTALS
Residential (Units) INA 8,152 9,784 6,034 23,970
Commercial/ Institutional
(SF) INA 1,122,062 3,068,029 2,986,029 7,176,120
Industrial (SF) INA 676,479 435,000 - 1,111,479
1 Development estimates based on 2019 consultation; subject to change. 2 The Iwilei-Kapālama TOD Priority Area does not include “Total Buildout” because of the uncertainty related to redevelopment of existing parcels and how many facilities will be demolished and replaced. 3 INA – Information Not Available.
State TOD Planning & Implementation Project, Island of O‘ahu
77
4 According to available information at the time of this study, the proposed facility a laboratory for science purposes. While the HCC facility is an institutional use, the infrastructure required for the proposed laboratory facility are most similar to industrial infrastructure requirements which is why it was classified as such in this analysis. 5 Estimated additional private landowner development based on development model assumptions for other land uses contained in the City’s respective TOD Plans overlaying this TOD priority area.
Landowners should consult with DOT Airports as soon as feasible in the redevelopment project planning process to provide an opportunity for review of the airspace constraints and single-engine out policies for individual aircraft operating at Daniel K. Inouye International Airport.
4.2.3 Major Landowners and TOD Projects in Iwilei-Kapālama TOD Priority Area The State TOD Projects and large private development projects identified in the preferred land use scenario analyzed for this study are described below and proposed buildout by land use type for major projects in the study area is provided in Table 4-1. As seen in Table 4-1, within a period of approximately thirty years, the TOD priority area is expected to include nearly 24,000 new housing units, nearly 7.2 million square feet of new commercial/institutional/mixed-use space, and nearly 1.1 million square feet of new industrial space. Overall, the number of housing units is anticipated to largely increase, while the total amount of commercial and industrial space is expected to remain constant or decrease as these uses transition to residential or mixed-uses.
Upon completion, the State and Kamehameha Schools’ Kapālama Kai and other redevelopment properties would represent 55% of overall new residential development and 7.5% of overall new commercial/institutional/mixed-use space within the Iwilei-Kapālama TOD priority area. The amount of total development by type cannot be provided due to discrepancies in available data on existing facility square footage in the Iwilei-Kapālama TOD priority area.
Hawaiʻi Public Housing Authority (HPHA)
HPHA has five properties within the Iwilei-Kapālama TOD priority area that are expected to redevelop with higher density residential uses that will increase affordable units. These include Mayor Wright Homes, the HPHA School Street Administrative Offices, Kalanihuia Homes, Kaahumanu Homes, and Kamehameha Homes.
The 15-acre Mayor Wright Homes development currently has 364 federal low-income public housing units. It is expected to be redeveloped into 2,500 mixed income residential units and commercial spaces. The School Street Administrative Offices parcel (12.5 acres) is currently used for HPHA offices and low-density public housing. The proposed redevelopment would include new offices, increased residential units, and some commercial development. While not as far along in the planning and redevelopment process, the other three HPHA properties – the 1.9-acre Kalanihuia Homes, 7.4-acre Kaahumanu Homes, and 17-acre Kamehameha Homes – are federal low-income public housing complexes that are expected to be upgraded to increase the number of residential units.
Hawaiʻi Housing Finance and Development Corporation (HHFDC) and Department of Accounting and General Services (DAGS)
The 3.8-acre Liliha Civic Center property, located across from the planned Kūwili (Iwilei) rail station, is partially used for offices, while most of the property remains vacant. HHFDC and DAGS are coordinating redevelopment of this parcel as a TOD mixed-use project with offices, commercial, affordable housing, and other incidental uses.
University of Hawaiʻi (UH) Honolulu Community College (HCC)
The UH HCC serves higher educational uses and plans to expand their campus in the future. At the time of this study, HCC has no specific TOD plans and only anticipates adding a single new educational building in their campus. However, given the prime location adjacent to the planned Niuhelewai (Kapālama) rail station, HCC conducted a study of TOD options related to their educational mission.
State TOD Planning & Implementation Project, Island of O‘ahu

78
Kamehameha Schools Kapālama Kai Project and Other Redevelopment
Kamehameha Schools owns over 100 acres of property in the Iwilei-Kapālama TOD priority area, with a large portion adjacent to the planned Niuhelewai (Kapālama) rail station. Given the amount of landholdings and their current master planning efforts in the area, Kamehameha Schools was the only major private landowner that provided additional input to this study on their development plans in the Iwilei-Kapālama TOD Priority area. Their plans include TOD mixed-use development with commercial and residential uses and maintenance of industrial uses on some of their properties in the area.
Department of Hawaiian Home Lands (DHHL)
DHHL has two major landholdings in the Iwilei-Kapālama TOD Priority area – the Kapālama properties along Kapālama Canal and the Moanalua Kai properties in the Shafter Flats area.
The Kapālama TOD landholdings are comprised of three parcels totaling 5 acres that are used for commercial and warehouse use. The DHHL Kapālama parcels will take advantage of TOD opportunities due to their location near the planned Niuhelewai (Kapālama) rail station, with property use expected to shift from mostly commercial and warehouse use, to business mixed-use with housing.
The Moanalua Kai landholdings are comprised of twenty parcels totaling 14 acres that are used for industrial and commercial warehousing. The DHHL Moanalua Kai parcels will maintain their industrial character, with an opportunity to be redeveloped as a higher-density mixed-use industrial hub, with commercial and retail options.
Department of Public Safety (PSD) and Department of Accounting and General Services (DAGS)
The existing OCCC correctional facility is located on approximately 16 acres within the Iwilei-Kapālama TOD priority area. It is the largest jail facility in the State, with 950 beds. However, the existing facility is undersized for the current and projected population, so efforts have been underway to replace the OCCC. In 2018, it was announced that a new site in Hālawa was selected for the relocation of OCCC. PSD and DAGS have explored the possible redevelopment of the existing OCCC property to include TOD once the facility is relocated. Since redevelopment plans have not been finalized, Table 4-1 does not identify anticipated development or phasing for the OCCC property.
Department of Education (DOE)
The DOE expects the highest growth in student enrollment in the areas closest to the nine train stations between Middle Street and Ala Moana Shopping Center, which includes the four stations of the Iwilei-Kapālama TOD priority area. The DOE schools serving this area are Kalihi Kai Elementary, Pu‘uhale Elementary, Kaiulani Elementary, Likelike Elementary, Kauluwela Elementary, Kalākaua Middle, Central Middle, Farrington High, and McKinley High. These schools are located within the Kalihi-to-Ala Moana School Impact District which was approved to leverage fees from residential development to accommodate the increase in new families and school enrollments in this high-growth region. More information can be found in Section 4.3.7.
Due to the anticipated amount of development and the forecasted population increase, the DOE is anticipating that at least two new schools will be needed in the Iwilei-Kapālama TOD priority area. The DOE is considering vertical school options as well as increasing capacity at existing nearby schools.
4.3 Iwilei-Kapālama TOD Priority Area Infrastructure Assessment While this study focuses on regional-serving infrastructure systems such as water, sewer, drainage, electrical, roadways and circulation to support the preferred land use scenario, individual projects will have infrastructure costs related to on-site improvements and connection to off-site systems including improvements to upgrade or replace aged and undersized facilities. Public schools are also included in this study because TOD buildout in this TOD priority area will increase area student population and will require significant State investment to accommodate such growth.
State TOD Planning & Implementation Project, Island of O‘ahu
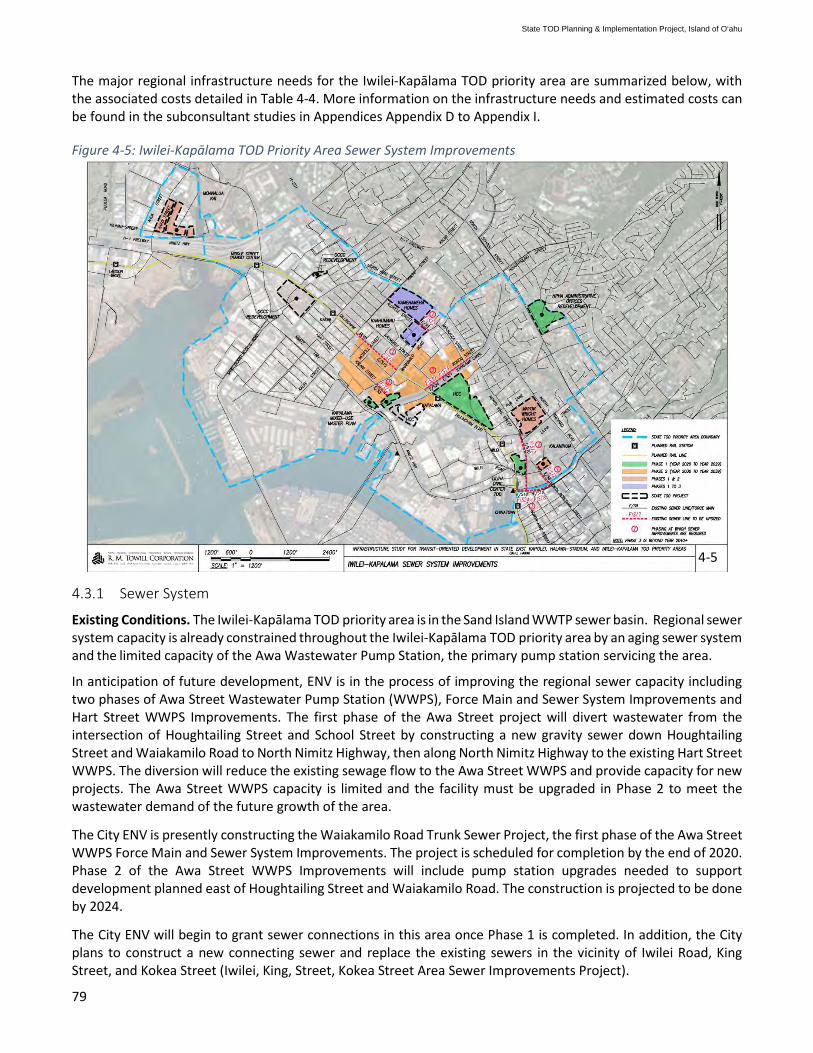
79
The major regional infrastructure needs for the Iwilei-Kapālama TOD priority area are summarized below, with the associated costs detailed in Table 4-4. More information on the infrastructure needs and estimated costs can be found in the subconsultant studies in Appendices Appendix D to Appendix I.
Figure 4-5: Iwilei-Kapālama TOD Priority Area Sewer System Improvements
4.3.1 Sewer System
Existing Conditions. The Iwilei-Kapālama TOD priority area is in the Sand Island WWTP sewer basin. Regional sewer system capacity is already constrained throughout the Iwilei-Kapālama TOD priority area by an aging sewer system and the limited capacity of the Awa Wastewater Pump Station, the primary pump station servicing the area.
In anticipation of future development, ENV is in the process of improving the regional sewer capacity including two phases of Awa Street Wastewater Pump Station (WWPS), Force Main and Sewer System Improvements and Hart Street WWPS Improvements. The first phase of the Awa Street project will divert wastewater from the intersection of Houghtailing Street and School Street by constructing a new gravity sewer down Houghtailing Street and Waiakamilo Road to North Nimitz Highway, then along North Nimitz Highway to the existing Hart Street WWPS. The diversion will reduce the existing sewage flow to the Awa Street WWPS and provide capacity for new projects. The Awa Street WWPS capacity is limited and the facility must be upgraded in Phase 2 to meet the wastewater demand of the future growth of the area.
The City ENV is presently constructing the Waiakamilo Road Trunk Sewer Project, the first phase of the Awa Street WWPS Force Main and Sewer System Improvements. The project is scheduled for completion by the end of 2020. Phase 2 of the Awa Street WWPS Improvements will include pump station upgrades needed to support development planned east of Houghtailing Street and Waiakamilo Road. The construction is projected to be done by 2024.
The City ENV will begin to grant sewer connections in this area once Phase 1 is completed. In addition, the City plans to construct a new connecting sewer and replace the existing sewers in the vicinity of Iwilei Road, King Street, and Kokea Street (Iwilei, King, Street, Kokea Street Area Sewer Improvements Project).
4-5
State TOD Planning & Implementation Project, Island of O‘ahu

80
Infrastructure Improvements Needed. Based on the anticipated development scenario of the State TOD priority projects, new and upsizing of sewer lines will be needed for Kamehameha Homes, Mayor Wright Homes, Liliha Civic Center, and Kalanihuia. These sewer improvements are estimates based on the projected increase in sewer demand. The actual improvements required will be determined by ENV when they add the new demand to their sewer model and run their model. Throughout the planning process, landowners have expressed concern over the limitations of the sewer system and its potential for delaying new development.
As much as 2.4 million gallons a day (MGD) of wastewater could be generated by full buildout over the next 30-40 years. Development in the first 10 years, Phase 1, would generate over 0.82 MGD, with increases of 1.4 MGD and 0.21 MGD in Phases 2 and 3, respectively, as the area builds out. The sewer demand calculations are provided in Table 15 of Appendix D.
The project-related sewer improvements as shown in Figure 4-5 (figure does not include ENV regional sewer improvements) are described below.
• The Kamehameha Homes site will require upsized sewer lines with construction anticipated in Phase 1 (2020-2029).
• The existing sewer lines in the vicinity of Mayor Wright Homes, Liliha Civic Center TOD, and Kalanihuia will have to be upsized with construction anticipated in Phase 1 (2020-2029).
• Kamehameha Schools will require upsized sewer lines on Dillingham Boulevard, Kohou Street, and Kalani Street with construction anticipated in Phase 2 (2030-2039) per the assumptions stated in Table 13 in Appendix D. The final sewer improvements and phasing schedule for Kamehameha Schools redevelopment will be determined in their master plan.
These sewer improvements are estimates based on the projected increase in sewer demand. The actual improvements required will be determined by ENV when they add the new demand to their sewer model and run their model. The new demand has been provided to ENV for their analysis.
Figure 4-6: Iwilei-Kapālama TOD Priority Area Potable Water System Improvements
4-6
State TOD Planning & Implementation Project, Island of O‘ahu

81
4.3.2 Water System
Existing Conditions. The water system in the Iwilei-Kapālama TOD priority area is owned and operated by the BWS. The backbone water infrastructure is relatively strong in the TOD priority area, however, aging infrastructure is an ongoing challenge. Water availability is not yet a concern for new development, however water system improvements are needed based on the existing water line sizes and the required fire flow for the proposed land uses. The BWS will check the system when the applicants prepare their environmental documents or come in for land use or building permits. The BWS has multiple projects in its capital program that will address current deficiencies and increase local and regional capacity.
Infrastructure Improvements Needed. Projected water demand is based on the anticipated development numbers in Table 4-1. The projected water demand is based on the identified development projects and does not include opportunity sites identified in the development model. Between 3.8 million gallons a day (MGD) average daily demand and up to 5.7 MGD maximum daily demand of water could be needed by full buildout over the next 30-40 years. Development in the first 10 years, Phase 1, of the study would require between 1.3 and 2.0 MGD, with an increase between 2.1 and 3.1 in Phase 2, and 0.4 and 0.6 in Phase 3, as the area builds out.
Existing water lines for the majority of the State TOD projects will have to be upsized to deliver the BWS required flow for fire protection and to increase reliability. Based on the BWS standards, the estimated average and maximum daily water demand for the Iwilei-Kapālama development are summarized in Table 16 of Appendix D.
The project-related water improvements for fire protection shown in Figure 4-6 are described below.
• The Moanalua Kai development will have to upsize the existing water lines with a 16-inch loop along Kākoʻi Street, a segment of Kilihau Street, Āhua Street, and a segment of Mokumoa Street. Construction of the water line improvements is anticipated in Phase 1 (2020-2029).
• The existing water lines in the vicinity of Kaʻahumanu Homes will have to be upsized to 12-inch lines, with construction anticipated in Phase 1 (2020-2029).
• The existing water lines of the HPHA Administrative Offices redevelopment will have to be upsized from 8- to 12-inch and relocated to align with the proposed roadways. A new 12-inch water line is required at the western portion of the parcel to provide reliability. Construction of the water line improvements is anticipated in Phase 1 (2020-2029).
• The existing 12-inch water lines on Kalani Street, located east of Waiakamilo Road, will have to be upsized to 16-inch for the development of the Kapālama Mixed-Use Master Plan. Construction of the water line improvements is anticipated in Phase 1 2020-2029).
• The existing water lines on Kalani Street (west of Waiakamilo Road), Hart Street, Kaumuali‘i Street, Moʻokaula Street, and Kohou Street will have to be upsized in Phase 2 (2030-2039) for the Kamehameha Schools redevelopment per the assumptions stated in Table 13 of Appendix D. The final water improvements and phasing schedule for Kamehameha Schools redevelopment will be determined in their master plan.
• The existing 8-inch water lines located west of the Liliha Civic Center TOD will have to be upsized to 12-inch lines, with construction anticipated in Phase 1 (2020-2029).
These water improvements are estimates based on the existing water line sizes and the required fire flow for the proposed land uses. BWS will check the system when the applicants prepare their environmental documents or come in for land use or building permits. In addition, there are numerous 6- and 8-inch water lines throughout the area that may not provide adequate fire protection for mixed-use land uses and will need to be upsized. There are also 8-inch and 12-inch water lines in areas with industrial and industrial mixed-use that cannot deliver industrial fire flow that may need to be upsized. These site-specific water line improvements are not included in this study.
State TOD Planning & Implementation Project, Island of O‘ahu

82
The BWS intends to improve the local and regional water system with the projects described below.
North Nimitz Highway 16-inch Main
This 16-inch main is located along North Nimitz Highway from Waiakamilo Road to Sumner Street and along Waiakamilo Road from North Nimitz Highway to Hart Street.
This project will replace/complete the 16-inch main on North Nimitz Highway, which will strengthen the water system ability to provide fire flow for industrial land uses. The project is in the design phase and could be undertaken with development projects depending on the timing of construction.
Honolulu District 42-inch Mains
This 42-inch main runs from Liliha to Mō‘ili‘ili, along Beretania Street from Liliha Street to Richards Street, along Richards Street from Beretania Street to King Street, along King Street to Victoria Street, and along Victoria Street to Kīnaʻu Street. The project is part of larger system improvements that will enhance reliability of the existing regional water system and is not specific to the TOD projects in this area. The project is currently in the planning phase.
4.3.3 Drainage System
Existing Conditions. The Iwilei-Kapālama TOD priority area is located within the southern and central portion of the Kapālama and Nu‘uanu watersheds. The existing backbone drainage systems consist of drain lines owned by the City, State, and private entities. The systems have various deficiencies and constraints due to low-lying terrain and high-water table. Other factors such as tidal effect, a plugged shallow drain, and a malfunctioning pump (only one of the two private pumps is operational) may contribute to existing flooding conditions.
Infrastructure Improvements Needed. The drainage system in the TOD priority area does not meet the City’s Storm Drainage Standards and will have to be upgraded. The drainage master plans for the area that drains into the Kapālama Canal can be finalized once the Kapālama Canal Catalytic Project design is finalized. The limited ROW space along Dillingham Boulevard will limit what can be done to improve the drainage system, which may require all developers to retain their increase in runoff or utilize mechanical means such as drainage pumping.
Each development project will be required to submit a drainage report that demonstrates that the development will not cause impacts to the adjacent properties due to runoff. Detention basins or underground chambers will be needed to retain the increased runoff volumes.
Flood and Tsunami Hazard Zones. Moanalua Stream, Kalihi Stream, Kapālama Canal, and Nuʻuanu Stream are the major drainageways that flow through the Iwilei-Kapālama TOD priority area and empty into Honolulu Harbor. According to the FEMA Flood Insurance Rate Map (FIRM) shown in Figure 4-7, a majority of the Iwilei-Kapālama TOD priority area is located in Zone X, an area determined to be outside the 0.2% annual chance of flooding.
Although the majority of the TOD priority area is designated as having ‘low flood potential’, several areas, including but not limited to Moanalua Kai and the makai areas of Iwilei and Kapālama, suffer from severe flooding and ponding after heavy rainfall events due to storm water runoff and deficiencies in the storm water drainage system.
The Moanalua Kai development is within the Moanalua Stream floodplain/floodway coverage and is classed as Zone AE/AEF. Zone AE/AEF is an area that has been determined to have a 1% annual chance of flooding with base flood elevations (BFEs) and floodway established. The OCCC redevelopment property is within the Kalihi Stream floodplain/floodway coverage under Zone AE/AEF and AO. Zone AO is an area typically with sheet flow on sloping terrain and the average depths of 1 to 3 feet are determined. Therefore, per the City’s floodplain ordinance, both projects must demonstrate that the developments will not cause an increase in base flood elevations.
State TOD Planning & Implementation Project, Island of O‘ahu
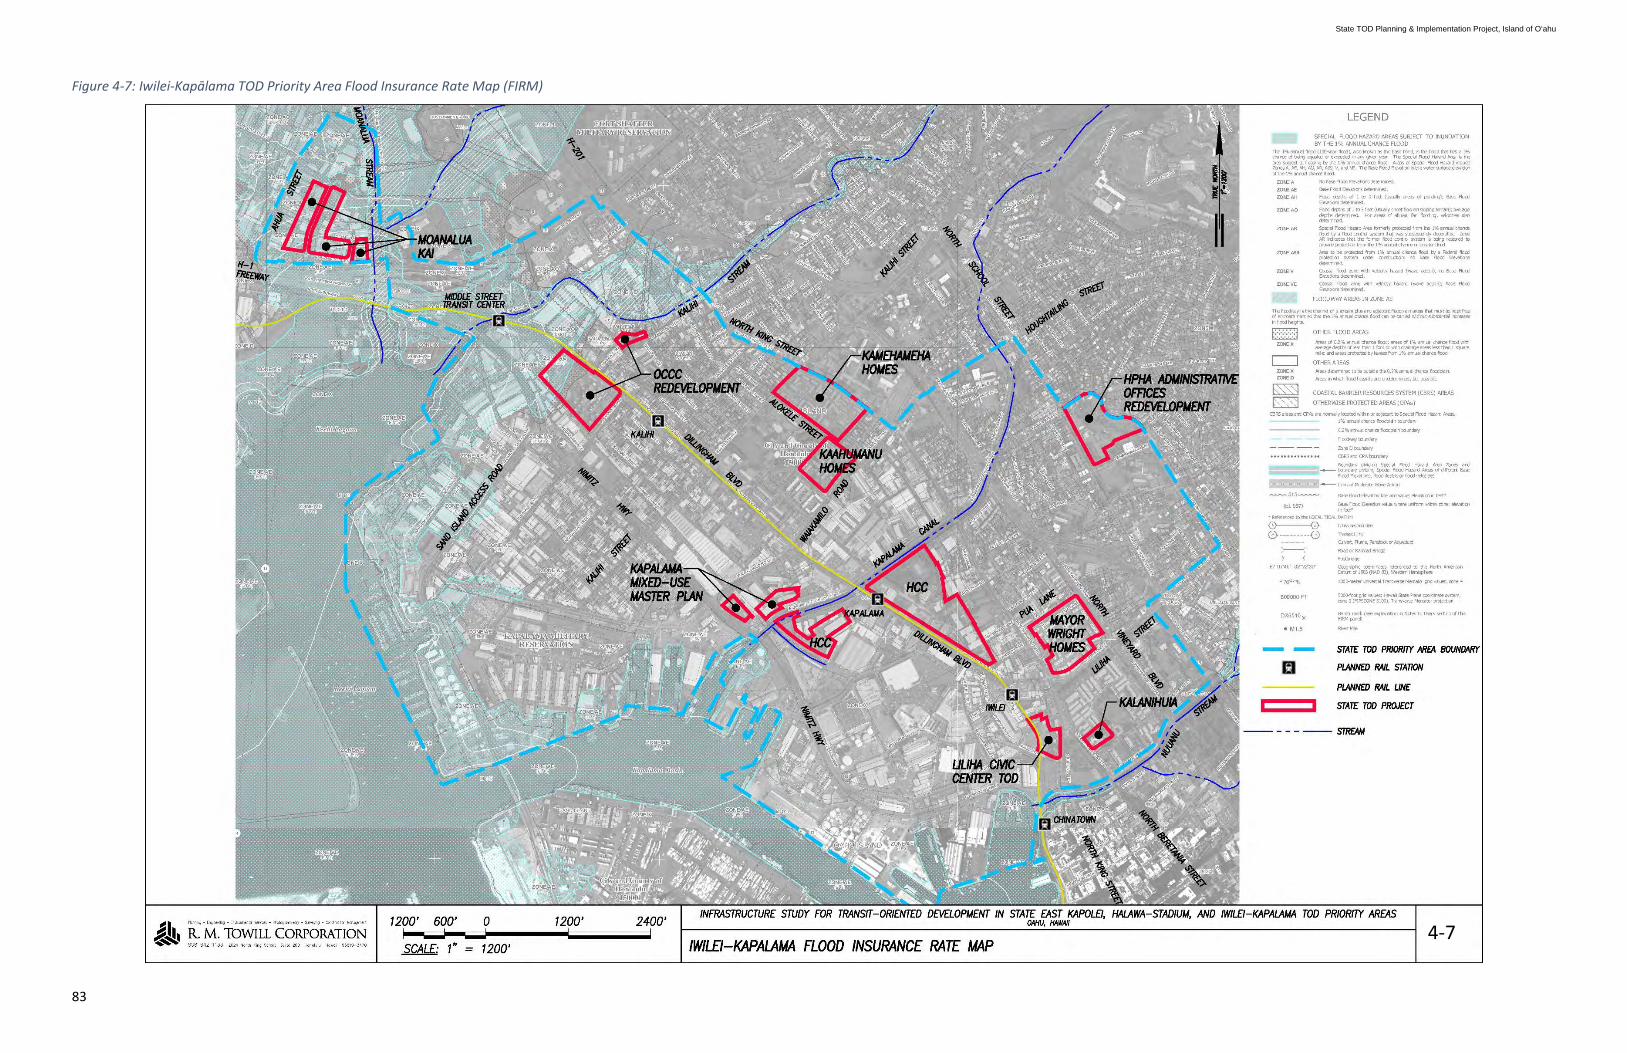
83
Figure 4-7: Iwilei-Kapālama TOD Priority Area Flood Insurance Rate Map (FIRM)
4-7
State TOD Planning & Implementation Project, Island of O‘ahu

84
This page intentionally left blank.
State TOD Planning & Implementation Project, Island of O‘ahu
85
The City Department of Design and Construction (DDC) is currently studying the Iwilei-Kapālama drainage system generally from the Kapālama Canal to Nuʻuanu Stream. One of the potential solutions is the diversion of the runoff collected by the Pua Lane drainage system. The existing Pua Lane drainage system connects to the Dillingham Boulevard and the Iwilei drainage system, and eventually drains to Kapālama Canal. Flooding and ponding often occurs following heavy rainfall events in the low-lying area. The City is evaluating various alternatives to divert the Pua Lane runoff to Nuʻuanu Stream within the Phase 1 (2020 to 2029) timeframe.
The Iwilei-Kapālama TOD priority area also has exposure to tsunami hazards due to its proximity to the coast. According to the National Oceanic and Atmospheric Administration’s (NOAA) tsunami evacuation mapping14, the areas located in close proximity to the harbor and the canals are within the tsunami evacuation zone. The extreme tsunami evacuation zone includes some areas with TOD potential and are generally makai of King Street. Tsunami inundation may inundate infrastructure within the evacuation zones, which may overwhelm these systems and create potential long-term impacts to the social and economic stability of the TOD priority area, if and when such an event should happen.
Sea Level Rise (SLR). SLR is one of many growing concerns associated with global climate change and can be especially taxing on the limited resources of island ecosystems. Coastal areas are extremely vulnerable to sea level rise, which poses a threat to the long-term safety and operation of drinking water, wastewater, and storm water infrastructure for cities and communities located in coastal regions. Flooding problems in the area are expected to be compounded by SLR. NOAA estimates that, within “intermediate” and “intermediate-high” scenarios, sea level will rise at least 4 feet by the end of the century. The City Climate Change Commission’s 2018 Sea Leve Rise Guidance concludes that it is reasonable to set planning benchmarks of up to 3.2 feet of SLR by mid-century and up to 6 feet in the later decades of the century for critical infrastructure with long lifespans and low-risk tolerance (Climate Change Commission, 2018).
There are four distinct flood mechanisms threatening the Iwilei-Kapālama area: coastal flooding, storm water flooding, riverine flooding, and groundwater flooding. All of these flood hazards are expected to be impacted by climate change through both SLR and variabilities in storm frequency and intensity. Although detailed flood modeling has not been completed for the entire TOD priority area, inundation maps similar to those in Figure 4-8 highlight low-lying areas that are also susceptible to drainage issues and high groundwater. In Iwilei-Kapālama, SLR creates a major planning issue in that coastal flooding is likely to change over time. Figure 4-8 shows the extent of a normal high tide under discrete amounts of SLR starting with 3 feet and progressing to 6 feet. The flood extent shown here is not for storm conditions but rather for an average high tide assuming that the given amount of SLR has manifested. Additionally, with Kapālama Canal and Nu‘uanu Stream bordering this area on the north and south ends respectively, storm water flooding and riverine flooding in these waterways could result in flooding of surrounding areas. Flooding within the TOD priority area could result in overwhelmed infrastructure systems, such as water pumping, or compete failure of certain systems, such as underground electrical facilities and back up generators that may become filled with water if they are not properly sealed.
14 National Oceanic and Atmospheric Administration’s (n.d.). Tsunami Aware Hawai‘i. Retrieved February 2, 2020 from https://tsunami.coast.noaa.gov/#/
State TOD Planning & Implementation Project, Island of O‘ahu

86
Figure 4-8: Tidal flooding from various levels of SLR projected near the Iwilei-Kapālama TOD Priority Area
Source: NOAA Sea Level Rise Viewer, https://coast.noaa.gov/slr
Flexible Adaptation Pathway (FAP) for Flooding and Sea Level Rise (SLR). The Iwilei-Kapālama TOD priority area is most acutely impacted by SLR. As a result, Arup developed two conceptual long-term flood adaptation scenarios for the Iwilei-Kapālama TOD priority area to identify a FAP Approach that can be used to guide future infrastructure investment. The two conceptual long-term flooding scenarios were informed by area research as well as a synthesis of recent discussions with OP, the City, and the outcomes of the City Resilience Roundtable hosted by the City in late 2018.
Due to the long lifecycles of infrastructure investment, the FAP Approach can be applied to address infrastructure planning efforts focused on protecting TOD areas from uncertain climate futures such as larger scale storms and coastal flooding as well as SLR and extreme heat. The FAP Approach can help guide future large-scale infrastructure projects, plans, phasing strategies, and estimated costs and benefits that will need to be incorporated in a way that addresses uncertain future conditions. With this information, the State and City can begin to consider the economic case for offsetting longer term infrastructure upgrade costs with the economic benefits of various development scenarios.
Based on the illustrative FAP approach model and strategies identified in Section 6.3, the high-level cost increase for FAP strategies identified for the Iwilei-Kapālama TOD priority area range from $8.4 million for Scenario 1 “Protect and Pump” to $2.5 billion for Scenario 2 “Raise and Restore”. See Section 4.4 for more information on the cost delta, Section 6.3 for more information on the FAP Approach generally, and Appendix I for Arup’s full report.
4.3.4 Storm Water Quality
Existing Conditions. The City adopted new guidelines for storm water quality that became effective on August 16, 2017. The new guidelines apply to all development and land disturbing activities within the City and establish minimum requirements for Best Management Practices (BMPs).
State TOD Planning & Implementation Project, Island of O‘ahu

87
Post-construction treatment control BMPs may include retention measures, biofiltration, and BMPs for alternative compliance. The location and method of the post-construction treatment control BMPs will be determined during a project’s design phase.
Infrastructure Improvements Needed. The City will require storm water treatment to be installed on-site. Underground chambers may be the preferred option due to space limitations. As applicable, low impact development solutions, such as capturing runoff from rooftops or impervious surfaces and conveying them to rain gardens and catchment basins, and other green infrastructure solutions should be implemented.
For retention BMPs, detention basins or underground chambers can be used for both flood control and storm water quality purposes, provided that the soil infiltration rate meets the minimum requirement of 0.5 inches an hour and the ground water table is below the detention basin and underground chambers’ invert.
Figure 4-9: Iwilei-Kapālama TOD Priority Area Roadway Improvements
4.3.5 Roadways and Circulation
Existing Conditions. The TOD priority area has good regional access to freeways, highways, and major arterials. The State’s H-1 Freeway and North Nimitz Highway are the main east-west corridors. There are also on- and off-ramps to the H-1 at several points near Middle Street (State) and mauka of King Street (City) within Kalihi. Kamehameha Highway (State)/Dillingham Boulevard (City) and North King Street (City) are also high-volume, east-west roadways. Mauka-makai access is provided by Middle Street (State), Liliha Street (State jurisdiction between King Street and School Street, City jurisdiction mauka of School Street), Kalihi Street (State jurisdiction between North Nimitz Highway and School Street, City Jurisdiction between North Nimitz Highway and Auiki Street and mauka of School Street), and Waiakamilo Road (City).
Infrastructure Improvements Needed. With TOD, this area has the opportunity to become a walkable, mixed-use, high-density urban community that could be an extension of Downtown Honolulu with areas that remain for
4-9
State TOD Planning & Implementation Project, Island of O‘ahu
88
industrial mixed-use. To accommodate rail station access and facilitate non-vehicular circulation, the Kalihi and Downtown Neighborhood TOD Plans recommend creating a multimodal circulation network by improving the street grid and addressing pedestrian and bicycle facility deficiencies in the area. Given the anticipated levels of redevelopment, including major expansion of residential uses throughout the area, circulation is a key infrastructure consideration.
For new development, the City will require a TIAR to evaluate the potential traffic impacts to the region. Potential improvements may include improvements to major intersections and roadways in the vicinity of each TOD project site that serve both regional and project-related purposes. Intersection improvements may include, but not be limited to signalized intersection, coordinated signal systems to improve capacity for a smoother traffic flow, and pedestrian/cyclist safety enhancement. The following items are identified in this study as potential regional/project improvements (Figure 4-9). The final locations are subject to change.
HPHA Administrative Offices Redevelopment Roadway Improvements • One intersection at Lanakila Avenue and North School Street • One intersection at Lanakila Avenue and North Kuakini Street
Kaʻahumanu Homes Roadway Improvements • One intersection at Waiakamilo Road/Alokele Street/Moʻonui Street • One intersection at Waiakamilo Road and McNeill Street
Kalanihuia Roadway Improvements • One intersection at ‘A‘ala Street and North Beretania Street • One intersection at ‘A‘ala Street and North Vineyard Boulevard
Kamehameha Homes Roadway Improvements • One intersection at North King Street and Kalihi Street • One intersection at North King Street connecting to the on-site backbone roads • One intersection at Kalihi Street connecting to the on-site backbone roads
Kamehameha Schools Roadway Improvements • Waiakamilo Road, Kalani Street, Moʻokaula Street, Kaumuali‘i Street, and Hart Street • One intersection at Dillingham Boulevard and Waiakamilo Road • One intersection at Waiakamilo Road and Kalani Street • One intersection at Waiakamilo Road and Hart Street • One intersection at Waiakamilo Road and Moʻokaula Street • One intersection at Waiakamilo Road and Kaumuali‘i Street
Kapālama Mixed-Use Master Plan Roadway Improvements • One intersection at Dillingham Boulevard and Kohou Street • One intersection at Waiakamilo Road and Kalani Street
Liliha Civic Center TOD Roadway Improvements • One intersection at Iwilei Road and North King Street • One intersection at Iwilei Road and Ka‘a‘ahi Street
Mayor Wright Homes Roadway Improvements • One intersection at Liliha Street/North King Street/Dillingham Boulevard • One intersection at Liliha Street and North Vineyard Boulevard • One intersection at Liliha Street and North Kukui Street • One intersection at Pua Lane and North King Street • One intersection at Pua Lane and North Vineyard Boulevard • One intersection at Pua Lane and North Kukui Street
State TOD Planning & Implementation Project, Island of O‘ahu

89
Moanalua Kai Roadway Improvements • One intersection at Kākoʻi Street and North Nimitz Highway • One intersection at Kākoʻi Street and Kilihau Street • One intersection at Āhua Street and North Nimitz Highway • One intersection at Āhua Street and Kilihau Street
Other Roadway and Circulation Related Improvements • Kapālama Canal Catalytic Project (not shown on Figure 4-9) • Iwilei Road extension through the existing ‘A‘ala Park from North King Street to North Beretania Street • Interstate Route H-1 Freeway Widening (Add lane in both directions from Middle Street to Punahou
Street, not shown on Figure 4-9) • North Nimitz Highway (Route 92), High Occupancy Vehicle (HOV) Flyover, Keʻehi Interchange to Pacific
Street (not shown on Figure 4-9)
Complete Streets Considerations In accordance with the City’s 2013 Complete Streets ordinance, public roads island-wide are being made to safely facilitate the flow of pedestrians, transit users, cyclists, and motorists. Complete Streets principles move away from streets designed with a singular focus on automobiles toward a design approach that is context-sensitive, multimodal, and integrated with the community's vision and sense of place. As such, State agencies in the Iwilei-Kapālama TOD Priority area should plan for convenient, attractive, and safe multimodal facilities along TOD site frontages (and within each site) to facilitate travel to adjacent rail transit stations and bus stops.
Other opportunities to enhance Complete Streets include:
• Increased local street density and connectivity on redeveloped sites to better distribute traffic to arterial roadways.
• Development and/or enhancement of pedestrian, bicycle, and transit improvements on key corridors that provide direct connections between State TOD sites and adjacent transit stations, including the need for good mauka-makai connections for enhanced access to the transit stations.
• Development of enhanced bicycle and pedestrian facilities on streets that include lower traffic volumes and speeds, such as Colburn and Kaumuali‘i, since these roadways would be more conducive to non-auto travel (as compared to major roadways, such as Dillingham, where limited ROW exists).
• Prioritizing multimodal enhancements in this dense, urbanized area over vehicle capacity projects. • Denser street networks and bicycle/pedestrian connections at no more than 300- to 400-foot spacing,
to the maximum extent feasible; and controlled pedestrian crossings of major roadways, such as Dillingham and Vineyard Boulevard, no longer than 750 feet.
• Inundation protection on corridors within the Iwilei-Kapālama TOD priority area.
State TOD Planning & Implementation Project, Island of O‘ahu
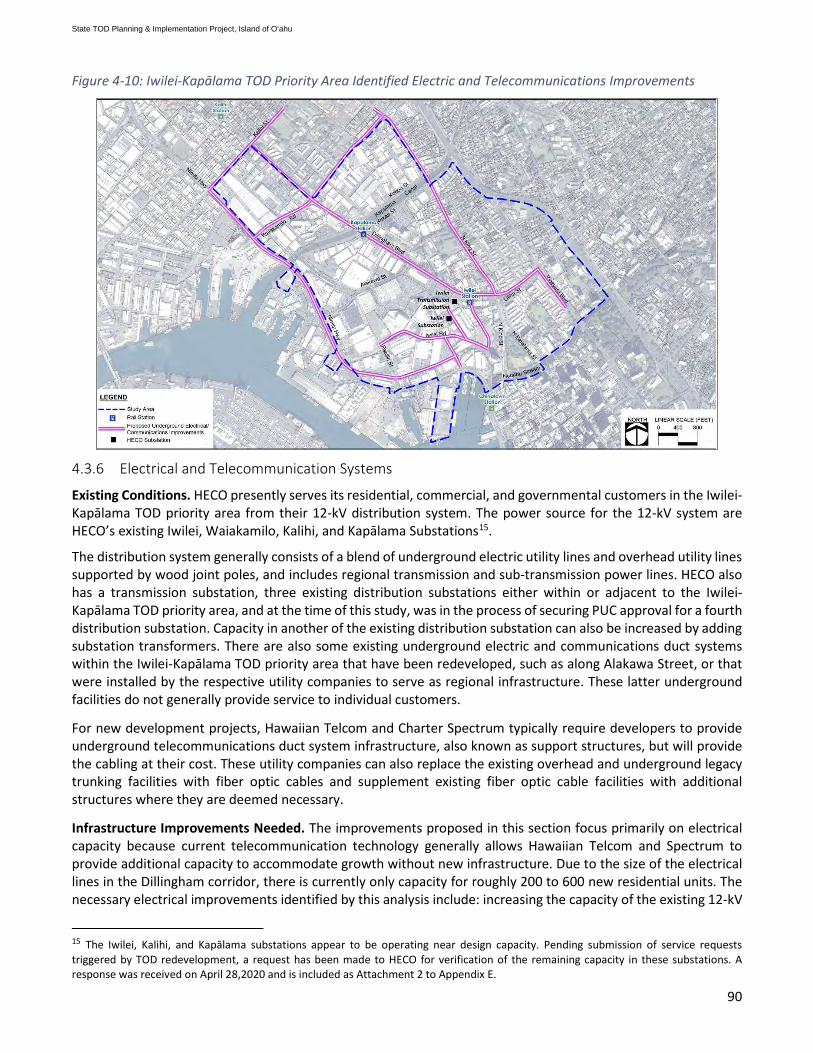
90
Figure 4-10: Iwilei-Kapālama TOD Priority Area Identified Electric and Telecommunications Improvements
4.3.6 Electrical and Telecommunication Systems
Existing Conditions. HECO presently serves its residential, commercial, and governmental customers in the Iwilei-Kapālama TOD priority area from their 12-kV distribution system. The power source for the 12-kV system are HECO’s existing Iwilei, Waiakamilo, Kalihi, and Kapālama Substations15.
The distribution system generally consists of a blend of underground electric utility lines and overhead utility lines supported by wood joint poles, and includes regional transmission and sub-transmission power lines. HECO also has a transmission substation, three existing distribution substations either within or adjacent to the Iwilei-Kapālama TOD priority area, and at the time of this study, was in the process of securing PUC approval for a fourth distribution substation. Capacity in another of the existing distribution substation can also be increased by adding substation transformers. There are also some existing underground electric and communications duct systems within the Iwilei-Kapālama TOD priority area that have been redeveloped, such as along Alakawa Street, or that were installed by the respective utility companies to serve as regional infrastructure. These latter underground facilities do not generally provide service to individual customers.
For new development projects, Hawaiian Telcom and Charter Spectrum typically require developers to provide underground telecommunications duct system infrastructure, also known as support structures, but will provide the cabling at their cost. These utility companies can also replace the existing overhead and underground legacy trunking facilities with fiber optic cables and supplement existing fiber optic cable facilities with additional structures where they are deemed necessary.
Infrastructure Improvements Needed. The improvements proposed in this section focus primarily on electrical capacity because current telecommunication technology generally allows Hawaiian Telcom and Spectrum to provide additional capacity to accommodate growth without new infrastructure. Due to the size of the electrical lines in the Dillingham corridor, there is currently only capacity for roughly 200 to 600 new residential units. The necessary electrical improvements identified by this analysis include: increasing the capacity of the existing 12-kV
15 The Iwilei, Kalihi, and Kapālama substations appear to be operating near design capacity. Pending submission of service requests triggered by TOD redevelopment, a request has been made to HECO for verification of the remaining capacity in these substations. A response was received on April 28,2020 and is included as Attachment 2 to Appendix E.
State TOD Planning & Implementation Project, Island of O‘ahu

91
distribution lines (reconductor or “up conductor”); extending the 25-kV distribution circuits throughout the Iwilei-Kapālama TOD priority area; providing an additional 46-kV transmission line; and providing additional transmission station and distribution substation capacity. HECO has been working with DPP on developing infrastructure plans to extend 25-kV circuits from their transmission substation to support the larger redevelopment projects within the Iwilei-Kapālama TOD priority area. At the time of this study, the City DPP, HHFDC, and other TOD priority area landowners were in discussion to jointly address electrical upgrades necessary for development in the Iwilei-Kapālama TOD priority area.
Under an existing City ordinance related to special districts generally, projects located on properties within a special district would be required to install new electric and telecommunication facilities underground (Revised Ordinances of Honolulu, Chapter 22). Discussions regarding the implications of this ordinance to the City’s forthcoming TOD Special District are ongoing. Finally, a three- to five-year planning and approval process involving the PUC is necessary for any new substation or substantial substation upgrades, and PUC oversight would be triggered for any expenditure amount of $2.5 million or greater for necessary improvements and for approval of HECO rate-base funding.
25-kV Distribution Network
Except for the existing 25-kV duct system and circuits extending from the Iwilei Transmission Substation along North Nimitz Highway that serves Downtown and parts of Kaka‘ako, there are currently no 25-kV distribution lines serving the Iwilei-Kapālama TOD priority area. New underground infrastructure must be built to allow for the extension of 25-kV circuits throughout the TOD priority area, and it is recommended that any project installing underground electric duct systems consider including duct systems for telecommunications utilities as well. A list of streets proposed to serve as the backbone 25-kV duct system is presented in Table 4-2. Improvements may be needed immediately for areas anticipating development in Phase 1 (2020-2029).
Creating this network would require construction of underground duct lines along several streets serving the Iwilei-Kapālama TOD priority area. These duct lines could initially be energized at 12-kV since that distribution voltage currently exists within this TOD priority area and should be convertible for use with 25-kV circuits in the future. Costs associated with 25-kV network improvements were estimated since these improvements will either be triggered by specific projects that will have to be covered by developers, or by an assessment district set up to share costs among landowners, HECO, and the City.
For the purpose of cost estimating, the major thoroughfares targeted for new duct infrastructure are North Nimitz Highway, Kalihi Street, Waiakamilo Road, North King Street, Liliha Street, Iwilei Road, and Dillingham Boulevard. Kūwili Street, Ka‘a‘ahi Street, and Sumner Street were also considered since they provide access to the other roadways for extension of 25-kV circuits from HECO’s Iwilei Transmission Substation.
As noted in the phasing section below, the 25-kV upgrades can be installed in stages based on the needs of development in the area. The total estimated cost for the 25-kV improvements ranges from $55.8 to $61.8 million for improvements, as identified by street in Table 4-2 below.
Table 4-2: Iwilei-Kapālama TOD Priority Area 25-kV Distribution Network Roadway Name 25-kV Underground Infrastructure Cost
1 North Nimitz Highway $27,000,000 2 Kalihi Street $4,500,000 - $5,000,000 3 Waiakamilo Road $5,000,000 4 North King Street $6,000,000 - $10,000,000 5 Liliha Street $2,000,000 6 Vineyard Boulevard $1,800,000
State TOD Planning & Implementation Project, Island of O‘ahu

92
Roadway Name 25-kV Underground Infrastructure Cost
7 Iwilei Road South $1,500,000 8 Iwilei Road North $1,100,000 - $1,600,000 9 Ka‘aahi Street $1,100,000 - $1,400,000
10 Dillingham Boulevard $800,000 - $900,000 11 Kūwili Street $3,500,000 - $3,600,000 12 Sumner Street $1,500,000 - $2,000,000 Total Estimated Cost $55,800,000 - $61,800,000
In addition, this assessment estimated the cost for including underground electric and telecommunications lines with the construction of the proposed new roads at $11 million in 2017 dollars.
46-kV Transmission Upgrades
In the mid- to long-term, an additional 46-kV16 transmission alignment would be needed. Three alternate underground routings for the 46-kV duct were analyzed – Dillingham Boulevard, North King Street, or North Nimitz Highway. These alternatives vary on costs, constraints, and relevant stakeholders.
The cost for installation of HECO 46-kV infrastructure and circuits is considered to be a “system” cost, which is typically borne by HECO, and depends on which alternative is deemed to be the most viable and cost efficient. The Dillingham alternative is the least expensive at $13.4 million, however the Dillingham corridor is already very congested since the rail guideway will go through Dillingham Boulevard and HART is planning on undergrounding all the utilities in that corridor (see Table 4-3 for cost estimates). The Nimitz alternative is the most expensive at approximately $45.6 million since the alignment route is very long.
Currently, the City’s special district ordinance for undergrounding utilities applies to City TOD Special District areas, which would require the installation of these 46-kV facilities underground. It has yet to be determined if the undergrounding of 46-kV duct systems and cabling would be considered a system cost covered by HECO, or if HECO would only agree to bear the cost for an “equivalent overhead” 46-kV line leaving the bulk of the cost to be funded by other means.
Table 4-3: Iwilei-Kapālama TOD Priority Area 46-kV Transmission Upgrades
Underground Roadway Infrastructure
New 46-kV Infrastructure Alignment Alternatives
North Nimitz Highway North King Street Dillingham Boulevard
North Nimitz Highway $33,000,000 - - Kalihi Street $6,500,000 $3,000,000 $1,500,000 North King Street - $12,000,000 - Iwilei Road North $1,600,000 $900,000 - Ka‘aahi Street - $1,600,000 $900,000 Dillingham Boulevard - $1,100,000 - Kūwili Street $2,500,000 $2,400,000 $2,500,000 Sumner Street - - $11,000,000 Total Estimated Cost $45,600,000 $21,000,000 $13,400,000
16 The HECO 46-kV underground infrastructure cost model is based on 4- to 5-inch HECO conduits, which would accommodate one 46-kV circuit. Synergistic cost sharing was considered for each 46-kV infrastructure alternative alignment that is parallel to a 25-kV infrastructure route.
State TOD Planning & Implementation Project, Island of O‘ahu
93
Phasing of Improvements
Several steps could be taken to increase electrical capacity in the Iwilei-Kapālama TOD priority area in the short term. These include:
1) Adding cooling fans to existing substation transformers that do not already have them; 2) Increasing the capacity of existing 12-kV distribution lines (reconductor or “up conductor”); 3) Extending 25-kV distribution circuits from the Iwilei Transmission Substation in the Kapālama
direction; and 4) Upgrading North King Street, Liliha Street, Iwilei Road, Pine Street, and Sumner Street with
underground 25-kV distribution lines in Phase 1 (2020-2029).
Near-term steps one and two would likely be system improvements funded and implemented by HECO, while step three may be done incrementally and funded in several different ways. Funding for step three could come from an individual redevelopment project or large landowners undertaking redevelopment on a number of their parcels, or the City may organize a regional improvement project, such as an improvement district (ID), to benefit all area landowners through a cost-sharing agreement.
Further expansion of the 25-kV Iwilei circuits should be prioritized in the mid-term in order to continue expansion of capacity needed to serve the parcels anticipated for redevelopment. Additional mid-term steps are to provide additional substation transformers at the Waiakamilo substation and add a 46-kV sub-transmission circuit to this substation. At the time of this study, HECO had also considered and was in the process of obtaining PUC approval for the development of a new distribution substation site (Auiki Substation) somewhere within the Iwilei-Kapālama TOD priority area.
In the long term, HECO may need to consider developing a new transmission station near the corner of Dillingham and Ka‘aahi Street, similar to the existing Iwilei Transmission Substation along Kūwili Street. A new transmission station would provide additional capacity for the 25-kV distribution system and also provide additional capacity for the 46-kV sub-transmission circuits, which feed the 12-kV substations. This would require securing a 2-acre or more parcel on the western edge of the Iwilei-Kapālama TOD priority area. This facility would provide additional capacity required to support TOD, not only in the Iwilei-Kapālama TOD priority area, but in other surrounding areas as well.
4.3.7 Public Schools
Infrastructure Improvements Needed. Future residential growth in the Iwilei-Kapālama TOD priority area will result in the need for two additional schools to serve students from these communities. The Board of Education has statutory authority to leverage fees from homebuilders and residential developers through the establishment of School Impact Districts approved by the Board of Education. Commercial, industrial, senior housing, and projects that replace or enlarge existing homes are exempt from school impact fees. The DOE’s Office of Facilities and Support Services will use these funds to accommodate the increase in new families and school enrollments in high-growth regions through expansion of existing schools or development of new school facilities (DOE, 2018).
The Board of Education approved the Kalihi-to-Ala Moana School Impact District to begin on October 1, 2018. The Kalihi-to-Ala Moana School Impact District is defined as those areas served by the following elementary schools: Fern, Kalihi Kai, Kalihi Waena, Linapuni, and Pu‘uhale in the Farrington Complex; and Kaʻahumanu, Kaʻiulani, Kauluwela, Likelike and Royal in the McKinley Complex. Prior to the issuance of a building permit, the City will notify building permit applicants to submit payment of $3,864 per unit to the DOE (DOE, 2018).
In areas, where vacant land may be unavailable, the DOE is considering vertical school options as well as looking at adaptive reuse strategies to retrofit existing buildings in and around the TOD areas to house entire new school capacity or select school functions. At the time of this study, the DOE was developing a new 21st Century vertical school model, with higher density facilities and a smaller campus footprint that can be used to provide additional capacity in TOD areas.
State TOD Planning & Implementation Project, Island of O‘ahu
94
4.3.8 Sustainability and District Systems
Existing Conditions. The Iwilei-Kapālama TOD priority area is most acutely impacted by rising sea levels. As an established community, it also will experience the most redevelopment impacts and related need to sustain and advance the needs of current residents. The presence of major landholders, historic resources, and proximity to the State’s business center offer significant opportunity for coordinated TOD infrastructure improvements, such as network systems. Sections 6.1 and 6.2 of this report have more information on sustainability and district systems, as does Appendix H.
Infrastructure Improvements Needed. The presence and mission alignment of major landowners in the Iwilei-Kapālama TOD priority area presents an opportunity for visionary action that smaller landowners are likely unable to similarly affect. Further, the diversity of residential, retail, academic, industrial, and commercial uses in the Iwilei-Kapālama TOD priority area offers a flattening of demand on energy, water, waste, and roadway and circulation systems since usage needs for different sectors occur largely at different times of day. As such, there is an opportunity to incorporate neighborhood-serving systems that would also offer a means to reduce the utility cost burden on disposable income, which could increase affordability for residents of the TOD priority area. However, because of the area’s significant vulnerability to SLR, a coordinated approach to accommodate SLR and landside flooding within this TOD priority area is very important. See Section 4.3.3 for more information on SLR and the FAP Approach to address flooding and SLR in this area.
Finally, the Iwilei-Kapālama TOD priority area has a wide diversity of large and small landowners that will have an opportunity to take joint action on major development initiatives, underscoring the importance of best practices in joint and participatory community planning and implementation.
More details on sustainable infrastructure systems and specific observations on sustainability challenges and opportunities for the Iwilei-Kapālama TOD priority area are provided in the Arup report in Appendix H, Sustainability and Neighborhood-Serving Systems.
4.4 Iwilei-Kapālama TOD Priority Area Rough Order of Magnitude (ROM) Infrastructure Costs As can be seen in Table 4-4, the infrastructure projects needed to support the anticipated land sue scenario buildout in the Iwilei-Kapālama TOD priority area were categorized in one of three categories as follows:
• Regional improvements: Improvements that will provide benefits and enhancement to the region, not just for specific TOD projects.
• Regional/project improvements: These are improvements consisting of on-site and/or off-site improvements required to support individual TOD project needs and that also benefit the region.
• Project improvements: These are typical on-site improvements consisting of backbone road, drainage, sewer, water, landscape, electrical, storm water quality, and other ancillary development that benefit the individual project.
Table 4-4 lists those projects determined to be regional improvements and regional/project improvements that significantly impact or are essential to TOD development in this priority area. The ROM infrastructure costs associated with these two categories of projects as well as for future DOE schools and regional electrical systems improvements needed in the Iwilei-Kapālama TOD priority area were included in the cost and financing analysis of this study. The OCCC Redevelopment site costs are not included because the proposed land uses and timing were not available at the time of this study. The infrastructure costs of the Iwilei-Kapālama TOD priority area and Non-Iwilei-Kapālama area improvements (2019 dollars), not including building, demolition, and soft costs are summarized in Table 4-4 and the detailed breakdown is included in Appendix D, Attachment B.
As shown in Table 4-4, the infrastructure costs for Phases 1 (2020-2029), 2 (2030-2039), and 3 (2040-2049) of the Iwilei-Kapālama TOD priority area are $447.6 million, $255.4 million, and $813.5 million, respectively. The regional electrical improvements costs (46-kV Transmission Upgrades) are $45.6 million, but the phasing plan is
State TOD Planning & Implementation Project, Island of O‘ahu
95
undetermined at the time of this study. The total infrastructure costs anticipated for the Iwilei-Kapālama TOD priority area are approximately $1.56 billion.
To examine the potential cost of infrastructure improvements that may be required in the mid- to long-term to accommodate and protect development in areas likely to be impacted by SLR in this area, Arup developed two plausible adaptation strategies for which R.M. Towill Corporation (RMT) calculated high-level, ROM cost estimates for the additional infrastructure required for each strategy. These high-level cost estimates for SLR adaptation can be used to compare against anticipated benefits of investments in the TOD priority area. This cost delta is the difference between the cost of baseline infrastructure needs presented previously, and ROM costs for conceptual upgrades needed to protect the area from SLR. This type of delta and cost benefit analysis, as proposed in Arup’s Flexible Adaptation Approach (FAP) (Appendix I) could be used to inform decisions. For instance, it could support planners in their analyses of whether or not to up-zone low-lying portions of the Iwilei-Kapālama TOD priority area, or whether to accelerate, delay, or even undertake investment in longer-term infrastructure fixes needed for SLR adaptation. The conceptual options to address SLR identified in the FAP analysis include Option 1 - Protect and Pump and Option 2 - Raise and Restore, with ROM costs of $8.4 million and $2.5 billion, respectively.
The infrastructure costs for Phases 1 (2020-2029) of the infrastructure improvements in the Non-Iwilei-Kapālama area are $17 million. No costs are attributed to Phase 2 (2030-2039) or Phase 3 (2040-2049) of the Non-Iwilei-Kapālama area. The total infrastructure costs anticipated for the Non-Iwilei-Kapālama area are approximately $17 million.
The grand total infrastructure costs for all three phases for both the Iwilei-Kapālama TOD priority area and Non-Iwilei-Kapālama area is $1.58 billion. However, combining the ROM costs for the Protect and Pump Option and the baseline infrastructure costs brings the total infrastructure costs for the Iwilei-Kapālama TOD priority area to an estimated $2.4 billion. While combining the ROM costs for the Raise and Restore Option and the baseline infrastructure costs brings the total infrastructure costs for the Iwilei-Kapālama TOD priority area to an estimated $4.1 billion. The implications of the cost delta analysis to address SLR using the two conceptual options identified in the FAP are that the total cost is 1.53 times larger and 2.62 times larger than the baseline infrastructure costs – which do not directly address future SLR – for the Protect and Pump Option and the Raise and Restore Option respectively.
State TOD Planning & Implementation Project, Island of O‘ahu
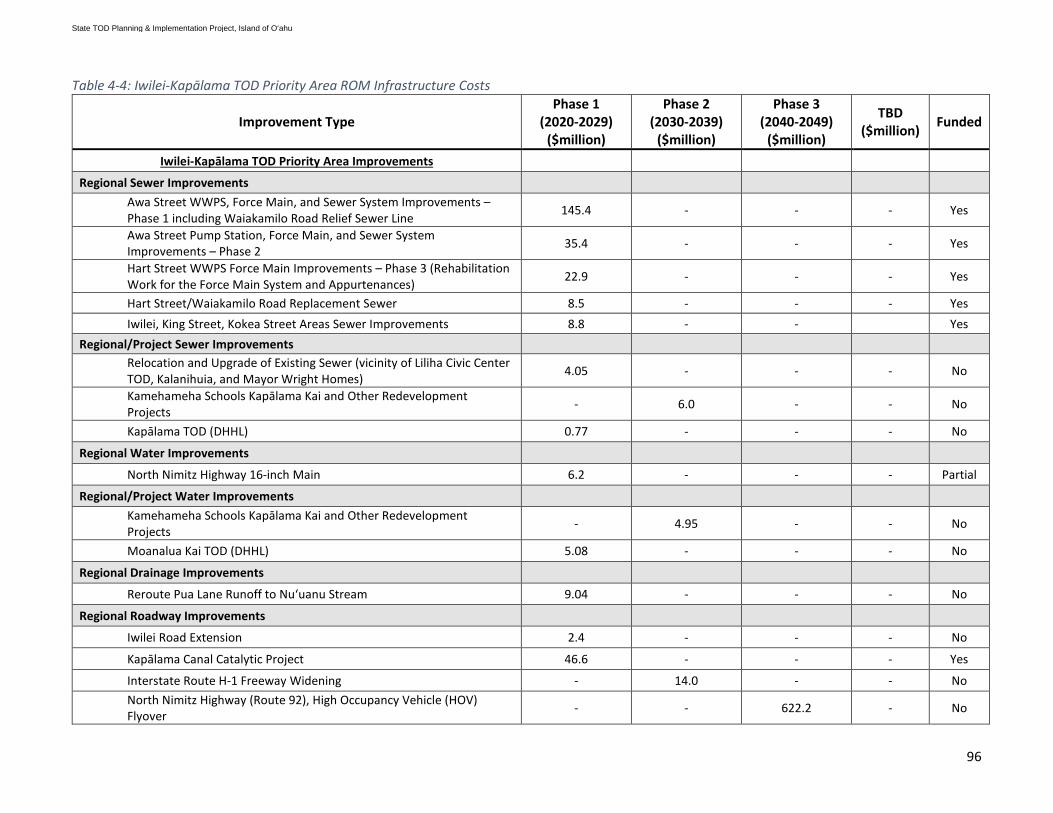
96
Table 4-4: Iwilei-Kapālama TOD Priority Area ROM Infrastructure Costs
Improvement Type Phase 1
(2020-2029) ($million)
Phase 2 (2030-2039)
($million)
Phase 3 (2040-2049)
($million)
TBD ($million) Funded
Iwilei-Kapālama TOD Priority Area Improvements
Regional Sewer Improvements Awa Street WWPS, Force Main, and Sewer System Improvements – Phase 1 including Waiakamilo Road Relief Sewer Line 145.4 - - - Yes
Awa Street Pump Station, Force Main, and Sewer System Improvements – Phase 2 35.4 - - - Yes
Hart Street WWPS Force Main Improvements – Phase 3 (Rehabilitation Work for the Force Main System and Appurtenances) 22.9 - - - Yes
Hart Street/Waiakamilo Road Replacement Sewer 8.5 - - - Yes Iwilei, King Street, Kokea Street Areas Sewer Improvements 8.8 - - Yes
Regional/Project Sewer Improvements Relocation and Upgrade of Existing Sewer (vicinity of Liliha Civic Center TOD, Kalanihuia, and Mayor Wright Homes) 4.05 - - - No
Kamehameha Schools Kapālama Kai and Other Redevelopment Projects - 6.0 - - No
Kapālama TOD (DHHL) 0.77 - - - No
Regional Water Improvements
North Nimitz Highway 16-inch Main 6.2 - - - Partial
Regional/Project Water Improvements Kamehameha Schools Kapālama Kai and Other Redevelopment Projects - 4.95 - - No
Moanalua Kai TOD (DHHL) 5.08 - - - No
Regional Drainage Improvements
Reroute Pua Lane Runoff to Nu‘uanu Stream 9.04 - - - No
Regional Roadway Improvements
Iwilei Road Extension 2.4 - - - No
Kapālama Canal Catalytic Project 46.6 - - - Yes
Interstate Route H-1 Freeway Widening - 14.0 - - No North Nimitz Highway (Route 92), High Occupancy Vehicle (HOV) Flyover - - 622.2 - No
State TOD Planning & Implementation Project, Island of O‘ahu
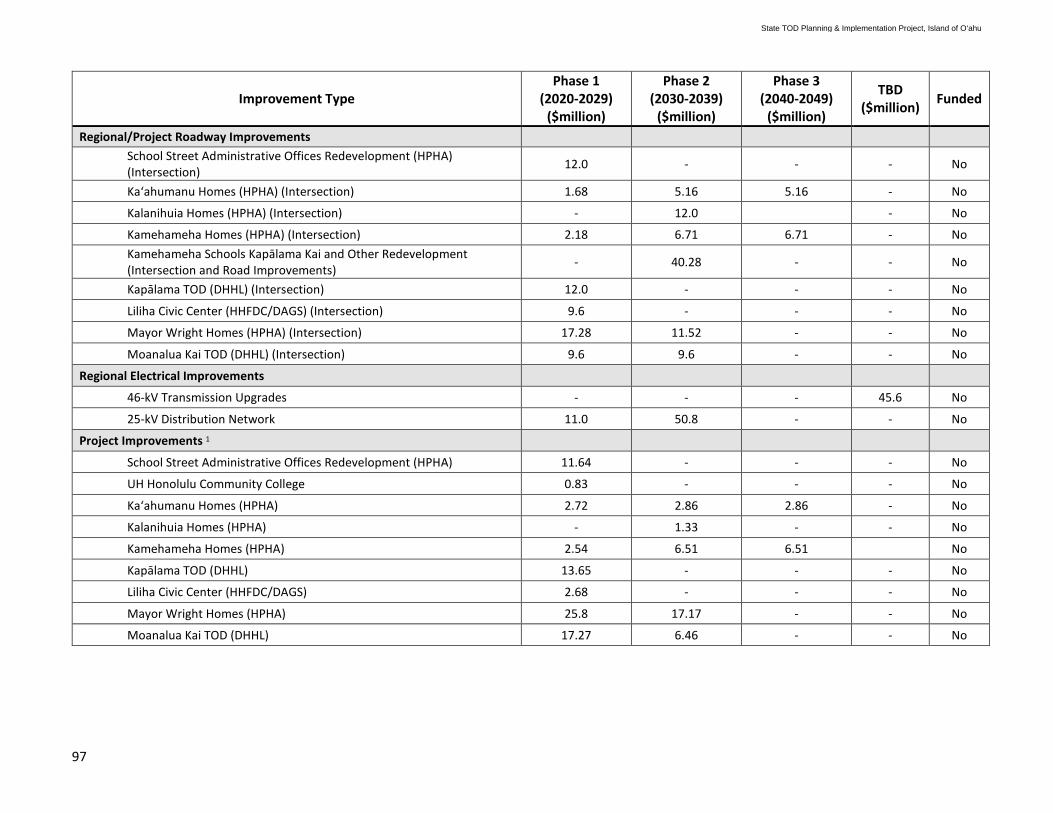
97
Improvement Type Phase 1
(2020-2029) ($million)
Phase 2 (2030-2039)
($million)
Phase 3 (2040-2049)
($million)
TBD ($million) Funded
Regional/Project Roadway Improvements School Street Administrative Offices Redevelopment (HPHA) (Intersection) 12.0 - - - No
Kaʻahumanu Homes (HPHA) (Intersection) 1.68 5.16 5.16 - No
Kalanihuia Homes (HPHA) (Intersection) - 12.0 - No
Kamehameha Homes (HPHA) (Intersection) 2.18 6.71 6.71 - No Kamehameha Schools Kapālama Kai and Other Redevelopment (Intersection and Road Improvements) - 40.28 - - No
Kapālama TOD (DHHL) (Intersection) 12.0 - - - No
Liliha Civic Center (HHFDC/DAGS) (Intersection) 9.6 - - - No
Mayor Wright Homes (HPHA) (Intersection) 17.28 11.52 - - No
Moanalua Kai TOD (DHHL) (Intersection) 9.6 9.6 - - No
Regional Electrical Improvements
46-kV Transmission Upgrades - - - 45.6 No
25-kV Distribution Network 11.0 50.8 - - No
Project Improvements 1
School Street Administrative Offices Redevelopment (HPHA) 11.64 - - - No
UH Honolulu Community College 0.83 - - - No
Kaʻahumanu Homes (HPHA) 2.72 2.86 2.86 - No
Kalanihuia Homes (HPHA) - 1.33 - - No
Kamehameha Homes (HPHA) 2.54 6.51 6.51 No
Kapālama TOD (DHHL) 13.65 - - - No
Liliha Civic Center (HHFDC/DAGS) 2.68 - - - No
Mayor Wright Homes (HPHA) 25.8 17.17 - - No
Moanalua Kai TOD (DHHL) 17.27 6.46 - - No
State TOD Planning & Implementation Project, Island of O‘ahu
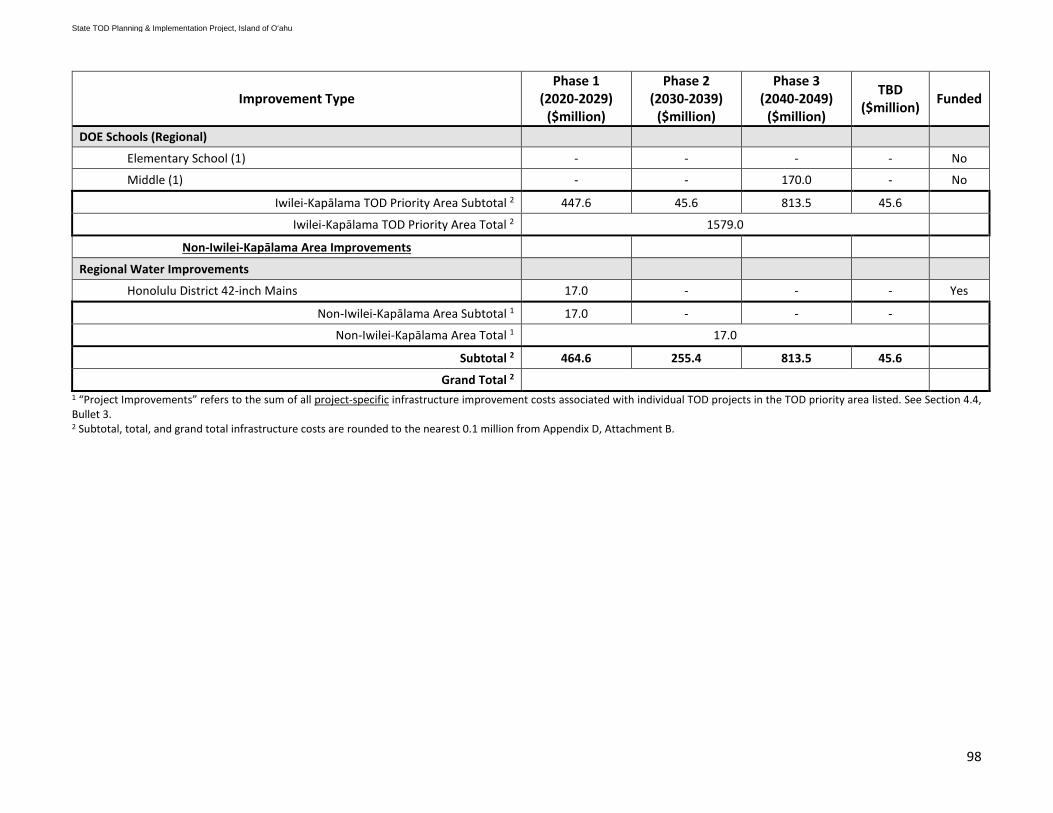
98
Improvement Type Phase 1
(2020-2029) ($million)
Phase 2 (2030-2039)
($million)
Phase 3 (2040-2049)
($million)
TBD ($million) Funded
DOE Schools (Regional)
Elementary School (1) - - - - No
Middle (1) - - 170.0 - No
Iwilei-Kapālama TOD Priority Area Subtotal 2 447.6 45.6 813.5 45.6
Iwilei-Kapālama TOD Priority Area Total 2 1579.0
Non-Iwilei-Kapālama Area Improvements
Regional Water Improvements
Honolulu District 42-inch Mains 17.0 - - - Yes
Non-Iwilei-Kapālama Area Subtotal 1 17.0 - - - Non-Iwilei-Kapālama Area Total 1 17.0
Subtotal 2 464.6 255.4 813.5 45.6 Grand Total 2
1 “Project Improvements” refers to the sum of all project-specific infrastructure improvement costs associated with individual TOD projects in the TOD priority area listed. See Section 4.4, Bullet 3. 2 Subtotal, total, and grand total infrastructure costs are rounded to the nearest 0.1 million from Appendix D, Attachment B.
State TOD Planning & Implementation Project, Island of O‘ahu

99
4.5 Key Infrastructure Issues for the Iwilei-Kapālama TOD Priority Area Sewer, electrical, drainage, and public schools are the key regional infrastructure issues that need to be addressed in the Iwilei-Kapālama TOD priority area. Improving infrastructure capacity of these systems will be critical in achieving TOD potential. There are significant barriers and concerns related to the timing and concurrency of needed infrastructure improvements for TOD development in this area, particularly related to wastewater and electrical facility improvements needed to support full buildout here. At the time of this study, the City DPP, HHFDC, and other TOD priority area landowners were in discussion to jointly address some of the infrastructure deficits in the Iwilei-Kapālama TOD priority area, with electrical upgrades being a priority for coordinated improvements.
Sewer. Regional sewer system capacity is already constrained throughout the TOD priority area by an aging sewer system and the limited capacity of the Awa WWPS, the primary pump station servicing the area. Throughout the planning process, landowners have expressed concern over the limitations of the sewer system and its potential impacts on new development. In anticipation of the future developments, the City ENV is in the process of improving the regional sewer capacity including two phases of Awa Street WWPS, Force Main and Sewer System Improvements and Hart Street WWPS Improvements. The City ENV will begin to grant sewer connections in this area once Phase 1 of the Awa Street WWPS project is completed. Based on the anticipated development scenario of the State TOD priority projects, new and upsized sewer lines will be needed for Kamehameha Homes, Mayor Wright Homes, Liliha Civic Center, and Kalanihuia. These sewer improvements are estimates based on the projected increase in sewer demand. The actual improvements required will be determined by ENV when they add the new demands to their sewer model and run their model.
Water. The backbone water infrastructure is relatively strong in the planning area, however aging infrastructure is an ongoing challenge. Water availability is not yet a concern for new development, however water system improvements are needed based on the existing water line sizes and the required fire flow for the proposed land uses. The BWS has multiple projects in its capital program that will address current deficiencies and increase local and regional capacity. Existing water lines for a majority of the State TOD projects will have to be upsized to deliver the BWS required flow for fire potential and increase reliability.
Drainage. The drainage system does not meet the City Drainage Standards and will have to be upgraded. The existing backbone drainage systems consist of drain lines owned by the City, State, and private entities and have various deficiencies and constraints due to low-lying terrain and high water table. Other factors such as tidal effect, plugged shallow drain, and malfunctioning pump (only one of the two private pumps is operational) may contribute to flooding issues in the TOD priority area. Each individual development must submit a drainage report to demonstrate that the development causes no impact on adjacent properties due to runoff.
Roadways and Circulation. Given the anticipated levels of redevelopment, including major expansion of residential uses throughout the area, circulation is a key infrastructure consideration. Roadways and circulation related improvements may include major intersections and roadways in the vicinity of each TOD project site that serve both regional and project related purposes. For new development projects, the City will require a TIAR to evaluate the potential traffic impacts to the region.
Electrical and Telecommunications. The Iwilei-Kapālama TOD priority area has major electrical system deficiencies that will need to be addressed in order for redevelopment of the TOD priority area to continue. The necessary electrical improvements identified by this analysis include: increasing the capacity of the existing 12-kV distribution lines (reconductor or “up conductor”); extending 25-kV distribution circuits throughout the Iwilei-Kapālama TOD priority area; providing an additional 46-kV transmission line; and providing additional transmission station and distribution substation capacity. At the time of this study, HECO was working with DPP on developing infrastructure plans to extend 25-kV circuits from their transmission substation to support the larger redevelopment projects within the Iwilei-Kapālama TOD priority area. As identified at the beginning of this section, several area landowners, departments, and agencies are in discussion to jointly address regional electrical
State TOD Planning & Implementation Project, Island of O‘ahu

100
upgrades. These conversations for coordinated improvements should be continued to ensure adequate and timely electrical upgrades in the TOD priority area.
Public Schools. The DOE expects the highest growth in student enrollment in the areas closest to the nine train stations between Middle Street and Ala Moana Shopping Center, which includes the four stations of the Iwilei-Kapālama TOD priority area. Future residential growth on Iwilei-Kapālama will result in the need for two additional schools to serve residents from these communities. In areas, where vacant land may be unavailable, the DOE is considering vertical school options as well as looking at adaptive reuse strategies to retrofit existing buildings in and around the TOD areas to house entire new school capacity or select school functions. At the time of this study. the DOE was developing a new 21st Century vertical school model, with higher density facilities and a smaller campus footprint that can be used to provide additional capacity in TOD areas. In order to help offset costs of additional school facilities, a School Impact District was implemented in October 2018 and requires homebuilders and residential developers to submit payment of $3,864 per new unit prior to the issuance of building permits.
Sustainability and District Systems. The Iwilei-Kapālama TOD priority area is most acutely impacted by rising sea levels and a FAP Approach was developed by Arup to consider long term impacts of SLR to infrastructure systems. The conceptual options to address SLR identified in the FAP analysis include Option 1 – Protect and Pump and Option 2 – Raise and Restore, with ROM costs of $8.4 million or 1.53 times more than baseline infrastructure costs, and $2.5 billion or 2.62 times more than baseline infrastructure costs, respectively. More information on the FAP approach can be found in Section 6.3 and infrastructure needed for the two hypothetical options can be found in Appendix I. The intent of the cost estimates is to provide a “cost delta” that can be used to compare against the estimated benefits of TOD priority area investment. If the ROM costs for upgraded and/or adaptive infrastructure systems to protect the area from SLR is less than the anticipated TOD priority area investment/development, then it may be cost effective to invest in the adaptive infrastructure strategies that will protect the area from SLR. In developing these future, larger scale adaptive infrastructure systems, additional studies will need to be undertaken, plans will need to be outlined, phasing strategies will need to be developed, and costs and benefits will need to be estimated.
As an established community, it also will experience the most redevelopment impacts and related need to sustain and advance the needs of current residents. The diversity of residential, retail, academic, industrial, and commercial uses in the Iwilei-Kapālama TOD priority area offers a flattening of demand on energy, water, waste, and roadway and circulation systems since usage needs for different sectors occur largely at different times of day.
Finally, the Iwilei-Kapālama TOD priority area has a wide diversity of large and small landowners that will have an opportunity to take joint action on major development initiatives, underscoring the importance of best practices in joint and participatory community planning and implementation.
Other considerations.
Hazardous Materials. Landowners should undertake a Phase I Environmental Site Assessment (ESA) to identify potential or existing contamination liabilities for properties that may have had industrial uses in the TOD priority area. Depending on the results of the Phase I ESA, a Phase II ESA may be required to test the chemical makeup and possible contamination of soil, groundwater, and vapor on-site.
Department of Transportation, Airports Division (DOT Airports). Landowners should consult with DOT Airports as soon as feasible in the redevelopment project planning process to provide an opportunity for review of the airspace constraints and single-engine out policies for individual aircraft operating at Daniel K. Inouye International Airport.
State TOD Planning & Implementation Project, Island of O‘ahu
101
5 Infrastructure Financing
5.1 Financing Study Objectives and Overview Successful implementation of TOD in the three TOD priority areas will require costly upgrades to shared regional infrastructure, as previously identified in Sections 2 through 4, above. In order to fund such improvements in a timely manner and be poised to realize the values created by transit, State and City entities are exploring a variety of financing tools and other incentives17. The public finance consulting firm, DTA, was engaged to evaluate financing tools or mechanisms18 that could be options for the State and/or City in funding the necessary public infrastructure. DTA analyzed the various types of infrastructure that will need to be developed (roadways, water, sewer improvements, etc.), in three ten-year development phases for the three TOD priority areas.
Numerous issues and challenges were identified and addressed in the study. These include the multi-jurisdictional nature of the infrastructure projects (City and State); the consultant team’s, TOD priority area work groups’, and PCC members’ assessments of political viability, public acceptance, land ownership status, timing and the availability of funds, among others. Given the long-lead time required for infrastructure financing and development, a viable investment strategy is considered critical to ensure that system capacities can be upgraded efficiently, and inadequate infrastructure does not become a barrier to meeting important public goals in these TOD priority areas.
The financing mechanisms examined include Community Facilities Districts, Utility Revenue Bonds, Lease Revenue Financing, General Obligation (GO) Bonds, Value Capture (including Payment in Lieu of Taxes (PILOT)), P3, Assessment Districts (including Special Improvement Districts (ID) and Business ID), and Development Impact Fees. Attachment A to the DTA report (Appendix G) provides more detailed explanations of each of the tools considered and how they might be applied for infrastructure financing, and provides examples of where such tools have been successfully used elsewhere.
Other financing mechanisms pertaining largely to vertical development (development of the buildings and other facilities within individual projects), and not generally applicable to regional infrastructure, were reviewed but not considered as significant tools for facilitating the public financing of infrastructure. For example, Opportunity Zone investment, Low-Income Housing Tax Credits (LIHTC), and New Market Tax Credits are not considered appropriate tools for financing regional infrastructure. It is also assumed that the State and City will pursue other funding sources not mentioned herein, such as private and/or federal grants, loans, etc.
Based on these inputs, DTA and the consultant team proposed a combination of potential tools that appear capable of providing the required funding while meeting stated goals of State agencies and other stakeholders in the TOD priority areas. The analysis is focused on Phase 1 (2020-2029) development and infrastructure costs, but the tools and concepts discussed herein are relevant to subsequent development phases and costs as well. The promising tools and strategies identified herein may also offer corollary lessons to meeting public goals in other TOD areas within the State.
This section presents a high-level summary of the DTA study framework, analyses, and findings. See Appendix G for further explanation of the assumptions, analyses, and findings of the financial assessment. The DTA report also identifies various issues that may be encountered in implementation of the suggested mechanisms and overall strategy.
17 See sections 5.8.2 and 5.8.4 for presentation of the alternative funding approaches considered, or Attachment A to Appendix G, the DTA report, for a more comprehensive explanation of potential options. 18 Financing “tools” and “mechanisms” are used interchangeably in this context.
State TOD Planning & Implementation Project, Island of O‘ahu
102
5.2 Financing Study Conditions and Parameters The primary intent of the State and TOD Council stakeholders is not to simply build infrastructure, but to achieve desired new development in the TOD priority areas and to realize their associated values. Thus, DTA’s study was framed by the anticipated development scenarios expressed by landowners in Sections 2 through 4 of this overall study. The anticipated development scenarios were then analyzed by RMT to determine the infrastructure needed to achieve the desired development, and the costs and necessary timing of this infrastructure.
In some cases, implementation of desired infrastructure and ultimate development within the TOD priority areas may be dependent on trunk or other infrastructure improvements needed outside of the priority areas, and those needed outside improvements may or may not already be funded. Thus, the timing and funding of those out-of-area improvements could become impediments or delaying factors to implementing the improvements desired within the TOD priority areas. Where known, such impediments are acknowledged (see Sections 2.3, 3.3, and 4.3), but their financing and implementation is not specifically addressed in the DTA analysis.
The DTA study focuses on the Phase 1 (2020-2029) plans, since development and redevelopment project plans, their timing, and existing funding are better known in the relative near-term. However, this presentation begins with an overview of all three phases. The analyses presented do not attempt to account for business cycles, short-term trends, or event-specific variations.19 Therefore, as in any longer-term view, even where future projections turn out to be accurate at identified horizon date(s), there will be variations from the projected trend in any given year or period along the way. In order to model the financial and fiscal characteristics of these development and redevelopment projects, the DTA study distinguishes development in terms of total or gross development and net new development as described below.
Total or gross development, which encompass any new unit or facility built within the TOD priority areas.
Net new development, which is the total new inventory, less any demolitions that would need to occur to accommodate the new development. For instance, much of the new development in Iwilei-Kapālama will represent redevelopment of existing commercial facilities, so this concept accounts for the net impact of such development. With the exception of the stadium and Puʻuwai Momi redevelopment, much of the new development proposed in the East Kapolei and Hālawa-Stadium TOD priority areas will not require demolition, so in these TOD priority areas, net new development is similar or equal to the total or gross development inventories.
DTA’s study conclusions are expressed in part in a financial model, which, like their analyses, depends on numerous input assumptions regarding development plans, timing, costs, and the like. Any adjustments to this input information will cause the model outcomes to adjust. However, the model outcomes reported herein are intended to provide the State and TOD stakeholders with information for future planning purposes. All dollar figures are stated in constant 2019 dollars.
5.3 Anticipated Development and Value Creation Based on the preferred land use scenarios derived in consultation with the State agency representatives and other stakeholders that participated in this planning process, the three TOD priority areas are anticipated to contribute:
• 48,000 new homes to be developed by both public and private entities on both State and private lands, • 15.2 million square feet of new commercial/institutional space/mixed-use, • 3.9 million square feet of new industrial space, • Up to three new hotels, with about 600 rooms, • A new, state-of-the-art, 35,000-seat stadium as an anchor for the NASED,
19 For instance, the assessments presented herein, predominantly prepared by DTA in Fall 2019 and the first weeks of 2020 with reference to cost and fiscal information available at that time, did not anticipate and have not been adjusted to reflect the COVID-19 pandemic, which is currently affecting markets, financing, and development throughout the world. See statement in Section 1.8.
State TOD Planning & Implementation Project, Island of O‘ahu
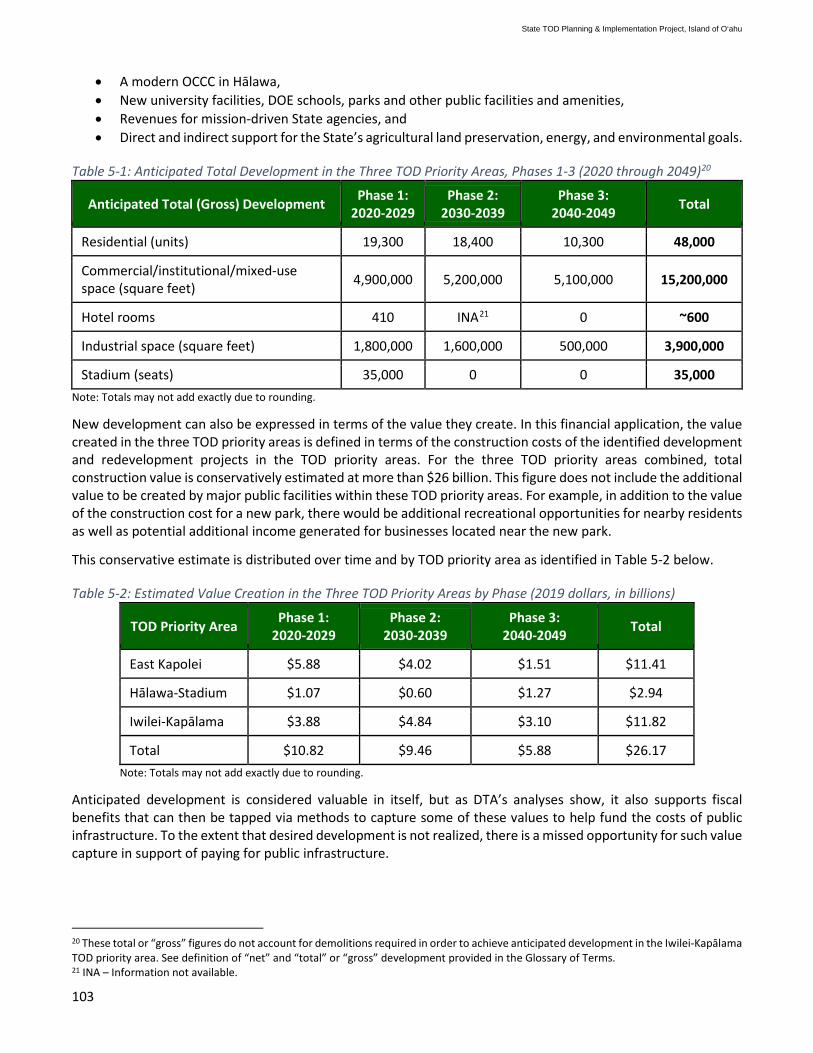
103
• A modern OCCC in Hālawa, • New university facilities, DOE schools, parks and other public facilities and amenities, • Revenues for mission-driven State agencies, and • Direct and indirect support for the State’s agricultural land preservation, energy, and environmental goals.
Table 5-1: Anticipated Total Development in the Three TOD Priority Areas, Phases 1-3 (2020 through 2049)20
Anticipated Total (Gross) Development Phase 1: 2020-2029
Phase 2: 2030-2039
Phase 3: 2040-2049 Total
Residential (units) 19,300 18,400 10,300 48,000
Commercial/institutional/mixed-use space (square feet) 4,900,000 5,200,000 5,100,000 15,200,000
Hotel rooms 410 INA21 0 ~600
Industrial space (square feet) 1,800,000 1,600,000 500,000 3,900,000
Stadium (seats) 35,000 0 0 35,000 Note: Totals may not add exactly due to rounding.
New development can also be expressed in terms of the value they create. In this financial application, the value created in the three TOD priority areas is defined in terms of the construction costs of the identified development and redevelopment projects in the TOD priority areas. For the three TOD priority areas combined, total construction value is conservatively estimated at more than $26 billion. This figure does not include the additional value to be created by major public facilities within these TOD priority areas. For example, in addition to the value of the construction cost for a new park, there would be additional recreational opportunities for nearby residents as well as potential additional income generated for businesses located near the new park.
This conservative estimate is distributed over time and by TOD priority area as identified in Table 5-2 below.
Table 5-2: Estimated Value Creation in the Three TOD Priority Areas by Phase (2019 dollars, in billions)
TOD Priority Area Phase 1: 2020-2029
Phase 2: 2030-2039
Phase 3: 2040-2049 Total
East Kapolei $5.88 $4.02 $1.51 $11.41
Hālawa-Stadium $1.07 $0.60 $1.27 $2.94
Iwilei-Kapālama $3.88 $4.84 $3.10 $11.82
Total $10.82 $9.46 $5.88 $26.17 Note: Totals may not add exactly due to rounding.
Anticipated development is considered valuable in itself, but as DTA’s analyses show, it also supports fiscal benefits that can then be tapped via methods to capture some of these values to help fund the costs of public infrastructure. To the extent that desired development is not realized, there is a missed opportunity for such value capture in support of paying for public infrastructure.
20 These total or “gross” figures do not account for demolitions required in order to achieve anticipated development in the Iwilei-Kapālama TOD priority area. See definition of “net” and “total” or “gross” development provided in the Glossary of Terms. 21 INA – Information not available.
State TOD Planning & Implementation Project, Island of O‘ahu

104
5.4 Estimated Infrastructure Costs by TOD Priority Area As suggested in Table 5-2 above, the three TOD priority areas are very different from one another in terms of the types and timing of development expected to occur. These differences in types and timing of development influence the ability of each TOD priority area to generate revenue to pay for infrastructure, and over different time horizons.
The East Kapolei TOD priority area is a largely greenfield development in that no demolitions are necessary to implement the proposed new development. Also a very large private development project, the 11,700-home Ho‘opili community by D.R. Horton, is already underway in this priority area, providing immediate development momentum and generating tax revenues. Other development that may take longer to materialize in the TOD priority area include more campus and TOD development by UHWO22, and TOD and industrial facilities by DLNR. DHHL is also proceeding with buildout of residential subdivisions for native Hawaiian beneficiaries in the TOD priority area.
The Hālawa-Stadium TOD priority area, in contrast, is focused on public and community-serving development, such as demolition and replacement of the existing Aloha Stadium and conversion of the Stadium property into the NASED, significant affordable housing development, and relocation of the OCCC to Hālawa. Several private landowners in the TOD priority area are assumed to take advantage of TOD development opportunities with future mixed-use development, but such development plans are not known to have been initiated and therefore were not modelled. To the extent such corollary development occurs, it would provide further support to the financing tools described herein.
The Iwilei-Kapālama TOD priority area is expected to see mostly urban redevelopment and infill development, with mixed-use and possibly modern industrial development replacing some of today’s low-density industrial and commercial uses on large lots. However, the TOD priority area also includes HCC and nearly 9,000 homes, most in small-lot single-family settings. Most new development in this TOD priority area will require demolition of existing facilities.
Details on the preferred plans in each of the three TOD priority areas are included in Sections 2 to 4. The sections below provide a recap of the shared infrastructure needed to implement these plans, and the associated costs of this infrastructure. The regional infrastructure costs in the tables below do not include on-site infrastructure costs attributable to specific development projects, but do include soft costs related to the planning and design of the infrastructure projects.
5.4.1 East Kapolei TOD Priority Area Estimated Infrastructure Costs Based on the assessment prepared by RMT, the costs of shared regional infrastructure necessary to implement the anticipated development scenario within the East Kapolei TOD priority area are estimated at $2.22 billion, with the breakdown by phase shown below in Table 5-3.
22 The anticipated residential development included in this assessment was based on the previously approved 2018 Proposed UHWO Campus Land Plan, as presented to the Board of Regents, and is subject to change.
State TOD Planning & Implementation Project, Island of O‘ahu

105
Table 5-3: East Kapolei TOD Priority Area Infrastructure Costs by Type and Phase (2019 dollars, in millions)
East Kapolei TOD Priority Area Infrastructure Costs
Infrastructure Type Phase 1
Infrastructure Costs (2020-2029)
Phase 2 Infrastructure Costs
(2030-2039)
Phase 3 Infrastructure Costs
(2040-2049) Total Costs
Electrical Improvements $5.2 $5.2 $5.2 $15.6
Roadway Improvements $345.7 $140.2 $59.9 $545.7
School Improvements $443.5 $414.0 $618.0 $1,475.5
Sewer Improvements $4.0 $43.3 $9.6 $56.8
Storm Water/Drainage $37.8 $6.9 - $44.7
Water Improvements $63.3 - $21.8 $85.2
TOTALS $899.5 $609.6 $714.5 $2,223.6
Note: Table includes soft costs, estimated at 20% of hard costs, and does not include on-site infrastructure. Totals may not add exactly due to rounding.
The cost of Phase 1 (2020-2029) infrastructure is approximately $0.90 billion. However, an estimated $0.59 billion in funding is already committed for infrastructure projects identified in Phase 1 (2020-2029). “Committed funds” refers to money or other resources that have been dedicated or obligated for specific objectives, in this case to specific infrastructure projects. Such funding generally comes from traditional sources such as CIP funds, bond proceeds, existing impact fee programs, and the like.
After deducting known committed funds, Table 5-4 identifies the unfunded regional infrastructure costs by infrastructure type and phase. “Unfunded” refers to the portion of estimated required infrastructure costs that has not been provided for via traditional funding sources. The major unfunded regional infrastructure costs for Phase 1 (2020-2029) are about $0.17 billion.
Table 5-4: East Kapolei TOD Priority Area Unfunded Infrastructure Costs by Type and Phase (2019 dollars, in millions)
East Kapolei TOD Priority Area Unfunded Infrastructure Costs
Infrastructure Type Phase 1
Funding Required (2020-2029)
Phase 2 Funding Required
(2030-2039)
Phase 3 Funding Required
(2040-2049)
Total Funding Required
Electrical Improvements $5.2 $5.2 $5.2 $15.6
Roadway Improvements $126.3 $140.2 $59.9 $326.3
School Improvements - $414.0 $618.0 $1,032.0
Sewer Improvements - - - -
State TOD Planning & Implementation Project, Island of O‘ahu
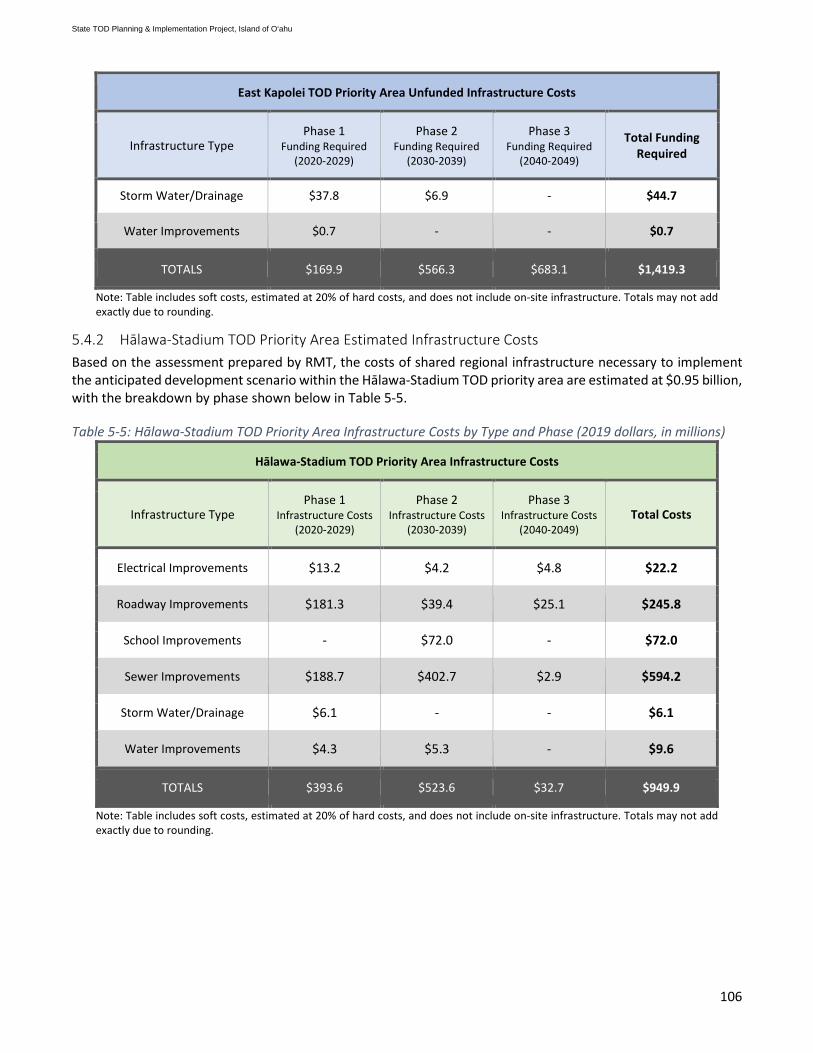
106
East Kapolei TOD Priority Area Unfunded Infrastructure Costs
Infrastructure Type Phase 1
Funding Required (2020-2029)
Phase 2 Funding Required
(2030-2039)
Phase 3 Funding Required
(2040-2049)
Total Funding Required
Storm Water/Drainage $37.8 $6.9 - $44.7
Water Improvements $0.7 - - $0.7
TOTALS $169.9 $566.3 $683.1 $1,419.3
Note: Table includes soft costs, estimated at 20% of hard costs, and does not include on-site infrastructure. Totals may not add exactly due to rounding.
5.4.2 Hālawa-Stadium TOD Priority Area Estimated Infrastructure Costs Based on the assessment prepared by RMT, the costs of shared regional infrastructure necessary to implement the anticipated development scenario within the Hālawa-Stadium TOD priority area are estimated at $0.95 billion, with the breakdown by phase shown below in Table 5-5.
Table 5-5: Hālawa-Stadium TOD Priority Area Infrastructure Costs by Type and Phase (2019 dollars, in millions)
Hālawa-Stadium TOD Priority Area Infrastructure Costs
Infrastructure Type Phase 1
Infrastructure Costs (2020-2029)
Phase 2 Infrastructure Costs
(2030-2039)
Phase 3 Infrastructure Costs
(2040-2049) Total Costs
Electrical Improvements $13.2 $4.2 $4.8 $22.2
Roadway Improvements $181.3 $39.4 $25.1 $245.8
School Improvements - $72.0 - $72.0
Sewer Improvements $188.7 $402.7 $2.9 $594.2
Storm Water/Drainage $6.1 - - $6.1
Water Improvements $4.3 $5.3 - $9.6
TOTALS $393.6 $523.6 $32.7 $949.9
Note: Table includes soft costs, estimated at 20% of hard costs, and does not include on-site infrastructure. Totals may not add exactly due to rounding.
State TOD Planning & Implementation Project, Island of O‘ahu
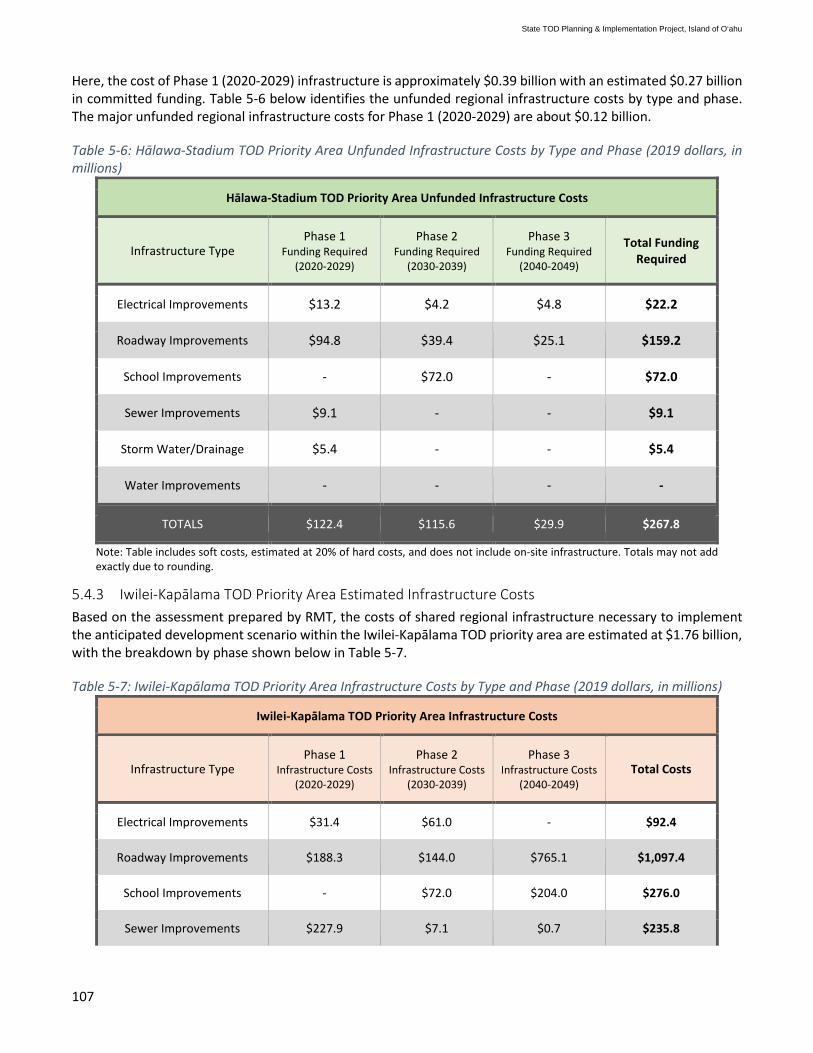
107
Here, the cost of Phase 1 (2020-2029) infrastructure is approximately $0.39 billion with an estimated $0.27 billion in committed funding. Table 5-6 below identifies the unfunded regional infrastructure costs by type and phase. The major unfunded regional infrastructure costs for Phase 1 (2020-2029) are about $0.12 billion.
Table 5-6: Hālawa-Stadium TOD Priority Area Unfunded Infrastructure Costs by Type and Phase (2019 dollars, in millions)
Hālawa-Stadium TOD Priority Area Unfunded Infrastructure Costs
Infrastructure Type Phase 1
Funding Required (2020-2029)
Phase 2 Funding Required
(2030-2039)
Phase 3 Funding Required
(2040-2049)
Total Funding Required
Electrical Improvements $13.2 $4.2 $4.8 $22.2
Roadway Improvements $94.8 $39.4 $25.1 $159.2
School Improvements - $72.0 - $72.0
Sewer Improvements $9.1 - - $9.1
Storm Water/Drainage $5.4 - - $5.4
Water Improvements - - - -
TOTALS $122.4 $115.6 $29.9 $267.8
Note: Table includes soft costs, estimated at 20% of hard costs, and does not include on-site infrastructure. Totals may not add exactly due to rounding.
5.4.3 Iwilei-Kapālama TOD Priority Area Estimated Infrastructure Costs Based on the assessment prepared by RMT, the costs of shared regional infrastructure necessary to implement the anticipated development scenario within the Iwilei-Kapālama TOD priority area are estimated at $1.76 billion, with the breakdown by phase shown below in Table 5-7.
Table 5-7: Iwilei-Kapālama TOD Priority Area Infrastructure Costs by Type and Phase (2019 dollars, in millions)
Iwilei-Kapālama TOD Priority Area Infrastructure Costs
Infrastructure Type Phase 1
Infrastructure Costs (2020-2029)
Phase 2 Infrastructure Costs
(2030-2039)
Phase 3 Infrastructure Costs
(2040-2049) Total Costs
Electrical Improvements $31.4 $61.0 - $92.4
Roadway Improvements $188.3 $144.0 $765.1 $1,097.4
School Improvements - $72.0 $204.0 $276.0
Sewer Improvements $227.9 $7.1 $0.7 $235.8
State TOD Planning & Implementation Project, Island of O‘ahu
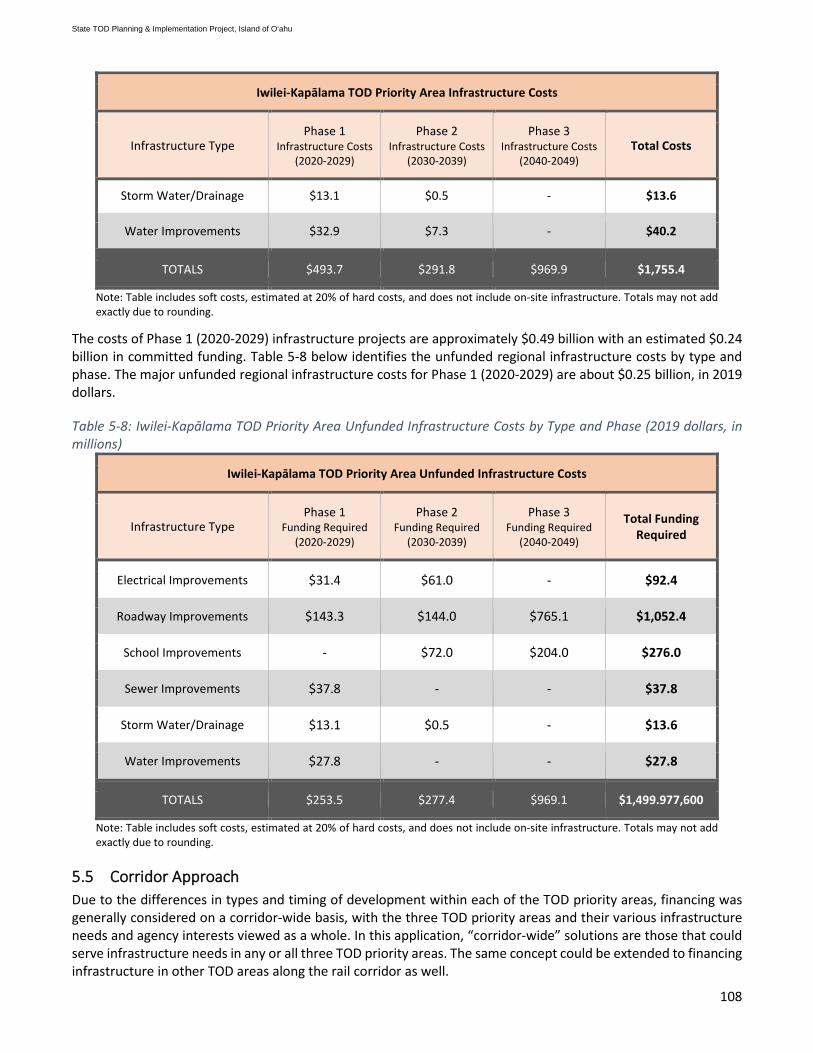
108
Iwilei-Kapālama TOD Priority Area Infrastructure Costs
Infrastructure Type Phase 1
Infrastructure Costs (2020-2029)
Phase 2 Infrastructure Costs
(2030-2039)
Phase 3 Infrastructure Costs
(2040-2049) Total Costs
Storm Water/Drainage $13.1 $0.5 - $13.6
Water Improvements $32.9 $7.3 - $40.2
TOTALS $493.7 $291.8 $969.9 $1,755.4
Note: Table includes soft costs, estimated at 20% of hard costs, and does not include on-site infrastructure. Totals may not add exactly due to rounding.
The costs of Phase 1 (2020-2029) infrastructure projects are approximately $0.49 billion with an estimated $0.24 billion in committed funding. Table 5-8 below identifies the unfunded regional infrastructure costs by type and phase. The major unfunded regional infrastructure costs for Phase 1 (2020-2029) are about $0.25 billion, in 2019 dollars.
Table 5-8: Iwilei-Kapālama TOD Priority Area Unfunded Infrastructure Costs by Type and Phase (2019 dollars, in millions)
Iwilei-Kapālama TOD Priority Area Unfunded Infrastructure Costs
Infrastructure Type Phase 1
Funding Required (2020-2029)
Phase 2 Funding Required
(2030-2039)
Phase 3 Funding Required
(2040-2049)
Total Funding Required
Electrical Improvements $31.4 $61.0 - $92.4
Roadway Improvements $143.3 $144.0 $765.1 $1,052.4
School Improvements - $72.0 $204.0 $276.0
Sewer Improvements $37.8 - - $37.8
Storm Water/Drainage $13.1 $0.5 - $13.6
Water Improvements $27.8 - - $27.8
TOTALS $253.5 $277.4 $969.1 $1,499.977,600
Note: Table includes soft costs, estimated at 20% of hard costs, and does not include on-site infrastructure. Totals may not add exactly due to rounding.
5.5 Corridor Approach Due to the differences in types and timing of development within each of the TOD priority areas, financing was generally considered on a corridor-wide basis, with the three TOD priority areas and their various infrastructure needs and agency interests viewed as a whole. In this application, “corridor-wide” solutions are those that could serve infrastructure needs in any or all three TOD priority areas. The same concept could be extended to financing infrastructure in other TOD areas along the rail corridor as well.
State TOD Planning & Implementation Project, Island of O‘ahu

109
The corridor approach is favored because it is seen to allow strategic public investments, and to take advantage of market forces when projects are ready for development, rather than necessitating competition between agencies and TOD areas for their respective funds. Additionally, this approach:
• Supports more robust and diverse funding sources/revenue streams for infrastructure investments. • Recognizes that the readiness for financing within each TOD priority area will vary over time, depending
on the status of development projects, and the mix of income-producing versus community-serving facilities that are included. While one TOD priority area may appear to be more than able to cover its costs in one phase, it could experience shortfalls in others.
• With effective coordination, may offer more responsiveness to changing needs and opportunities as they emerge across the corridor.
• Allows TOD areas with greater private sector participation or market orientation to lend support to major development and redevelopment projects that serve important State- and City-wide interests such as UHWO and HCC, a new stadium, correctional facility, and public and affordable housing development.
• May help to minimize competition for limited funding resources among area-based lobbying groups. • May enhance the financial underwriting for various systems by promoting economies of scale for both
revenue sources as well as for development efforts. Underwriting refers to the analysis and assurance of source revenues.
• Promotes dialogue and collaboration between jurisdictions, agencies, and landowners on a coordinated strategy for timely and efficient delivery of area infrastructure; the goal would be to “dig once”, rather than requiring individual developers to invest in incremental system improvements as individual projects come online.
The following section reviews the funding requirements of the three TOD priority areas combined.
5.6 Overall Funding Requirements for the Three TOD Priority Areas Shared regional infrastructure to support State agency goals in the three TOD priority areas is estimated to cost $4.93 billion over the next 30 years, in 2019 dollars. To date, an estimated $1.74 billion in funding has been identified from existing funding sources, including 2- and 6-year CIP funds, anticipated yields of sewer and water revenue bonds, ‘Ewa Highway Impact Fees, and anticipated DOE funding. This leaves an unfunded balance, or remaining cost after accounting for the existing funding sources, of some $3.19 billion.
Figure 5-1: Overview of Shared Regional Funding Needs for the Three TOD Priority Areas (2019 dollars, in billions)
$1.24
$0.47 $0.04
$0.55
$0.96 $1.68
$ 1 . 79 BPHASE 1
(2 02 0 -2029)
$1 .42BPHASE 2
(2030-2039)
$1 .72BPHASE 3
(2040-2049)
Funded Unfunded
State TOD Planning & Implementation Project, Island of O‘ahu

110
5.7 Phase 1 Financial Analysis (2020-2029) DTA’s financial analysis focuses on Phase 1 development and redevelopment projects, for the reasons noted previously. All Phase 1 development and redevelopment projects are assumed to be implemented between 2020 and 2029.
Table 5-9: TOD Priority Area Phase 1 Net New Development (2020-2029)23
TOD Priority Area Residential (Units)
Commercial / Mixed-use /
Institutional Space (SF)
Hotel Rooms Industrial Space (SF)
East Kapolei 9,740 3,464,696 180 1,186,300 Hālawa-Stadium 1,404 333,000 230 0 Iwilei-Kapālama 7,060 448,127 0 -349,210 Total 18,204 4,245,823 410 837,090
Regional infrastructure necessary to support the Phase 1 (2020-2029) development plans alone are estimated at $1.79 billion. Of this amount, about $1.24 billion is already funded, meaning it has been “committed” via conventional means. For purposes of this study, “committed” funding includes the following, which are discussed in further detail in a subsequent section:
• Funding for enterprise programs such as ENV or BWS, which provide wastewater and drinking water facilities, respectively. Such programs may generate or obtain funds via revenue bonds, the State revolving fund, facilities charges, and impact fees.
• Funding for certain highway improvements in East Kapolei that will benefit from ‘Ewa Highway Impact Fee revenues.
• Two-year CIP funds, representing monies already allocated to specific infrastructure projects. • Six-year CIP funds, representing monies that are planned to be allocated to specific infrastructure
projects. • Funding expected to be provided via CIP and/or other sources to cover costs of the planned Phase 1
(2020-2029) public secondary schools, all of which would be located in East Kapolei.
The remaining $0.55 billion, the net unfunded costs of regional-serving infrastructure, was the focus of the study’s financial assessment. However, it is also recognized that some committed funding, particularly the 6-year CIP funds, may not become available within a timeframe that would support the desired timing of anticipated development. Thus, investment strategies that can accelerate the generation of funds for infrastructure construction and/or exceed this net unfunded threshold would be favored.
5.8 Conventional and Alternative Funding Approaches As part of this study, DTA reviewed a number of financing mechanisms for purposes of funding TOD infrastructure. The information provided from DTA’s analysis along with other information compiled by the planning team has been incorporated into the discussion below.
5.8.1 Existing Funding Approaches Under current conditions, the State and/or City must secure an additional $0.55 billion, in addition to the $1.24 billion already committed, in order to complete funding for the necessary infrastructure to implement Phase 1 (2020-2029). Even larger efforts would need to be duplicated in subsequent years to generate more than $2.64 billion in currently unfunded needs for Phases 2 (2030-2039) and 3 (2040-2049).
As noted above, the State and City typically finance major infrastructure using sources such as general obligation (GO) bonds, revenue bonds, or appropriations from general funds. These public funds are often committed in 2-
23 These Phase 1 (2020-2029) figures differ from those shown previously in Tables 2-1, 3-1, and 4-1 in that they represent net development, after adjustment for anticipated associated demolitions necessary in the Iwilei-Kapālama TOD priority area.
State TOD Planning & Implementation Project, Island of O‘ahu
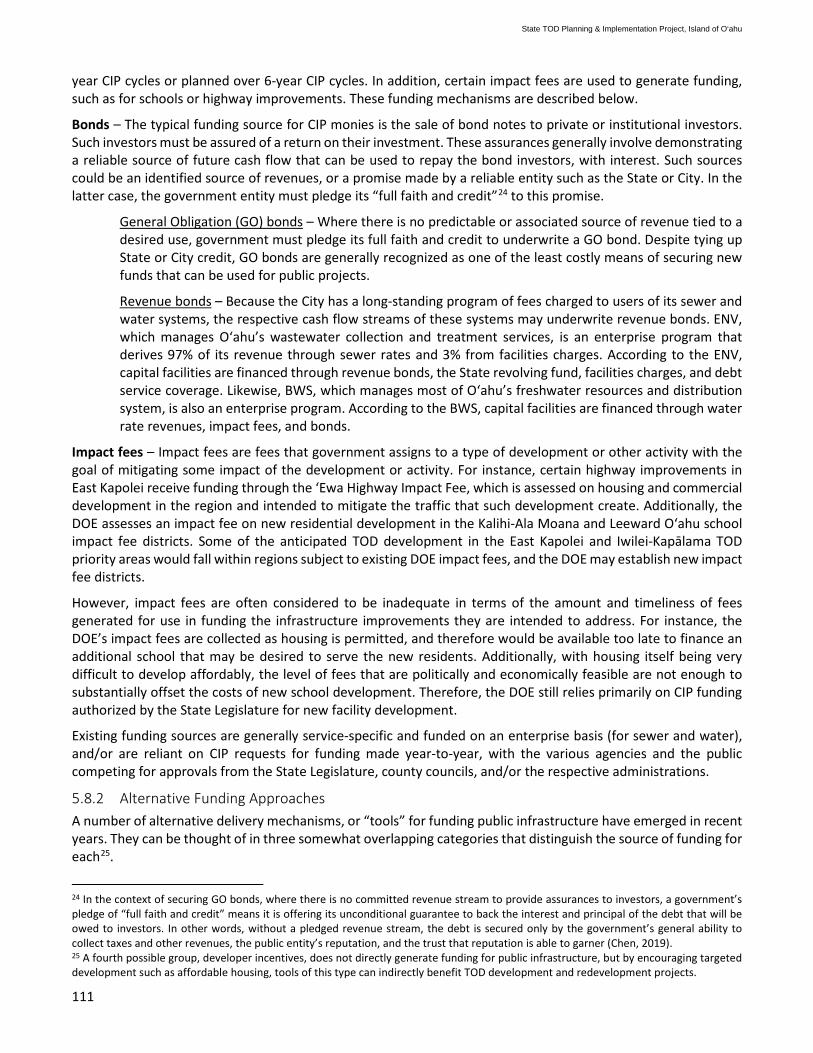
111
year CIP cycles or planned over 6-year CIP cycles. In addition, certain impact fees are used to generate funding, such as for schools or highway improvements. These funding mechanisms are described below.
Bonds – The typical funding source for CIP monies is the sale of bond notes to private or institutional investors. Such investors must be assured of a return on their investment. These assurances generally involve demonstrating a reliable source of future cash flow that can be used to repay the bond investors, with interest. Such sources could be an identified source of revenues, or a promise made by a reliable entity such as the State or City. In the latter case, the government entity must pledge its “full faith and credit”24 to this promise.
General Obligation (GO) bonds – Where there is no predictable or associated source of revenue tied to a desired use, government must pledge its full faith and credit to underwrite a GO bond. Despite tying up State or City credit, GO bonds are generally recognized as one of the least costly means of securing new funds that can be used for public projects.
Revenue bonds – Because the City has a long-standing program of fees charged to users of its sewer and water systems, the respective cash flow streams of these systems may underwrite revenue bonds. ENV, which manages O‘ahu’s wastewater collection and treatment services, is an enterprise program that derives 97% of its revenue through sewer rates and 3% from facilities charges. According to the ENV, capital facilities are financed through revenue bonds, the State revolving fund, facilities charges, and debt service coverage. Likewise, BWS, which manages most of O‘ahu’s freshwater resources and distribution system, is also an enterprise program. According to the BWS, capital facilities are financed through water rate revenues, impact fees, and bonds.
Impact fees – Impact fees are fees that government assigns to a type of development or other activity with the goal of mitigating some impact of the development or activity. For instance, certain highway improvements in East Kapolei receive funding through the ‘Ewa Highway Impact Fee, which is assessed on housing and commercial development in the region and intended to mitigate the traffic that such development create. Additionally, the DOE assesses an impact fee on new residential development in the Kalihi-Ala Moana and Leeward O‘ahu school impact fee districts. Some of the anticipated TOD development in the East Kapolei and Iwilei-Kapālama TOD priority areas would fall within regions subject to existing DOE impact fees, and the DOE may establish new impact fee districts.
However, impact fees are often considered to be inadequate in terms of the amount and timeliness of fees generated for use in funding the infrastructure improvements they are intended to address. For instance, the DOE’s impact fees are collected as housing is permitted, and therefore would be available too late to finance an additional school that may be desired to serve the new residents. Additionally, with housing itself being very difficult to develop affordably, the level of fees that are politically and economically feasible are not enough to substantially offset the costs of new school development. Therefore, the DOE still relies primarily on CIP funding authorized by the State Legislature for new facility development.
Existing funding sources are generally service-specific and funded on an enterprise basis (for sewer and water), and/or are reliant on CIP requests for funding made year-to-year, with the various agencies and the public competing for approvals from the State Legislature, county councils, and/or the respective administrations.
5.8.2 Alternative Funding Approaches A number of alternative delivery mechanisms, or “tools” for funding public infrastructure have emerged in recent years. They can be thought of in three somewhat overlapping categories that distinguish the source of funding for each25.
24 In the context of securing GO bonds, where there is no committed revenue stream to provide assurances to investors, a government’s pledge of “full faith and credit” means it is offering its unconditional guarantee to back the interest and principal of the debt that will be owed to investors. In other words, without a pledged revenue stream, the debt is secured only by the government’s general ability to collect taxes and other revenues, the public entity’s reputation, and the trust that reputation is able to garner (Chen, 2019). 25 A fourth possible group, developer incentives, does not directly generate funding for public infrastructure, but by encouraging targeted development such as affordable housing, tools of this type can indirectly benefit TOD development and redevelopment projects.
State TOD Planning & Implementation Project, Island of O‘ahu

112
Funding sources
Revenue diversion/value capture – Value capture is a concept in which the increase in property productivity and value as a result of public infrastructure improvements is “captured” through a set aside of the incremental new property taxes, sales or GET, or other taxes, fees or fiscal means. These additional values can be captured by a number of mechanisms, including tax increment financing (TIF), P3s, or arrangements where a third party collects PILOT.26
Value capture approaches use existing tax structures to divert all or a portion of taxes or fees that would have otherwise gone to a general fund, and commit them to a specific use, generally for a defined period. Most often, this is applied to a share of the tax or fees that a new development enabled by the improvements will generate, and the revenues diverted are seen as capturing some of the value created by new development. A value capture tool could work by setting up a special government fund to collect and disburse proceeds for the designated use, or it could be implemented by a non-governmental entity such as a developer. In the latter case, government could receive funds from the developer as PILOT. In Hawai‘i, the major existing tax structures that might be tapped in this way include the State’s GET and the counties’ RPTs.
New revenues – Some mechanisms create new sources of revenue, adding new costs or fees to development or properties that are considered to benefit from the improvements. Community Facilities Districts (CFDs), ID, impact fees, or simply raising taxes for specific purposes are examples of new revenue tools.
Outside funding – Some mechanisms, such as special grants or credits, represent outside (non-local and/or non-governmental) funds, which may or may not need to be paid back via another financing mechanism. Outside funding depends on one’s perspective. Any private grant would be viewed by government as outside funds; State funds would be considered outside from a county’s perspective; and federal funds would be considered outside to either a State or County entity. The federal LIHTC and Community Development Block Grants (CDBG), both applicable to certain affordable housing projects, are examples of monies that would be considered outside funding by the State or counties.
Generation of funds
The means by which any given tool generates its funds can also be categorized. Public financing generally yields revenues either in a “pay-as-you-go” approach, or via long-term borrowing. A tool may also yield revenues via a combination of the two, but it is helpful to understand funding from these viewpoints.
“Pay-as-you-go” – In this approach, revenues from general appropriations or a dedicated funding source are applied to target projects as the funds are generated or as they become available. Typical sources are RPT, GET set-asides, one-time impact fees, or even fines and budget surpluses. “Pay-as-you-go” means year-by-year accountability and no borrowing costs. However, it also means that funds may fall short or be generated slowly, and sufficient revenues may not be available at a scale needed to fund projects when funding is needed or desired. Funds originating from “pay-as-you-go” sources are also less reliable than those originating from borrowing, because the taxes, fees and other sources that underlie “pay-as-you-go” funding tend to vary with short- and longer-term business cycles, economic or other disruptions, and other generally unpredictable events.
Borrowing – Long-term borrowing presents another set of opportunities and obstacles. On the opportunities side, government-sponsored debt can provide the revenue and flexibility to fund large-scale infrastructure projects, at borrowing rates that are lower than those available to the private sector. For instance, GO bonds are typically paid off over 30 years with tax-exempt interest rates, plus various up-front charges. However, convincing constituents and/or public officials of the merits of incurring additional debt can be challenging.
26 Nationally, the most common value capture mechanism employed is TIF. However, certain legal considerations regarding use of this approach have been raised in Hawai‘i; therefore, the DTA assessment assumed that TIF would not be the mechanism by which value capture would be accomplished. See also Section 5.8.4.
State TOD Planning & Implementation Project, Island of O‘ahu

113
5.8.3 Financing Goals for the TOD Priority Areas The DTA study was tasked with finding alternative delivery mechanisms to existing funding approaches that could offer a longer-term solution to financing the regional infrastructure needs for the three TOD priority areas. The preference was for tools that could fund multiple infrastructure types, projects, and agency interests, as well as dual jurisdictions (State or City), with little to no impairment of existing State or City revenues. The approach taken also viewed funding on a corridor-wide basis, for reasons explained previously.
A financing and investment strategy that offers accelerated yields and a legacy of revenues to support future public infrastructure needs would be the most preferred.
5.8.4 Alternative Tools Considered After a thorough review of the available funding mechanisms and based on the goals identified, strong preference was given to options that would entail no impairment of existing State or City revenues and no new public taxes. It was also understood that outside funding initiatives will be pursued, but cannot be counted on, and therefore were not included in the analysis.
Summarized below are the primary financing mechanisms utilized in the DTA Model.
Value capture tools
DTA’s analyses suggested the most promising tools included three types of value capture methods. The analysis assumes that value capture would be implemented via a PILOT or P3 structure, since those mechanisms tend to be flexible in terms of the type of revenues leveraged, and because of potentially unresolved legal issues regarding the use of TIF in Hawai‘i. The value capture mechanisms considered would tap additional or incremental growth in tax revenues from three established State and City tax revenue sources, including the following.
General Excise Tax (GET) from construction of the new facilities, which are generated “one-time” for each facility,
GET on operations of the new facilities are generated on an on-going basis, and
Real Property Taxes (RPT), generated on an ongoing basis by the additional tax assessed values of new facilities or development.
Once again, these value capture mechanisms would not reduce current State or City revenues; rather, some portion of the increase in future revenues from GET and/or RPT would be allocated to payment of infrastructure costs and not be available for other purposes.
New revenue source
In addition, the study considered a potential new source of revenues that would likewise not involve raising taxes.
Community Facilities Districts (CFDs) would represent entirely new sources of funds, generated in addition to existing taxes. Like the value capture tools, CFDs do not impair public revenues, but they do burden property owners within the designated area with an additional payment obligation. After initial analysis, CFDs were not pursued for these infrastructure purposes because of their relatively low revenue potential, their costs and effort of organization, and the concern that they could make development on State TOD lands less marketable compared to nearby properties outside the CFD.
State TOD Planning & Implementation Project, Island of O‘ahu

114
Table 5-10: Public Finance Alternatives Modelled: No Reduction to Existing Public Revenues Tool Source of funds for infrastructure
Value capture: One-time State GET on construction
Share of construction GET generated as new projects are developed within the three TOD priority areas
Value capture: Ongoing State GET on commercial operations
Share of incremental GET resulting from new expenditures or sales once new development is operational in the three TOD priority areas. Modeled for:
• Retail sales • Commercial and industrial space rents • Hotel room revenues
Value capture: County real property taxes (RPT)
Share of incremental increase in RPT revenue as a result of new development in the three TOD priority areas
New revenue: Community Facilities Districts (CFDs)
District authorized by property owners and City to levy special taxes to fund public improvements
Implementation of tools
Each of the identified tools could be implemented in various ways. For instance, the State could create special fund(s) with uses restricted to specific infrastructure expenses. The City’s Hanauma Bay Special Fund is an example of a funding source dedicated to a particular use. Alternatively, rather than paying Department of Taxation (DOTAX), developers, tenants, or property owners could make PILOT to a P3 or private entity that has been charged with providing the targeted infrastructure.27
5.9 Financing Analysis
5.9.1 Model Assumptions The alternative tools analysis focused on the $0.55 billion in unfunded Phase 1 (2020-2029) shared regional infrastructure needs identified in Section 5.4. The goal was to find alternative financing mechanisms, or tools, that could be used in Phase 1 (2020-2029), but that might also support infrastructure funding for future phases. A key goal was to identify more timely, reliable, and systemic approaches compared to conventional funding approaches.
In Phase 1 (2020-2029), based on discussions with the respective agencies, the financial model assumes the following.
• All 2- and 6-year CIP funds currently committed or planned to address the identified infrastructure projects are available for use when needed.28
• Sewer and water utility needs continue to be financed via ENV’s and BWS’s established processes, including revenue bonds, State revolving fund, water rate revenues, impact fees, etc.
• All ‘Ewa Highway Impact Fee revenue from relevant development projects in the East Kapolei TOD priority area will be available to offset the Phase 1 (2020-2029) roadway costs.
• Funding for planned Phase 1 (2020-2029) schools (all in East Kapolei) have already been committed through traditional means, including State CIP allocation, according to the DOE. These DOE impact fees are assumed to be directed to offset DOE facility construction costs.
27 Attachment A to the DTA report (Appendix G) provides more complete discussions of these and other tools considered. 28 In fact, the timely availability of CIP or other conventional funding sources cannot be assured. While the model assumes contemporaneous availability within phases in order to simplify the scenario presentations, the ability of alternate tools to provide funding on timetables not governed by conventional budgetary and approval processes is another impetus for considering alternate tools.
State TOD Planning & Implementation Project, Island of O‘ahu

115
Three scenarios
Other assumptions are presented in detail in the DTA report, Appendix G. DTA modelled three scenarios to meet the unfunded needs, using different combinations of potential financing tools/mechanisms as outlined below.
Scenario 1: Status Quo – This scenario is intended to show how typical current funding works, with reliance on State GO Bond and/or CIP sources. The scenario depicts outcomes for all three phases.
Before generating the two following alternative scenarios, DTA reviewed the potential tools described in Section 5.8, and created a benchmark assessment to consider the maximum potential Phase 1 (2020-2029) yield and various opportunities and constraints of each tool. Based on this benchmark analysis, three tools were selected for further evaluation with focus on Phase 1 (2020-2029) funding needs.
Scenario 2: Alternate Tools – This scenario shows alternative outcomes using three value capture methods that appeared most promising.
Scenario 3: Preferred Scenario with Gap Funding – This scenario improves on Scenario 2 by adding an additional tool to address the up-front Phase 1 (2020-2029) funding gap, and to leave a legacy of surplus funds that could support future phases.
5.9.2 Scenario 1: Status Quo (Phases 1-3, 2020 through 2049) Scenario 1 shows how financing might look if the State and City were to fund all costs through existing methods. This is referred to as the “Status Quo” approach.
This scenario assumes the State funds the $3.2 billion in remaining unfunded costs, including the $0.55 billion for Phase 1 (2020-2029), with a series of GO Bonds, authorized at the beginning of each phase. Proceeds would then be appropriated to fund individual infrastructure projects over the buildout of each phase. This approach requires the State pledge its “full faith and credit” to repayment of the bond notes, and the State would incur upfront costs and fees such as underwriters’ fees, consulting fees, legal fees, and other costs. As a result, the bond issuance amounts must exceed the net funding needs. Additionally, any bonds that are issued will need to be repaid, typically over a 30-year period, with interest charges. Assuming an average coupon rate of 4.00% over a 30-year term, Table 5-11 below summarizes the principal and interest obligations over the repayment period, which could be expected to extend to 2070.
Table 5-11: Potential Proceeds and Costs of GO Bonding (2019 dollars, in millions)
GO Bond Issuance Net Proceeds Required for Funding
Upfront, One-time Issuance Costs
Principal/Interest/ Administration
Obligation over 30 years29
Phase 1: 2020 – 2029 $546.0 $60.7 $1,078.7
Phase 2: 2030 – 2039 $959.2 $106.6 $1,895.3
Phase 3: 2040 – 2049 $1,682.1 $186.9 $2,991.2
Total $3,187.2 $354.1 $5,965.2 Source: DTA, 2020
Due to the interest carry and repayment schedule, while GO bonds are a viable funding source, they impact the State’s other credit capacity and would incur substantial additional costs through 2070, decades past the buildout of all three phases. As shown, generating the $3.19 billion in infrastructure funding needed is expected to cost $5.97 billion over the repayment period, or some $2.78 billion in additional costs. This is an approximately 87% additional load over the amounts needed for the infrastructure development itself.
29 Annual administration cost estimated to be approximately 2.5% of total principal and interest payment. Estimate subject to change.
State TOD Planning & Implementation Project, Island of O‘ahu
116
Figure 5-2: Illustrative Cash Flow, Scenario 1, All 3 Phases (2020 through 2049) (2019 dollars, in billions)
` Source: DTA, 2020
It is noted that the State might generate funds through a series of GO bonds such as depicted, but funds would actually be allocated to selected infrastructure projects through annual CIP appropriations.
5.9.3 Benchmark Assessment of Alternative Tools Returning to the alternative tools analysis, the four value capture tools were considered in terms of the hypothetical maximum revenue each might be expected to generate, based on the corridor-wide tax-generating facilities and activities within Phase 1 (2020-2029). Affordable housing and public facilities are often exempt from construction and ongoing GET as well as from RPT through various developer incentives already enacted. Therefore, such exemptions were modelled based on the mix of uses proposed. For this analysis, the three value capture methods are assumed to divert 100% of new GET revenues to be generated from three TOD priority area development’s construction GET, ongoing GET and RPT. In addition, a hypothetical CFD, which would represent an additional tax to affected property owners, is set at 15% of underlying RPT assessments, regardless of whether the property would be subject to RPT or not.
More likely, the State and City would not attempt to divert the maximum potential revenue from the selected tools due to several factors including other needs for such funds, public willingness to accept additional taxes (such as a CFD), political viability, etc. The maximum funding capacity is assessed only to provide a benchmark in terms of the total potential revenue that each tool might represent.
State TOD Planning & Implementation Project, Island of O‘ahu

117
Table 5-12: Hypothetical Yields of Selected Tools in Phase 1 (2020-2029) (2019 dollars, in millions)
Revenue Sources % of New Revenue
Hypothetically Assumed to be Allocated
Benchmark Revenue Capacity
Percent of Combined Capacity (Benchmark)
Construction GET 100% $227.6 15% Ongoing GET 100% $972.3 64% Property Taxes 100% $260.8 17% CFD Special Tax 15% $61.5 4% Total $1,522.3 100%
Source: DTA, 2020
As illustrated, the ongoing GET tool has by far the greatest capacity for generating funds, while the CFD, even when set at 15% of underlying values, has the least. The relatively low yield of the CFD occurs even though this calculation assumed it would be extended to RPT-exempt classes of properties such as affordable housing.
Figure 5-3: Benchmark Revenue Capacity of Selected Tools in Phase 1 (2020-2029) (2019 dollars, in millions)
Source: DTA, 2020
5.9.4 Scenario 2: Alternate Tools (Phase 1, 2020-2029) Scenario 2 reflects a value capture approach to funding the remaining development and costs for Phase 1 (2020-2029) only, and represents the consultant team’s initially recommended approach, as informed by agency and stakeholder representatives. The three value capture tools, representing the vast majority of the potential revenue generation described above, are employed. These tools would divert additional revenues to be generated within existing provisions of the State’s GET and the City’s RPT, and therefore entail no new tax burdens.
As modelled, the value capture methods based on construction GET, ongoing GET and incremental RPT would be applied only to new development, and only within the three TOD priority areas. A CFD special tax is not considered because of its small potential yield compared to the other tools, even when extended to affordable housing and other development projects typically granted exemption from RPT. In addition, in this infrastructure application, the CFD was disfavored because it could create marketplace handicaps for properties within the TOD priority areas relative to those outside the TOD priority areas, since those subject to the CFD would appear to be paying a higher RPT. Since a CFD must be approved by a majority of owners within the affected region, its passage could also be jeopardized.
Scenario 2 assumes that all construction GET generated by new development within the TOD priority areas, 50% of ongoing GET from retail, space lease, and hotel operations within the TOD priority areas, and 30% of the incremental RPT supported by net new development will be captured and diverted to a fund(s) to finance the
$228
$972
$261
$62
$- $100 $200 $300 $400 $500 $600 $700 $800 $900
$1,000
Construction GET Recurring GET Incremental RPT CFD Special Tax
State TOD Planning & Implementation Project, Island of O‘ahu

118
regional infrastructure needs. This yields about $0.79 billion, in 2019 dollars, over 20 years, or more than the $0.55 billion needed for Phase 1 (2020-2029).
Table 5-13: Summary of Scenario 2 Funding Sources and Yields in Phase 1 (2020-2029) (2019 dollars, in millions)
Revenue Sources % of New Revenue Allocated to Fund Infrastructure
Revenue Allocated to Fund Infrastructure
Construction GET 100% $227.6 Ongoing GET 50% $486.2 Property Taxes 30% $80.9 CFD Special Tax 0% $0.0 Total NA $794.7
Source: DTA, 2020
These revenue sources would be realized in a “pay-as-you-go” fashion, since none are readily bonded.
• The State’s GET is difficult to bond due to the unpredictability of the relatively small set of specific development or redevelopment projects and hence their tax generation; and
• The City’s RPT is more predictable once a new development or redevelopment is completed, but because most development in these TOD priority areas would occur on State lands, the City may have limited recourse in the event of nonpayment of the tax, thereby limiting the marketability of such bonds.
Without the ability to bond, revenues from the selected tools would materialize over time, whereas the shared regional infrastructure must be funded and built before most facilities are constructed. Considering its cash flow profile over time, Scenario 2 falls $0.22 billion short of cash flow needs in the early years of Phase 1 (2020-2029), with breakeven not occurring until about 2034, or mid-way through Phase 2 (2030-2039).
Figure 5-4: Illustrative Cash Flow, Scenario 2, Phase 1 (2020-2029) (2019 dollars, in billions)
Source: DTA, 2020
State TOD Planning & Implementation Project, Island of O‘ahu

119
5.9.5 Scenario 3: Preferred Scenario with Gap Funding (Phase 1, 2020-2029) Scenario 3 was created to address the initial gap in funding noted in Scenario 2, recognizing the early funding needs of infrastructure development, in contrast to the later emergence cash flow from additional tax revenues that are dependent on facility construction and operations in this “pay-as-you-go” approach. In this scenario, DTA sought to plug the initial funding gap of Phase 1 (2020-2029) with other sources that could be more immediately productive and would not depend on construction activity or new operations.
In consideration of the above, some stakeholders suggested an O‘ahu-wide GET surcharge for the short-term purpose of addressing the Phase 1 (2020-2029) gap need. As a surcharge, the proposed additional tool would not impact revenues available to the State General Fund or other uses, but it would represent a tax increase spread among O‘ahu residents and visitors. Based on historical collections, a 0.1% surcharge on O‘ahu GET collections for just 10 years could be expected to generate approximately $50 million per year, or $0.5 billion over the period, more than filling this gap. The surcharge could sunset once the initial gap funding needs are met and the other value capture tools are robust.
Table 5-14: Summary of Scenario 3: Preferred Scenario, Phase 1 (2020-2029) (2019 dollars, in millions)
Revenue Sources % of New Revenue Allocated to Fund Infrastructure
New Revenue Allocated to Fund Infrastructure (in Millions)
Construction GET 100% $227.6
Ongoing GET 50% $486.2
Property Taxes 30% $80.9
CFD Special Tax 0% $0.0
GET Surcharge Additional 0.1% GET for 10 Years $500.0
Total NA $1,294.7 Source: DTA, 2020
By filling the gap of the initially negative cash flows of Scenario 2, the GET surcharge in this Scenario allows the more gradual value capture revenue yields to accumulate. Thus, in addition to mitigating the former early shortfalls, this surcharge also generated a surplus in future years that could be applied to Phases 2 (2030-2039) and 3 (2040-2049), or to other TOD infrastructure needs. As modelled, Phase 1 (2020-2029) would generate a surplus of $406.2 million by 2031, and an additional $380.6 million by 2041.
State TOD Planning & Implementation Project, Island of O‘ahu

120
Figure 5-5: Illustrative Cash Flow, Preferred Scenario (Scenario 3), Phase 1 (2020-2029) (2019 dollars, in billions)
Source: DTA, 2020
5.9.6 Policy Considerations Relative to Tools Considered The scenarios presented deal with the unfunded amounts as presented. However, the same tools were tested at substantially higher levels of funding need than the estimated levels discussed above. These analyses showed the selected tools continued to be effective where the need is greater. The main difference from the analyses shown herein is that the initial funding gap shown for Scenario 2 was higher, and its breakeven date later. However, the GET surcharge described in Scenario 3 still provided an adequate solution to bridge this gap.
The value capture methods identified could be structured as special funds administered by government, similar to HHFDC’s Dwelling Unit Revolving Fund (DURF), or as PILOT that could be incorporated in a master development agreement with a P3 partner. The legal and administrative implications of these two approaches vary.
GET sources are often seen as being regressive. However, taxpayers include visitors as well as residents; therefore, the burden on residents is diluted. Some also consider GET sources unreliable, since they get triggered by actions that cannot be predicted, such as the development of a building within a certain timeframe or the success of a retail establishment. In context of the TOD priority area development, GET on construction is realized relatively early, but is short-term, or “one-time”. GET derived from operations is delayed relative to construction GET, but endures indefinitely, and was shown to have the largest potential revenue yield.
On the other hand, a new surcharge applied to all GET revenues on the island would combine the construction, operational, and other sources of GET revenues, and would not be tied to the development pace or scale within the TOD priority areas. It would also be available earlier than other methods considered, yielding revenues as soon as the new surcharge was enacted, and collections begin.
Throughout Hawai‘i, tools that are based on the current RPT structure are generally handicapped in terms of potential yield because of the relatively low RPT rates in the State. This is principally because in Hawai‘i, the State, not the counties, operate the public schools. This means that even substantial percentage increases to RPT yield relatively low dollars. Additionally, current City policy exempts many types of development that are sought in the
State TOD Planning & Implementation Project, Island of O‘ahu

121
TOD priority areas from RPT, including most affordable housing and public facilities. Finally, since much of the infrastructure that this study seeks to fund are systems that the City will eventually have to operate and maintain, the City will likely need increased revenues to maintain the additional capacities.
5.9.7 Other Potential Funding Sources TOD Council members and other stakeholders suggested a number of other potential sources of shared infrastructure funding that were not pursued because they would require significant legislative changes or new taxes or fees. These included the following.
• Legalizing and taxing recreational marijuana. • Legalizing and taxing lotteries or other forms of gambling. • New taxes or fees such as:
o Increases to the base GET, o Special user fees such as for the stadium or other facilities, o Additional fees on real estate transactions, o Congestion taxes on drivers, and o Expansion of geographic areas subject to current impact fees or the rates of fees such as highway
or DOE school impact fees. • Certificates for Potential Additional Construction (CePAC), a market-based land value capture tool created
in Brazil in 1995. This tool seeks to obtain compensation for development bonuses allowed in special districts; however, the City is already providing such bonuses with special TOD zoning and/or development agreements.
5.10 Conclusion The study team’s analysis determined that shared regional infrastructure necessary to support State agency goals in the three TOD priority areas could cost about $4.93 billion over the next 30 years, in 2019 dollars. Of this amount, $1.74 billion appears to be funded from existing sources, leaving an unfunded balance of some $3.19 billion.
DTA was charged with identifying financing mechanisms that could be viable options for government to bridge existing funding shortfalls and enable the desired development in the three TOD priority areas. This study sets forth a rationale for addressing all three TOD priority areas as a whole in a “corridor-wide approach”, rather than relying on traditional approaches that often put agencies and regions in competition with one another for limited public resources.
DTA first reviewed GO bonds, which has been the conventional means for funding public infrastructure not funded or financed by revenue bonds, grants, CIP appropriations, or impact fees. The modelling demonstrated that GO bonds could satisfy this unfunded balance, but at the cost of interest and other costs amounting to up to 87% over the targeted capital costs, with debt repayment extending decades beyond the implementation of the infrastructure. In addition, a GO bond approach commits a portion of the State and/or County’s available credit, potentially limiting governments’ ability to support other desired projects.
Thus, an alternative approach was sought that could accelerate and meet funding needs with no or minimal new taxes, and lower costs to government. Focusing on the estimated $0.55 billion in unfunded needs for Phase 1 (2020-2029), DTA reviewed a number of mechanisms and concluded that three value capture tools were most promising. These three tools entail no new taxes. Rather, they would capture a share of the future taxes that would apply to new development in the three priority areas. The selected tools and their recommended capture rates are:
• 100% of GET on development expenditures related to new construction within the TOD priority areas, • 50% of GET on spending at new retail, space leasing, and hotel operations within the TOD priority areas,
and • 30% of the additional RPT collected on new development within the TOD priority areas.
State TOD Planning & Implementation Project, Island of O‘ahu
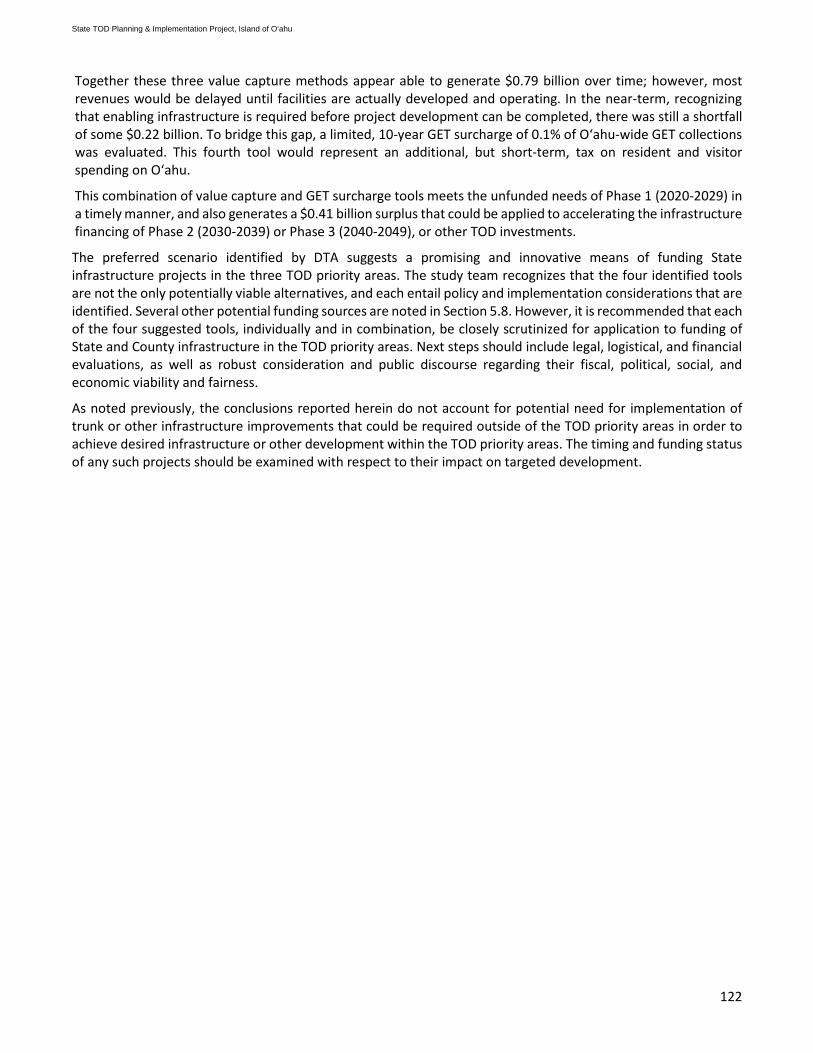
122
Together these three value capture methods appear able to generate $0.79 billion over time; however, most revenues would be delayed until facilities are actually developed and operating. In the near-term, recognizing that enabling infrastructure is required before project development can be completed, there was still a shortfall of some $0.22 billion. To bridge this gap, a limited, 10-year GET surcharge of 0.1% of O‘ahu-wide GET collections was evaluated. This fourth tool would represent an additional, but short-term, tax on resident and visitor spending on O‘ahu.
This combination of value capture and GET surcharge tools meets the unfunded needs of Phase 1 (2020-2029) in a timely manner, and also generates a $0.41 billion surplus that could be applied to accelerating the infrastructure financing of Phase 2 (2030-2039) or Phase 3 (2040-2049), or other TOD investments.
The preferred scenario identified by DTA suggests a promising and innovative means of funding State infrastructure projects in the three TOD priority areas. The study team recognizes that the four identified tools are not the only potentially viable alternatives, and each entail policy and implementation considerations that are identified. Several other potential funding sources are noted in Section 5.8. However, it is recommended that each of the four suggested tools, individually and in combination, be closely scrutinized for application to funding of State and County infrastructure in the TOD priority areas. Next steps should include legal, logistical, and financial evaluations, as well as robust consideration and public discourse regarding their fiscal, political, social, and economic viability and fairness.
As noted previously, the conclusions reported herein do not account for potential need for implementation of trunk or other infrastructure improvements that could be required outside of the TOD priority areas in order to achieve desired infrastructure or other development within the TOD priority areas. The timing and funding status of any such projects should be examined with respect to their impact on targeted development.
State TOD Planning & Implementation Project, Island of O‘ahu

123
6 Regional Infrastructure Planning Considerations: Sustainability, District Systems, and Flexible Adaptation Pathways (FAP)
The State and City have adopted a number of sustainability plans, policies, and initiatives to address climate change, sustainability, and resiliency. Drawing on these plans and initiatives and the infrastructure needs assessment for the three TOD priority areas described in the previous sections of this report, this section presents long-term infrastructure planning considerations related to climate change, sustainability, and resiliency that could help to address timing, cost, and approach to infrastructure planning for the future development of the State TOD priority areas. The content of this section was developed by Arup and provides a high level planning perspective on the opportunities and constraints of the State TOD priority areas and how sustainability solutions (if appropriate) may be advanced through alternative financing, technology solutions, and management structures. The intent of the Arup analysis is to:
• Identify where additional effort makes sense and why, especially recommendations to consider making infrastructure in the three TOD priority areas more resilient now and over time.
• Consider the three areas over 50-plus years; understanding how systems work over a long timeline, especially the likelihood of infrastructure technology changes over the 30-plus year buildout period, what some of those systems may be that Arup is witnessing from emerging best practice nationally and globally, and how they impact current infrastructure planning and delivery.
• Identify future work that should be done or carried forward and best practices for an entity that wants to invest over the long-term, focusing on emerging themes and practices for resilient infrastructure and the need for upfront investment in resilient infrastructure such as those being explored in the City of Boston’s Climate Ready Boston initiative.
Sustainability issues and recommendations as well as specific observations on sustainability challenges and opportunities for each TOD priority area are provided in the Arup report in Appendix H, Sustainability and Neighborhood-Serving Systems. A more detailed description of the use of FAPs to guide planning and financing of infrastructure investments in response to uncertainty about SLR can be found in Arup’s report, Flexible Adaptation Pathways: An Approach for Sea Level Rise and Flood Infrastructure, in Appendix I.
6.1 Sustainability Based on its review of State and City sustainability initiatives, Arup recommends the goal of climate-positive TOD communities be approached in a step-by-step approach that saves money and builds community by putting the highest benefits and least costs first in the priority list. By promoting higher density walkable communities (items 1 through 3 in Figure 6-1) means that less investment is needed in items 4 through 6 to achieve a similar level of sustainable outcomes. This means that with the same investment provided for items 4 through 6, greater sustainable outcomes can be achieved. These actions are adapted from Arup published research and discussed further below.
State TOD Planning & Implementation Project, Island of O‘ahu
124
Figure 6-1: Step-by-Step Approach to Climate-Positive Communities
Source: Arup, 2020
1. Dense: Right-Size Building (Community-Supporting Density)
Community-supporting density in the TOD priority areas will help achieve the State goals of lower carbon emissions per person. Planning for TOD at appropriate density avoids the excesses of larger, sprawling, low-density development that has emerged since the 1950s and allows for the creation of community-supporting services. Right sizing a development area allows for:
• Less wall area to gain heat (which then needs to be expelled), • Less space to artificially light and air-condition, • Less volume to ventilate with fan systems, • Less materials to construct (with embodied carbon in their manufacture and transport), and • Less goods to accumulate (with embodied carbon in their manufacture).
Figure 6-2 below compares the carbon intensity per person of 2- and 4-story buildings in a sample community development. As growth increases (expressed by the green arrow), carbon intensity per capita decreases across the good, better, and best variants (gray lines). As much as 70% lower carbon intensity per person results from better transit, smaller conditioned spaces, shared low heat transfer walls, avoided agricultural and rangeland development, and optimized neighborhood-serving energy, waste, and water infrastructure systems.
State TOD Planning & Implementation Project, Island of O‘ahu
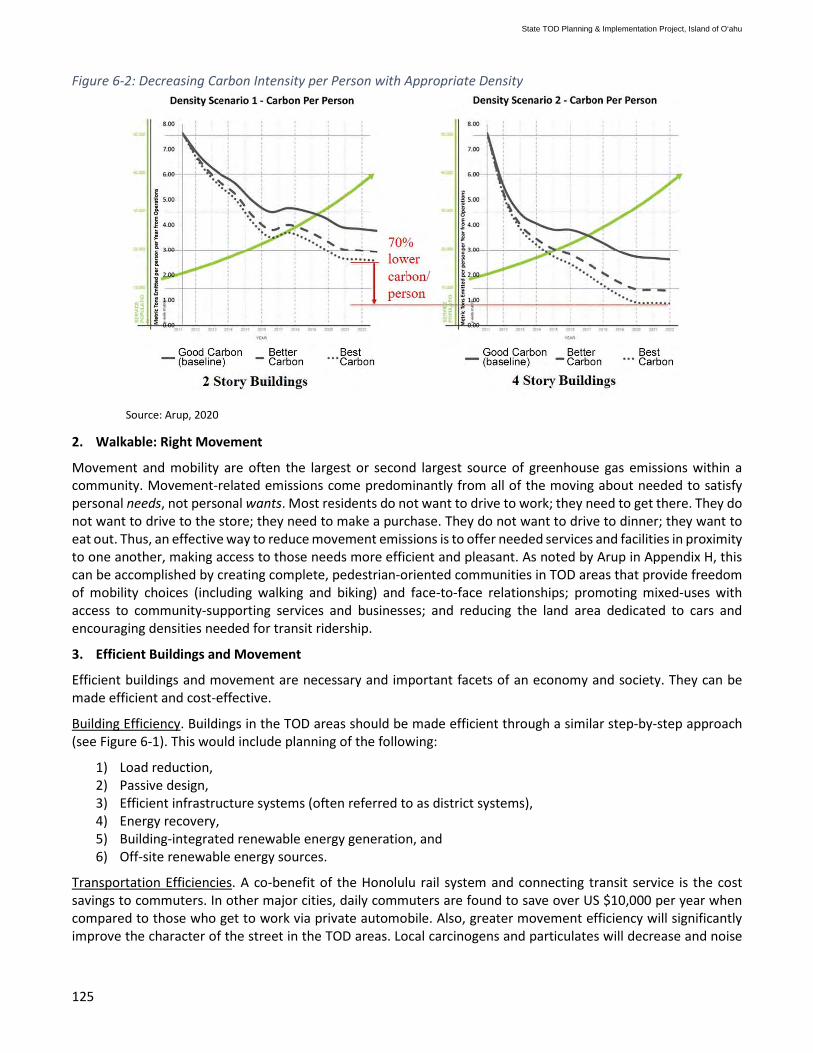
125
Figure 6-2: Decreasing Carbon Intensity per Person with Appropriate Density
Source: Arup, 2020
2. Walkable: Right Movement
Movement and mobility are often the largest or second largest source of greenhouse gas emissions within a community. Movement-related emissions come predominantly from all of the moving about needed to satisfy personal needs, not personal wants. Most residents do not want to drive to work; they need to get there. They do not want to drive to the store; they need to make a purchase. They do not want to drive to dinner; they want to eat out. Thus, an effective way to reduce movement emissions is to offer needed services and facilities in proximity to one another, making access to those needs more efficient and pleasant. As noted by Arup in Appendix H, this can be accomplished by creating complete, pedestrian-oriented communities in TOD areas that provide freedom of mobility choices (including walking and biking) and face-to-face relationships; promoting mixed-uses with access to community-supporting services and businesses; and reducing the land area dedicated to cars and encouraging densities needed for transit ridership.
3. Efficient Buildings and Movement
Efficient buildings and movement are necessary and important facets of an economy and society. They can be made efficient and cost-effective.
Building Efficiency. Buildings in the TOD areas should be made efficient through a similar step-by-step approach (see Figure 6-1). This would include planning of the following:
1) Load reduction, 2) Passive design, 3) Efficient infrastructure systems (often referred to as district systems), 4) Energy recovery, 5) Building-integrated renewable energy generation, and 6) Off-site renewable energy sources.
Transportation Efficiencies. A co-benefit of the Honolulu rail system and connecting transit service is the cost savings to commuters. In other major cities, daily commuters are found to save over US $10,000 per year when compared to those who get to work via private automobile. Also, greater movement efficiency will significantly improve the character of the street in the TOD areas. Local carcinogens and particulates will decrease and noise
State TOD Planning & Implementation Project, Island of O‘ahu

126
will be reduced. Additionally, the quiet and pollution-free vehicles (at point-of-use) can allow operable windows to be used, reducing the use of air-conditioning systems.
Community-Scale System Efficiency. There are opportunities for cost-effective and efficient infrastructure system opportunities at neighborhood scales beyond an individual building (e.g., due to load-sharing among mixed-use development projects). Often referred to as district systems, this scale of system is discussed in more detail in Section 6.2 below.
4. On-Site Renewables: Energy Supply
With efficient buildings in appropriate areas, with applicable density, scale, and the proper modal circulation in place, renewable energy sources could be included into the TOD areas to further enhance sustainability and resiliency. While it may seem counterintuitive to incorporate on-site renewables after efficient building and design, the order of these steps puts the highest benefits and least costs efforts first in the priority list. For buildings, this takes the form of distributed and utility-scale renewable electric and thermal energy systems. For movement, this may take the form of biofuel sources and decarbonized electrical supplies (from the distributed and utility-scale electric energy systems that can also serve buildings).
5. Off-Site Renewable Energy Supply
Where community renewable energy sources are inadequate to meet all needs, renewable energy from off-site facilities can address remaining needs. Such off-site systems may include solar photovoltaic, wind energy, or other renewable energy sources.
6. Sequestering: Sequestration of Consumption-Based Emissions
With the systems described above in place and by directing growth to compact TOD, TOD communities can contribute to sequestering carbon in biomass within the community and through preservation of the biomass and socioeconomic systems that farmland, open land, or environmentally sensitive areas outside of TOD areas provide. Much of the world’s carbon is bound in the world’s biomass. This biomass includes not only trees, shrubs, and other vegetation, but the very soil beneath, which (when healthy) is alive with biological activity. Sequestration measures that can be used within TOD communities can take the form of (1) landscape enhancements such as tree plantings, roof gardens, bioswales, and low-impact storm water improvements, or (2) the creation or restoration of native habitat, drainageways, or stream channels within the TOD community.
6.2 District Systems In each of the TOD priority areas, there is an opportunity for a “network” of services to multiple projects and/or buildings that could be formed. This network of services could capitalize on synergies and economies of scale to provide shared energy, water, goods movement, and waste services that cannot be captured at the level of individual buildings.
The reason for this is partly due to standalone uses, whose redundant activities and service demand within a community can reduce efficiency. However, mixed-uses and/or activities within a community can enhance efficiency – an example being the variation in electrical load of offices and residences between day and night. By combining or co-locating these activities and programs together in a mixed-use community, like in TOD communities, they can result in a flatter profile of overall service use and demand. By flattening peak demand – whether the resource is electricity, natural gas, water, or traffic – infrastructure operating costs may be lowered and optimized.
For this study, the baseline cost assessments for the TOD priority areas have not incorporated such system optimization. As a result, there remains opportunity for TOD stakeholders to advance such systems to the benefit of each TOD priority area as well as to the general public.
In this respect, Arup estimates district cooling systems in the TOD priority areas could reduce costs by 80-95% due to smaller capacities, greenfield development conditions, existing systems that can be expanded, or required
State TOD Planning & Implementation Project, Island of O‘ahu
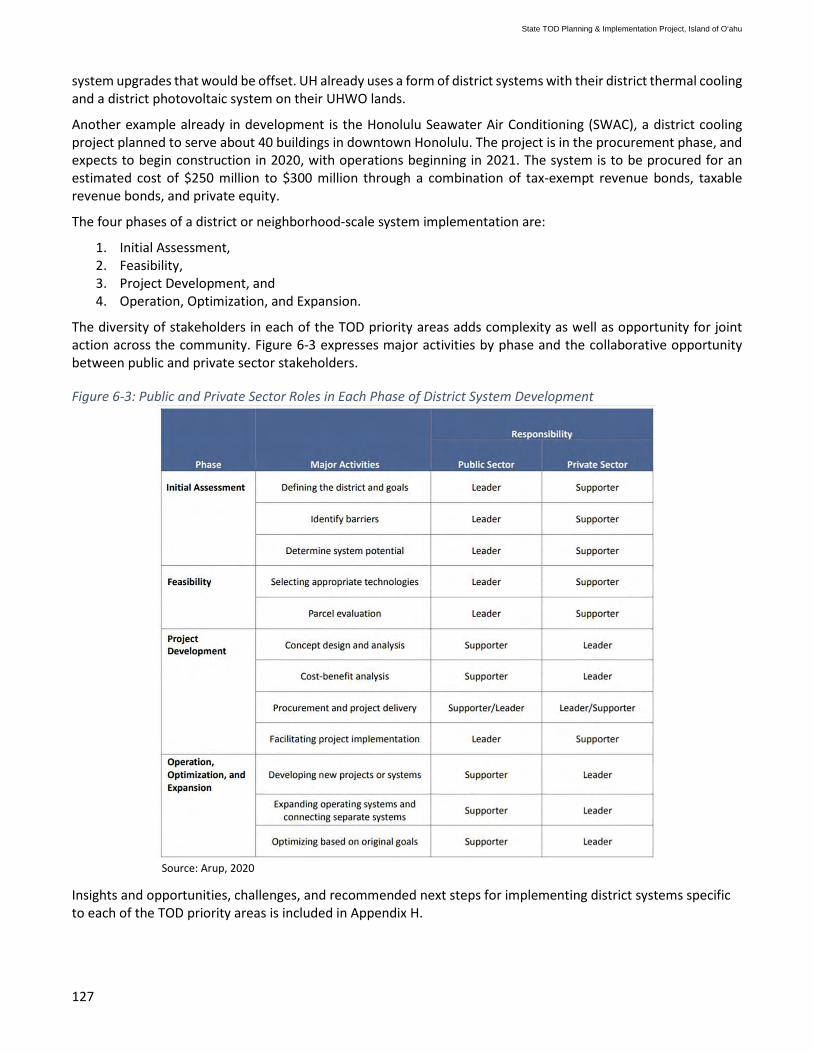
127
system upgrades that would be offset. UH already uses a form of district systems with their district thermal cooling and a district photovoltaic system on their UHWO lands.
Another example already in development is the Honolulu Seawater Air Conditioning (SWAC), a district cooling project planned to serve about 40 buildings in downtown Honolulu. The project is in the procurement phase, and expects to begin construction in 2020, with operations beginning in 2021. The system is to be procured for an estimated cost of $250 million to $300 million through a combination of tax-exempt revenue bonds, taxable revenue bonds, and private equity.
The four phases of a district or neighborhood-scale system implementation are:
1. Initial Assessment, 2. Feasibility, 3. Project Development, and 4. Operation, Optimization, and Expansion.
The diversity of stakeholders in each of the TOD priority areas adds complexity as well as opportunity for joint action across the community. Figure 6-3 expresses major activities by phase and the collaborative opportunity between public and private sector stakeholders.
Figure 6-3: Public and Private Sector Roles in Each Phase of District System Development
Source: Arup, 2020
Insights and opportunities, challenges, and recommended next steps for implementing district systems specific to each of the TOD priority areas is included in Appendix H.
State TOD Planning & Implementation Project, Island of O‘ahu
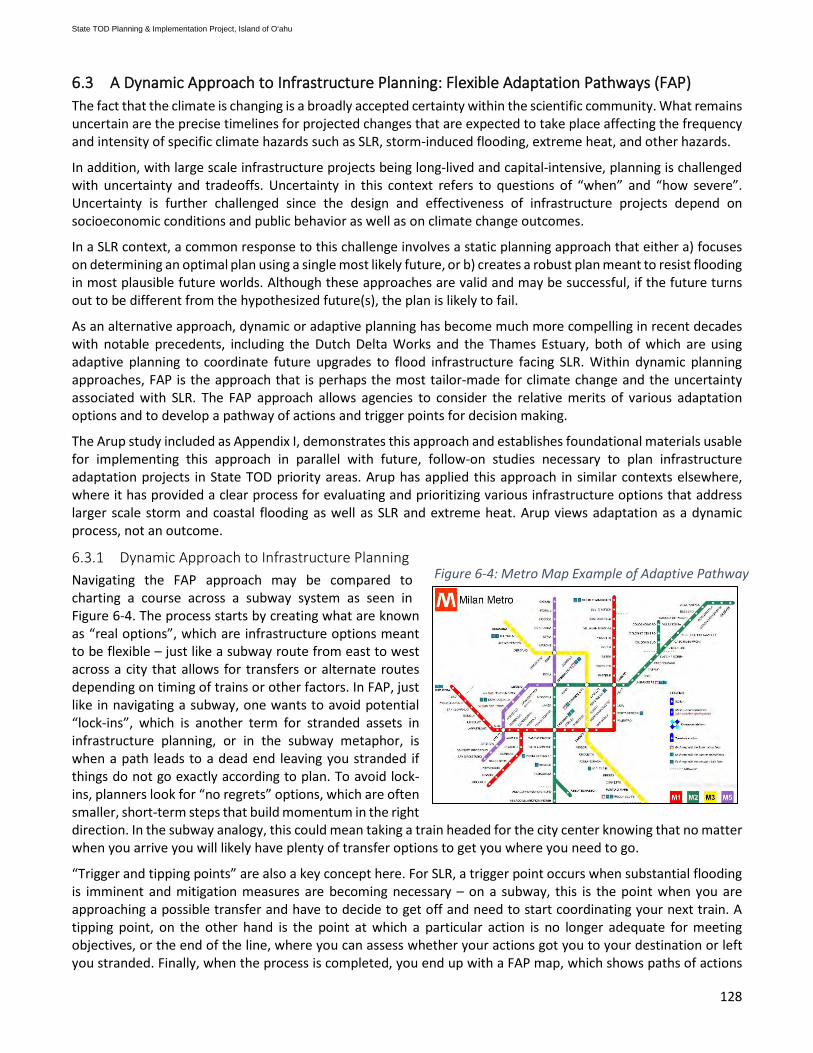
128
6.3 A Dynamic Approach to Infrastructure Planning: Flexible Adaptation Pathways (FAP) The fact that the climate is changing is a broadly accepted certainty within the scientific community. What remains uncertain are the precise timelines for projected changes that are expected to take place affecting the frequency and intensity of specific climate hazards such as SLR, storm-induced flooding, extreme heat, and other hazards.
In addition, with large scale infrastructure projects being long-lived and capital-intensive, planning is challenged with uncertainty and tradeoffs. Uncertainty in this context refers to questions of “when” and “how severe”. Uncertainty is further challenged since the design and effectiveness of infrastructure projects depend on socioeconomic conditions and public behavior as well as on climate change outcomes.
In a SLR context, a common response to this challenge involves a static planning approach that either a) focuses on determining an optimal plan using a single most likely future, or b) creates a robust plan meant to resist flooding in most plausible future worlds. Although these approaches are valid and may be successful, if the future turns out to be different from the hypothesized future(s), the plan is likely to fail.
As an alternative approach, dynamic or adaptive planning has become much more compelling in recent decades with notable precedents, including the Dutch Delta Works and the Thames Estuary, both of which are using adaptive planning to coordinate future upgrades to flood infrastructure facing SLR. Within dynamic planning approaches, FAP is the approach that is perhaps the most tailor-made for climate change and the uncertainty associated with SLR. The FAP approach allows agencies to consider the relative merits of various adaptation options and to develop a pathway of actions and trigger points for decision making.
The Arup study included as Appendix I, demonstrates this approach and establishes foundational materials usable for implementing this approach in parallel with future, follow-on studies necessary to plan infrastructure adaptation projects in State TOD priority areas. Arup has applied this approach in similar contexts elsewhere, where it has provided a clear process for evaluating and prioritizing various infrastructure options that address larger scale storm and coastal flooding as well as SLR and extreme heat. Arup views adaptation as a dynamic process, not an outcome.
6.3.1 Dynamic Approach to Infrastructure Planning Navigating the FAP approach may be compared to charting a course across a subway system as seen in Figure 6-4. The process starts by creating what are known as “real options”, which are infrastructure options meant to be flexible – just like a subway route from east to west across a city that allows for transfers or alternate routes depending on timing of trains or other factors. In FAP, just like in navigating a subway, one wants to avoid potential “lock-ins”, which is another term for stranded assets in infrastructure planning, or in the subway metaphor, is when a path leads to a dead end leaving you stranded if things do not go exactly according to plan. To avoid lock-ins, planners look for “no regrets” options, which are often smaller, short-term steps that build momentum in the right direction. In the subway analogy, this could mean taking a train headed for the city center knowing that no matter when you arrive you will likely have plenty of transfer options to get you where you need to go.
“Trigger and tipping points” are also a key concept here. For SLR, a trigger point occurs when substantial flooding is imminent and mitigation measures are becoming necessary – on a subway, this is the point when you are approaching a possible transfer and have to decide to get off and need to start coordinating your next train. A tipping point, on the other hand is the point at which a particular action is no longer adequate for meeting objectives, or the end of the line, where you can assess whether your actions got you to your destination or left you stranded. Finally, when the process is completed, you end up with a FAP map, which shows paths of actions
Figure 6-4: Metro Map Example of Adaptive Pathway
State TOD Planning & Implementation Project, Island of O‘ahu
129
that result in the least number of regrets, and overall, help the implementing agency get to their destination successfully.
The concepts described and definitions herein are adapted from the work of Dutch researcher, Marjolijn Haasnoot, and her collaborators (Haasnoot, Middelkoop, Offermans, van Beek, & van Deursen, 2012).
• Real options – infrastructure options with flexibility to adapt to future changes, rather than planned for a specific scenario at a specific time.
• Potential lock-ins – when an option leads to a failure, or inability to adjust adequately to a changed environment; path-dependency of investment decisions can lead to stranded assets/lock-ins if conditions change.
• No regrets options – options which achieve positive outcomes under all plausible projections of climate change.
• Trigger and tipping points – a trigger indicates when a decision is needed for a forthcoming action; a tipping point is the point at which a particular action is no longer adequate for meeting objectives.
• FAP map – path of actions that result in least regrets and achieves overall objectives.
6.3.2 Iwilei-Kapālama TOD Priority Area Study Example To illustrate this process more completely, the Arup study formulated a demonstration for the Iwilei-Kapālama TOD priority area. The demonstration provided herein is meant to serve for demonstration purposes and is not a recommended solution to the issue of SLR for the Iwilei-Kapālama area. Rather, it serves as a process for implementing an FAP approach to SLR and infrastructure planning for the area. In this example, Arup took the TOD planning objective of ensuring adequate infrastructure capacity and has incorporated flood protection considerations for the TOD priority area investments through 2100. To achieve this objective, four illustrative concepts were developed for large-scale flood infrastructure upgrades that could be considered for the area.
Four distinct flood mechanisms threaten the Iwilei-Kapālama TOD priority area – coastal/tidal flooding, storm water flooding, riverine flooding, and groundwater flooding. All of these flood hazards are expected to be impacted by climate change through both SLR and variabilities in storm frequency and intensity. Although detailed flood modeling has not been completed for the full district area, the inundation maps in Figure 6-5 below highlight low-lying areas susceptible to drainage issues and high groundwater.
In the Iwilei-Kapālama TOD priority area example, SLR is a major planning issue because a critical hazard, coastal/tidal flooding, changes over time. Coastal/tidal flooding refers to a high-tide flooding event that results in the temporary inundation of low-laying areas when local sea levels temporarily rise, in the absence of storm surge or riverine flooding, above an identified threshold for flooding (U.S. Climate Resilience Toolkit, 2020). Figure 6-5 shows the extent of a normal high tide under SLR outcomes varying from 3-feet to 6-feet. The flood extent shown here does not account for storm conditions in rainfall or surf. Additionally, with the Kapālama Canal and the Nu‘uanu Stream bordering this district on the north and south ends respectively, it is safe to assume that high flow events in either of these watercourses could result in flooding of the surrounding areas.
State TOD Planning & Implementation Project, Island of O‘ahu

130
Figure 6-5: Tidal Flooding from Various Levels of SLR Projected near Iwilei-Kapālama
Source: NOAA SLR Viewer, 2019
In this example, Arup generated four illustrative adaptation options that may be considered in meeting the identified objective of protecting major Iwilei-Kapālama infrastructure investments from flooding through the year 2100. These are:
1. Option 1, Protect and Pump, 2. Option 2, Raise and Restore, 3. Option 3, Barriers and Bulkheads, and 4. Option 4, Retreat and Restore.
In developing future large-scale infrastructure, plans will need to be outlined, phasing strategies developed, and costs and benefits estimated. It is difficult to know how flood protection infrastructure will perform over time given that the timing and magnitude of SLR could follow a number of different paths over the next century.
In Figure 6-6, these hypothetical planning options are overlaid on two SLR timeline scenarios – a “gradual climate change” of 3 feet of SLR by 2060, and a “rapid climate change” of 3 feet of SLR by 2040. Next, in creating the FAP map, the various routes one could take over time are charted for each of the four illustrative infrastructure options. This map is similar to a subway map, complete with decision points (known as adaptation triggers), transfer stations, and tipping points, which are the points at which objectives are no longer being met and where an alternative response or intervention is needed. The map also demonstrates that a single infrastructure option could be pursued exclusively, or that the planning objective may need a combination of options to be achieved.
State TOD Planning & Implementation Project, Island of O‘ahu

131
Figure 6-6: Flexible Adaptation Pathway Map
Source: Arup, 2020
In reading the FAP map, first notice that a “no action” option has been added as the initial pathway. Theoretically, “no action” could be a standalone alternative, although this would not meet the planning objective of protecting TOD area investments from flooding through 2100. The map assumes that there is approximately a decade to plan out and evaluate options before the first adaptation trigger is reached, which in this example occurs at 2 feet of SLR. At this point, Option 1, 2, 3, or 4 would have to be implemented to protect the asset(s). After implementing a single option there would be a number of different transfer points to consider as SLR unfolds.
It is important to point out that all of these paths end with tipping points, some of which are later than others. In other words, those pathways with tipping points at 6 feet of SLR, rather than 3 feet of SLR, should be more desirable given that with these options, TOD investments are still being protected through 2100.
6.3.3 Evaluating Pathways Once all options are mapped, a cost-benefit analysis could be undertaken for each pathway. Costs in this case are the monetary investments being made in the infrastructure as well as the cost of transferring between adaptation and/or investment options. Additional benefits beyond the planned objectives of the FAP are measured as the flood losses avoided plus additional co-benefits like environmental restoration. Where stated in dollars, the anticipated costs and benefits can be deflated, or “discounted” back to the present to generate a net present value (NPV) estimate of each pathway. This is a common economic metric used for ranking alternatives.
6.3.4 Benefits and Recommendations Based on this demonstration study, there is a compelling and pressing opportunity to put this framework to use with State TOD infrastructure planning. The following outlines key benefits of this approach:
• Provides flexibility to adapt infrastructure planning to uncertain climate change outcomes, • Avoids “lock-in” decisions and identifies near-term “no regret” options, • Clearly outlines future decision (trigger) points for investment, • Presents an approachable framework for cost-benefit analysis, and • Maps out achievable pathways towards successful future outcomes.
State TOD Planning & Implementation Project, Island of O‘ahu

132
In practice, a number of studies would be required to implement the FAP approach at the scale of infrastructure planning needed for TOD district areas. The following represents a brief summary of recommendations to be considered for implementing the FAP approach:
• Conduct a more detailed pilot study focusing on large-scale flood infrastructure needs,
• Develop an initial suite of “real options” – fitted with flexibility to adapt to future change,
• Conduct flood risk study required for cost-benefit analysis of “real options,”
• Map out realistic timing, thresholds, tipping points for decisions, and
• Undertake pre-work for various adaptation pathways, which may include technical studies for groundwater, coastal flooding, and SLR.
6.3.5 Conclusions As referenced above, a single path is a major challenge in infrastructure planning as today’s decisions can constrain opportunities in the future. In the case of the State TOD priority areas, near-term decisions around finished floor elevations, drainage infrastructure, roadway heights, and the like could put future districts and properties on a path towards resilience or increasing vulnerability to hazards like SLR. The FAP approach is tied to an evolving knowledge base and can be used to identify paths of least regrets and avoid undesirable lock-in decisions. It is applicable in future infrastructure planning efforts focused on protecting the TOD priority areas from larger-scale storm and coastal flooding as well as SLR and extreme heat. Ongoing planning for the TOD priority areas will benefit from an adaptation planning approach that considers interdependencies between programs, e.g. TOD and harbor improvements, identifies tipping points for actions, and provides clear logic for sequencing additional planning and technical studies, such as groundwater and drainage studies.
Source: Arup, 2020
State TOD Planning & Implementation Project, Island of O‘ahu

133
7 Summary and Next Steps
Assuring that adequate infrastructure is available to encourage and support TOD development can be a challenging proposition. The scale of infrastructure that is sometimes necessary, its cost, and the coordination required among various agencies and jurisdictions can be overwhelming for a single agency to accomplish. In addition, the timing for infrastructure to be in-place to accommodate future growth and development, not too soon and not too late, is critical to the successful development of TOD communities. Often, these challenges become too great of a hurdle for a single agency to overcome, which results in delays or abandonment of development within TOD areas. As such, a collaborative, multi-agency approach is often required to tackle this challenge.
This study provides essential information on anticipated TOD buildout and TOD-driven infrastructure need in the three State TOD priority areas – and can serve as an important tool for the State to identify, support, and track actions necessary to facilitate shared infrastructure investments and State agency development projects in these TOD priority areas. The study findings are also intended to support the implementation and update of the State Strategic Plan for TOD for projects along the rail corridor on O‘ahu. It provides a robust analysis of critical region-serving infrastructure projects specific to each of the three TOD priority areas, associated costs for region-serving infrastructure projects, and overall ROM costs for investments necessary to advance development and implementation of State TOD projects in the three TOD priority areas.
The study team would like to acknowledge the productive interagency and interjurisdictional (City, State, and private sector) conversations that underlie the study outcomes. Through collaboration among State and City departments and agencies, the State TOD Council, work groups, and stakeholders that will be impacted or will need to provide infrastructure within the three TOD priority areas, the groundwork for a broad, long-term corridor approach for region-serving infrastructure investment was laid, which can be used to target immediate, or area- or agency-specific needs going forward. This interagency and interjurisdictional collaboration was vital to this process and will continue to be necessary going forward, to ensure efficient implementation of infrastructure projects that will benefit not only State landowners, but private and broad civic interests as well.
To implement these ideas in a cost effective and coordinated manner, key decisions and next steps remain for decision-makers and the public. Next steps for implementation are discussed in the following sections.
7.1 Infrastructure Systems and Priorities While each of the three TOD priority areas has different infrastructure needs and timelines, the study as a whole identifies opportunities for collaboration on infrastructure investments and provides information that can be used to develop an overall strategy for infrastructure investment and delivery that is more predictable, integrated, and reliable than the current system provides.
The infrastructure analysis and associated funding needs and timeframes focused on the execution of TOD at a regional- or area-wide scale, in order to better capture the benefits of TOD. The analysis determined that shared regional infrastructure necessary to support State agency goals in the three TOD priority areas could cost about $4.93 billion over the next 30 years, in 2019 dollars. Of this amount, $1.74 billion appears to be already funded from existing sources, leaving an unfunded balance of some $3.19 billion.
7.1.1 Prioritization Investment priorities for specific infrastructure projects have yet to be identified. This important discussion was initiated during this study; however, priorities among departments, agencies, landowners, and between the three TOD priority areas are not yet determined.
As such, a major next step would be to determine the desired sequencing of Phase 1 (2020-2029) infrastructure projects. This could be undertaken in a critical path analysis that considers current construction activity, funding and funding gaps, development- and market-readiness or development timing of projects for which infrastructure
State TOD Planning & Implementation Project, Island of O‘ahu

134
projects are needed; agency goals, resources, and needs; legal obligations and consent decrees impacting infrastructure investment decisions; and other considerations. The cost estimates for Phase 1 (2020-2029) infrastructure projects should then be updated to account for potential additional costs necessary to expedite or revise the sequencing of infrastructure projects, where appropriate, as well as then-current costs and funding levels.
Additional information on a critical path analysis for project prioritization can be found below in Section 7.1.2, and discussion of coordinated approaches and collaboration in Section 7.3.
7.1.2 Critical Path Analysis As identified in Section 7.1.1, while general coordination is critical at the regional level, given finite funds, the State and City must be strategic in their investment decisions in order to leverage development opportunities in the three TOD priority areas. As such, the departments, agencies, and landowners should continue to work together to prioritize investments based on consideration of public needs and values, rather than the effectiveness of individual agencies or departments in securing funding. This collaborative process is discussed in more detail in Section 7.3.
The priority infrastructure projects for investment within and across the three TOD priority areas will require upfront investment in order to achieve the long-term benefits desired, and should be determined using a coordinated critical path analysis to identify the type, location, and level of priority. Outcomes from the critical path analysis should also inform decision-making on CIP appropriations and use of bond funds for priority projects. The critical path analysis could include:
• Identification of infrastructure projects necessary to fulfill legal obligations or consent decrees. • Identification of infrastructure projects that support multiple agency or department projects, possibly
resulting in more impactful or efficient use of time and resources. • Analysis of the development-readiness of projects that will be supported by the proposed infrastructure
investment. This may include whether there is existing construction activity, if the development is ready except for required infrastructure, or if there are other barriers to development such as existing agreements, plans, or entitlements.
• Analysis of the overall market and real estate conditions along the rail corridor to determine which projects may be supported by the market upon completion. This should include updated reviews of demographics; product demand by type such as affordable, rental, for-sale, or leasehold residential product types; price points; and existing funding commitments or outside resources available for specific development or redevelopment projects.
• Analysis of the financial resources needed for infrastructure projects and the impact of investments. These impacts may not be a direct dollar-to-dollar comparison, but rather a value metric for comparison between the factors. For example, the impact of investments could be considered at various scales ranging from site-specific benefits to regional benefits; or they could be focused on prioritization of certain project types such as affordable housing and public facilities, or projects that generate economic activity and tax revenues such as commercial or industrial facilities.
7.1.3 District-Regional Systems As identified in Section 6.2 of this study, each of the TOD priority areas has an opportunity to incorporate a district approach, involving a “network” of services to multiple projects and/or buildings. If applicable, network approaches may convey significant environmental values, climate change resiliency, and cost savings for the districts they serve. The baseline cost assessments put forth in this study have not incorporated such system optimization. As a result, there remains opportunity for TOD stakeholders to advance such systems to the benefit of each TOD priority area as well as to the general public.
This network of services could capitalize on synergies and economies of scale to provide shared energy, water, goods movement, and waste services that cannot be captured at the level of individual buildings. For example,
State TOD Planning & Implementation Project, Island of O‘ahu

135
Arup estimated that district cooling systems in the TOD priority areas could reduce costs by 80-95% due to smaller capacities, greenfield development conditions, existing systems that can be expanded, operating efficiencies, or required system upgrades that would be offset.
Additional analysis is required to identify specific systems, timing, and investment requirements to implement district systems. The four phases of district or neighborhood-scale system implementation that would need to be undertaken include initial assessment, feasibility, project development, and operation, optimization, and expansion.
The diversity of stakeholders in each of the TOD priority areas adds complexity as well as opportunity for joint action for district-regional systems across the TOD priority areas as further described in Section 7.3, Coordinated Approaches and Collaboration. Finally, the opportunities supported by emerging technologies and services are dynamic and should be revisited for each area as planning for regional infrastructure is finalized.
7.1.4 Flexible Adaptation Pathway Approach Ongoing planning for the TOD priority areas – especially Iwilei-Kapālama – will benefit from an adaptative planning approach that addresses climate change, sustainability, and resilience. As outlined in Section 6.3, the FAP approach is tied to an evolving knowledge base and can be used to address uncertain future conditions such as larger-scale storm and coastal flooding as well as SLR and extreme heat. Further, the FAP approach considers interdependencies between programs, identifies tipping points for actions, and provides clear logic for sequencing additional planning and technical studies.
Since infrastructure projects are large-scale, long-lived capital investments, there is a compelling and pressing opportunity to implement a FAP approach to identify paths of “least regrets”, meaning those that avoid getting “lock-ins” to undesirable decisions or outcomes for infrastructure investments. Key benefits of this approach are that it:
• Provides flexibility to adapt infrastructure planning to uncertain climate change outcomes, • Avoids “lock-in” decisions and identifies near-term “no regrets” options, • Clearly outlines future decision (trigger) points for investment, • Presents an approachable framework for cost-benefit analysis, and • Maps out achievable pathways towards successful future outcomes.
In practice, a number of studies would be required to implement the FAP approach at the scale of infrastructure planning needed for TOD priority areas. The following represents a brief summary of recommendations to be considered for implementing the FAP approach:
• Conduct a more detailed pilot study focusing on large-scale flood infrastructure needs, • Develop an initial suite of “real options” – fitted with flexibility to adapt to future change, • Conduct a flood risk study required for cost-benefit analysis of “real options,” • Map out realistic timing, thresholds, and tipping points for decisions, and • Undertake preliminary work for various adaptation pathways, which may include technical studies for
groundwater, coastal flooding, and SLR.
7.2 Financing Approaches The DTA study identified financing mechanisms that appear to be viable options to bridge an existing funding shortfall for regional infrastructure necessary to meet agency goals in the three TOD priority areas. This shortfall was estimated at $0.55 billion for Phase 1 (2020-2029). To bridge this gap, DTA identified three value capture tools, which entail no new taxes. The selected tools and their recommended capture rates are:
State TOD Planning & Implementation Project, Island of O‘ahu
136
• 100% of GET on development expenditures related to new construction within the TOD priority areas; • 50% of GET on spending at new retail, space leasing and hotel operations within the TOD priority areas;
and • 30% of the additional RPT collected on new development within the TOD priority areas.
However, because GET and RPT taxes tend to be generated as, or after, a project is developed and a project’s infrastructure generally needs to be constructed before its development, a fourth tool, a limited, 10-year GET surcharge of 0.1% of O‘ahu-wide GET collections was suggested by some stakeholders and evaluated by the study team. This fourth tool would represent an additional, short-term, tax on resident and visitor spending on O‘ahu. Based on analyses conducted in late 2019, this combination of value capture and GET surcharge tools met the unfunded needs of Phase 1 (2020-2029) in a timely manner, and also generated a $0.41 billion surplus that could be applied to accelerating the infrastructure financing of Phase 2 (2030-2039), Phase 3 (2040-2049), or other TOD investments.
Implementation of any of the financing mechanisms will depend on future development status, public agency policy, existing legislation, and other factors. Next steps should include legal, logistical, and financial evaluations of the identified tools, as well as robust consideration and public discourse regarding their fiscal, political, social, and economic viability and fairness. The subsections below suggest a number of steps that government could take to pursue the opportunities identified in this study.
7.2.1 Expand and Refine Development View The State could engage additional landowners or stakeholders within each TOD priority area, particularly with an eye to encouraging a mix of development types that is most financeable. For instance, a combination of civic- and income-producing, or near-term and longer-term development opportunities may produce more financeable outcomes while also meeting goals of a broad group of stakeholders. The study noted the ability of TOD areas with greater private sector orientation to lend support to initiatives that serve important State- and City-wide interests such as UHWO, HCC, the new stadium, correctional facility, and public and affordable housing development.
7.2.2 Update and Refine Funding Needs and Tools As priority projects and/or infrastructure system investments are identified in a critical path or other approach as discussed above, existing and funding shortfall balances should be updated, and the suite of financing tools to be promoted should be re-evaluated for best fit in the context of current market, finance, and political contexts.
Decision-makers should review the combination of tools they are willing to promote, and in so doing, review:
• Whether variations on any of the tools are preferred (i.e., a surcharge on RPT rather than GET, etc.) • The specific applicability of each (i.e., should a recurring GET value capture tool apply to hotel room
revenues; to wholesale as well as retail sales; to building space leases?) • The share of each targeted new revenue or tax class to be captured.
7.2.3 Feasibility Analysis Agency consultations and financial and legal analyses specific to the infrastructure projects, and suite of tools as refined should be undertaken. These investigations should target:
• Greater understanding of how the specific value capture revenue sources may be bonded, and the estimated costs and procedures associated with this.
• Identification of where and when interagency and interjurisdictional (State/City) agreements will be required.
• Legislation and amendments or revisions needed at the State or City levels. • Estimated costs of implementing each value capture method.
State TOD Planning & Implementation Project, Island of O‘ahu
137
• Determination of the optimal balance of alternate value capture tools and conventional financing mechanisms in terms of cost, time to yield, and political difficulty.
• Cash flow analysis of revenues and expenses associated with implementation of the selected suite of tools and their funding yields vs. infrastructure development costs.
• Determination of the administrative costs for personnel, training, or recruitment at the respective State and/or City levels.
7.2.4 Mechanisms for Managing Funds Discussions should also be undertaken to determine how the receipt and disbursement of value capture revenues would be best handled.
• If via a public entity – o Determine the jurisdictions (State and/or City) that must be involved, and the lead agency/ies for
each. o How will agencies administer collections, segregate revenues, and ensure their application to the
targeted infrastructure projects? o Is there administrative capacity in the current tax-collecting entity to be able to geo-code
revenues for defined areas within counties? Or would a new entity need to be established to receive and/or co-mingle and administer revenues from the various tax types?
• If via a private P3 entity – o Will the private entity be responsible for developing as well as financing the desired shared
regional infrastructure with the funds to be collected? o Will the private entity be compensated for these efforts, or will its compensation be tied to rights
to an income-producing public works project? If the latter, what projects would be development-ready on a timely basis?
o Who will implement the P3 procurement? The process may be expected to require a feasibility study, RFQ/RFP processes and establishment of protocols, performance standards, and development agreements/contracts.
o The P3 developer may require environmental reporting be completed beforehand, including demonstration of HRS Chapter 343 and/or NEPA compliance.
o How and who will fund the administrative costs for these transactions? o Would the State or City entity need to remove the affected properties from their respective tax
roles, and how would payments and revenues flow in the P3 contract?
7.2.5 Legal Review Many of the suggested next steps above touch on legal issues. A legal analysis should be undertaken specific to the infrastructure projects, tools, and administrative approaches selected. Successful formation and implementation of the financing mechanism will require cooperation between all stakeholders and a thorough understanding of these legal requirements.
Tax Increment Financing (TIF) is probably the most common method used to capture the values created by new development in other U.S. jurisdictions. However, in this study, only PILOT and P3 value capture methods were considered because of legal questions that have been raised regarding the constitutionality of TIF in Hawai‘i. This issue should be explored and resolved as it would allow use of this robust and well-established tool that governments elsewhere have used to tap into the values created by public infrastructure investments and incentives.
7.2.6 Other Options Raised Agency representatives and other stakeholders that participated in the study also suggested a number of other financing alternatives that were not evaluated in this study. These include enabling and taxing recreational marijuana; enabling and taxing lotteries or other forms of gambling; increasing or dedicating special taxes such as
State TOD Planning & Implementation Project, Island of O‘ahu

138
use taxes or gasoline taxes; and raising the GET or other taxes. Each of these options brings legal, political, fairness, and implementation considerations that could be evaluated should policy makers wish to pursue them.
7.2.7 COVID-19 Impacts As noted at the outset of this report, the conclusions presented herein are largely based on conversations, consultations and research conducted between the third quarter of 2018 and the first weeks of 2020. Since that time, the COVID-19 pandemic has dramatically changed the social, economic, fiscal, social, and market environments applicable to all citizens and State and county government in Hawai‘i, as elsewhere in the world. Accordingly, the analyses and conclusions presented herein should be reviewed prior to implementation. While the longer-term impacts of the COVID-19 pandemic are not knowable now, the pandemic’s impacts need to be monitored with respect to:
• Changes in public and governmental priorities, as well as the financial and fiscal resources available to individuals, business, and government;
• Its devastating impact on the visitor industry, with most hotel facilities remaining closed, and support enterprises such as restaurants and entertainment dramatically impacted;
• Any perceptible shifts in market preferences applicable for various development types, including higher density recreational and living environments;
• Population loss or out-migration, as some residents could seek more immediate employment opportunities in locales that are less dependent on tourism;
• The infusion of federal funds to Hawai‘i, as to other states; • Significant declines in interest rates applicable to borrowing and lending; and • The pace of completion of the City’s rail project.
7.3 Coordinated Approaches and Collaboration In an environment of multiple and critical demands on reduced and limited resources, effective and ongoing collaboration and coordination may help reduce conflicts and avoid unnecessary competition among different participating entities for scarce resources. One way to ensure efficient investment and to identify the most impactful infrastructure investments is through collaboration between State and City departments and agencies, landowners and developers, and elected officials, similar to the efforts currently being facilitated by the State’s TOD Council. A coordinated approach could create opportunities for each stakeholder to see their role in the broader context of development and infrastructure projects, reduce competition for short term funds between projects, and could facilitate creative infrastructure solutions such as district systems.
The State TOD Council and the City’s TOD Subcabinet should continue to strengthen their current working relationships in planning and coordinating TOD initiatives to become active, long-term partners in TOD development. This could include collaborating on shared investments and support for infrastructure needed to enable both State and City TOD projects to proceed. Ongoing department and agency coordination for necessary projects will continue to facilitate efficient use of funds and could expedite high-value projects based on agreed-upon outcomes, goals, or actions. Additional opportunities, such as interjurisdictional policies or guidelines, may develop over time as projects are implemented and this coordinated approach could shift or overcome identified barriers.
It is important to note that this assessment did not consider the locations, costs, or triggers for several other public facilities such as police stations, fire stations, public libraries, and the full suite of urban parks, recreational facilities, and public open space. Future coordination with the City departments and agencies to identify requirements, costs, and scheduling for these public facilities should also be undertaken in the development of a regional approach to public infrastructure investment in support of TOD.
State TOD Planning & Implementation Project, Island of O‘ahu
139
8 References
Chen, J. (2019, October 2). Investopedia. Retrieved from Futh Faith and Credit: https://www.investopedia.com/terms/f/full-faith-credit.asp
City and County of Honolulu. (2010/2020). East Kapolei Neighborhood TOD Plan (Public Review Drafts No. 1 and 2).
City and County of Honolulu. (2017). Downtown Neighborhood TOD Plan.
City and County of Honolulu. (2017). Halawa-Area TOD Plan (Draft Final).
City and County of Honolulu. (2017). Kalihi Neighborhood TOD Plan.
City and County of Honolulu. (2017). Strategic Economics Market Analysis.
City and County of Honolulu. (2018). Iwilei-Kapalama TOD Infrastructure Needs Assessment.
Climate Change Commission. (2018, June 5). City and County of Honolulu. Retrieved from Sea Level Rise Guidance: https://static1.squarespace.com/static/59af5d3cd7bdce7aa5c3e11f/t/5b4d2f22aa4a99750406730f/1531784996473/CCH-CCC+Sea+Level+Rise+Guidance+%286-5-18%29.pdf
Coleman, A. (2017, August). The Council of State Governments. Retrieved from The Current State: https://www.csg.org/pubs/capitolideas/enews/cs41_1.aspx
Community Planning and Engineering, Inc. (2006, June). Wastewater Master Plan for East Kapolei.
Community Planning and Engineering, Inc. (2009, January). Wastewater Master Plan for East Kapolei II Development.
Department of Accounting and General Services. (2019). New Aloha Stadium Entertainment District Phase 1 Planning.
Department of Hawaiian Home Lands. (2010). Kapolei Regional Plan.
Department of Hawaiian Home Lands. (2019). TOD Analysis.
DOE. (2018, August 26). Kalihi-to-Ala Moana School Impact Fees. Retrieved from Hawaii State Department of Education: http://www.hawaiipublicschools.org/ConnectWithUs/MediaRoom/PressReleases/Pages/kalihi-ala-moana-impact-fees.aspx
DTA. (2019). Funding and Finance Presentation to TOD Priority Area Work Groups.
Engineering Concepts, Inc. (n.d.). Drainage Master Plan for University of Hawai‘i West O‘ahu Ma kai Property.
Financial Dictionary. (2020, June). Financial Dictionary. Retrieved from Free Dictionary by Farlax: https://financial-dictionary.thefreedictionary.com/
FitchRatings. (2010, October 25). City and County of Honolulu. Retrieved from Fitch Report: https://www.honolulu.gov/rep/site/bfs/bfs_docs/FitchReport.pdf
Haasnoot, M., Middelkoop, H., Offermans, A., van Beek, E., & van Deursen, W. P. (2012). Exploring pathways for sustainable water management in river deltas in a changing environment. In Climatic Change, 115 (pp. 795-819).
Hawaiʻi Public Housing Authority. (n.d.). Strategic Redevelopment Initiatives.
State TOD Planning & Implementation Project, Island of O‘ahu
140
Hawaiʻi State Legislature. (2020). Hawaiʻi Revised Statutes. Retrieved from Chapter 37, Budget - Section 62, Part IV, Executive Budget: https://www.capitol.hawaii.gov/hrscurrent/Vol01_Ch0001-0042F/HRS0037/HRS_0037-.htm
Honolulu TOD. (2019, September 30). City and County of Honolulu. Retrieved from http://www.honolulu.gov/tod/dpp-tod-home.html
IKTODINA. (2018, August). Retrieved from DPP TOD - Iwilei/Kapalama Transit-Oriented Development Infrastructure Needs Assessment: http://www.honolulu.gov/rep/site/dpptod/iwilei_docs/IKTODINA_No-appx_Aug2018.pdf
(2019). Land Use Model: Project Boundaries and Scenarios.
Lincoln Institute of Land Policy. (2018, September). Land Value Capture Tools to Finance Our Urban Future. Retrieved from Lincoln of Land Policy: https://www.lincolninst.edu/sites/default/files/pubfiles/land-value-capture-policy-brief.pdf
Merriam-Webster Dictionary. (2020, June). Merriam Webster. Retrieved from merriam-webster.com
Office of Planning. (2018). Request for Proposals State TOD Planning and Implementation for the Island of O 'ahu, State of Hawai'i.
OP/HHFDC. (2018, August). State of Hawai‘i Strategic Plan for Transit-Oriented Development. Retrieved from State Office of Planning: https://planning.hawaii.gov/wp-content/uploads/State-TOD-Strategic-Plan_Dec-2017-Rev-Aug-2018.pdf
OP/HHFDC. (2018, August). State of Hawai‘i Strategic Plan for Transit-Oriented Development. Retrieved from State Office of Planning: https://planning.hawaii.gov/wp-content/uploads/State-TOD-Strategic-Plan_Dec-2017-Rev-Aug-2018.pdf
OP/HHFDC. (2018, August). State of Hawai‘i Strategic Plan for Transit-Oriented Development. Retrieved from State Office of Planning: https://planning.hawaii.gov/wp-content/uploads/State-TOD-Strategic-Plan_Dec-2017-Rev-Aug-2018.pdf
(2018). PCC 1 Handout.
R.M. Towill Corporation. (2015, August 4). Ho‘opili Water Master Plan.
R.M. Towill Corporation. (2017, November 6). Ho‘opili Sewerage Master Plan.
Revised Ordinances of Honolulu, Chapter 22. (n.d.). Retrieved from https://www.honolulu.gov/rep/site/ocs/roh/ROH_Chapter_22.pdf
U.S. Climate Resilience Toolkit. (2020, July 1). Retrieved from High-Tide Flooding: https://toolkit.climate.gov/topics/coastal-flood-risk/shallow-coastal-flooding-nuisance-flooding
United States Government Accountability Office. (2012, June 27). Government Accountability Office. Retrieved from Planning and Flexibility Are Key to Effectively Deploying Broadband Conduit through Federal Highway Projects: https://www.gao.gov/assets/600/591928.pdf
University of Hawaiʻi. (2011). Honolulu Community College Long Range Development Plan.
State TOD Planning & Implementation Project, Island of O‘ahu

Appendices
Appendix A – Consultation Meeting List
Appendix B – Anticipated TOD Land Use Development Methodology
Appendix C – Land Use Development Numbers, Infrastructure Requirements, and Costs Tables
Appendix D – Infrastructure Study for Transit-Oriented Development in State East Kapolei, Hālawa-Stadium, and Iwilei-Kapālama TOD Priority Areas (R.M. Towill Corporation)
Appendix E – Electrical and Telecommunications Infrastructure Needs Assessment (Ron N.S. Ho and Associates, Inc.)
Appendix F – Final Summary Report: State TOD Planning and Implementation for the Island of O‘ahu Transportation Analysis (Fehr & Peers)
Appendix G – TOD Financial Analysis (DTA)
Appendix H – State TOD Planning and Implementation for the Island of O‘ahu, Sustainability and Neighborhood-Serving Systems (Arup)
Appendix I – State TOD Planning and Implementation for the Island of O‘ahu, Flexible Adaptation Pathways: An Approach for Sea Level Rise and Flood Infrastructure (Arup)
Appendix J – Project Coordinating Committee (PCC), TOD Priority Area Permitted Interaction Group (TOD Priority Area Work Groups), and TOD Council Meeting Materials and Notes
State TOD Planning & Implementation Project, Island of O‘ahu