Embed Size (px)
Citation preview
1
STATE OF THE VITIVINICULTURE WORLD MARKET
April 2017
2
Table of contents
1. VITICULTURAL PRODUCTION POTENTIAL 3
2. WINE PRODUCTION 6
3. WINE CONSUMPTION 8
4. INTERNATIONAL TRADE 11
Abbreviations: kha: thousands of hectares mha: millions of hectares khl: thousands of hectolitres mhl: millions of hectolitres bn: billion m: millions EUR: euros
3
7.8 7.8 7.8 7.87.8
7.7 7.77.6
7.5 7.5 7.5 7.47.5 7.5 7.5 7.5 7.5
7.0
7.2
7.4
7.6
7.8
8.0
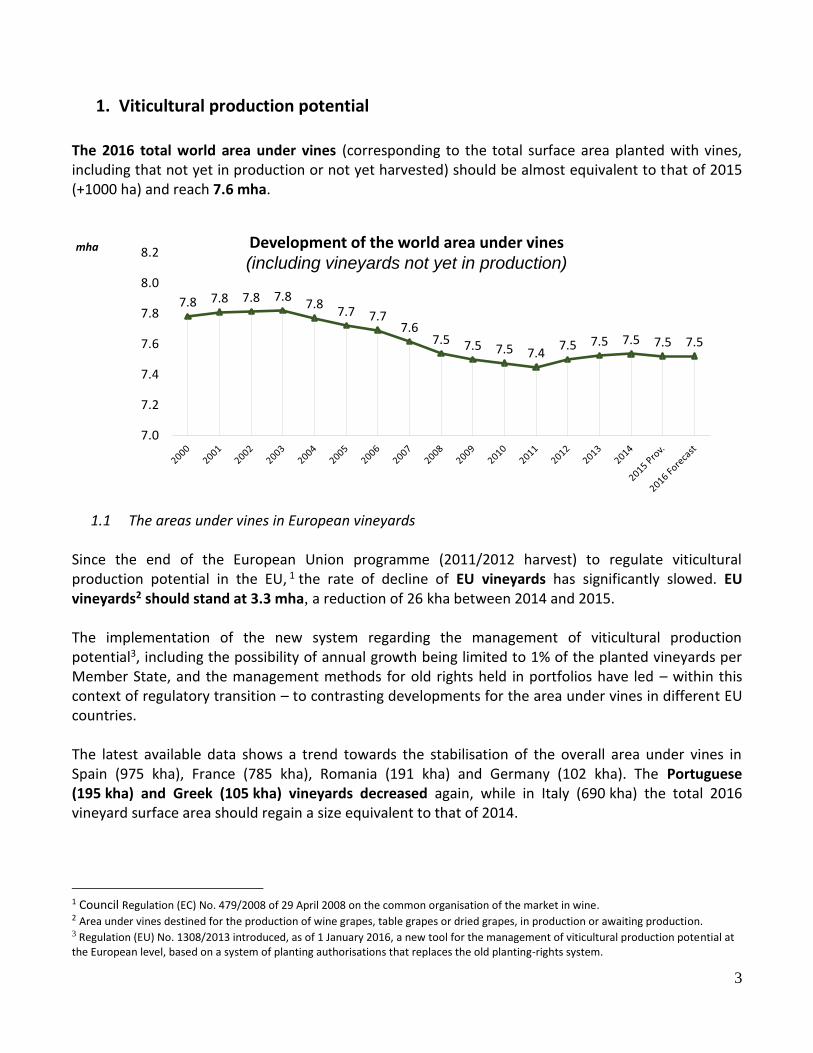
8.2mha Development of the world area under vines (including vineyards not yet in production)
1. Viticultural production potential
The 2016 total world area under vines (corresponding to the total surface area planted with vines, including that not yet in production or not yet harvested) should be almost equivalent to that of 2015 (+1000 ha) and reach 7.6 mha.
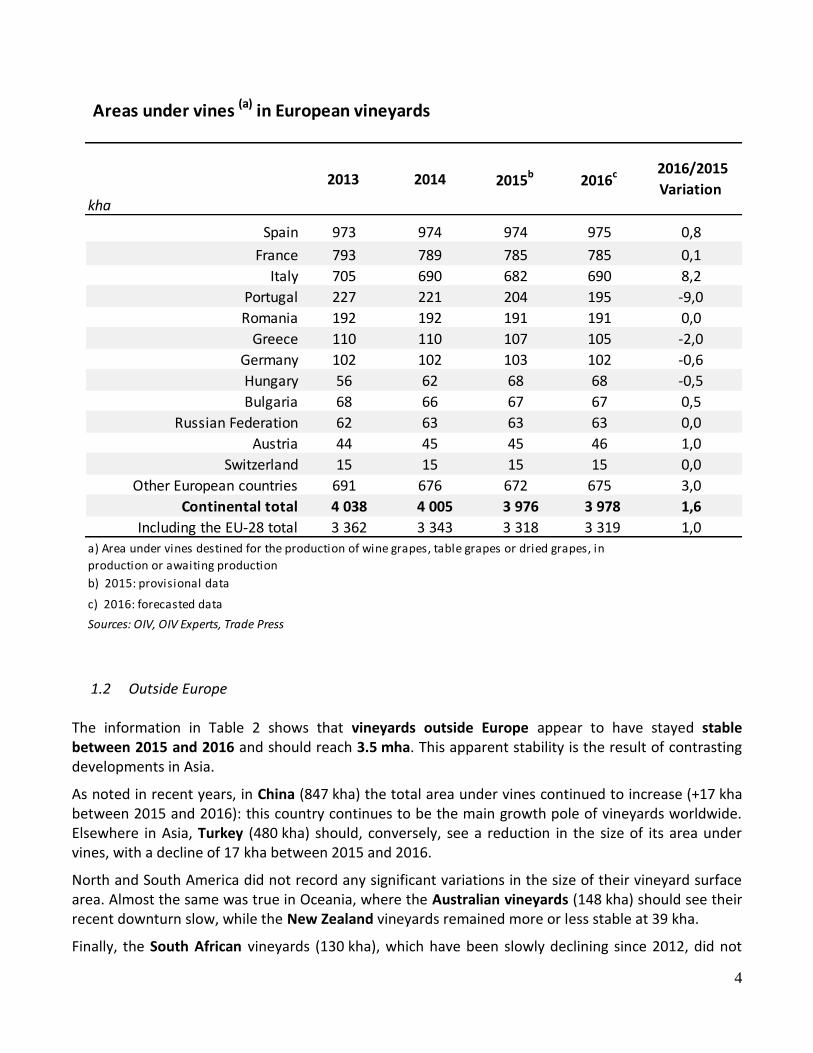
1.1 The areas under vines in European vineyards Since the end of the European Union programme (2011/2012 harvest) to regulate viticultural production potential in the EU, 1 the rate of decline of EU vineyards has significantly slowed. EU vineyards2 should stand at 3.3 mha, a reduction of 26 kha between 2014 and 2015. The implementation of the new system regarding the management of viticultural production potential3, including the possibility of annual growth being limited to 1% of the planted vineyards per Member State, and the management methods for old rights held in portfolios have led – within this context of regulatory transition – to contrasting developments for the area under vines in different EU countries. The latest available data shows a trend towards the stabilisation of the overall area under vines in Spain (975 kha), France (785 kha), Romania (191 kha) and Germany (102 kha). The Portuguese (195 kha) and Greek (105 kha) vineyards decreased again, while in Italy (690 kha) the total 2016 vineyard surface area should regain a size equivalent to that of 2014.
1 Council Regulation (EC) No. 479/2008 of 29 April 2008 on the common organisation of the market in wine. 2 Area under vines destined for the production of wine grapes, table grapes or dried grapes, in production or awaiting production. 3 Regulation (EU) No. 1308/2013 introduced, as of 1 January 2016, a new tool for the management of viticultural production potential at the European level, based on a system of planting authorisations that replaces the old planting-rights system.
4
Areas under vines (a) in European vineyards
Spain 973 974 974 975 0,8
France 793 789 785 785 0,1
Italy 705 690 682 690 8,2
Portugal 227 221 204 195 -9,0
Romania 192 192 191 191 0,0
Greece 110 110 107 105 -2,0
Germany 102 102 103 102 -0,6
Hungary 56 62 68 68 -0,5
Bulgaria 68 66 67 67 0,5
Russian Federation 62 63 63 63 0,0
Austria 44 45 45 46 1,0
Switzerland 15 15 15 15 0,0
Other European countries 691 676 672 675 3,0
Continental total 4 038 4 005 3 976 3 978 1,6
Including the EU-28 total 3 362 3 343 3 318 3 319 1,0
c) 2016: forecasted data
kha
2013 2014 2016c 2016/2015
Variation
a) Area under vines destined for the production of wine grapes, table grapes or dried grapes, in
production or awaiting production
b) 2015: provisional data
Sources: OIV, OIV Experts, Trade Press
2015b
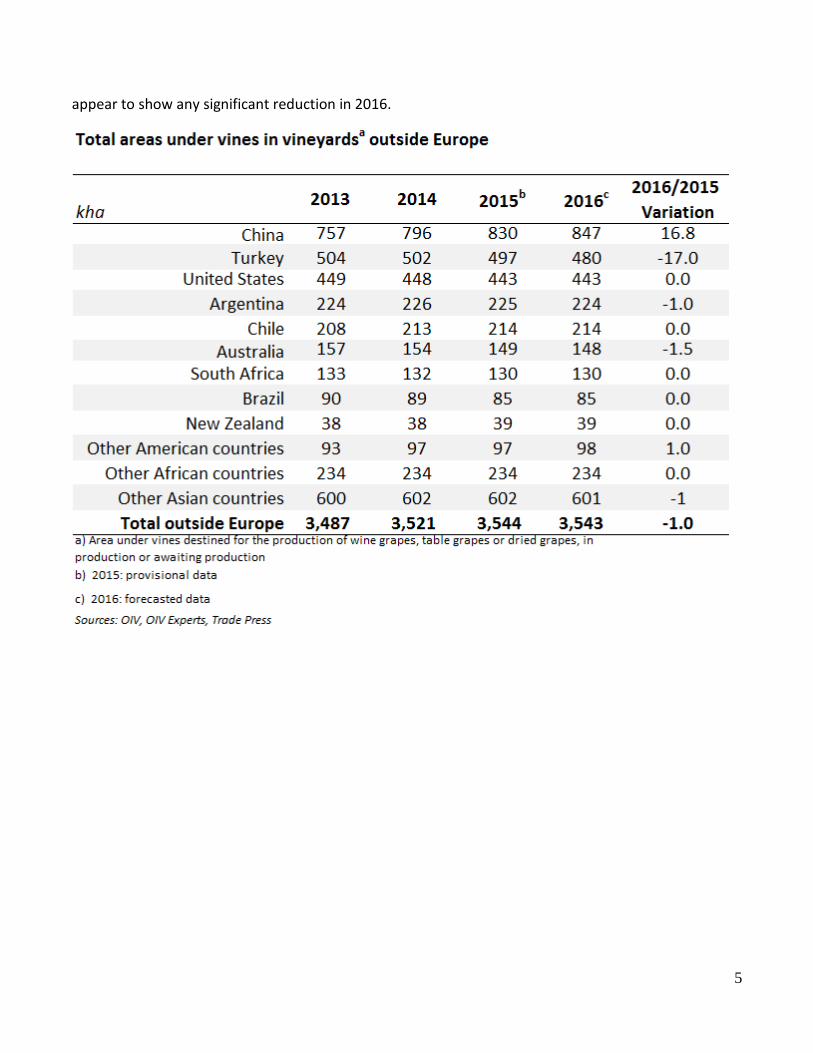
1.2 Outside Europe The information in Table 2 shows that vineyards outside Europe appear to have stayed stable between 2015 and 2016 and should reach 3.5 mha. This apparent stability is the result of contrasting developments in Asia.
As noted in recent years, in China (847 kha) the total area under vines continued to increase (+17 kha between 2015 and 2016): this country continues to be the main growth pole of vineyards worldwide. Elsewhere in Asia, Turkey (480 kha) should, conversely, see a reduction in the size of its area under vines, with a decline of 17 kha between 2015 and 2016.
North and South America did not record any significant variations in the size of their vineyard surface area. Almost the same was true in Oceania, where the Australian vineyards (148 kha) should see their recent downturn slow, while the New Zealand vineyards remained more or less stable at 39 kha.
Finally, the South African vineyards (130 kha), which have been slowly declining since 2012, did not
5
appear to show any significant reduction in 2016.
6
279 265 257
264
298 278 283
268 269 273 264 268 258
290 270 276
267
180 200 220 240 260 280 300 320
mhl
World wine production(excluding juice & musts)
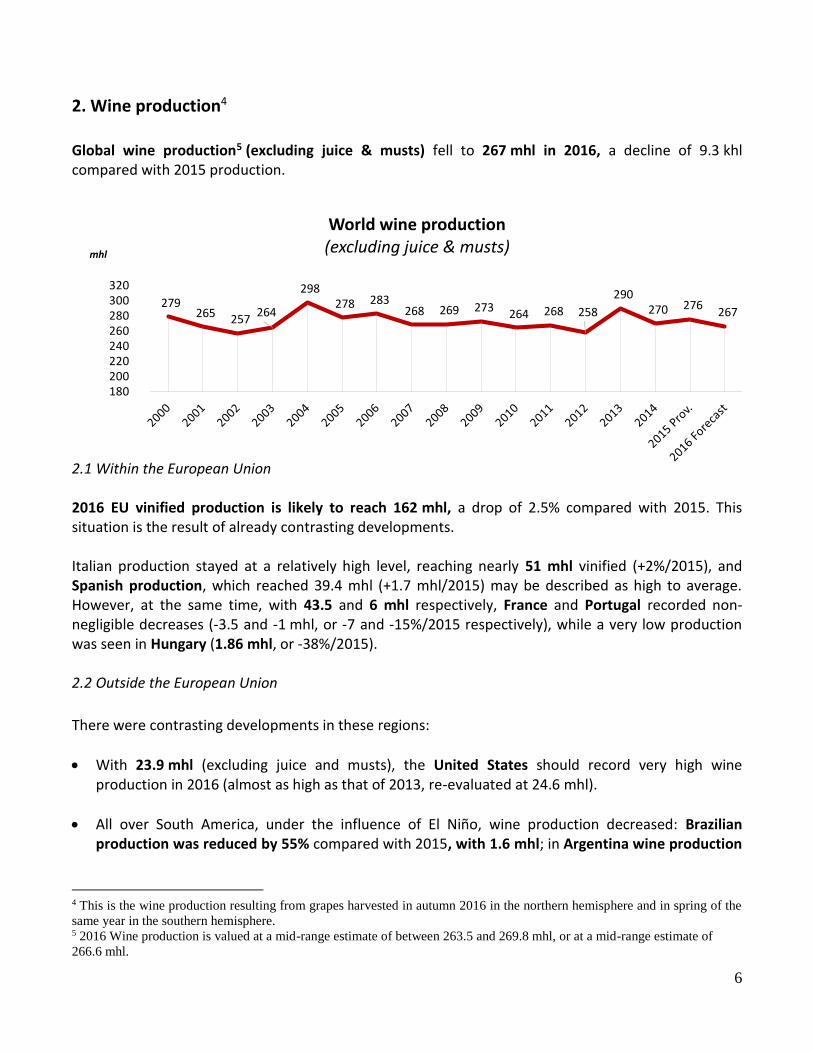
2. Wine production4
Global wine production5 (excluding juice & musts) fell to 267 mhl in 2016, a decline of 9.3 khl compared with 2015 production.
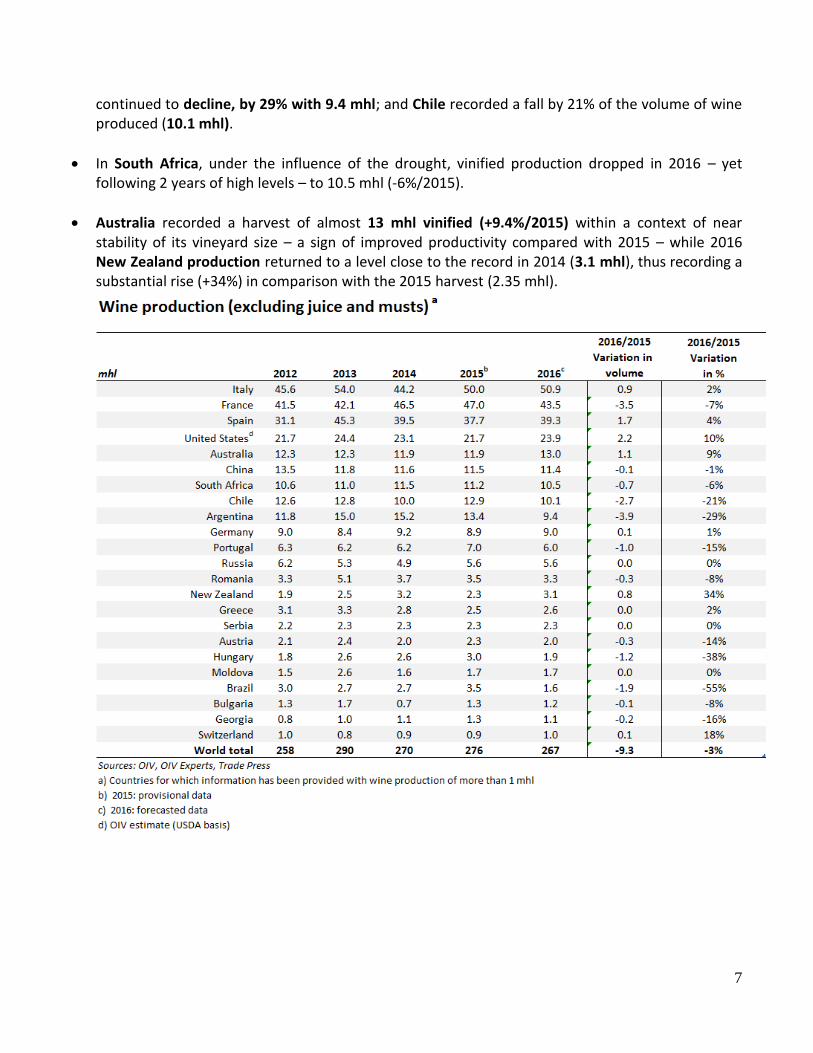
2.1 Within the European Union 2016 EU vinified production is likely to reach 162 mhl, a drop of 2.5% compared with 2015. This situation is the result of already contrasting developments. Italian production stayed at a relatively high level, reaching nearly 51 mhl vinified (+2%/2015), and Spanish production, which reached 39.4 mhl (+1.7 mhl/2015) may be described as high to average. However, at the same time, with 43.5 and 6 mhl respectively, France and Portugal recorded non-negligible decreases (-3.5 and -1 mhl, or -7 and -15%/2015 respectively), while a very low production was seen in Hungary (1.86 mhl, or -38%/2015). 2.2 Outside the European Union
There were contrasting developments in these regions:
With 23.9 mhl (excluding juice and musts), the United States should record very high wine production in 2016 (almost as high as that of 2013, re-evaluated at 24.6 mhl).
All over South America, under the influence of El Niño, wine production decreased: Brazilian production was reduced by 55% compared with 2015, with 1.6 mhl; in Argentina wine production
4 This is the wine production resulting from grapes harvested in autumn 2016 in the northern hemisphere and in spring of the
same year in the southern hemisphere. 5 2016 Wine production is valued at a mid-range estimate of between 263.5 and 269.8 mhl, or at a mid-range estimate of
266.6 mhl.
7
continued to decline, by 29% with 9.4 mhl; and Chile recorded a fall by 21% of the volume of wine produced (10.1 mhl).
In South Africa, under the influence of the drought, vinified production dropped in 2016 – yet following 2 years of high levels – to 10.5 mhl (-6%/2015).
Australia recorded a harvest of almost 13 mhl vinified (+9.4%/2015) within a context of near stability of its vineyard size – a sign of improved productivity compared with 2015 – while 2016 New Zealand production returned to a level close to the record in 2014 (3.1 mhl), thus recording a substantial rise (+34%) in comparison with the 2015 harvest (2.35 mhl).
8
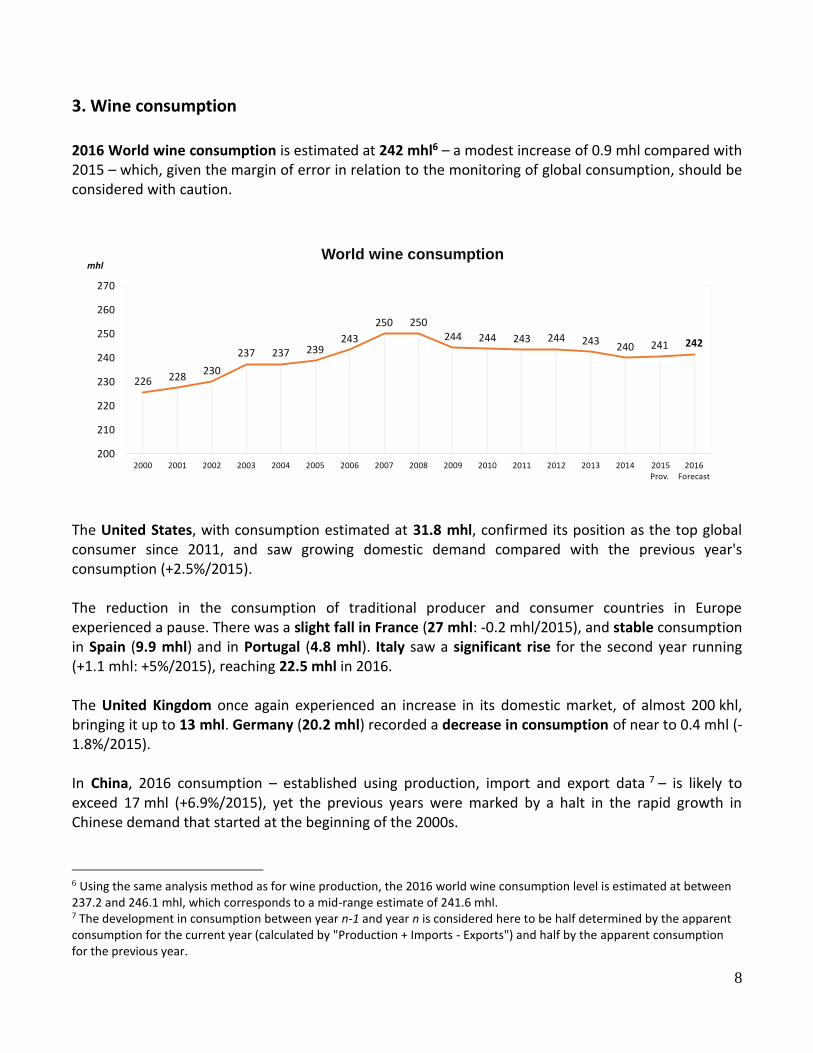
3. Wine consumption
2016 World wine consumption is estimated at 242 mhl6 – a modest increase of 0.9 mhl compared with 2015 – which, given the margin of error in relation to the monitoring of global consumption, should be considered with caution.
226 228230
237 237 239243
250 250244 244 243 244 243
240 241 242
200
210
220
230
240
250
260
270
2000 2001 2002 2003 2004 2005 2006 2007 2008 2009 2010 2011 2012 2013 2014 2015 Prov.
2016 Forecast
mhlWorld wine consumption
The United States, with consumption estimated at 31.8 mhl, confirmed its position as the top global consumer since 2011, and saw growing domestic demand compared with the previous year's consumption (+2.5%/2015). The reduction in the consumption of traditional producer and consumer countries in Europe experienced a pause. There was a slight fall in France (27 mhl: -0.2 mhl/2015), and stable consumption in Spain (9.9 mhl) and in Portugal (4.8 mhl). Italy saw a significant rise for the second year running (+1.1 mhl: +5%/2015), reaching 22.5 mhl in 2016. The United Kingdom once again experienced an increase in its domestic market, of almost 200 khl, bringing it up to 13 mhl. Germany (20.2 mhl) recorded a decrease in consumption of near to 0.4 mhl (-1.8%/2015). In China, 2016 consumption – established using production, import and export data 7 – is likely to exceed 17 mhl (+6.9%/2015), yet the previous years were marked by a halt in the rapid growth in Chinese demand that started at the beginning of the 2000s.
6 Using the same analysis method as for wine production, the 2016 world wine consumption level is estimated at between 237.2 and 246.1 mhl, which corresponds to a mid-range estimate of 241.6 mhl. 7 The development in consumption between year n-1 and year n is considered here to be half determined by the apparent consumption for the current year (calculated by "Production + Imports - Exports") and half by the apparent consumption for the previous year.
9
In Oceania, consumption in the Australian and New Zealand markets was down slightly in 2015 as a result of the decline in Australian consumption in particular, yet 2016 marked a return to 2014 levels with 6.3 mhl. South African consumption should once again see a rise between 2015 and 2016 to reach 4.4 mhl (+3%/2015). In South America, 2016 domestic consumption was lower than in 2015, especially in Argentina (9.4 mhl: -8%/2015) and in Brazil (2.9 mhl: -12%/2015). Nevertheless, Chile should see 5% growth in its consumption with 2.2 mhl, yet after having recorded a very sharp drop (850 khl) between 2014 and 2015. In Hungary and Romania, domestic consumption decreased between 2015 and 2016, although it is difficult to monitor Romanian self-consumption by producers.
10
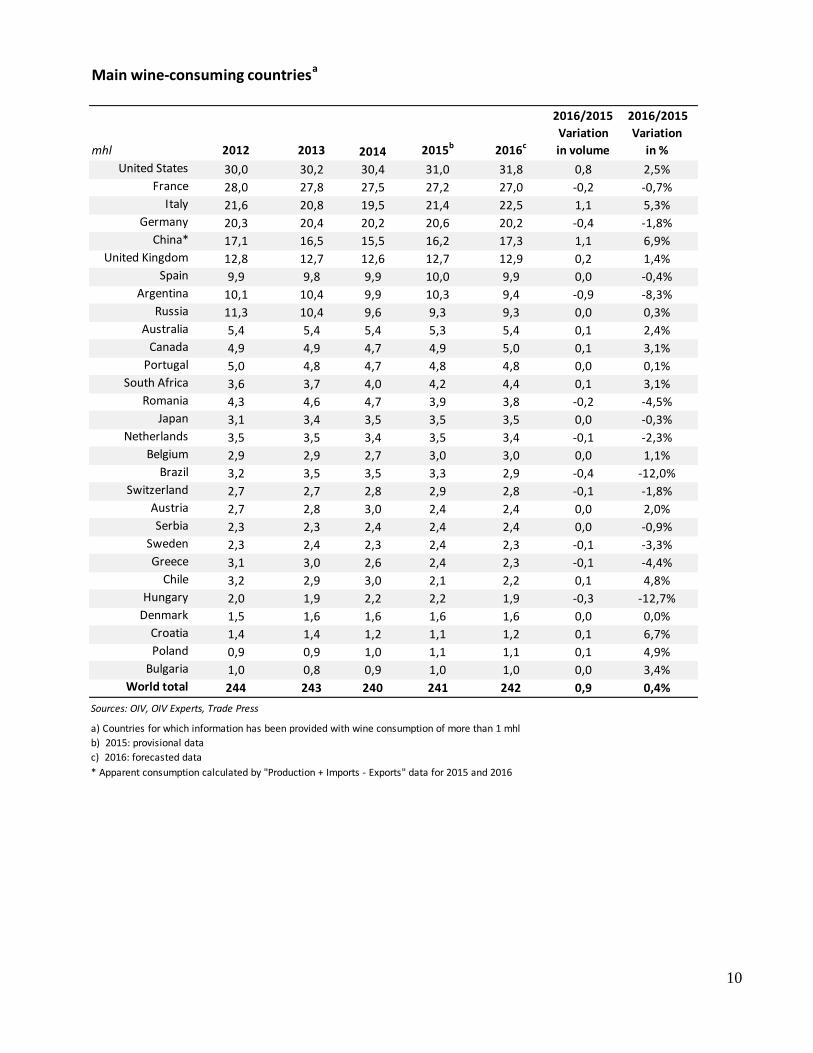
Main wine-consuming countriesa
mhl 2012 2013 2014 2015b 2016c
2016/2015
Variation
in volume
2016/2015
Variation
in %
United States 30,0 30,2 30,4 31,0 31,8 0,8 2,5%
France 28,0 27,8 27,5 27,2 27,0 -0,2 -0,7%
Italy 21,6 20,8 19,5 21,4 22,5 1,1 5,3%
Germany 20,3 20,4 20,2 20,6 20,2 -0,4 -1,8%
China* 17,1 16,5 15,5 16,2 17,3 1,1 6,9%
United Kingdom 12,8 12,7 12,6 12,7 12,9 0,2 1,4%
Spain 9,9 9,8 9,9 10,0 9,9 0,0 -0,4%
Argentina 10,1 10,4 9,9 10,3 9,4 -0,9 -8,3%
Russia 11,3 10,4 9,6 9,3 9,3 0,0 0,3%
Australia 5,4 5,4 5,4 5,3 5,4 0,1 2,4%
Canada 4,9 4,9 4,7 4,9 5,0 0,1 3,1%
Portugal 5,0 4,8 4,7 4,8 4,8 0,0 0,1%
South Africa 3,6 3,7 4,0 4,2 4,4 0,1 3,1%
Romania 4,3 4,6 4,7 3,9 3,8 -0,2 -4,5%
Japan 3,1 3,4 3,5 3,5 3,5 0,0 -0,3%
Netherlands 3,5 3,5 3,4 3,5 3,4 -0,1 -2,3%
Belgium 2,9 2,9 2,7 3,0 3,0 0,0 1,1%
Brazil 3,2 3,5 3,5 3,3 2,9 -0,4 -12,0%
Switzerland 2,7 2,7 2,8 2,9 2,8 -0,1 -1,8%
Austria 2,7 2,8 3,0 2,4 2,4 0,0 2,0%
Serbia 2,3 2,3 2,4 2,4 2,4 0,0 -0,9%
Sweden 2,3 2,4 2,3 2,4 2,3 -0,1 -3,3%
Greece 3,1 3,0 2,6 2,4 2,3 -0,1 -4,4%
Chile 3,2 2,9 3,0 2,1 2,2 0,1 4,8%
Hungary 2,0 1,9 2,2 2,2 1,9 -0,3 -12,7%
Denmark 1,5 1,6 1,6 1,6 1,6 0,0 0,0%
Croatia 1,4 1,4 1,2 1,1 1,2 0,1 6,7%
Poland 0,9 0,9 1,0 1,1 1,1 0,1 4,9%
Bulgaria 1,0 0,8 0,9 1,0 1,0 0,0 3,4%
World total 244 243 240 241 242 0,9 0,4%
Sources: OIV, OIV Experts, Trade Press
a) Countries for which information has been provided with wine consumption of more than 1 mhl
b) 2015: provisional data
c) 2016: forecasted data
* Apparent consumption calculated by "Production + Imports - Exports" data for 2015 and 2016
11
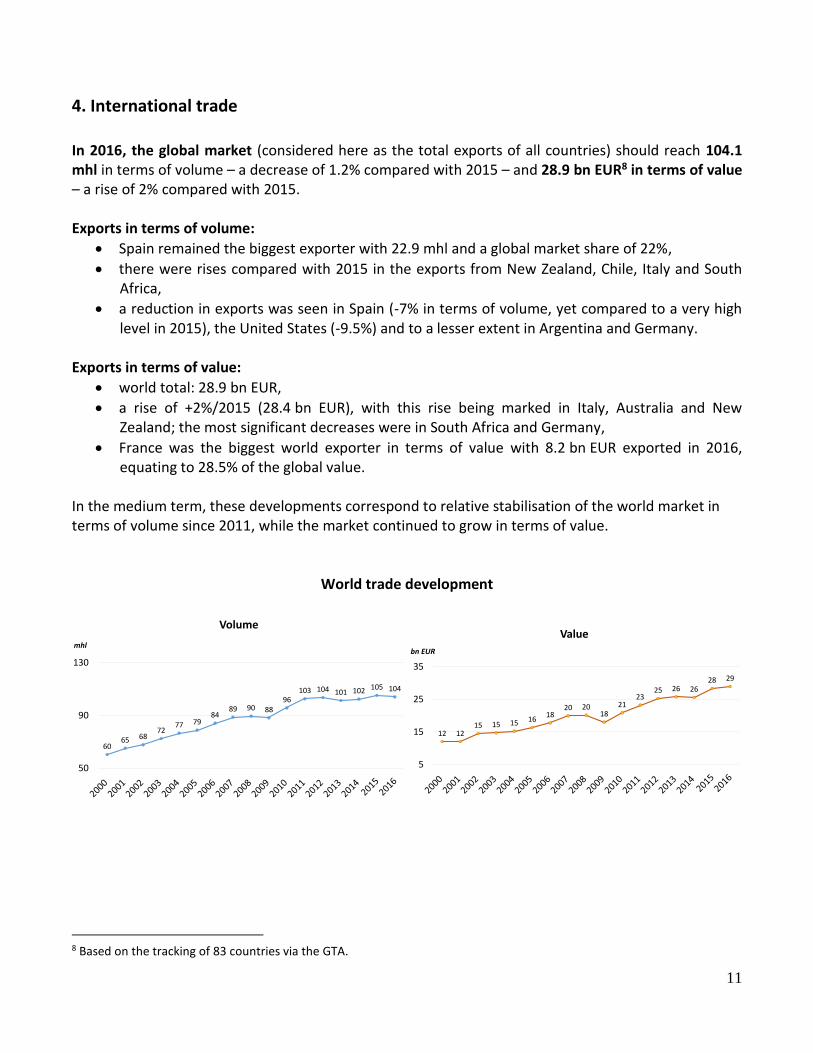
4. International trade
In 2016, the global market (considered here as the total exports of all countries) should reach 104.1 mhl in terms of volume – a decrease of 1.2% compared with 2015 – and 28.9 bn EUR8 in terms of value – a rise of 2% compared with 2015. Exports in terms of volume:
Spain remained the biggest exporter with 22.9 mhl and a global market share of 22%,
there were rises compared with 2015 in the exports from New Zealand, Chile, Italy and South Africa,
a reduction in exports was seen in Spain (-7% in terms of volume, yet compared to a very high level in 2015), the United States (-9.5%) and to a lesser extent in Argentina and Germany.
Exports in terms of value:
world total: 28.9 bn EUR,
a rise of +2%/2015 (28.4 bn EUR), with this rise being marked in Italy, Australia and New Zealand; the most significant decreases were in South Africa and Germany,
France was the biggest world exporter in terms of value with 8.2 bn EUR exported in 2016, equating to 28.5% of the global value.
In the medium term, these developments correspond to relative stabilisation of the world market in terms of volume since 2011, while the market continued to grow in terms of value.
World trade development
6065 68
7277 79
8489 90 88
96103 104 101 102 105 104
50
90
130
mhl
Volume
12 1215 15 15 16
1820 20
1821
2325 26 26
28 29
5
15
25
35
bn EUR
Value
8 Based on the tracking of 83 countries via the GTA.
12
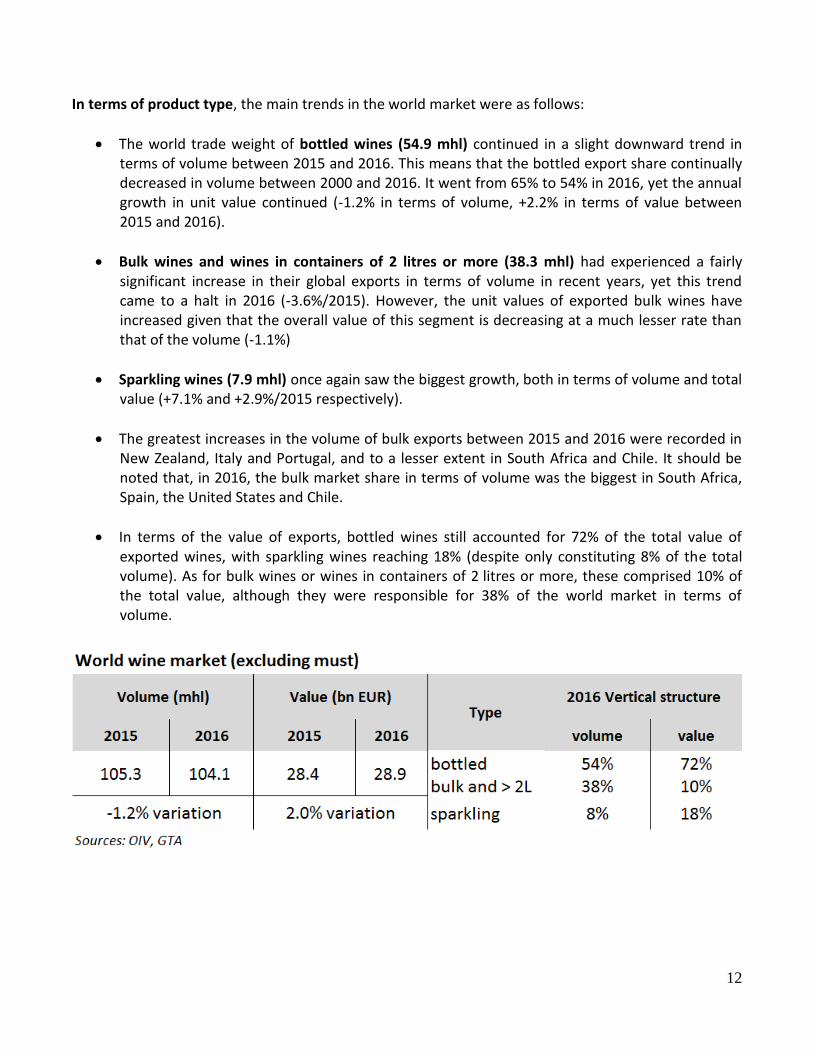
In terms of product type, the main trends in the world market were as follows:
The world trade weight of bottled wines (54.9 mhl) continued in a slight downward trend in terms of volume between 2015 and 2016. This means that the bottled export share continually decreased in volume between 2000 and 2016. It went from 65% to 54% in 2016, yet the annual growth in unit value continued (-1.2% in terms of volume, +2.2% in terms of value between 2015 and 2016).
Bulk wines and wines in containers of 2 litres or more (38.3 mhl) had experienced a fairly significant increase in their global exports in terms of volume in recent years, yet this trend came to a halt in 2016 (-3.6%/2015). However, the unit values of exported bulk wines have increased given that the overall value of this segment is decreasing at a much lesser rate than that of the volume (-1.1%)
Sparkling wines (7.9 mhl) once again saw the biggest growth, both in terms of volume and total value (+7.1% and +2.9%/2015 respectively).
The greatest increases in the volume of bulk exports between 2015 and 2016 were recorded in New Zealand, Italy and Portugal, and to a lesser extent in South Africa and Chile. It should be noted that, in 2016, the bulk market share in terms of volume was the biggest in South Africa, Spain, the United States and Chile.
In terms of the value of exports, bottled wines still accounted for 72% of the total value of exported wines, with sparkling wines reaching 18% (despite only constituting 8% of the total volume). As for bulk wines or wines in containers of 2 litres or more, these comprised 10% of the total value, although they were responsible for 38% of the world market in terms of volume.
13
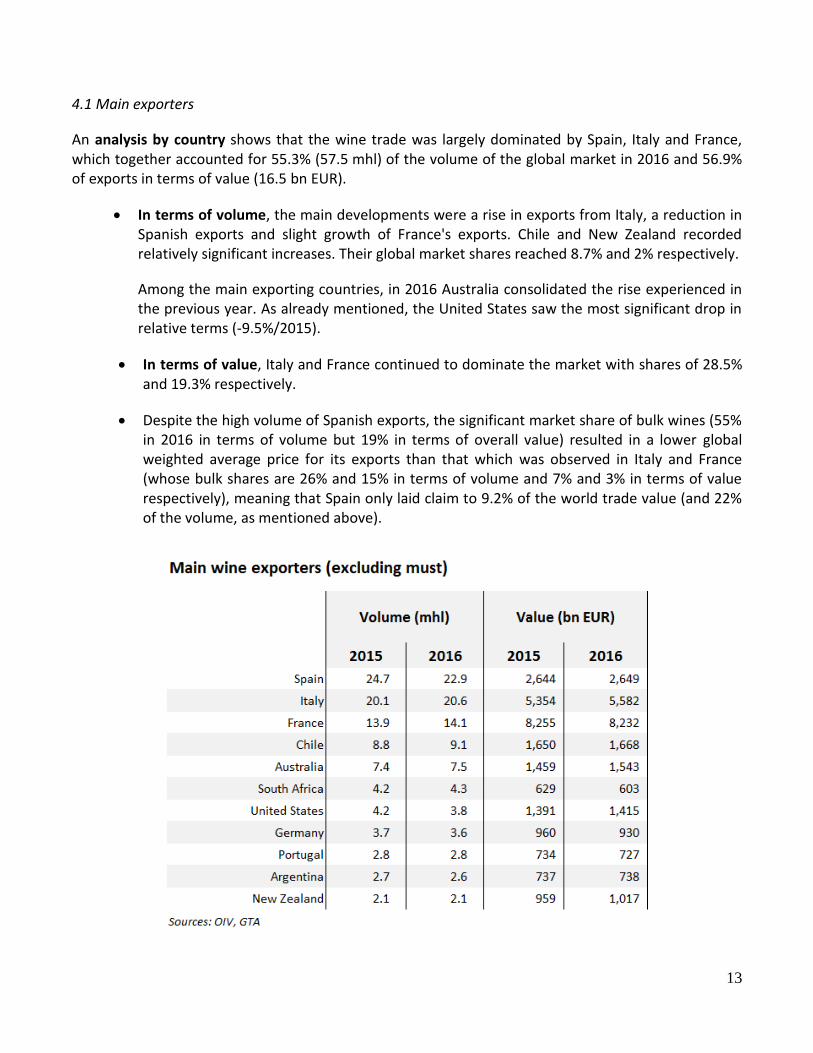
4.1 Main exporters
An analysis by country shows that the wine trade was largely dominated by Spain, Italy and France, which together accounted for 55.3% (57.5 mhl) of the volume of the global market in 2016 and 56.9% of exports in terms of value (16.5 bn EUR).
In terms of volume, the main developments were a rise in exports from Italy, a reduction in Spanish exports and slight growth of France's exports. Chile and New Zealand recorded relatively significant increases. Their global market shares reached 8.7% and 2% respectively.
Among the main exporting countries, in 2016 Australia consolidated the rise experienced in the previous year. As already mentioned, the United States saw the most significant drop in relative terms (-9.5%/2015).
In terms of value, Italy and France continued to dominate the market with shares of 28.5% and 19.3% respectively.
Despite the high volume of Spanish exports, the significant market share of bulk wines (55% in 2016 in terms of volume but 19% in terms of overall value) resulted in a lower global weighted average price for its exports than that which was observed in Italy and France (whose bulk shares are 26% and 15% in terms of volume and 7% and 3% in terms of value respectively), meaning that Spain only laid claim to 9.2% of the world trade value (and 22% of the volume, as mentioned above).
14
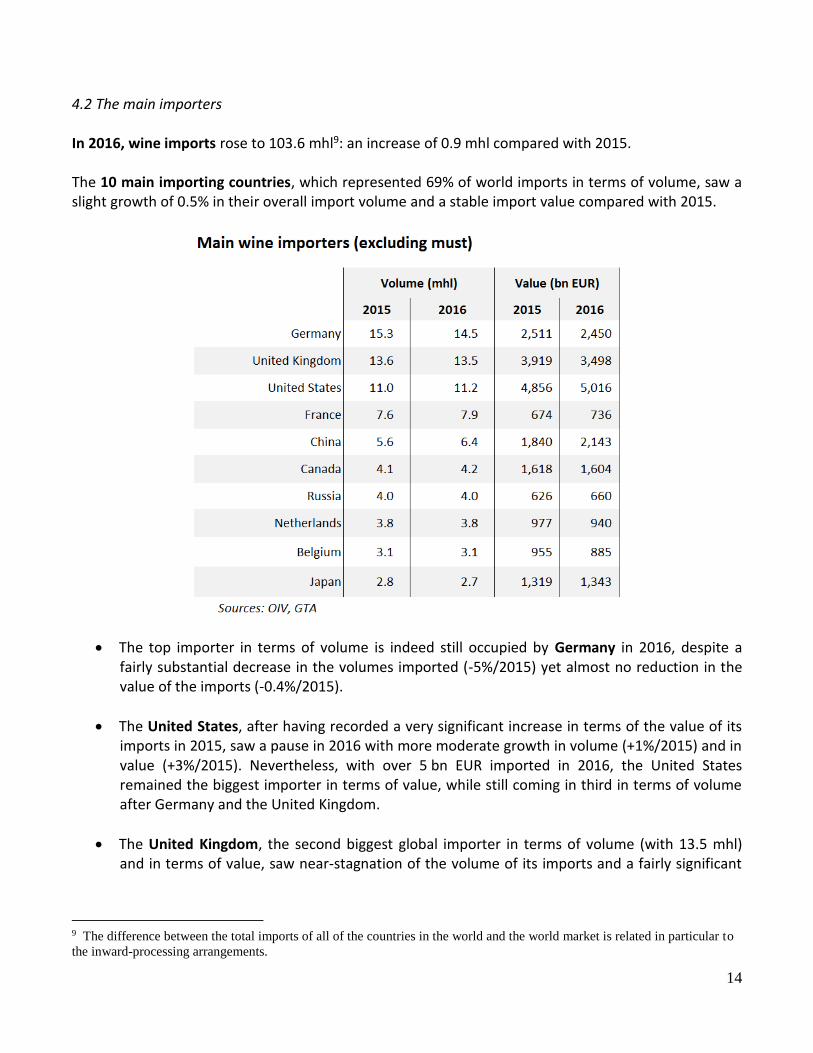
4.2 The main importers In 2016, wine imports rose to 103.6 mhl9: an increase of 0.9 mhl compared with 2015. The 10 main importing countries, which represented 69% of world imports in terms of volume, saw a slight growth of 0.5% in their overall import volume and a stable import value compared with 2015.
The top importer in terms of volume is indeed still occupied by Germany in 2016, despite a fairly substantial decrease in the volumes imported (-5%/2015) yet almost no reduction in the value of the imports (-0.4%/2015).
The United States, after having recorded a very significant increase in terms of the value of its imports in 2015, saw a pause in 2016 with more moderate growth in volume (+1%/2015) and in value (+3%/2015). Nevertheless, with over 5 bn EUR imported in 2016, the United States remained the biggest importer in terms of value, while still coming in third in terms of volume after Germany and the United Kingdom.
The United Kingdom, the second biggest global importer in terms of volume (with 13.5 mhl) and in terms of value, saw near-stagnation of the volume of its imports and a fairly significant
9 The difference between the total imports of all of the countries in the world and the world market is related in particular to
the inward-processing arrangements.
15
64%
54%
82%
67%
76%
45%
15%
65%
54%
37%
23%
27%
16%
29%
23%
48%
80%
24%
35%
58%
13%
12%
2%
4%
2%
7%
3%
10%
11%
4%
Japan
Belgium
Netherlands
Canada
China
Russia
France
United States
United Kingdom
Germany
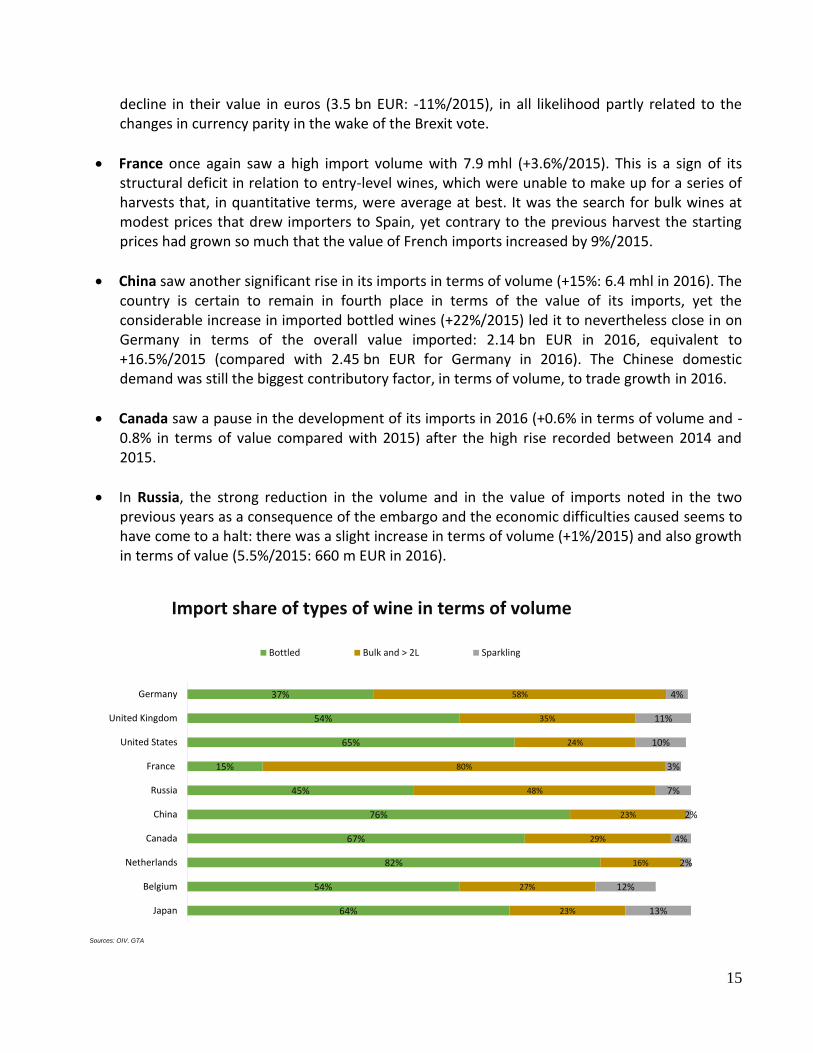
Import share of types of wine in terms of volume
Bottled Bulk and > 2L Sparkling
Sources: OIV, GTA
decline in their value in euros (3.5 bn EUR: -11%/2015), in all likelihood partly related to the changes in currency parity in the wake of the Brexit vote.
France once again saw a high import volume with 7.9 mhl (+3.6%/2015). This is a sign of its structural deficit in relation to entry-level wines, which were unable to make up for a series of harvests that, in quantitative terms, were average at best. It was the search for bulk wines at modest prices that drew importers to Spain, yet contrary to the previous harvest the starting prices had grown so much that the value of French imports increased by 9%/2015.
China saw another significant rise in its imports in terms of volume (+15%: 6.4 mhl in 2016). The country is certain to remain in fourth place in terms of the value of its imports, yet the considerable increase in imported bottled wines (+22%/2015) led it to nevertheless close in on Germany in terms of the overall value imported: 2.14 bn EUR in 2016, equivalent to +16.5%/2015 (compared with 2.45 bn EUR for Germany in 2016). The Chinese domestic demand was still the biggest contributory factor, in terms of volume, to trade growth in 2016.
Canada saw a pause in the development of its imports in 2016 (+0.6% in terms of volume and -0.8% in terms of value compared with 2015) after the high rise recorded between 2014 and 2015.
In Russia, the strong reduction in the volume and in the value of imports noted in the two previous years as a consequence of the embargo and the economic difficulties caused seems to have come to a halt: there was a slight increase in terms of volume (+1%/2015) and also growth in terms of value (5.5%/2015: 660 m EUR in 2016).