Embed Size (px)
Citation preview

State of the U.S. Multifamily Market
Q1 2015 Review and Forecast

• Economy
• Leasing Fundamentals
• Rent and NOI Trends
• Single-Family Market
• Capital Markets
Agenda

page 3
Economy
page 4
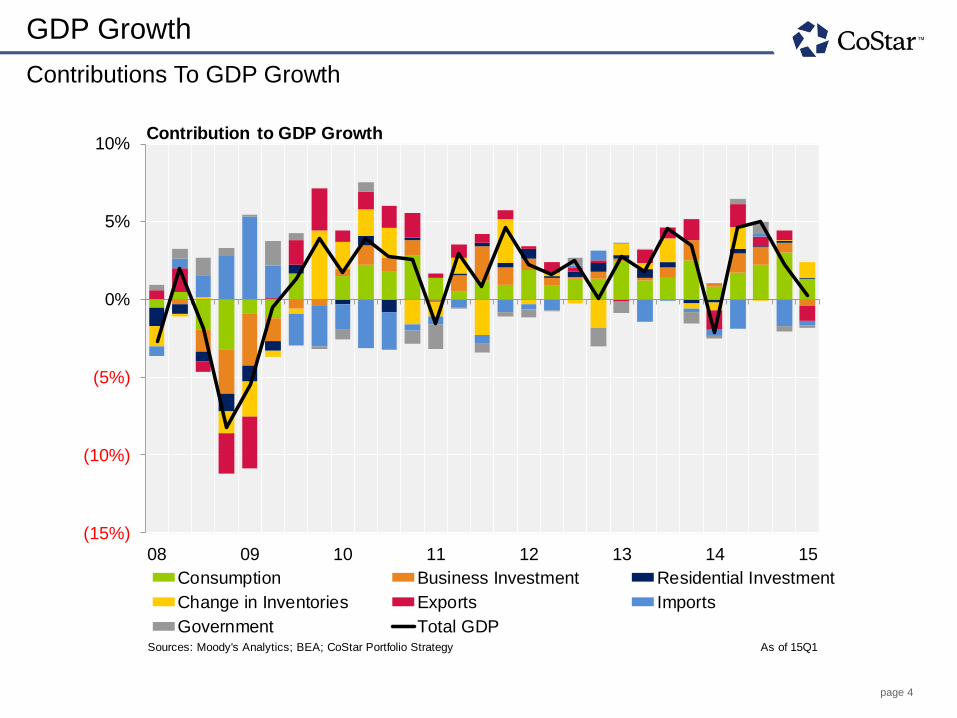
GDP Growth
Contributions To GDP Growth
08
08
08
08
09
09
09
09
Sources: Moody's Analytics; BEA; CoStar Portfolio Strategy As of 15Q1
(15%)
(10%)
(5%)
0%
5%
10%
08 09 10 11 12 13 14 15
Consumption Business Investment Residential Investment
Change in Inventories Exports Imports
Government Total GDP
Contribution to GDP Growth

page 5
Employment Growth
Total Nonfarm Employment
Sources: Moody's Analytics; BLS; CoStar Portfolio Strategy As of May 2015
(6%)
(5%)
(4%)
(3%)
(2%)
(1%)
0%
1%
2%
3%
4%
(900)
(750)
(600)
(450)
(300)
(150)
0
150
300
450
600
05 06 07 08 09 10 11 12 13 14 15
Jobs Gained/Lost Growth (Y/Y)
Monthly Jobs Gained / Lost 3-Month Moving Average Growth (Y/Y)
page 6
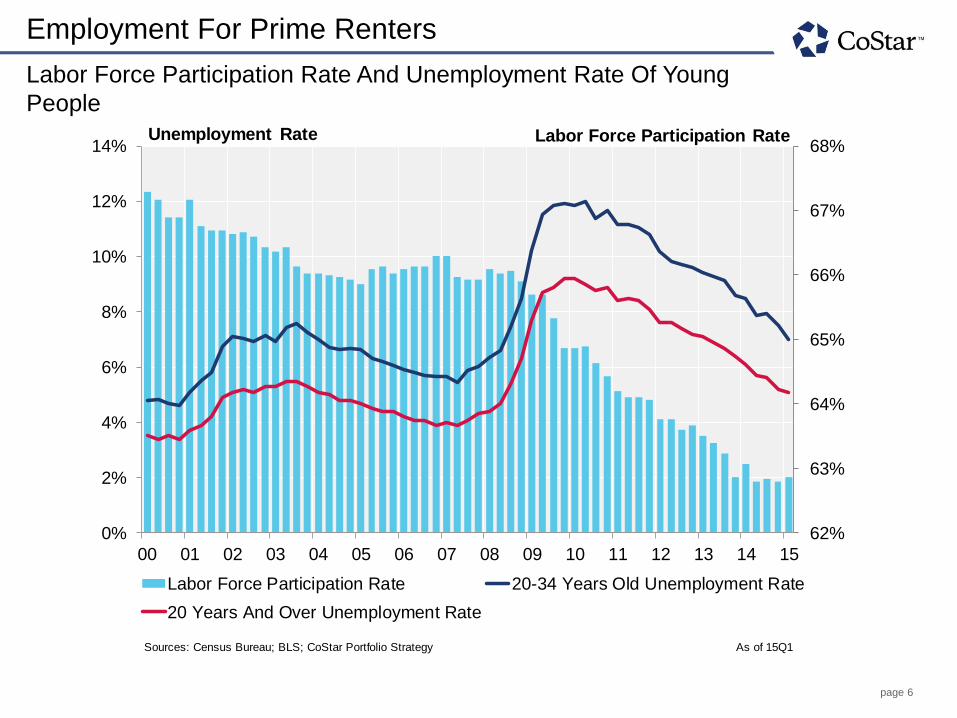
Employment For Prime Renters
Labor Force Participation Rate And Unemployment Rate Of Young
People Year
99
99
99
99
00
00
00
00
01
0101
01
02
02
02
02
03
03
03
03
04
04
04
04
05
05
05
05
06
06
06
Sources: Census Bureau; BLS; CoStar Portfolio Strategy As of 15Q1
62%
63%
64%
65%
66%
67%
68%
0%
2%
4%
6%
8%
10%
12%
14%
00 01 02 03 04 05 06 07 08 09 10 11 12 13 14 15
Labor Force Participation Rate 20-34 Years Old Unemployment Rate
20 Years And Over Unemployment Rate
Unemployment Rate Labor Force Participation Rate
page 7
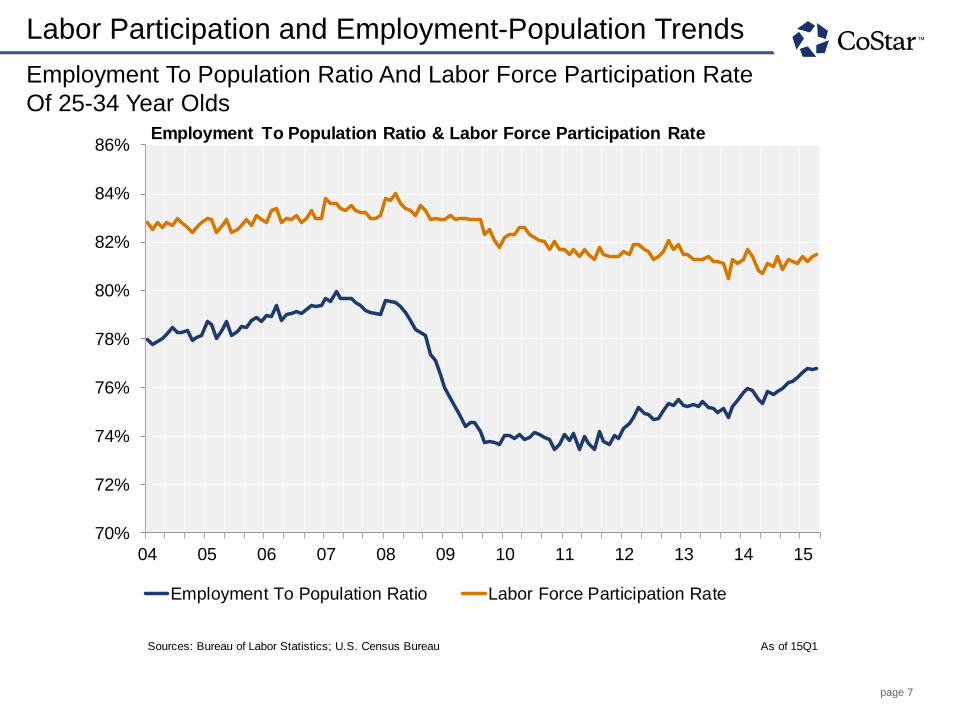
Employment To Population Ratio And Labor Force Participation Rate
Of 25-34 Year Olds
04
04
04
04
04
04
04
04
04
04
04
04
05
05
05
05
05
05
05
05
05
05
05
05
06
06
06
06
06
06
Sources: Bureau of Labor Statistics; U.S. Census Bureau As of 15Q1
70%
72%
74%
76%
78%
80%
82%
84%
86%
04 05 06 07 08 09 10 11 12 13 14 15
Employment To Population Ratio Labor Force Participation Rate
Employment To Population Ratio & Labor Force Participation Rate
Labor Participation and Employment-Population Trends

page 8
Labor Participation and Employment-Population Trends
Employment To Population Ratio And Labor Force Participation Rate
Of 20-24 Year Olds
04
04
04
04
04
04
04
04
04
04
04
04
05
05
05
05
05
05
05
05
05
05
05
05
06
06
06
06
06
06
Sources: Bureau of Labor Statistics; U.S. Census Bureau As of 15Q1
58%
60%
62%
64%
66%
68%
70%
72%
74%
76%
78%
04 05 06 07 08 09 10 11 12 13 14 15
Employment To Population Ratio Labor Force Participation Rate
Employment To Population Ratio & Labor Force Participation Rate
page 9
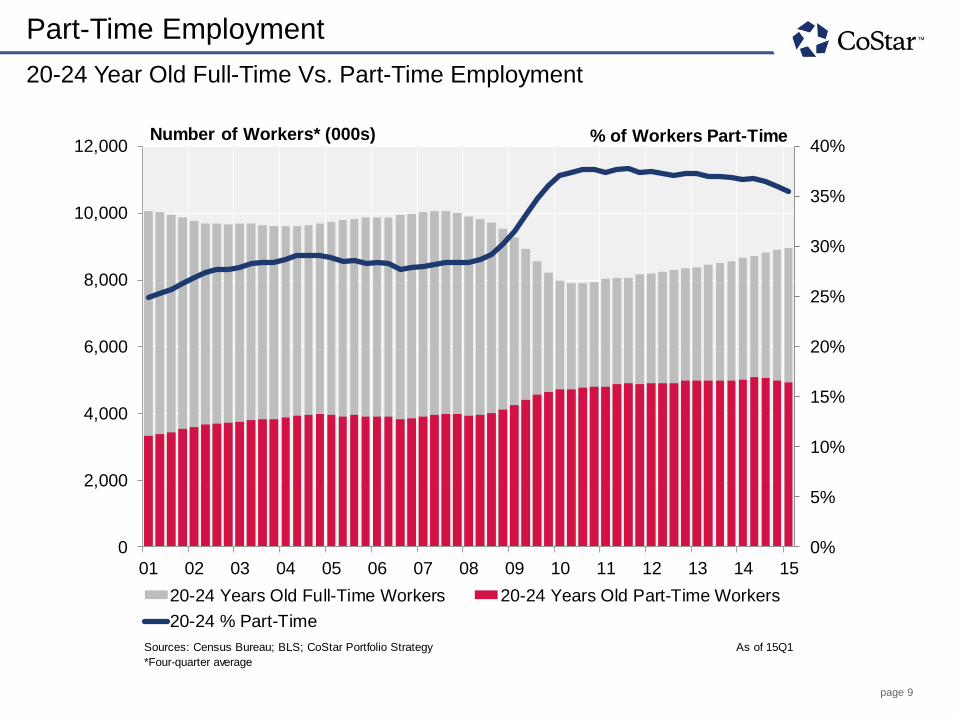
Part-Time Employment
20-24 Year Old Full-Time Vs. Part-Time Employment
Year
00
00
00
00
01
01
01
01
02
0202
02
03
03
03
Sources: Census Bureau; BLS; CoStar Portfolio Strategy As of 15Q1
*Four-quarter average
0%
5%
10%
15%
20%
25%
30%
35%
40%
0
2,000
4,000
6,000
8,000
10,000
12,000
01 02 03 04 05 06 07 08 09 10 11 12 13 14 15
20-24 Years Old Full-Time Workers 20-24 Years Old Part-Time Workers
20-24 % Part-Time
Number of Workers* (000s) % of Workers Part-Time
page 10
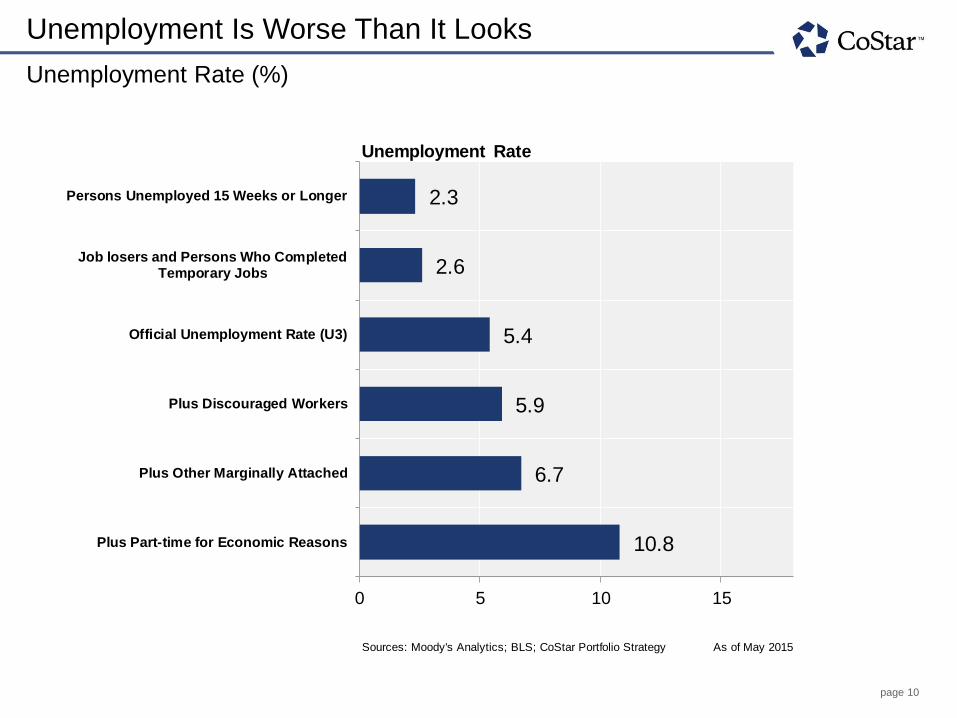
Unemployment Is Worse Than It Looks
Unemployment Rate (%)
Sources: Moody's Analytics; BLS; CoStar Portfolio Strategy As of May 2015
10.8
6.7
5.9
5.4
2.6
2.3
0 5 10 15
Plus Part-time for Economic Reasons
Plus Other Marginally Attached
Plus Discouraged Workers
Official Unemployment Rate (U3)
Job losers and Persons Who CompletedTemporary Jobs
Persons Unemployed 15 Weeks or Longer
Unemployment Rate

page 11
Leasing Fundamentals
page 12
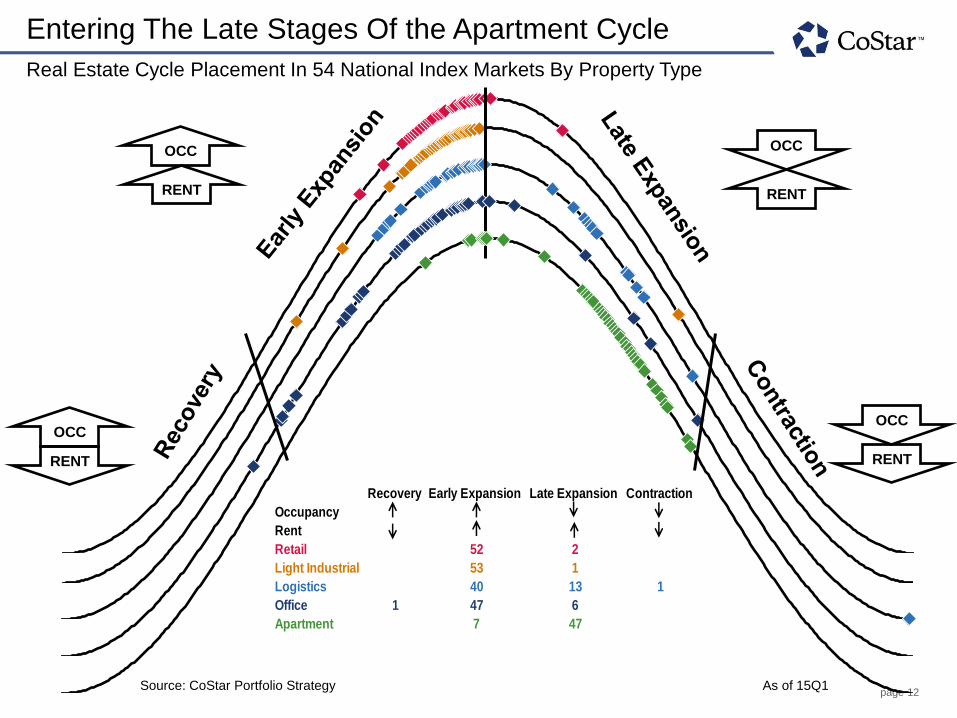
Entering The Late Stages Of the Apartment Cycle
Real Estate Cycle Placement In 54 National Index Markets By Property Type
OCC
RENT
OCC
RENT
OCC
RENT
OCC
RENT
Source: CoStar Portfolio Strategy As of 15Q1
Recovery Early Expansion Late Expansion Contraction
Occupancy
Rent
Retail 52 2
Light Industrial 53 1
Logistics 40 13 1
Office 1 47 6
Apartment 7 47
page 13
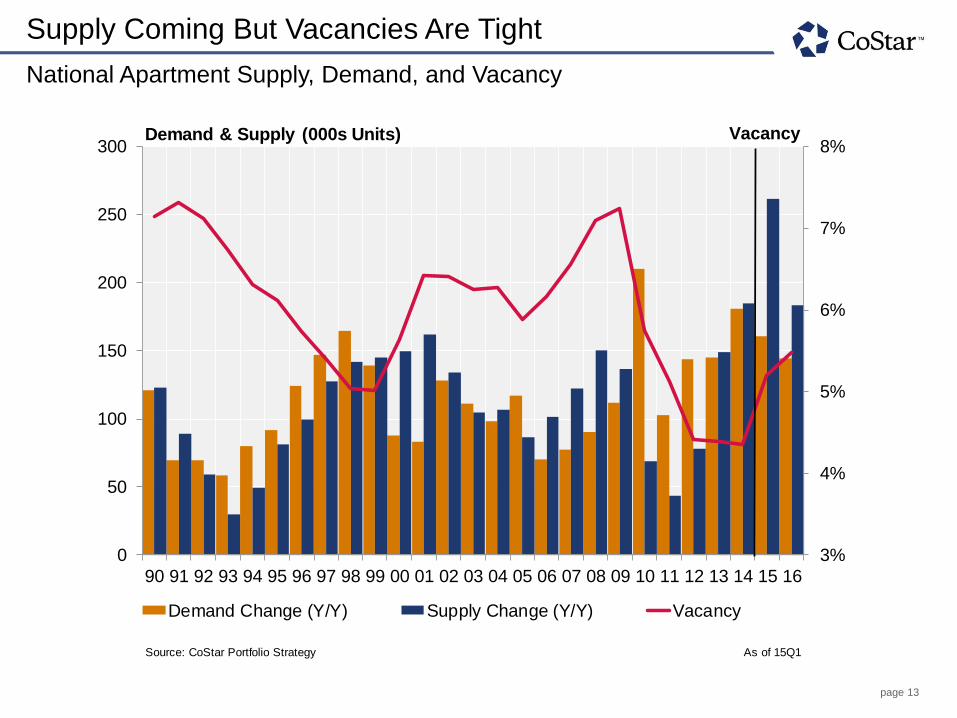
Supply Coming But Vacancies Are Tight
National Apartment Supply, Demand, and Vacancy
90
91
92
93
94
95
96
97
98
99
00
01
02
03
04
05
06
07
08
09
10
11
12
13
14
15
16
17
Source: CoStar Portfolio Strategy As of 15Q1
3%
4%
5%
6%
7%
8%
0
50
100
150
200
250
300
90 91 92 93 94 95 96 97 98 99 00 01 02 03 04 05 06 07 08 09 10 11 12 13 14 15 16
Demand Change (Y/Y) Supply Change (Y/Y) Vacancy
Demand & Supply (000s Units) Vacancy
page 14
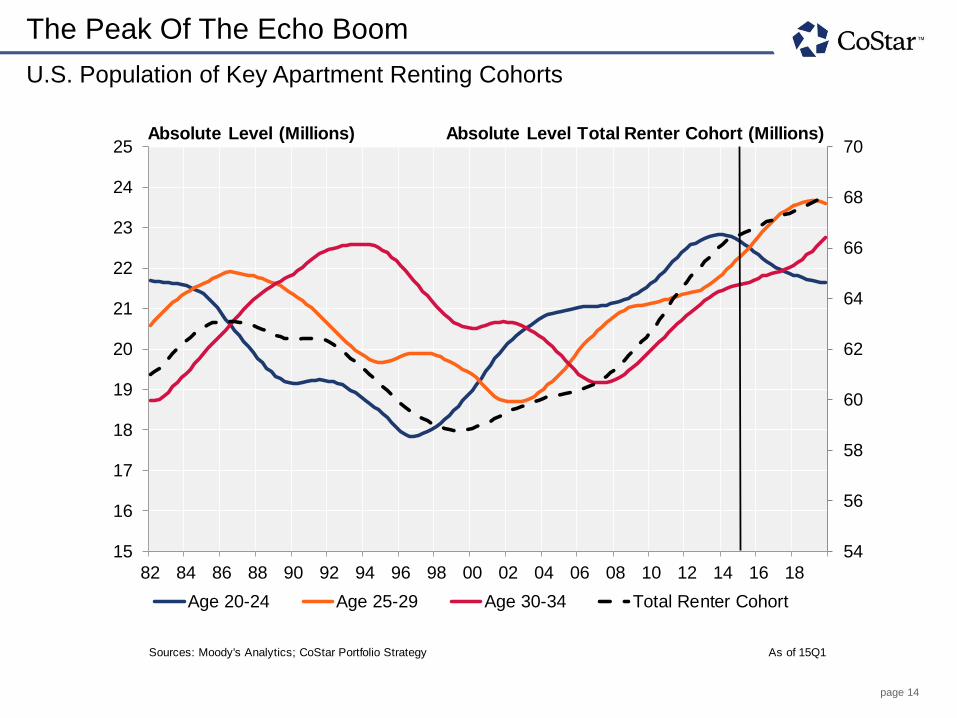
The Peak Of The Echo Boom
U.S. Population of Key Apartment Renting Cohorts
82
82
82
82
83
83
83
83
84
84
84
84
85
85
85
85
86
86
86
86
87
87
87
87
88
88
88
Sources: Moody's Analytics; CoStar Portfolio Strategy As of 15Q1
54
56
58
60
62
64
66
68
70
15
16
17
18
19
20
21
22
23
24
25
82 84 86 88 90 92 94 96 98 00 02 04 06 08 10 12 14 16 18
Age 20-24 Age 25-29 Age 30-34 Total Renter Cohort
Absolute Level (Millions) Absolute Level Total Renter Cohort (Millions)
page 15
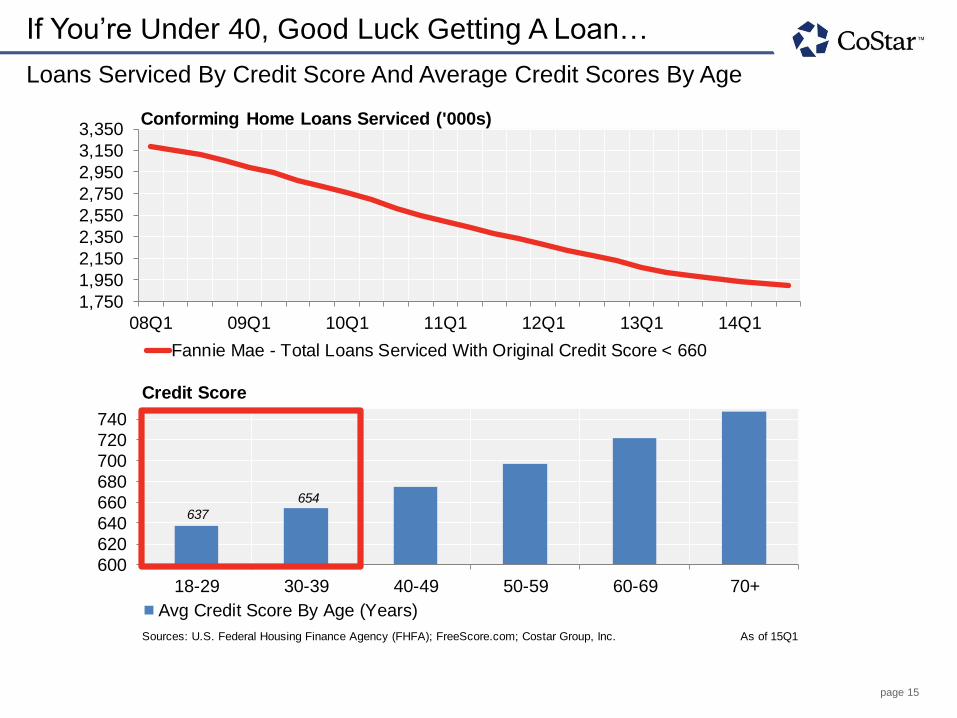
If You’re Under 40, Good Luck Getting A Loan…
Loans Serviced By Credit Score And Average Credit Scores By Age
Sources: U.S. Federal Housing Finance Agency (FHFA); FreeScore.com; Costar Group, Inc. As of 15Q1
1,750
1,950
2,150
2,350
2,550
2,750
2,950
3,150
3,350
08Q1 09Q1 10Q1 11Q1 12Q1 13Q1 14Q1
Fannie Mae - Total Loans Serviced With Original Credit Score < 660
Conforming Home Loans Serviced ('000s)
600
620
640660680
700
720740
18-29 30-39 40-49 50-59 60-69 70+
Avg Credit Score By Age (Years)
Credit Score
654
637
page 16
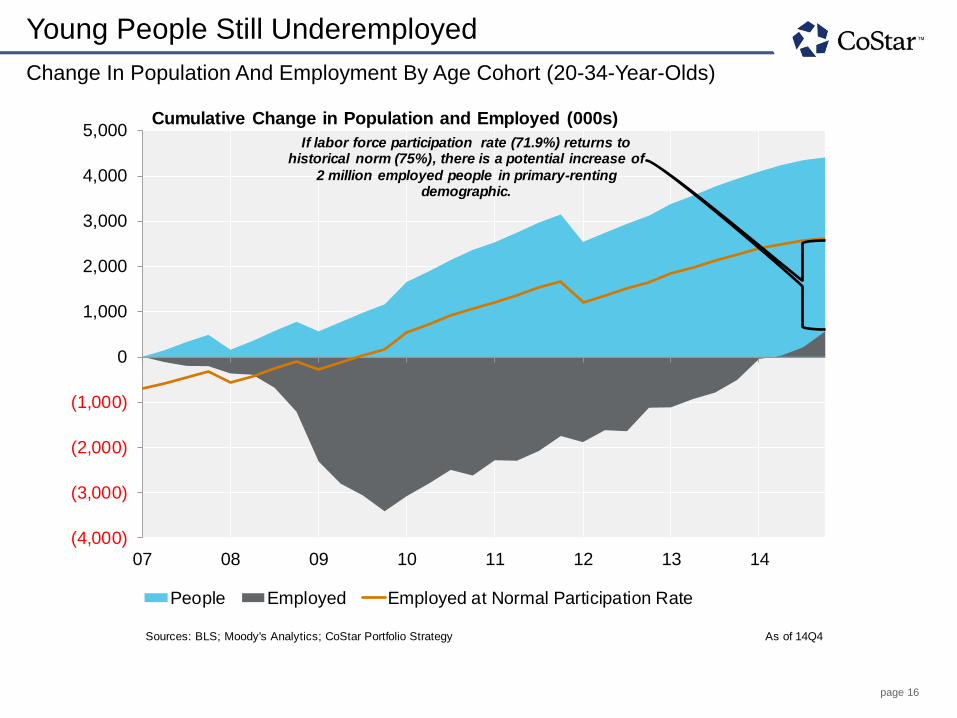
Young People Still Underemployed
Change In Population And Employment By Age Cohort (20-34-Year-Olds)
3/31/2000
6/30/2000
9/30/2000
12/31/2000
3/31/2001
6/30/2001
9/30/2001
12/31/2001
3/31/2002
6/30/2002
9/30/2002
12/31/2002
3/31/2003
6/30/2003
9/30/2003
12/31/2003
3/31/2004
6/30/2004
9/30/2004
12/31/2004
3/31/2005
6/30/2005
9/30/2005
12/31/2005
3/31/2006
6/30/2006
Sources: BLS; Moody's Analytics; CoStar Portfolio Strategy As of 14Q4
(4,000)
(3,000)
(2,000)
(1,000)
0
1,000
2,000
3,000
4,000
5,000
07 08 09 10 11 12 13 14
People Employed Employed at Normal Participation Rate
Cumulative Change in Population and Employed (000s)
If labor force participation rate (71.9%) returns to historical norm (75%), there is a potential increase of
2 million employed people in primary-renting demographic.

page 17
Starts Continue To Climb To Historical Levels
U.S. Multifamily Starts and Permits
Sources: U.S. Census; Moody's Analytics; CoStar Portfolio Strategy As of 15Q1
0
50
100
150
200
250
83 85 87 89 91 93 95 97 99 01 03 05 07 09 11 13 15
Multifamily StartsMultifamily PermitsMultifamily Starts Historical Average (83-Present)
Starts and Permits (000s)
page 18
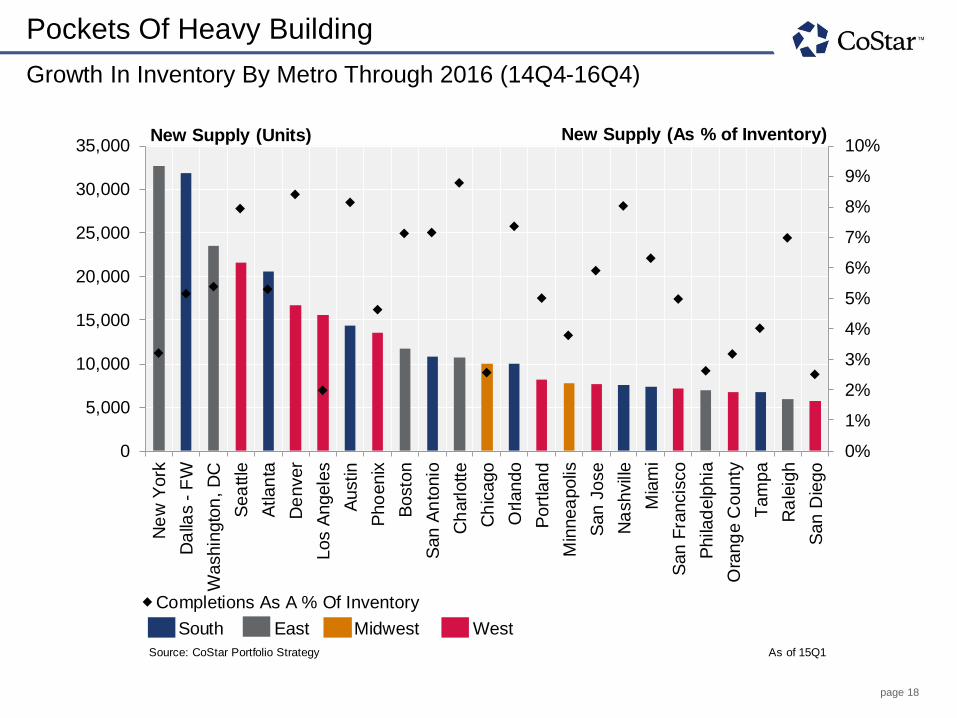
Pockets Of Heavy Building
Growth In Inventory By Metro Through 2016 (14Q4-16Q4)
Rank
2
3
4
5
6
7
8
9
10
11
12
13
14
15
16
17
18
19
20
21
22
23
24
25
26
Source: CoStar Portfolio Strategy As of 15Q1
0%
1%
2%
3%
4%
5%
6%
7%
8%
9%
10%
0
5,000
10,000
15,000
20,000
25,000
30,000
35,000N
ew
York
Da
llas -
FW
Washin
gto
n, D
C
Sea
ttle
Atlan
ta
De
nver
Los A
ngele
s
Austin
Pho
enix
Bosto
n
San
An
tonio
Ch
arlotte
Ch
icago
Orlando
Port
land
Min
nea
polis
San
Jo
se
Na
sh
vill
e
Mia
mi
San
Fra
ncis
co
Phila
delp
hia
Ora
ng
e C
ounty
Tam
pa
Ra
leig
h
San
Die
go
Completions As A % Of Inventory
South East Midwest West
New Supply (As % of Inventory)New Supply (Units)
page 19
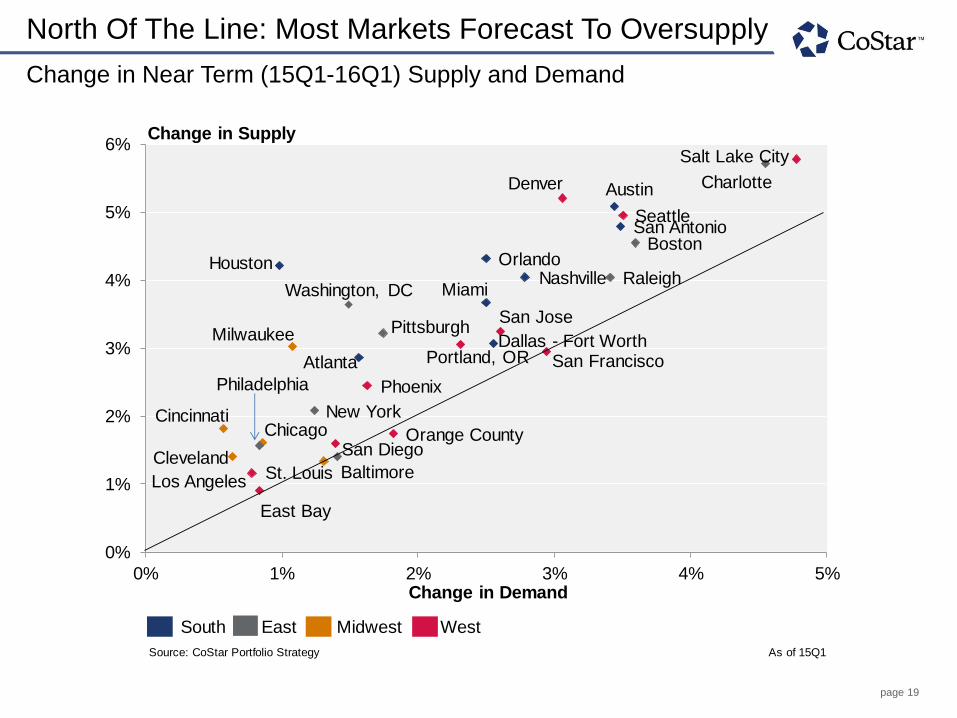
North Of The Line: Most Markets Forecast To Oversupply
Change in Near Term (15Q1-16Q1) Supply and Demand
Cleveland
Hartford
Chicago
Cincinnati
Memphis
Detroit
St. Louis
New York
San Diego
East Bay
Honolulu
Milwaukee
Richmond
Baltimore
Miami
Pittsburgh
Tampa
San Jose
Phoenix
Source: CoStar Portfolio Strategy As of 15Q1
Atlanta
Austin
Baltimore
Boston
Charlotte
ChicagoCincinnati
Cleveland
Dallas - Fort Worth
Denver
East Bay
Houston
Los Angeles
Miami
Milwaukee
Nashville
New York
Orange County
Orlando
Philadelphia Phoenix
Pittsburgh
Portland, OR
Raleigh
St. Louis
Salt Lake City
San Antonio
San Diego
San Francisco
San Jose
Seattle
Washington, DC
0%
1%
2%
3%
4%
5%
6%
0% 1% 2% 3% 4% 5%
Change in Supply
Change in Demand
South East Midwest West
page 20
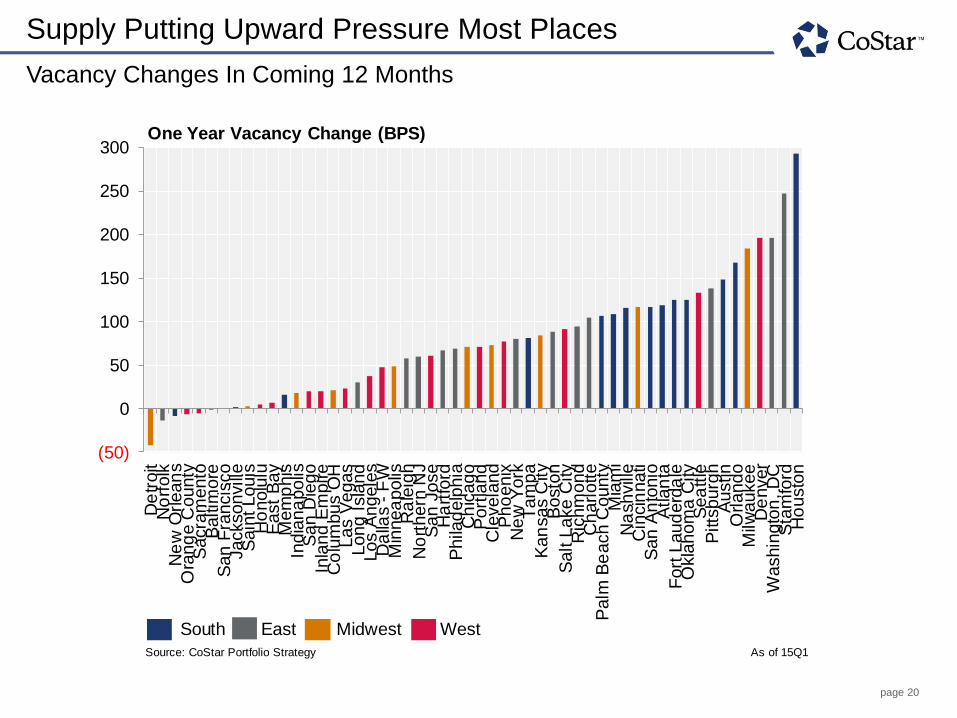
Supply Putting Upward Pressure Most Places
Vacancy Changes In Coming 12 Months
54
53
52
51
50
49
48
47
46
45
44
43
42
41
40
39
38
37
36
35
34
33
32
31
30
29
28
Source: CoStar Portfolio Strategy As of 15Q1
(50)
0
50
100
150
200
250
300D
etr
oit
No
rfolk
Ne
w O
rlean
sO
rang
e C
ounty
Sacra
mento
Baltim
ore
San
Fra
ncis
co
Jacksonvill
eS
ain
t Louis
Ho
nolu
luE
ast
Bay
Mem
phis
India
na
polis
San
Die
go
Inla
nd E
mpire
Co
lum
bus O
HLas V
egas
Long I
sla
nd
Los A
ngele
sD
alla
s -
FW
Min
nea
polis
Ra
leig
hN
ort
hern
NJ
San
Jose
Ha
rtfo
rdP
hila
delp
hia
Ch
icago
Port
land
Cle
vela
nd
Pho
enix
Ne
w Y
ork
Tam
pa
Kan
sas C
ity
Bosto
nS
alt L
ake
City
Ric
hm
ond
Ch
arlotte
Palm
Be
ach C
ounty
Mia
mi
Na
shvill
eC
incin
nati
San
An
tonio
Atlan
taF
ort
Laud
erd
ale
Okla
hom
a C
ity
Sea
ttle
Pitts
burg
hA
ustin
Orlando
Milw
aukee
De
nve
rW
ashin
gto
n, D
CS
tam
ford
Ho
usto
n
One Year Vacancy Change (BPS)
South East Midwest West

page 21
Vacancies Will Remain Tighter In West Coast Markets
Regional Vacancy Rates
Source: CoStar Portfolio Strategy As of 15Q1
2%
3%
4%
5%
6%
7%
8%
9%
10%
01 03 05 07 09 11 13 15
East South Midwest West National Index
Vacancy Rate
page 22
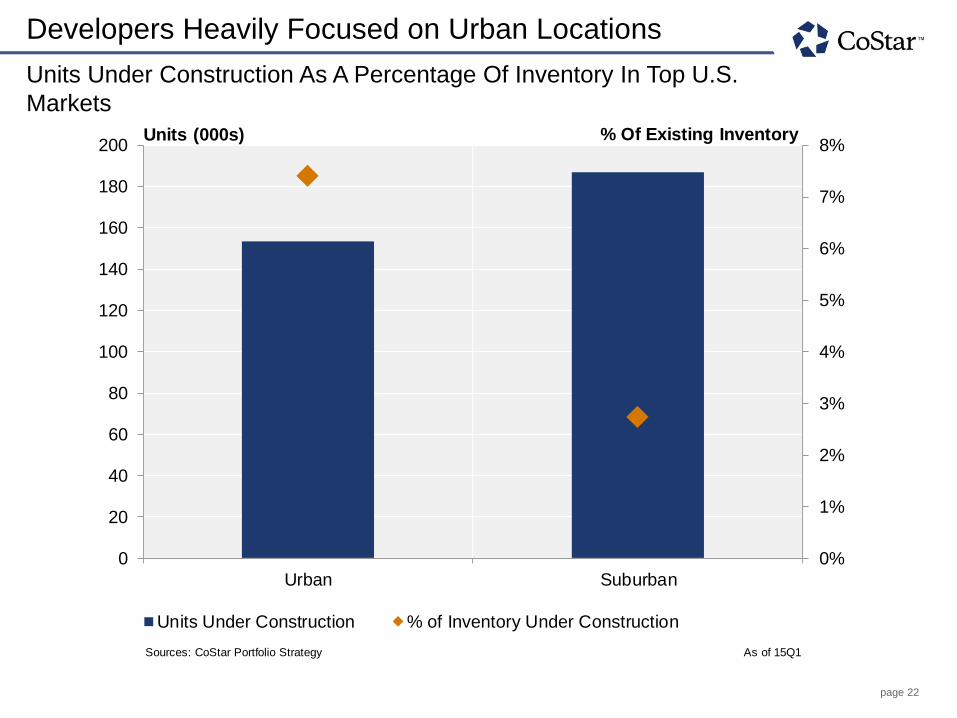
Developers Heavily Focused on Urban Locations
Units Under Construction As A Percentage Of Inventory In Top U.S.
Markets
Urban
Suburban
CBD
Suburban
Sources: CoStar Portfolio Strategy As of 15Q1
0%
1%
2%
3%
4%
5%
6%
7%
8%
0
20
40
60
80
100
120
140
160
180
200
Urban Suburban
Units (000s)
Units Under Construction % of Inventory Under Construction
% Of Existing Inventory

page 23
Vacancies In 3 Star Properties Still Tightening
Change In Vacancy By Star Over Last 2 Years By Star Rating
Building Rating
Row Labels
3/31/2013
3/31/2015
Grand Total
0.071755414
Source: CoStar Portfolio Strategy As of 15Q1
(0.6%)
(0.4%)
(0.2%)
0.0%
0.2%
0.4%
0.6%
0.8%
1.0%
4 & 5 Star 3 Star 1 & 2 Star
Y/Y Change in Vacancy
Vacancy Change
page 24
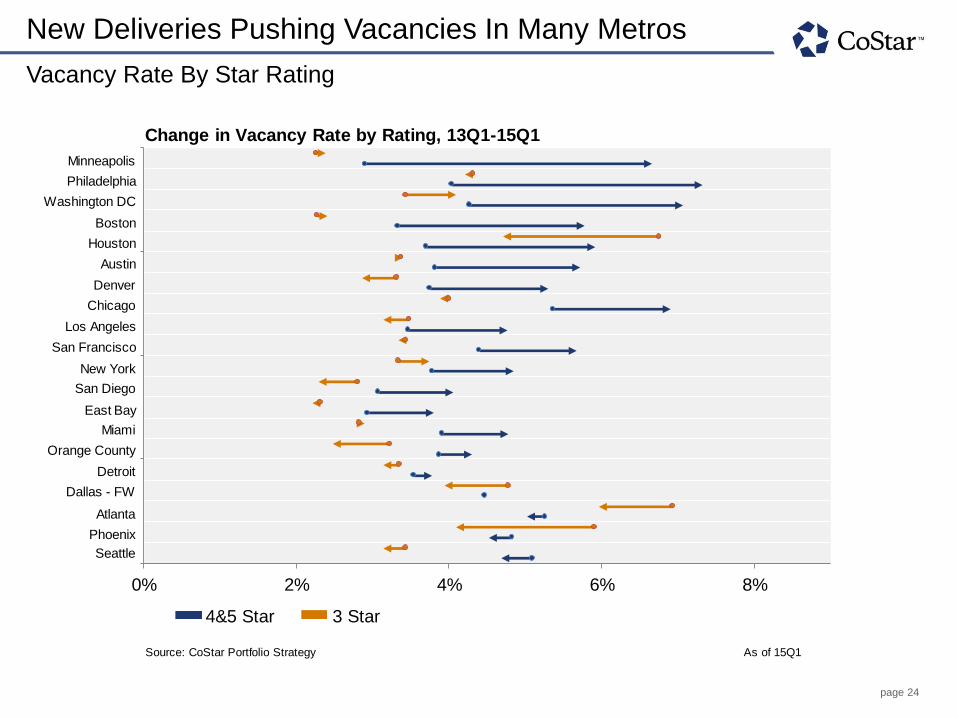
New Deliveries Pushing Vacancies In Many Metros
Vacancy Rate By Star Rating
Source: CoStar Portfolio Strategy As of 15Q1
0% 2% 4% 6% 8%
4&5 Star 3 Star
Orange County
Minneapolis
Phoenix
Seattle
Atlanta
East Bay
Dallas - FW
Detroit
Change in Vacancy Rate by Rating, 13Q1-15Q1
Philadelphia
Washington DC
Boston
Houston
Austin
Denver
Chicago
Los Angeles
San Francisco
New York
San Diego
Miami

page 25
Rent and NOI Trends
page 26
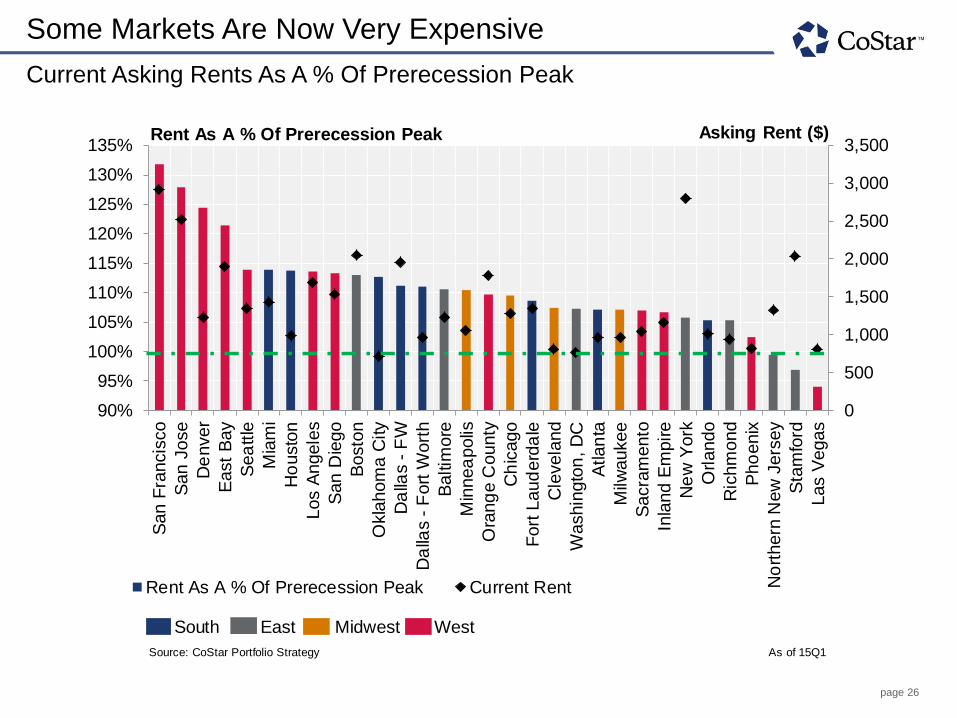
Some Markets Are Now Very Expensive
Current Asking Rents As A % Of Prerecession Peak
Rank
1
2
3
4
9
10
11
12
13
15
16
18
19
21
22
24
25
29
34
35
36
38
39
41
45
46
47
50
52
53
54
Source: CoStar Portfolio Strategy As of 15Q1
0
500
1,000
1,500
2,000
2,500
3,000
3,500
90%
95%
100%
105%
110%
115%
120%
125%
130%
135%S
an
Fra
ncis
co
San
Jose
De
nver
East
Bay
Sea
ttle
Mia
mi
Ho
usto
n
Los A
ngele
s
San
Die
go
Bosto
n
Okla
hom
a C
ity
Da
llas -
FW
Da
llas -
Fort
Wort
h
Baltim
ore
Min
nea
polis
Ora
ng
e C
ounty
Ch
icago
Fort
Laud
erd
ale
Cle
vela
nd
Washin
gto
n, D
C
Atlan
ta
Milw
aukee
Sacra
mento
Inla
nd E
mpire
Ne
w Y
ork
Orlando
Ric
hm
ond
Pho
enix
No
rthern
New
Jers
ey
Sta
mfo
rd
Las V
egas
Rent As A % Of Prerecession Peak Current Rent
Rent As A % Of Prerecession Peak
South East Midwest West
Asking Rent ($)
page 27
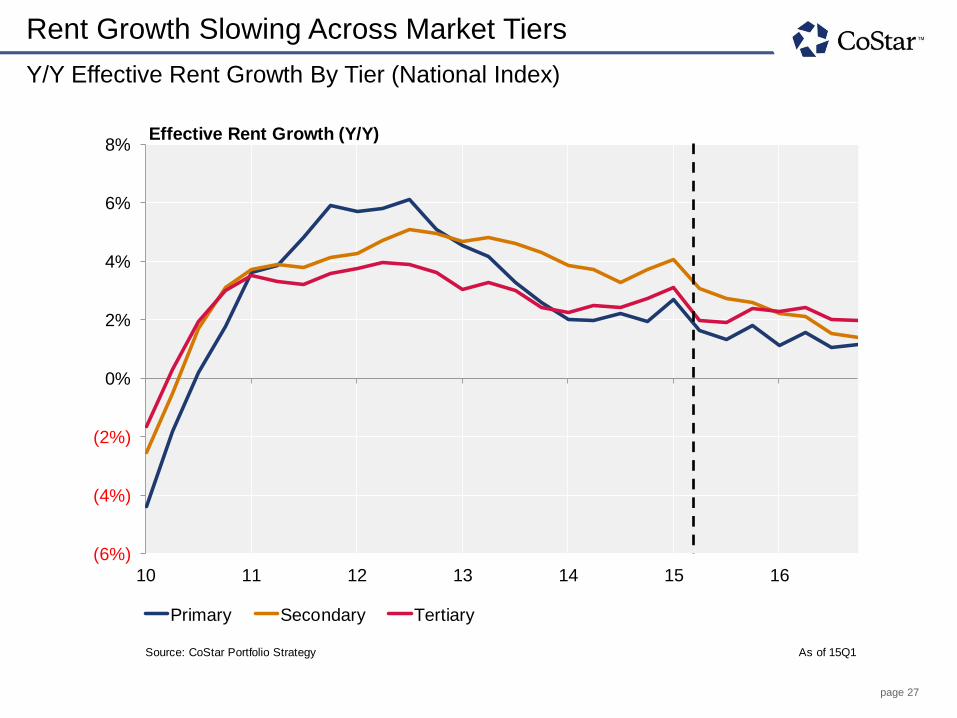
Rent Growth Slowing Across Market Tiers
Y/Y Effective Rent Growth By Tier (National Index)
01
01
01
01
02
02
02
02
03
03
03
03
04
04
04
04
05
05
05
05
06
06
06
06
Source: CoStar Portfolio Strategy As of 15Q1
(6%)
(4%)
(2%)
0%
2%
4%
6%
8%
10 11 12 13 14 15 16
Primary Secondary Tertiary
Effective Rent Growth (Y/Y)
page 28
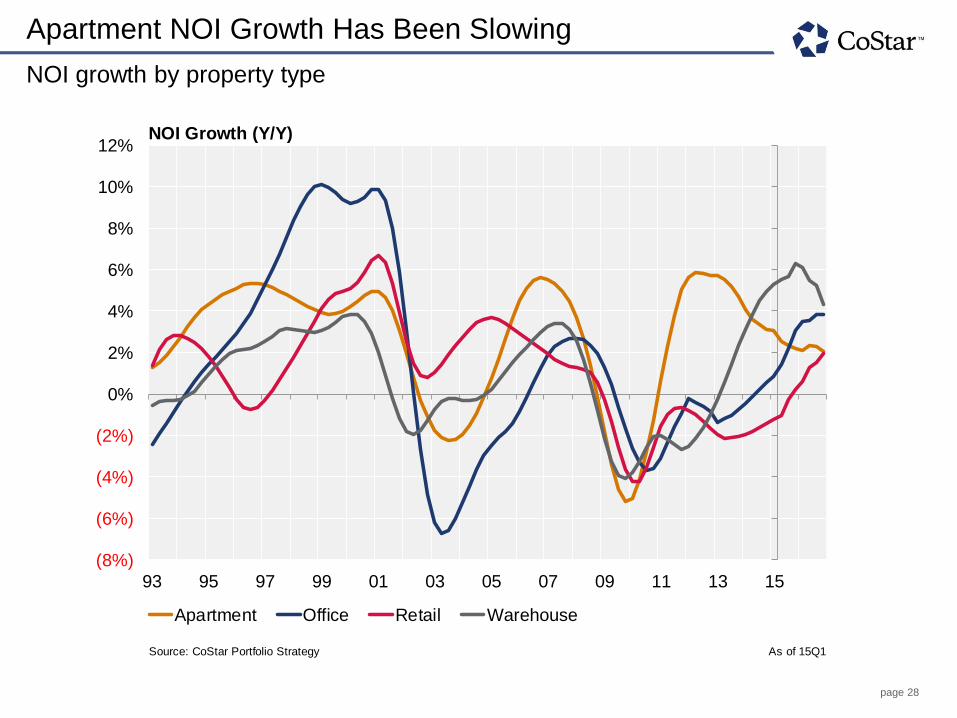
Apartment NOI Growth Has Been Slowing
NOI growth by property type
Metro Name
NOI Index YOY - Metro
Row Labels
3/31/1982
6/30/1982
9/30/1982
12/31/1982
3/31/1983
6/30/1983
9/30/1983
12/31/1983
3/31/1984
6/30/1984
9/30/1984
12/31/1984
3/31/1985
6/30/1985
9/30/1985
12/31/1985
3/31/1986
6/30/1986
9/30/1986
12/31/1986
3/31/1987
6/30/1987
9/30/1987
12/31/1987
3/31/1988
6/30/1988
9/30/1988
12/31/1988
Source: CoStar Portfolio Strategy As of 15Q1
(8%)
(6%)
(4%)
(2%)
0%
2%
4%
6%
8%
10%
12%
93 95 97 99 01 03 05 07 09 11 13 15
Apartment Office Retail Warehouse
NOI Growth (Y/Y)

page 29
Single-Family Market
page 30
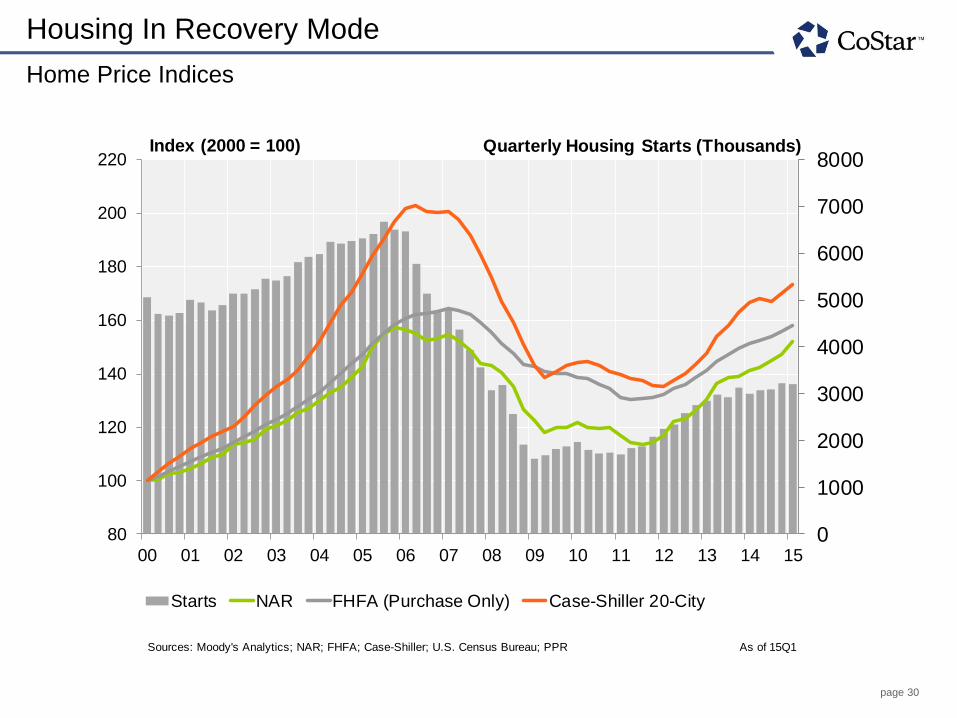
Housing In Recovery Mode
Home Price Indices
12/31/1999
3/31/2000
6/30/2000
9/30/2000
12/31/2000
3/31/2001
6/30/2001
9/30/2001
12/31/2001
3/31/2002
Sources: Moody's Analytics; NAR; FHFA; Case-Shiller; U.S. Census Bureau; PPR As of 15Q1
0
1000
2000
3000
4000
5000
6000
7000
8000
80
100
120
140
160
180
200
220
00 01 02 03 04 05 06 07 08 09 10 11 12 13 14 15
Starts NAR FHFA (Purchase Only) Case-Shiller 20-City
Index (2000 = 100) Quarterly Housing Starts (Thousands)
page 31
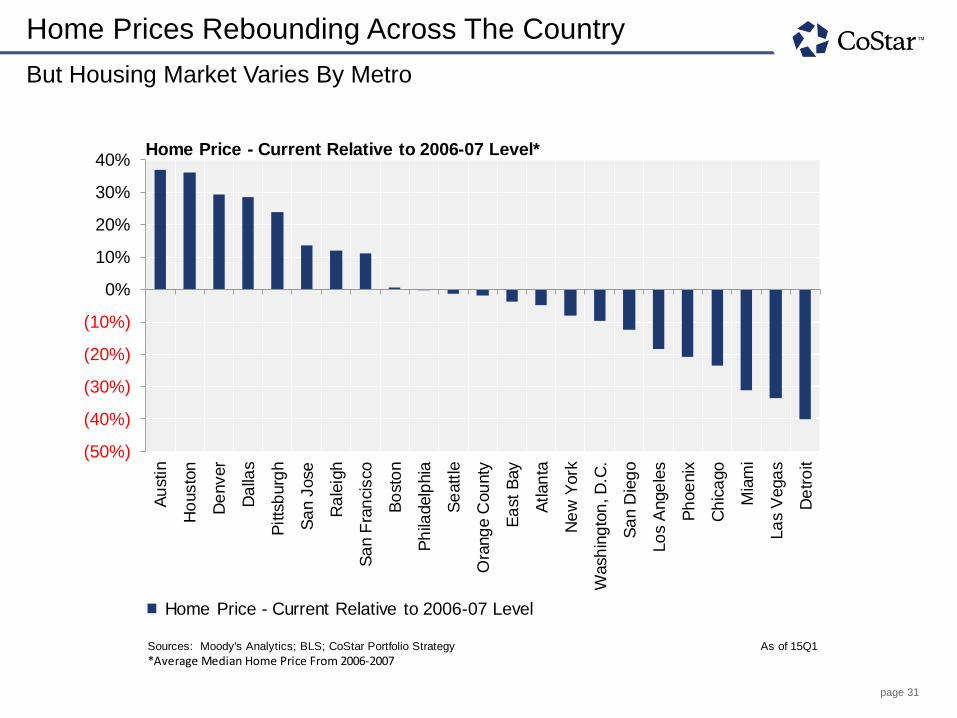
Home Prices Rebounding Across The Country
But Housing Market Varies By Metro
21345867
1113
9121014161517182019212223
Sources: Moody's Analytics; BLS; CoStar Portfolio Strategy As of 15Q1
*Average Median Home Price From 2006-2007
(50%)
(40%)
(30%)
(20%)
(10%)
0%
10%
20%
30%
40%A
ustin
Ho
usto
n
De
nver
Da
llas
Pitts
burg
h
Sa
n J
ose
Ra
leig
h
Sa
n F
ran
cis
co
Bo
sto
n
Ph
iladelp
hia
Se
att
le
Ora
ng
e C
ou
nty
Ea
st
Bay
Atlan
ta
Ne
w Y
ork
Wash
ing
ton
, D
.C.
Sa
n D
ieg
o
Lo
s A
nge
les
Ph
oe
nix
Ch
ica
go
Mia
mi
La
s V
ega
s
De
tro
it
Home Price - Current Relative to 2006-07 Level*
Home Price - Current Relative to 2006-07 Level
page 32
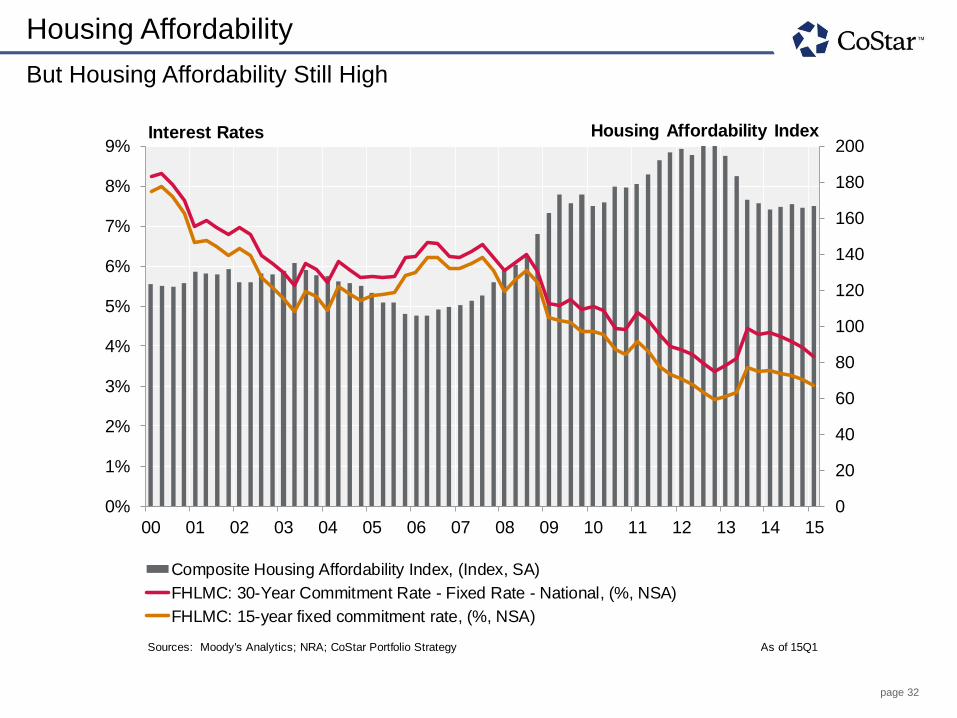
Housing Affordability
But Housing Affordability Still High
3/31/1970
6/30/1970
9/30/1970
12/31/1970
3/31/1971
6/30/1971
9/30/1971
12/31/1971
3/31/1972
6/30/1972
9/30/1972
12/31/1972
3/31/1973
6/30/1973
9/30/1973
12/31/1973
3/31/1974
6/30/1974
9/30/1974
12/31/1974
3/31/1975
6/30/1975
9/30/1975
12/31/1975
3/31/1976
6/30/1976
Sources: Moody's Analytics; NRA; CoStar Portfolio Strategy As of 15Q1
0
20
40
60
80
100
120
140
160
180
200
0%
1%
2%
3%
4%
5%
6%
7%
8%
9%
00 01 02 03 04 05 06 07 08 09 10 11 12 13 14 15
Composite Housing Affordability Index, (Index, SA)
FHLMC: 30-Year Commitment Rate - Fixed Rate - National, (%, NSA)
FHLMC: 15-year fixed commitment rate, (%, NSA)
Interest Rates Housing Affordability Index
page 33
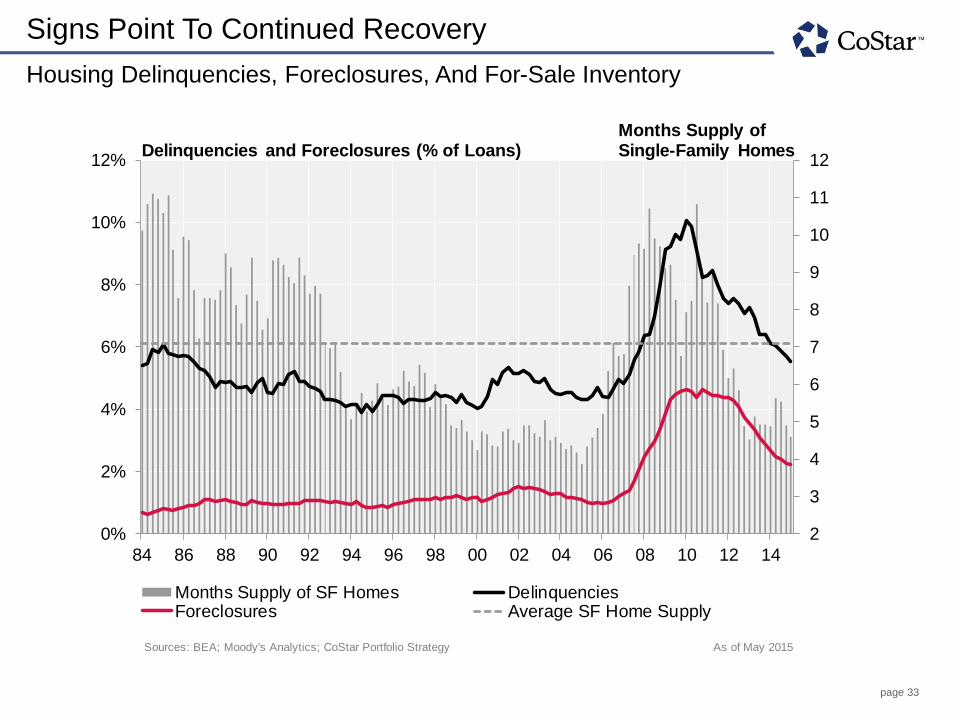
Signs Point To Continued Recovery
Housing Delinquencies, Foreclosures, And For-Sale Inventory
Delinquencies
6/30/1981
9/30/1981
12/31/1981
3/31/1982
6/30/1982
9/30/1982
12/31/1982
3/31/1983
6/30/1983
9/30/1983
12/31/1983
3/31/1984
6/30/1984
9/30/1984
12/31/1984
3/31/1985
Sources: BEA; Moody's Analytics; CoStar Portfolio Strategy As of May 2015
2
3
4
5
6
7
8
9
10
11
12
0%
2%
4%
6%
8%
10%
12%
84 86 88 90 92 94 96 98 00 02 04 06 08 10 12 14
Months Supply of SF Homes DelinquenciesForeclosures Average SF Home Supply
Delinquencies and Foreclosures (% of Loans)Months Supply of Single-Family Homes

page 34
Is Condo Market Coming Back?
U.S. Condo Inventory And Condo Sales Price Change
Sources: NAR; Moody's Analytics; CoStar Portfolio Strategy As of 15Q1
0
100
200
300
400
500
600
700
01 02 03 04 05 06 07 08 09 10 11 12 13 14 15
(8%)
(6%)
(4%)
(2%)
0%
2%
4%
6%
8%
10%
12%Homeownership Vacancy and Quarterly Price Change
Condos Available for Sale
Change in Condo Sales Price - 4 Qrtr Moving Avg (Q/Q)
5+ Unit Homeownership Vacancy
Condos For Sale (000s)

page 35
Homeownership Rate Continues To Decline
Homeownership Rate And Renter Occupied Households
65
65
66
66
66
66
67
67
67
67
68
68
68
68
69
69
69
69
70
70
70
70
71
71
71
Sources: Moody's Analytics; U.S. Census Bureau; CoStar Portfolio Strategy As of 15Q1
30
32
34
36
38
40
42
44
30
35
40
45
50
55
60
65
70
94 96 98 00 02 04 06 08 10 12 14
Renter Households Under 35 Years HO Rate U.S. HO Rate
Homeownership Rate (%) Renter Occupied Households (Millions)
page 36
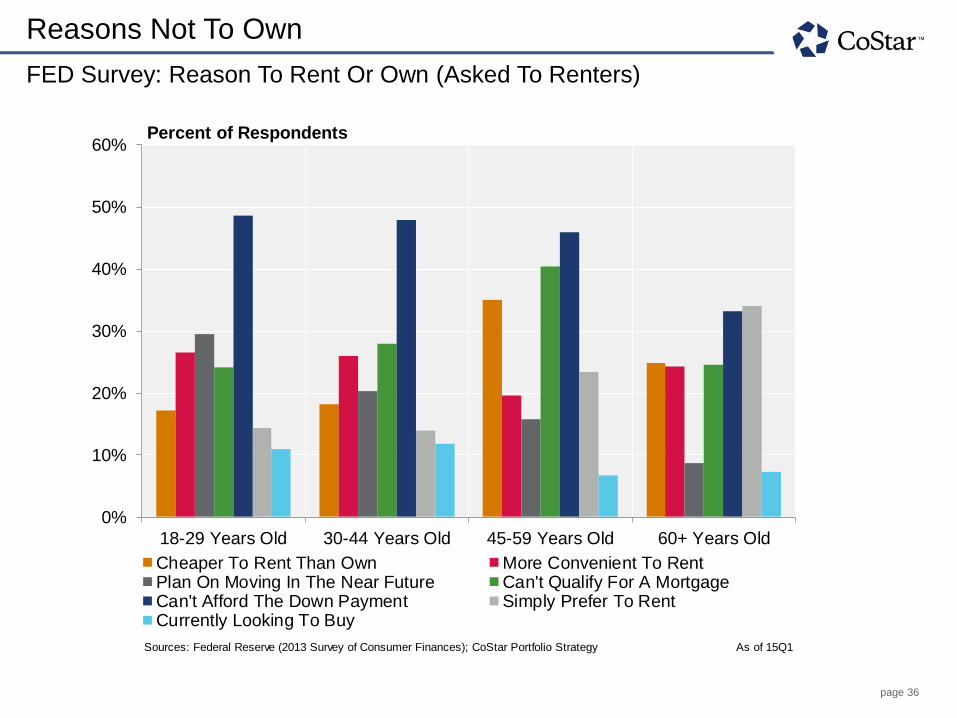
Reasons Not To Own
FED Survey: Reason To Rent Or Own (Asked To Renters)
Other
Cheaper/More Convenient to Rent
Sources: Federal Reserve (2013 Survey of Consumer Finances); CoStar Portfolio Strategy As of 15Q1
0%
10%
20%
30%
40%
50%
60%
18-29 Years Old 30-44 Years Old 45-59 Years Old 60+ Years Old
Cheaper To Rent Than Own More Convenient To RentPlan On Moving In The Near Future Can't Qualify For A MortgageCan't Afford The Down Payment Simply Prefer To RentCurrently Looking To Buy
Percent of Respondents

page 37
Capital Markets
page 38
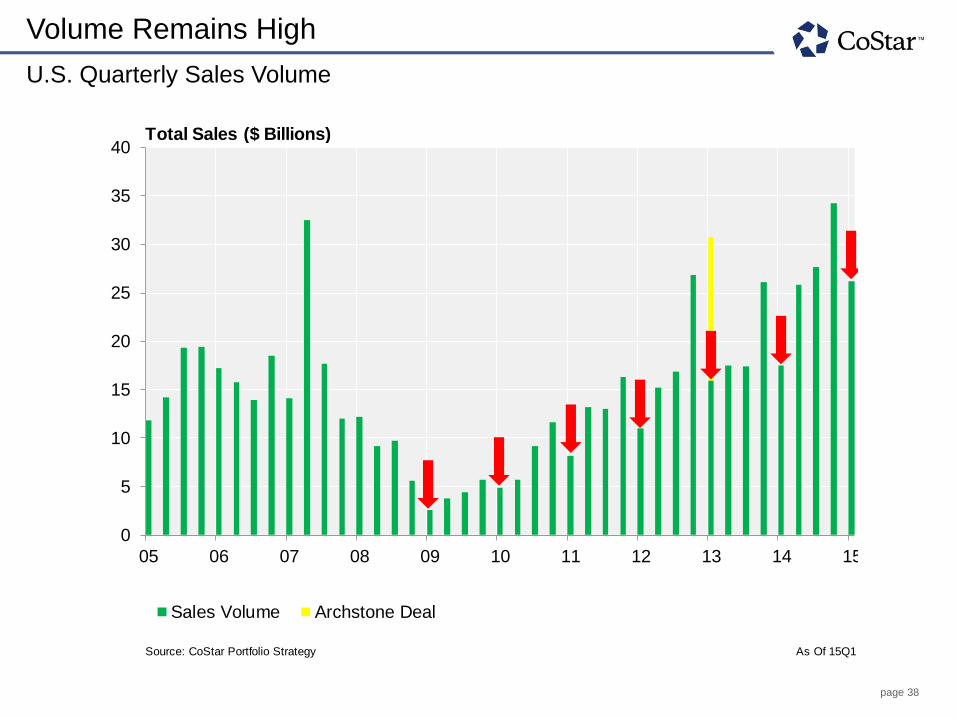
Volume Remains High
U.S. Quarterly Sales Volume
As Of 15Q1
12/31/20043/31/20056/30/20059/30/2005
12/31/20053/31/20066/30/20069/30/2006
12/31/20063/31/20076/30/20079/30/2007
12/31/20073/31/20086/30/20089/30/2008
12/31/20083/31/20096/30/20099/30/2009
12/31/20093/31/20106/30/20109/30/2010
12/31/20103/31/20116/30/20119/30/2011
12/31/2011
Source: CoStar Portfolio Strategy As Of 15Q1
0
5
10
15
20
25
30
35
40
05 06 07 08 09 10 11 12 13 14 15
Sales Volume Archstone Deal
Total Sales ($ Billions)
page 39
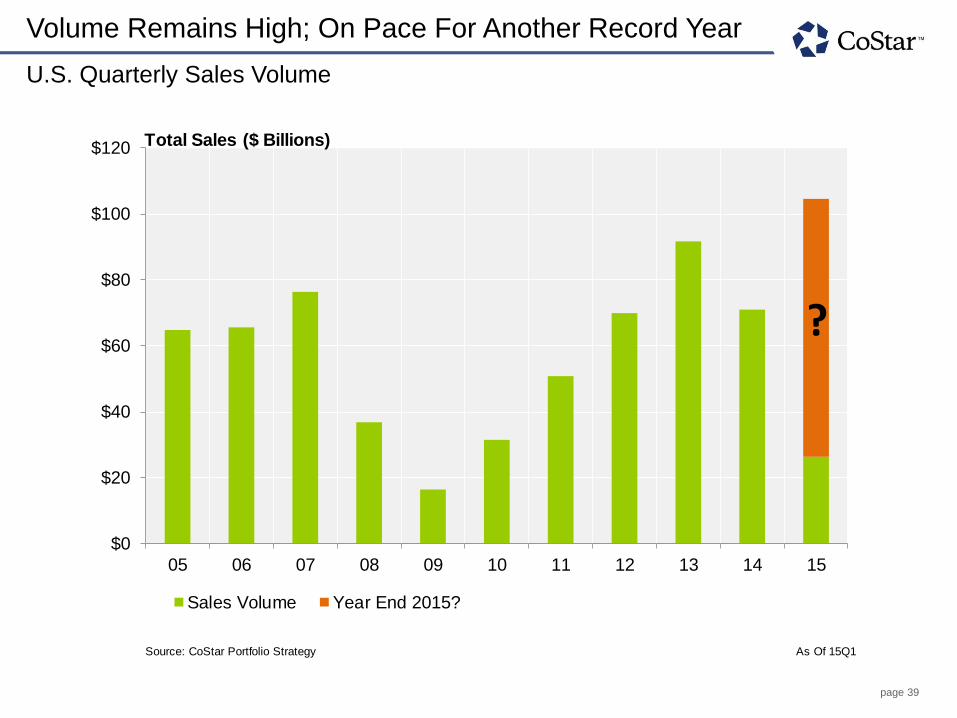
Volume Remains High; On Pace For Another Record Year
U.S. Quarterly Sales Volume
As Of 15Q1
12/31/200512/31/200612/31/200712/31/200812/31/200912/31/201012/31/201112/31/201212/31/201312/31/201412/31/2015
Source: CoStar Portfolio Strategy As Of 15Q1
$0
$20
$40
$60
$80
$100
$120
05 06 07 08 09 10 11 12 13 14 15
Sales Volume Year End 2015?
Total Sales ($ Billions)
?
page 40
Sales Volume by Tier
As Of 15Q1
12/31/20043/31/20056/30/20059/30/2005
12/31/20053/31/20066/30/20069/30/2006
12/31/20063/31/20076/30/20079/30/2007
12/31/20073/31/20086/30/20089/30/2008
12/31/20083/31/20096/30/20099/30/2009
12/31/20093/31/20106/30/20109/30/2010
12/31/20103/31/20116/30/2011
Source: CoStar Portfolio Strategy As Of 15Q1
0
5
10
15
20
25
30
35
40
08 09 10 11 12 13 14 15
Primary Market Sales Volume Secondary Volume Tertiary Volume
Total Sales ($ Billions)
page 41
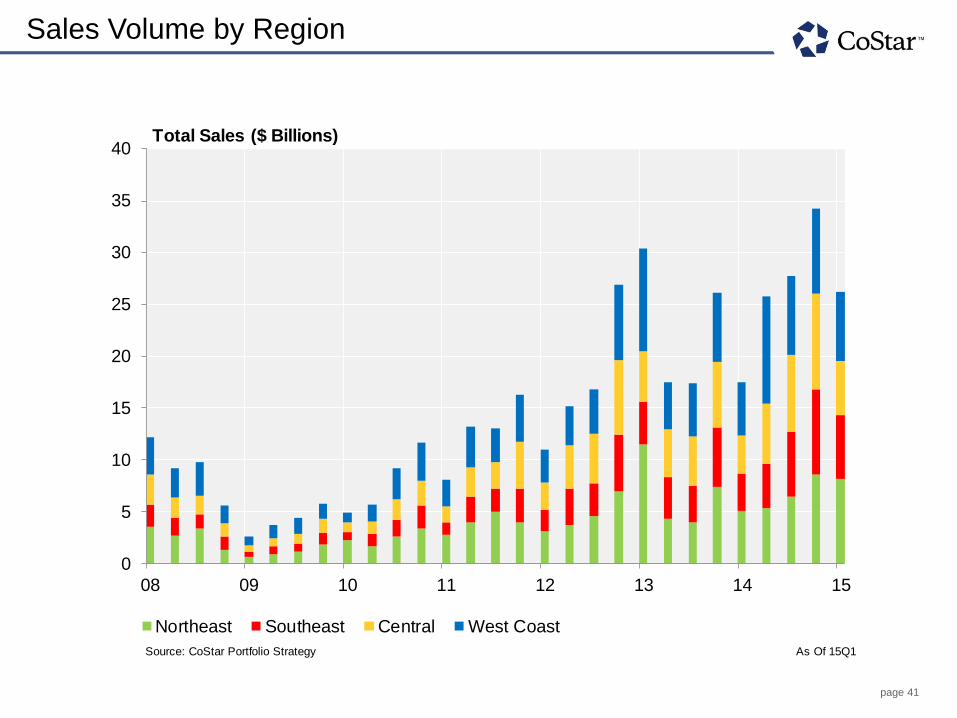
Sales Volume by Region
As Of 15Q1
12/31/20043/31/20056/30/20059/30/2005
12/31/20053/31/20066/30/20069/30/2006
12/31/20063/31/20076/30/20079/30/2007
12/31/20073/31/20086/30/20089/30/2008
12/31/20083/31/20096/30/20099/30/2009
12/31/20093/31/20106/30/20109/30/2010
12/31/20103/31/20116/30/20119/30/2011
Source: CoStar Portfolio Strategy As Of 15Q1
0
5
10
15
20
25
30
35
40
08 09 10 11 12 13 14 15
Northeast Southeast Central West Coast
Total Sales ($ Billions)
page 42
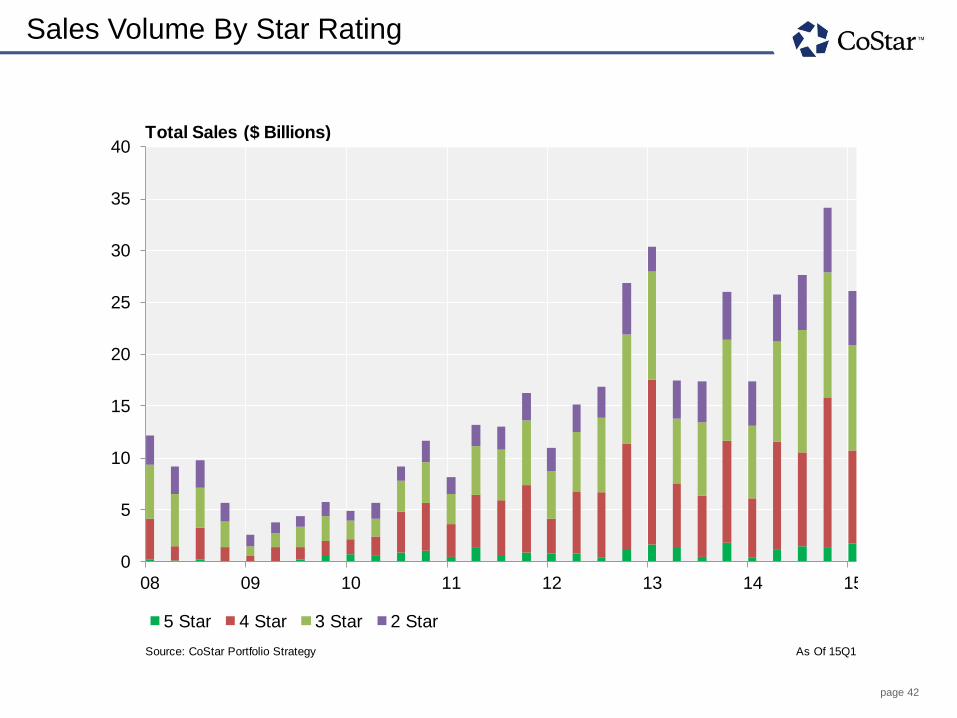
Sales Volume By Star Rating
As Of 15Q1
Rating
12/31/20043/31/20056/30/20059/30/2005
12/31/20053/31/20066/30/20069/30/2006
12/31/20063/31/20076/30/20079/30/2007
12/31/20073/31/20086/30/20089/30/2008
12/31/20083/31/20096/30/20099/30/2009
12/31/20093/31/20106/30/20109/30/2010
12/31/20103/31/20116/30/20119/30/2011
Source: CoStar Portfolio Strategy As Of 15Q1
0
5
10
15
20
25
30
35
40
08 09 10 11 12 13 14 15
5 Star 4 Star 3 Star 2 Star
Total Sales ($ Billions)
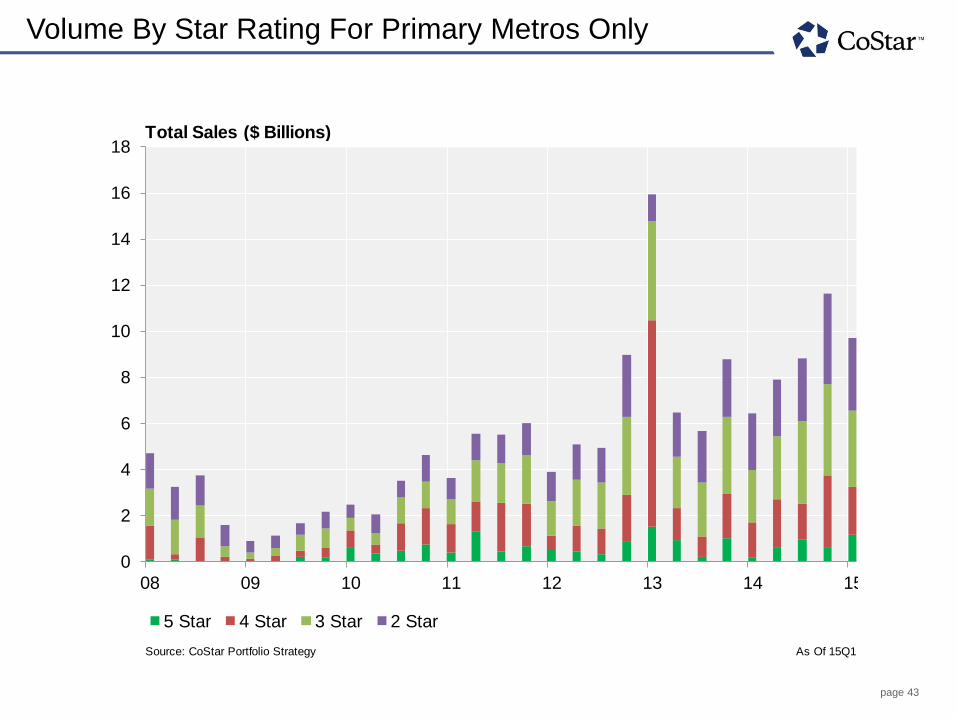
page 43
Volume By Star Rating For Primary Metros Only
As Of 15Q1
Rating
12/31/20043/31/20056/30/20059/30/2005
12/31/20053/31/20066/30/20069/30/2006
12/31/20063/31/20076/30/20079/30/2007
12/31/20073/31/20086/30/20089/30/2008
12/31/20083/31/20096/30/20099/30/2009
12/31/20093/31/20106/30/20109/30/2010
12/31/20103/31/20116/30/20119/30/2011
Source: CoStar Portfolio Strategy As Of 15Q1
0
2
4
6
8
10
12
14
16
18
08 09 10 11 12 13 14 15
5 Star 4 Star 3 Star 2 Star
Total Sales ($ Billions)
page 44
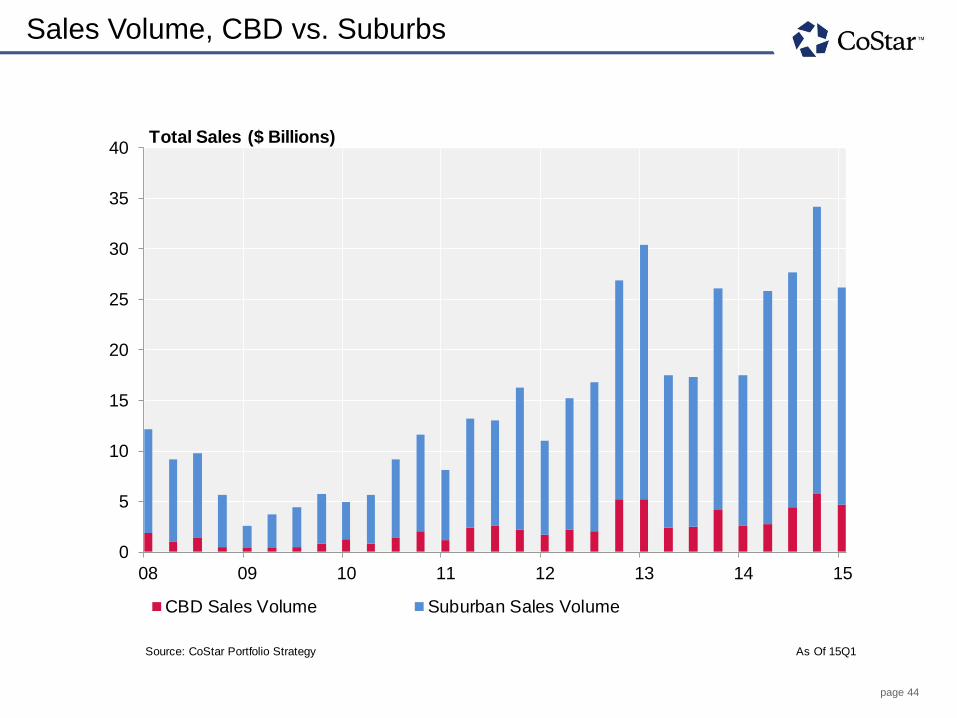
Sales Volume, CBD vs. Suburbs
As Of 15Q1Subtype:
12/31/20043/31/20056/30/20059/30/2005
12/31/20053/31/20066/30/20069/30/2006
12/31/20063/31/20076/30/20079/30/2007
12/31/20073/31/20086/30/20089/30/2008
12/31/20083/31/20096/30/20099/30/2009
12/31/20093/31/20106/30/20109/30/2010
12/31/20103/31/20116/30/20119/30/2011
Source: CoStar Portfolio Strategy As Of 15Q1
0
5
10
15
20
25
30
35
40
08 09 10 11 12 13 14 15
CBD Sales Volume Suburban Sales Volume
Total Sales ($ Billions)
page 45
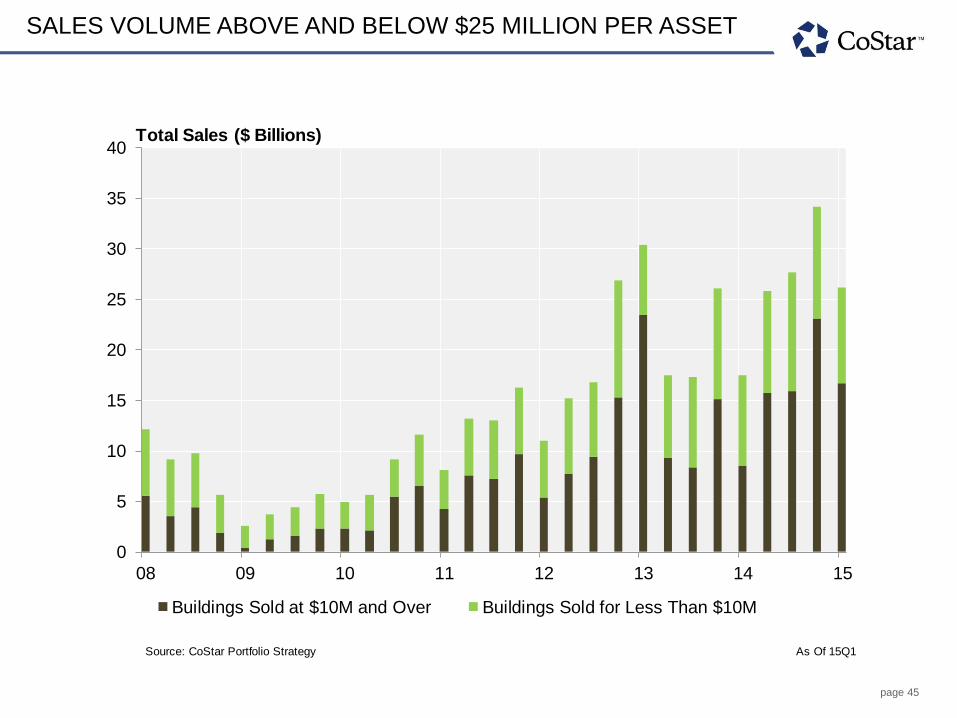
SALES VOLUME ABOVE AND BELOW $25 MILLION PER ASSET
As Of 15Q1Subtype:
12/31/20043/31/20056/30/20059/30/2005
12/31/20053/31/20066/30/20069/30/2006
12/31/20063/31/20076/30/20079/30/2007
12/31/20073/31/20086/30/20089/30/2008
12/31/20083/31/20096/30/20099/30/2009
12/31/20093/31/20106/30/20109/30/2010
12/31/20103/31/20116/30/20119/30/2011
Source: CoStar Portfolio Strategy As Of 15Q1
0
5
10
15
20
25
30
35
40
08 09 10 11 12 13 14 15
Buildings Sold at $10M and Over Buildings Sold for Less Than $10M
Total Sales ($ Billions)
page 46
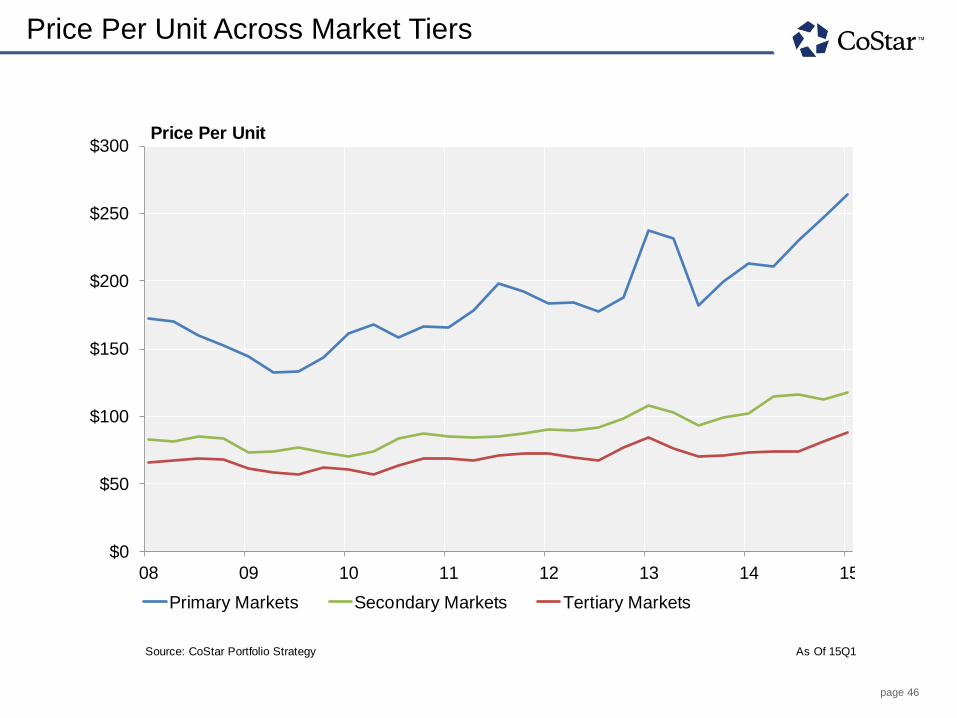
Price Per Unit Across Market Tiers
As Of 15Q1
12/31/20043/31/20056/30/20059/30/2005
12/31/20053/31/20066/30/20069/30/2006
12/31/20063/31/20076/30/20079/30/2007
12/31/20073/31/20086/30/20089/30/2008
12/31/20083/31/20096/30/20099/30/2009
12/31/20093/31/20106/30/20109/30/2010
12/31/20103/31/20116/30/2011
Source: CoStar Portfolio Strategy As Of 15Q1
$0
$50
$100
$150
$200
$250
$300
08 09 10 11 12 13 14 15
Primary Markets Secondary Markets Tertiary Markets
Price Per Unit

page 47
As Of 15Q1
12/31/20043/31/20056/30/20059/30/2005
12/31/20053/31/20066/30/20069/30/2006
12/31/20063/31/20076/30/20079/30/2007
12/31/20073/31/20086/30/20089/30/2008
12/31/20083/31/20096/30/20099/30/2009
12/31/20093/31/20106/30/20109/30/2010
12/31/20103/31/20116/30/2011
Source: CoStar Portfolio Strategy As Of 15Q1
$0
$50
$100
$150
$200
$250
$300
08 09 10 11 12 13 14 15
Primary Markets Secondary Markets Tertiary Markets
Price Per Unit
99%
54%
67%
Price Per Unit Across Market Tiers
page 48
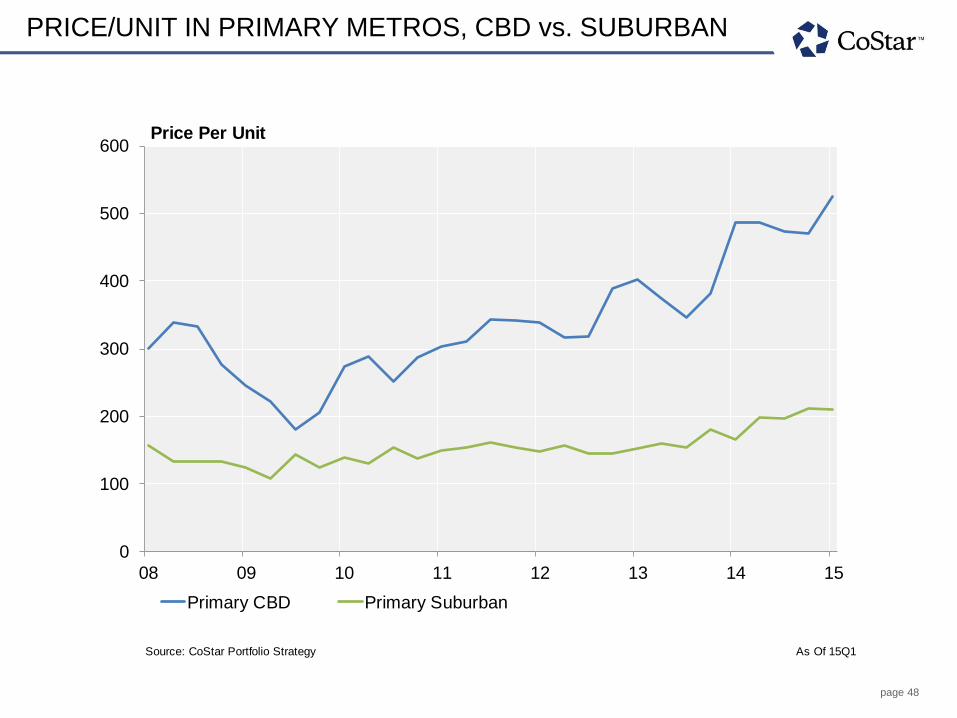
PRICE/UNIT IN PRIMARY METROS, CBD vs. SUBURBAN
As Of 15Q1
12/31/20043/31/20056/30/20059/30/2005
12/31/20053/31/20066/30/20069/30/2006
12/31/20063/31/20076/30/20079/30/2007
12/31/20073/31/20086/30/20089/30/2008
12/31/20083/31/20096/30/20099/30/2009
12/31/20093/31/20106/30/20109/30/2010
12/31/20103/31/20116/30/2011
Source: CoStar Portfolio Strategy As Of 15Q1
0
100
200
300
400
500
600
08 09 10 11 12 13 14 15
Primary CBD Primary Suburban
Price Per Unit
page 49
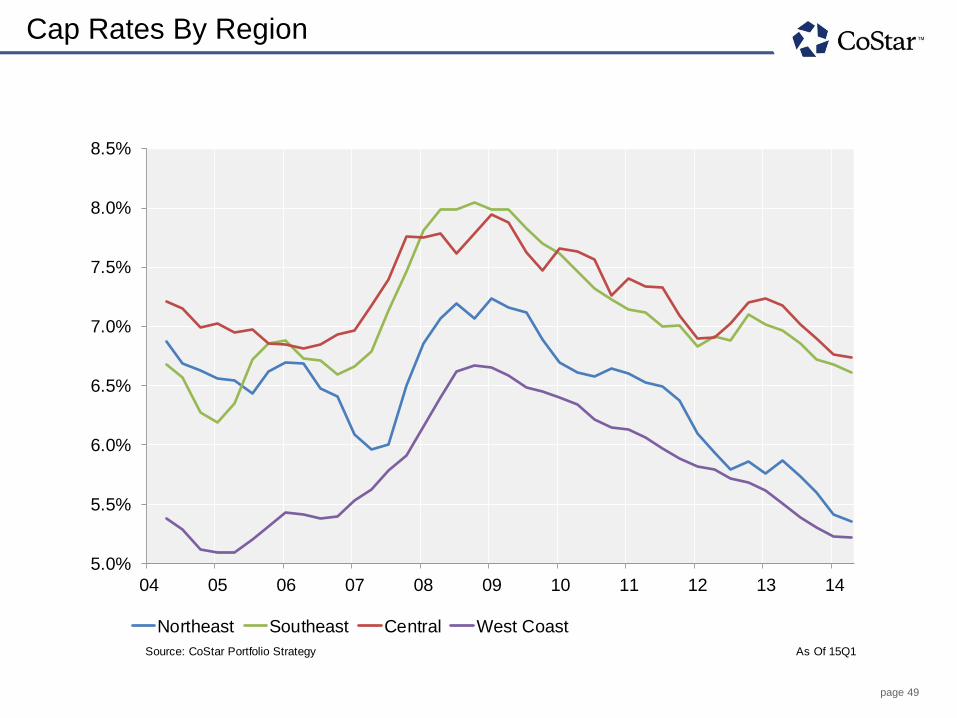
Cap Rates By Region
As Of 15Q1
12/31/20043/31/20056/30/20059/30/2005
12/31/20053/31/20066/30/20069/30/2006
12/31/20063/31/20076/30/20079/30/2007
12/31/20073/31/20086/30/20089/30/2008
12/31/20083/31/20096/30/20099/30/2009
12/31/20093/31/20106/30/20109/30/2010
12/31/20103/31/20116/30/20119/30/2011
Source: CoStar Portfolio Strategy As Of 15Q1
5.0%
5.5%
6.0%
6.5%
7.0%
7.5%
8.0%
8.5%
04 05 06 07 08 09 10 11 12 13 14
Northeast Southeast Central West Coast

page 50
Cap Rates By Market Tier
5.0%
5.5%
6.0%
6.5%
7.0%
7.5%
8.0%
8.5%
04 05 06 07 08 09 10 11 12 13 14
Primary Secondary Tertiary
As Of 15Q1 Source: CoStar Portfolio Strategy
page 51
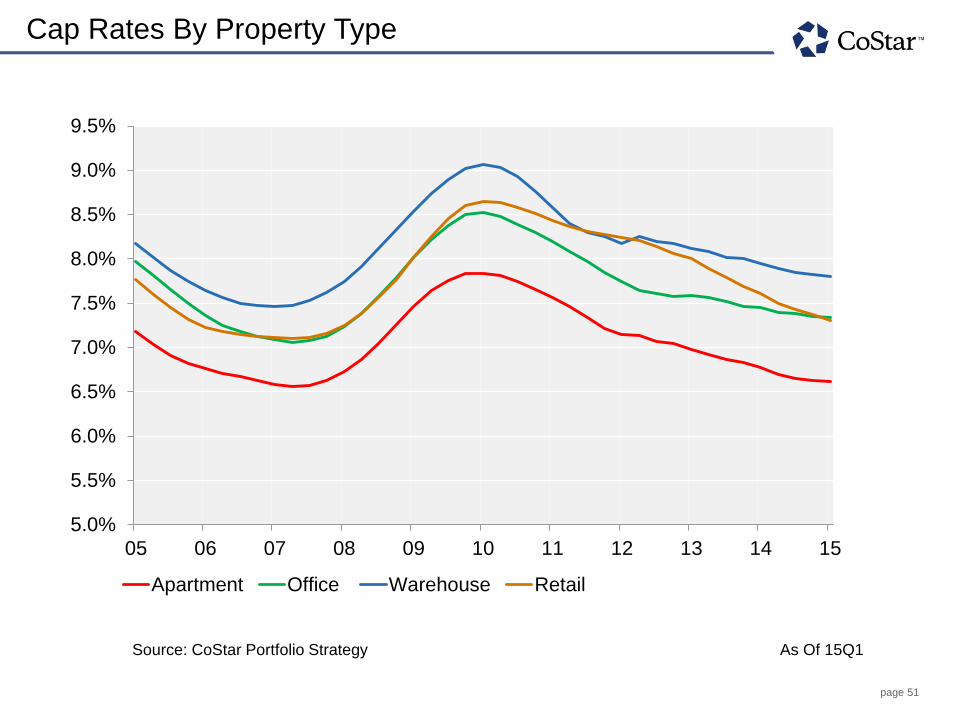
Cap Rates By Property Type
5.0%
5.5%
6.0%
6.5%
7.0%
7.5%
8.0%
8.5%
9.0%
9.5%
05 06 07 08 09 10 11 12 13 14 15
Apartment Office Warehouse Retail
Source: CoStar Portfolio Strategy As Of 15Q1
page 52
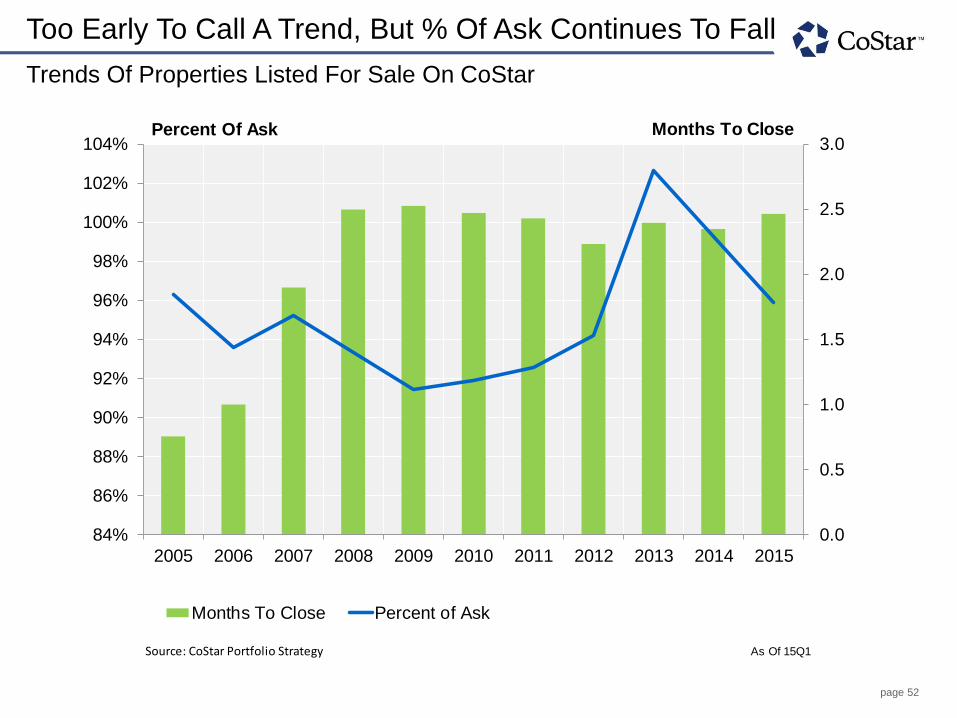
Too Early To Call A Trend, But % Of Ask Continues To Fall
Trends Of Properties Listed For Sale On CoStar
As Of 15Q1
12/31/200412/31/200512/31/200612/31/200712/31/200812/31/200912/31/201012/31/201112/31/201212/31/201312/31/201412/31/2015
Note: If there is a spike in 13Q4 it's due to deal ID 2925503 which was entered as 104 or 1,000 times the asking price. Need to delete it.
Source: CoStar Portfolio Strategy As Of 15Q1
0.0
0.5
1.0
1.5
2.0
2.5
3.0
84%
86%
88%
90%
92%
94%
96%
98%
100%
102%
104%
2005 2006 2007 2008 2009 2010 2011 2012 2013 2014 2015
Months To Close Percent of Ask
Months To ClosePercent Of Ask
page 53
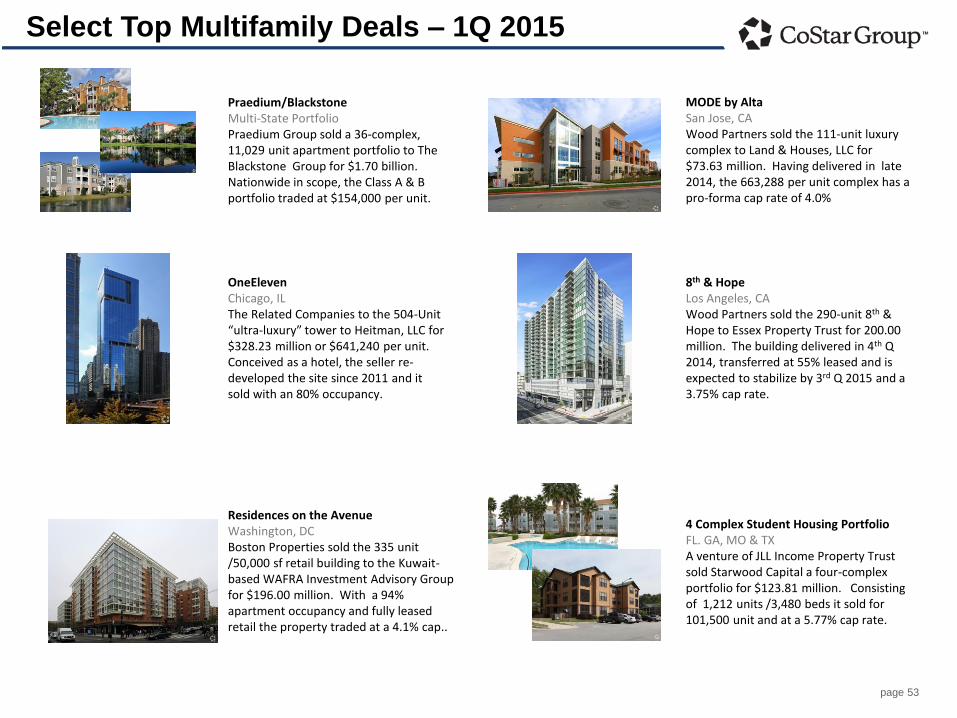
Select Top Multifamily Deals – 1Q 2015
Praedium/Blackstone Multi-State Portfolio Praedium Group sold a 36-complex, 11,029 unit apartment portfolio to The Blackstone Group for $1.70 billion. Nationwide in scope, the Class A & B portfolio traded at $154,000 per unit.
MODE by Alta San Jose, CA Wood Partners sold the 111-unit luxury complex to Land & Houses, LLC for $73.63 million. Having delivered in late 2014, the 663,288 per unit complex has a pro-forma cap rate of 4.0%
OneEleven Chicago, IL The Related Companies to the 504-Unit “ultra-luxury” tower to Heitman, LLC for $328.23 million or $641,240 per unit. Conceived as a hotel, the seller re-developed the site since 2011 and it sold with an 80% occupancy.
8th & Hope Los Angeles, CA Wood Partners sold the 290-unit 8th & Hope to Essex Property Trust for 200.00 million. The building delivered in 4th Q 2014, transferred at 55% leased and is expected to stabilize by 3rd Q 2015 and a 3.75% cap rate.
Residences on the Avenue Washington, DC Boston Properties sold the 335 unit /50,000 sf retail building to the Kuwait-based WAFRA Investment Advisory Group for $196.00 million. With a 94% apartment occupancy and fully leased retail the property traded at a 4.1% cap..
4 Complex Student Housing Portfolio FL. GA, MO & TX A venture of JLL Income Property Trust sold Starwood Capital a four-complex portfolio for $123.81 million. Consisting of 1,212 units /3,480 beds it sold for 101,500 unit and at a 5.77% cap rate.

page 54
© Copyright 2015 CoStar Realty Information, Inc. No reproduction or distribution without permission. The following information includes projections and analyses that are based on various assumptions by CoStar
concerning future events and circumstances, as well as historical and current data maintained in CoStar’s database, obtained from public sources or provided by proprietary sources. Actual results may vary
materially from the projections presented. The information in this presentation speaks only as of the date(s) referenced and is provided ‘as is’. CoStar expressly disclaims any guarantees, representations or
warranties of any kind, including those of merchantability and fitness for a particular purpose. You should not construe any of the information herein as investment, tax, accounting or legal advice.