Embed Size (px)
Citation preview
State of the Power System
Presentation to American Chamber of Commerce
11 November 2014
Overview of Majuba Incident
Managing the Power Grid
Summer Outlook
Progress on New Build Programme
2
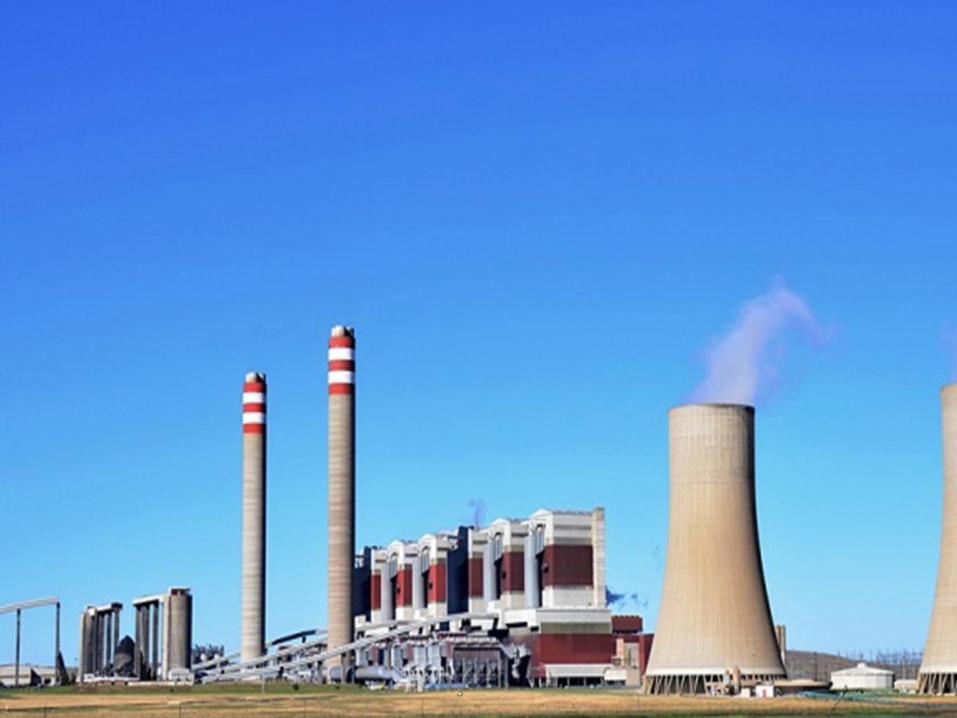
3
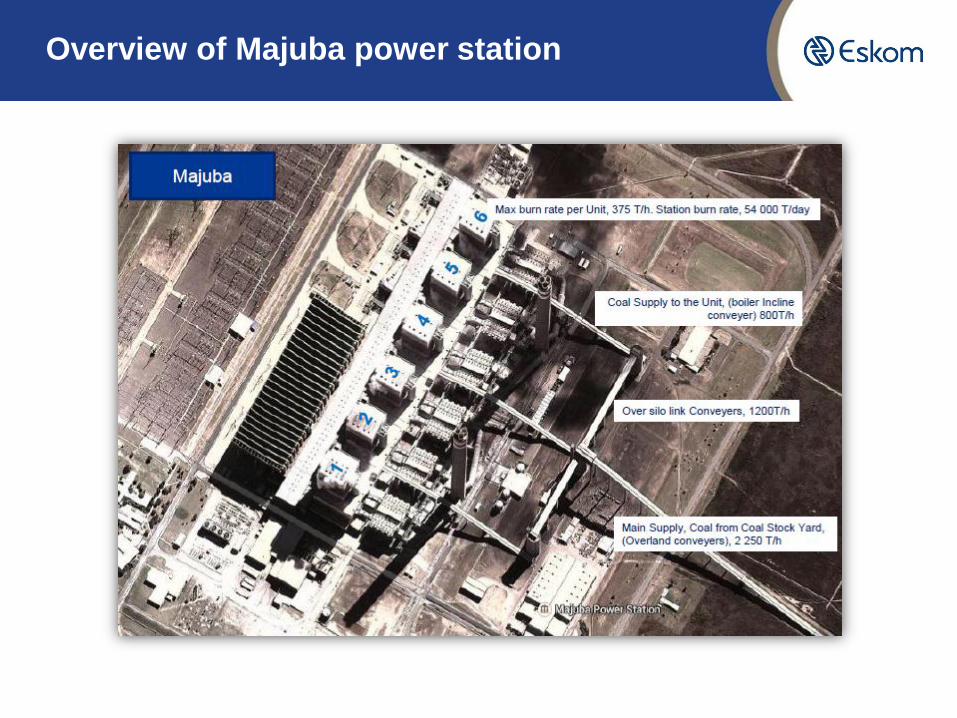
Overview of Majuba power station
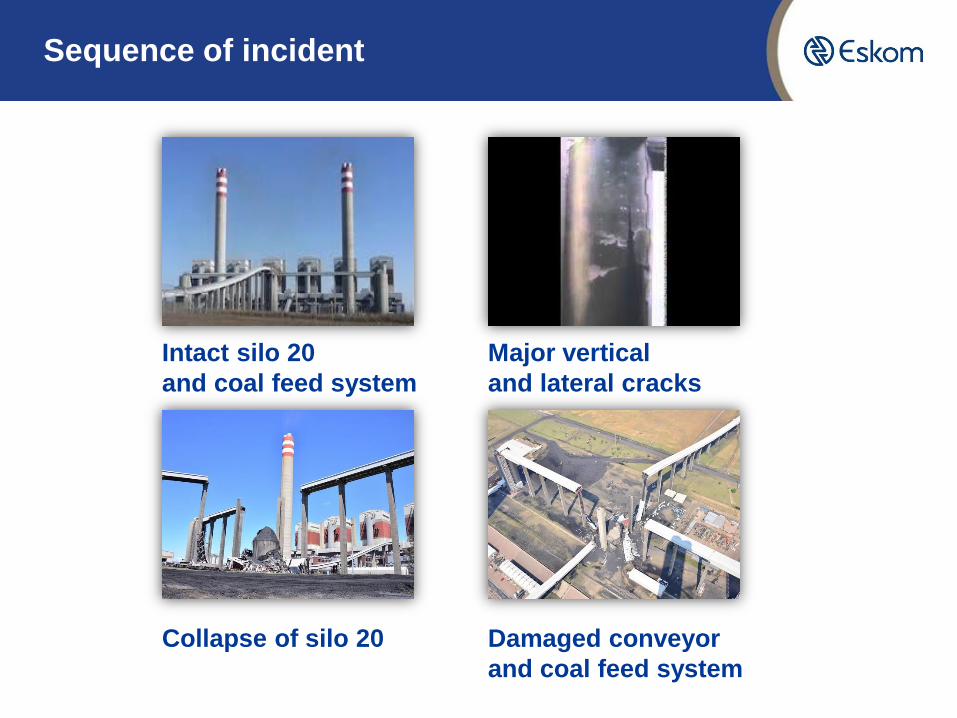
Sequence of incident
Intact silo 20
and coal feed system
Major vertical
and lateral cracks
Collapse of silo 20 Damaged conveyor
and coal feed system
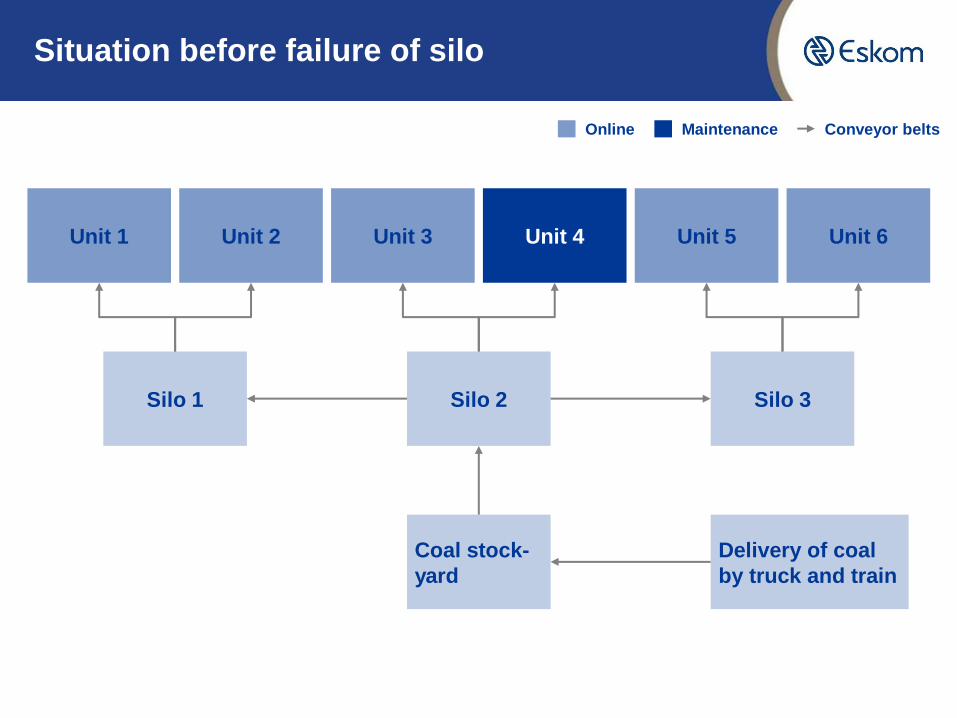
Situation before failure of silo
Unit 1 Unit 2 Unit 3 Unit 4 Unit 5 Unit 6
Silo 1 Silo 2 Silo 3
Coal stock-
yard
Delivery of coal
by truck and train
Online Maintenance Conveyor belts

7

Current operations – replenishment of coal stocks
Standard procedure -
deliveries to stock yards
Coal transshipped from
yards to outside plant areas
Coal delivered to silos
10 and 30
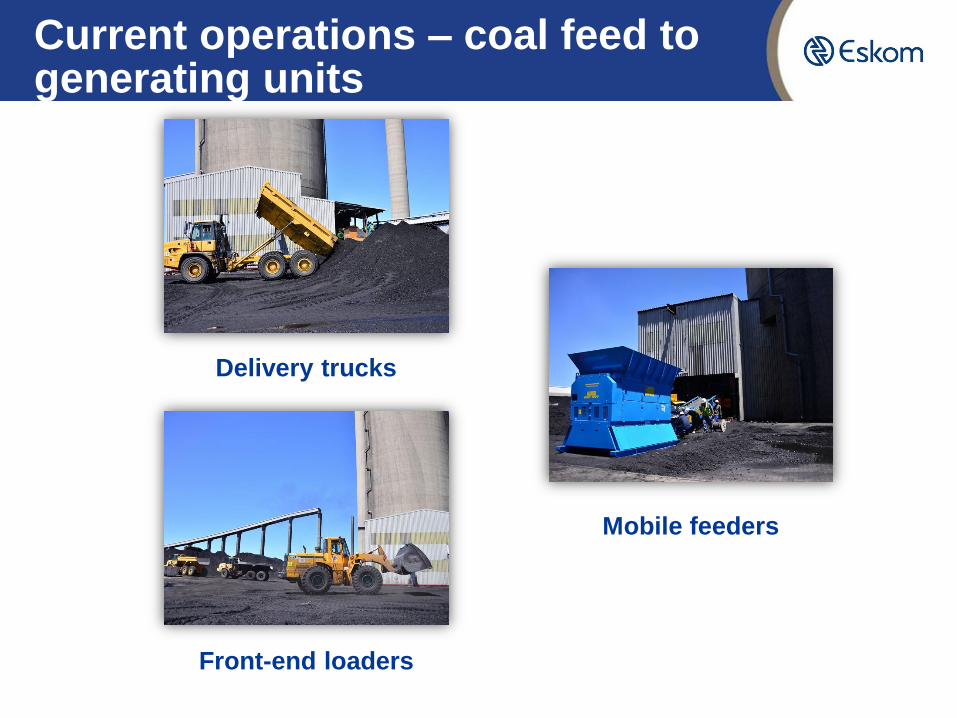
Current operations – coal feed to generating units
Mobile feeders
Front-end loaders
Delivery trucks
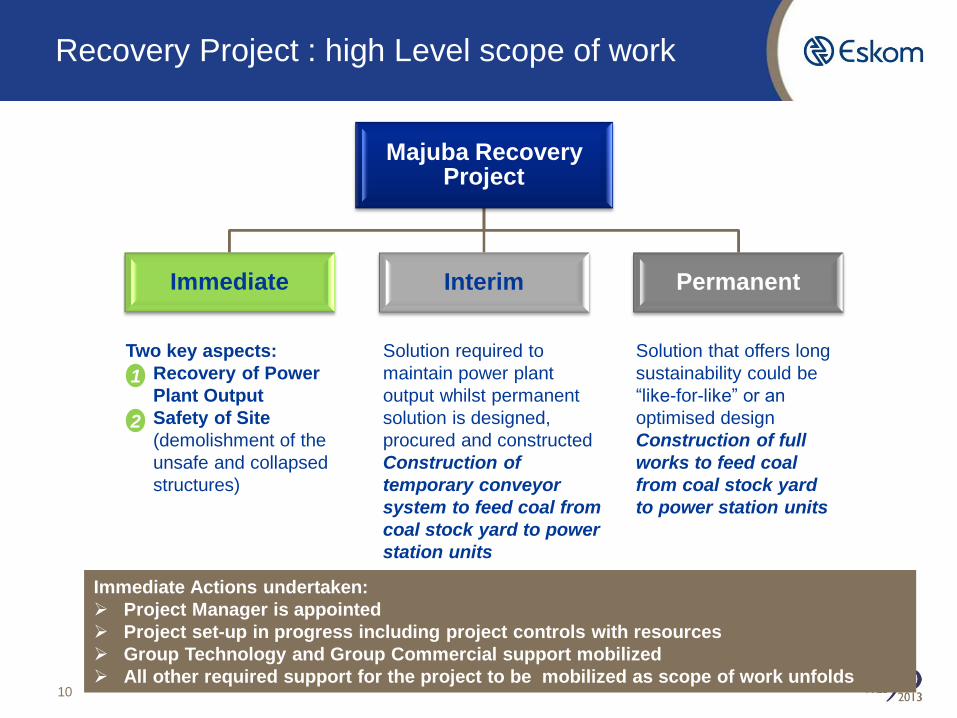
Recovery Project : high Level scope of work
10
Majuba Recovery Project
Immediate Interim Permanent
Two key aspects:
1. Recovery of Power
Plant Output
2. Safety of Site
(demolishment of the
unsafe and collapsed
structures)
Solution required to
maintain power plant
output whilst permanent
solution is designed,
procured and constructed
Construction of
temporary conveyor
system to feed coal from
coal stock yard to power
station units
Solution that offers long
sustainability could be
“like-for-like” or an
optimised design
Construction of full
works to feed coal
from coal stock yard
to power station units
Immediate Actions undertaken:
Project Manager is appointed
Project set-up in progress including project controls with resources
Group Technology and Group Commercial support mobilized
All other required support for the project to be mobilized as scope of work unfolds
1
2

Overview of Majuba Incident
Managing the Power Grid
Summer Outlook
Progress on New Build Programme
11
In support of 12
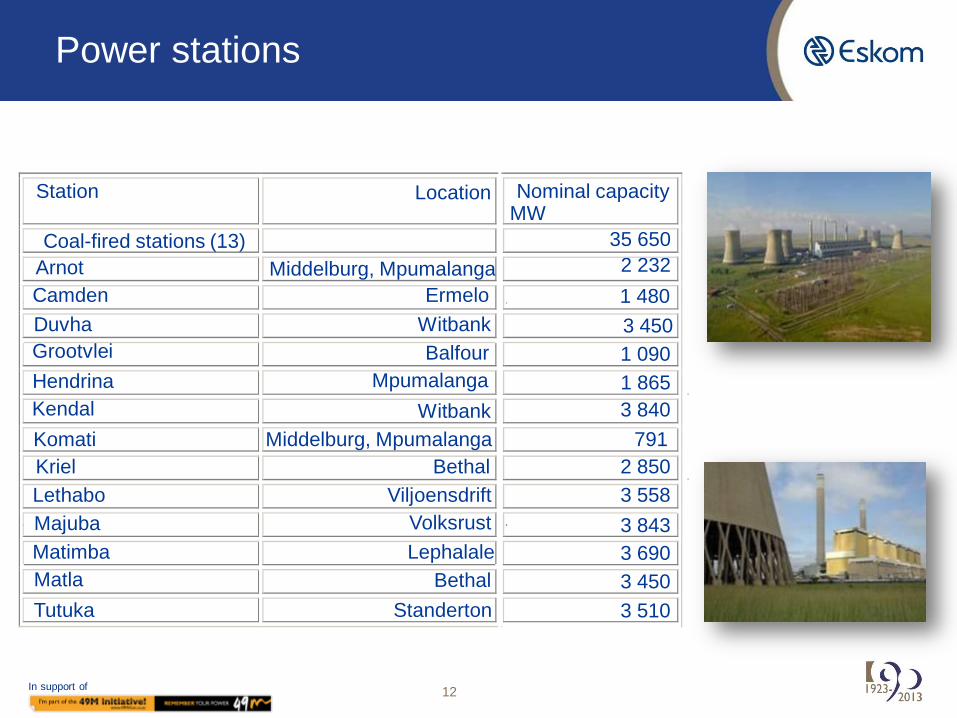
Power stations
Station Location Nominal capacity MW
Coal-fired stations (13) 35 650
Arnot Middelburg, Mpumalanga 2 232
Camden Ermelo 1 480
Duvha Witbank 3 450 Grootvlei Balfour 1 090
Hendrina Mpumalanga 1 865
Kendal Witbank 3 840
Komati Middelburg, Mpumalanga 791
Kriel Bethal 2 850
Lethabo Viljoensdrift 3 558
Majuba Volksrust 3 843
Matimba Lephalale 3 690
Matla Bethal 3 450
Tutuka Standerton 3 510
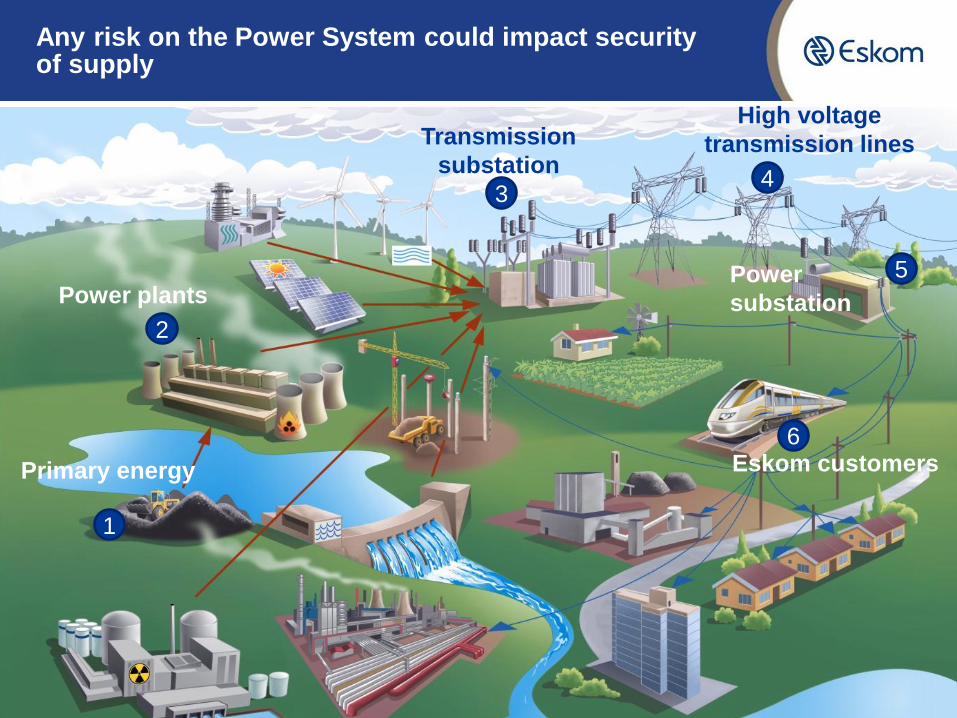
Any risk on the Power System could impact security of supply
1
2
3 4
5
6
Power plants
Primary energy
Transmission
substation
High voltage
transmission lines
Power
substation
Eskom customers

Usage of Emergency reserves – OCGT + Gas Usage
14
A similar level of emergency reserve usage has been required in 2014 when compared
to 2013. Slightly lower OCGT usage was required in September and October in 2014.
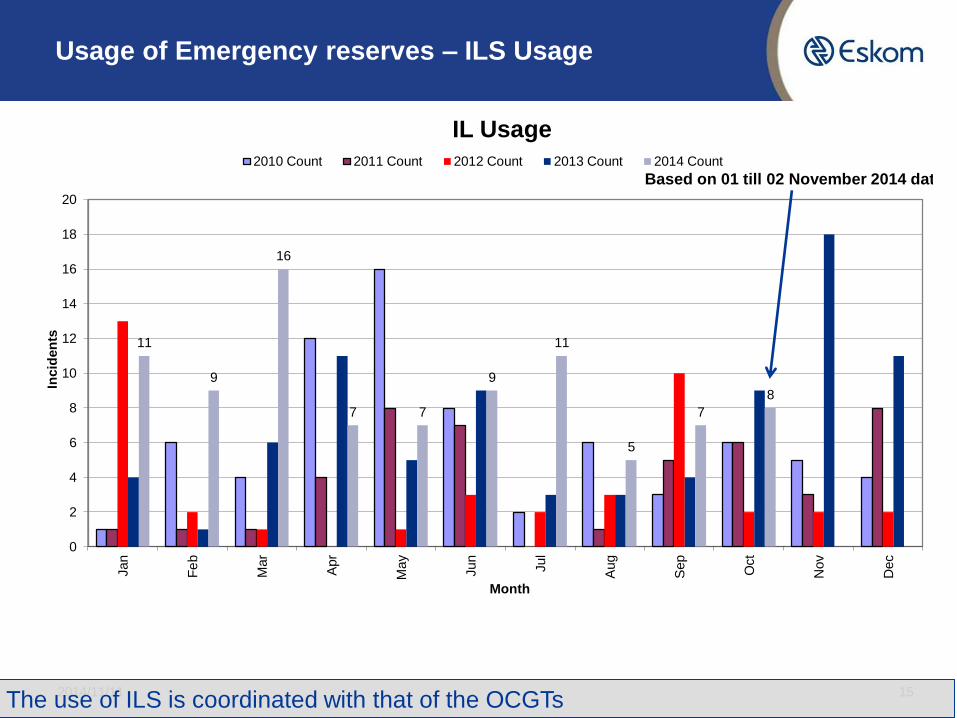
Usage of Emergency reserves – ILS Usage
2014/11/11 15
11
9
16
7 7
9
11
5
7
8
0
2
4
6
8
10
12
14
16
18
20
Jan
Fe
b
Mar
Apr
May
Jun
Jul
Aug
Sep
Oct
Nov
Dec
Incid
en
ts
Month
IL Usage
2010 Count 2011 Count 2012 Count 2013 Count 2014 Count
Based on 01 till 02 November 2014 data
The use of ILS is coordinated with that of the OCGTs

16
Low Frequency Incidents
The number of low frequency incidents indicates the relative tightness of the system.
Operating the system at lower frequencies increases the risk of an even lower frequency
event following the loss of generation

The power system remains under pressure, requiring a range of activities to keep the lights on
A M M J J A S O N D J F
Expectations are that 3 to 4 days in every week will experience severe supply
shortages, requiring electricity to be used wisely to keep the lights on.
0
1000
2000
3000
4000
5000
6000
MW
2014 2015
Projected MW shortfalls against forecasted demand as at April 20141
1. Note that the projections are indicative only as at April 2014, and changes continually to accommodate system changes and requirements
October 2014 17 | Source: Eskom System Operator, April 2014
To enable critical maintenance to the power generation fleet during the summer,
current planning is preparing for a shortfall of 2,500 MWs over the summer period.
Currently, and into the foreseeable future, a significant contribution is required from
mitigating / alternate measures to maintain power supply
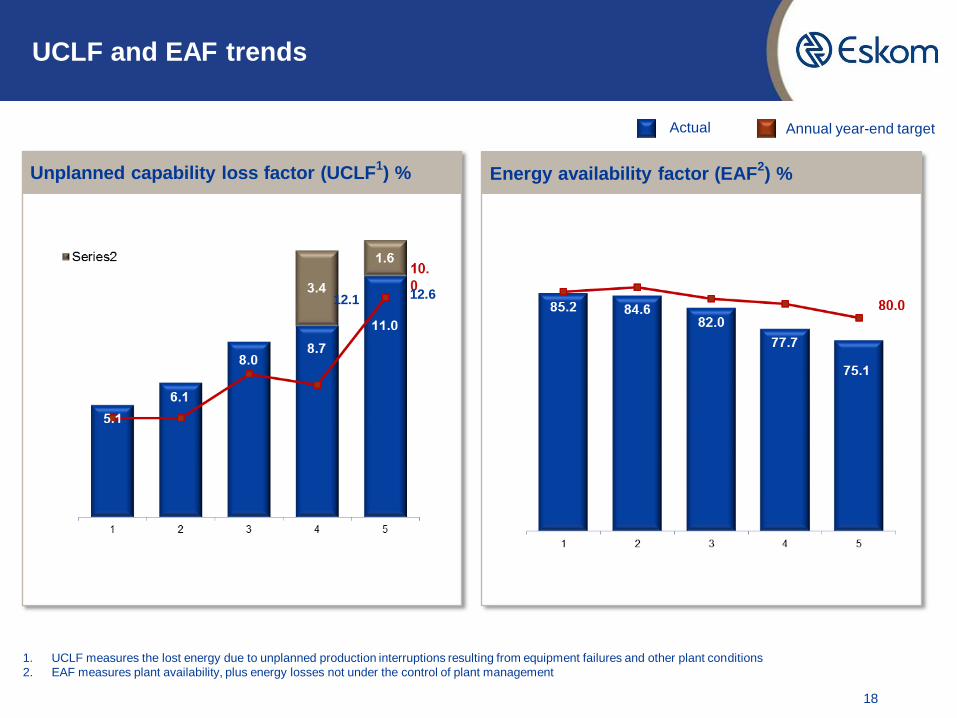
UCLF and EAF trends
1. UCLF measures the lost energy due to unplanned production interruptions resulting from equipment failures and other plant conditions
2. EAF measures plant availability, plus energy losses not under the control of plant management
18
Actual Annual year-end target
Unplanned capability loss factor (UCLF1) %
12.6 12.1
Energy availability factor (EAF2) %
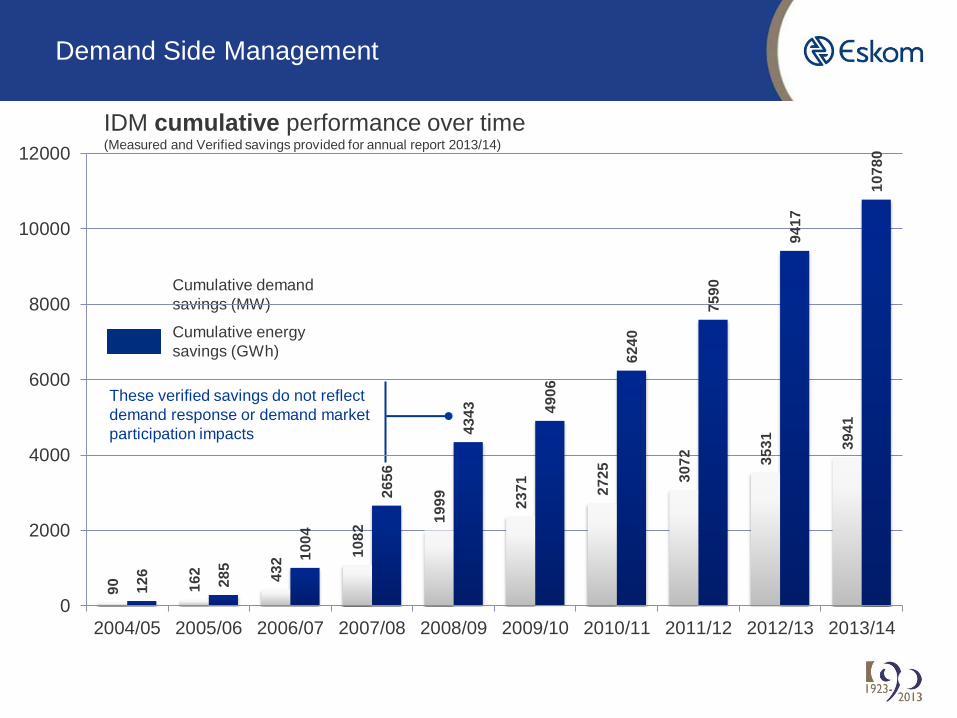
Demand Side Management
IDM cumulative performance over time (Measured and Verified savings provided for annual report 2013/14)
These verified savings do not reflect
demand response or demand market
participation impacts
Cumulative demand
savings (MW)
Cumulative energy
savings (GWh)
90
16
2
43
2 10
82
19
99
23
71
27
25
30
72
35
31
39
41
12
6
28
5 1
00
4
26
56
43
43
49
06
62
40
75
90
94
17
10
78
0
0
2000
4000
6000
8000
10000
12000
2004/05 2005/06 2006/07 2007/08 2008/09 2009/10 2010/11 2011/12 2012/13 2013/14

We are making a difference
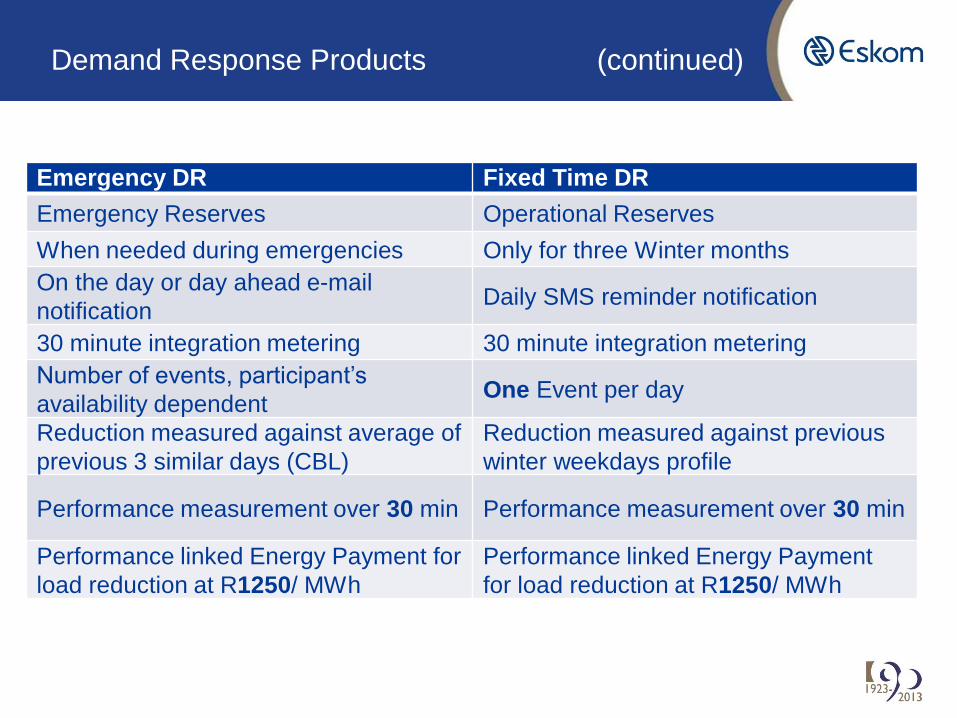
Demand Response Products (continued)
Emergency DR Fixed Time DR
Emergency Reserves Operational Reserves
When needed during emergencies Only for three Winter months
On the day or day ahead e-mail
notification Daily SMS reminder notification
30 minute integration metering 30 minute integration metering
Number of events, participant’s
availability dependent One Event per day
Reduction measured against average of
previous 3 similar days (CBL)
Reduction measured against previous
winter weekdays profile
Performance measurement over 30 min Performance measurement over 30 min
Performance linked Energy Payment for
load reduction at R1250/ MWh
Performance linked Energy Payment
for load reduction at R1250/ MWh

22
Illustration of typical RESERVE deployment order
Em
erg
en
cy
RE
SE
RV
E M
AR
KE
T
Em
erg
en
cy
red
ucti
on
NR
S 0
48-9
Incr
eas
ing
“Tig
htn
ess
” o
f Su
pp
ly
Stage 4
Load shedding and curtailment ( Stages 1& 2 )
Curtailment ( Stage 0 )
Load shedding and curtailment ( Stage 3 )
Supplemental DR
Op
era
tin
g
Automatic Gen Control (AGC)
Instantaneous DR Instantaneous
ENERGY MARKET
Interruptible Load
Agreements
Max cont. rating/Emergency Level 1
Self Generation DR (Hi Rate)
Self Generation DR (Low to Medium Rate)
Open Cycle Gas
Turbines
2014/11/11 23
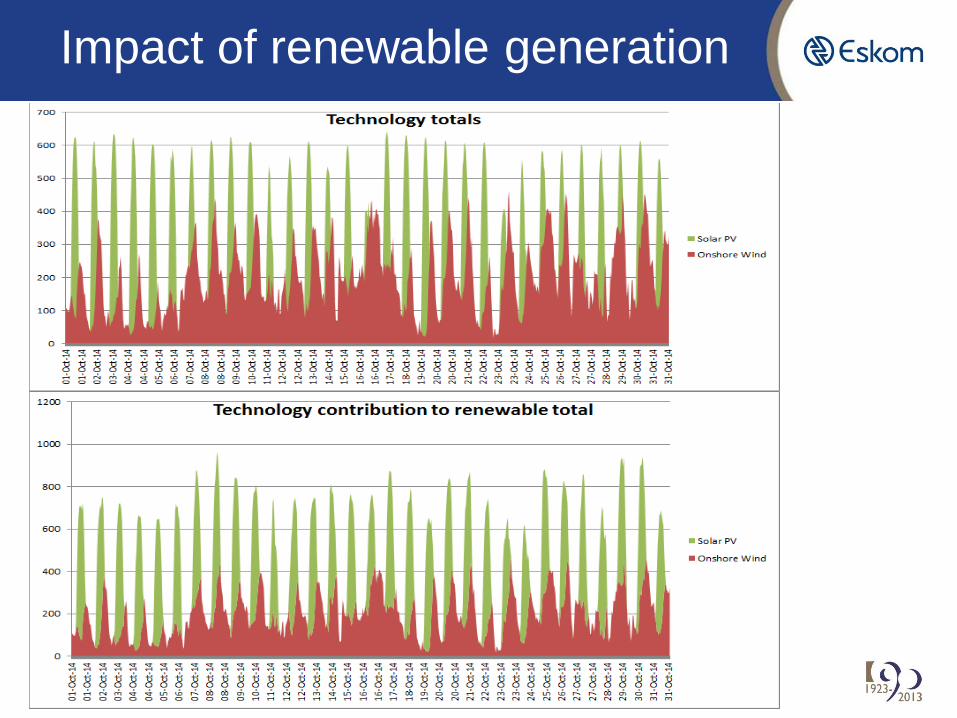
Impact of renewable generation
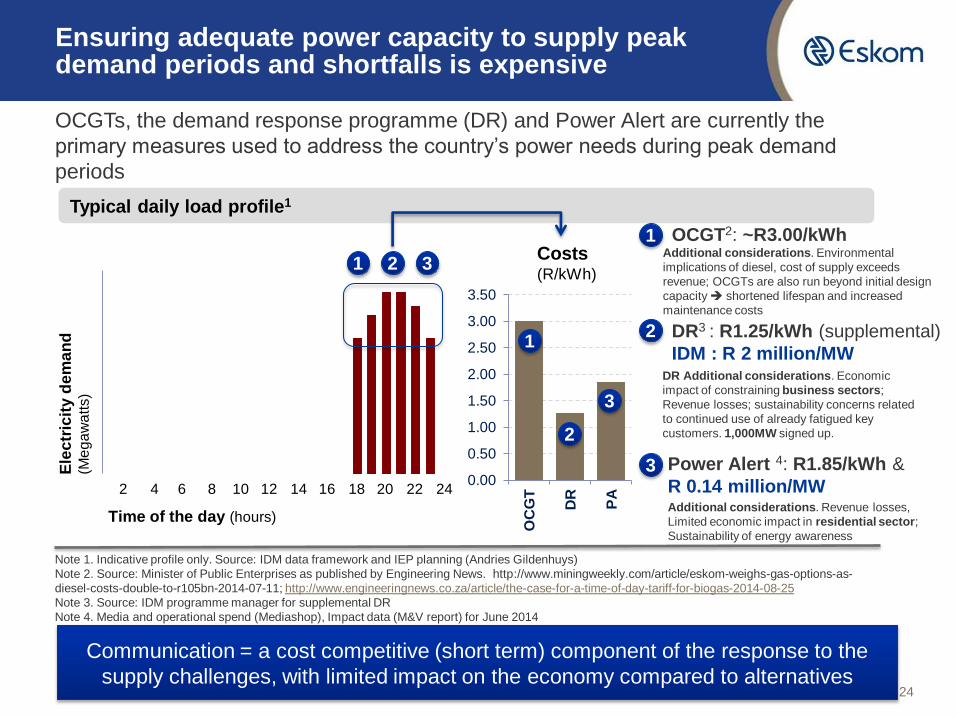
Ensuring adequate power capacity to supply peak demand periods and shortfalls is expensive
OCGTs, the demand response programme (DR) and Power Alert are currently the
primary measures used to address the country’s power needs during peak demand
periods
Typical daily load profile1
October 2014 24
Note 1. Indicative profile only. Source: IDM data framework and IEP planning (Andries Gildenhuys)
Note 2. Source: Minister of Public Enterprises as published by Engineering News. http://www.miningweekly.com/article/eskom-weighs-gas-options-as-
diesel-costs-double-to-r105bn-2014-07-11; http://www.engineeringnews.co.za/article/the-case-for-a-time-of-day-tariff-for-biogas-2014-08-25
Note 3. Source: IDM programme manager for supplemental DR
Note 4. Media and operational spend (Mediashop), Impact data (M&V report) for June 2014
OCGT2: ~R3.00/kWh
Communication = a cost competitive (short term) component of the response to the
supply challenges, with limited impact on the economy compared to alternatives
Power Alert 4: R1.85/kWh &
R 0.14 million/MW
DR3 : R1.25/kWh (supplemental)
IDM : R 2 million/MW DR Additional considerations. Economic
impact of constraining business sectors;
Revenue losses; sustainability concerns related
to continued use of already fatigued key
customers. 1,000MW signed up.
Additional considerations. Environmental
implications of diesel, cost of supply exceeds
revenue; OCGTs are also run beyond initial design
capacity shortened lifespan and increased
maintenance costs
Additional considerations. Revenue losses,
Limited economic impact in residential sector;
Sustainability of energy awareness
Time of the day (hours)
2 24 4 6 8 10 12 14 16 18 20 22
Ele
ctr
icit
y d
em
an
d
(Me
ga
wa
tts)
0.00
0.50
1.00
1.50
2.00
2.50
3.00
3.50
OC
GT
DR
PA
Costs (R/kWh)
1
2
3
1 2 3
1
2
3

Overview of Majuba Incident
Managing the Power Grid
Summer Outlook
Progress on New Build Programme
25
Summer profile
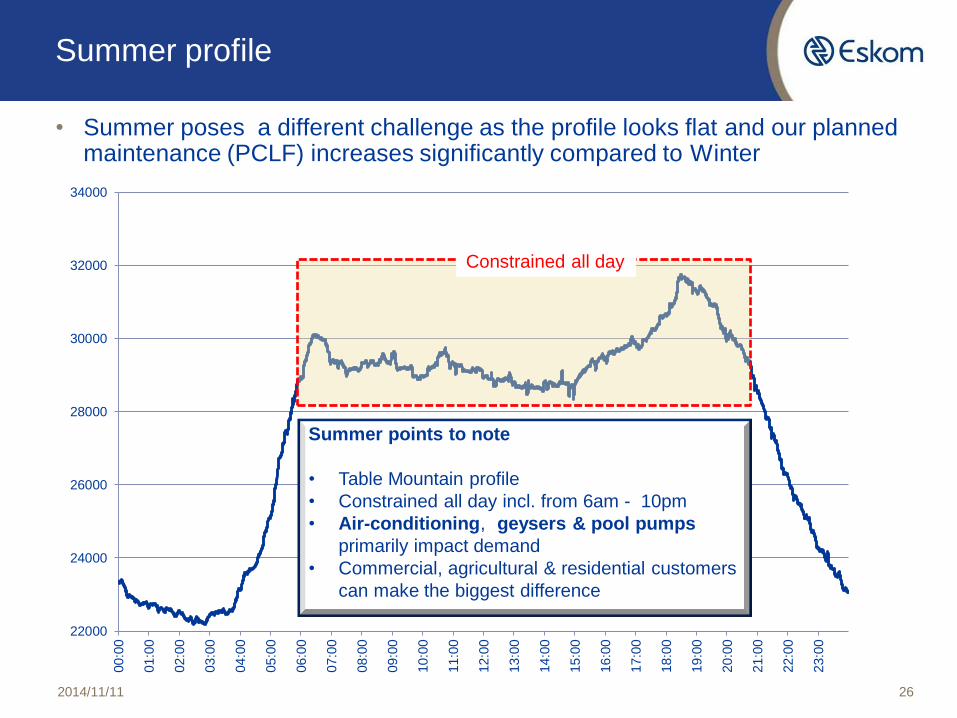
• Summer poses a different challenge as the profile looks flat and our planned maintenance (PCLF) increases significantly compared to Winter
2014/11/11 26
22000
24000
26000
28000
30000
32000
34000
00:0
0
01:0
0
02:0
0
03:0
0
04:0
0
05:0
0
06:0
0
07:0
0
08:0
0
09:0
0
10:0
0
11:0
0
12:0
0
13:0
0
14:0
0
15:0
0
16:0
0
17:0
0
18:0
0
19:0
0
20:0
0
21:0
0
22:0
0
23:0
0
Summer points to note
• Table Mountain profile
• Constrained all day incl. from 6am - 10pm
• Air-conditioning, geysers & pool pumps
primarily impact demand
• Commercial, agricultural & residential customers
can make the biggest difference
Constrained all day

27
Outlook for summer
• The system remains tight in summer, with different challenges due to the summer load
profile
• Unlike winter, where the demand increases significantly during the evening peak (5pm -
9pm), the demand profile during summer is much flatter with an increased demand
profile throughout the day.
• This is because of a relatively high percentage of almost constant industrial load and the
impact of air conditioning in the commercial and marginally in the residential sector
during the day. The significant residential component over evening peak is not as
evident in summer. If there is a constraint, the system is constrained all day
• Summer is typically maintenance season, but this summer maintenance will increase
based on the generation strategy as most of the maintenance is fixed and cant be
deferred.
• The challenge is to ensure that there is sufficient generation capacity throughout the
day, as we continue with our maintenance plan and focus on reducing unplanned
outages
• The degree of tightness will depend on the performance of the plant and the level of
unplanned maintenance (UCLF) as well as the available capacity
• Eskom will not compromise its generation plant and will load shed if necessary to
protect the power system from total collapse.
Priority Summer Risks
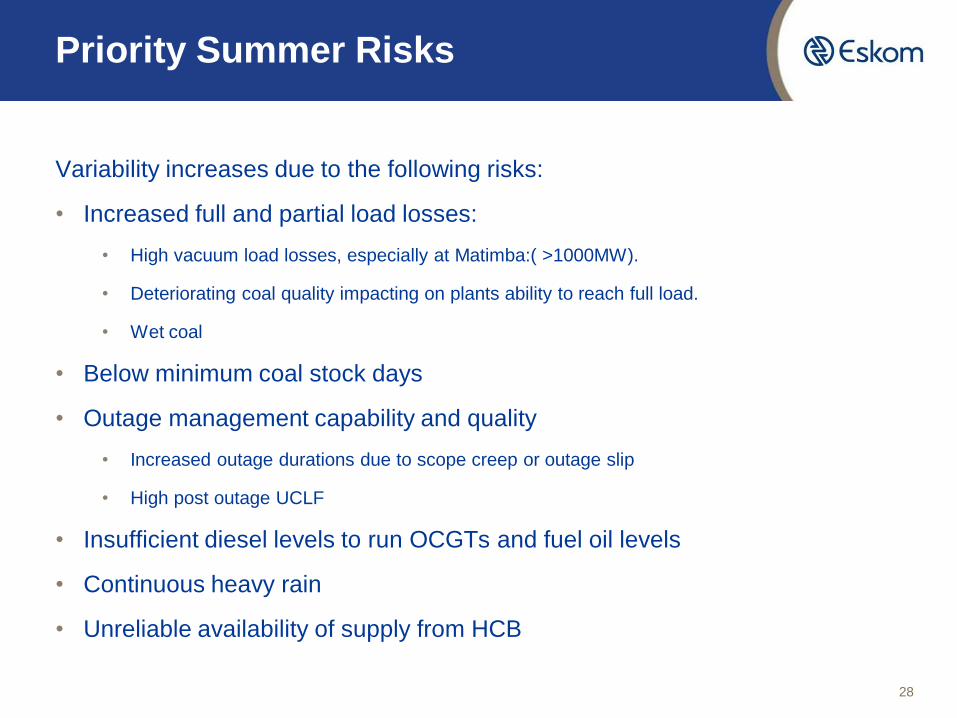
Variability increases due to the following risks:
• Increased full and partial load losses:
• High vacuum load losses, especially at Matimba:( >1000MW).
• Deteriorating coal quality impacting on plants ability to reach full load.
• Wet coal
• Below minimum coal stock days
• Outage management capability and quality
• Increased outage durations due to scope creep or outage slip
• High post outage UCLF
• Insufficient diesel levels to run OCGTs and fuel oil levels
• Continuous heavy rain
• Unreliable availability of supply from HCB
28
29
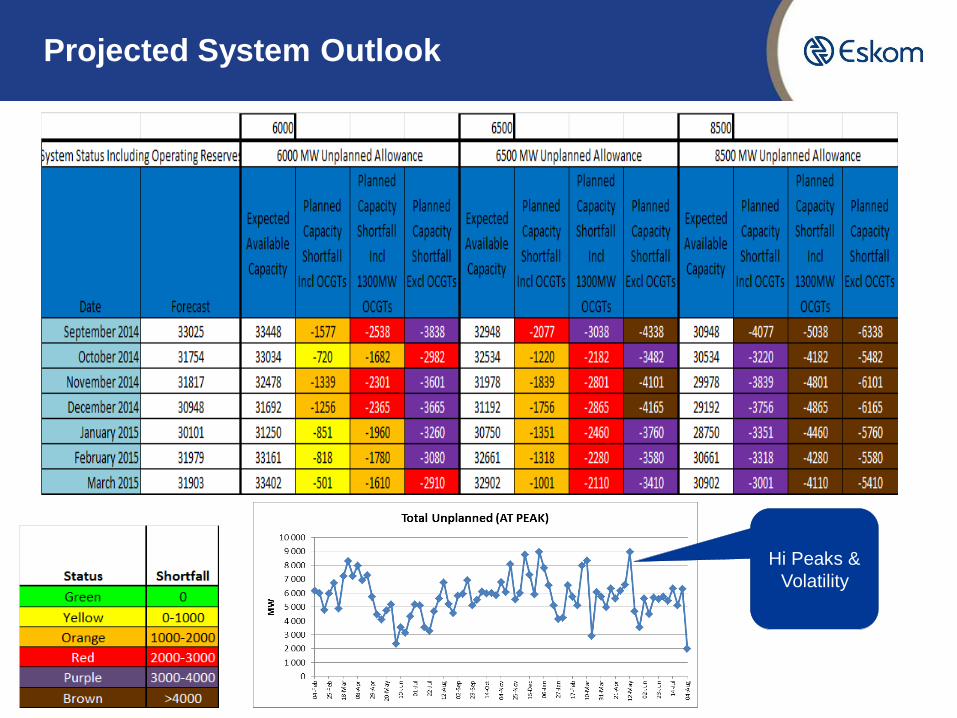
Projected System Outlook
Hi Peaks &
Volatility

Overview of Majuba Incident
Managing the Power Grid
Summer Outlook
Progress on New Build Programme
30
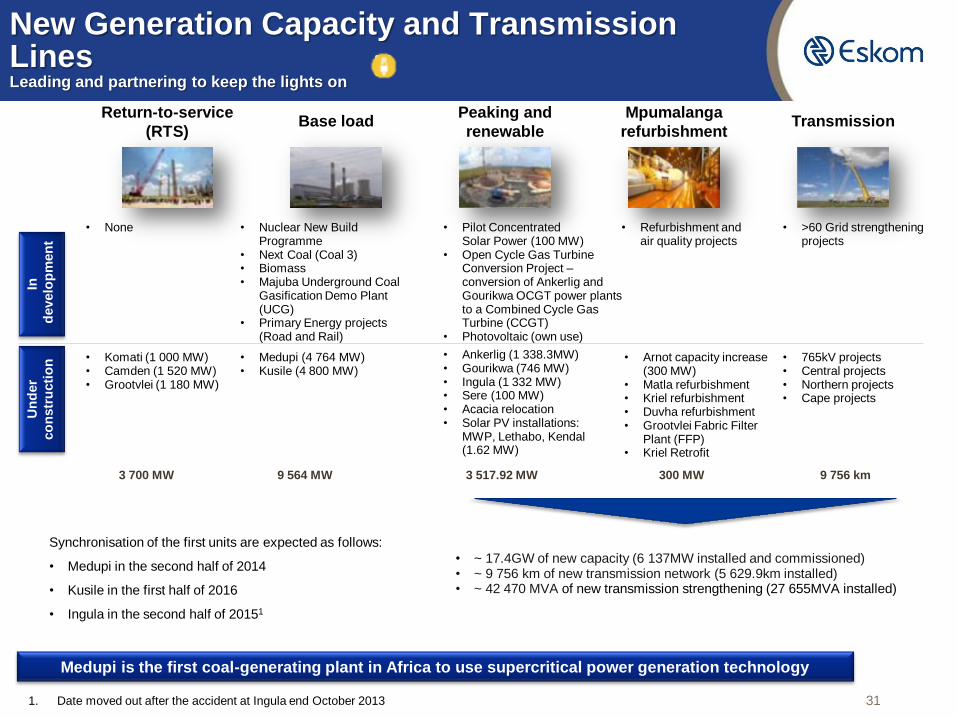
• ~ 17.4GW of new capacity (6 137MW installed and commissioned) • ~ 9 756 km of new transmission network (5 629.9km installed) • ~ 42 470 MVA of new transmission strengthening (27 655MVA installed)
31
New Generation Capacity and Transmission Lines Leading and partnering to keep the lights on
Un
der
co
nstr
ucti
on
In
develo
pm
en
t
Return-to-service
(RTS) Base load
Peaking and
renewable
Mpumalanga
refurbishment Transmission
• None • Nuclear New Build Programme
• Next Coal (Coal 3) • Biomass • Majuba Underground Coal
Gasification Demo Plant (UCG)
• Primary Energy projects (Road and Rail)
• Pilot Concentrated Solar Power (100 MW)
• Open Cycle Gas Turbine Conversion Project – conversion of Ankerlig and Gourikwa OCGT power plants to a Combined Cycle Gas Turbine (CCGT)
• Photovoltaic (own use)
• Refurbishment and air quality projects
• >60 Grid strengthening projects
• Komati (1 000 MW) • Camden (1 520 MW) • Grootvlei (1 180 MW)
• Medupi (4 764 MW) • Kusile (4 800 MW)
• Ankerlig (1 338.3MW) • Gourikwa (746 MW) • Ingula (1 332 MW) • Sere (100 MW) • Acacia relocation • Solar PV installations:
MWP, Lethabo, Kendal (1.62 MW)
• Arnot capacity increase (300 MW)
• Matla refurbishment • Kriel refurbishment • Duvha refurbishment • Grootvlei Fabric Filter
Plant (FFP) • Kriel Retrofit
• 765kV projects • Central projects • Northern projects • Cape projects
Medupi is the first coal-generating plant in Africa to use supercritical power generation technology
3 700 MW 9 564 MW 3 517.92 MW 300 MW 9 756 km
1. Date moved out after the accident at Ingula end October 2013
Synchronisation of the first units are expected as follows:
• Medupi in the second half of 2014
• Kusile in the first half of 2016
• Ingula in the second half of 20151
32
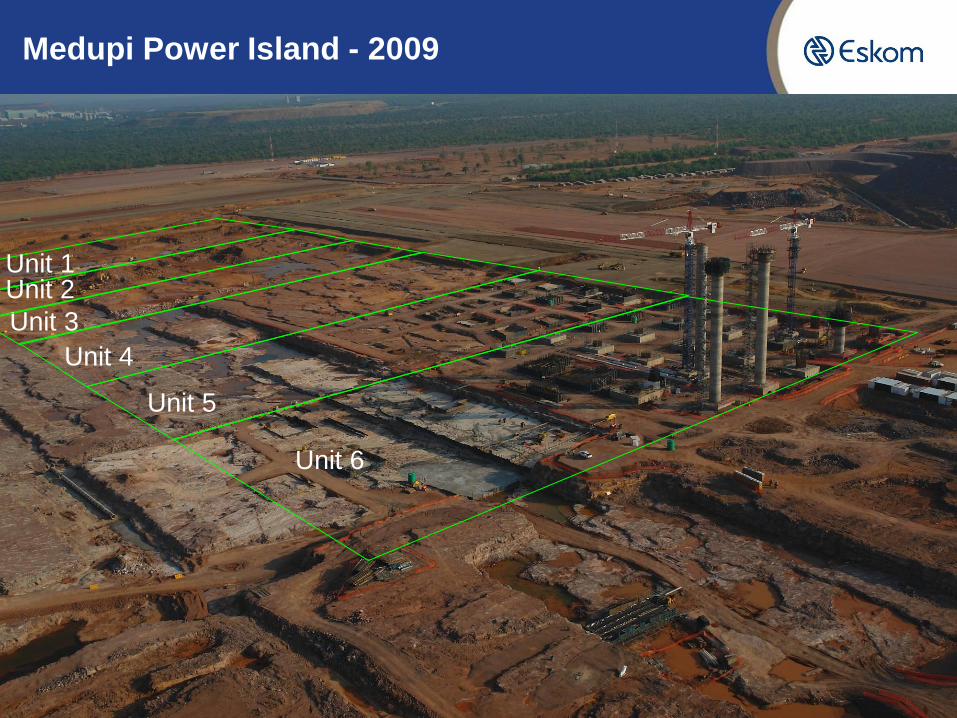
Unit 6
Unit 4
Unit 5
Unit 3
Unit 2 Unit 1
Medupi Power Island - 2009
33
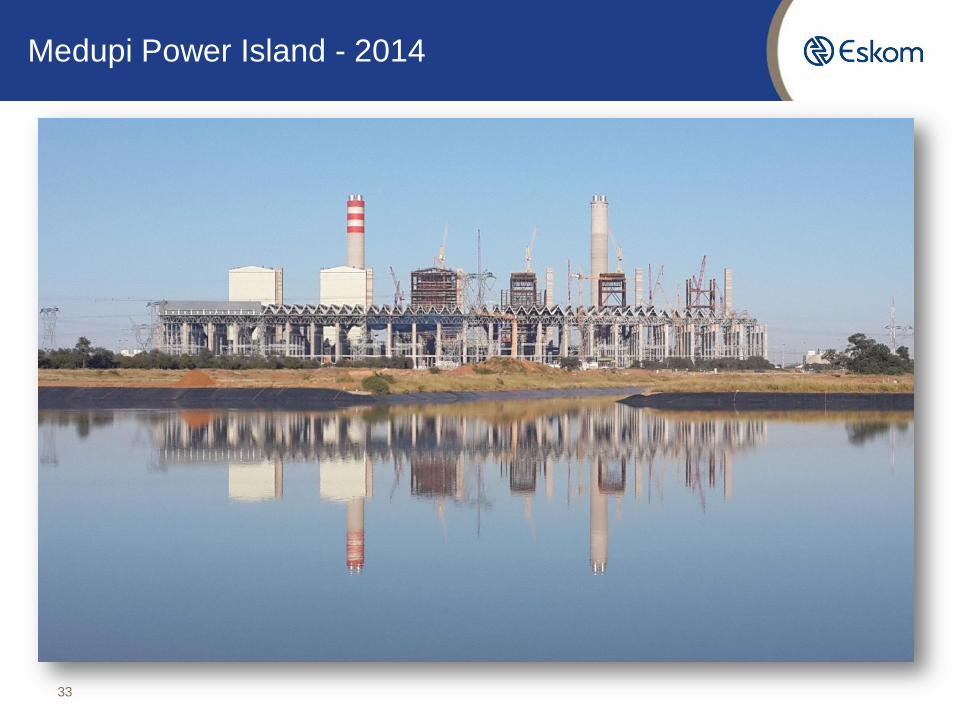
Medupi Power Island - 2014
▪ Boiler Chemical Clean on Unit 6 was completed ahead of schedule on 21 August
2014.
▪ Unit 6 Turbine on Barring achieved on 30 August 2014;
▪ C&I Site Integration Test (SIT)/Site Acceptance Test (SAT) completed ahead of
schedule on 04 September 2014 ; and
▪ Draught Group Test Run commenced on 07 September and will run for 12 days.
▪ Other activities continue to support the December 2014 synchronization date.
▪ Construction progress in critical areas was hindered due to the industrial action of July
2014, with labour attendance of 40% - 70% during the period
▪ The workforce is back on site
▪ Through risk mitigation plans and re-assignment of available resources, the target for
First Unit (Unit 6) synchronization remains December 2014
▪ Additional resources have been mobilised to Unit 6 by both the boiler contractor and
control and instrumentation (C&I) contractor to mitigate any resource-driven delays
▪ Similarly, additional shifts have been introduced 24 hours a day, 7 days a week to
accelerate progress on site
▪ Eskom is working with contractors to resolve any issues which could affect the
schedule.
Industrial
Action Impact
First Unit
Synch
Mitigation to
achieve First
Synch in Dec
2014
34
Medupi Power Station
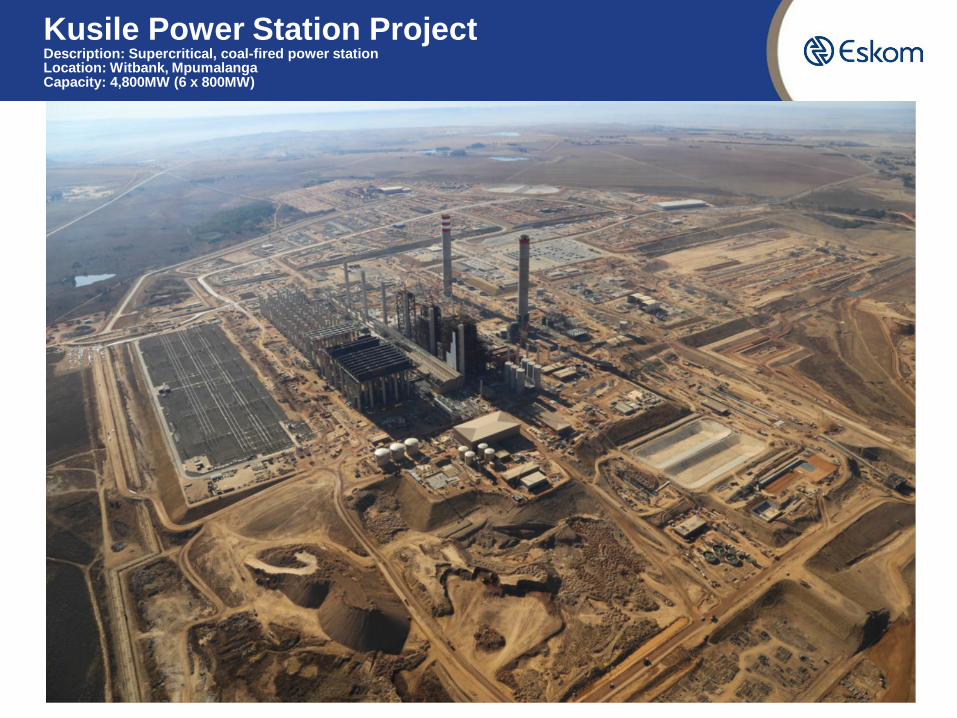
Kusile Power Station Project Description: Supercritical, coal-fired power station Location: Witbank, Mpumalanga Capacity: 4,800MW (6 x 800MW)
35

▪ The boiler contractor improved boiler construction progress from 0.48%/week (March
2014) to 0.74%/week
▪ Further improvement by the boiler contractor is required to achieve the target date and
Eskom is addressing this
▪ Eskom continues to work with the control and instrumentation (C&I) contractor to ensure the
contractor supports the target synchronization date
▪ Eskom has also implemented additional measures to mitigate schedule risk associated to C&I.
▪ Priority areas were defined for 2014 in order to support the First Unit (Unit 1)synchronization
target date
▪ Stringent tracking process and recovery plans have been established by Eskom, together
with contractors, to recover the schedule, where required, and achieve synchronization by
January 2016
▪ A commercial strategy has been defined to increase contractors’ resources and improve their
performance
▪ In addition to the protected strikes from Metal and Engineering contractors, Eskom
experienced unprotected industrial action from Civil contractors during July 2014
▪ Disciplinary action, against Civil contractors whose workers caused disruptions, has been
taken
▪ Resources were transferred to Project Medupi in order to support Medupi’s recovery plan
▪ The workforce is back on site
Industrial
Action Impact
First Unit
Synch
Productivity
Challenges
36
Kusile Power Station
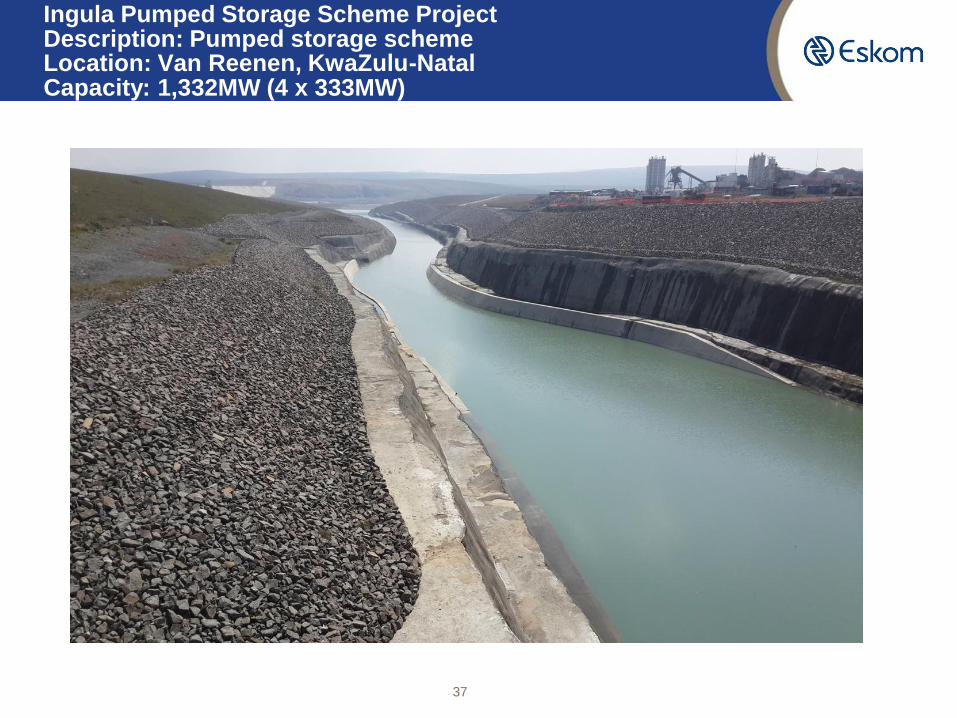
Ingula Pumped Storage Scheme Project Description: Pumped storage scheme Location: Van Reenen, KwaZulu-Natal Capacity: 1,332MW (4 x 333MW)
37
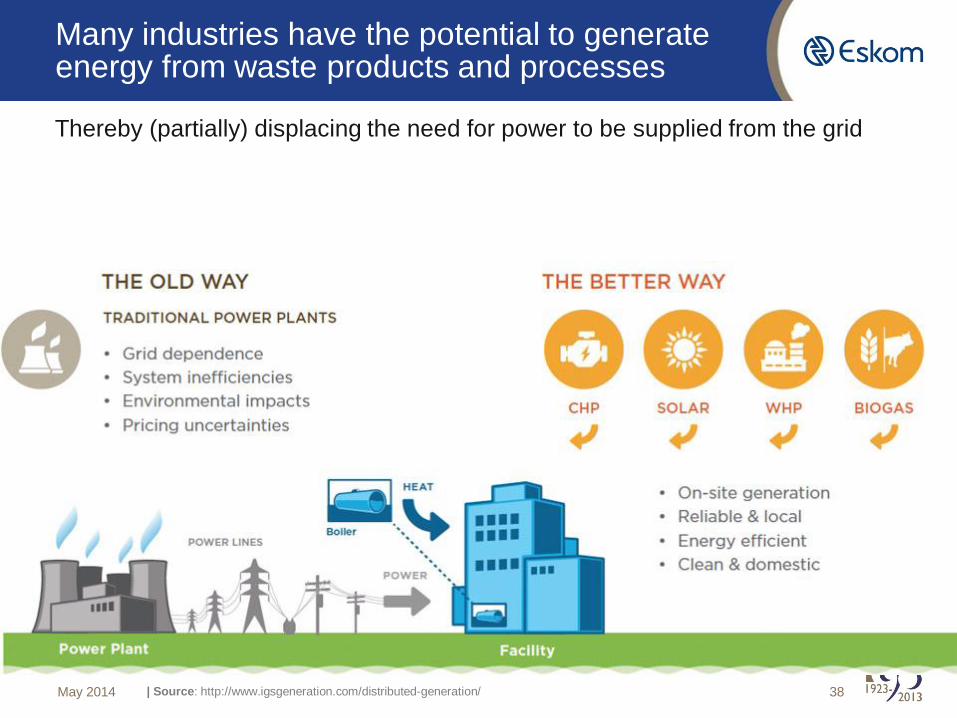
Many industries have the potential to generate energy from waste products and processes
| Source: http://www.igsgeneration.com/distributed-generation/ 38
Thereby (partially) displacing the need for power to be supplied from the grid
May 2014
Conclusion
• The system remains tight this summer, requiring the use of costly open cycle gas turbines to ensure secure supply of electricity
• Maintenance of power stations will not be compromised
• Eskom is managing the tight electricity supply to protect the integrity of the power system, and will therefore implement load shedding only if necessary, to protect the system from a devastating country blackout
• Unlike winter, in summer, the system is tight all day up to 10pm, due to the flat “Table Mountain” profile
• We thank customers for beating the peak in winter and continue to ask you to ‘Live Lightly’ in summer as the system will be tight all day due to the flat load profile
• Eskom is on track to achieve first synchronisation of Medupi Unit 6 at end of December 2014, with full power expected in the first half of 2015.
39

Less is more - Live Lightly
• Saving electricity reduces pressure on the grid and cuts your electricity bill and South Africa’s carbon emissions
• The power system remains vulnerable all day during Summer
1. Use air-conditioning efficiently
- Set air-conditioning at 23 degrees
- Close windows and doors to optimize conditioning
- Switch off 30 minutes before leaving the office
2. Switch off all geysers (during the day – until 9pm) and pool pumps all day until 9pm, invest in a timer
3. If you use the pool frequently, limit pool filtering cycles to 2 cycles daily, not between 5pm & 9pm
4. Switch off all non-essential lighting
5. Respond to the Power Alert messages by switching off all appliances that are not being used
40
Thank you