Embed Size (px)
Citation preview

State of the Oceans 2006-2007
Albert Fischer
OOPC-12
Paris, France, 2-5 May 2007
Ocean climate indices from data
• Observing system evaluation– In the long term: the development of ocean forecasting and ocean
reanalyses, and observing system simulation experiments (OSSEs) will provide specific feedback
– Right now: estimating the uncertainty in the measure of climate indices
• quantities that act as indicators of climate variability• towards a measure of our ability to observe
• Liaison/outreach– A way to communicate about the ocean observing system and the
ocean’s role in climate and climate variability - what is the influence of the ocean on weather/climate and what is it doing right now

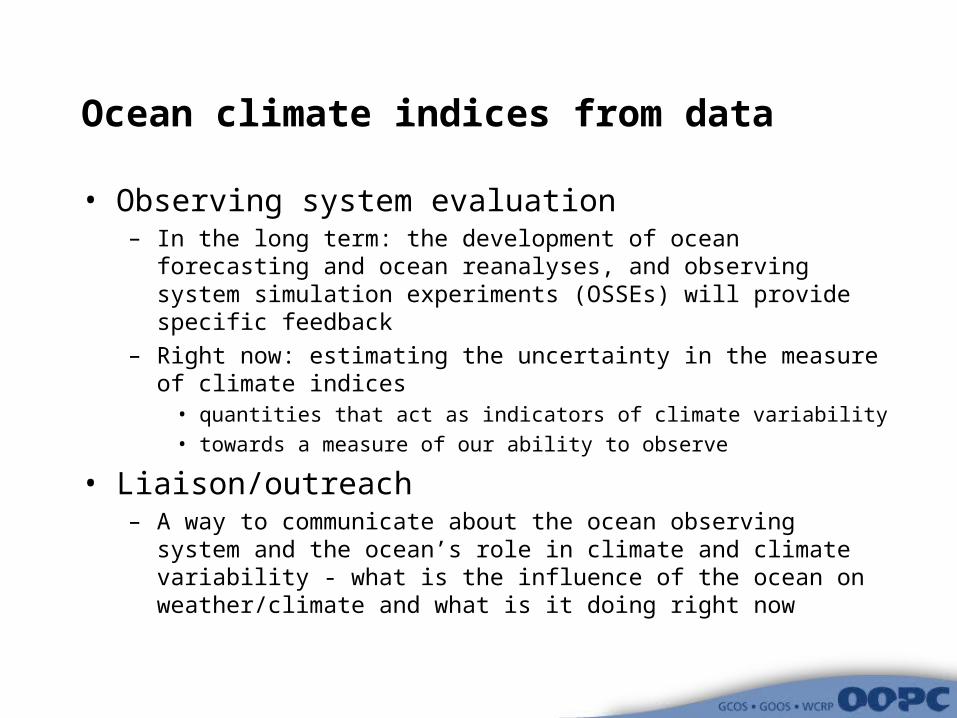
http://ioc.unesco.org/oopc/
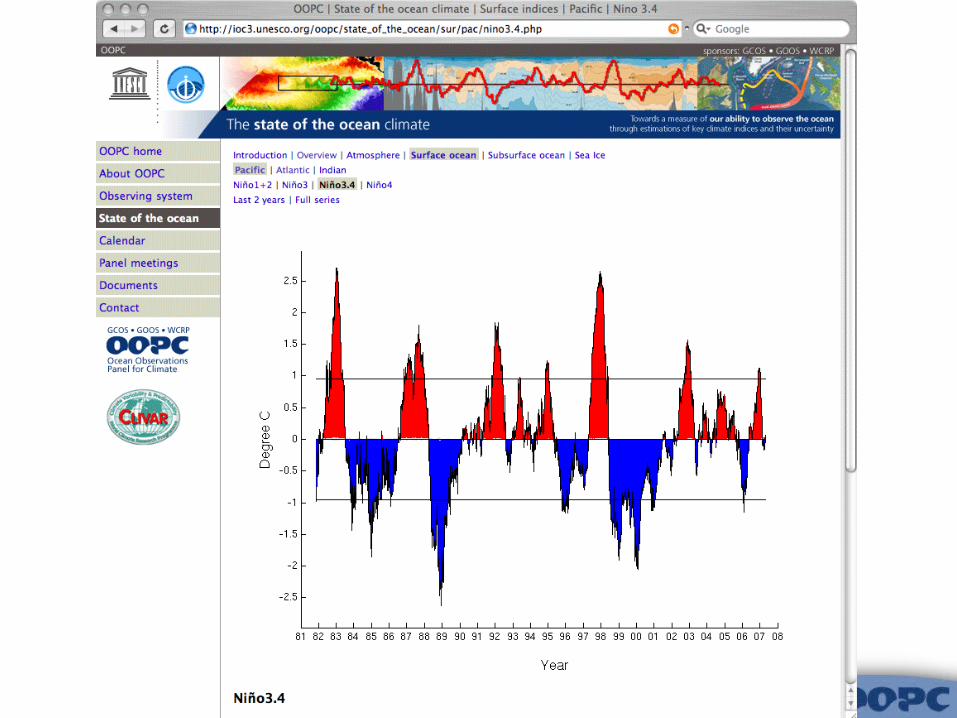
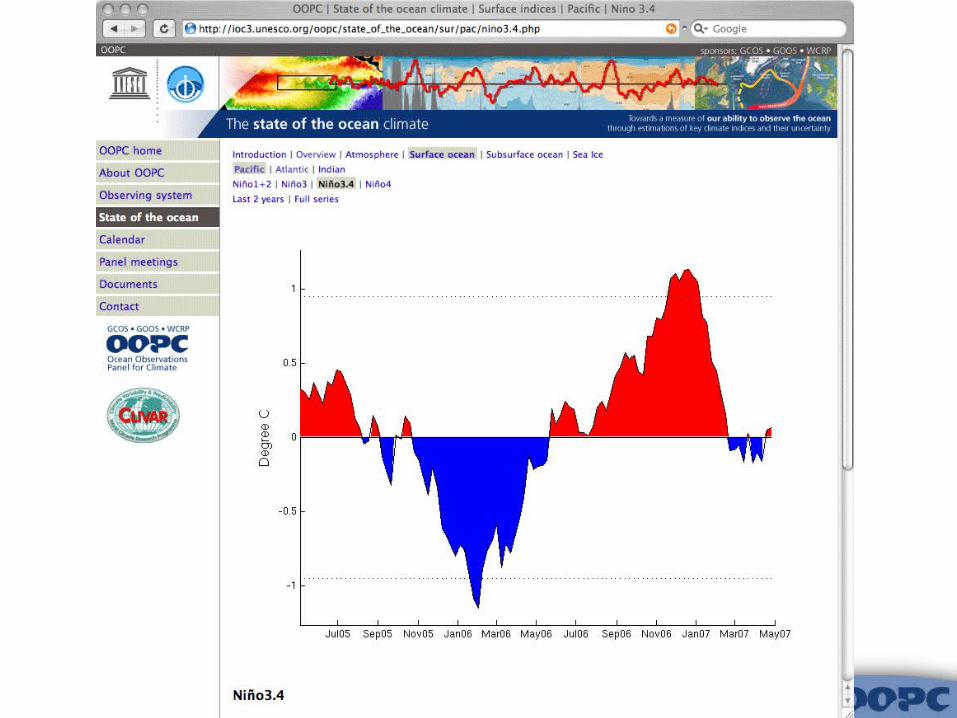
State of the ocean


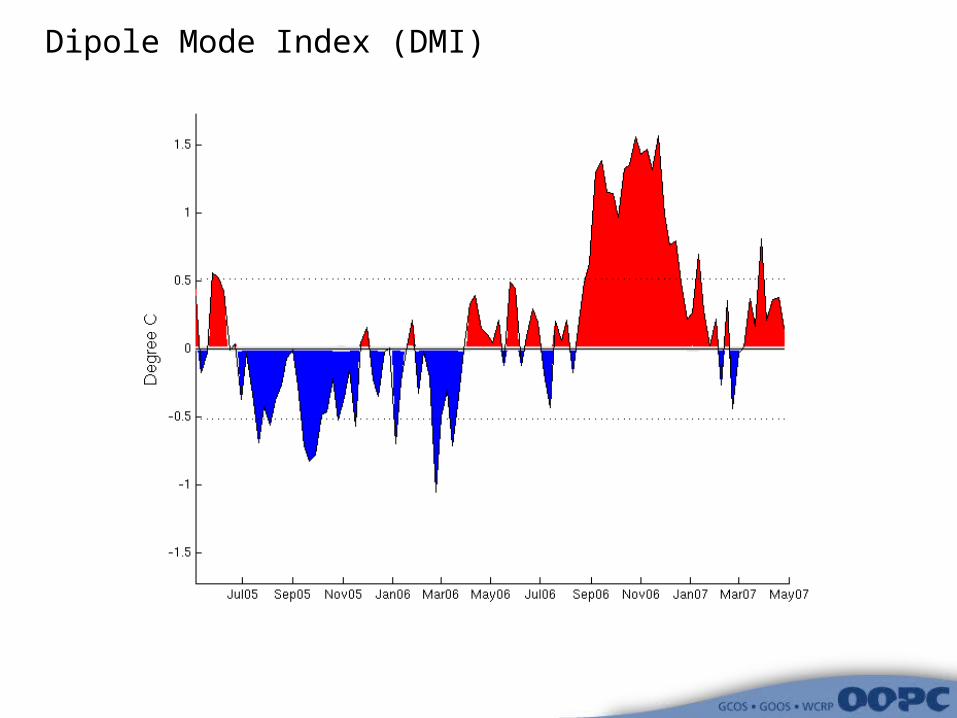
Dipole Mode Index (DMI)
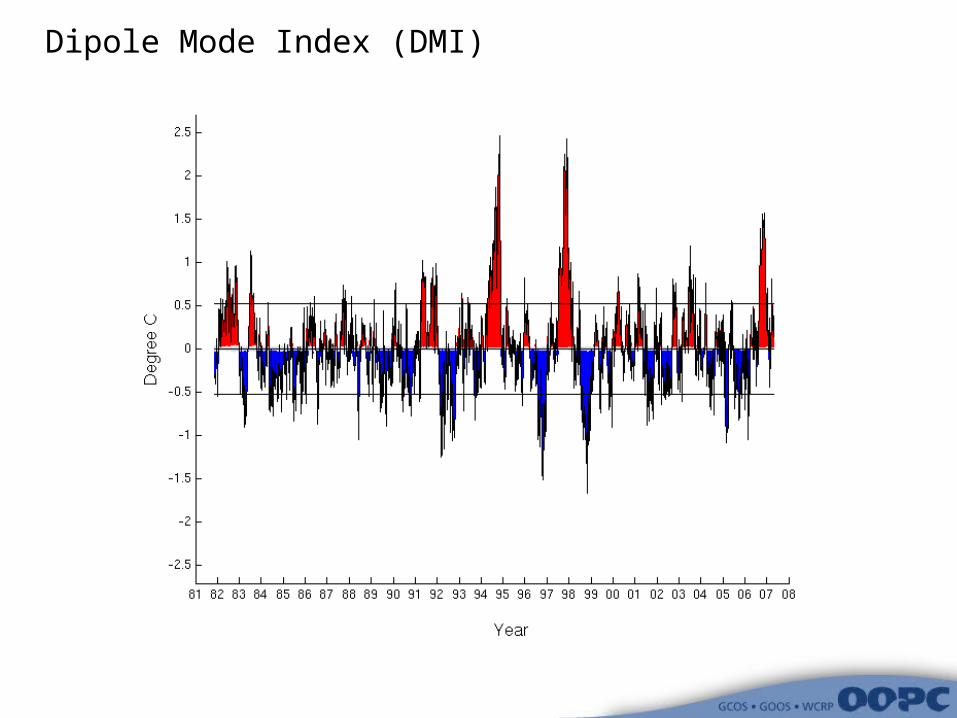
Dipole Mode Index (DMI)

Seasonal precipitation anomaly
JJA2006
SON2006
CAMS OPI
raingauge+OLR(Xie & Arkin)
Standardized Precipitation Index (stdevs from normal)
plotted usingIRI data library

Seasonal precipitation anomaly
CAMS OPI
raingauge+OLR(Xie & Arkin)
Standardized Precipitation Index (stdevs from normal)

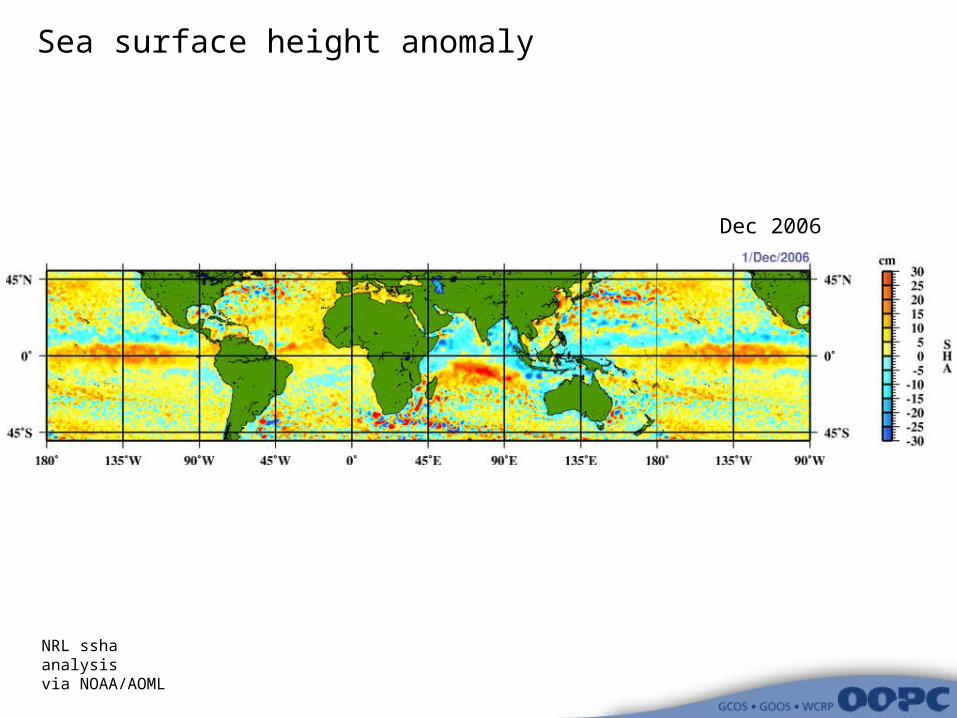
Sea surface height anomaly
NRL ssha analysisvia NOAA/AOML
Sep 2006
Sea surface height anomaly
NRL ssha analysisvia NOAA/AOML
Dec 2006

Sea surface height anomaly
NRL ssha analysisvia NOAA/AOML
Apr 2007

Tropical North Atlantic (TNA) SSTA
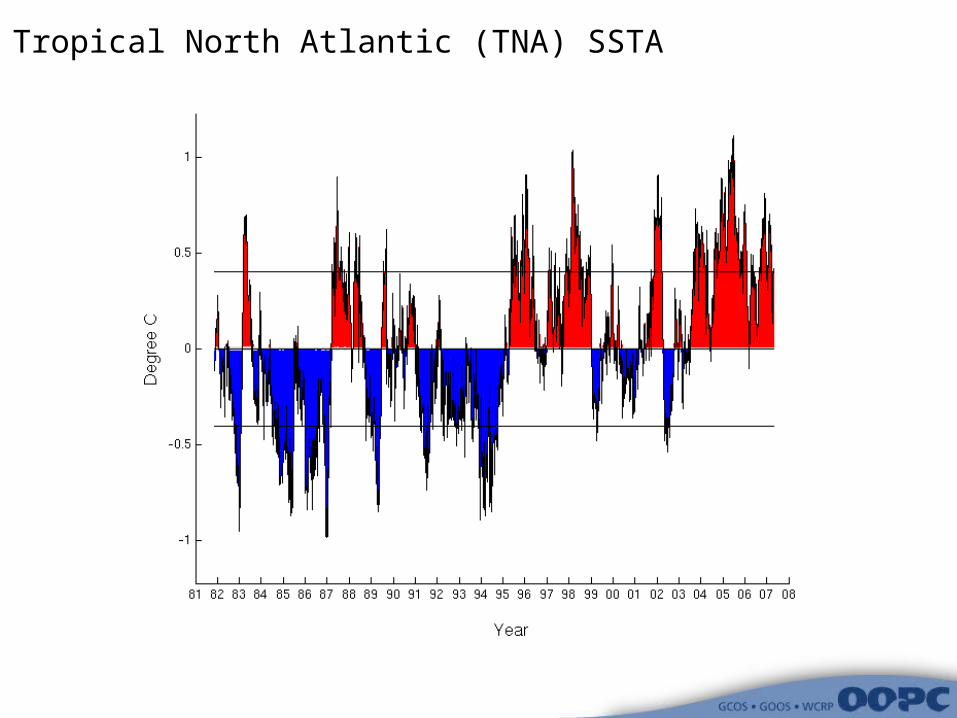
Tropical North Atlantic (TNA) SSTA
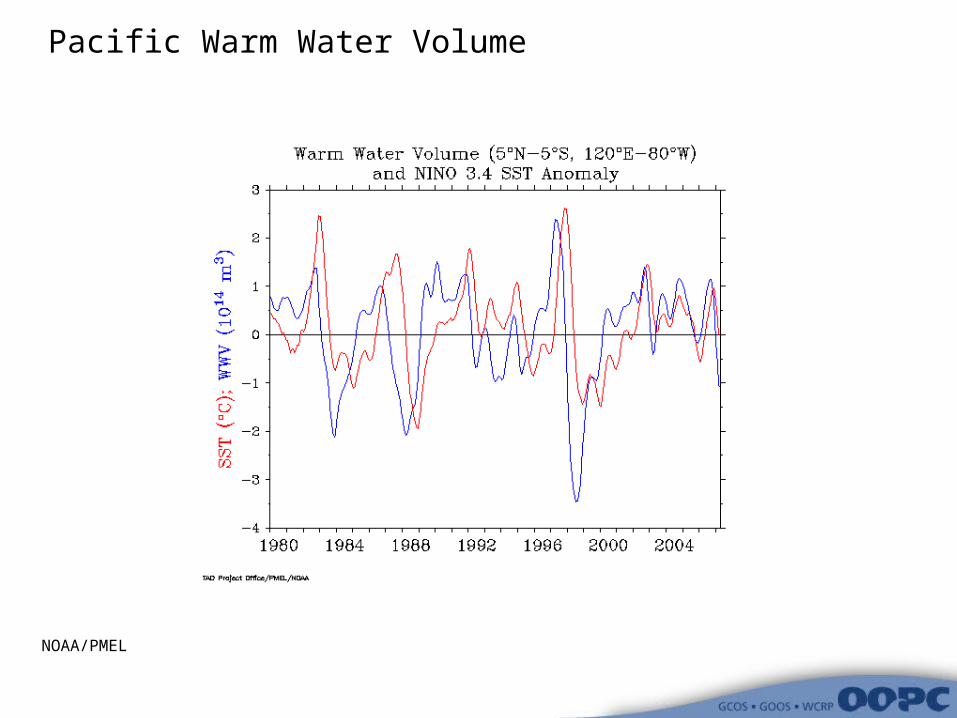
Pacific Warm Water Volume
NOAA/PMEL
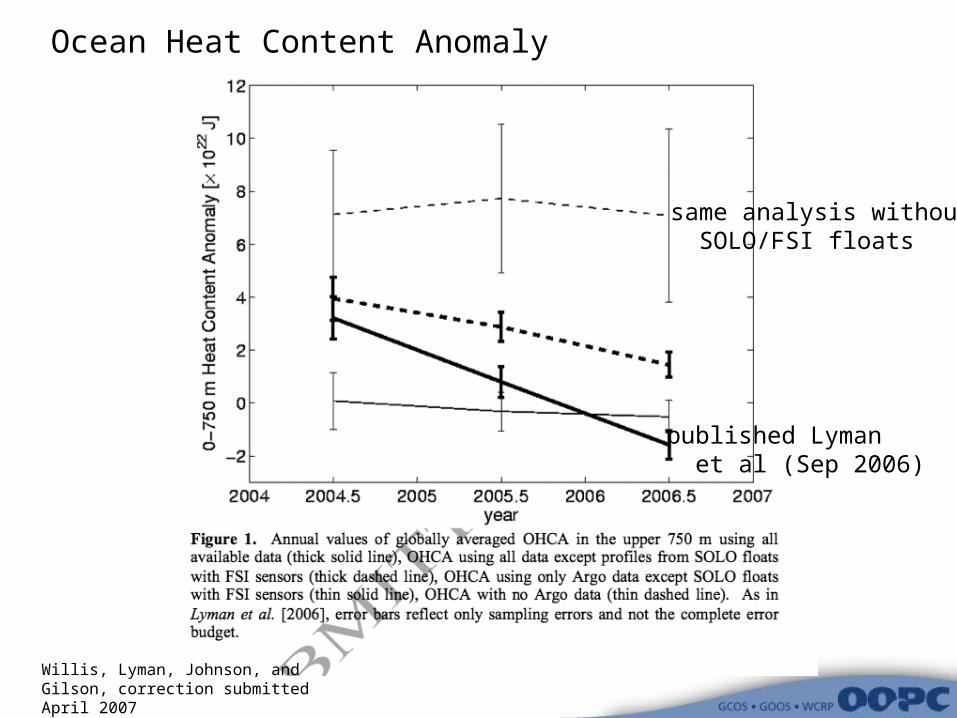
Willis, Lyman, Johnson, and Gilson, correction submitted April 2007
published Lyman et al (Sep 2006)
same analysis without SOLO/FSI floats
Ocean Heat Content Anomaly

Increasing visibility
• shown largely to a community ‘in the know’ (ocean observations community)
• Incoming traffic– exposure with links from IOC and GOOS, CLIVAR, and JAMSTEC
web sites
– 30% from google (‘dipole mode’, ‘tropical atlantic’, ‘ocean climate/transport’, ‘essential climate variables’)
– 40% direct (bookmarked)
• now averaging 600 visits/month– from all continents except Antarctica
• In current form geared to ocean climate scientists
Where we know we want to improve
• Information about the impacts associated with the index - patterns of climate variability, links between indices, changes in rainfall, even historical examples; with references
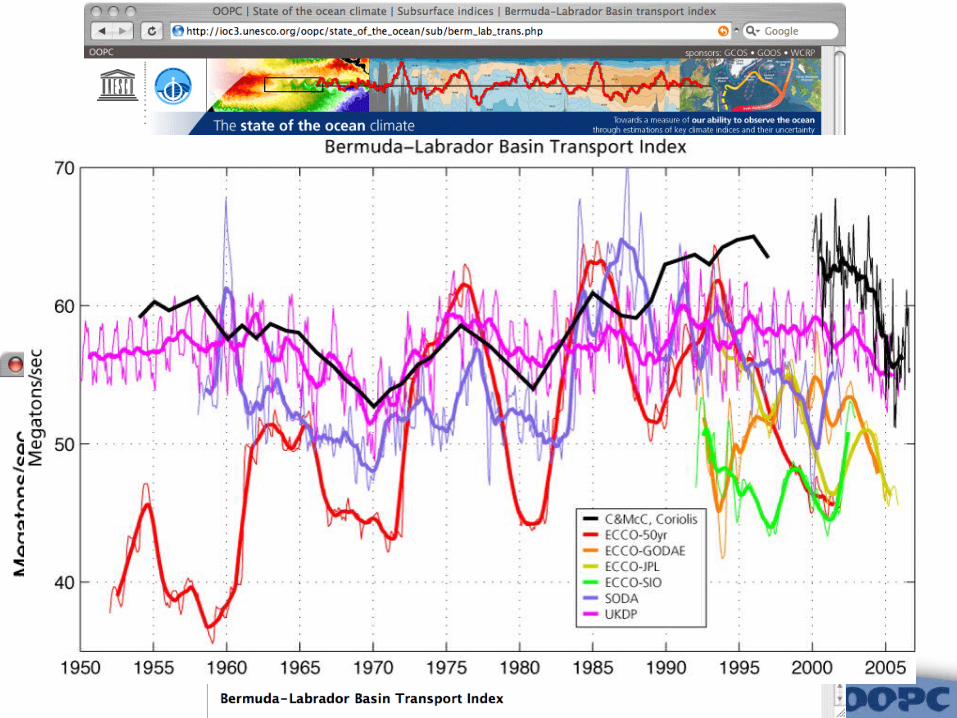
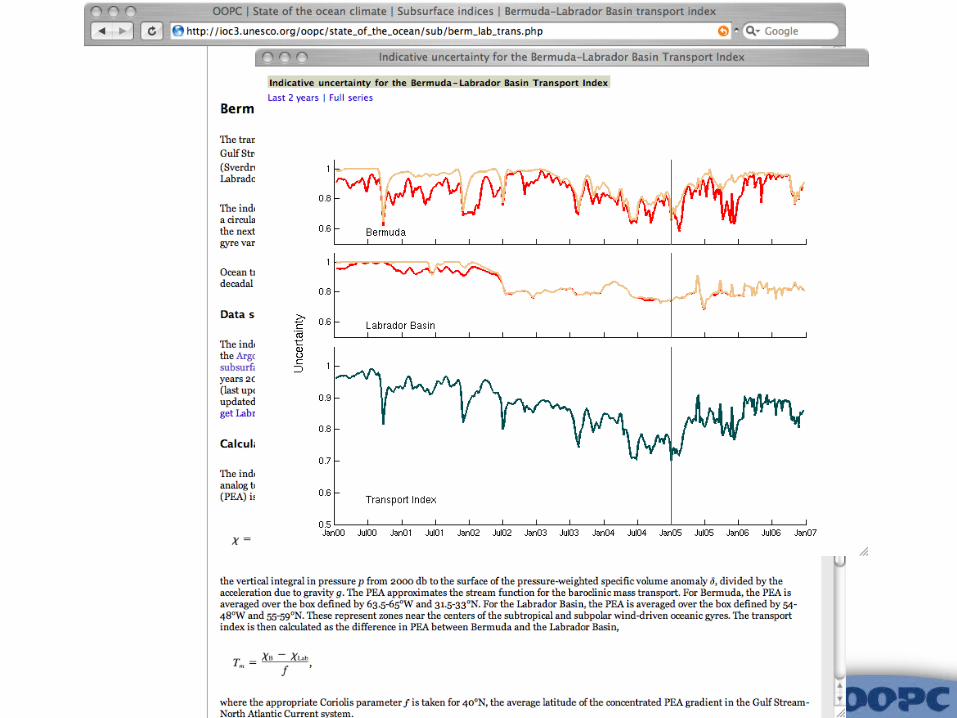
• more subsurface indices: upper ocean heat content, mixed layer / thermocline depth, MOC, transports like ITF, mode waters, salinity changes, taking advantage of time series (mooring, repeat XBT) with improved uncertainty estimates
• sea level indices (including dynamic indices from altimetry)• composite indices (ex: hurricane index - combination of ocean heat content
and atmospheric conditions)
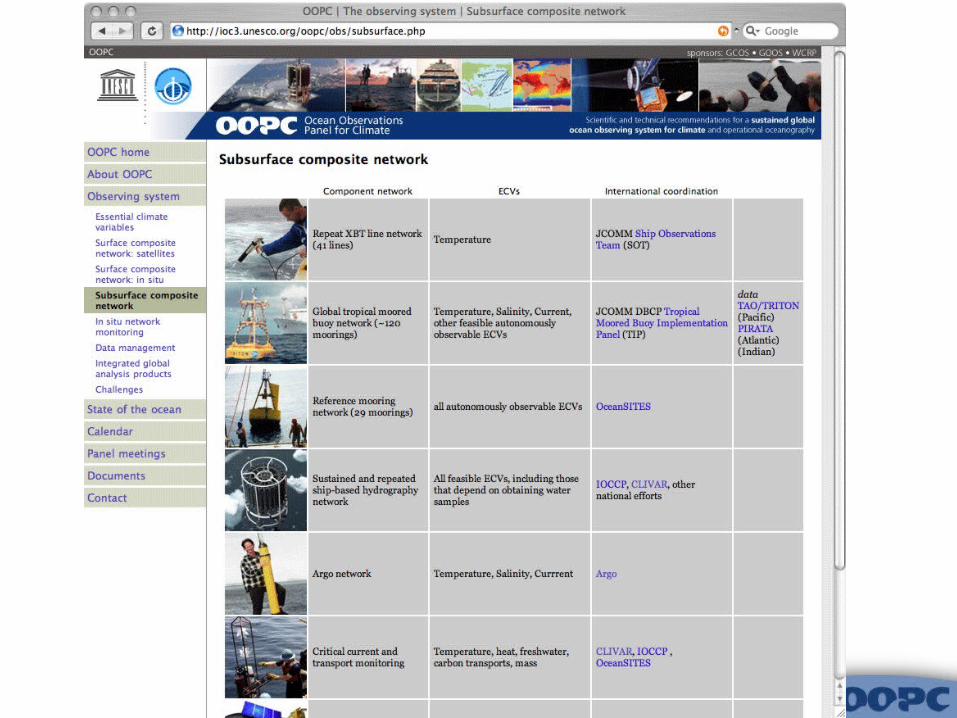
• sea ice• polar oceans• more information/better links about the observing networks
contributing to the calculation of the index• while retaining easy accessibility - a limit on the number of ‘top level’
indices - an ‘expert’ toggle?