Embed Size (px)
Citation preview
STATE OF THE NATIONS CHILD: STATE OF THE NATIONS CHILD:
IRELAND 2006IRELAND 2006 Towards a better understanding of Towards a better understanding of children’s liveschildren’s lives
Anne-Marie BrooksAnne-Marie Brooks2828thth June 2007 June 2007
BACKGROUND (1)BACKGROUND (1)
Commitment given in the National Children’s Strategy
Compiled by the Research Division, Office of the Minister for Children in association with:
The Central Statistics Office The Statistics Division of the Department of Health
and Children The Health Promotion Unit, National University of
Galway, Ireland
Range of reviewers of single indicators from policy, research and service provider areas
BACKGROUND (2)BACKGROUND (2)
1. A background review of indicators sets in use elsewhere and the compilation of an inventory of key indicators, domains and indicator selection criteria;
2. A feasibility study of the availability of national statistics to construct the indicators identified in the previous step;
3. A study on Children’s Understandings of Well-Being; and
4. A consensus process referred to as a Delphi technique, where participants on ‘a panel of expertise’ agreed indicators for use in the Irish context.
PRINCIPLES PRINCIPLES
Go beyond basic survival in its representation of well-being
Focus on positive as well as negative aspects of children’s lives
Take account of the experience of childhood in itself
Include some of the new domains of child well-being
SELECTION CRITERIASELECTION CRITERIA
Comprehensive coverage Children of all ages Clear and comprehensible Positive outcomes Forward-looking Rigorous methods Geographically detailed Cost-efficient Reflective of social goals
AIM OF THE REPORTAIM OF THE REPORT
Describes the lives of children in Ireland
Tracks changes over time
Benchmarks progress in Ireland relative to other countries
STRUCTURE OF THE STRUCTURE OF THE REPORT (1)REPORT (1)
Executive Summary Introduction
Section 1: Socio-demographics Section 2: Children’s relationships:
- Parental relationships- Peers relationships
Section 3: Children’s outcomes: - Education- Health- Social, emotional and
behavioural Section 4: Formal and informal
supports
Index
STRUCTURE OF THE STRUCTURE OF THE REPORT (2)REPORT (2)
Context Significance
Findings: description according to: – gender, – Age, – Geography, – Social class, – International comparisons
Technical notes Access further information
STATE OF THE NATIONS STATE OF THE NATIONS CHILD CHILD
KEY FINDINGS
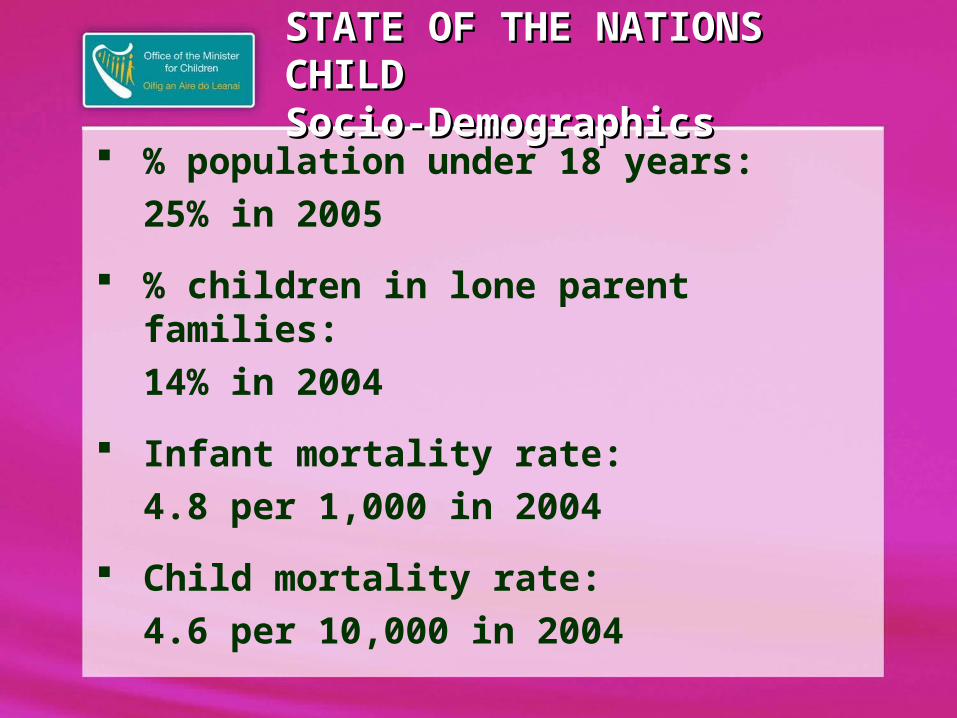
STATE OF THE NATIONS STATE OF THE NATIONS CHILD CHILD Socio-DemographicsSocio-Demographics
% population under 18 years:25% in 2005
% children in lone parent families:14% in 2004
Infant mortality rate:4.8 per 1,000 in 2004
Child mortality rate:4.6 per 10,000 in 2004
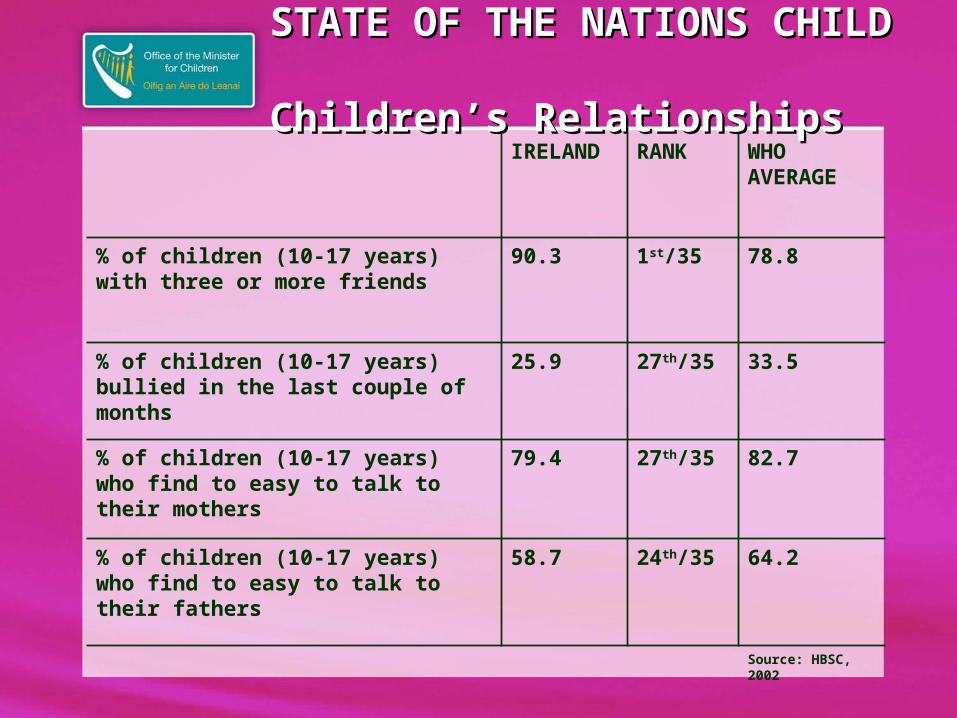
STATE OF THE NATIONS STATE OF THE NATIONS CHILD CHILD Children’s RelationshipsChildren’s Relationships
IRELAND RANK WHO AVERAGE
% of children (10-17 years) with three or more friends
90.3 1st/35 78.8
% of children (10-17 years) bullied in the last couple of months
25.9 27th/35 33.5
% of children (10-17 years) who find to easy to talk to their mothers
79.4 27th/35 82.7
% of children (10-17 years) who find to easy to talk to their fathers
58.7 24th/35 64.2
Source: HBSC, 2002
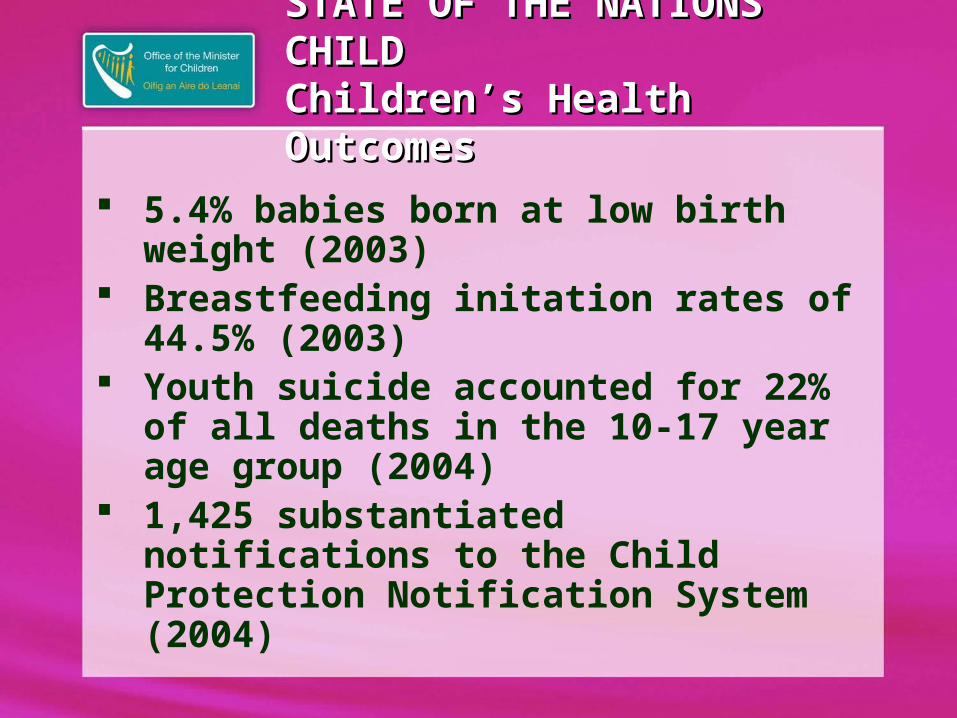
STATE OF THE NATIONS STATE OF THE NATIONS CHILD CHILD Children’s Health Children’s Health OutcomesOutcomes
5.4% babies born at low birth weight (2003)
Breastfeeding initation rates of 44.5% (2003)
Youth suicide accounted for 22% of all deaths in the 10-17 year age group (2004)
1,425 substantiated notifications to the Child Protection Notification System (2004)
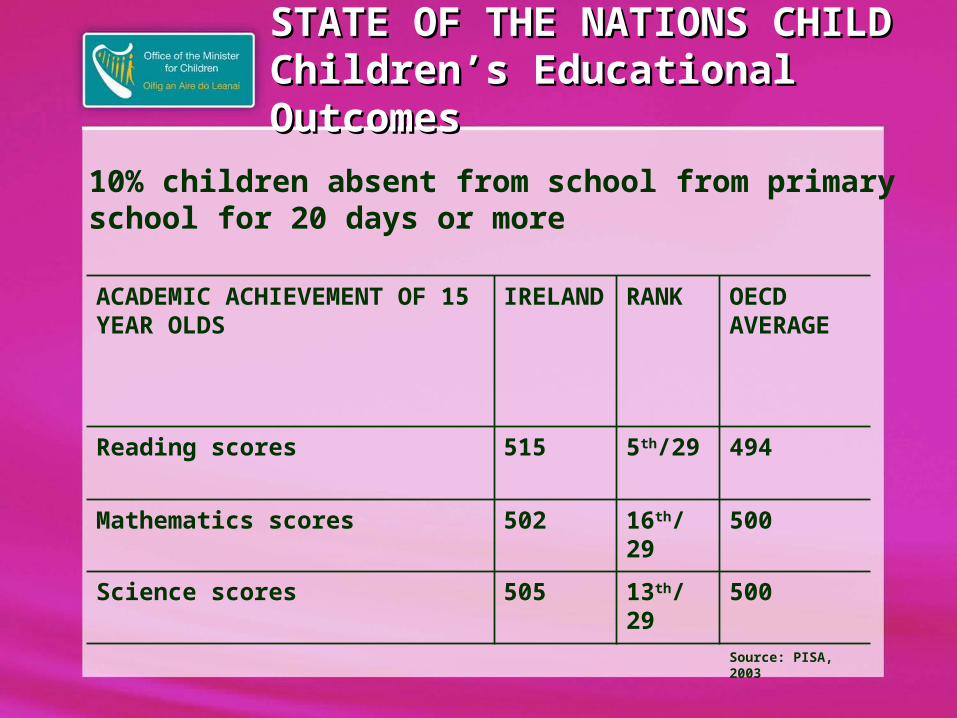
STATE OF THE NATIONS STATE OF THE NATIONS CHILD CHILD Children’s Educational Children’s Educational OutcomesOutcomes
ACADEMIC ACHIEVEMENT OF 15 YEAR OLDS
IRELAND
RANK OECD AVERAGE
Reading scores 515 5th/29 494
Mathematics scores 502 16th/29
500
Science scores 505 13th/29
500
Source: PISA, 2003
10% children absent from school from primary school for 20 days or more
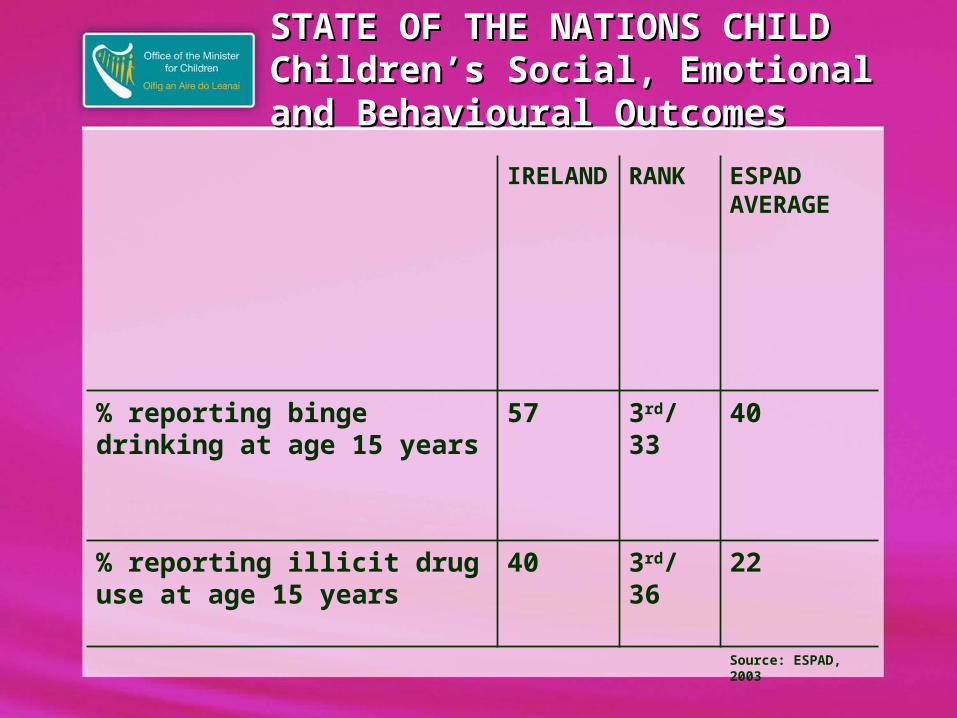
STATE OF THE NATIONS CHILD STATE OF THE NATIONS CHILD Children’s Social, Emotional and Children’s Social, Emotional and Behavioural OutcomesBehavioural Outcomes
IRELAND
RANK ESPAD AVERAGE
% reporting binge drinking at age 15 years
57 3rd/33
40
% reporting illicit drug use at age 15 years
40 3rd/36
22
Source: ESPAD, 2003
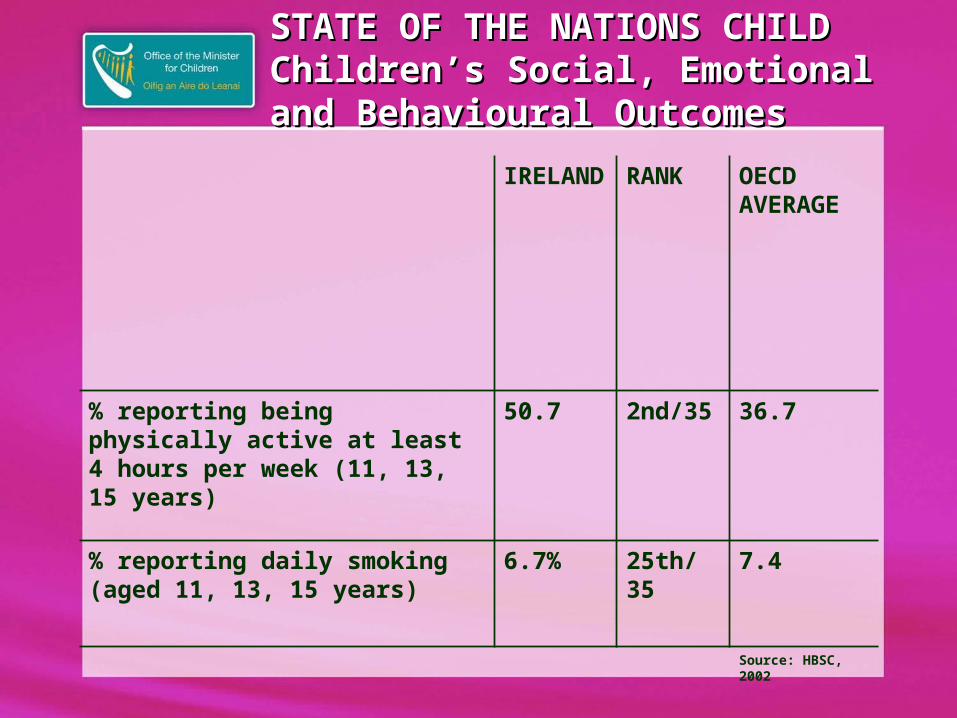
STATE OF THE NATIONS CHILD STATE OF THE NATIONS CHILD Children’s Social, Emotional and Children’s Social, Emotional and Behavioural OutcomesBehavioural Outcomes
IRELAND
RANK OECD AVERAGE
% reporting being physically active at least 4 hours per week (11, 13, 15 years)
50.7 2nd/35 36.7
% reporting daily smoking (aged 11, 13, 15 years)
6.7% 25th/35
7.4
Source: HBSC, 2002
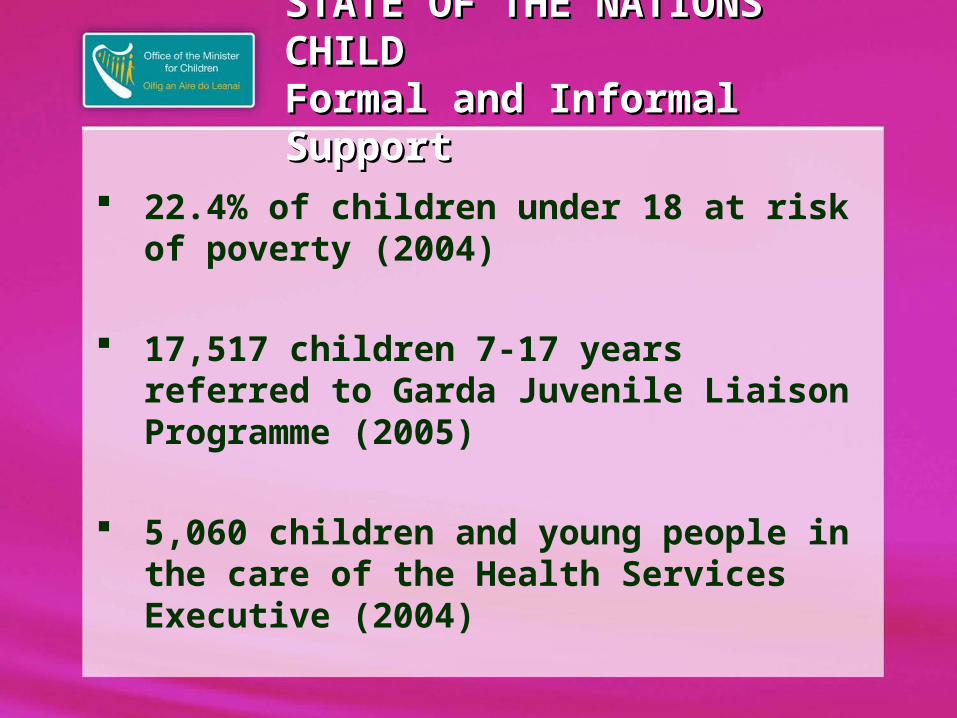
STATE OF THE NATIONS STATE OF THE NATIONS CHILD CHILD Formal and Informal Formal and Informal SupportSupport
22.4% of children under 18 at risk of poverty (2004)
17,517 children 7-17 years referred to Garda Juvenile Liaison Programme (2005)
5,060 children and young people in the care of the Health Services Executive (2004)
STATE OF THE NATIONS STATE OF THE NATIONS CHILD CHILD
KEY CONSIDERATIONS
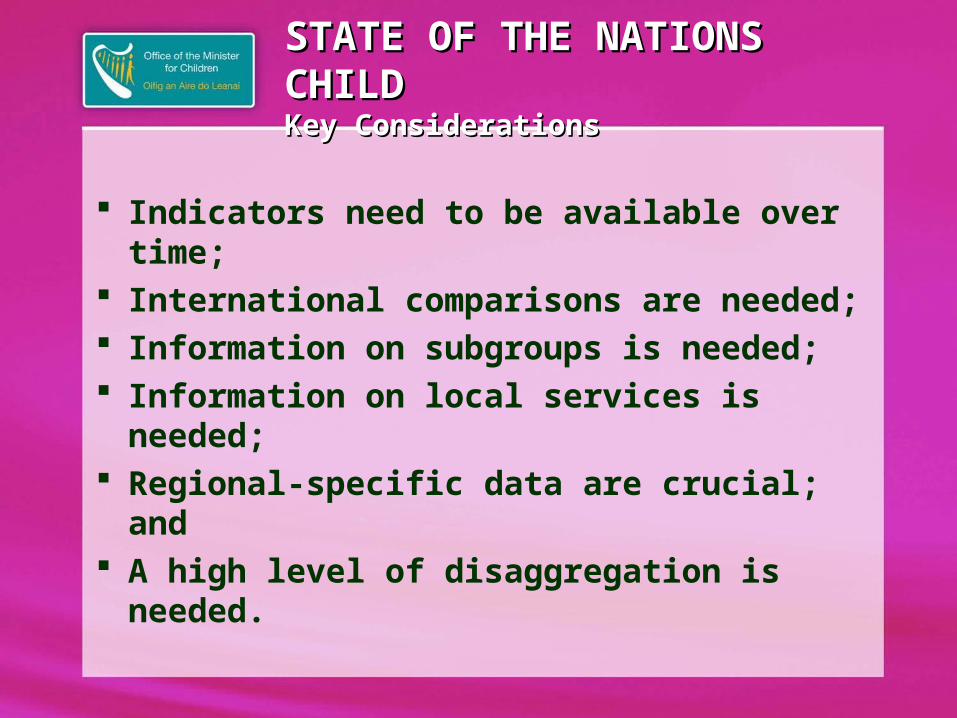
STATE OF THE NATIONS STATE OF THE NATIONS CHILDCHILDKey ConsiderationsKey Considerations
Indicators need to be available over time;
International comparisons are needed; Information on subgroups is needed; Information on local services is
needed; Regional-specific data are crucial; and A high level of disaggregation is
needed.
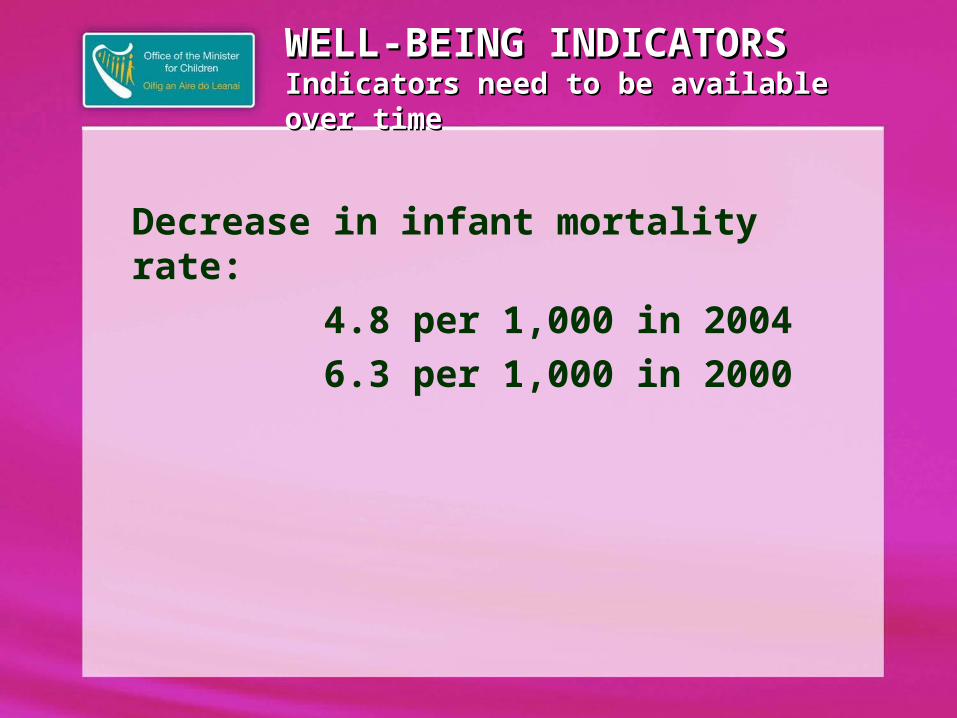
WELL-BEING INDICATORSWELL-BEING INDICATORSIndicators need to be available over Indicators need to be available over timetime
Decrease in infant mortality rate:4.8 per 1,000 in 2004 6.3 per 1,000 in 2000
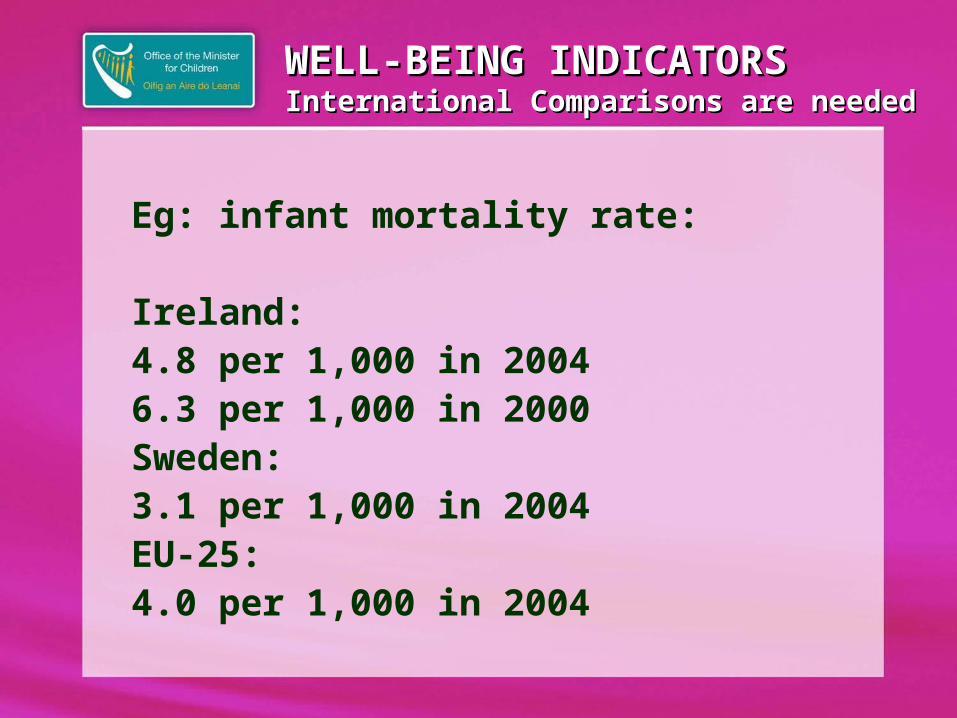
WELL-BEING INDICATORSWELL-BEING INDICATORSInternational Comparisons are neededInternational Comparisons are needed
Eg: infant mortality rate:
Ireland:4.8 per 1,000 in 2004 6.3 per 1,000 in 2000
Sweden:3.1 per 1,000 in 2004
EU-25:4.0 per 1,000 in 2004
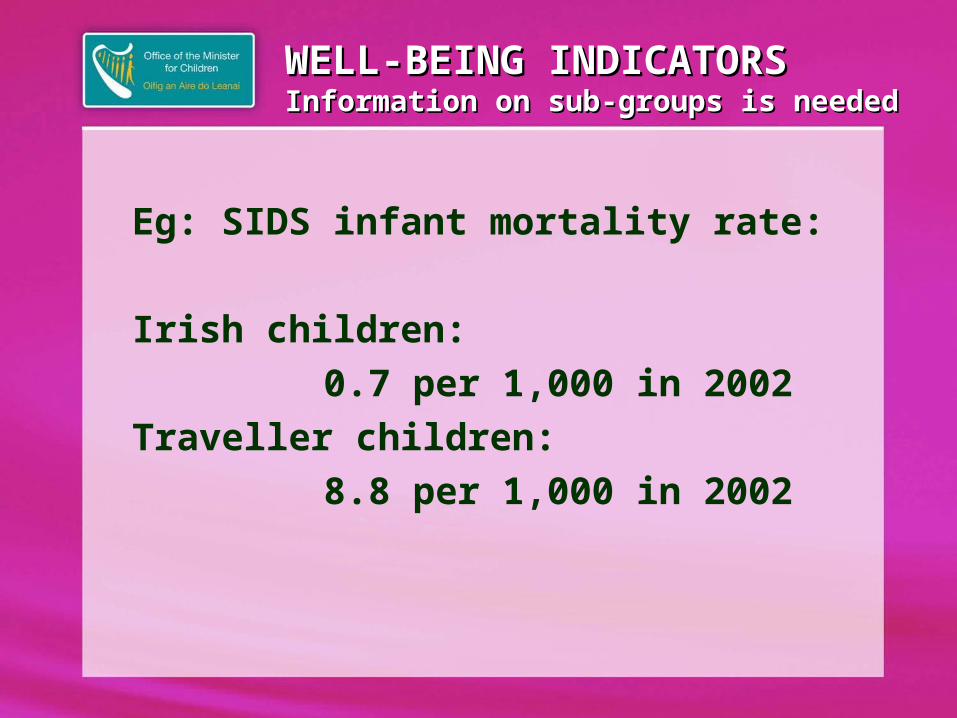
WELL-BEING INDICATORSWELL-BEING INDICATORSInformation on sub-groups is neededInformation on sub-groups is needed
Eg: SIDS infant mortality rate:
Irish children:0.7 per 1,000 in 2002
Traveller children:8.8 per 1,000 in 2002
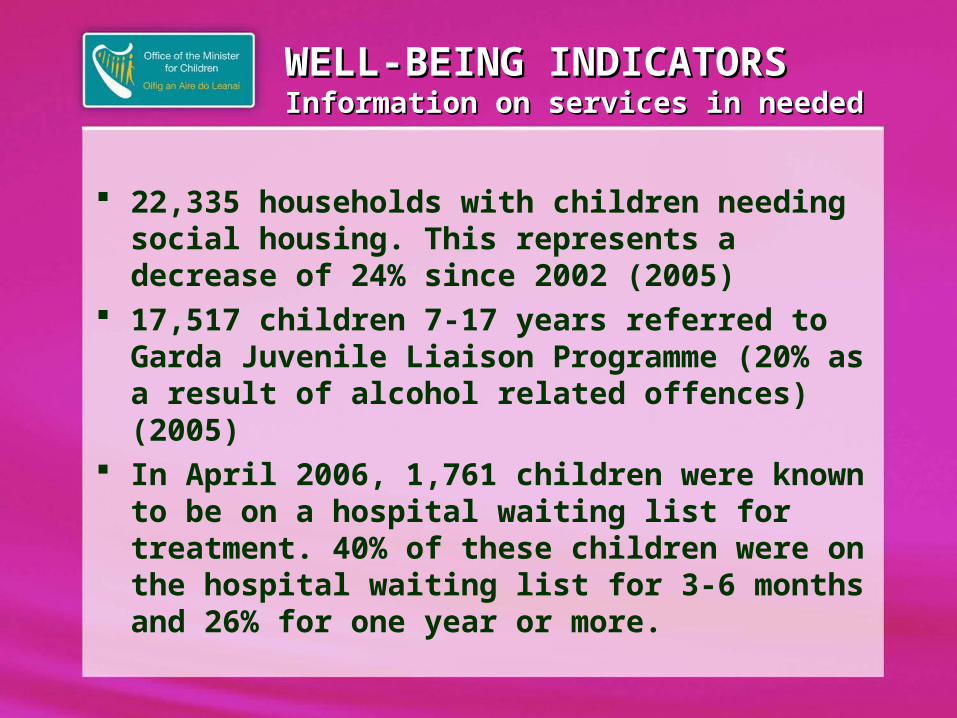
WELL-BEING INDICATORSWELL-BEING INDICATORSInformation on services in neededInformation on services in needed
22,335 households with children needing social housing. This represents a decrease of 24% since 2002 (2005)
17,517 children 7-17 years referred to Garda Juvenile Liaison Programme (20% as a result of alcohol related offences) (2005)
In April 2006, 1,761 children were known to be on a hospital waiting list for treatment. 40% of these children were on the hospital waiting list for 3-6 months and 26% for one year or more.
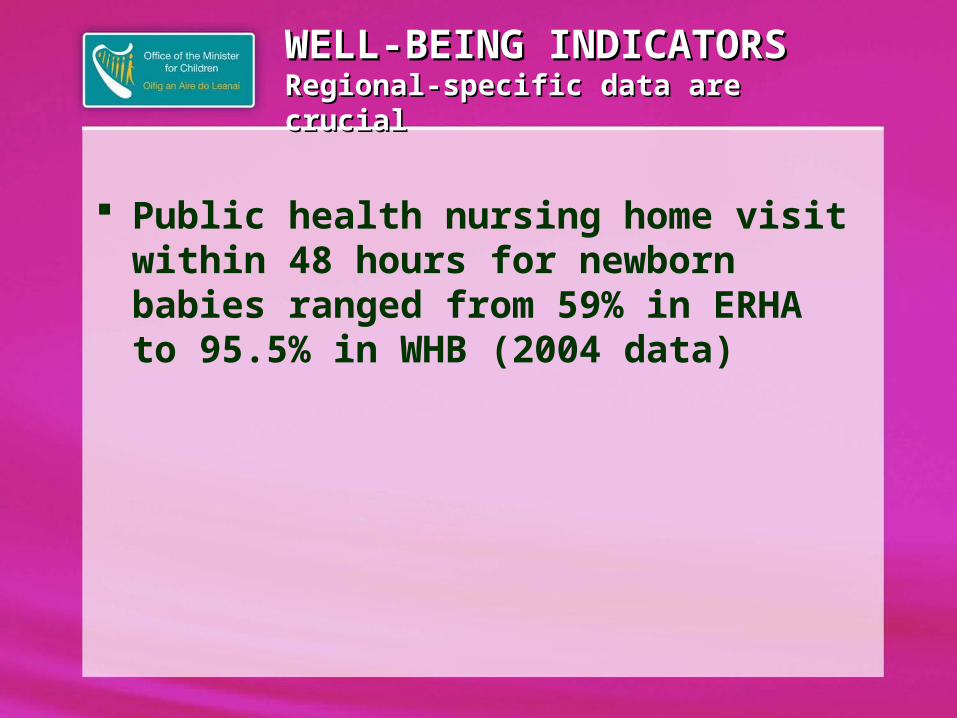
WELL-BEING INDICATORSWELL-BEING INDICATORSRegional-specific data are crucialRegional-specific data are crucial
Public health nursing home visit within 48 hours for newborn babies ranged from 59% in ERHA to 95.5% in WHB (2004 data)
STATE OF THE NATIONS STATE OF THE NATIONS CHILD CHILD
NEXT STEPS
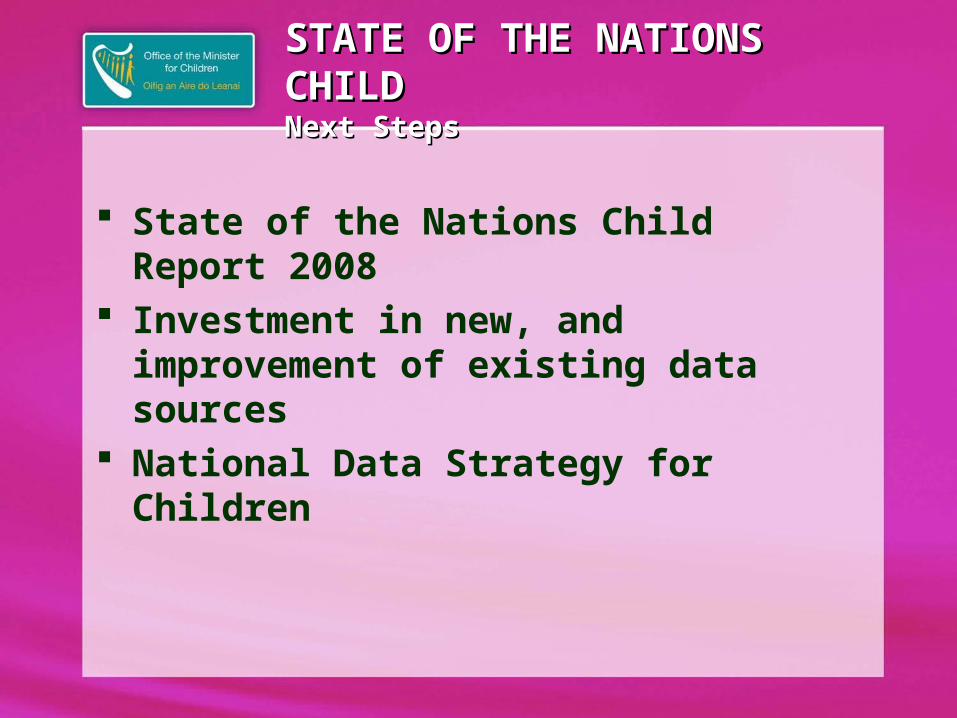
STATE OF THE NATIONS STATE OF THE NATIONS CHILDCHILDNext StepsNext Steps
State of the Nations Child Report 2008
Investment in new, and improvement of existing data sources
National Data Strategy for Children
Office of the Minister for ChildrenDepartment of Health and Children
Hawkins HouseDublin 2
Phone: (01) 635 [email protected]
State of the Nations Child Report 2006can be downloaded from:
www.omc.gov.ie