Embed Size (px)
Citation preview

STATE OF THE FISHERIES AND AQUATIC RESOURCES REPORT 2009/10

2 DEPARTMENT OF FISHERIES
Edited by W.J. Fletcher and K. Santoro Produced by the Fisheries Research Division based at the WA Fisheries and Marine Research Laboratories Published by the Department of Fisheries 3rd Floor, The Atrium 168 St Georges Terrace Perth WA 6000 Website: www.fish.wa.gov.au ABN: 55 689 794 771
ISSN 1838 - 417X (print) ISSN 1838 - 4161 (online)
Suggested citation formats:
Entire report: Fletcher, W.J. and Santoro, K. (eds). 2010. State of the Fisheries and Aquatic Resources Report 2009/10. Department of Fisheries, Western Australia.
Individual status report: Hart, A. and Brown, J. 2010. Roe’s Abalone Fishery Status Report. In: State of the Fisheries and Aquatic Resources Report 2009/10 eds. W.J. Fletcher and K. Santoro, Department of Fisheries, Western Australia, pp. 39-48.
CONTENTS OVERVIEW FROM THE CHIEF EXECUTIVE OFFICER................................5
Gascoyne Demersal Scalefish Fishery Status Report ......................................122
EDITOR'S INTRODUCTION.......................6 Inner Shark Bay Scalefish Fishery Status Report .................................................129 HOW TO USE THIS VOLUME ...................7
OVERVIEW OF THE STATUS OF KEY FISHERIES AND STOCKS........................11
Gascoyne and North Coast Blue Swimmer Crab Fishery Status Report 135
OVERVIEW TABLE 14 AQUACULTURE 142 Stock Status, Catch & Effort Ranges for the Major Commercial Fisheries.......... 14
COMPLIANCE AND COMMUNITY EDUCATION 143
WEST COAST BIOREGION......................18 NORTH COAST BIOREGION ................ 147 ABOUT THE BIOREGION 19 ABOUT THE BIOREGION 148 SUMMARY OF FISHING AND AQUACULTURE ACTIVITIES 19
SUMMARY OF FISHING AND AQUACULTURE ACTIVITIES 148
ECOSYSTEM MANAGEMENT 19 ECOSYSTEM BASED FISHERIES MANAGEMENT 21
ECOSYSTEM MANAGEMENT 149
FISHERIES 19
ECOSYSTEM BASED FISHERIES MANAGEMENT 151 FISHERIES 155
West Coast Rock Lobster Fishery Status Report................................................... 28
Northern Prawn Managed Fisheries Status Report ......................................155
Roe’s Abalone Fishery Status Report .. 39 North Coast Nearshore and Estuarine Fishery Status Report .........................165 Abrolhos Islands and Mid West, South
West Trawl Managed Fisheries and South Coast Trawl Fishery Status Report49
North Coast Demersal Fisheries Status Report .................................................172
West Coast Blue Swimmer Crab Fishery Status Report ........................................ 54
Mackerel Managed Fishery Report: Statistics Only.....................................190
West Coast Deep Sea Crab (Interim) Managed Fishery Status Report ........... 62
Northern Shark Fisheries Status Report192 Pearl Oyster Managed Fishery Status Report .................................................199 West Coast Nearshore and Estuarine
Finfish Resources Status Report .......... 65 Beche-de-mer Fishery Status Report..205 West Coast Purse Seine Fishery Report: Statistics Only ...................................... 78
AQUACULTURE 210 COMPLIANCE & COMMUNITY EDUCATION 210 West Coast Demersal Scalefish Fishery
Status Report ........................................ 80 SOUTH COAST BIOREGION................. 213 Octopus Fishery Status Report............. 90
AQUACULTURE 95 ABOUT THE BIOREGION 214
COMPLIANCE AND COMMUNITY EDUCATION 95
SUMMARY OF FISHING AND AQUACULTURE ACTIVITIES 214 ECOSYSTEM MANAGEMENT 215
GASCOYNE COAST BIOREGION...........99 ECOSYSTEM BASED FISHERIES MANAGEMENT 215 ABOUT THE BIOREGION 100
SUMMARY OF FISHING AND AQUACULTURE ACTIVITIES 100
FISHERIES 218
ECOSYSTEM MANAGEMENT 101 ECOSYSTEM BASED FISHERIES MANAGEMENT 103
South Coast Crustacean Fisheries Report: Statistics Only........................218
FISHERIES 107
Greenlip/Brownlip Abalone Fishery Status Report ......................................221 South Coast Nearshore and Estuarine Finfish Resources Status Report.........229 Shark Bay Prawn and Scallop Managed
Fisheries Status Report....................... 107 South Coast Purse Seine Fishery Report: Statistics Only.....................................244 Exmouth Gulf Prawn Managed Fishery
Status Report ...................................... 117
STATE OF THE FISHERIES AND AQUATIC RESOURCES REPORT 2009/10 3
CONTENTS
Demersal Gillnet and Longline Fisheries Status Report ...................................... 246 South Coast Demersal Line Fishery Report: Statistics Only ....................... 259
AQUACULTURE 260 COMPLIANCE AND COMMUNITY EDUCATION OVERVIEW 261
NORTHERN INLAND BIOREGION.......264 ABOUT THE BIOREGION 265 SUMMARY OF FISHING AND AQUACULTURE ACTIVITIES 265 ECOSYSTEM MANAGEMENT 265 ECOSYSTEM BASED FISHERIES MANAGEMENT 265 FISHERIES 267
Lake Argyle Silver Cobbler Fishery Report: Statistics Only ....................... 267
AQUACULTURE 269 COMPLIANCE & COMMUNITY EDUCATION 269
SOUTHERN INLAND BIOREGION.......269 ABOUT THE BIOREGION 272 SUMMARY OF FISHING AND AQUACULTURE ACTIVITIES 272 ECOSYSTEM MANAGEMENT 272 ECOSYSTEM BASED FISHERIES MANAGEMENT 272
Licensed Recreational Marron Fishery Report: Statistics Only ....................... 275
AQUACULTURE 276 COMPLIANCE AND COMMUNITY EDUCATION 276
STATEWIDE.............................................279
ECOSYSTEM BASED FISHERIES MANAGEMENT 280 FISHERIES 282
Marine Aquarium Fish Managed Fishery Report: Statistics Only........................282 Specimen Shell Managed Fishery Status Report .................................................284
APPENDICES........................................... 287 APPENDIX 1 288
Fisheries Research Division staff publications 2009/10 ..........................288
APPENDIX 2 291 Table of catches from fishers’ statutory monthly returns for 2008/09...............291 Estimated Western Australian Aquaculture Production for 2008/09 ..297
APPENDIX 3 300 Research Division – Other Activities .300 Pemberton Freshwater Research Centre activities 2009/10................................300 Activities of the Fish Health Unit during 2009/10 ...............................................302 Indian Ocean Territories Fishery Status Report .................................................303
APPENDIX 4 308 Annual performance for commercial fisheries subject to export approval under the Australian Government’s Environment Protection and Biodiversity Conservation Act 1999 .......................308
APPENDIX 5 318 Fisheries Research Division staff adjunct positions and Supervision of students 318
GLOSSARY OF ACRONYMS 319
4 DEPARTMENT OF FISHERIES
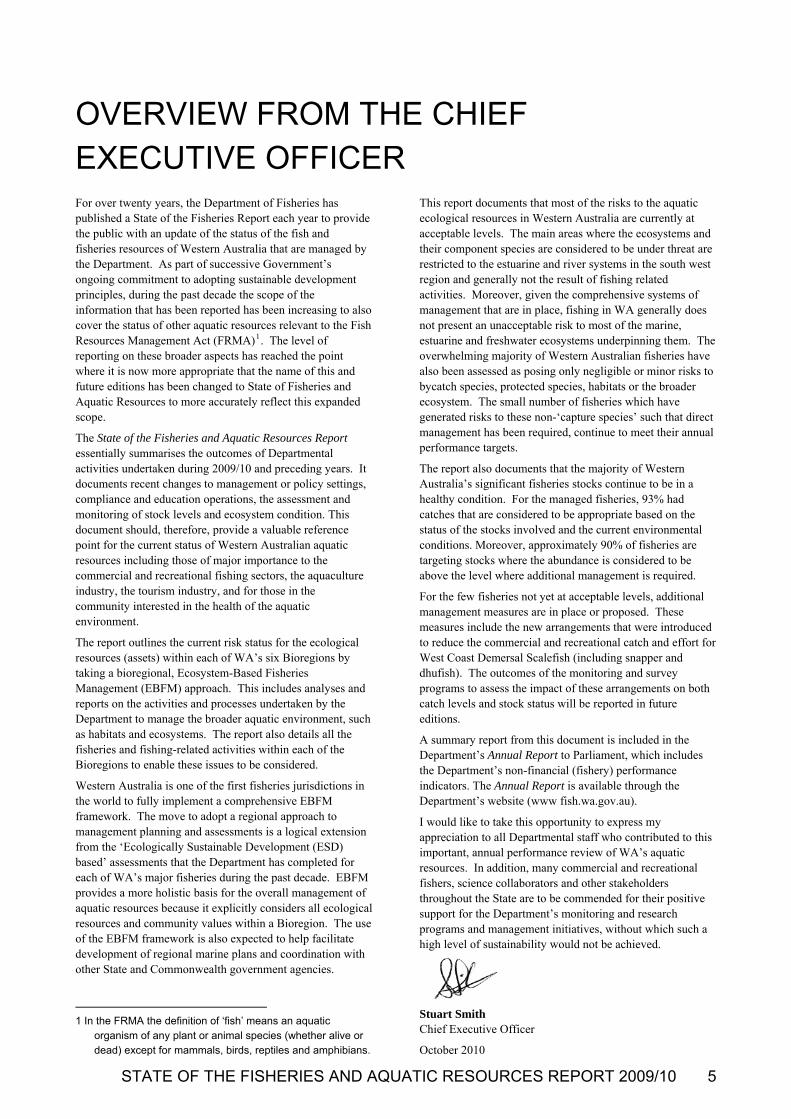
OVERVIEW FROM THE CHIEF EXECUTIVE OFFICER For over twenty years, the Department of Fisheries has published a State of the Fisheries Report each year to provide the public with an update of the status of the fish and fisheries resources of Western Australia that are managed by the Department. As part of successive Government’s ongoing commitment to adopting sustainable development principles, during the past decade the scope of the information that has been reported has been increasing to also cover the status of other aquatic resources relevant to the Fish Resources Management Act (FRMA)1. The level of reporting on these broader aspects has reached the point where it is now more appropriate that the name of this and future editions has been changed to State of Fisheries and Aquatic Resources to more accurately reflect this expanded scope.
The State of the Fisheries and Aquatic Resources Report essentially summarises the outcomes of Departmental activities undertaken during 2009/10 and preceding years. It documents recent changes to management or policy settings, compliance and education operations, the assessment and monitoring of stock levels and ecosystem condition. This document should, therefore, provide a valuable reference point for the current status of Western Australian aquatic resources including those of major importance to the commercial and recreational fishing sectors, the aquaculture industry, the tourism industry, and for those in the community interested in the health of the aquatic environment.
The report outlines the current risk status for the ecological resources (assets) within each of WA’s six Bioregions by taking a bioregional, Ecosystem-Based Fisheries Management (EBFM) approach. This includes analyses and reports on the activities and processes undertaken by the Department to manage the broader aquatic environment, such as habitats and ecosystems. The report also details all the fisheries and fishing-related activities within each of the Bioregions to enable these issues to be considered.
Western Australia is one of the first fisheries jurisdictions in the world to fully implement a comprehensive EBFM framework. The move to adopt a regional approach to management planning and assessments is a logical extension from the ‘Ecologically Sustainable Development (ESD) based’ assessments that the Department has completed for each of WA’s major fisheries during the past decade. EBFM provides a more holistic basis for the overall management of aquatic resources because it explicitly considers all ecological resources and community values within a Bioregion. The use of the EBFM framework is also expected to help facilitate development of regional marine plans and coordination with other State and Commonwealth government agencies.
This report documents that most of the risks to the aquatic ecological resources in Western Australia are currently at acceptable levels. The main areas where the ecosystems and their component species are considered to be under threat are restricted to the estuarine and river systems in the south west region and generally not the result of fishing related activities. Moreover, given the comprehensive systems of management that are in place, fishing in WA generally does not present an unacceptable risk to most of the marine, estuarine and freshwater ecosystems underpinning them. The overwhelming majority of Western Australian fisheries have also been assessed as posing only negligible or minor risks to bycatch species, protected species, habitats or the broader ecosystem. The small number of fisheries which have generated risks to these non-‘capture species’ such that direct management has been required, continue to meet their annual performance targets.
The report also documents that the majority of Western Australia’s significant fisheries stocks continue to be in a healthy condition. For the managed fisheries, 93% had catches that are considered to be appropriate based on the status of the stocks involved and the current environmental conditions. Moreover, approximately 90% of fisheries are targeting stocks where the abundance is considered to be above the level where additional management is required.
For the few fisheries not yet at acceptable levels, additional management measures are in place or proposed. These measures include the new arrangements that were introduced to reduce the commercial and recreational catch and effort for West Coast Demersal Scalefish (including snapper and dhufish). The outcomes of the monitoring and survey programs to assess the impact of these arrangements on both catch levels and stock status will be reported in future editions.
A summary report from this document is included in the Department’s Annual Report to Parliament, which includes the Department’s non-financial (fishery) performance indicators. The Annual Report is available through the Department’s website (www fish.wa.gov.au).
I would like to take this opportunity to express my appreciation to all Departmental staff who contributed to this important, annual performance review of WA’s aquatic resources. In addition, many commercial and recreational fishers, science collaborators and other stakeholders throughout the State are to be commended for their positive support for the Department’s monitoring and research programs and management initiatives, without which such a high level of sustainability would not be achieved.
1 In the FRMA the definition of ‘fish’ means an aquatic
organism of any plant or animal species (whether alive or dead) except for mammals, birds, reptiles and amphibians.
Stuart Smith Chief Executive Officer
October 2010
STATE OF THE FISHERIES AND AQUATIC RESOURCES REPORT 2009/10 5
EDITOR'S INTRODUCTION As outlined in the CEO’s overview, this year’s renamed State of the Fisheries and Aquatic Resources Report 2009/10 reflects that the Department of Fisheries has now fully adopted an Ecosystem Based Fisheries Management (EBFM) framework as the basis for management of Western Australia’s aquatic resources (Fletcher, et al., 20101). Consequently, the format for this document has been updated so that it is consistent with this risk-based approach to resource management.
There is now a section at the beginning of each Bioregion that outlines each of the key ecological resources (assets) for the region and summarises their current risk status. The assets that are examined in each bioregion include each of the
IMCRA2
meso-scale ecosystems plus the key habitats, captured species and protected species categories. There is also a section for the external drivers, such as climate change, coastal development and introduced pests/diseases, which may affect the Department’s ability to effectively manage WA’s aquatic resources.
For each Bioregion there is still a set of individual fishery reports but these are being refocussed to become more resource-based rather than activity (sector)-based. Consequently, each report now contains descriptions of both the commercial and recreational activities that are accessing a particular ecological resource (asset). This has facilitated further consolidation of reports whereby a number of different fisheries accessing the same category of ecological assets are now covered in a single report (e.g. West Coast Nearshore and Estuarine Finfish). This is consistent with taking a Bioregional approach to the management of ecological assets and ensures that the aggregate catch harvested from each stock is clear and shows how it is being shared among fishing sectors. This structure should enable readers to more easily assess the interrelationships between fisheries and their cumulative effect within each Bioregion of the State. This trend will continue over coming years.
The long-standing involvement by our commercial, recreational and aquaculture stakeholders in specific research projects and monitoring programs, such as the provision of logbook data and biological samples, is acknowledged as being essential to the generation of many of the status reports presented in this document. The input from collaborating science groups is also acknowledged. There has been an increasing trend over the past decade for collaborative research projects to be undertaken to assist in the
development of new monitoring and assessment techniques or to help further our understanding of issues that affect management (e.g. determining the causes of the recent low rock lobster puerulus settlement levels).
While the State of the Fisheries and Aquatic Resources Report 2009/10 provides the general public, interested fishers and other stakeholders with a ready reference source, it is also serves the purpose for the Department’s various reporting requirements, including the need to annually report
on the ‘state of fisheries managed under’ the FRMA3
to the Western Australian Parliament and to the Commonwealth Government, on the performance of fisheries under their EPBC Act.
The report is directly accessible on the Department’s website (www fish.wa.gov.au/docs/sof), where users are encouraged to download relevant sections for personal use. If quoting from the document, please give appropriate acknowledgment using the citation provided at the front of the report.
A summary version of this document is also available from the same website.
Finally, I would like to thank all of my Departmental colleagues across all Divisions who have assisted in the production of this volume and its many status reports. Particular thanks are due to Ms Karen Santoro who again had the unenviable job of coordinating the submission of the text from various authors, facilitating internal reviews, managing version control, undertaking the copy editing, final formatting and organising the publication and submission process.
Dr Rick Fletcher Director – Fisheries Research
September 2010
1 W.J. Fletcher, J. Shaw, S.J. Metcalf & D.J. Gaughan
(2010) An Ecosystem Based Fisheries Management framework: the efficient, regional-level planning tool for management agencies. Marine Policy 34 (2010) 1226–1238
2 Commonwealth of Australia (2006) A guide to the Integrated Marine and Coastal Regionalisation of Australia - version 4.0 June 2006 (IMCRA v4.0). http://www.environment.gov.au/coasts/mbp/publications/imcra/pubs/imcra4.pdf
3 Section 263 of the FRMA.
6 DEPARTMENT OF FISHERIES

HOW TO USE THIS VOLUME To obtain full benefit from the information provided in the updated State of Fisheries and Aquatic Resources Report, readers need to understand various terms and headings used in the text and summarised in the fishery status overview table (which also appeared in the Department of Fisheries Annual Report 2009/10 to Parliament) and especially those associated with the newly developed ecological resource level reports.
The terms and headings are a combination of the reporting structures outlined in the national Ecologically Sustainable Development (ESD) reporting structure (Fletcher et al.
2002)1
and the more recent Ecosystem Based Fisheries
Management (EBFM) framework (Fletcher et al., 2010)2
. In addition to the explanations provided below, acronyms are expanded at their first occurrence in a section of the text and are also listed in a glossary at the end of the volume.
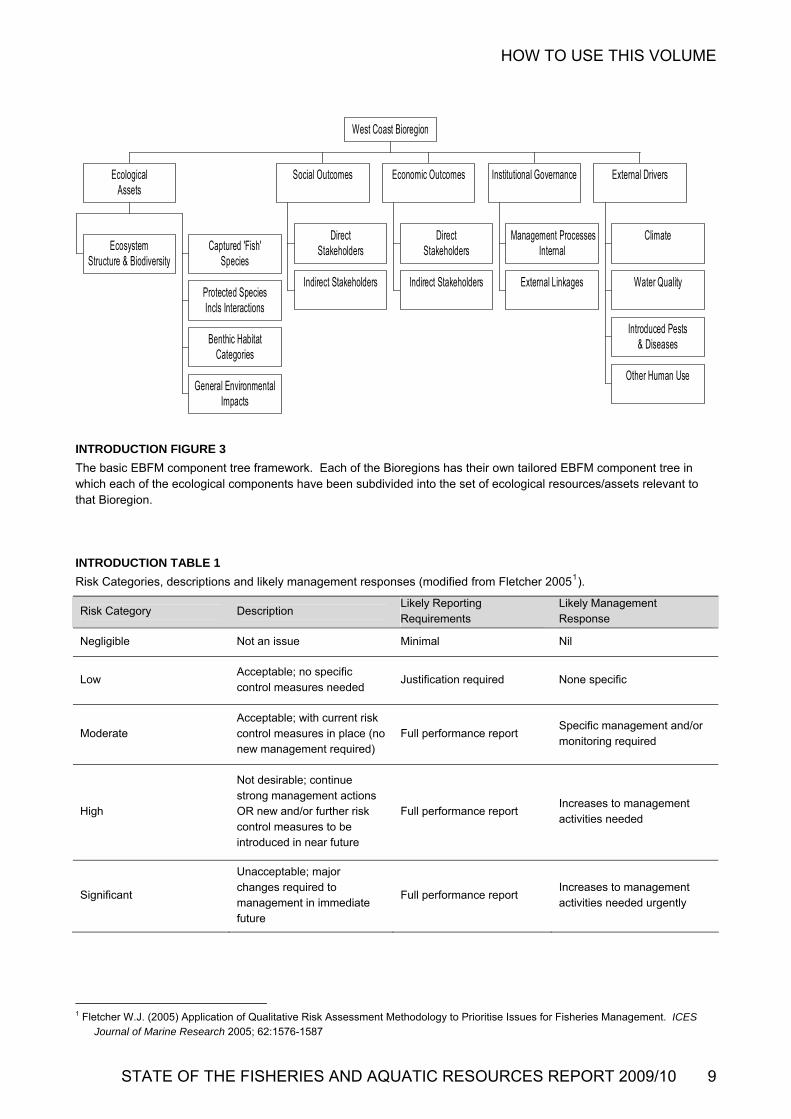
INTRODUCTION FIGURE 2
Map of Western Australia showing the general boundaries of the Bioregions referred to throughout this document and the meso-scale ecosystems based on IMCRA 4.0 boundaries3.
Bioregions INTRODUCTION FIGURE 1
Map of Western Australia showing the general boundaries of the Bioregions referred to throughout this document.
As noted above, with the adoption of the EBFM approach, readers need to note the fully bioregional structure of this report (see Introduction Figure 1). A ‘Bioregion’ refers to a region defined by common oceanographic characteristics in its marine environment and by climate/rainfall characteristics in its inland river systems.
1 Fletcher, W.J., Chesson, J., Fisher, M., Sainsbury, K.J.,
Hundloe, T., Smith, A.D.M. and Whitworth, B. 2002. National ESD reporting framework for Australian fisheries: The ‘how to’ guide for wild capture fisheries. Fisheries Research and Development Corporation (FRDC) project 2000/145, ESD Reporting and Assessment Subprogram, Fisheries Research and Development Corporation, Canberra.
2 Fletcher, W.J., Shaw, J., Metcalf, S.J. & D.J. Gaughan (2010) An Ecosystem Based Fisheries Management framework: the efficient, regional-level planning tool for management agencies. Marine Policy 34 (2010) 1226–1238
The marine bioregional boundaries used here are broadly consistent with those of the A guide to The Integrated Marine and Coastal Regionalisation of Australia - version 4.0 June 2006 (IMCRA v4.0). 3 except for the inclusion of the Gascoyne Coast as a separate Bioregion, reflecting its nature as the transition zone between tropical and temperate waters.
3http://www.environment.gov.au/coasts/mbp/publications/imcr
a/pubs/imcra4.pdf
STATE OF THE FISHERIES AND AQUATIC RESOURCES REPORT 2009/10 7

HOW TO USE THIS VOLUME
The precise boundaries of the Bioregions reflect functional geographic separations and data recording systems. Each individual Bioregion has been provided with a general introduction outlining its aquatic environment, major commercial and recreational fisheries and aquaculture industries and now it also has a section that outlines the current status of each of the high level, ecological resources/assets located within each Bioregion.
Assessment of Regional Level Ecological Resources (Assets) in each Bioregion Consistent with the adoption of the EBFM framework for each bioregion we have identified the high level set of ecological resources/assets that are to be managed under the FRMA (see Introduction Figure 2). The ecological resources/assets in each Bioregion include the ecosystems and their constituent habitats, captured species and protected species. The potential complexity of EBFM is dealt with by using a step-wise, risk-based approach to integrate the individual issues identified and information gathered into a form that can be used by the Department. Similarly, the levels of knowledge needed for each of the issues only need to be appropriate to the risk and the level of precaution adopted by management. Implementing EBFM does not, therefore, automatically generate the need to collect more ecological, social or economic data or require the development of complex ‘ecosystem’ models. Full details of how the EBFM process is undertaken are presented in Fletcher et al1 (2010) with a summary description outlined below.
Ecosystems: Within each Bioregion, one or more ecosystems, as defined by the IMCRA process, were identified with some of these further divided into estuarine and marine ecosystems where relevant.
Habitats: The habitat assets in each Bioregion were at least divided into estuarine and marine categories and again where necessary they were further divided into estuarine, nearshore and offshore components. Captured Fish: The captured fish were subdivided into finfish, crustaceans and molluscs with each of these further divided into estuarine/embayments; nearshore, inshore and offshore demersal and pelagic (finfish only) suites.
Protected Species: This category was subdivided into protected ‘fish’ (e.g. Great White Sharks) and protected ‘non-fish’ as defined in the FRMA (e.g. mammals).
Risk Assessment Status The risks associated with each individual ecological asset are examined separately using formal qualitative risk assessment (consequence x likelihood) or more-simple problem
assessment processes, as detailed in Fletcher (2005, 2010)2
. This enables the analysis of risk (using a five year time horizon) for objectives related to species, habitat and community structure/ecosystem sustainability, plus social and economic outcomes to be completed (Introduction Table 1).
Internationally, risk has now been defined as “the uncertainty
associated with achieving objectives” (ISO, 2009)3
, therefore any uncertainties from a lack of specific data are explicitly incorporated into the assessment enabling the calculation of risk to be completed with whatever data are available. All risk scoring considers the level of current activities and management controls already in place or planned.
Within each Bioregion, the EBFM process identified many individual ecological assets, social, economic and governance issues and their associated risks. This complexity has been addressed by first assessing each of the individual risks and then consolidating these into bioregional or category level risks. The Department’s primary objective is to manage the sustainability of the community’s ecological assets from which economic or social outcomes are generated. Therefore the various ecological, social and economic risks and values associated with each of these ecological assets are integrated using a multi-criteria analysis into approximately 80 Departmental-level priorities distributed across the six Bioregions. These are now the basis of the Departmental Risk Register.
1 W.J. Fletcher, J. Shaw, S.J. Metcalf & D.J. Gaughan (2010)
An Ecosystem Based Fisheries Management framework: the efficient, regional-level planning tool for management agencies. Marine Policy 34 (2010) 1226–1238
2 Fletcher W.J. (2005) Application of Qualitative Risk
Assessment Methodology to Prioritise Issues for Fisheries Management. ICES Journal of Marine Research 2005; 62:1576-1587
Fletcher W.J. (2010) Planning processes for the management of the tuna fisheries of the Western and Central Pacific Region using an Ecosystem Approach. Forum Fisheries Agency, Honiara. Facilitators version 6.1 January 2010, 61pp
3 AS/NZS ISO 31000 (2009) Risk management – Principles
and guidelines. Sydney, Australia: Standards Australia.
8 DEPARTMENT OF FISHERIES
HOW TO USE THIS VOLUME
EcosystemStructure & Biodiversity
Captured 'Fish'Species
Protected SpeciesIncls Interactions
Benthic HabitatCategories
General EnImp
vironmentalacts
EcologicalAssets
DirectStakeholders
Indirect Stakeholders
Social Outcomes
DirectStakeholders
Indirect Stakeholders
Economic Outcomes
Management ProcessesInternal
External Linkages
Institutional Governance
Climate
Water Quality
Introduced Pests& Diseases
Other Human Use
External Drivers
West Coast Bioregion
INTRODUCTION FIGURE 3
The basic EBFM component t Bioregions has their own tailored EBFM component tree in which each of the ecological components have been subdivided into the set of ecological resources/assets relevant to that Bioregion.
INTRODUCTION TABLE 1
Risk Categories, descriptions nt responses (modified from Fletcher 20051).
ree framework. Each of the
and likely manageme
Risk Category Description Likely Reporting Requirements
Likely Management Response
Negligible issue Minimal Nil Not an
Low Acceptable; no specific control measures needed
Justification required None specific
Moderate Acceptable; with current risk control measures in place (no new management required)
Full performance report Specific management and/or monitoring required
High
Not desirable; continue strong management actions OR new and/or further risk control measures to be introduced in near future
Full performance report Increases to management activities needed
Significant
Unacceptable; major changes required to management in immediate future
Full performance report Increases to management activities needed urgently
1 Fletcher W.J. (2005) Application of Qualitative Risk Assessment Methodology to Prioritise Issues for Fisheries Management. ICES
Journal of Marine Research 2005; 62:1576-1587
STATE OF THE FISHERIES AND AQUATIC RESOURCES REPORT 2009/10 9
HOW TO USE THIS VOLUME
Breeding stock status Assessments of breeding stock can be undertaken using a number of techniques. The breeding stock is only directly measured for a small number of stocks. In most cases, the stock assessment methods use indirect measures and indicators.
Adequate: reflects levels of parental biomass of a stock where annual variability in recruitment of new individuals (recruits) to the stock is a function only of environmental effects or recruit survival, not the level of the stock.
Recovering: reflects situations where the parental biomass has previously been depleted to unacceptable levels by fishing or some other event (e.g. the virus attacks on pilchards in the 1990s) but is now recovering at an acceptable rate due to management action and/or natural processes.
Inadequate/declining: reflects situations where excessive fishing pressure (catch) or some external event has caused parental biomass to fall to levels where the breeding stock is depleted to levels that may affect recruitment.
Stock Assessment Method Each report clearly identifies what type of assessment method(s) have been used to determine the status of breeding stocks. The main methods vary from the relatively simple analysis of catch levels and catch rates, through to more sophisticated analyses that involve sampling of the catch (fishing mortality), direct surveys and age structured simulation models.
Non-retained species This refers to any species caught during a fishing operation which are not the target of, and are never retained by the fishing operation. These species can include both unwanted ‘bycatch’ species and interactions with 'protected' species. In each case, an explanation is provided of the situation and the level of risk to the stock from fishing operations.
Ecosystem effects This refers to the indirect impacts of removing fish from the ecosystem, and physical interactions of fishing gear with the sea floor. Each fishery is considered in terms of its effects on the food chain and the habitat, and an assessment of current ecological risk (‘negligible’, ‘low’, ‘moderate’ or ‘high’) is provided.
Target catch (or effort) range Target catch range: the range of annual catches, taking into account natural variations in recruitment to the fished stock, which can be expected under a fishing-effort-based management plan.
Target effort range: the range of annual fishing effort, assuming natural variability in stock abundance, required to achieve a total allowable catch under a catch quota management plan.
Where the annual catch or effort falls outside of this range, and the rise or fall cannot be adequately explained (e.g. environmentally-induced fluctuations in recruitment levels – like prawns), a management review or additional research to assess the cause is generally required.
External factors This refers to known factors outside of the direct control of the fishery legislation which impact on fish stocks or fishing. An understanding of these factors, which are typically environmental (cyclones, ocean currents) but might also include, for example, market factors or coastal development, is necessary to fully assess the performance of the fishery.
Season reported Readers should be aware that the individual fishery and aquaculture production figures relate to the latest full year or season for which data are available, noting the inevitable time-lags involved in collection and analysis. Therefore, the statistics in this volume refer either to the financial year 2008/09 or the calendar year 2009, whichever is the more appropriate. The estimates of the value of the fishery may vary from published estimates of GVP due to differences between financial year and entitlement year for a fishery, estimated value of secondary by products for individual sectors, and estimating the total value of several fisheries operating on a single resource.
Similarly, the statistics on compliance and educational activities are also for 2008/09, following the analysis of data submitted by Fisheries and Marine Officers.
In contrast, the sections on departmental activities in the areas of fishery management and new compliance activities are for the current year, and may include information up to June 2010.
Performance measures Many of the State’s significant fisheries have now undergone assessment and achieved environmental certification under the Commonwealth Government’s Environment Protection and Biodiversity Conservation Act 1999 (EPBC Act). Consequently, the State of Fisheries and Aquatic Resources Report also reports on the ecological performance of the relevant fisheries against the specific performance measures used or developed during the EPBC Act assessment process. These may vary among future editions as EPBC conditions change and individual fisheries determine the need and value of maintaining and resourcing such accreditation.
Within the individual fishery status reports, each of these performance measures is shown in a highlighted box to assist the reader. The results are also summarised in Appendix 4.
Common fish names The common names of a small number of fish species may have changed in this volume. Where this has occurred, a reference is included to the common name formerly used for the same species. This situation reflects an initiative of the seafood sector to standardise marketing names across Australia, and it is likely that further changes will occur in future volumes.
10 DEPARTMENT OF FISHERIES

OVERVIEW OF THE STATUS OF KEY FISHERIES AND STOCKSAnnual stock assessments, including analyses of trends in catch and fishing activity, are used each year to determine the status of each of the State’s most significant fisheries and are presented in detail in the rest of this document. This section provides an overview of the outcomes of the Department’s management systems by collectively examining the status of all the commercial fisheries and commercially harvested fish stocks in WA. The material presented in this section is based on the analyses and text presented in the Key Performance Indicators section of the Department of Fisheries Annual Report to the Parliament 2009/10.
The proportion of fish stocks identified as being at risk or vulnerable through exploitation To measure the performance of management, the proportion of fisheries for which the breeding stocks of each of their major target or indicator species are being maintained at acceptable levels (or they are now recovering from a depleted state at an appropriate rate following management intervention), is measured annually.
For 2009/10, 36 fisheries had breeding stock assessments completed (see Overview Table 1). Within this group of 36 assessed fisheries, 30 involve stocks that were considered to have adequate breeding stock levels (83 per cent of fisheries). Two additional fisheries have breeding stocks considered to be recovering at acceptable rates (Shark Bay Snapper Fishery, Cockburn Sound Crab Fishery). Thus, while the crab stock within Cockburn Sound was still too low to open the fishery in 2008/09, it has continued to improve to the point where it will be open for the 2009/10 season.
In conclusion, a combined total of 89 per cent of fisheries have breeding stock management that is considered satisfactory (Overview Figure 1) this is an increase on the level that was measure in 2008/09 and continues an upward trend from the low point measured in 07/08.
For three of the remaining fisheries, the Temperate Shark Fishery (composed of the Southern and Western demersal gillnet and longline fisheries), the West Coast Demersal
Scalefish Fishery and the Tropical Shark Fishery (composed of the North Coast and Northern shark fisheries), all have stocks considered to be depleted. Finally, the south coast herring fishery continues to have an uncertain status.
For the southern shark fishery, two of the four target species (dusky whaler and sandbar) have breeding stock levels that will continue to be below acceptable levels for some time due to previous fishing activities (i.e. not from current fishing impacts). While previous management interventions should now be generating a recovery of both dusky and sandbar stocks this will need to be confirmed before their stock status can be revised.
The new set of management arrangements which were introduced for the West Coast Demersal Scalefish Fishery over the past 18 months were designed to reduce the total level of fishing mortality and catch on these stocks by 50 per cent. These levels of reductions are expected to be sufficient to initiate stock recovery. The catches of this suite by the commercial sector (line fishery and the net fishery) have already been reduced to be below the target levels. Management interventions to generate comparable reductions in the recreational and charter sector catches have also been introduced but their impact on the annual catch cannot be fully determined until they have been in place for over 12 months. Monitoring of the status of the indicator species and the catches taken by all three sectors is currently underway to determine if the current set of management arrangements are delivering the required reductions in catch and fishing mortality.
In the Northern Shark Fishery, whilst there has been a significant reduction in effort, the impacts on the breeding stock from previous activities will also continue to affect the recruitment to the breeding stock and catches of one of the target species remain above target levels.
New research has begun on the stocks of herring in the south-west region to determine whether the recent low catch levels are a result of changes to environmental conditions or a reduction in the breeding stock leading to lowered recruitment, or reduced fishing effort, or some combination of the above.
STATE OF THE FISHERIES AND AQUATIC RESOURCES REPORT 2009/10 11

OVERVIEW
8682 82
87
7774
92 93 9188 88
79 77
8689
0
20
40
60
80
100
1995/96
1996/9
7
1997/98
1998/9
9
1999/00
2000/0
1
2001/02
2002/0
3
2003/0
4
2004/05
2005/0
6
2006/07
2007/0
8
2008/09
2009/1
0
YEAR
PE
RC
EN
TA
GE
OVERVIEW FIGURE 1
The proportion (%) of commercial fisheries where breeding stocks of the major target species are both assessed and either adequate or recovering adequately to levels to ensure catches can be sustained at maximum levels within the range expected under typical environmental conditions.
The proportion of commercial fisheries where acceptable catches (or effort levels) are achieved A target catch or effort range has also been determined for each of the major commercial fisheries (see Overview Table 1). This indicator provides an assessment of the success of the Department’s management plans and regulatory activities in keeping fish catches at appropriate levels (including those in a recovery phase).
For most of the fisheries in WA, each management plan seeks to directly control the amount of fishing effort applied to stocks, with the level of catch taken providing an indication of the effectiveness of the plan. Where the plan is operating effectively, the catch by the fishery should fall within a projected range. The extent of this range reflects the degree to which normal environmental variations affect the recruitment of juveniles to the stock which cannot be ‘controlled’ by the management plan.
For quota-managed fisheries, the measure of success for the management arrangements is firstly that most of the Total Allowable Catch (TAC) is achieved, but additionally, that it has been possible to take this catch using an acceptable amount of fishing effort. If an unusually large expenditure of effort is needed to take the TAC, or the industry fails to
achieve the TAC by a significant margin, this may indicate that the abundance of the stock is significantly lower than anticipated. For these reasons, an appropriate range of fishing effort to take the TAC has also been incorporated for assessing the performance of quota-managed fisheries (see Overview Table).
Comparisons between the actual catches (or effort) with the target ranges have been undertaken for 30 of the 38 fisheries referred to in Overview Table 1. The fisheries for which there are target ranges account for most of the commercial value of WA’s landed catch. The fisheries where ranges are unavailable include the four pilchard fisheries which are still rebuilding following an exotic virus attack and the effort levels to take the current quotas have not been established. For the mackerel and deep-sea crab fisheries, effort ranges are not yet available so catch ranges will continue to be used. Finally, some fisheries had negligible fishing activity for economic reasons and were therefore not assessed.
Of the 30 fisheries where ‘target ranges’ were available and a material level of fishing was undertaken in 2008/09, six were catch-quota managed [through a TAC allocated through Individually Transferable Quotas (ITQ)] with 24 subject to effort control management (including those with individually transferable effort ‘quotas’ or ITEs).
All of the ITQ-managed fisheries operated within their target effort/catch ranges or were acceptably below the effort range
12 DEPARTMENT OF FISHERIES

OVERVIEW
(Roe’s abalone, pearl oysters). In the 24 effort-controlled fisheries, 22 produced catches that were within (14) or acceptably above (3) or below (5) their target catch ranges. The two fisheries identified where the catch levels were considered to be problematic were the Pilbara trawl fishery and the Northern Shark Fishery. Recent catches have been declining in the Pilbara trawl fishery and there are some questions whether this is due to reduced gear efficiencies following the introduction of protected species bycatch
reduction devices or changes to stock levels. In addition, the catch of sandbar sharks in the Northern Shark Fishery exceeded what is considered to be the appropriate level.
In summary, 28 (93 per cent) of the 30 fisheries assessed were considered to have met their performance criteria, or were affected by factors outside the purview of the management plan/arrangements (Overview Figure 2). This continues the high percentage (> 90%) of fisheries that have met this performance target in the last three years.
92 9296
91 9196 96
93
90
100
87 89 89
81 79 80 80
0
10
20
30
40
50
60
70
80
1995/9
6
1996/97
1997/9
8
1998/99
1999/0
0
2000/0
1
2001/02
2002/0
3
2003/04
2004/0
5
2005/0
6
2006/07
2007/0
8
2008/09
2009/1
0
YEAR
PE
RC
EN
TA
GE
OVERVIEW FIGURE 2
The proportion (%) of commercial fisheries where the catch or effort reported is acceptable relevant to the target management range being applied.
STATE OF THE FISHERIES AND AQUATIC RESOURCES REPORT 2009/10 13
OVERVIEW
OVERVIEW TABLE Stock Status, Catch & Effort Ranges for the Major Commercial Fisheries
NA - Not assessed, Q - Quota management, TAC - Total Allowable Catch, TACC - Total Allowable Commercial Catch
Fishery/ Resource
Stock assessment method
Breeding stock performance measures/limits
Breeding stock assessment
Target catch (and effort) range in tonnes (days)
Catch (tonnes) and Effort (days/hours) for season reported - 2008/09 or 2009
Catch (or effort) level acceptable and explanation if needed
WEST COAST BIOREGION
West coast rock lobster
Length Based Population Dynamics Model
> early 1980s level
Adequate 7,800 catch limit for 08/09 season
7,595 t (includes Windy Harbour and Augusta)
Acceptable. Catch limits introduced to ensure breeding stock is maintained despite recent low puerulus settlements.
Roe’s abalone
Catch Rates & Direct Survey
Effort (by zone) remains < maximum
Adequate 101.8 (Q) (620 – 750 days)
92.8 t (554 days)
Acceptable. Low effort due to increased fishing efficiency not increased stock.
Octopus Catch Rates CPUE > 70kg/day
Adequate 50 - 250 71 t Acceptable.
Abrolhos Islands and mid west trawl
Direct Survey & Catch Rates
Fishing ceases at catch rate threshold.
Adequate 95 – 1,830
0
Surveys indicated low abundance and small meat size and poor quality so season did not open.
Cockburn Sound crab
Direct Survey Residual stock above threshold
Recovering Not Applicable
0
The fishery remained closed for 2008/09 due to insufficient recovery of the breeding stock.
Deep sea crab
Catch & Catch Rate
Catch range Adequate 140 (Q) 138 t Acceptable
Estuarine fisheries (west coast)
No NA NA 75 – 220 (Peel-Harvey only)
104 t Acceptable
West coast beach bait
Catch Catch range Adequate 60 – 275 (whitebait only)
131 t Acceptable
West coast purse seine
Catch Acceptable catch range
Adequate 3,000 (Q) 45 t NA
14 DEPARTMENT OF FISHERIES
OVERVIEW
Fishery/ Resource
Stock assessment method
Breeding stock performance measures/limits
Breeding stock assessment
Catch (tonnes) Target catch (and effort) range in tonnes (days)
and Effort Catch (or effort) (days/hours) for level acceptable season reported and explanation if - 2008/09 or needed 2009
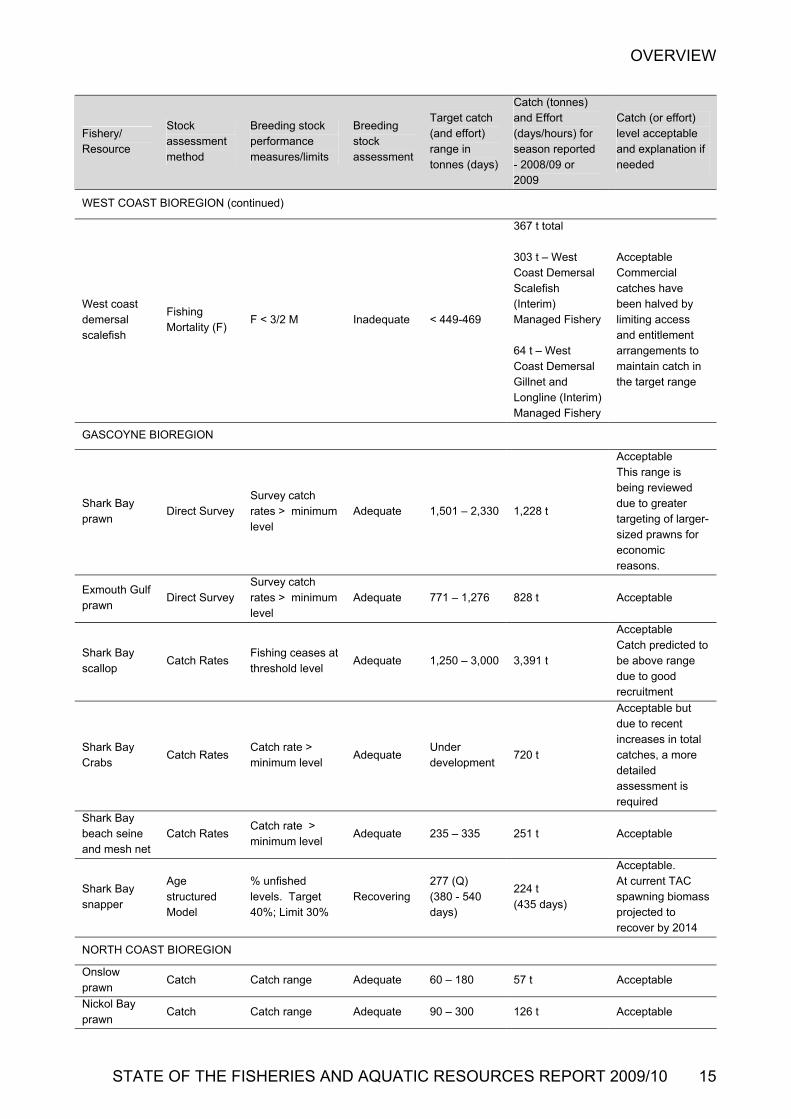
WEST COAST BIOREGION (continued)
West coast demersal scalefish
Fishing Mortality (F)
F < 3/2 M Inadequate < 449-469
367 t total 303 t – West Coast Demersal Scalefish (Interim) Managed Fishery 64 t – West Coast Demersal Gillnet and Longline (Interim) Managed Fishery
Acceptable Commercial catches have been halved by limiting access and entitlement arrangements to maintain catch in the target range
GASCOYNE BIOREGION
Shark Bay prawn
Direct Survey Survey catch rates > minimum level
Adequate 1,501 – 2,330 1,228 t
Acceptable This range is being reviewed due to greater targeting of larger-sized prawns for economic reasons.
Exmouth Gulf prawn
Direct Survey Survey catch rates > minimum level
Adequate 771 – 1,276 828 t Acceptable
Shark Bay scallop
Catch Rates Fishing ceases at threshold level
Adequate 1,250 – 3,000 3,391 t
Acceptable Catch predicted to be above range due to good recruitment
Shark Bay Crabs
Catch Rates Catch rate > minimum level
Adequate Under development
720 t
Acceptable but due to recent increases in total catches, a more detailed assessment is required
Shark Bay beach seine and mesh net
Catch Rates Catch rate > minimum level
Adequate 235 – 335 251 t Acceptable
Shark Bay snapper
Age structured Model
% unfished levels. Target 40%; Limit 30%
Recovering 277 (Q) (380 - 540 days)
224 t (435 days)
Acceptable. At current TAC spawning biomass projected to recover by 2014
NORTH COAST BIOREGION
Onslow prawn
Catch Catch range Adequate 60 – 180 57 t Acceptable
Nickol Bay prawn
Catch Catch range Adequate 90 – 300 126 t Acceptable
STATE OF THE FISHERIES AND AQUATIC RESOURCES REPORT 2009/10 15

OVERVIEW
Fishery/ Resource
Stock assessment method
Breeding stock performance measures/limits
Breeding stock assessment
Catch (tonnes) Target catch (and effort) range in tonnes (days)
and Effort Catch (or effort) (days/hours) for level acceptable season reported and explanation if - 2008/09 or needed 2009
NORTH COAST BIOREGION (continued)
Broome prawn
Catch Catch range Adequate 55 – 260 Negligible NA Very little effort this season
Kimberley prawn
Catch Catch range Adequate 240 – 500 238 t Acceptable
Kimberley gillnet and barramundi
Catch Rates Rates > minimum level
Adequate 25 – 40 (barramundi)
60 t
Acceptable Catches have increased due to increased effort. An assessment of these stocks will begin shortly.
Northern demersal scalefish
Age structured Model
% unfished levels. Target 40%; Limit 30%
Adequate
Total 600 – 1,000 (goldband <485) (red emperor <212)
Total 1,046 t (goldband 485) (red emperor 156)
Acceptable
Pilbara fish trawl
Age structured Model
% unfished levels. Target 40%; Limit 30%
Adequate 2,000 – 2,800 1,044 t
Not Acceptable Reduced catch may be due to 20 per cent reduction effort in Areas 1 and 2 and new net designs to deal with protected species issues. Formal analysis is required
Pilbara demersal trap and line
Age structured Model
% unfished levels. Target 40%; Limit 30%
Adequate
400 – 600 (trap) 50 – 115 (line)
455 t (trap) 123 t (line)
Acceptable The line catch increased due to higher catches of ruby snapper in offshore waters.
Mackerel Catch Catch range Adequate
410 (Q) 246 - 410 (all except grey mackerel)
284 t Acceptable
Tropical shark
Demographic and Catch
Under review Depleted/ Uncertain
< 20 (sandbar)
Less than three licences operated.
Not Acceptable The catch of sandbar sharks exceeds limit.
Pearl oyster Fished Area & Catch Rates
Area < 60% Rates > min.
Adequate
1,060,400 oysters (Q) (14,071 – 20,551 dive hours)
260,002 oysters (3,284 dive hours)
Acceptable Only 25 % of TAC caught due to uncertainty regarding global pearl markets
Beche-de-mer
Catch and Catch Rate
Catch range Adequate 50 – 150 129 t Acceptable
16 DEPARTMENT OF FISHERIES
OVERVIEW
STATE OF THE FISHERIES AND AQUATIC RESOURCES REPORT 2009/10 17
Fishery/ Resource
Stock assessment method
Breeding stock performance measures/limits
Breeding stock assessment
Target catch (and effort) range in tonnes (days)
Catch (tonnes) and Effort (days/hours) for season reported - 2008/09 or 2009
Catch (or effort) level acceptable and explanation if needed
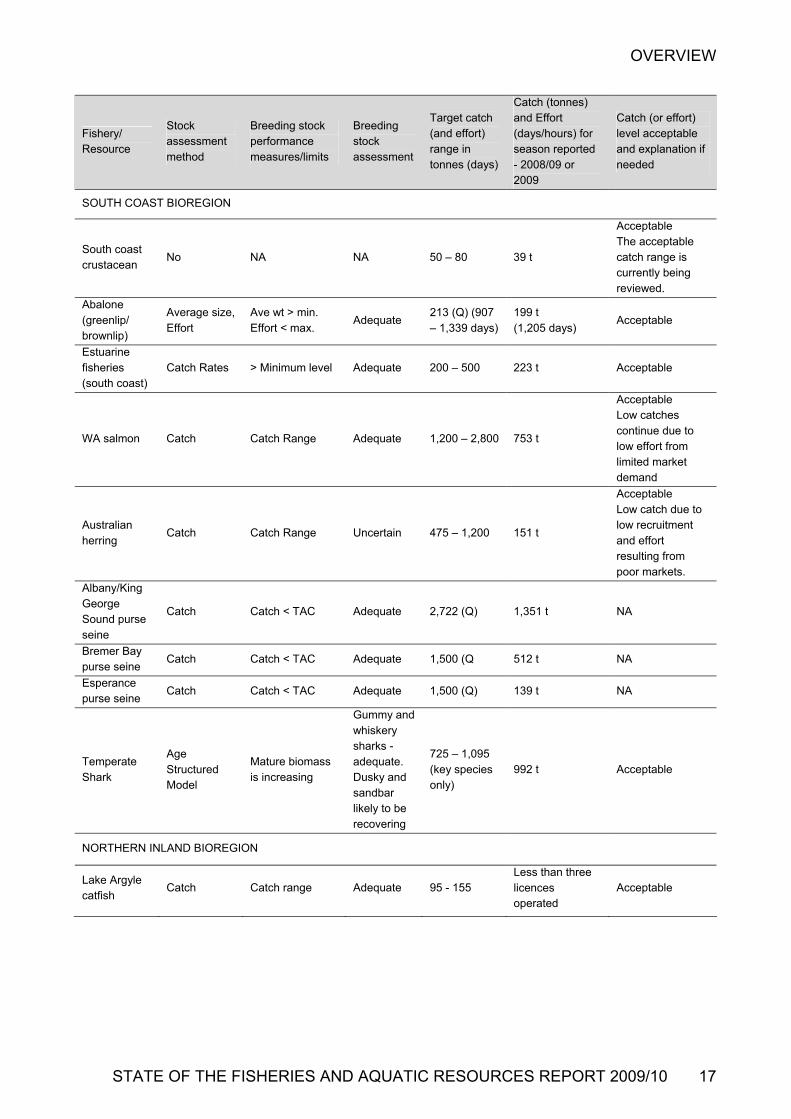
SOUTH COAST BIOREGION
South coast crustacean
No NA NA 50 – 80 39 t
Acceptable The acceptable catch range is currently being reviewed.
Abalone (greenlip/ brownlip)
Average size, Effort
Ave wt > min. Effort < max.
Adequate 213 (Q) (907 – 1,339 days)
199 t (1,205 days)
Acceptable
Estuarine fisheries (south coast)
Catch Rates > Minimum level Adequate 200 – 500 223 t Acceptable
WA salmon Catch Catch Range Adequate 1,200 – 2,800 753 t
Acceptable Low catches continue due to low effort from limited market demand
Australian herring
Catch Catch Range Uncertain 475 – 1,200 151 t
Acceptable Low catch due to low recruitment and effort resulting from poor markets.
Albany/King George Sound purse seine
Catch Catch < TAC Adequate 2,722 (Q) 1,351 t NA
Bremer Bay purse seine
Catch Catch < TAC Adequate 1,500 (Q 512 t NA
Esperance purse seine
Catch Catch < TAC Adequate 1,500 (Q) 139 t NA
Temperate Shark
Age Structured Model
Mature biomass is increasing
Gummy and whiskery sharks - adequate. Dusky and sandbar likely to be recovering
725 – 1,095 (key species only)
992 t Acceptable
NORTHERN INLAND BIOREGION
Lake Argyle catfish
Catch Catch range Adequate 95 - 155 Less than three licences operated
Acceptable

WEST COAST BIOREGION ABOUT THE BIOREGION 19SUMMARY OF FISHING AND AQUACULTURE ACTIVITIES 19ECOSYSTEM MANAGEMENT 19ECOSYSTEM BASED FISHERIES MANAGEMENT 21FISHERIES 28AQUACULTURE 95COMPLIANCE AND COMMUNITY EDUCATION 95
18 DEPARTMENT OF FISHERIES

WEST COAST BIOREGION
WEST COAST BIOREGION
ABOUT THE BIOREGION The marine environment of the West Coast bioregion between Kalbarri and Augusta is predominantly a temperate oceanic zone, and is heavily influenced by the Leeuwin Current, which transports warm tropical water southward along the edge of the continental shelf. The fish stocks of the region are typically temperate, in keeping with the coastal water temperatures that range from 18°C to about 24°C. The Leeuwin Current is also responsible for the existence of the unusual Abrolhos Islands coral reefs at latitude 29° S and the extended southward distribution of many tropical species along the west and south coasts.
The Leeuwin Current system, up to several hundred kilometres-wide along the west coast, flows most strongly in autumn/winter (April to September) and has its origins in ocean flows from the Pacific through the Indonesian archipelago. The current is variable in strength from year-to-year, flowing at speeds typically around 1 knot, but has been recorded at 3 knots on occasions. The annual variability in current strength is reflected in variations in Fremantle sea levels, and is related to El Niño or Southern Oscillation events in the Pacific Ocean.
Weaker counter-currents on the continental shelf (shoreward of the Leeuwin Current), such as the Capes Current that flows northward from Cape Leeuwin as far as Shark Bay, occur during summer and influence the distribution of many of the coastal finfish species.
The most significant impact of the clear, warm, low-nutrient waters of the Leeuwin Current is on the growth and distribution of the temperate seagrasses. These form extensive meadows in protected coastal waters of the West Coast Bioregion, generally in depths of 20m (but up to 30 m), and act as major nursery areas for many fish species and particularly for the western rock lobster stock.
The west coast is characterised by exposed sandy beaches and a limestone reef system that creates surface reef lines, often about 5 kilometres off the coast. Further offshore, the continental shelf habitats are typically composed of coarse sand interspersed with low limestone reef associated with old shorelines. There are few areas of protected water along the west coast, the exceptions being within the Abrolhos Islands, the leeward sides of some small islands off the mid-west coast, plus behind Rottnest and Garden Islands in the Perth metropolitan area.
The major significant marine embayments of the west coast are Cockburn Sound and Geographe Bay. Beyond Cape Naturaliste, the coastline changes from limestone to predominantly granite and becomes more exposed to the influences of the Southern Ocean. Along the west coast, there are 4 significant estuarine systems – the Swan/Canning, Peel/Harvey and Leschenault estuaries and Hardy Inlet (Blackwood estuary). All of these are permanently open to the sea and form an extension of the marine environment except when freshwater run-off displaces the oceanic water for a short period in winter and spring.
SUMMARY OF FISHING AND AQUACULTURE ACTIVITIES The principal commercial fishery in this region is the western rock lobster fishery which is Australia’s most valuable single-species wild capture fishery. There are also significant commercial fisheries for other invertebrates including scallops, abalone, blue swimmer crabs and octopus. Commercial fishers take a range of finfish species including sharks, dhufish, snapper, baldchin groper and emperors using demersal line and net methods. Beach based methods such as beach seining and near-shore gillnetting, and hand-hauled nets are used to capture whitebait, mullet and whiting in a restricted number of locations.
The West Coast bioregion, which contains the state’s major population centres, is the most heavily used bioregion for recreational fishing (including charter based fishing). The range of recreational fishing opportunities includes estuarine fishing, beach fishing and boat fishing either in embayments or offshore for demersal and pelagic/game species often around islands and out to the edge of the continental shelf.
The principal aquaculture development activities in the West Coast Bioregion are the production of blue mussels (Mytilus edulis) and marine algae (Dunaliella salina) for beta-carotene production, and the emerging black pearl industry based on the production of Pinctada margaritifera at the Abrolhos Islands. The main mussel farming area is in southern Cockburn Sound, where conditions are sheltered and the nutrient and planktonic food levels are sufficient to promote good growth rates. Owing to the generally low productivity of the Western Australian coastline under the influence of the Leeuwin Current, areas outside embayments (where nutrient levels are enhanced) are unsuitable for bivalve aquaculture.
ECOSYSTEM MANAGEMENT The marine benthic habitats and their associated biodiversity are largely protected along most of the West Coast from any physical impact of commercial fishing due to the extensive closures to trawling. These closures inside 200m depth were introduced in the 1970s and 1980s, in recognition of the significance of extensive areas of seagrass and reef as fish habitat (West Coast Ecosystem Management, Figure 1). The extent of these areas means that over 50% of the West Coast Bioregion inside 200 m depth could be classified as a marine protected area with an IUCN category of IV (Ecosystem
Management Table 1; as per Dudley, 2008).1
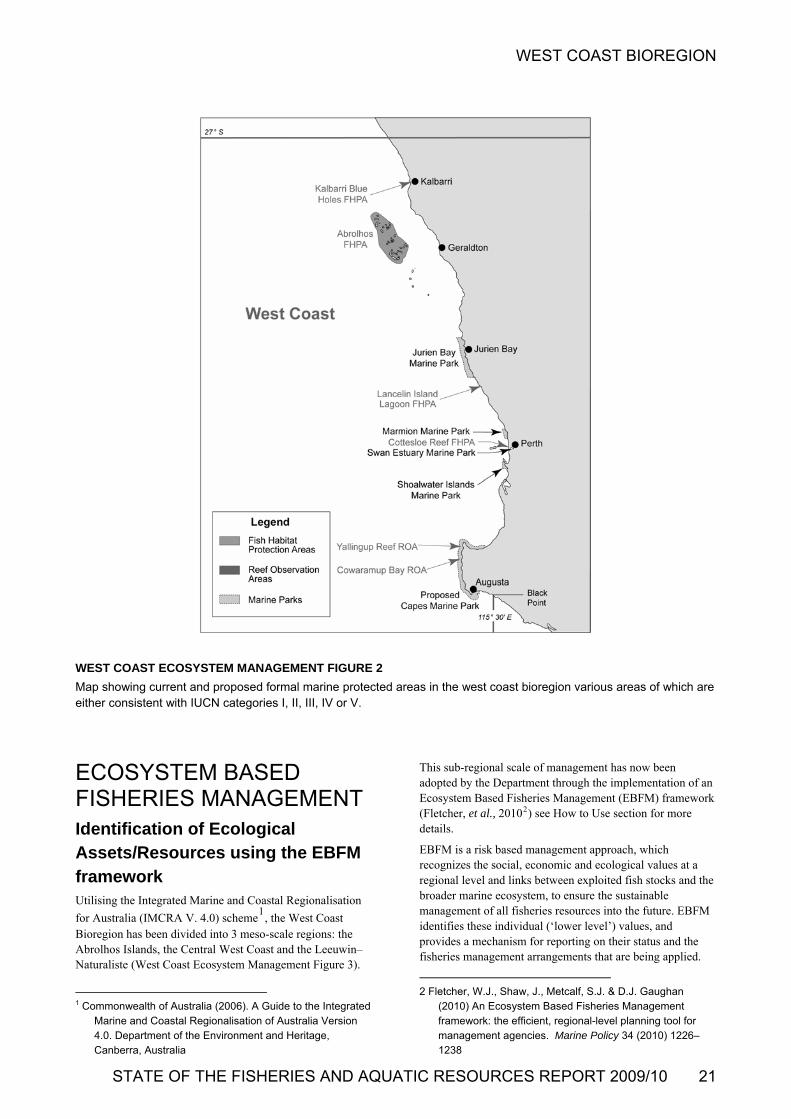
Protection of fish habitat and biodiversity is also provided by marine protected areas consistent with IUCN categories of I, II and III along the west coast including:
1 Dudley, N. (editor) (2008) Guidelines for applying protected
area management categories. IUCN, Gland, Switzerland.
STATE OF THE FISHERIES AND AQUATIC RESOURCES REPORT 2009/10 19
WEST COAST BIOREGION
Fish Habitat Protection Areas (FHPAs) at the Abrolhos Islands, Lancelin Island Lagoon, Cottesloe Reef, and Kalbarri Blueholes; Reef Observation Areas within the Abrolhos Islands FHPA and closures to fishing under s.43 of the Fish Resources Management Act 1994 at Yallingup Reef, Cowaramup Bay, the Busselton Underwater Observatory, and around the wrecks of the Saxon Ranger (Shoalwater Bay) and
Swan (Geographe Bay); and marine conservation areas proclaimed under the Conservation and Land Management Act 1984 at Jurien Bay, Marmion, Swan Estuary, Shoalwater Islands, and the proposed Capes Marine Park between Cape Leeuwin and Cape Naturaliste (West Coast Ecosystem Management, Figure 2).
WEST COAST ECOSYSTEM MANAGEMENT TABLE 1
The areas and proportions of the West Coast Bioregion making up continental shelf waters (< 200 m depth) where habitats are protected from the physical disturbance of trawl fishing. The areas which are formally closed to trawling would be equivalent to meet the IUCN criteria for classification as marine protected areas as category IV. The area of habitat effectively protected refers to the area where trawling doesn’t occur.
Total Area of Shelf
Area of shelf equivalent to IUCN marine protected area <= category IV (%)
Maximum area of actual trawling activity
Total area of habitat effectively protected (%)
19600 sq nm 11000 sq nm
(56%) 300 sq nm
19300 sq nm (98%)
The Australian Government’s Department of Environment, Water Heritage and the Arts (DEWHA) is also undertaking a Marine Bioregional Planning process for Commonwealth waters between Kangaroo Island, South Australia and Shark
Bay. The draft South West Marine Bioregional Plan (MBP) was due for release in late 2009, and will include further proposed marine protected areas within the Commonwealth waters.
WEST COAST ECOSYSTEM MANAGEMENT FIGURE 1
Map showing areas of permanent and extended seasonal closures to trawl fishing in the west coast bioregion. The areas permanently closed are consistent with IUCN marine protected area category IV.
20 DEPARTMENT OF FISHERIES
WEST COAST BIOREGION
WEST COAST ECOSYSTEM MANAGEMENT FIGUR
Map showing current and proposed formal marine proteceither consistent with IUCN categories I, II, III, IV or V.
E 2
ted areas in the west coast bioregion various areas of which are
cological BFM
rine and Coastal Regionalisation
for Australia (IMCRA V. 4.0) scheme1
, the West Coast Bioregion has been divided into 3 meso-scale regions: the Abrolhos Islands, the Central West Coast and the Leeuwin–Naturaliste (West Coast Ecosystem Management Figure 3).
ECOSYSTEM BASED FISHERIES MANAGEMENT Identification of EAssets/Resources using the Eframework
Utilising the Integrated Ma
1 Commonwealth of Australia (2006). A Guide to the Integrated
Marine and Coastal Regionalisation of Australia Version 4.0. Department of the Environment and Heritage, Canberra, Australia
This sub-regional scale of management has now been adopted by the Department through the implementation of an Ecosystem Based Fisheries Management (EBFM) framework (Fletcher, et al., 20102) see How to Use section for more details.
EBFM is a risk based management approach, which recognizes the social, economic and ecological values at a regional level and links between exploited fish stocks and the broader marine ecosystem, to ensure the sustainable management of all fisheries resources into the future. EBFM identifies these individual (‘lower level’) values, and provides a mechanism for reporting on their status and the fisheries management arrangements that are being applied.
2 Fletcher, W.J., Shaw, J., Metcalf, S.J. & D.J. Gaughan
(2010) An Ecosystem Based Fisheries Management framework: the efficient, regional-level planning tool for management agencies. Marine Policy 34 (2010) 1226–1238
STATE OF THE FISHERIES AND AQUATIC RESOURCES REPORT 2009/10 21

WEST COAST BIOREGION
The West Coast was the first bioregion where the EBFM process, including the comprehensive risk assessment of each of the ecological assets was applied (see West Coast Ecosystem Management Table 2).
In terms of ecological assets (= resources), the Department utilises the following categories for the three IMCRA regions within the West Coast Bioregion:
Ecosystem structure and biodiversity (on a meso-scale basis – subdivided into marine, estuarine/embayments);
Captured fish species
Protected species (direct impact – capture or interaction);
Benthic habitat; and
External impacts.
For some issues a finer level of division of the IMCRA ecosystems is used by the Department. This relates to recent management initiatives necessary to recognise different suites of exploited fish and invertebrates across the continental shelf. These sub-components are defined by depth contours (Estuarine/Nearshore 0-20m; Inshore 20-250m; Offshore >250m). The full set of ecological assets identified for ongoing monitoring are presented in West Coast Ecosystem Management Figure 4.
WEST COAST ECOSYSTEM MANAGEMENT FIGURE 3
Map showing the three main IMCRA ecosystems in the West Coast Bioregion: the Abrolhos Is.; the Central West Coast; the Leeuwin-Naturaliste.
Note- This is based on Map 2 in IMCRA v4.0.
22 DEPARTMENT OF FISHERIES

WEST COAST BIOREGION
MarineEstuaries/Embayments
CentralWest Coast
Marine
Abrolhos
MarineEstuaries
LeeuwinNaturaliste
Ecosystems
EstuaEmbay
ries &ments
Nearshore
Shelf
Slope
Habitats
EstuarineNearshoreInshore DemersalOffshore DemersalPelagic
Finfish
Estuarine/NearshoreInshore Demersal
C srustacean
Nearshore
Molluscs
Captured Species
Fish
Non 'Fish'
Protected Species
West Coas ioregionEcological Resources/Assets
t B
EST COAST ECOSYSTEM MANAGEMENT FIGURE 4
omponent tree showing the ecological assets identified and separately assessed for the West Coast Bioregion.
Risk Assessment of Regional Ecological Assets
The EBFM process identifies the ecological assets in a hierarchical manner such that the assets outlined Figure 4 are often made up of individual components at species or stock level. The risks to each of the individual stock or lower level components are mostly detailed in the individual fishery reports presented in this document. The following table (West Coast Ecosystem Management Table 2) provides an overview and cumulative assessment of the current risks to
the ecological assets of the West Coast Bioregion, at a bioregional level and provides a mechanism for reporting on their status and the fisheries management arrangements that are being applied. These bioregional level risks are now used by the Department as a key input into the Department’s Risk Register which, combined with an assessment of the economic and social values and risks associated with these assets, is integral for use in the annual planning cycle for assigning priorities for activities across all Divisions in this Bioregion.
W
C
STATE OF THE FISHERIES AND AQUATIC RESOURCES REPORT 2009/10 23

WEST COAST BIOREGION
WEST COAST ECOSYSTEM MANAGEMENT TABLE 2 - ANNUAL UPDATE OF RISK LEVELS FOR EACH WEST COAST ECOLOGICAL ASSET.
Risk levels in this Table are developed by combining the risks of lower level elements (usually indicator species) that make up each of these higher level (regional) components. Low and Moderate values are both considered to be acceptable levels of risk, whereby Moderate Risks will generally have some level of directed management actions associated with these which will be outlined in the detailed reports in the rest of the West Coast section. High and Significant risks indicate that the asset is no longer in a condition that is considered acceptable and additional management actions are required by the Department except where the value is followed by (non-fishing) this indicates that all, or the majority of the risk value, was not generated by fishing or related activities but by activities managed by other agencies.
Ecosystem Structure and Biodiversity
Ecosystem Aquatic
zone Risk Status and Current Activities
Abrolhos Islands
Marine MODERATE
The Abrolhos Islands are protected within a ‘Fish Habitat Protection Area’, and are not considered to be at unacceptable risk from fisheries related activities. There are a number of research programs Including monitoring of the health of coral communities at the Abrolhos Islands. This program, which utilises permanent transects located at each of the island groups collected important baseline information on coral communities, allowing researchers to quantify whether lobster fishing with pots results in damage to sensitive coral habitats, and to determine the vulnerability of coral communities at the Abrolhos to climate change. Surveys of the community structure of finfish are also underway within and outside of non-fishing areas.
Central West Coast
Marine MODERATE
An assessment of the community structure and trophic level of all commercially caught fish species over the past 30 years through an FRDC project found no evidence of systematic changes that could be evidence of an unacceptable impact on this ecosystem (Hall and Wise, 2010). Further ecological research in deep waters, supported by funding from the Western Australian Marine Science Institution (WAMSI) and the FRDC, will compare fished and unfished areas using a deep water reference area. A key objective of this project will be to enable potential ecosystem impacts of lobster fishing to be quantified. Negotiation of a suitable reference area is near completion as are the sampling methodologies to effectively monitor benthic habitats in fished and unfished areas.
Estuaries/ Embay.
SIGNIFICANT (non-fishing)
The estuaries and embayments within this area have been identified as being at significant risk, due to external factors (water quality issues due to high nutrient runoff from surrounding catchment) which have the potential to affect fish and other communities. Poor water quality within the Peel – Harvey and Swan-Canning estuaries, and Cockburn Sound are of particular concern.
Leeuwin Naturaliste
Marine LOW The impacts on the marine communities are relatively low in this region.
Estuaries HIGH
(non-fishing)
External factors such as water quality issues in the Blackwood Estuary, due to high nutrient run-off from surrounding land, as well as acid-sulphate soil contamination are of concern to sustainable fish stocks and the ecosystem in general.
Captured fish species - Details of the analyses for these scores are located in the individual fishery reports.
Captured Species
Aquatic zone
Risk Status and Current Activities
Estuarine SIGNIFICANT (non-fishing)
There is concern for some indicator fish stocks within estuaries in the West Coast Bioregion mainly due to external (non-fishing) factors (poor water quality).
Finfish
Nearshore (0-20m depth)
HIGH With the increasing concerns for Australian herring, tailor and whiting in the nearshore regions, research projects are underway to assess these stocks and to develop methods to measure shore based fishing catch and effort.
24 DEPARTMENT OF FISHERIES
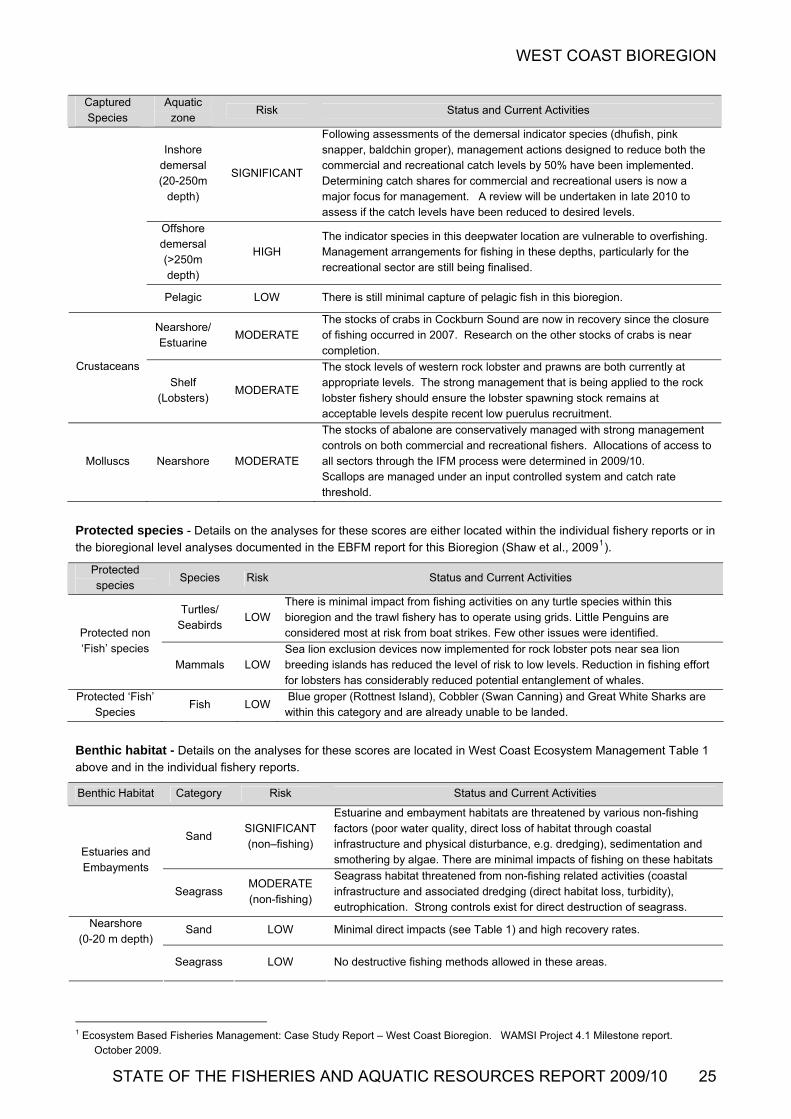
WEST COAST BIOREGION
Captured Aquatic Risk Status and Current Activities
Species zone
Inshore demersal (20-250m
depth)
SIGNIFICANT
Following assessments of the demersal indicator species (dhufish, pink snapper, baldchin groper), management actions designed to reduce both the commercial and recreational catch levels by 50% have been implemented. Determining catch shares for commercial and recreational users is now a major focus for management. A review will be undertaken in late 2010 to assess if the catch levels have been reduced to desired levels.
Offshore demersal (>250m depth)
HIGH The indicator species in this deepwater location are vulnerable to overfishing. Management arrangements for fishing in these depths, particularly for the recreational sector are still being finalised.
Pelagic LOW There is still minimal capture of pelagic fish in this bioregion.
Nearshore/Estuarine
MODERATE The stocks of crabs in Cockburn Sound are now in recovery since the closure of fishing occurred in 2007. Research on the other stocks of crabs is near completion.
Crustaceans
Shelf (Lobsters)
MODERATE
The stock levels of western rock lobster and prawns are both currently at appropriate levels. The strong management that is being applied to the rock lobster fishery should ensure the lobster spawning stock remains at acceptable levels despite recent low puerulus recruitment.
Molluscs Nearshore MODERATE
The stocks of abalone are conservatively managed with strong management controls on both commercial and recreational fishers. Allocations of access to all sectors through the IFM process were determined in 2009/10. Scallops are managed under an input controlled system and catch rate threshold.
Protected species - Details on the analyses for these scores are either located within the individual fishery reports or in
the bioregional level analyses documented in the EBFM report for this Bioregion (Shaw et al., 20091).
Protected species
Species Risk Status and Current Activities
Turtles/ Seabirds
LOW There is minimal impact from fishing activities on any turtle species within this bioregion and the trawl fishery has to operate using grids. Little Penguins are considered most at risk from boat strikes. Few other issues were identified. Protected non
‘Fish’ species
Mammals LOW Sea lion exclusion devices now implemented for rock lobster pots near sea lion breeding islands has reduced the level of risk to low levels. Reduction in fishing effort for lobsters has considerably reduced potential entanglement of whales.
Protected ‘Fish’ Species
Fish LOW Blue groper (Rottnest Island), Cobbler (Swan Canning) and Great White Sharks are within this category and are already unable to be landed.
Benthic habitat - Details on the analyses for these scores are located in West Coast Ecosystem Management Table 1
above and in the individual fishery reports.
Benthic Habitat Category Risk Status and Current Activities
Sand SIGNIFICANT (non–fishing)
Estuarine and embayment habitats are threatened by various non-fishing factors (poor water quality, direct loss of habitat through coastal infrastructure and physical disturbance, e.g. dredging), sedimentation and smothering by algae. There are minimal impacts of fishing on these habitats
Estuaries and Embayments
Seagrass MODERATE (non-fishing)
Seagrass habitat threatened from non-fishing related activities (coastal infrastructure and associated dredging (direct habitat loss, turbidity), eutrophication. Strong controls exist for direct destruction of seagrass.
Sand LOW Minimal direct impacts (see Table 1) and high recovery rates. Nearshore (0-20 m depth)
Seagrass LOW No destructive fishing methods allowed in these areas.
1 Ecosystem Based Fisheries Management: Case Study Report – West Coast Bioregion. WAMSI Project 4.1 Milestone report.
October 2009.
STATE OF THE FISHERIES AND AQUATIC RESOURCES REPORT 2009/10 25
WEST COAST BIOREGION
26 DEPARTMENT OF FISHERIES
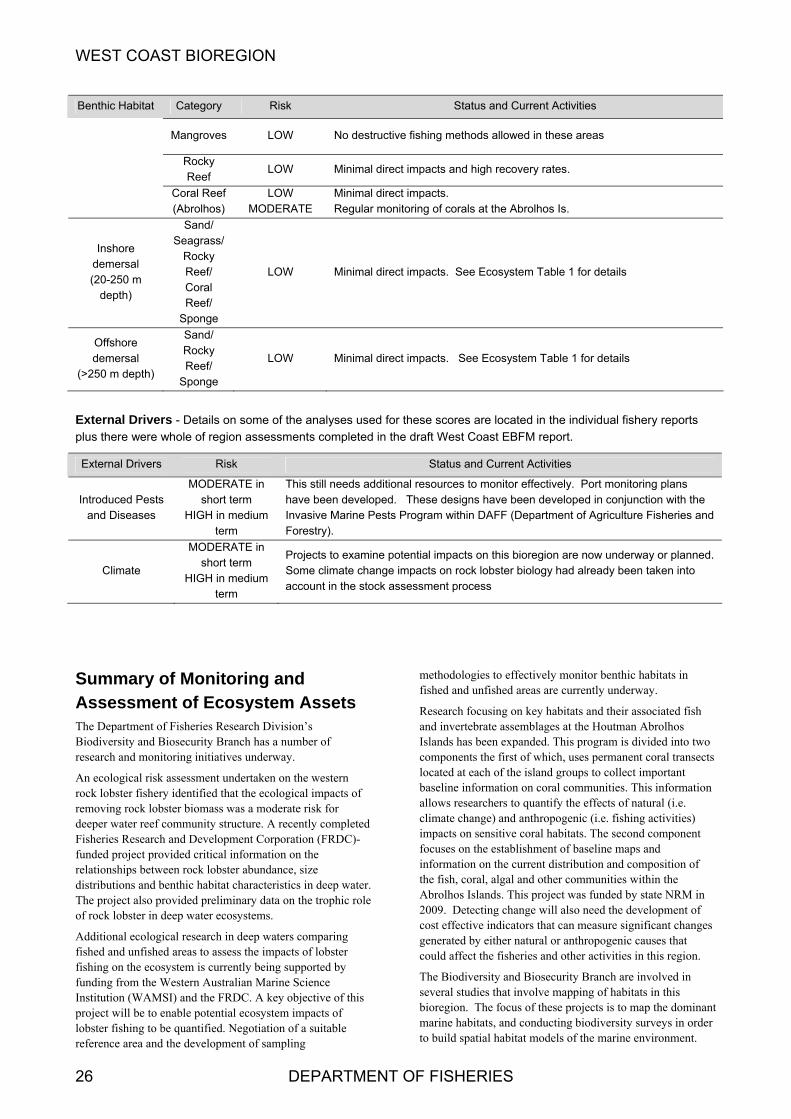
Benthic Habitat Category Risk Status and Current Activities
Mangroves LOW No destructive fishing methods allowed in these areas
Rocky Reef
LOW Minimal direct impacts and high recovery rates.
Coral Reef (Abrolhos)
LOW MODERATE
Minimal direct impacts. Regular monitoring of corals at the Abrolhos Is.
Inshore demersal (20-250 m
depth)
Sand/ Seagrass/
Rocky Reef/ Coral Reef/
Sponge
LOW Minimal direct impacts. See Ecosystem Table 1 for details
Offshore demersal
(>250 m depth)
Sand/ Rocky Reef/
Sponge
LOW Minimal direct impacts. See Ecosystem Table 1 for details
External Drivers - Details on some of the analyses used for these scores are located in the individual fishery reports
plus there were whole of region assessments completed in the draft West Coast EBFM report.
External Drivers Risk Status and Current Activities
Introduced Pests and Diseases
MODERATE in short term
HIGH in medium term
This still needs additional resources to monitor effectively. Port monitoring plans have been developed. These designs have been developed in conjunction with the Invasive Marine Pests Program within DAFF (Department of Agriculture Fisheries and Forestry).
Climate
MODERATE in short term
HIGH in medium term
Projects to examine potential impacts on this bioregion are now underway or planned.
Some climate change impacts on rock lobster biology had already been taken into account in the stock assessment process
Summary of Monitoring and Assessment of Ecosystem Assets
The Department of Fisheries Research Division’s Biodiversity and Biosecurity Branch has a number of research and monitoring initiatives underway.
An ecological risk assessment undertaken on the western rock lobster fishery identified that the ecological impacts of removing rock lobster biomass was a moderate risk for deeper water reef community structure. A recently completed Fisheries Research and Development Corporation (FRDC)-funded project provided critical information on the relationships between rock lobster abundance, size distributions and benthic habitat characteristics in deep water. The project also provided preliminary data on the trophic role of rock lobster in deep water ecosystems.
Additional ecological research in deep waters comparing fished and unfished areas to assess the impacts of lobster fishing on the ecosystem is currently being supported by funding from the Western Australian Marine Science Institution (WAMSI) and the FRDC. A key objective of this project will be to enable potential ecosystem impacts of lobster fishing to be quantified. Negotiation of a suitable reference area and the development of sampling
methodologies to effectively monitor benthic habitats in fished and unfished areas are currently underway.
Research focusing on key habitats and their associated fish and invertebrate assemblages at the Houtman Abrolhos Islands has been expanded. This program is divided into two components the first of which, uses permanent coral transects located at each of the island groups to collect important baseline information on coral communities. This information allows researchers to quantify the effects of natural (i.e. climate change) and anthropogenic (i.e. fishing activities) impacts on sensitive coral habitats. The second component focuses on the establishment of baseline maps and information on the current distribution and composition of the fish, coral, algal and other communities within the Abrolhos Islands. This project was funded by state NRM in 2009. Detecting change will also need the development of cost effective indicators that can measure significant changes generated by either natural or anthropogenic causes that could affect the fisheries and other activities in this region.
The Biodiversity and Biosecurity Branch are involved in several studies that involve mapping of habitats in this bioregion. The focus of these projects is to map the dominant marine habitats, and conducting biodiversity surveys in order to build spatial habitat models of the marine environment.

WEST COAST BIOREGION
Outputs from these habitat mapping and biodiversity surveys will assist in the identification of key marine indicators, and will support regional natural resource management groups in establishing marine ecosystem monitoring targets. The habitat maps produced will provide information on the distribution and extent of various substrates (e.g. reef versus sediment), relief, dominant vegetation types and different classes of sessile invertebrates.
In the West Coast bioregion, sampling mostly by other agencies (e.g. UWA, ECU, CSIRO) has focused on the Abrolhos Islands, Jurien Bay, Rottnest and Cape Naturaliste. Bathymetric and towed video surveys have been completed at all of these sites, as well as biodiversity sampling including research trawls using the RV Naturaliste and Baited Remote Underwater Video Stations (BRUVS). This work is being coordinated through the WAMSI Node 4 project 4.1
The Department continues to undertake research to assess the impacts on fisheries from other activities and determine appropriate management responses. The Department also inputs into the Western Australian Environmental Protection Authority’s environmental impact assessment process when a development proposal has the potential, if implemented, to impact on the aquatic environment.
The Department also continues to actively engage with the natural resource management groups within the West Coast to promote sustainable use of the aquatic environment, and has ‘introduced aquatic organism incursion’ and ‘fish kill incident response’ programs to minimise risks to the marine environment through the introduction of exotic aquatic organisms, or other incidents which have the potential to have an adverse effect.
A Natural Heritage Trust project, which commenced in 2006, is evaluating the extent of introduced marine species in Western Australian waters and developing strategies to minimise further introductions. This project has developed considerable information on the status of introduced marine species (IMPs) in WA. Outputs in 2010 from this funding include the development of a community-based IMP monitoring program and the preliminary design and testing of
an underwater camera system to assess biofouling on vessels less than 12 m.
Other completed work by biosecurity staff include a survey of the Careening Bay Naval waters at Garden Island, for the possible presence of the invasive mussel Perna viridis. Other ongoing work by biosecurity staff include: a project for capacity building funded by an FRDC Tactical Research Fund grant which involved staff travelling to established biosecurity institutions in Australia and New Zealand and the development of a dive slate of potential IMPs for the Albany region for use by recreational divers and funded by the Atlantic Eagle Fund.
A bycatch risk assessment method to rapidly assess the cumulative risk to sustainability of multiple fisheries was developed based on data up to and including 2009. The method draws on other techniques already published in scientific literature and adds a new cumulative ranked estimate of total catch across multiple fisheries. The Ranked Risk Assessment of Multiple Fisheries (RRAMF) allows ranking of bycatch species within each fishery and to accumulate the ranks across multiple fisheries incorporating the relative impact of each fishery. Another feature of this study is that it does not present a single risk result for each species, rather it shows a range of scores based on a variety of combinations of double-weighted parameters used in the risk assessment. The RRAMF method was tested on the West Coast and Gascoyne Coast Bioregions of Western Australia using fishery independent data for general teleost and elasmobranch bycatch; and fishery dependent data for threatened, endangered and protected species (TEPs). The analyses are in the final stages of completion and will be written up as a Fisheries Research Report.
A trial has begun of using a camera placed on a demersal gillnet vessel to investigate the efficacy of electronic monitoring to (a) identify protected species interactions, and (b) determine by-product and target species catches. The experiment is still in the equipment-testing phase, however, it is expected that the technique will produce information useful for management.
STATE OF THE FISHERIES AND AQUATIC RESOURCES REPORT 2009/10 27
WEST COAST BIOREGION
FISHERIES West Coast Rock Lobster Fishery Status Report S. de Lestang, A. Thomson and M. Rossbach. Management input from J. Kennedy, G. Baudains and A. Steele
Main Features
Status
Stock level Acceptable
Fishing Level Acceptable
Current Landings (Season 2008/09)
Commercial catch 7593 t
Recreational catch 225 t
Fishery Description
Commercial The West Coast Rock Lobster Managed Fishery (WCRLF) targets the western rock lobster, Panulirus cygnus, on the west coast of Western Australia between Shark Bay and Cape Leeuwin, using baited traps (pots). This is an input controlled fishery that was one of the first limited entry fisheries in the world plus it has used a sophisticated ITE based system for over 20 years. With annual production historically averaging about 11,000 t this has been Australia’s most valuable single species wild capture fishery and was the first fishery in the world to achieve Marine Stewardship Certification (MSC).
Recreational The recreational rock lobster fishery primarily targets western rock lobsters using baited pots and by diving.
Governing legislation/fishing authority
Commercial Fish Resources Management Act 1994
Fish Resources Management Regulations 1995
West Coast Rock Lobster Management Plan 1993
Other subsidiary legislation
West Coast Rock Lobster Managed Fishery Licence
Commonwealth Government Environment Protection and Biodiversity Conservation Act 1999 (Export Exemption)
Recreational Fish Resources Management Act 1994
Recreational Fishing Licence
Consultation processes
Commercial Rock Lobster Industry Advisory Committee (RLIAC)
Western Australian Fishing Industry Council (WAFIC)
Meetings between the Department of Fisheries and industry; Western Rock Lobster Council
Recreational RecFishWest
Boundaries
Commercial The fishery is situated along the west coast of Australia between Latitudes 21°44´ to 34°24´ S. The fishery is managed in 3 zones: south of latitude 30° S (C Zone), north of latitude 30° S (B Zone) and, within this northern area, a third offshore zone (A Zone) around the Abrolhos Islands.
Recreational The recreational rock lobster fishery operates on a state-wide basis and encompasses the take of all rock lobster species. Fishing is concentrated on western rock lobsters in inshore regions in depths of less than 20 meters between North West Cape and Augusta. The majority of recreational lobster fishing occurs in the Perth metropolitan area and Geraldton.
Management arrangements
Commercial The fishery is divided into three zones, which distributes effort across the entire fishery, reducing concentration of effort and the potential for unacceptable exploitation rates. This also permits the implementation of management controls aimed at addressing zone-specific issues, including different restrictions in the northern and southern regions of the fishery.
This fishery is managed using a total allowable effort (TAE) system and associated input controls. The primary control mechanism is the number of pots licensed for the fishery, together with a proportional usage rate, which creates the TAE in pot days. Unitisation in the fishery and transferability provisions allow market forces to determine the most efficient use of licences and pot entitlements. This is known as an individually transferable effort (ITE) management system. The total number of pots (subsequently changed to units) in the fishery was set at 68,961 in the early 1990s. In 1993/94 the usage rate of these units as pots was reduced to 82%. This was further reduced in the northern part of the fishery to 74% for part of the season beginning in 2005/06 to keep the TAE at a sustainable level (see below).
The management arrangements also included the protection of females in breeding condition, a minimum size limit of 77 mm carapace length applied from 15 November to 31 January, and a minimum of 76 mm from 1 February to 30 June. A maximum size limit for female lobsters was re-
28 DEPARTMENT OF FISHERIES

WEST COAST BIOREGION
imposed in 2002/03 that prohibits the take of female lobsters larger than 105 mm from waters between 21º44 S and 30º S (northern region) and those larger than 115 mm between 30º S and 34º24 S (southern region), excluding waters east of 115º08. Gear controls, including escape gaps and a limit on the size of pots, also play a significant role in controlling exploitation rates. The season opens on 15 November and closes on 30 June, with the Abrolhos Islands zone operating from 15 March to 30 June.
Additional effort reductions were introduced in 2005/06. In the northern coastal region pot usage was reduced to 74% from 15 November – 14 March and 82% from the 15 March to 30 June. The northern zone was also closed to fishing from 15 January – 9 February, with no fishing on Sundays (15 March – 30 June), Christmas Day and New Year’s Day. Pot usage in Zone A was also reduced to 74% for the first four weeks of the season (15 March – 15 April), before returning to 82% for the remainder of the season. In the southern region pot usage remained at 82% all season, the season began 10 days later (24 November), 3-day moon closures occurred from 1 February to 30 June (1 day prior to the full moon, the day of the full moon and the day after the full moon) and the fishery was closed for Christmas Day and New Year’s Day.
With the ongoing decrease in puerulus settlement, and given that the 2006/07 puerulus settlement was the second lowest on record at the time, further measures were introduced prior to the start of the 2008/09 season. At the commencement of the season the arrangements for Zone C was a pot usage of 74% and Sunday closures all season, for Zone B there was a pot usage of 66% and Sunday closures all season, and for Zone A, a pot usage of 66% and Sunday closures from 1 April until the end of the season. For Zone C, where moon closures were in place (from February until the end of the season), when the Sunday fell the day prior to or after the moon closure, it resulted in a four-day closure.
However, as a further precautionary measure with the continuing low puerulus settlement early in the 2008/09 settlement period, further pot reductions were implemented just after the start of the season. As of 30 November 2008 the pot usage was subsequently reduced to 62% for Zone C and 54% for Zones B and A.
With negligible puerulus settlement occurring by January of 2009, additional effort reductions were implemented. These amendments were designed to limit the 2008/09 season’s catch to 7,800 tonnes. They were; a closure to rock lobster fishing in all zones on Saturdays, Sundays and Mondays from 1 March (moon closures in Zone C were abolished), a further reduction to the unit values to 50% in Zone C and 42% in Zone A and Zone B, and the closure of the Big Bank area, and a reduction in the legal maximum length for female rock lobsters in Zone A and B to 95mm and an increase in the legal minimum length in Zone C to 77mm as of 15 March 2009. It was also decided not to open the Big Bank area for this season.
On 23 April 2009, having reviewed the effectiveness of these measures, the restriction on fishing on Mondays was removed, and fishers were permitted to operate on Mondays from 4 May 2009 onwards for the remainder of the season.
Recreational The recreational component of the western rock lobster fishery is managed under fisheries regulations, which impose a mix of input and output controls on individual recreational fishers. These arrangements are designed to complement the management plan for the commercial fishery.
Input controls include the requirement for a recreational rock lobster fishing license. Fishers are restricted to 2 pots per license holder, although the total number of licenses is not restricted. The pots must meet specific size requirements and have gaps to allow under-size rock lobsters to escape. Divers are also restricted to catching by hand, snare or blunt crook in order that the lobsters are not damaged. Fishing for rock lobsters at the Abrolhos Islands is restricted to potting.
An open season runs from 15 November to 30 June each year, with a shorter season (15 March to 30 June) at the Abrolhos Islands. Night-time fishing for lobsters by either diving or potting is prohibited. Management regulations on minimum size limits, protection of breeding females and the maximum size of females that can be taken are the same as those for commercial fishers.
In 2007/08 a daily bag limit of 8 lobsters per fisher per day was used to control individual catches, and limits the ability of recreational fishers to accumulate large quantities of lobsters. A daily boat limit of 16 provided further control on high individual catches where there are 2 or more people fishing from the same boat. In November of 2008, these limits were amended, with the daily bag limit changing to 6 lobsters per fisher per day, the boat limit amended to 12 per boat per day, and a possession limit introduced - limiting the number of rock lobsters permitted in a person’s possession to 24 rock lobsters. There is also a requirement for recreationally-caught lobsters to be tail-clipped in order to stop these animals from being sold illegally as part of ‘shamateur’ activity.
Integrated Fisheries Management In March 2008, through the Integrated Fisheries Management process, the Minister determined that the allocated shares of the sectors or the West Coast Rock Lobster Fishery would be 95% to the commercial Sector, 5% to the recreational sector and one tonne to customary fishers. The 2009/10 season will be the first season where these shares were formally allocated for all sectors.
Research summary
Research activities focus on assessing stock sustainability, forecasting future catch and breeding stock levels. This involves fishery-dependent and independent monitoring of breeding stock levels and puerulus settlement. Industry performance is monitored through compulsory catch and effort records from both fishers and processors, comprehensive data from the voluntary logbook scheme, and a commercial monitoring program, all of which are used for modelling and stock assessment.
An environmental management strategy was developed for use in the assessment of the broader ecosystem impacts of rock lobster fishing in the context of ESD and MSC certification. This strategy includes research into the ecosystem effects of rock lobster fishing in deep water. A Fisheries Research and Development Corporation (FRDC)
STATE OF THE FISHERIES AND AQUATIC RESOURCES REPORT 2009/10 29

WEST COAST BIOREGION
30 DEPARTMENT OF FISHERIES
funded project to examine the effects of western rock lobster fishing on the deep-water ecosystem off the west coast of Western Australia has recently been completed. This project provided critical baseline data on the relationships between the abundance and size distributions of rock lobster and the different benthic habitats located in deeper waters, plus preliminary data on diets and the trophic role of rock lobster within these depths. Further ecological research in deep waters will be based on comparing fished and unfished areas using research closures. This research is supported by the WAMSI and a new FRDC project that started in 2009. The aims of this project include negotiating a suitable closed area in deep water to assess the ecological impacts of fishing, developing cost-effective methods to monitor benthic communities in deep water and the collection of baseline information on lobster stocks, habitats and community structure to facilitate comparisons between fished and unfished areas. The ultimate outputs of this project will enable any impacts of lobster fishing on deepwater ecosystems to be quantified.
A second project examining lobster populations between fished and unfished zones is ongoing at Rottnest Island. This project consists of annual sampling using pots and underwater dive surveys at Armstrong Bay and Parker Point sanctuary zones. Results from the first three years after the no-take regions were implemented have shown a rapid increase in lobster numbers within the protected areas. This study also aims to provide additional information on growth, natural mortality and size/sex-specific catchability.
A risk assessment workshop to examine the low puerulus settlement was held in April 2009. The workshop focused on examining the ‘likelihood’ of factors that could have caused the decline in puerulus settlement. The workshop concluded that the decline in settlement could have been caused by changes in environmental conditions and productivity in the eastern Indian Ocean, or a decline in the abundance of the rock lobster breeding stock, particularly in the northern region of the fishery, or a combination of these two factors. A report on this workshop can be found on the Departments website (http://www fish.wa.gov.au/docs/op/op071/fop71.pdf).
The six projects listed below were funded by the Fisheries Research and Development Corporation (FRDC) to investigate various aspects of the possible causes and factors associated with the low puerulus settlements of 2007-08 and 2008-09.
Project 1. Identifying factors affecting the low western rock lobster puerulus settlement in recent years.
Project 2. Evaluating source-sink relationships of the Western Rock Lobster Fishery using oceanographic modelling.
Project 3. Evaluating the use of novel statistical techniques for determining harvest rates and efficiency increases in the Western Rock Lobster Fishery.
Project 4. Evaluation of population genetic structure in the western rock lobster.
Project 5. Assessing possible environmental causes behind the reduced colonization of puerulus collectors by a wide suite of species.
Project 6. A joint funded project between the FRDC and the
Marine National Facility - RV Southern Surveyor. Biological Oceanography of the Western Rock Lobster – Winter / Spring Dynamics.
Concern about the status of the breeding stock in the Big Bank region resulted in an additional independent breeding stock survey being conducted in this area to generate baseline information to assess the effects of the closure in this area.
A stock assessment workshop took place from 20 – 24 May 2010 at the Hillarys facility. Along with the need for regular review of the 2010 stock assessment, the objectives of the workshop met the conditions set by the Marine Stewardship Council’s auditors for the Western Rock Lobster Fishery (WRLF) certification. The reviewers concluded that while the structure of the current model was appropriate the spatial complexity could be reduced. The reviewers also advised that more of the data sources and parameters should be incorporated within the model to improve the estimates of precision. A major outcome of the workshop was the development of an ITQ version of the model that incorporated many of the suggested changes made by the reviewers. This model is currently being tested and will eventually be used for stock assessment of the fishery. A report on this workshop will be available in late 2010.
To assess the economic performance of the fishery a Seafood CRC project was submitted for possible funding. This project would look at updating the maximum economic yield assessment, In light of having an ITQ management system, and ways to incorporate the economic assessment into the stock assessment model.
For the recreational component of this fishery, an annual mail-based survey of participants has been used to estimate the annual catch and effort for the past 20 years. The trends generated by these data, together with data on puerulus settlement, are used to predict the recreational catch and effort in following seasons. Since 2000/01, telephone diary surveys of recreational rock lobster fishers have also been undertaken in most years. Estimates of recreational catch using this method are compared to the estimates from mail surveys. Phone diary surveys are considered to be more accurate than those from mail surveys because they eliminate the recall bias in the mail surveys and additionally, there is a higher participation rate in the survey from random sample selection. Sample sizes for the phone diary surveys have been increased since the 2006/07 survey to improve the accuracy of the result.
A project has commenced that aims to identify the parameters derived from mail surveys that need to be adjusted such that a catch estimate comparable to the diary survey estimates is generated. Thus, the estimates of effort obtained from the mail survey may alter in the future but comparison between seasons should not be affected.
Retained Species Commercial landings (season 2008/09):
7593 tonnes
Lobsters: Trends in the annual catches from the West Coast Rock Lobster Managed Fishery are shown in West Coast Rock Lobster Figure 1. The predicted 2008/09 catch for the

WEST COAST BIOREGION
WCRLF, forecast from puerulus settlement 3 to 4 years previously, was 9250 t. Due to additional management changes which were introduced in response to poor puerulus settlement in 2008/09 the catch landed by the WCRLF for the 2008/09 season was just 7593 t. This was 31.0% lower than the long-term average catch (1981/82 to 2006/07) of 11,005 t and 14.9% lower than the previous season’s 8920 t. In 2008/09, the catches in A, B and C Zones were 1,339, 2588 and 3,667 t, respectively, with A Zone 30.6% down, B Zone 14.9% down and C Zone 7.8% lower than the previous season.
The nominal fishing effort was 4.6 million pot lifts in 2008/09 – 43% lower than the 8.1 million pot lifts for 2007/08 and the lowest level since the 1950s (West Coast Rock Lobster Figure 1). This decline in nominal pot lifts is due to the sustainability package adopted by the fishery in the 2008/09 season.
The 2008/09 nominal effort for A, B and C Zones was 0.48, 1.52 and 2.6 million pot lifts respectively, which was 76.4, 13.9 and 40.0% lower than the previous season’s pot lifts.
Recreational A total of 41,986 licenses were sold that permitted fishing for lobsters during some part of the 2008/09 season (made up of specific rock lobster licenses plus umbrella licenses) with an estimated 25,050 (60%) utilized for lobster fishing. This was very close to the forecasted number of 25,000. Sales of licenses and associated usage figures are substantially higher in years of anticipated good recruitment into the fishery, which in turn results in those years producing a relatively higher overall recreational rock lobster catch due to a combination of increased lobster abundance and higher fishing effort. The number of licenses used for rock lobster fishing in 2008/09 was 10% higher than the number of active licenses (22,800) for the 2007/08 season.
Octopus: Octopus are also caught in rock lobster pots, generally in shallow water (<40 m), and a catch rate of 0.03 octopus per pot lift was recorded in the 2008/09 voluntary research log book data. This was 25% above the average of 0.024 per pot lift over the historical range (1985/86 to 2003/04).
This catch rate translates to an estimated 120,337 octopus caught in all regions of the fishery during 2008/09. Octopus catches were estimated for A, B and C Zones as 16,562, 49,087, and 54,688, respectively.
The average rates of usage by active pot and diving fishers (i.e. excluding all those who held a license but failed to use it) were 28 and 10 days respectively during the 2008/09 fishing season. These rates were similar in the 2007/08 fishing season.
The catch rate of octopus (incidental landings) is an indicator for this fishery, and at 0.03 octopus per pot lift achieved the performance measure of being within 10% of the historical range ± 10% (0.013–0.033 octopus per pot lift).
Finally, the average diary-adjusted catch taken by active pot and diving fishers were 19 and 11 lobsters respectively during the 2008/09 fishing season. In the 2007/08 season the average number of lobsters caught by pot and dive fishers was 19 and 10 respectively.
Recreational catch estimate (season 2008/09):
225 tonnes
In addition to long-term trends in license usage, the annual recreational catch in Zone C has also been shown to be related with puerulus settlement indices recorded on the Alkimos collectors 3 to 4 years earlier.
Based on the first 2 phone diary surveys (2000/01 and 2001/02), previous mail survey based catch estimates back to the 1986/87 season were adjusted downwards by the average ratio of 1.9. While a subsequent comparison undertaken in the 2005/06 season produced a different ratio, to maintain consistency from year to year the 1.9 conversion factor to adjust the mail survey data has been will be used until a more reliable conversion factor can be determined.
Stock Assessment Assessment complete: Yes
The recreational catch of western rock lobster for 2008/09 was estimated at 225 t based on the adjusted mail survey, with 162 t taken by potting and 63 t by diving. This represents close to 3% of the total catch of lobsters.
Assessment method:
Size-structured simulation model
Breeding stock levels: Adequate Comparative catch estimates for 2007/08 were 206 t, with 147 t by potting and 59 t by diving. The estimated recreational catch in 2008/09 was therefore 9% above the 2007/08 catch. The 2008/09 season catch estimate was at the lower limit of the catch prediction confidence limits (i.e. 200 – 350 t) produced by the model constructed using adjusted mail survey catch estimates.
Targeted commercial catch next season
(2009/10): 5,500 + 10% tonnes TACC
Projected recreational catch next season
(2009/10): 265 tonnes
The stock assessment process for this fishery utilises the broad range of fishery data and fishery-independent monitoring outlined in the research summary above.
Fishing effort/access level
Indices of egg production are the main indicators for assessing the health of the lobster stock. Prior to 2008/09 these were empirically based measures presented as the north and south coastal fishery-dependent breeding stock indices. These indices were based on commercial monitoring data and
Commercial In 2008/09 the numbers of vessels fishing for lobster were 107 in A Zone, 89 in B Zone and 199 in C Zone. Thus, in comparison to the 460 active boats in 2007/08, a fleet of 395 vessels fished in 2008/09, which was a reduction of 14%.
STATE OF THE FISHERIES AND AQUATIC RESOURCES REPORT 2009/10 31

WEST COAST BIOREGION
the fishery-independent breeding stock survey (IBSS) indices. Since 2008/09 the development of a fully integrated stock-assessment model that incorporates information these data sources along with other information has enabled more robust and spatially comprehensive estimates of egg production to be generated. These model based indices are now used for assessing the health of this stock and their continued use was a key recommendation from the recent stock assessment review of the fishery (May 2010).
The current focus for stock assessment has been to determine the effects of four years of low puerulus settlements on future catches and breeding stock levels and assess the effect of different management measures in mitigating any negative impacts.
The proposed management arrangements, which have been updated from the changes implemented in 2005/06, 2008/09 and 2009/10 which include reductions in the pot usage rate, the protection of setose and maximum size females, the closure of Big Bank and a number of temporal closures, the overall breeding stock projected five years into the future should remain at, or above, the target levels of the early – mid 1980s with a probability greater than 75% (West Coast Rock Lobster Figures 2, 3 and 4).
Catch per Unit Effort (CPUE) A second assessment measure in this fishery is the catch per unit of effort (CPUE) achieved annually by the fishery (West Coast Rock Lobster Figure 5). This provides a broad indicator of variations in the abundance of the legally catchable stock.
Commercial The downward trend from the 1970s to the 1980s reflects the increasing effort during this period (West Coast Rock Lobster Figure 1), which automatically leads to lower CPUE. This trend was reversed in the early 1990s through a substantial management-induced reduction in effort (i.e. pot usage was reduced to 82% of the unit holding).
Typically short-term fluctuations in abundance have represented the cyclical nature of puerulus settlement, which is reflected in the legal-sized abundance (CPUE) 3 to 4 years later. In the 2008/09 fishing season however the increase in CPUE to 1.68 kg/pot lift (around 52% higher than the previous year) relates more to the significant reduction in effort levels during this season. It should be noted that the catch rate does not directly reflect the overall abundance of lobsters, as legal catches are only a proportion of the overall biomass due to the large biomass of under-size animals and breeding females, which are fully protected.
Recreational The average recreational pot and diving diary-adjusted catch rates were 0.70 and 1.05 lobsters per person per fishing day
in the 2008/09 fishing season. These catch rates are very similar to the 0.68 lobsters for potting and 0.99 lobsters for diving in the 2007/08 fishing.
Juvenile Recruitment and Catch Prediction Post-larval (puerulus) recruitment to the fishery is monitored on a lunar monthly basis. Recruitment levels are affected by fluctuations in environmental conditions such as strength of the Leeuwin Current and the frequency and intensity of low-pressure systems generating westerly winds. Annual indices of puerulus settlement for 2009/10 were at very low levels at nearly all sampling sites (West Coast Rock Lobster Figure 6). This was the second lowest settlement on record, and factors such as environmental and/or breeding stock that may be contributing to this decline are being investigated (see Research summary). The low 2009/10 settlement will first impact on catches during the “reds” of 2012/13 and the ‘whites’ of 2013/14.
Non-Retained Species By-catch species impact: Low
Fishery-independent monitoring on commercial vessels records the catch rates of fish and invertebrate by-catch species caught during normal rock lobster fishing operations. Approximately 41,904 fish and invertebrates other than rock lobster and octopus were captured during the 2008/09 fishing season, of which most were released (Table 1). This is 52% less that last year’s catch and is due to the reduced effort in the fishery.
A performance measure for the fishery is that the egg production index for the three zones are projected to be above their respective threshold levels (that estimated to be the early-mid 1980s levels) five years into the future with a probability greater than 75%. The fishery has therefore met this performance measure.
Protected species interaction: Low
Previously, the WCRLF interacted with the Australian sea lion, Neophoca cinerea, resulting in the accidental drowning of an estimated small number of sea lion pups in rock lobster pots, as the pups attempted to retrieve from the traps the bait or rock lobsters contained in them. Such incidents were restricted to shallow waters (< 20 m) and to areas within 30 km of the mainland sea lion breeding colonies on the mid-west coast.
In order to eliminate these accidental drownings, from November 15, 2006 all pots fished in waters less than 20 m within approximately 30 km of the 3 breeding colonies, i.e. just north of Freshwater Point to just south of Wedge Island, were fitted with an approved Sea Lion Exclusion Device (SLED). Video trials have indicated that this device does stop sea lion pups from entering lobsters pots and drowning.
Approved SLED designs include an internal rigid structure, directly under the pot neck and an external design across the top of the pot, both of which ensure that the diagonal distance from the SLED to the neck of the pot is not greater than 132 mm. Further information on the SLED management package is available at
http://www.fish.wa.gov.au/docs/pub/SeaLionExclusionDevices/index.php
Monitoring of commercial pots in the SLED zone in 2007/08 – 2008/09 showed that over 95% of pots checked had an approved SLED.
32 DEPARTMENT OF FISHERIES
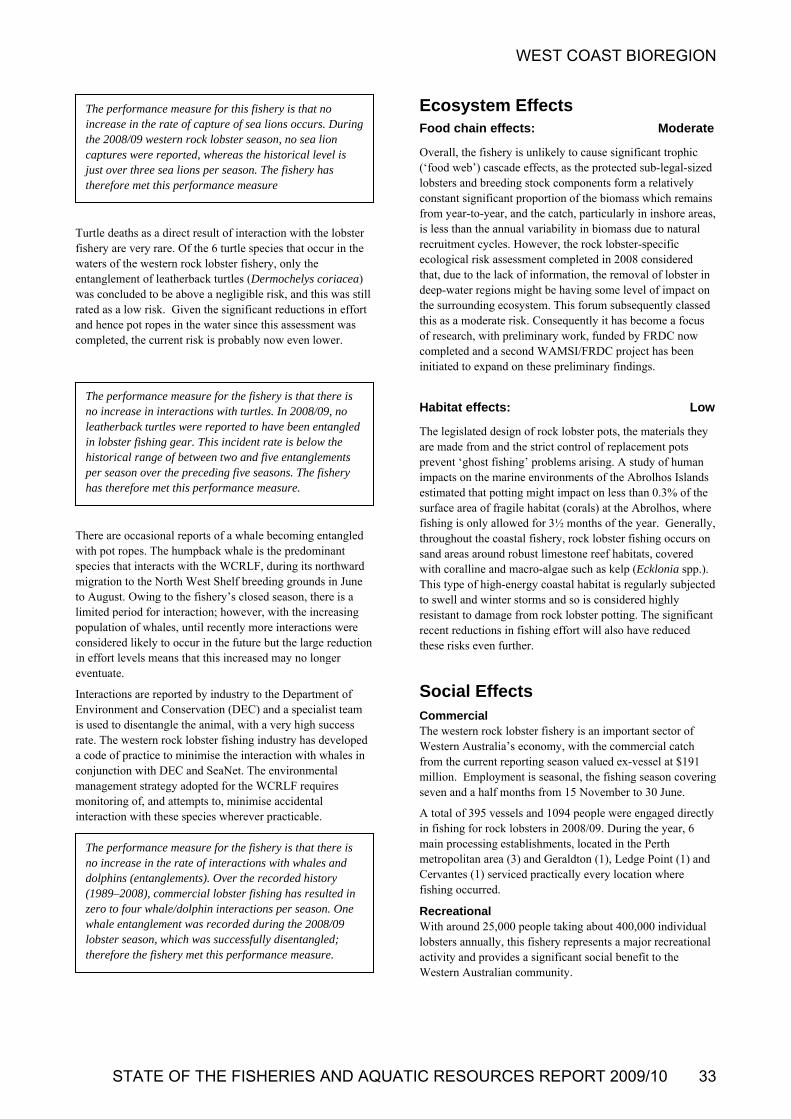
WEST COAST BIOREGION
Ecosystem Effects The performance measure for this fishery is that no increase in the rate of capture of sea lions occurs. During the 2008/09 western rock lobster season, no sea lion captures were reported, whereas the historical level is just over three sea lions per season. The fishery has therefore met this performance measure
Food chain effects: Moderate
Overall, the fishery is unlikely to cause significant trophic (‘food web’) cascade effects, as the protected sub-legal-sized lobsters and breeding stock components form a relatively constant significant proportion of the biomass which remains from year-to-year, and the catch, particularly in inshore areas, is less than the annual variability in biomass due to natural recruitment cycles. However, the rock lobster-specific ecological risk assessment completed in 2008 considered that, due to the lack of information, the removal of lobster in deep-water regions might be having some level of impact on the surrounding ecosystem. This forum subsequently classed this as a moderate risk. Consequently it has become a focus of research, with preliminary work, funded by FRDC now completed and a second WAMSI/FRDC project has been initiated to expand on these preliminary findings.
Turtle deaths as a direct result of interaction with the lobster fishery are very rare. Of the 6 turtle species that occur in the waters of the western rock lobster fishery, only the entanglement of leatherback turtles (Dermochelys coriacea) was concluded to be above a negligible risk, and this was still rated as a low risk. Given the significant reductions in effort and hence pot ropes in the water since this assessment was completed, the current risk is probably now even lower.
The performance measure for the fishery is that there is no increase in interactions with turtles. In 2008/09, no leatherback turtles were reported to have been entangled in lobster fishing gear. This incident rate is below the historical range of between two and five entanglements per season over the preceding five seasons. The fishery has therefore met this performance measure.
Habitat effects: Low
The legislated design of rock lobster pots, the materials they are made from and the strict control of replacement pots prevent ‘ghost fishing’ problems arising. A study of human impacts on the marine environments of the Abrolhos Islands estimated that potting might impact on less than 0.3% of the surface area of fragile habitat (corals) at the Abrolhos, where fishing is only allowed for 3½ months of the year. Generally, throughout the coastal fishery, rock lobster fishing occurs on sand areas around robust limestone reef habitats, covered with coralline and macro-algae such as kelp (Ecklonia spp.). This type of high-energy coastal habitat is regularly subjected to swell and winter storms and so is considered highly resistant to damage from rock lobster potting. The significant recent reductions in fishing effort will also have reduced these risks even further.
There are occasional reports of a whale becoming entangled with pot ropes. The humpback whale is the predominant species that interacts with the WCRLF, during its northward migration to the North West Shelf breeding grounds in June to August. Owing to the fishery’s closed season, there is a limited period for interaction; however, with the increasing population of whales, until recently more interactions were considered likely to occur in the future but the large reduction in effort levels means that this increased may no longer eventuate.
Social Effects Interactions are reported by industry to the Department of Environment and Conservation (DEC) and a specialist team is used to disentangle the animal, with a very high success rate. The western rock lobster fishing industry has developed a code of practice to minimise the interaction with whales in conjunction with DEC and SeaNet. The environmental management strategy adopted for the WCRLF requires monitoring of, and attempts to, minimise accidental interaction with these species wherever practicable.
Commercial The western rock lobster fishery is an important sector of Western Australia’s economy, with the commercial catch from the current reporting season valued ex-vessel at $191 million. Employment is seasonal, the fishing season covering seven and a half months from 15 November to 30 June.
A total of 395 vessels and 1094 people were engaged directly in fishing for rock lobsters in 2008/09. During the year, 6 main processing establishments, located in the Perth metropolitan area (3) and Geraldton (1), Ledge Point (1) and Cervantes (1) serviced practically every location where fishing occurred.
The performance measure for the fishery is that there is no increase in the rate of interactions with whales and dolphins (entanglements). Over the recorded history (1989–2008), commercial lobster fishing has resulted in zero to four whale/dolphin interactions per season. One whale entanglement was recorded during the 2008/09 lobster season, which was successfully disentangled; therefore the fishery met this performance measure.
Recreational With around 25,000 people taking about 400,000 individual lobsters annually, this fishery represents a major recreational activity and provides a significant social benefit to the Western Australian community.
STATE OF THE FISHERIES AND AQUATIC RESOURCES REPORT 2009/10 33

WEST COAST BIOREGION
Economic Effects Estimated annual commercial value (to fishers)
for year 2008/09: $191 million
The price that commercial fishers received for the western rock lobster in 2008/09 was an estimated average of $25.10/kg in all zones of the fishery. This was 3.29% increase on the $24.30/kg paid in 2007/08. The overall value of the fishery declined marginally from the previous season’s value of $217 million as a result of the lower landed weight recorded.
The bulk of the product was exported to Japan, Taiwan, Hong Kong/China, United States and some into Europe.
Fishery Governance Commercial Current Fishing (or Effort) Level: Acceptable
Commercial catch limit (08/09): 7,800 tonnes
Commercial catch target (09/10):
5,500 tonnes + 10%
Between 1975/76 and 2008/09 commercial catches have averaged 10,951 and ranged from 7,593 t in 2008/09 to 14,523 t in 1999/2000. The variations in catches result primarily from varying levels of recruitment, which have been largely associated with the environmental conditions experienced by western rock lobster larvae and post-larvae, and levels of fishing effort. The record low puerulus settlement in 2008/09 which followed a series of low levels resulted in catch limits being imposed to generate a carry-over rather than continuing the historical strategy of catching a similar proportion of the available stock each year. For the 2008/09 season this involved restricting the catch to below 7,800 t which required significant effort reductions were instigated for both the whites (ca. 35%) and reds (ca. 60%) portions of the season. A similar strategy was adopted for the 2009/10 season with the catch target at 5,500 t with 10 % tolerance limits. These actions are designed to ensure a carryover of lobsters should occur into what would have otherwise have been low catch years (2010/11 and 2011/12).
Recreational Current Fishing (or Effort) Level Acceptable
Target recreational catch limit (08/09):
400 tonnes
Target recreational catch limit (09/10):
290 tonnes
Between 1986/87 and 2008/09 recreational catches have varied between 115 t in 1987/88 to 468 t in 2002/03. Variation of these catches results primarily from variable levels of recruitment, which are driven by the environmental conditions as described above. From 2008/09 onwards the commercial and recreational sectors have been managed under the principles of Integrated Fisheries management (IFM), which allocates the commercial and recreational sectors 95 and 5% of the total catch, respectively. Under this arrangement the limit recreational catch for 2008/09 based on
a commercial catch of 7593 t is 400 t.
The recreational catch estimate for the 2008/09 season was 225 25 t (95% confidence interval of the mean) which was well below their limit catch of 400 t.
New management initiatives (2009/10)
To achieve the 5,500 t catch limit for the 2009/10 season another series of additional effort restrictions were developed. These additional measures included substantial reductions in pot usage values within each zone, four day fishing periods per week for parts of the season, and for some zones substantial closures were implemented during the season.
Given the complexity of the effort control arrangements and the significant interventions needed within the season, the management system for the fishery was reassessed. The Minister made an in-principle decision to move the fishery to quota control for the 2010/11 season.
External Factors The variations in western rock lobster catches both commercially and recreationally are largely a result of variable levels of puerulus settlement due to changes in the Southern Oscillation (El Niño or La Niña events in the Pacific Ocean) and their effect on the Leeuwin Current. A positive relationship exists between Leeuwin Current strength and levels of puerulus settlement. The southward-flowing Leeuwin Current also affects the spatial distribution of puerulus settlement along the coast. Catches are also dependent upon the environmental conditions at the time of fishing.
The fishery has been affected now by seven years of El Nino or neutral conditions, which has generally resulted in average or below average puerulus settlement due to the weaker Leeuwin current strength. The 2009/10 settlement levels were a slight improvement on 2008/09, however, this collection was still the second lowest settlement ever recorded. The factors that may be contributing to this low settlement are being examined (see Research Summary).
Increases in water temperatures over the last 30-40 years, which may be related to climate change, appear to be affecting some of the biological parameters such as size at maturity and size of migrating lobsters. These changes are being taken into account in the stock assessment model and therefore in the future stock assessment of the fishery. An article describing the relationship between climate change and lobster biology has recently been published in an international journal.
The economic performance of the fishery is being strongly affected by the value of the Australian dollar (affecting the price of lobsters), fuel and labour costs.
34 DEPARTMENT OF FISHERIES
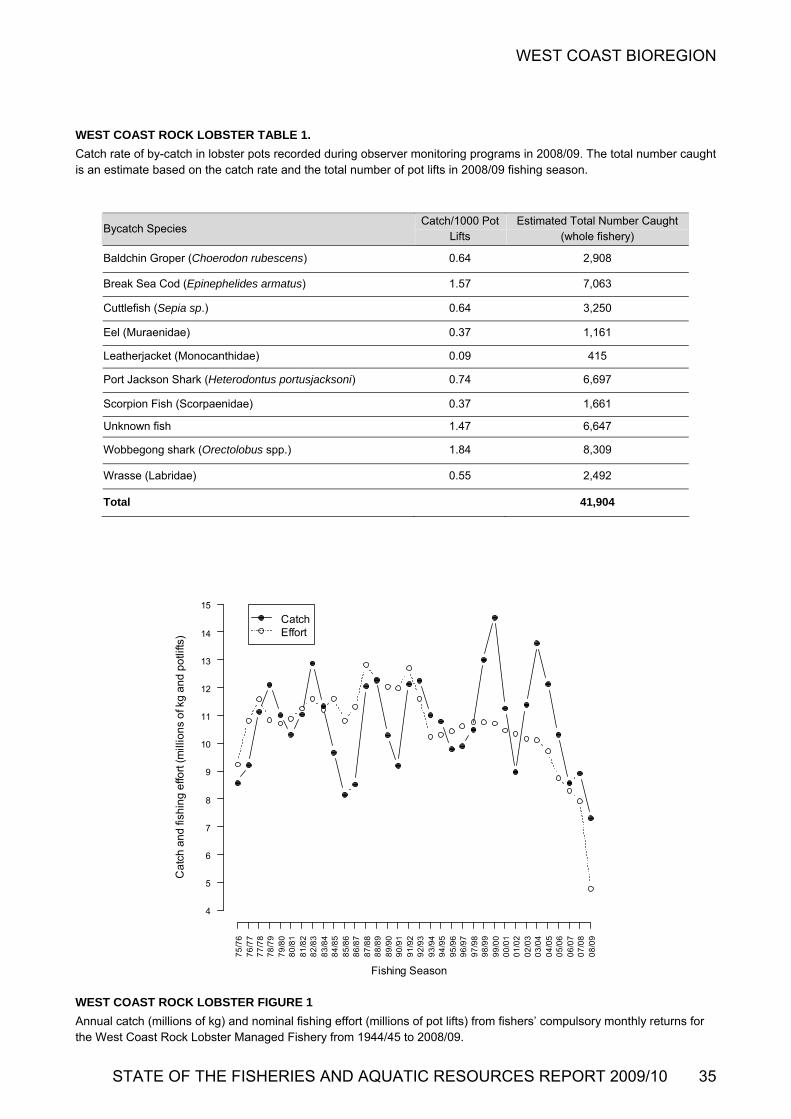
WEST COAST BIOREGION
WEST COAST ROCK LOBSTER TABLE 1.
Catch rate of by-catch in lobster pots recorded during observer monitoring programs in 2008/09. The total number caught is an estimate based on the catch rate and the total number of pot lifts in 2008/09 fishing season.
Bycatch Species Catch/1000 Pot
Lifts Estimated Total Number Caught
(whole fishery)
Baldchin Groper (Choerodon rubescens) 0.64 2,908
Break Sea Cod (Epinephelides armatus) 1.57 7,063
Cuttlefish (Sepia sp.) 0.64 3,250
Eel (Muraenidae) 0.37 1,161
Leatherjacket (Monocanthidae) 0.09 415
Port Jackson Shark (Heterodontus portusjacksoni) 0.74 6,697
Scorpion Fish (Scorpaenidae) 0.37 1,661
Unknown fish 1.47 6,647
Wobbegong shark (Orectolobus spp.) 1.84 8,309
Wrasse (Labridae) 0.55 2,492
Total 41,904
Fishing Season
Ca
tch
an
d fi
shin
g e
ffort
(m
illio
ns
of k
g a
nd
po
tlifts
)
75
/76
76
/77
77
/78
78
/79
79
/80
80
/81
81
/82
82
/83
83
/84
84
/85
85
/86
86
/87
87
/88
88
/89
89
/90
90
/91
91
/92
92
/93
93
/94
94
/95
95
/96
96
/97
97
/98
98
/99
99
/00
00
/01
01
/02
02
/03
03
/04
04
/05
05
/06
06
/07
07
/08
08
/09
4
5
6
7
8
9
10
11
12
13
14
15
CatchEffort
WEST COAST ROCK LOBSTER FIGURE 1
Annual catch (millions of kg) and nominal fishing effort (millions of pot lifts) from fishers’ compulsory monthly returns for the West Coast Rock Lobster Managed Fishery from 1944/45 to 2008/09.
STATE OF THE FISHERIES AND AQUATIC RESOURCES REPORT 2009/10 35

WEST COAST BIOREGION
Spawning year
Mo
de
l-d
eri
ved
eg
g in
de
x
75
/76
76
/77
77
/78
78
/79
79
/80
80
/81
81
/82
82
/83
83
/84
84
/85
85
/86
86
/87
87
/88
88
/89
89
/90
90
/91
91
/92
92
/93
93
/94
94
/95
95
/96
96
/97
97
/98
98
/99
99
/00
00
/01
01
/02
02
/03
03
/04
04
/05
05
/06
06
/07
07
/08
08
/09
09
/10
10
/11
11
/12
12
/13
13
/14
14
/15
0
100
200
300
400
500
WEST COAST ROCK LOBSTER FIGURE 2
Mean and 50% confidence region (in grey) model-derived egg production index for the Abrolhos zone of the fishery (A zone). The horizontal dotted line represents the 1980’s threshold.
Spawning year
Mo
de
l-d
eri
ved
eg
g in
de
x
75
/76
76
/77
77
/78
78
/79
79
/80
80
/81
81
/82
82
/83
83
/84
84
/85
85
/86
86
/87
87
/88
88
/89
89
/90
90
/91
91
/92
92
/93
93
/94
94
/95
95
/96
96
/97
97
/98
98
/99
99
/00
00
/01
01
/02
02
/03
03
/04
04
/05
05
/06
06
/07
07
/08
08
/09
09
/10
10
/11
11
/12
12
/13
13
/14
14
/15
100
200
300
400
500
600
700
WEST COAST ROCK LOBSTER FIGURE 3
Mean and 50% confidence region (in grey) model-derived egg production index for the northern coastal zone of the fishery (B zone). The horizontal dotted line represents the 1980’s threshold.
36 DEPARTMENT OF FISHERIES
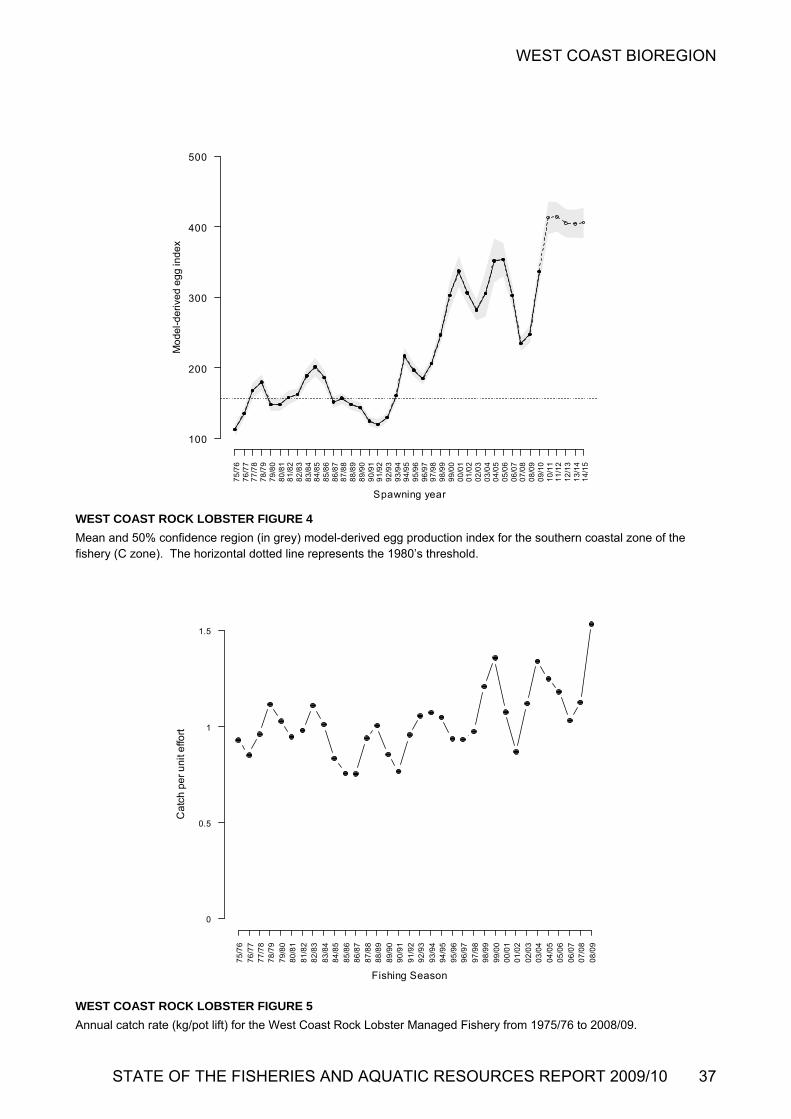
WEST COAST BIOREGION
Spawning year
Mo
de
l-d
eri
ved
eg
g in
de
x
75
/76
76
/77
77
/78
78
/79
79
/80
80
/81
81
/82
82
/83
83
/84
84
/85
85
/86
86
/87
87
/88
88
/89
89
/90
90
/91
91
/92
92
/93
93
/94
94
/95
95
/96
96
/97
97
/98
98
/99
99
/00
00
/01
01
/02
02
/03
03
/04
04
/05
05
/06
06
/07
07
/08
08
/09
09
/10
10
/11
11
/12
12
/13
13
/14
14
/15
100
200
300
400
500
WEST COAST ROCK LOBSTER FIGURE 4
del-derived egg production index for the southern coastal zone of the Mean and 50% confidence region (in grey) mofishery (C zone). The horizontal dotted line represents the 1980’s threshold.
Fishing Season
Ca
tch
per
uni
t effo
rt
75
/76
76
/77
77
/78
78
/79
79
/80
80
/81
81
/82
82
/83
83
/84
84
/85
85
/86
86
/87
87
/88
88
/89
89
/90
90
/91
91
/92
92
/93
93
/94
94
/95
95
/96
96
/97
97
/98
98
/99
99
/00
00
/01
01
/02
02
/03
03
/04
04
/05
05
/06
06
/07
07
/08
08
/09
0
0.5
1
1.5
WEST COAST ROCK LOBSTER FIGURE 5
nnual catch rate (kg/pot lift) for the West Coast Rock Lobster Managed Fishery from 1975/76 to 2008/09. A
STATE OF THE FISHERIES AND AQUATIC RESOURCES REPORT 2009/10 37
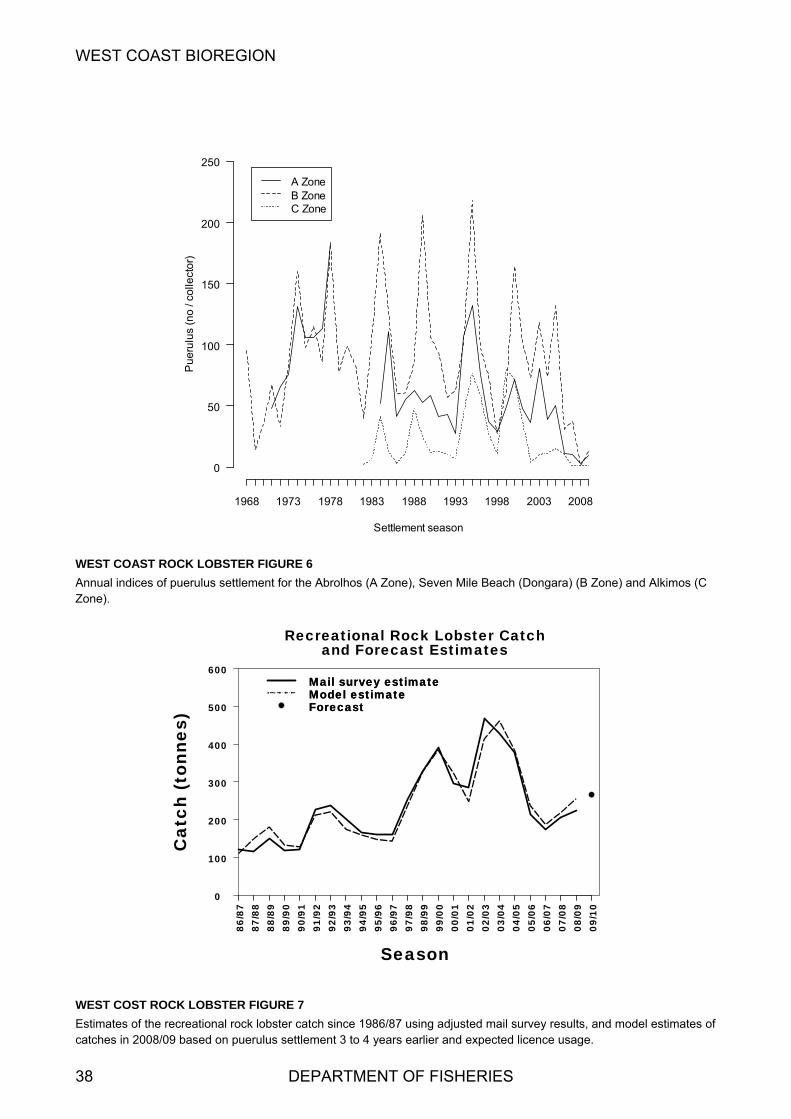
WEST COAST BIOREGION
38 DEPARTMENT OF FISHERIES
Settlement season
Pu
eru
lus
(no
/ co
llect
or)
1968 1973 1978 1983 1988 1993 1998 2003 2008
0
50
100
150
200
250
A ZoneB ZoneC Zone
WEST COAST ROCK LOBSTER FIGURE 6
Annual indices of puerulus settlement for the Abrolhos (A Zone), Seven Mile Beach (Dongara) (B Zone) and Alkimos (C Zone).
86/8
7
87
/88
88/8
9
89
/90
90/9
1
91
/92
92/9
3
93
/94
94/9
5
95
/96
96/9
7
97
/98
98/9
9
99
/00
00/0
1
01
/02
02/0
3
03
/04
04/0
5
05
/06
06/0
7
07
/08
08/0
9
09
/10
0
100
200
300
400
500
600
Season
Cat
ch (
tonn
es)
Recreational Rock Lobster Catchand Forecast Estimates
Mail survey estimateModel estimateForecast
Mail survey estimateModel estimateForecast
WEST COST ROCK LOBSTER FIGURE 7
Estimates of the recreational rock lobster catch since 1986/87 using adjusted mail survey results, and model estimates of catches in 2008/09 based on puerulus settlement 3 to 4 years earlier and expected licence usage.

WEST COAST BIOREGION
Roe’s Abalone Fishery Status Report A. Hart and J. Brown
Management input from M. Holtz
Main Features
Status
Stock level Acceptable
Fishing level Acceptable
Current Landings
Commercial Catch
West Coast 36 t
Other 57 t
Recreational Catch
West Coast 49 t
Other 14 t
Fishery Description The Western Australian Roe’s abalone (Haliotis roei) fishery is a dive and wade fishery, operating in shallow coastal waters along WA’s western and southern coasts. Roe’s abalone are found in commercial quantities from the South Australian border to Shark Bay, although they are not uniformly distributed throughout this range.
The commercial fishery harvest method is a single diver working off a ‘hookah’ (surface-supplied breathing apparatus) using an abalone ‘iron’ to prise the shellfish off rocks. Abalone divers operate from small fishery vessels (generally less than 9 metres in length).
The recreational fishery harvest method is primarily wading and snorkeling, with the main focus of the fishery being the Perth metropolitan stocks (West Coast Fishery).
Governing legislation/fishing authority
Fish Resources Management Act 1994
Fish Resources Management Regulations 1995
Abalone Management Plan 1992
Ministerial Policy Guideline no. 10
Abalone Managed Fishery Licence
Commonwealth Government Environment Protection and Biodiversity Conservation Act 1999 (Export Exemption)
Recreational Fishing Licence
Consultation process
Meetings between the Department of Fisheries and commercial abalone industry
Recreational Fishing Advisory Committee
Boundaries
Commercial The Abalone Management Plan covers all Western Australian coastal waters, which are divided into 8 management areas.
Commercial fishing for Roe’s abalone is managed in 6 separate regions from the South Australian border to Busselton Jetty – Areas 1, 2, 5, 6, 7 and 8 (Roe’s Abalone Figure 1).
Recreational The recreational abalone fishery regulations relate to three zones: the Northern Zone, the West Coast Zone, and the Southern Zone (Roe’s Abalone Figure 2). The West Coast Zone is the centre of the fishery and includes the metropolitan fishery.
Management arrangements
Commercial The commercial Roe’s abalone fishery is managed primarily through output controls in the form of total allowable commercial catches (TACCs), set annually for each area and allocated to license holders as individual transferable quotas (ITQs).
The overall TACC for 2009 was 101.8 t whole weight (note this small species is generally landed in the whole condition). The TACC is administered through 25,180 ITQ units, with a minimum unit holding of 800 units generally applying, although some Roe’s abalone licences are permitted to operate below this minimum in recognition of historical fishing practices.
The licensing period (fishing year) runs from 1 April to 31 March of the following year.
The legal minimum length for Roe’s abalone is 60 mm shell length in most parts of the fishery. However, industry initiated commercial minimum lengths of 75 mm and 70 mm apply in Area 1 (WA/South Australia border to Point Culver) and Area 7 (Cape Bouvard to Moore River) respectively.
A comprehensive Ecologically Sustainable Development assessment of the commercial fishery has been undertaken to identify any potential sustainability risks requiring direct management. The only issue identified through this process related to the breeding stock levels of Roe’s abalone. Boxed text in this status report provides the annual assessment of performance for this issue.
STATE OF THE FISHERIES AND AQUATIC RESOURCES REPORT 2009/10 39

WEST COAST BIOREGION
Recreational The recreational Roe’s abalone fishery is managed under a mix of input and output controls. Recreational fishers must purchase a dedicated abalone recreational fishing licence or an umbrella licence (which covers all licensed recreational fisheries). These licences are not restricted in number. The West Coast zone (Perth) of the recreational fishery is restricted to an average total allowable recreational catch (TARC) of 40 t.
The fishing season in the Northern and Southern Zones extends from 1 October to 15 May. The West Coast Zone is only open for 6 Sundays annually, commencing on the first Sunday in November, and the daily allowed fishing time is 60 minutes (between 7.00 a m. and 8.00 a m.). Prior to 2006, daily fishing time was 90 minutes.
These restrictive management controls on the west coast are necessary to ensure the sustainability of an easily accessible (and therefore vulnerable) stock located adjacent to a population in excess of 1.6 million people (including Geraldton).
For Roe’s abalone, the minimum legal size is 60 mm shell length, the daily bag limit is 20 per fisher, and the household possession limit (the maximum number that may be stored at a person’s permanent place of residence) is 80.
Research summary
Commercial Commercial abalone divers provide daily catch information on the total weight of abalone collected, the hours fished, the date and location of harvest and the name of the person(s) harvesting. These data are used to assist in research, compliance and management matters.
The main abundance index is an annual standardized catch per unit effort (CPUE) model that takes into account diver, sub-area and month of fishing, as well as technological improvements that aid fishing efficiency. The standardized CPUE data are used in a decision-rule framework for quota setting for each area of the fishery.
Current research is focused on stock assessment using catch and effort statistics, fishery-independent surveys of Perth metropolitan stocks, and digital video imagery (DVI) surveys by industry divers, who survey selected sites with an underwater video camera. Size and density of Roe’s abalone across the near-shore sub-tidal reef habitat is measured annually at 11 indicator sites between Mindarie Keys and Penguin Island. Nine of these are fished while the other 2 are the Waterman’s Reserve Marine Protected Area (MPA), and the Cottesloe Fish Habitat Protection Zone.
Recreational Current annual recreational catch and effort estimates are derived from an annual field survey (West Coast Zone / Perth metropolitan fishery), and an occasional telephone diary survey covering the entire state (2007 was the last year of a state-wide survey).
The field survey estimates the catch and effort from each distinct Roe’s abalone stock within the Perth fishery, and estimates are based on average catch (weight and numbers), catch rates (derived from 1,100 interviews in 2009), and fisher counts conducted by Fisheries Volunteers and research
personnel from shoreline vantage points and aerial surveys. This method provides a comprehensive assessment, but is too resource-intensive to be applied routinely outside of the Perth metropolitan area.
The telephone diary survey estimates the catch of all 3 species on a state-wide basis, however is not completed every year. In 2007, around 500 licence holders were randomly selected from the licensing database, with selection stratified by licence type (abalone or umbrella) and respondent location (country or Perth metropolitan area). The licence holders were sent a diary to record their fishing activity and were contacted every 3 months by telephone for the duration of the abalone season, or at the end of the season for those only involved in the Perth abalone season.
Retained Species Commercial production
Season 2009: 92.8 tonnes whole weight
Metro only: 36 tonnes whole weight
The TACC for the 2009 quota year was 101.8 t whole weight for Roe’s abalone. The 2009 catch of 92.8 t whole weight (Roe’s Abalone Table 1) was similar to 2008 and about 90% of the TACC. The overall TACC was not caught because Area 1 of the fishery (Roe’s Abalone Figure 1) was not fished in 2009, and catches in Area 5 were below the TACC (80% of TACC caught) due to unfavourable weather. Total TACC is not usually caught in this fishery because of weather-related issues in the marginal regions (Area 1 and Area 8) of the fishery.
Recreational catch
Season 2009: Roe's Metro Fishery 48.6 tonnes
(Season 2007): Roe’s rest of state 14 tonnes
(40% of total catch)
The recreational catch for Roe’s abalone from the Perth metropolitan area in 2009 was 48.6 t (Roe’s Abalone Table 2). This is an increase of about 10% from 2008 and the highest catch weight since this time series was started in 1999. The higher catch resulted from a combination of good weather conditions, a 5% increase in license numbers (Roe’s Abalone Figure 3), and discontinuation of daylight savings resulting in the fishery start time being shifted backward by one hour, with the resultant increase in light and temperature attracting more fishers.
Based on the Perth recreational fishery for 2009 (49 t), and using the 2007 phone diary estimate for the rest of the state (14 t), recreational fishing represented about 40% of the total (commercial and recreational) Roe’s abalone catch (155 t) across the state in 2009.
Fishing effort/access level
Commercial Total effort for dedicated Roe’s abalone divers in 2009 was 554 diver days (lower than last year's effort of 585 diver days) and is the lowest effort on record (Roe’s Abalone Table 1). The low effort in recent years is a combination of high
40 DEPARTMENT OF FISHERIES
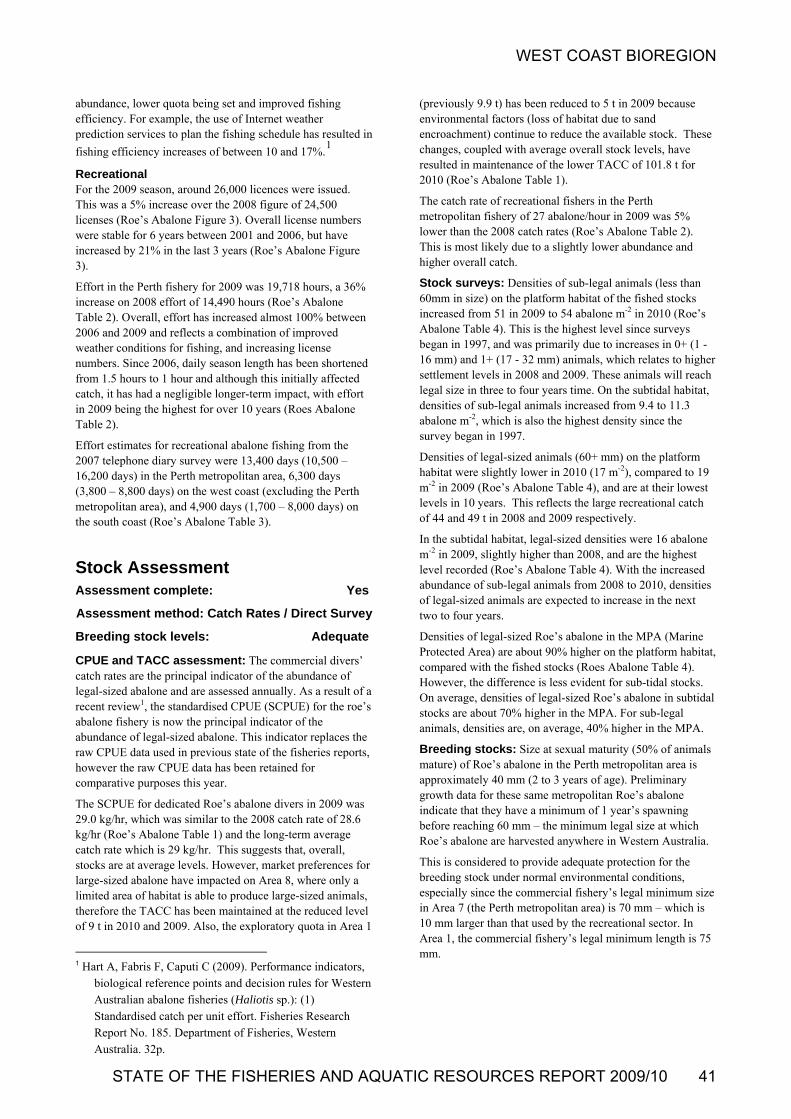
WEST COAST BIOREGION
STATE OF THE FISHERIES AND AQUATIC RESOURCES REPORT 2009/10 41
abundance, lower quota being set and improved fishing efficiency. For example, the use of Internet weather prediction services to plan the fishing schedule has resulted in
fishing efficiency increases of between 10 and 17%.1
Recreational For the 2009 season, around 26,000 licences were issued. This was a 5% increase over the 2008 figure of 24,500 licenses (Roe’s Abalone Figure 3). Overall license numbers were stable for 6 years between 2001 and 2006, but have increased by 21% in the last 3 years (Roe’s Abalone Figure 3).
Effort in the Perth fishery for 2009 was 19,718 hours, a 36% increase on 2008 effort of 14,490 hours (Roe’s Abalone Table 2). Overall, effort has increased almost 100% between 2006 and 2009 and reflects a combination of improved weather conditions for fishing, and increasing license numbers. Since 2006, daily season length has been shortened from 1.5 hours to 1 hour and although this initially affected catch, it has had a negligible longer-term impact, with effort in 2009 being the highest for over 10 years (Roes Abalone Table 2).
Effort estimates for recreational abalone fishing from the 2007 telephone diary survey were 13,400 days (10,500 – 16,200 days) in the Perth metropolitan area, 6,300 days (3,800 – 8,800 days) on the west coast (excluding the Perth metropolitan area), and 4,900 days (1,700 – 8,000 days) on the south coast (Roe’s Abalone Table 3).
Stock Assessment Assessment complete: Yes
Assessment method: Catch Rates / Direct Survey
Breeding stock levels: Adequate
CPUE and TACC assessment: The commercial divers’ catch rates are the principal indicator of the abundance of legal-sized abalone and are assessed annually. As a result of a recent review1, the standardised CPUE (SCPUE) for the roe’s abalone fishery is now the principal indicator of the abundance of legal-sized abalone. This indicator replaces the raw CPUE data used in previous state of the fisheries reports, however the raw CPUE data has been retained for comparative purposes this year.
The SCPUE for dedicated Roe’s abalone divers in 2009 was 29.0 kg/hr, which was similar to the 2008 catch rate of 28.6 kg/hr (Roe’s Abalone Table 1) and the long-term average catch rate which is 29 kg/hr. This suggests that, overall, stocks are at average levels. However, market preferences for large-sized abalone have impacted on Area 8, where only a limited area of habitat is able to produce large-sized animals, therefore the TACC has been maintained at the reduced level of 9 t in 2010 and 2009. Also, the exploratory quota in Area 1
1 Hart A, Fabris F, Caputi C (2009). Performance indicators,
biological reference points and decision rules for Western Australian abalone fisheries (Haliotis sp.): (1) Standardised catch per unit effort. Fisheries Research Report No. 185. Department of Fisheries, Western Australia. 32p.
(previously 9.9 t) has been reduced to 5 t in 2009 because environmental factors (loss of habitat due to sand encroachment) continue to reduce the available stock. These changes, coupled with average overall stock levels, have resulted in maintenance of the lower TACC of 101.8 t for 2010 (Roe’s Abalone Table 1).
The catch rate of recreational fishers in the Perth metropolitan fishery of 27 abalone/hour in 2009 was 5% lower than the 2008 catch rates (Roe’s Abalone Table 2). This is most likely due to a slightly lower abundance and higher overall catch.
Stock surveys: Densities of sub-legal animals (less than 60mm in size) on the platform habitat of the fished stocks increased from 51 in 2009 to 54 abalone m-2 in 2010 (Roe’s Abalone Table 4). This is the highest level since surveys began in 1997, and was primarily due to increases in 0+ (1 -16 mm) and 1+ (17 - 32 mm) animals, which relates to higher settlement levels in 2008 and 2009. These animals will reach legal size in three to four years time. On the subtidal habitat, densities of sub-legal animals increased from 9.4 to 11.3 abalone m-2, which is also the highest density since the survey began in 1997.
Densities of legal-sized animals (60+ mm) on the platform habitat were slightly lower in 2010 (17 m-2), compared to 19 m-2 in 2009 (Roe’s Abalone Table 4), and are at their lowest levels in 10 years. This reflects the large recreational catch of 44 and 49 t in 2008 and 2009 respectively.
In the subtidal habitat, legal-sized densities were 16 abalone m-2 in 2009, slightly higher than 2008, and are the highest level recorded (Roe’s Abalone Table 4). With the increased abundance of sub-legal animals from 2008 to 2010, densities of legal-sized animals are expected to increase in the next two to four years.
Densities of legal-sized Roe’s abalone in the MPA (Marine Protected Area) are about 90% higher on the platform habitat, compared with the fished stocks (Roes Abalone Table 4). However, the difference is less evident for sub-tidal stocks. On average, densities of legal-sized Roe’s abalone in subtidal stocks are about 70% higher in the MPA. For sub-legal animals, densities are, on average, 40% higher in the MPA.
Breeding stocks: Size at sexual maturity (50% of animals mature) of Roe’s abalone in the Perth metropolitan area is approximately 40 mm (2 to 3 years of age). Preliminary growth data for these same metropolitan Roe’s abalone indicate that they have a minimum of 1 year’s spawning before reaching 60 mm – the minimum legal size at which Roe’s abalone are harvested anywhere in Western Australia.
This is considered to provide adequate protection for the breeding stock under normal environmental conditions, especially since the commercial fishery’s legal minimum size in Area 7 (the Perth metropolitan area) is 70 mm – which is 10 mm larger than that used by the recreational sector. In Area 1, the commercial fishery’s legal minimum length is 75 mm.

WEST COAST BIOREGION
Economic Effects
The main performance measure for the fishery relates to the maintenance of adequate breeding stocks in each area of the fishery. This is assessed using a combination of the level of quota achieved and the effort required to achieve the quota, both of which reflect stock abundance. In 2009, catch and standardised CPUE were within the agreed ranges in all areas fished, indicating that overall breeding stock levels were adequate (Roe’s Abalone Table 5). Adverse weather conditions limited the fishing in the remote Area 1 and, to a lesser extent, in Area 5 (80% of TAC caught).
Estimated annual value (to commercial fishers)
for 2009: $2.3 million
The estimated average price for Roe’s abalone in 2009 was $24.50/kg, a decrease from $26/kg in 2008. On the basis of the average price, the fishery was worth approximately $2.3 million – a decrease from the 2008 value of $2.6 million. Overall, the price of Roe’s abalone has dropped by over 50% since 2000, when it was $55/kg whole weight. This is due to the value of the Australian dollar, which increased from $US0.58 in 2000 to >US$0.90 in mid-2008, although dropped back to $US0.7 to $US0.8 in the later part of 2008. In 2009, the value of the Australian dollar increased again to be primarily above US$0.90. The other factor in the decline in prices is competition from abalone produced by aquaculture.
Non-Retained Species Bycatch species impact: Negligible
Divers have the ability to target abalone of choice (species, sizes and quality of abalone) and do not inadvertently harvest bycatch in their normal fishing activities.
Fishery Governance
Commercial Protected species interaction: Negligible Target SCPUE range:
The only potential protected species interaction in this fishery would be with the great white shark (Carcharodon carcharias) while fishing in some of the more open-water locations. Some Roe’s abalone divers are adopting the ‘shark shield’ technology generally used by greenlip/brownlip divers for their personal protection.
28 – 33 kg per hour (all areas combined)
Target effort range: 620 – 750 diver days
In 2009, as a result of a review of performance indicators in abalone fisheries1, a new governance range was developed for the roe’s abalone fishery, based on standardised CPUE (SCPUE). This replaces the old governance range based on effort in diver days fished, which has been retained for comparative purposes.
Ecosystem Effects Food chain effects: Negligible To assess whether the catch quota set is appropriate
(sustainable) relative to the stock available, Roe’s abalone catches should be taken within the range of SCPUE recorded over the 1999 – 2006 fishing years (28 – 33 kg per hour; Roes Abalone Table 1). This range reflects the acceptable variation in catch rates due to weather and recruitment cycles. Roes Abalone Table 5 shows performance measures of each individual ar
Commercial abalone diving occurs over a small proportion of the total abalone habitat of the Western Australian coastline. In view of the relatively low exploitation rates and consequent maintenance of a high proportion of the natural biomass of abalone, it is considered unlikely that the fishery has any significant effect on the food chain in the region.
The old governance range of 620 – 750 diver days (also from 1999 – 2006) does not account for changes in fishing efficiency, which are now incorporated into the SCPUE calculations. Consequently, the effort value of 554 diver days in 2009 (Roes Abalone Table 1) falls below the expected effort range, suggesting stocks are at historically high levels. However this is not the case, stocks are at average levels.
Habitat effects: Negligible
The fishing activity makes minimal contact with the habitat, which typically consists of hard rock surfaces in a high wave energy environment. As abalone feed on drift algae, their removal is unlikely to result in any changes to the algal growth cover in areas fished.
Recreational (West Coast) Social Effects Target Catch range: 35 – 45 tonnes There are 26 vessels commercially fishing for Roe’s abalone, employing approximately 50 people across WA. The dispersed nature of the Roe’s abalone fishery means that small coastal towns from Kalbarri to Eucla receive income from the activity of divers.
In 2009, as a result of the introduction of a Total Allowable Recreational catch (TARC) in the West Coast zone of 40 tonnes, a new governance range based on total catch was developed. This range takes in the permitted maximum variations of 5t around the 40 t catch.
Around 26,000 licences were issued that would have allowed fishers to participate in the recreational abalone fishery (Roe’s Abalone Figure 4). The recreational fishery provides a major social benefit to those sectors of the community that appreciate the abalone as a delicacy.
The 2009 west coast recreational roe’s abalone catch of 48.6 t was above the governance range of 35 – 45 tonnes. Consequently, a reduction in the number of fishing days from 6 to 5 has been proposed for the 2010 season, in order to keep the 5-year moving average at 40 tonnes.
42 DEPARTMENT OF FISHERIES
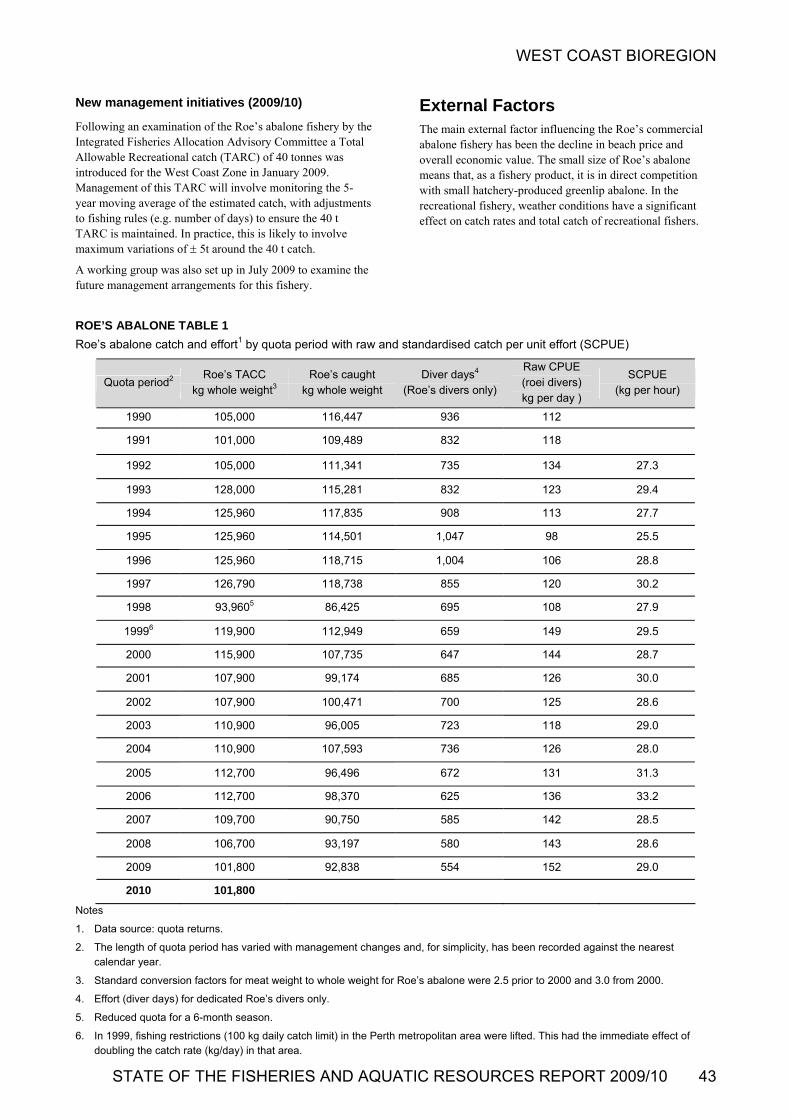
WEST COAST BIOREGION
STATE OF THE FISHERIES AND AQUATIC RESOURCES REPORT 2009/10 43
New management initiatives (2009/10)
Following an examination of the Roe’s abalone fishery by the Integrated Fisheries Allocation Advisory Committee a Total Allowable Recreational catch (TARC) of 40 tonnes was introduced for the West Coast Zone in January 2009. Management of this TARC will involve monitoring the 5-year moving average of the estimated catch, with adjustments to fishing rules (e.g. number of days) to ensure the 40 t TARC is maintained. In practice, this is likely to involve maximum variations of 5t around the 40 t catch.
A working group was also set up in July 2009 to examine the future management arrangements for this fishery.
External Factors The main external factor influencing the Roe’s commercial abalone fishery has been the decline in beach price and overall economic value. The small size of Roe’s abalone means that, as a fishery product, it is in direct competition with small hatchery-produced greenlip abalone. In the recreational fishery, weather conditions have a significant effect on catch rates and total catch of recreational fishers.
ROE’S ABALONE TABLE 1
Roe’s abalone catch and effort1 by quota period with raw and standardised catch per unit effort (SCPUE)
Quota period2 Roe’s TACC
kg whole weight3 Roe’s caught
kg whole weight Diver days4
(Roe’s divers only)
Raw CPUE (roei divers) kg per day )
SCPUE (kg per hour)
1990 105,000 116,447 936 112
1991 101,000 109,489 832 118
1992 105,000 111,341 735 134 27.3
1993 128,000 115,281 832 123 29.4
1994 125,960 117,835 908 113 27.7
1995 125,960 114,501 1,047 98 25.5
1996 125,960 118,715 1,004 106 28.8
1997 126,790 118,738 855 120 30.2
1998 93,9605 86,425 695 108 27.9
19996 119,900 112,949 659 149 29.5
2000 115,900 107,735 647 144 28.7
2001 107,900 99,174 685 126 30.0
2002 107,900 100,471 700 125 28.6
2003 110,900 96,005 723 118 29.0
2004 110,900 107,593 736 126 28.0
2005 112,700 96,496 672 131 31.3
2006 112,700 98,370 625 136 33.2
2007 109,700 90,750 585 142 28.5
2008 106,700 93,197 580 143 28.6
2009 101,800 92,838 554 152 29.0
2010 101,800
Notes
1. Data source: quota returns.
2. The length of quota period has varied with management changes and, for simplicity, has been recorded against the nearest calendar year.
3. Standard conversion factors for meat weight to whole weight for Roe’s abalone were 2.5 prior to 2000 and 3.0 from 2000.
4. Effort (diver days) for dedicated Roe’s divers only.
5. Reduced quota for a 6-month season.
6. In 1999, fishing restrictions (100 kg daily catch limit) in the Perth metropolitan area were lifted. This had the immediate effect of doubling the catch rate (kg/day) in that area.
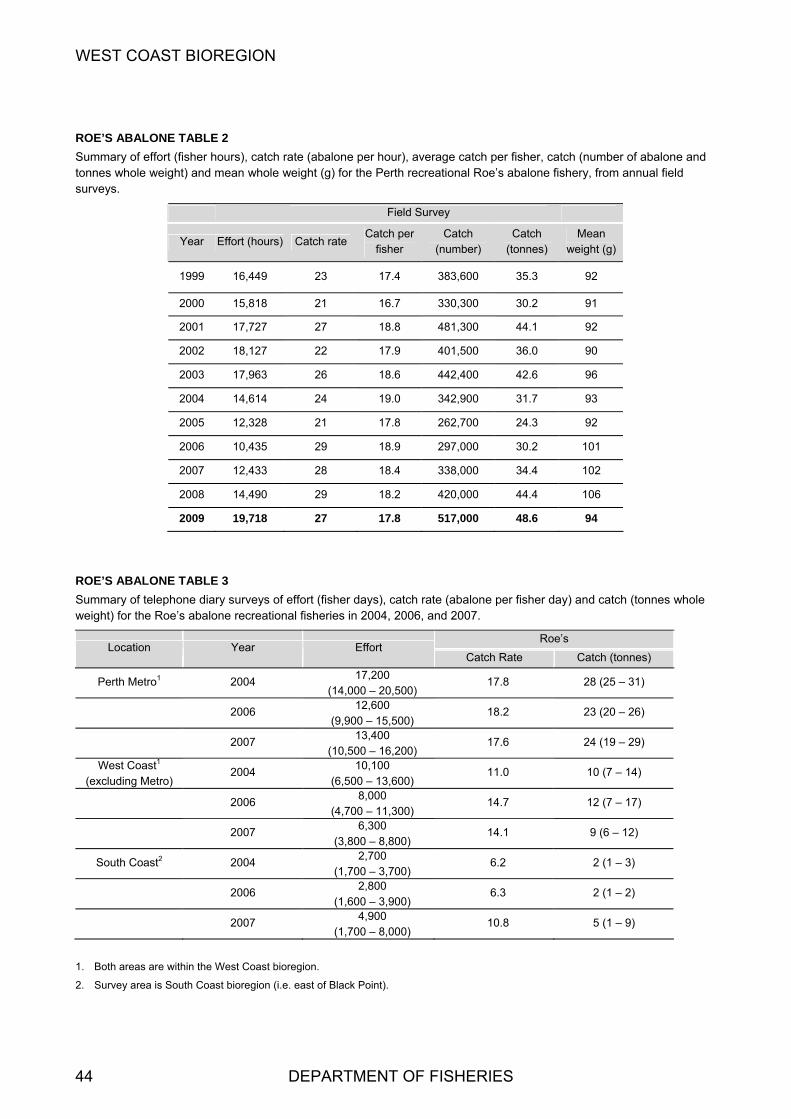
WEST COAST BIOREGION
ROE’S ABALONE TABLE 2
Summary of effort (fisher hours), catch rate (abalone per hour), average catch per fisher, catch (number of abalone and tonnes whole weight) and mean whole weight (g) for the Perth recreational Roe’s abalone fishery, from annual field surveys.
Field Survey
Year Effort (hours) Catch rate Catch per
fisher Catch
(number) Catch
(tonnes) Mean
weight (g)
1999 16,449 23 17.4 383,600 35.3 92
2000 15,818 21 16.7 330,300 30.2 91
2001 17,727 27 18.8 481,300 44.1 92
2002 18,127 22 17.9 401,500 36.0 90
2003 17,963 26 18.6 442,400 42.6 96
2004 14,614 24 19.0 342,900 31.7 93
2005 12,328 21 17.8 262,700 24.3 92
2006 10,435 29 18.9 297,000 30.2 101
2007 12,433 28 18.4 338,000 34.4 102
2008 14,490 29 18.2 420,000 44.4 106
2009 19,718 27 17.8 517,000 48.6 94
ROE’S ABALONE TABLE 3
Summary of telephone diary surveys of effort (fisher days), catch rate (abalone per fisher day) and catch (tonnes whole weight) for the Roe’s abalone recreational fisheries in 2004, 2006, and 2007.
Roe’s Location Year Effort
Catch Rate Catch (tonnes)
Perth Metro1 2004 17,200
(14,000 – 20,500) 17.8 28 (25 – 31)
2006 12,600
(9,900 – 15,500) 18.2 23 (20 – 26)
2007 13,400
(10,500 – 16,200) 17.6 24 (19 – 29)
West Coast1 (excluding Metro)
2004 10,100
(6,500 – 13,600) 11.0 10 (7 – 14)
2006 8,000
(4,700 – 11,300) 14.7 12 (7 – 17)
2007 6,300
(3,800 – 8,800) 14.1 9 (6 – 12)
South Coast2 2004 2,700
(1,700 – 3,700) 6.2 2 (1 – 3)
2006 2,800
(1,600 – 3,900) 6.3 2 (1 – 2)
2007 4,900
(1,700 – 8,000) 10.8 5 (1 – 9)
1. Both areas are within the West Coast bioregion.
2. Survey area is South Coast bioregion (i.e. east of Black Point).
44 DEPARTMENT OF FISHERIES

WEST COAST BIOREGION
ROE’S ABALONE TABLE 4
Mean densities (abalone/m2) of sub-legal (<60 mm shell length) and legal-sized Roe’s abalone (60 mm and over) from 9 monitoring sites (fished stocks) and the Marine Protected Area (MPA) in the Perth fishery. The platform habitat is primarily the recreational fishery, while the sub-tidal habitat is primarily the commercial fishery. Data has been standardised by a GLM (Generalized Linear Models) analysis, as the sites are not the same for all years.
Platform habitat Sub-tidal habitat
Year Fished stocks Waterman’s Reserve (MPA) Fished stocks Waterman’s Reserve (MPA)
<60 60+ <60 60+ <60 60+ <60 60+
1997 32 29 44 26 4.2 12 9 21
1998 42 27 51 37 5.2 13 11 29
1999 47 26 52 26 3.8 7 12 27
2000 45 24 29 35 2.7 10 8 31
2001 44 25 38 34 3.7 10 8 28
2002 35 27 42 39 3.2 10 7 31
2003 29 24 36 41 4.5 11 4 25
2004 31 21 33 52 3.8 9 5 20
2005 32 20 43 39 5.0 9 9 22
2006 33 19 49 38 6.8 9 6 20
2007 35 19 42 35 5.6 11 7 23
2008 42 21 69 37 7.2 15 7 19
2009 51 19 67 38 9.4 15 11 24
2010 54 17 77 32 11.3 16 8 23
ROE’S ABALONE TABLE 5
Assessment against agreed performance measures for 2009.
Performance Indicator Performance Measure1
2009 Values
Assessment/Comments
Area 1
Total catch (TACC) 5,500 kg 0 Exploratory quota – no fishing in 2009.
Effort range (Diver days) 14 – 43 0 See above.
Area 2
Total catch (TACC) 19,800 kg 19,770 Met – 99.9% of quota caught.
Standardised CPUE 20 – 31 25 Met – within agreed ranges.
Area 5
Total catch (TACC) 20,000kg 16,077 Met – 80% of quota caught.
Standardised CPUE 18 – 27 23 Met – within agreed ranges.
Area 6
Total catch (TACC) 12,000 kg 12,000 Met – 100% of quota caught.
Standardised CPUE 18 – 26 21 Met – within agreed ranges.
Area 7
Total catch (TACC) 36,000 kg 35,996 Met – 99.9% of quota caught.
Standardised CPUE 28 – 42 39 Met – within agreed ranges.
Area 8
Total catch (TACC) 9,000 kg 8,995 Met – 99.9% of quota caught.
Standardised CPUE 16 – 24 19 Met – within agreed ranges
1. With the exception of Area 1, the standardised CPUE (SCPUE) performance measure replaces the effort ranges (in diver days) used in previous state of the fisheries reports. The range in SCPUE represents the Target (upper) and Limit (lower) biological reference points as developed in the following document. Hart A, Fabris F, Caputi C (2009). Performance indicators, biological reference points and decision rules for Western Australian abalone fisheries (Haliotis sp.): (1) Standardised catch per unit effort. Fisheries Research Report No. 185. Department of Fisheries, Western Australia. 32p.
STATE OF THE FISHERIES AND AQUATIC RESOURCES REPORT 2009/10 45

WEST COAST BIOREGION
ROE’S ABALONE FIGURE 1
Maps showing (a) the distribution of Roe’s abalone in Western Australia, and (b) the management areas used to set quotas for the commercial fishery.
46 DEPARTMENT OF FISHERIES

WEST COAST BIOREGION
ROE’S ABALONE FIGURE 2
Maps showing (a) the recreational fishing boundaries for abalone, and (b) the West Coast (Perth Fishery) zone, showing conservation areas within this zone.
STATE OF THE FISHERIES AND AQUATIC RESOURCES REPORT 2009/10 47

WEST COAST BIOREGION
48
ROE’S ABALONE
The number of licenc
ROE’S ABAL
Catch estimate ackwards projections through time, ba
Assumption 1: average of the 2 mean weight values measured for 1999 a mbers caught are estimated using the field surve
Assumption 2: rt utilised for the years 1997 to 2000; that the years 1997 to 2000; and that the mean weight of a
Note that the recr ys in 1995 and 1997 – 2006. In 1992 – s and Sundays). From 1995 –
006 - 2009, permissible fishing time per season
DEPARTMENT OF FISHERIES
ONE FIGURE 4
s for the Perth recreational abalone fishery for the period 1992 to 2008, including bsed on two assumptions. Error bars are SE.
assumes that the mean weight of abalone taken during 1997 and 1998 is equal to thend 2000 (i.e. 91.6 g, averaged from 92 g in 1999 and 91.3 g in 2000). Nu
y technique (Roe’s Abalone Table 2).
assumes that effort from 1992 to 1996 is the average percentage of the potential effo catch rate for the years 1992 to 1996 is the average of the annual catch rates for the
balone taken from 1992 to 1996 is the same as applied to 1997 and 1998 in Assumption 1.
eational season totalled 16 days in 1993, 12 days in 1992 and 1994, 5 days in 1996 and 6 da1994, fishing was permitted for 2 hours per season day (7 a.m. to 9 a.m., Saturday
2005, permissible fishing time per season day was 1.5 hours (7 a.m. to 8.30 a.m., Sundays only). In 2day was 1 hour.
FIGURE 3
es issued in the recreational abalone fishery, by licence type, for the period 1992 to 2008.
Year
19921993
19941995
19961997
19981999
20002001
20022003
20042005
20062007
20082009
Nu
mb
ers
of
recr
eati
on
al li
cen
ces
0
2000
4000
6000
8000
10000
12000
14000
16000
18000
20000
22000
24000
26000 All licensesAbalone recreational licensesUmbrella recreational licenses
Year
19921993
19941995
19961997
19981999
20002001
20022003
20042005
20062007
20082009
0
5
10
15
20
25
30
35
40
45
50
55
Cat
ch e
stim
ate
(to
nn
es)
Field Research SurveysAssumption 2 Assumption 1 Telephone Diary Survey

WEST COAST BIOREGION
Abrolhos Islands and Mid West, South West Trawl Managed Fisheries and South Coast Trawl Fishery Status Report M Kangas, E. Sporer and S. Brown
Management input from R Gould
Fishery Description The Abrolhos Islands and Mid West Trawl Managed Fishery (AIMWTMF) is based on the take of saucer scallops (Amusium balloti), with a small component targeting the western king prawn (Penaeus latisulcatus) in the Port Gregory area.
The South West Trawl (SWTMF) Fishery includes two of the State’s smaller scallop fishing grounds – Fremantle and north of Geographe Bay. It is a multi-species fishery.
The South Coast Trawl Fishery (SCTF) principally targets scallops (Amusium balloti) and associated by-products, although in years of low scallop catches licensees have an option to use other trawl gear to target fish species. Scallop landings for the fishery have varied dramatically over the years, depending primarily on the strength of recruitment. While the managed fishery area covers a large section of the coastal waters, the operations of the fleet are effectively restricted to very small areas of higher scallop abundance.
Each of these fisheries operates using low opening otter trawl systems.
Governing legislation/ fishing authority
Abrolhos Islands and Mid West Trawl Management Plan 1993
Abrolhos Islands and Mid West Trawl Managed Fishery Licence
Commonwealth Government Environment Protection and Biodiversity Conservation Act 1999 (Export Exemption) for AIMWTMF.
South West Trawl Management Plan 1989
South West Trawl Managed Fishery Licence (MFL)
Trawling Prohibition (Whole of State) Notice 1992 (Order)
Surface Trawl Net Fishery (South Coast) Notice 1992
Trawling for Scallops (South Coast) Notice 1992
Condition 73 and/or 79 on Fishing Boat Licences
Consultation process
Meetings between the Department of Fisheries and industry.
Boundaries
AIMWTMF: ‘all the waters of the Indian Ocean adjacent to Western Australia between 27°51´ south latitude and 29°03´ south latitude on the landward side of the 200 m isobath’.
SWTMF: ‘all the waters of the Indian Ocean adjacent to Western Australia between 31°43.38´27˝ south latitude and 115°08.08´ east longitude where it intersects the high water mark at Cape Leeuwin, and on the landward side of the 200 m isobath’.
The area is further divided into four management zones, with a limited number of operators (indicated in brackets) permitted access to fish within each zone as follows:
Zone A from 31°43´27˝ S to 32°16´ S (3 MFL’s)
Zone B from 32°16´ S to 115°08´ E (12 MFL’s)
Zone C north-east of Cape Naturaliste (0 MFL’s
Closed to trawling)
Zone D Comet Bay off Mandurah (3 MFL’s)
SCTF: Off the south coast of Western Australia in state waters east of 115° E longitude (Cape Leeuwin, Condition 73). Condition 79 provides for the use of demersal trawl nets for taking scallops within the Recherche Archipelago. Four fishing boat licences have both conditions.
Management arrangements
The AIMWTF operates under an input control system, with 15 licences (after one licence was removed via a Fishery Adjustment Scheme in 2009), a maximum total net headrope capacity restriction, specified net mesh size, along with seasonal closures and significant spatial closures protecting all near-shore waters and sensitive reef areas. Bycatch reduction devices (grids) to release large species are fully
Main Features
Status
Stock level Acceptable
Fishing level Acceptable
Current Landings
AIMWTMF: Scallops 0 t (whole weight)
SWTMF: Scallops 21 t (whole weight)
Prawns 7 t
SCTF: Scallops, 71 t (whole weight)
STATE OF THE FISHERIES AND AQUATIC RESOURCES REPORT 2009/10 49
WEST COAST BIOREGION
implemented in the AIMWTF as a licence condition. The fishery operates to a catch rate threshold level of 250kg meat weight per 24 hours trawling to cease fishing but given low stock levels and meat weights there was no fishing in 2009 (see research summary for details).
The SWTMF is a gear based rather than a managed fishery which operates under an input control system that limits boat numbers, gear sizes and fishing areas. There is a total of 14 MFLs operating in this fishery, some in more than one zone. The fishing season operates between 1 January and 15 November in Zones A and B. Zone D season is open to fishing all-year-round and access to Zone C ceased in 2002. The management plan also includes large closures to protect sensitive coastal habitats (including seagrass beds) and nursery areas such as Cockburn Sound, Warnbro Sound and inshore Geographe Bay.
The SCTF is managed primarily under an input control system with 4 licences to operate in the fishery. There are also seasonal closed areas in specified parts of the fishery.
The Departments’ vessel monitoring system (VMS) monitors the activities of all boats including compliance with the spatial closures.
The Australian Government Department of Environment, Water, Heritage and the Arts has assessed the AIMWT fishery under the provisions of the Environment Protection and Biodiversity Conservation Act 1999 and has accredited the fishery for a period of five years, allowing product from the fishery to be exported from Australia. The comprehensive Ecological Sustainable Development assessment of this fishery identified that maintaining an acceptable breeding stock level of the target scallop species was the key performance indicator for the fishery. Boxed text in this status report provides the annual assessment of performance against this indicator for this issue.
Research summary
Research monitoring of the scallop stocks for all fisheries is undertaken using daily logbooks. The logbooks are validated by processor returns. In the AIMWTMF these, together with an annual pre-season survey, provide the information required for assessing the fishery. Advice on the status of stocks and appropriate season opening and closing dates is provided to industry.
During the previous (2008) season it was reported that one area (the “Wallabi area”) had small size scallop shell generating small size and poor quality meat during the period when these should be near optimum. Consequently, the predicted catch level for the 2008 season was not reached. In consultation with industry it was decided that it would be essential to undertake scallop sampling before the 2009 season commenced to enable an assessment of scallop meat size and quality before industry commenced fishing. The first of these surveys was undertaken in February 2009 which identified poor meat quality and small size, which when combined with the relatively low catch prediction industry determined that there would be no value or profit initiating fishing operations in 2009. Three additional surveys were undertaken in 2009 (May, July and August). The poor meat size and condition of scallop persisted so fishing did not begin all during the 2009 season.
Retained Species Commercial landings (season 2009)
AIMWTMF: Scallops, no fishing
SWTMF: Prawns 7 tonnes
Scallops 21 tonnes whole weight
Fish 3 tonnes
SCTF: Scallops, 71 tonnes whole weight
AIMWTMF No scallop landings were recorded for the 2009 season in this fishery as no fishing was undertaken due to small meat size and poor quality of scallops and the moderately low catch prediction (350-500 t whole weight) (West and South Coast Scallop Figure 1).
SWTMF The total recorded landings for this fishery were separated into invertebrate and fish species. Included in the invertebrate landings are 7 t of western king prawns, 21 t of scallops (whole weight) and 2 t of crabs (Portunus pelagicus). The catch of king prawns was low but in line with low catches since 2006. The decline in prawn catches is in part due to low effort. The reported scallop landings show an increase compared to recent years (since 2004) and a return to normal scallop landings seen since 1993. Observations by fishers indicate improved recruitment with an expected increase in catches for the 2010 season. The fishery also retains a mixture of fish species of which the most abundant species recorded was 2 t of whiting. All other landings of fish species were less than 1 t each.
SCTF The scallop catch was 71tonnes (whole weight) which was higher than last year’s catch of 23 t. There is generally low effort expended in the fishery and variable recruitment (West and South Coast Scallop Figure 2). By-product species landings were negligible.
Recreational catch: Nil
Fishing effort/access level
AIMWTMF No fishing occurred in the AIMWTMF in 2009 (see research summary for details).
SWTMF A total of 125 days were fished in the SWTMF (all zones) which is similar to last year. There are 14 boats licensed to fish in this fishery but not all boats actively fish. The low level of effort reflects the marginal fishing economics and viability of boats.
SCTF The annual effort expended in the SCTF is mostly affected by scallop recruitment levels. Exploratory fishing is undertaken by skipper(s) to estimate stock abundance of scallops and to assess if it is economically viable to continue fishing. As a consequence, the level of effort utilised each year closely follows stock abundance and catch levels. For the 2009 season only two boats fished for scallops between January and October recording a total of 111 scallop fishing days.
50 DEPARTMENT OF FISHERIES

WEST COAST BIOREGION
STATE OF THE FISHERIES AND AQUATIC RESOURCES REPORT 2009/10 51
Stock Assessment represent a very small percentage of the fishing area within the legislated boundary, therefore bycatch species impact is considered to be minimal. Assessment complete:
AIMWTMF: Yes
SWTMF and SCTF: Not assessed Protected species interaction: Low
While turtles do occur in the Abrolhos Islands, these species are towards the southern extent of their range, and do not breed in the Abrolhos Islands area because water temperatures are too low. Consequently, interactions with turtles were always minimal and now that grids are compulsory in the fishery, their capture should be negligible.
Assessment method:
AIMWTMF: Direct survey, catch rate
Breeding stock levels: Few other protected species occur in this area. For the SWTMF and SCTF protected species that are susceptible to capture by trawling do not occur regularly in the fishing areas.
AIMWTMF: Adequate
SWTMF and SCTF: Not assessed
Projected catch range next season (2010) Ecosystem Effects
AIMWTMF: Scallops 1400 – 2150 tonnes Food chain effects: Low
The annual fishing season arrangements in the AIMWTMF are set so that the majority of the mature scallops are able to spawn before fishing occurs. Breeding stocks are therefore protected to ensure that recruitment is dependent only on environmental conditions each year. Because this fishery was not opened for fishing in 2009 due to low predicted scallop abundance, small size and poor quality meat all the stock would have contributed to the breeding stock.
The total biomass taken by these fisheries is generally very small. Moreover, due to the high natural variability of scallop stock abundance it is unlikely that any predators are highly dependent on this species.
Habitat effects: Low
The fishers generally operate over a very small proportion of the licensed area and therefore the total area impacted by trawling is small. Trawling is not extensive and confined to trawl grounds where fishable scallop abundance is significant.
This fishery is highly variable, being dependent on sporadic recruitment, which appears to be strongly influenced by environmental conditions, e.g. the Leeuwin Current. A pre-season survey is undertaken annually. The survey index provided a catch prediction of 1775 tonnes whole weight providing a catch range 1400 to 2150 tonnes whole weight for the 2010 season.
The areas associated with scallops are sandy habitats and trawling activity does not impact these significantly.
The main performance measure for the AIMWTMF fishery relates to maintaining breeding stocks of scallops. This is done in two ways; by setting the season fishing period according to the catch prediction and by closing the fishery at a threshold catch rate level. No fishing took place in 2009 due to small meat size and meat quality and predicted very low catches.
Non-Retained Species Bycatch species impact: Low
The AIMWTF trawl fleet operates over a small portion of the licensed fishing area, focusing on scallop aggregations in several different areas or fish grounds and fishing activity is dependent on how widespread settlement is each season. Scallops settle on relatively bare sand habitats. In 2009, no fishing occurred.
The fishery therefore met this performance measur.e
In the SWTMF trawling for scallops is focused on a few small offshore areas, while the prawn catch is mainly taken from Comet Bay. An extensive study (Laurenson et al. 1993,1) of the environmental effects of this fishery has shown that the fishery has minimal impact on bycatch species’ populations.
Social Effects The estimated employment for the year 2009 was nine in the SWTMF and 10 in the SCTF.
The large-mesh (100 mm) trawl gear used in the SCTF takes minimal bycatch. The areas trawled by the boats also
1 Laurenson, L.J.B., Unsworth, P., Penn, J.W. and Lenanton,
R.C.J. 1993b. The impact of trawling for saucer scallops and western king prawns on the benthic communities in coastal waters off south-western Australia. Fisheries Research Report No. 100, Fisheries WA.

WEST COAST BIOREGION
Economic Effects Estimated annual value (to fishers) for year 2009:
AIMWTMF Nil
SWTMF: $0.2 million
SCTF: $0.3 million
For the SWTMF and the SCTF the estimated value of the scallop catch is based on wholesale price per kilogram obtained from these fisheries, which is $4.50/kg whole weight or $22.50/kg meat weight. Meat weight is approximately 20% of the whole weight.
Fishery Governance Target catch range:
AIMWTMF: 95 – 1,830 tonnes whole weight
Current fishing level: Acceptable
Except for a small number of years (see External Factors for details) the historic catch range for this fishery is 95 – 1,830
tonnes whole weight. The catch in 2009 was predicted to be low and due to poor meat size and quality no fishing took place.
New management initiatives (2009/10) Nil
External Factors High variability in the level of recruitment highlights the dependence of recruitment success upon environmental conditions, such as the Leeuwin Current, rather than spawning stock levels. The relationship between environmental factors and recruitment success is being evaluated for all these regions. This high variability in recruitment results in the level of fishing activity and quantity of catch within these fisheries to be variable and in addition, in recent times, the cost of fishing has affected fishing levels. Meat quality and size (for marketing purposes) is also important in the current economic climate and is a factor in determining the amount of effort expended in addition to stock abundance levels.
Abrolhos Islands Annual Scallop Catch and Effort
0
1,000
2,000
3,000
4,000
5,000
6,000
7,000
85 86 87 88 89 90 91 92 93 94 95 96 97 98 99 00 01 02 03 04 05 06 07 08 09
Year
L
and
ing
s (t
wh
ole
wei
gh
t )
0
2,000
4,000
6,000
8,000
10,000
12,000
14,000
16,000
18,000
20,000
No
min
al E
ffo
rt (
traw
l ho
urs
)
Whole weight
Nominal Trawl Hours
WEST AND SOUTH COAST SCALLOP FIGURE 1
Annual Scallop Landings And Nominal Effort For The Abrolhos Islands And Mid West Trawl Managed Fishery, 1985 – 2009.
52 DEPARTMENT OF FISHERIES

WEST COAST BIOREGION
STATE OF THE FISHERIES AND AQUATIC RESOURCES REPORT 2009/10 53
0
500
1000
1500
2000
2500
3000
90 91 92 93 94 95 96 97 98 99 00 01 02 03 04 05 06 07 08 09
Year
La
nd
ing
s (
t w
ho
le w
eig
ht)
WEST AND SOUTH COAST SCALLOP FIGURE 2
Annual Scallop Landings For South Coast Fishery, 1990 – 2009.
WEST AND SOUTH COAST SCALLOP FIGURE 3
Boundaries of the Abrolhos Islands and Mid West Trawl Managed Fishery, no fishing in 2009.
WEST COAST BIOREGION
West Coast Blue Swimmer Crab Fishery Status Report D. Johnston and D. Harris
Management input from N. Harrison
Main Features
Status
Stock level
Cockburn Sound Recovering
Peel-Harvey Estuary Acceptable
Fishing Level
Cockburn Sound Fishery closed
Peel-Harvey Acceptable
Current Landings
Commercial catch (08/09) 74 t
Cockburn Sound Fishery closed
Peel-Harvey Estuary 46 t
Catch by other commercial fisheries 28 t
Recreational catch
Approximately 60 - 70% of total catch
Peel-Harvey Estuary (Nov 07 - Oct 08) 107-193 t
Fishery Description The blue swimmer crab (Portunus pelagicus) is found along the entire Western Australian coast, in a wide range of inshore and continental shelf areas, from the inter-tidal zone to at least 50 metres in depth. However, the majority of the commercially and recreationally fished stock is concentrated in the coastal embayments between Geographe Bay (in the south) and Port Hedland (in the north).
The commercial blue swimmer crab fisheries within the West Coast bioregion are the Cockburn Sound Crab Managed Fishery, the Warnbro Sound Crab Managed Fishery, Area I (the Swan and Canning Rivers) and Area II (the Peel-Harvey Estuary) of the West Coast Estuarine Managed Fishery and Area I (Comet Bay) and Area II (Mandurah to Bunbury) of the Mandurah to Bunbury Experimental Crab Fishery. Originally, commercial crab fishers in WA used set (gill) nets or drop nets, but most have now converted to purpose-designed crab traps. Blue swimmer crabs are also retained as by-product by trawlers operating in Comet Bay (Area D of the South West Trawl Managed Fishery), and occasionally by trawlers operating in the waters from Fremantle to Cape Naturaliste (Area B of the South West Trawl Managed Fishery).
Recreational crabbing in the West Coast bioregion is centred largely on the estuaries and coastal embayments from Geographe Bay north to the Swan River and Cockburn Sound. They represent the most important recreationally fished inshore species in the southwest of WA in terms of participation rate. While the majority of recreational fishers use either drop nets or scoop nets, diving for crabs is becoming increasingly popular.
There are separate reports for crab fisheries in the Gascoyne and North Coast bioregions.
Governing legislation/fishing authority
West Coast Estuarine Fishery (Interim) Management Plan 2003
Cockburn Sound (Crab) Management Plan 1995
Warnbro Sound (Crab) Management Plan 1995
South West Trawl Management Plan 1989
Exceptions to the Fish Traps Prohibition Notice 1990 and Fish Traps Restrictions Notice 1994
Exemptions under Section 7 of the Fish Resources Management Act 1994
Consultation process
Meetings between the Department of Fisheries and the commercial fishing sector (WAFIC)
Meetings between the Department of Fisheries and the Recreational Fishing Advisory Committee (RFAC) and Recfishwest
Boundaries
The Cockburn Sound (Crab) Managed Fishery encompasses the inner waters of Cockburn Sound, from South Mole at Fremantle to Stragglers Rocks, through Mewstone to Carnac Island and Garden Island, along the eastern shore of Garden Island, and back to John Point on the mainland.
The Warnbro Sound (Crab) Managed Fishery includes Warnbro Sound itself and adjacent waters, extending from Becher Point to John Point.
The West Coast Estuarine Fishery encompasses the waters of the Swan and Canning Rivers and the waters of the Peel Inlet and Harvey Estuary, together with the Murray, Serpentine, Harvey and Dandalup Rivers.
54 DEPARTMENT OF FISHERIES

WEST COAST BIOREGION
The Mandurah to Bunbury Developing Crab Fishery covers the waters south of the Shoalwater Islands Marine Park (32°22´40˝ S) to Point McKenna near Bunbury (33�18´ S), and offshore to 115°30´ E. The fishery is further divided into two zones. A single northern zone (Area 1) 80-pot exemption (valid as at 30 June 2008) authorises crab fishing in a specified area of Comet Bay between 32°22´40˝ S and 32o30' S. Historically, four 60-pot exemptions were permitted to be operated In the southern zone (Area 2) (in the waters between Cape Bouvard and the southern boundary of the fishery). However, as at 30 June 2008, only two 60-pot exemptions were valid. The area separating the 2 zones (waters between 32o30' S and Cape Bouvard) is closed to commercial crab fishing.
The Geographe Bay fishery was officially closed on 21 January 2005 to reduce conflict between the recreational and commercial fishing sectors and commercial fishing in the Leschenault Estuary at Australind ceased in 2000.
Management arrangements
Commercial access to blue swimmer crab stocks in WA is governed by a series of separate management arrangements provided for under the legislative framework of the Fish Resources Management Act 1994. Individual fisheries are managed under an input control system, primarily through the regulation of vessel and trap numbers. Supplementary controls cover retainable species and associated minimum size limits, gear specifications and seasonal and daily time restrictions.
The principal management tool employed to ensure adequate breeding stock in the commercial crab fisheries involves maintaining minimum size limits well above the size at sexual maturity. Except for male crabs in Shark Bay, which mature at 115 mm carapace width, blue swimmer crabs become sexually mature below 100 mm carapace width. The legal minimum size range varies between 127 – 130 mm carapace width in the fisheries of the West Coast bioregion – well above the size at sexual maturity (86-98 mm carapace width).
Recreational fishing for blue swimmer crabs in Western Australia is managed through a series of input and output controls. As with commercial fishing, the principal management tool employed to sustain an adequate breeding stock involves maintaining minimum size limits well above the size at sexual maturity. A minimum legal size limit of 127 mm carapace width applies in State waters, along with a bag limit of 20 crabs per person or 40 crabs per boat. However, from November 1, 2007, the recreational bag limits in the West Coast bioregion have been halved to 10 crabs per person and 20 crabs per boat.
Restrictions also govern gear types that can be used to take blue swimmer crabs, along with localised spatial and temporal closures. Interim management measures have been introduced in August 2007 to include a seasonal closure to both commercial and recreational fishers in the Peel-Harvey Estuary for the months of September and October to protect pre-spawning female crabs.
Following several years of rapidly-depleting commercial blue swimmer crab catches in Cockburn Sound, the Minister for Fisheries closed the fishery to both commercial and
recreational fishing in December 2006. Commercial fishers were prohibited from taking crabs in the whole of the Cockburn Sound Managed Crab Fishery, while recreational fishers were prohibited from taking crabs south of a line from Woodman Point across to Garden Island. The closure remained in place for the 2008/09 season.
Following a partial recovery of crab stocks a review of the management arrangements for Cockburn Sound commenced in early 2009. The review was undertaken by a working group comprising representatives from WAFIC, Recfishwest and the Department of Fisheries. The review resulted in new management arrangements being implemented December 2009.
A voluntary Fisheries Adjustment Scheme resulted in the number of licenses in the Swan/Canning River (Area 1 of the West Coast Estuarine Fishery) being reduced from 4 to 2 in July 2005. A further licence was removed from the fishery in early 2008, and the final licence is expected to be resumed in 2010.
Research summary
Data for the assessment of blue swimmer crab stocks in the West Coast bioregion are obtained from a variety of sources. Commercial catch and effort is assessed using fishers’ compulsory catch and effort returns, voluntary daily log books from fishers in the Mandurah to Bunbury Inshore Experimental Crab Fishery, and data from on-board catch monitoring conducted by the Department of Fisheries’ research staff.
Annual trawl programs conducted in Cockburn Sound provide information on the status of the spawning stock and subsequent strength of recruitment, along with data on the general crab population.
Studies are currently being undertaken to investigate the relationships between environmental variables and the success of spawning of blue swimmer crab stocks. In Cockburn Sound, a stock-recruitment-environment model has been developed which correlates water temperature, in the pre-spawning months of August and September, and the size of the breeding stock with the following season’s commercial catch.
Following the closure of the Cockburn Sound crab fishery in December 2006, research funding (from the Development and Better Interest Fund) was granted to:
undertake additional sampling in Cockburn Sound to provide a finer resolution to the assessment of recruitment and breeding stocks during the recovery of the Cockburn Sound crab stock. From this data the recruitment index that drives a catch prediction model for the Cockburn Sound commercial blue swimmer crab fishery has been revised to more accurately estimate recruitment strength and the residual stock from the previous year and which determines the potential catch during the stock recovery;
maintain the Cockburn Sound commercial catch monitoring program during the fishery closure;
develop a commercial catch monitoring program in Warnbro Sound and the Swan River;
STATE OF THE FISHERIES AND AQUATIC RESOURCES REPORT 2009/10 55

WEST COAST BIOREGION
56 DEPARTMENT OF FISHERIES
examine the genetic relationship between the Cockburn Sound stock and those in Warnbro Sound and the Swan River;
develop a commercial catch monitoring program in the Peel-Harvey Estuary and Comet Bay (Area 1 of the Mandurah to Bunbury Inshore Experimental Crab Fishery);
develop a fishery-independent sampling program to assess the status of the Peel-Harvey crab stock; and
undertake a 12-month recreational survey in the Peel-Harvey Estuary between November 2007 and October 2008 to provide an estimate of total recreational catch and effort. Data collection during this study has been completed and the data is currently being analysed.
Retained Species Commercial landings (season 2008/09):
Cockburn Sound fishery closed
Peel-Harvey Estuary 46 tonnes
Other commercial fisheries 28 tonnes
The total commercial catch of blue swimmer crabs taken in Western Australian waters during the 2008/09 financial year was 847 t (West Coast Blue Swimmer Crab Figure 1) – a 10% decrease on the 947 t taken in 2007/08. Total landings from the West Coast bioregion declined 41% over the same period from 126 t in 2007/08 to 74 t in 2008/09.
The commercial catch from the Peel-Harvey Estuary (Area 2 of the West Coast Estuarine Fishery) for 2008/09 was 46 t. This represents a 49% decrease on the 90 t in 2007/08 (West Coast Blue Swimmer Crab Figure 3).
The Mandurah to Bunbury Inshore Experimental Crab Fishery reported an annual catch for 2008/09 of 10 t, representing a 50% decrease on the 20 t reported for the 2007/08 financial year (West Coast Blue Swimmer Crab Figure 4).
The Cockburn Sound (Crab) Managed Fishery remained closed for the 2008/09 financial year.
Recreational catch estimate:
Peel-Harvey Estuary (Nov 2007 - Oct 2008)
107-193 tonnes
Recreational catch for West Coast Bioregion:
approximately 60-70% of total catch
Most of the recreational blue swimmer crab fishing in Western Australia occurs in the West Coast bioregion. Departmental surveys have estimated recreational catches of blue swimmer crabs in this bioregion to be in the vicinity of 60-70% of the total catch.
A 12 month recreational catch and effort survey in the Peel-Harvey Estuary was completed in October 2008. This survey covered fishing from boats, shore, canals, and houseboats. Recreational catch for the Peel-Harvey Estuary from November 2007 to October 2008 was estimated to be
between 107-193 t, which represents a significant decline in recreational catch estimate of 251-377 t from the last survey undertaken in 1998/99. Boating has become the dominant fishing method with a decline the amount of scoop netting undertaken. The majority of fishers are now also Mandurah locals rather than people from the metropolitan area.
Recent surveys produced relatively consistent recreational catch estimates for Cockburn Sound of 18 t, 23 t and 18 t for the 2002, 2003 and 2004 calendar years respectively. However, the recreational catch for the 2005/06 financial year was estimated to be just 3 t. The Minister for Fisheries closed the Cockburn Sound crab fishery to recreational fishing in December 2006, south of a line between Woodman Point and the northern end of Garden Island. The closure remained in effect during the 2007/08 financial year. A recreational survey quantifying catch and effort in the West Coast bioregion has been conducted between 2007/08 and 2009/10. Analysis of the data will be carried out in the second half of 2010.
A 12-month survey of recreational fishing in the Swan/Canning Estuary Basin between August 1998 and July 1999 estimated the total recreational blue swimmer crab catch to be 7.3 t. This compares with a commercial catch during the 1998/99 financial year of 24 t. In subsequent years, commercial catches have ranged between 10 t and 20 t, but no further recreational surveys have been undertaken.
Both the Leschenaulte Inlet and Geographe Bay are now exclusively for recreational use. Previous surveys have found the annual recreational blue swimmer crab catch from Geographe Bay to be between 7 – 11 t per year.
Fishing effort/access level
The Cockburn Sound (Crab) Managed Fishery remained closed for the 2008/09 financial year.
Commercial fishers in the Peel-Harvey Estuary reported 48,762 trap lifts during the 2008/09 season – a 16% decrease on the 57,940 trap lifts reported the previous year (West Coast Blue Swimmer Crab Figure 3).
Commercial effort in the Mandurah to Bunbury Inshore Experimental Crab Fishery also fell in 2008/09, with a total of 17,306 trap lifts reported compared to 24,006 trap lifts the previous year (West Coast Blue Swimmer Crab Figure 4). The annual fishing effort in both of these fisheries has been found to follow variations in the abundance of the resident crab stock.
Stock Assessment Assessment complete: Yes
Assessment method:
Cockburn Sound Direct survey
Other West Coast fisheries Catch rate
Breeding stock levels:
Cockburn Sound Recovering
Other West Coast fisheries Adequate
WEST COAST BIOREGION
The commercial trap catch and catch rate presented are measures based on the weight of commercially retained crabs. The substantial decline in these indices recorded in 2008/09 does not necessarily reflect a similar decline in the overall abundance of crabs in the Peel-Harvey Estuary. However the fishery will be monitored closely in 2009/10 in view of the low catch in 2008/09.
Catch rates from fisheries within the West Coast bioregion generally provide an index of abundance that can be used to assess individual fishery performance from year-to-year. Direct surveys of recruitment and breeding stock have been conducted in Cockburn Sound for about 10 years and are now being developed for Peel-Harvey.
Cockburn Sound: No commercial fishing for blue swimmer crabs took place in Cockburn Sound during 2008/09 as the fishery remained closed.
A large breeding stock in 2007 produced a successful recruitment in March-June 2008. However, above average early and extended rainfall between April and July 2008 flushed the already recruited sub-adult cohort out of the estuary and impeded further recruitment of juveniles into the estuary. This resulted in slower than average growth between the onset of rains in April, through to November when the 2008/09 season commenced. Consequently, crabs were potentially a moult behind. Very large numbers of these sub-adults entered the estuary in November and December 2008, such that competition for available resources resulted in a lower proportion than usual successfully moulting through to legal size over the 2008/09 summer. Consequently, significantly greater numbers of undersize crabs (<127mmCW) were captured in commercial traps during 2008/09, potentially impeding the numbers of size crabs entering traps. Following a later than average moult time possibly combined with food limitation, the muscle tissue in many crabs remained under-developed and crabs were therefore lighter than usual.
Historically, natural variations in stock abundance have resulted in large fluctuations in the annual commercial blue swimmer crab catch from Cockburn Sound (e.g. 362 t in 1996/97 versus 92 t in 2001/02). This fluctuation relates largely to variable recruitment, although the shift by commercial fishers from set nets to crab traps in the mid-1990s initiated a marked increase in mean annual crab landings.
Following the second highest annual catch on record in 2000 (340 t), however, the catch declined over the next few years to the point where the low stock abundance required closure of the fishery (in December 2006).
Like many other blue swimmer crab fisheries, adequate protection to the breeding stock in Cockburn Sound had relied primarily on a minimum legal size set well above the size at sexual maturity, which would allow female crabs to spawn at least once before entering the fishery. However, a combination of biological, environmental and fishery-dependent factors contributed to the collapse and include: 1) vulnerability to environmental fluctuations as this species is at the southern extreme of its temperature tolerance, 2) a life cycle contained within an embayment and is self-recruiting, 3) a change in fishing method from gill nets to traps which increased fishing pressure on pre-spawning females in winter and reduced egg production to one age class, 4) four consecutive years of cooler water temperatures resulting in poor recruitment and 5) continued high fishing pressure during years of low recruitment resulting in low breeding stock.
In response to the lower quality, lighter crabs, some commercial fishers had difficulty in marketing and chose to retain crabs at a higher size (130-135 mm CW) than the legal minimum size of 127 mm CW. This practice lowered the annual catch as crabs measuring 127-135mm CW traditionally form a significant proportion of the commercial blue swimmer crab catch from the Peel-Harvey fishery. Consequently, while commercial fishers reported high numbers of crabs in their traps, both numbers of retained crabs and mean catch weights were down
A recreational survey conducted in the Peel-Harvey Estuary during 2007/08 estimated that the recreational take accounted for approximately 60 % of the total catch. Consequently, it is recognized that commercial catch data alone may not provide an accurate indication of the status of crab stocks in this estuary.
Research trawling has been conducted in Cockburn Sound since 1999 to collect data on juvenile blue swimmer crab abundance for use in a catch prediction model. The number so recruits and the residual stock from the previous year correlate strongly with catch levels the next year.
Mandurah-Bunbury: Mean annual trap catch rates in the Mandurah to Bunbury Inshore Experimental Crab Fishery have increased steadily since the commencement of exploratory fishing along the coast south of Mandurah to Bunbury in 2002. This increase reflects more efficient fishing of the region crab stocks as the commercial operators’ knowledge of the spatial and temporal distribution of resident stocks and localized environmental influences increased over time. The mean catch rate for 2008/09 in the Mandurah to Bunbury fishery was 1.15 kg/trap lift – a marginal increase on the 2007/08 catch rate of 1.10 kg/trap lift (West Coast Blue Swimmer Crab Figure 4).
While a modest improvement in recruitment to the Cockburn Sound crab stock was evident from 2006 to 2008 during the fishery closure (recruitment indices of 0.124, 0.358 and 0.497 for 2006, 2007 and 2008 respectively), recruitment in 2009 was still low (recruitment index of 0.468). However, the absence of fishing pressure resulted in a substantial increase in residual (2+) stock (residual index increased from 0.301 in 2006 to 5.76 in 2009). The recovery of the combined residual stock and recruitment index was sufficient to warrant a limited level of fishing in Cockburn Sound during the 2010 fishing season.
Peel Harvey: The mean annual catch rate for 2008/09 in the Peel-Harvey estuary was 0.94 kg/trap lift, the equal lowest mean annual catch-rate since the conversion from set nets to crab traps in the late nineties. It follows the record 2007/08 catch rate of 1.56 kg/trap lift (West Coast Blue Swimmer Crab Figure 3).
Monthly monitoring surveys conducted aboard commercial vessels in the Mandurah to Bunbury fishery have indicated a high percentage of female crabs in the catch from this fishery, especially during the peak period of commercial fishing from April to August, and this will need to be closely monitored to avoid overfishing the breeding stock.
STATE OF THE FISHERIES AND AQUATIC RESOURCES REPORT 2009/10 57

WEST COAST BIOREGION
Non-Retained Species Bycatch species impact: Negligible
The shift from using set nets to traps in most blue swimmer crab fisheries has resulted in a substantial reduction in bycatch from dedicated crab fishing. Pots are purpose-designed to minimise the capture of non-target species and are therefore an inefficient way to capture fish, the majority of which are able to escape through the entrance gaps when the pot is soaking or being hauled.
Small numbers of fish are infrequently captured in crab pots, but the fishers are not permitted to retain them. The low number of fish caught and returned by crab fishers is considered to pose a negligible risk to these stocks.
Discarded bycatch from trawl fisheries taking crabs as a by-product is dealt with in the status reports that are specific to each trawl fishery.
Protected species interaction: Negligible
The crab trap longline system used in the targeted crab fisheries has little possibility of interacting with protected species. The fishery is conducted in a manner that avoids mortality of, or injuries to, endangered, threatened or protected species and avoids or minimises impacts on threatened ecological communities.
Ecosystem Effects Food chain effects: Low
As the commercial take of crabs represents a relatively small portion of the biomass, which is effectively renewed annually and subject to high levels of natural variation in abundance, secondary food chain effects are likely to be minimal in these fisheries.
Habitat effects: Negligible
Fishing with traps results in limited habitat disturbance, with only minor dragging of traps on the bottom occurring during trap retrieval. Sand and associated biota do not get brought to the surface in commercial blue swimmer crab traps, as the mesh used on traps is sufficiently large to allow the escape of any sand-dwelling macro-benthos.
Although seagrasses are occasionally brought to the surface with the trap, the infrequent nature of this occurrence, and the small amount of living seagrass removed, results in minimal habitat damage.
Social Effects During 2008/09, approximately 23 people were employed as skippers and crew on vessels targeting blue swimmer crabs in the West Coast bioregion. Employment numbers have been adversely affected by the closure of the Cockburn Sound Crab Fishery in November 2006, which accounts for as many as 14 commercial fishers.
Blue swimmer crabs also provide a highly popular recreational fishery, particularly in the Peel-Harvey and
Geographe Bay region, where they dominate the inshore recreational catch. Recreational fishing in this region has also been affected by the closure of the Cockburn Sound crab fishery.
Economic Effects Estimated annual value
(to fishers) for year 2008/09: $0.52 million
The economic value of commercial blue swimmer crab fishing to the State of Western Australia for the 2008/09 season was estimated to be $4.2 million – down slightly on the $4.4 million generated in 2007/08.
With no catch from the Cockburn Sound crab fishery, and reduced catches in the Peel-Harvey Estuary and Area II of the Mandurah to Bunbury Inshore Experimental Crab Fishery, the blue swimmer crab catch in the West Coast bioregion for 2008/09 was valued at around $520,000. Most West Coast fishers were able to maintain an increased beach price (averaging around AUS$7/kg live weight) for blue swimmer crabs sold at local markets due to the Cockburn Sound closure maintaining a tightening of local supply. The poor quality of the catch from the Peel-Harvey Estuary, however, led to a reduction in beach price (circa $5.50/kg live weight) for crabs from this fishery. While most of the catch from the West Coast bioregion was sold through local markets, the increase in beach prices was also supported by the continued cultivation of interstate markets.
Fishery Governance Target catch (or effort) range: Under review
In the light of recent recruitment failures in the Cockburn Sound fishery, the target range will need to be reviewed when the fishery is re-opened.
Current fishing (or effort) level
Cockburn Sound: Not Applicable
Other West Coast Bioregion fisheries:
Under Development
New management initiatives (2009/10)
As a result of the bi-partisan commitment to close the Swan River to commercial fishing, the Department will be implementing a Compulsory Fisheries Adjustment Scheme to complete this initiative. The final licence is expected to be resumed in 2010.
As an outcome of the review into the management arrangements for Cockburn Sound the following changes will be implemented in December 2009 for this fishery.
Limited open season 15 Dec to 31 March (both recreational and commercial)
Increase in commercial size limit for blue swimmer crabs from 130mm to 140mm
20% pot reduction in the commercial fishery
58 DEPARTMENT OF FISHERIES

WEST COAST BIOREGION
STATE OF THE FISHERIES AND AQUATIC RESOURCES REPORT 2009/10 59
External Factors
The Mandurah to Bunbury Developing Crab Fishery underwent its final review by the Developing Fisheries Assessment Committee (DFAC) in mid-2007 as part of the ‘Developing New Fisheries’ process. The Department of Fisheries is considering the recommendations of the DFAC and intends to make clear recommendations in 2010 regarding the future viability of a fishery in this region.
Levels of recruitment to many of the crab fisheries fluctuate considerably. While the causes of these variations are not fully understood, it is considered most likely due to environmental influences (e.g. water temperature) both on spawning success and larval survival through to recruitment. The relationship between environmental factors, recruitment and catch is being further evaluated as data becomes available.
Blue Swimmer Crab - Catch by Bioregion
Year
95/96 96/97 97/98 98/99 99/00 00/01 01/02 02/03 03/04 04/05 05/06 06/07 07/08 08/09
Cat
ch
(to
nnes
)
0
200
400
600
800
1000
1200State Catch (commercial)West CoastGascoyne CoastNorth Coast
WEST COAST BLUE SWIMMER CRAB FIGURE 1
State and bioregion commercial catch history for the blue swimmer crab (Portunus pelagicus) in Western Australia since 1995/96.

WEST COAST BIOREGION
Blue Swimmer Crab - Trap Catch and Effortckburn Sound
Year
Co350 1.4
93/94 94/95 95/96 96/97 97/98 98/99 99/00 00/01 01/02 02/03 03/04 04/05 05/06 06/07 07/08 08/09
Cat
ch (
tonn
es)
and
eff
ort
(tr
ap li
ts x
1,0
00)
0
50
100
150
200
250
300
CP
UE
(kg
/trap
lift
)
0.0
0.2
0.4
0.6
0.8
1.0
1.2
CatchEffortCPUE
FISHERYCLOSED
WEST COAST BLUE SWIMMER CRAB FIGURE 2
Blue swimmer crab catch (t), effort (trap lifts x 1,000) and catch per unit effort (kg/trap lift) in the Cockburn Sound Crab Fishery between 1993/94 and 2008/09 using traps.
Blue Swimmer Crab - Trap Catch and EffortPeel/Harvey
Year
95/96 96/97 97/98 98/99 99/00 00/01 01/02 02/03 03/04 04/05 05/06 06/07 07/08 08/09
Cat
ch (
tonn
es)
and
e li
fts
x 1,
ffo
rt (
trap
000)
0
20
40
80
60
100
CP
UE
(kg
/ li
ft)tr
ap
0.0
0.2
0.4
0.6
0.8
1.0
1.2
1.4
1.6CatchEffortCPUE
EST COAST BLUE SWIMMER CRAB FIGURE 3
lue swimmer crab catch (t), effort (trap lifts x 1,000) and catch per unit effort (kg/trap lift) in Area 2 of the West Coast e Fishery (the Peel-Harvey Estuary) between 1996/97 and 2007/08 using traps.
W
BEstuarin
60 DEPARTMENT OF FISHERIES

WEST COAST BIOREGION
Blue Swimmer Crab - Trap Catch and EffortMandurah to Bunbury
Year
0
5
10
20
30
0.0
0.2
0.4
0.6
1.0
1.2
1.4
1.6
02/03 03/04 04/05 05/06 06/07 07/08 08/09
Cat
ch (
tonn
es)
and
ex
1,00
0) CatchEffort
25 CPUE
ffo
rt (
trap
lift
s
CP
UE
( li
ft)
apkg
/tr
15 0.8
WEST COAST BLUE SWIMMER CRAB FIGURE 4
effort (trap lifts x 1,000) and catch per unit effort (kg/trap lift) in the Mandurah to Bunbury shery between 2002/03 and 2008/09.
Blue swimmer crab catch (t), Inshore Experimental Crab Fi
STATE OF THE FISHERIES AND AQUATIC RESOURCES REPORT 2009/10 61

WEST COAST BIOREGION
62 DEPARTMENT OF FISHERIES
st Deep Sea Crab (Interi
n Managed
albus), Giant
agement Act 1994
ish resources Management Regulations 1995
eetings between the Department of Fisheries and industry
ble
s to opriate
m of 120mm carapace width applies and for
he interim management plan came into effect on the 1 key
al of management
20 tonne limit for Crystal Crabs (annual quota of 140
nnes) and a 2 tonne limit for Giant and Champagne Crabs
sea crabs. These have el remaining within an
d to
2008 performance measures based on whether e quota is achieved and the catch rate and effort required to
andings (season 2009):
136 tonnes
ry in
small catch of 2.3 t Champagne rab was taken in 2009 which was the first catch of this
ce 2006.
2009) Nil
West Coa m) Managed Fishery Status
the lesser targeted species, Champagne and Giant crab, a minimum size of 92 and 140mm carapace length respectively applies.
Report A. Thomson and P. Unsworth
Management input by K. Nardi
Main Features
Status
Stock level Acceptable
Fishing Level Acceptable
C
C
C 2.3 t
urrent Landings
rystal Crabs 136 t
hampagne Crabs
Fishery DescriptioTThe West Coast Deep Sea Crustacean (Interim)
Fishery targets Crystal (Snow) Crabs (Chaceon January 2008. This plan introduced a number ofmanagement changes such as the remov(King) Crabs (Pseudocarcinus gigas) and Champagne
(Spiny) Crabs (Hypothalassia acerba) using baited pots operated in a long-line formation in the offshore waters of the
zones in the fishery, removing part-time permits and initiating a quota management system, with individual transferable quota for each existing permit holder. There are currently seven permits operating in the fishery. Each permithas a
West Coast.
Governing legislation/fishing authority
Fish Resources Man
tocombined (annual combined quota of 14 tonnes).
A comprehensive Ecologically Sustainable Development F(ESD) assessment of this fishery determined that performance should be measured annually against measures West Coast Deep Sea Crustacean Fishery (Interim)
Management Plan 2007 relating to the breeding stocks of deep now been defined as the catch levAustralian Government Environment Protection and
Biodiversity Conservation Act 1999 (Wildlife Trade Operation) - Export approval through until May 2013.
Consultation process
acceptable range.
Research summary
Research for this fishery has involved assessing the current status of the west coast deep sea crab stocks based on commercial catch returns, log book information and at-sea research monitoring of the catch. The annual total CrystalCrab catch from 2000 to 2008 have been historically usemonitor this fishery for ecologically sustainable developmentassessment. However, since the quota system has come into
M
Boundaries
The boundaries of this fishery are all the waters lying north of latitude 34° 24' S (Cape Leeuwin) and west of the Northern operation in
thTerritory border on the seaward side of the 150m isobath out to the extent of the Australian Fishing Zone.
Management arrangements
The West Coast Deep Sea Crustacean (Interim) Managed Fishery is a quota based ‘pot’ fishery. The fishery mostly operates in depths of 500-800 metres, with the only allowamethod for capture being baited pots (‘traps’). These are operated in ‘long-lines’, which have between 50 and 100 potsattached to a main line marked by a float at each end.
The Department of Fisheries has in place, regulationprotect breeding females by the establishment of apprminimum size limits. For the principal target species Crystal Crab, a minimu
achieve the catch will be required.
Retained Species Commercial l
Crystal Crab
Champagne Crab 2.3 tonnes
A catch of 136 t of crystal crabs was taken in the fishe2009 – similar to the catch taken in the 2008 season (139 t) (Deep Sea Crab Figure 1). ACspecies sin
Recreational catch estimate (season

WEST COAST BIOREGION
Fishing effort/access level
Effort decreased by 10% from an estimated 90,000 pot lifthe 2008 season to 81,000 pot lifts in the 2009 season. The effort estimate in this fishery is based on detailed catch and effort
ts in
research logbook returns, which are required to be ompleted by fishers in this fishery during its developmental
s
e standardised catch per unit of fishing effort (CPUE) for crystal crabs increased by 8%, from 1.23 kg/pot lift in 2008 to 1.33 kg/pot lift in 2009 (Deep Sea Crab Figure 2). The long-term CPUE dataset for the fishery shows a decrease in the early years of the fishery, presumably in response to depletion of accumulated biomass. Catch rates have been relatively stable since 2003. However it is not clear how changes in CPUE in this fishery are influenced by efficiency increases resulting from improvements by fishers in the type of gear that they use and the way that they deploy it, compared to variations in the catchability and local abundance levels of the crabs. The change to quota management in 2008 and removal of zones have also affected the catch rate.
Crystal crabs are known to be very slow-growing, as are most other deep-water species. Preliminary estimates suggest that the males attain maturity at around 12 years and reach legal minimum size at about 14 years. Ageing estimates are not available for females, but size at maturity information shows that they mature well below the legal size limit and probably moult once after reaching maturity, which means that their contribution to the fished biomass is small and that egg production in the fishery is well protected by the legal size limit provided that there are sufficient males.
Non-Retained Species Bycatch species impact Low
The gear used in this fishery generates minimal bycatch and the design of the pots is such that they do not ‘ghost fish’ if lost.
Protected species interaction Negligible
The pots and ropes used in crab longlines have minimal capacity to interact with protected species in this fishing area.
cosystem Effects
Assuming that all the round is equally productive, means that at catch levels
grams of crabs etre of ground.
Habitat effects Low
Crab potting is considered to have a low impact on the largely soft mud habitat over which the fishery operates.
Social Effects This fishery is based on mobile vessels that employ a skipper and two or three crew. The product is landed live at ports between Carnarvon and Fremantle, generating some additional economic activity and benefits. There were three vessels operating in 2009.
Economic Effects Estimated annual value (to fishers)
for year 2009 $2.1 million
The beach value of the fishery was about $2.1 million in 2009, based on an average beach price of $15/kg for crystal crab. The majority of the catch is exported live to south-east Asia.
Fishery Governance Current fishing (or effort) level Acceptable
now lower than it has been for several years. This is a relatively new commercial fishery that has only been fished on a full-time basis since 2000 and the target is a long-lived species.
Target catch range 100-140 tonnes
The TAC for the fishery has been set well below landings of recent years and is at the lower end of the target catch range for the WTO assessments. A preliminary effort range to achieve the TAC, based on the steady range of catch rates since 2001, is 70 – 100,000 pot lifts. This effort range will be adjusted as more data becomes available from this fishery whilst under quota management.
New management initiatives (2009)
The fishery has recently (2008) moved to output controls. New initiatives in pot design are being considered in 2010.
erformance measure needs to be revised to include whether the quota has been achieved and the effort required to achieve the quota.
cstatus.
Stock Assessment Assessment complete Ye
Assessment method Catch rate
Breeding stock levels Adequate
Th
EFood chain effects Negligible
Catches of the 3 species of deep sea crabs landed represent a very small biomass, and any impact of fishing on the general food chain is expected to be minimal. Most of the commercial crystal crab catch is taken between 500 to 800 metres in depth. A rough estimate of the amount of ground between 500 – 1,000 m over the distributional range of crystal crabs is about 50,600 km2. gexperienced in the past season roughly 3 kiloare being removed each year per square kilom
Because of the TAC, the catch in the crystal crab fishery isThe performance measure is whether the catch remains within the range 100-250 t. This criterion was met. As the fishery has moved to catch quota, the p
STATE OF THE FISHERIES AND AQUATIC RESOURCES REPORT 2009/10 63

WEST COAST BIOREGION
West Coast Deep Sea Crab Annual Catch
0
50
100
Cat
ch (
ton
nes
)
150
200
1997 1999
Year
250
1989 1991 1993 1995 2001 2003 2005 2007 2009
Crystal Crab
Champagne Crab
W
A 989. Annual giant crab catches have always been small, and the
EST COAST DEEP SEA CRAB FIGURE 1
nnual catches of crystal and champagne crabs since 1y have therefore been excluded.
3
2.5
2000 2001 2002 2003 2004 2005 2006 2007 2008 20090
0.5
1
1.5
2
lift)
Cat
ch r
ate
(kg/
pot
Year
l crabs.
WEST COAST DEEP SEA CRAB FIGURE 2
Standardized catch per unit effort since 2000 for crysta
64 DEPARTMENT OF FISHERIES

WEST COAST BIOREGION
West Coast Nearshore and Estuar s Status
. Smith and J. Brown
brunn
ine Finfish ResourceReport K
Management input from N. Harrison and A. Warm
Main Features
Status
Stock levels
Australian herring Uncertain
table
garfish Acceptable
Acceptable
Acceptable
able
Not assessed
cceptable
Acceptable
ng Not assessed
009)
it only)
.
vey 2000/01 940 t (key species only)
Tailor Accep
Southern sea
Whiting species Not assessed
Sea mullet
Whitebait
Black bream (Swan-Canning) Accept
Black bream (other estuaries)
Cobbler (Swan-Canning) Not a
Cobbler (Peel-Harvey)
Cobbler (Leschenault) Not assessed
Perth herri
Fishing Level Acceptable
Current Landings (2
Commercial total 827 t (finfish only)
South West Coast Salmon Fishery 494 t (salmon only)
West Coast Beach Bait & South West Beach Seine
Fisheries 131 t (whiteba
West Coast Estuarine Fisheries 36 t (finfish only)
Recreational not available for current year
Most recent sur
Fishery DescriptionCommercial - Nearshore Commercial fishers target a large number of finfish species in
st Coast Bioregion
Tn Sound. The main targets are southern sea
ing
Coast Salmon Managed Fishery operates on arious beaches south of the metropolitan area. This fishery
to target salmon (Arripis rring.
TFisher ious beaches from Tim's Thicket
int Déntrecasteaux (south coast), with most h).
T isheries both target whitebait (Hyperlophus ttatus), but blue sprat (Spratelloides robustus), sea mullet
), yellow-finned whiting (Sillago southern sea garfish and yellow-eye mullet steri) are also taken in small quantities.
lows
m) Managed Fishery. These fishers mainly
Estuarine
s. It s
lue
ast Blue Swimmer Crab Fishery status report. The
commercial fishery, although not included in
creational species clude Australian herring, tailor (Pomatomus saltatrix),
arious species), southern sea garfish, silver trevally spp.) and black bream (Acanthopagrus
nearshore and estuarine waters of the Weusing a combination of gill nets, haul nets and beach seines.
he Cockburn Sound (Fish Net) Managed Fishery uses gill nets in Cockburgarfish (Hyporhamphus melanochir) and Australian herr(Arripis georgianus).
West The Southvuses seine and haul nets, mainlytruttaceus) and he
The West Coast Beach Bait Managed Fishery operates on various beaches from Moore River (north of Perth) to Tim's
hicket (south of Mandurah). The South West Beach Seine y operates on var
southwards to Poeffort in Geographe Bay (Cape Naturaliste to Preston Beac
hese seine net fvi(Mugil cephalusschomburgkii), (Aldrichetta for
A number of commercial beach net fishers currently operate outside the metropolitan area under an Exemption that althem to fish in the waters of the West Coast Demersal
Scalefish (Interiuse haul net and beach seine nets to target sea mullet, mulloway (Argyrosomus hololepidotus), Australian herring, yellow-finned whiting and southern sea garfish. These fishing operations will be managed within in the proposed West Coast Inshore Net Fishery.
Commercial - West Coast Estuarine (Interim) Managed Fishery (WCEF) operates in the Swan/Canning and Peel/Harvey Estuarieis a multi-species fishery targeting blue swimmer crab(Portunus pelagicus) and numerous finfish species. The bswimmer crab component of the fishery is reported in the West Cofinfish component is described in this report. The methods used by commercial fishers to target finfish in West Coast estuaries are gill nets and haul nets.
The Hardy Inletthe WCEF interim management plan, is also reported here asit shares the characteristics of the other west coast estuarine fisheries.
Recreational Most finfish caught recreationally in West Coast estuaries and nearshore waters are taken by shore or boat-based line fishing. The most commonly targeted reinwhiting (v(Pseudocaranx
STATE OF THE FISHERIES AND AQUATIC RESOURCES REPORT 2009/10 65

WEST COAST BIOREGION
butcheri) (estuaries only).
curs
ry
al Scalefish (Interim) Managed Fishery
subsidiary legislation
Commercial Meetings between the
peak body members
Commercial
y Great North Road).
hicket south
t.
roposed - West Coast Inshore Net Fishery – Moore River f Shark Bay)
et fishers must hold a licence.
of d g
ler
A relatively small amount of recreational net fishing ocin the West Coast Bioregion, mainly to target sea mullet.
Governing legislation/fishing authority
Commercial West Coast Estuarine Fishery (Interim) Management Plan
2003
West Coast Estuarine (Interim) Managed Fishery Permit
Cockburn Sound (Fish Net) Management Plan 1995
Cockburn Sound (Line and Pot) Management Plan 1995
Fish Resources Management Act 1994 and subsidialegislation
Closed waters and Permitted Gear Orders under Section 43 ofthe Fish Resources Management Act 1994
Condition 19 on a Fishing Boat Licence
Condition 17 on a Commercial Fishing Licence
Directions to Licensing Officers
West Coast Demersal Scalefish Fishery (Interim) Management Plan 2007
West Coast Demers Permit
West Coast (Beach Bait Fish Net) Management Plan 1995
South-West Coast Salmon Fishery Management Plan 1982
South-West Coast Salmon Managed Fishery Licence
Proclaimed Fishing Zone Notice (South-West Coast) 1975
Salmon Block Net Prohibition Notice 1996
Salmon and Snapper Purse Seining Prohibition Notice 1987
Condition 68 on a Fishing Boat Licence
Commonwealth Government Environment Protection andBiodiversity Conservation Act 1999 (Export Exemption)
Recreational Fish Resources Management Act 1994 and
Consultation processes
Department of Fisheries, industry and (e.g. the Western Australian Fishing
Industry Council).
Recreational Regional Recreational Fishing Advisory Committees and
Recfishwest.
Boundaries
WCEF: The management plan encompasses all estuaries in the West Coast Bioregion between 27º S and 33º11´ S. Complex closures exist for both the Swan/Canning and Peel/Harvey commercial fisheries (refer to management
plans, related legislation and regulations).
Waters of Hardy Inlet and the Blackwood River are open to commercial fishing upstream from a line connecting Point Irwin to the Irwin Street boat ramp to a line drawn across theriver from the eastern boundary of Sussex Location 133 (approximatel
Leschenault Estuary: Closed to Commercial fishing
The Cockburn Sound (Fish Net) Managed Fishery operates within Cockburn Sound.
West Coast Beach Bait Managed Fishery: From Moore River(north of Perth), to Tim’s Thicket (south of Mandurah).
South West Beach Seine Fishery: From Tim’s Tto Point D’Entrecasteaux, with most effort reported in Geographe Bay (Cape Naturaliste to Preston Beach).
South-West Coast Salmon Managed Fishery: all waters north of Cape Beaufor
(Pto Zuytdorp Cliffs, south o
Recreational Recreational line fishing is permitted in most areas within estuaries and nearshore waters of the West Coast Bioregion. Some spatial closures exist, including closures in marine reserves and around industrial structures.
A small number of areas within estuaries and nearshore waters of the West Coast Bioregion are open to recreational netting. Recreational nRecreational net fishing regulations are complex – please refer to the 'Recreational Net Fishing Guide' for details.
Management arrangements
Commercial The west coast nearshore and estuarine commercial fisheriesare managed primarily through input controls in the formlimited entry and gear restrictions, as well as seasonal antime closures, area closures and size limits. Finfish fishinmethods are restricted to gill nets, seine nets and haul nets.
Recreational Recreational fishers in west coast estuaries and nearshore waters take a diverse array of finfish species. Size and possession limits apply to these species when caught recreationally in the West Coast Bioregion. Refer to the 'Recreational Fishing Guide - West Coast Bioregion' for details.
As many recreationally targeted species are also targeted bythe commercial sector, resource-sharing issues are a major consideration in future management arrangements.
Key species Tailor, black bream and yellow-finned whiting are assigned to the ‘medium risk’ category. Australian herring, southern sea garfish, sea mullet and Perth herring (Nematalosa vlaminghi) are assigned to the ‘low risk’ category. Cobb(Cnidoglanis macrocephalus) is assigned to the ‘medium risk’ category, except in the Swan-Canning estuary, where a total fishing ban is in effect until 2017.
66 DEPARTMENT OF FISHERIES
WEST COAST BIOREGION
STATE OF THE FISHERIES AND AQUATIC RESOURCES REPORT 2009/10 67
mmercial catch levels are determined annually from tional
to
atches in
f
ntly
outh
s
h)
quantities of the same species that are taken by
estuarine
atch
by
ased
A have been taken in the
ry
ince 2000, the total state annual commercial catch of herring t in 2000 to 184 t in 2009. Annual
wnward the South Coast and
n
ched an historical peak of 150 t in 1988 and again in
t
95,
h the
Research summary
Monitoring of fisheries and fish stocks in West Coast estuaries and nearshore waters is based on commercial catch and effort statistics (CAES) from compulsory monthly returns, recreational catch and effort data from voluntary recreational fisher log books (Research Angler Program) andrecreational fishing surveys, fishery-independent surveys using beach seine nets to monitor annual juvenile recruitment by various fish species (including herring, whiting and mullet) and research angling to monitor annual juvenile tailorrecruitment.
While codata reported in compulsory commercial returns, recreacatch levels are estimated only occasionally when recreational fishing surveys are conducted.
A 12-month, state-funded NRM research project designed provide more rigorous monitoring and assessment of the status of Australian herring and tailor commenced in mid-2009. Volunteer anglers and commercial fishers provided samples of these species to enable researchers to determine the age structure of recreational and commercial cthe West Coast Bioregion. This information will be used to assess the feasibility of ongoing age-based assessments and to develop methods, if appropriate, to monitor levels oannual fishing mortality for herring and tailor in the West Coast Bioregion.
The NRM-funded project is also examining aspects of stock structure, including sources of recruitment to the West Coast herring and tailor stocks. The majority of West Coast tailor landings are taken by recreational fishers in the metropolitan area. Monitoring of juvenile recruitment since the mid-1990s has identified two significant 'pulses' of 0+ recruits that arrive each year. Limited data suggests that these pulses are products of both local and remote (i.e. outside Perth metropolitan waters) spawning events. Research is curreunderway to examine source(s) of recruitment to the metropolitan tailor fishery, which may also assist in explaining the highly variable annual recruitment to this fishery. The proportions of herring in the West Coast fishery that originate from nursery sites in the West Coast and SCoast Bioregions is also being examined.
Retained Species Total commercial finfish landings (2009):
723 tonnes in nearshore waters
104 tonnes in estuarine water
Commercial landings by fishery (2009):
South West Coast Salmon: 494 tonnes (salmon)
WC Beach Bait + SW Beach Seine:
131 tonnes (whitebait)
West Coast Estuarine + Hardy Inlet:
36 tonnes (finfis
The commercial catches reported in West Coast Nearshore and Estuarine Table 1 are taken by estuarine fisheries andbeach-based fisheries using gill nets, haul nets and beach
seines. Minorother methods (e.g., purse seine, demersal gill nets and long-lines) are not included in Table 1. Catches by all methods and all fisheries are included in the catches reported for key species in the following sections and in individual stock assessments.
In 2009, the total commercial catch of finfish byand beach-based fisheries in the West Coast Bioregion included approximately 24 species. The majority of the cconsisted of Australian salmon (60% by weight), which was caught primarily by the South West Coast Salmon ManagedFishery, and whitebait (16%), which was caught primarilythe South West Beach Seine Managed Fishery.
Excluding salmon and whitebait, the remaining finfish landings in 2009 were composed of approximately equal contributions by estuarine (103 t) and nearshore beach-bfisheries (93 t).
Key finfish species:
Commercial nearshore species
Australian herring: Since 2000, 83% of total commercial landings of Australian herring in WSouth Coast Bioregion, with the remaining 17% taken in the West Coast Bioregion. Within the West Coast Bioregion, 62% of landings were taken in the Geographe Bay/Bunbuarea, 21% taken in Cockburn Sound and 8% taken in the Peel-Harvey estuary.
Ssteadily declined from 818landings in both bioregions followed a similar dotrend – declining from 700 t to 151 t in from 143 t (in 2001) to 32 t in the West Coast Bioregion. The downward trend in the West Coast mainly reflected declining catches in the Geographe Bay/Bunbury area. Landings of herring in Cockburn Sound declined only slightly, and landings in the Peel-Harvey estuary and in coastal waters north of Perth increased slightly over this period.
Total WA commercial landings of herring peaked at 1401 t i1991, when 1329 t was taken in the South Coast Bioregion.In the West Coast Bioregion, the total annual commercial catch rea1992.
Whitebait: All commercial landings of whitebait are taken in the West Coast Bioregion. Total landings have declined slightly since the 1990s when historic peaks of about 330 occurred in 1990 and 1997 (West Coast Nearshore and Estuarine Figure 1). The decline mainly reflects declines in landings in the metropolitan and Mandurah areas followingeffort reductions in these areas. Landings in the GeographeBay/Bunbury area have been relatively stable. Since 19landings from the Geographe Bay/Bunbury area have comprised 94% of total landings. The total West Coastcommercial catch of whitebait was 136 t in 2009 of whicWest Coast Beach Bait and South West Beach Seine Fisheries landed 96%. Substantial variations in whitebait landings appear to occur in response to environmental factors including ENSO and Leeuwin Current fluctuations.
WEST COAST BIOREGION
Sea garfish: Since 1995, about 55% of total commercial landings of sea garfish in WA have been taken in the West Coast Bioregion, with 30% from the South Coast, 10% frothe Gascoyne and 5% from the North Coast Bioregions. From 1995 to 2009, the total annual commercial catch of sea garfish in the West Coast Bioregion ranged between 11 and 44 t. In this period, annual catches were
m
quite variable, but e
f
st
l effort that previously targeted this species. From mullet
landings of yellow-eye mullet in WA were taken
ast has e
s
et ,
tal ere
25% taken in the West
09.
rdy
st
ographe Bay/Bunbury rea and 37% taken in the Capes/Augusta area.
e south ed from an
historical peak of 4046 t
n
n,
total catch was 5 t in 2009.
ary
l
s .
re
to
e a historical peak of 150 t in
968-69. Total West Coast landing peaked at 239 t in 1978. eclining landings are partly due to an ongoing reduction in
a ious fishery adjustment schemes (licence buy-
discrete breeding stock of cobbler, which is genetically distinct to other estuarine populations and also distinct to cobbler populations in adjacent ocean waters.
From 2000 to 2009, 95% of commercial landings of cobbler
the overall trend was downward. The declines are partly duto a reduction in commercial effort. Approximately 85% ototal commercial landings of garfish each year in the West Coast over this period have been taken in Cockburn Sound. In 2009, 92% of West Coast landings were taken in CockburnSound.
The annual landings of sea garfish in Cockburn Sound increased gradually after 1980 to reach a peak of 37 t in 1999 and have since steadily declined. A minimum annual catch of9 t was reported in 2008. The 2009 catch was 14 t.
Sea mullet: From 2000 to 2009, 42 % of total commercial landings of sea mullet in WA were taken in the West CoaBioregion, with 45% from the Gascoyne, 12% from the SouthCoast and 1% from the North Coast Bioregions.
Since 2000, the total annual commercial catch of sea mullet in the west coast has steadily declined from 179 t in 2000 to 80 t in 2009. The decline is partly due to an ongoing reduction in commercial effort in estuarine and nearshore waters as a result of various fishery adjustment schemes (licence buy-backs) operating since 1990. The historical peak in sea mullet landings within the West Coast Bioregion was 429 t in 1988, reflecting the much higher level of commercia2000 to 2009, 48% of total commercial landings of sea in the west coast region were taken in the Peel-Harvey estuary and 21% taken in the area of the proposed West CoastInshore Net Fishery (Moore River to Zuytdorp Cliffs).
Yellow-eye mullet: From 2000 to 2009, 87 % of total commercialin the West Coast Bioregion, with the remaining 13% taken in the South Coast Bioregion. Since 2000, the total annual commercial catch of yellow-eye mullet in the west costeadily declined from 64 t in 2000 to 17 t in 2009. Thdecline is partly due to an ongoing reduction in commercial effort in estuarine and nearshore waters as a result of varioufishery adjustment schemes (licence buy-backs) operating since 1990. The historical peak in yellow-eye mulllandings within the West Coast Bioregion was 514 t in 1988reflecting the much higher level of commercial effort that previously targeted this species. From 2000 to 2009, 80% oftotal commercial landings of yellow-eye mullet in the west coast region were taken in the Peel-Harvey estuary.
Yellow-finned whiting: From 2000 to 2009, 74 % of tocommercial landings of yellow-finned whiting in WA wtaken in the Gascoyne Bioregion, withCoast and 1% taken in the South Coast Bioregion. The total annual commercial catch of yellow-eye mullet in the west coast has steadily declined from 66 t in 2001 to 23 t in 20The decline is partly due to an ongoing reduction in commercial effort in estuarine and nearshore waters as a result of various fishery adjustment schemes (licence buy-backs) operating since 1990. From 2000 to 2009, the HaInlet, the Peel-Harvey estuary and Geographe Bay each contributed 20-25% of total commercial landings in the we
coast region.
Australian salmon: Since 2000, 67% of total commercial landings of Australian salmon in WA have been taken in the South Coast Bioregion, with the remaining 33% taken in the West Coast Bioregion. Within the West Coast Bioregion, 62% of landings were taken in the Gea
Total WA landings of salmon have been declining since 1995. This trend reflects declining catches on thcoast, where the annual catch has steadily declin
in 1995 to 258 t in 2009. By contrast, in the West Coast Bioregion the catch trend has been stable with annual landings fluctuating between 0 (i2000) and 1364 (in 1968). West Coast catches of 1316 t in 1995 and 1194 t in 2006 were close to the historical peak reached in 1968. In 2009, total West Coast landings of salmon were 495 t.
Tailor: Since 2000, about 80% of total WA commercial landings of tailor have been taken in the Gascoyne Bioregio13 % in the West Coast and 7 % in the South Coast Bioregions. In 2009, the total state commercial catch of tailor was 25 t, which was mostly caught in Shark Bay. The West Coast
In the West Coast bioregion, the majority of commercial tailor landings are reported from the Peel-Harvey Estu(65% of landings since 2000), where 4 t was reported in2009. Over the past decade, tailor landings in this estuary have fluctuated between <1 t to 8 t.
Key finfish species
Commercial estuarine species
Perth herring: From 2000 to 2009, almost 100% of totacommercial landings of Perth herring in WA were taken in the West Coast Bioregion. Over this period, total landinghave declined from 11 t in 2000 to approximately 1 t in 2009Since 2000, 75% of landings were reported from the Swan-Canning estuary and 17% from the Peel-Harvey estuary. Historically, the majority of landings of this species wecaught in the Swan-Canning estuary. Commercial targetingof Perth herring in this estuary ceased in 2007. The minor quantities taken in 2008 and 2009 were from the Peel-Harveyestuary.
Recent landings of Perth Herring are very low comparedhistorical landings. From 1963 to 1988, annual commercial catches of Perth herring in the Swan-Canning Estuary werconsistently >40 t, including1Dcommercial effort in estuarine and nearshore waters asresult of varbacks) operating since 1990. However, declining stock abundance is also believed to be a contributing factor.
Cobbler: In WA, commercial targeting of cobbler is essentially restricted to estuaries. Each estuary hosts a
68 DEPARTMENT OF FISHERIES

WEST COAST BIOREGION
were caught in estuaries of the South Coast Bioregion, with the rperioranged from <the Peein the Ptotal catch in West Coa
Hisestuaries were much high
Leschenauestuary. Landings in the Hardy Inlet have always been
latively low.
arvey Estuary, cobbler landings during the
the 1970s (1970an
from <1 t to 10 t. In 2009, landings were 8 t, whhig
In the Swan/Canning Estuary, annual cobbler landly >20 t (average catch 31
iod 1959-1977). However, landings fell m 76 t to 7 t between 1976 and 1978. From
g t
in
ve
), m
ively low compared to landings of other
rdy
ardy
)
f the West Coast Bioregion were not
y nearshore
ting (various (9%), southern
of highest catches were southern metropolitan, eographe Bay/Bunbury, each of which
ne
rt towards targeting of demersal species
s in earshore and estuarine waters of the West Coast Bioregion annot be determined for the current year. Approximate atch shares have been estimated where data are available.
estuarine target species. Landings peaked at 8 t in 1996 in the Swan-Canning estuary and peaked at 4 t in 1983 in HaInlet. Commercial targeting of bream in the Swan-Canning estuary has been negligible since 2007, resulting in the H
emaining 5% from the West Coast Bioregion. Over this d, total annual landings in the West Coast Bioregion
1 t to 8 t, with 90% of these landings caught in Inlet now being the only (albeit minor) commercial bream fishery in the West Coast Bioregion.
Recreational catch estimate (2009): NA
Most recent catch estimate (2000/01):
940 tonnes (key species only
The recreational catch levels of finfish in nearshore andestuarine waters o
l-Harvey estuary. In 2009, 8 t of cobbler was caught eel-Harvey Estuary, which was almost 100% of the
st Bioregion.
torically, commercial catches of cobbler in West Coast er. Landings peaked at 298 t in
1961 in the Peel-Harvey Estuary, at 158 t in 1958 in lt Estuary and at 56 t in 1960 in the Swan-Canning
re
In the Peel-Hestimated for 2009. The most recent estimates are from theNational Recreational and Indigenous Fishing Survey conducted in 2000/01 (West Coast Nearshore and Estuarine Table 2). The exception is Hardy Inlet, where a creel survey was conducted in 2005/061. While the dominant species in the nearshore catch are probably similar to those caught in 2000/01, the current catch and effort levels b
1950s, 1960s and 1970s were frequently >100 t. Landings in -79) averaged 127 t per year. However,
nual landings fell dramatically from 233 t to 49 t between 1980 and 1982. From 1983 to 1996, annual landings ranged from 3 to 74 t. Since 1996, annual landings have ranged
ich was the hest catch since 1999 when 10 t were reported.
ings during recreational fishers may have changed substantially since this survey. Therefore, current total catch level cannot be estimated.
Overall, the most abundant species in the retained catch (nearshore and estuarine combined) in 2000/01 were Australian herring (48% by number), whispecies, excluding King George) (24%), tailor
the 1960s and 1970s were frequentt per year for perdramatically fro1978 to 1996, annual landings ranged from 1 to 10 t. After 1997, annual catches in the Swan-Canning Estuary were <800 kg. A prohibition to catch cobbler in the Swan-CanninEstuary was introduced on the 6 July 2007 in order to protecthe stock.
sea garfish (3%), King George whiting (Sillaginodes punctata) (2%) and trevally (Pseudocaranx spp.).
The regionsIn the Leschenault Estuary, a period of relatively high cobbler landings occurred from 1955 to 1965 (average 45 t per year, 1955-65). Landings declined from 17 t in 1978 to 2 t in 1979. From 1979 until the closure of the commercial fishery in 2000/01, annual catches of cobbler ranged from <1t to 6 t.
Declining landings are partly due to an ongoing reduction incommercial effort in estuaries since 1990. However, decreasing stock abundance is also believed to be a contributing factor in each estuary.
Mandurah and Gcontributed about 20% of all retained fish. In nearshore waters, 61% of retained fish were taken by shore fishers.
Surveys of boat-based recreational fishing in the West Coast Bioregion estimated catches of key nearshore species in 1996/97 and 2005/06 (West Coast Nearshore and EstuariTable 3). Boat-based landings of many nearshore speciestypically declined between these surveys. This trend could indicate a decline in abundance of nearshore species. However, since landings of demersal species typically increased between surveys, it may also reflect a shift in effoby boat-based fishers
Black bream: Black bream is an estuarine species. Each estuary hosts a discrete breeding stock of bream, which is genetically distinct to other estuarine populations.
From 2000 to 2009, 95% of commercial landings of black bream were caught in the South Coast Bioregion, with the remaining 5% from the West Coast Bioregion. In the West Coast Bioregion, total landings over this period were mainly caught in the Swan-Canning estuary (68% of landings) and Hardy Inlet (31%). Since 2000, total annual West Coastlandings of bream have ranged from 1 to 5 t, including approximately 1 t taken in 2009.
Historically, the Swan-Canning Estuary and Hardy Inlet hacontributed the vast majority of commercial bream landingsin the West Coast Bioregion. Occasional landings were
instead of nearshore species.
The total landings of nearshore species in 1996/97 and 2005/06 were not estimated because catches by shore-based recreational fishers, who catch the majority of nearshore finfish, were not surveyed.
Approximate recreational catch shares (by weight):
The recreational catch share of total finfish landingnc
previously taken in the Leschenault Estuary (<2 t per yearprior to the closure of that fishery. Annual landings of breain the Peel-Harvey Estuary have always been negligible.
Historically, commercial landings of black bream have always been relat
c
Prior SP and Beckley LE. 2006. Creel survey of the
Blackwood Estuary, 2005-06. Final report to South West Catchments Council (Project C3-01).
1
STATE OF THE FISHERIES AND AQUATIC RESOURCES REPORT 2009/10 69
WEST COAST BIOREGION
Key species
8-16% of West Coast Australian salmon catch
5-10% of West Coast sea mullet catch
70% of West Coast Australian herring catch
85-90% of West Coast blac
ince the early 1990s, the number of licences in nearshore een substantially
rate
rt
88
ecline
d
mean number of active
rt
s to 1 in 2000 and subsequent
of sult
is region by shore-based net fishers (gill nets, haul
(in
ore-based recreational fishing effort for e West Coast Bioregion are unavailable. Two 12-month
005/06 estimated the reational fishers in the
egions, provided
01 08,673 boat-based
95% of West Coast tailor catch
70% of West Coast southern sea garfish catch
65-85% of West Coast King George whiting catch
k bream catch
Estuaries
95% of total finfish catch in Swan-Canning estuary
30% of total finfish catch in Peel-Harvey estuary
50% of total finfish catch in Hardy Inlet/Blackwood River system
100% of total finfish catch in other West Coast estuaries
Fishing effort/access level
Commercial Sand estuarine commercial fisheries has breduced via Voluntary Fishery Adjustment Schemes. The removal of licences has eliminated a significant amount of latent effort (inactive licences) that previously existed in these fisheries.
Fishing effort in nearshore and estuarine fisheries is sometimes reported as the number of units of access (vessels, teams, licencees, etc). These measures of effort provide a general indication of effort changes over time and are often the only types of effort data available throughout the history of each fishery. Where possible, effort is also calculated as the number of days fished by each method. It is considered that ‘method days fished’ generally provides a more accumeasure of the effort undertaken in each fishery.
Licence holders in the west coast estuaries that are open to commercial fishing are endorsed to fish a single estuary system only.
Peel-Harvey Estuary: During the 1980s, fishing effo(number of method days fished) averaged 5,372 days per year, but this included a period of rapid decline between 19and 1990. Effort then stabilised and averaged 3,463 days per year from 1990 to 2000. After another pronounced dbetween 1998 and 2000, effort again stabilised, with an average of 2,045 days fished per year between 2000 an2008. Since 2000, 43% of commercial effort (method days) has been spent targeting finfish in this estuary. There are currently 11 licences in the fishery. Since 2000, the mean number of active fishing units per month has been about 8.
Swan-Canning Estuary: Thefishing units per month declined from about 25 in the mid-1970s to 1 in 2009. The majority of total commercial effoin 2009 and other recent years has been spent targeting blue swimmer crabs.
Hardy Inlet: The mean monthly number of fishing units has declined from 3 in the 1970years, including 2009. Virtually all commercial effort in 2009and other recent years has been spent targeting finfish.
Cockburn Sound (Fish Net) fishery: Since the early 1990s, there has been a progressive decline in the numbercommercial licences operating in Cockburn Sound as a reof Voluntary Fishery Adjustment Schemes. In the Cockburn Sound (Fish Net) fishery, the number of licences fell from six in the early 1990s to one in 2003 and subsequent years. The total number of method days fished declined from 474 in 2000 to 117 in 2009. All effort by this fishery is spent targeting finfish.
Moore River to Kalbarri (Proposed West Coast Inshore Net Fishery): The total number of method days fished in thnets and beach seines only) is relatively stable at about 450 method days per year. In 2009, 9 licencees reported finfish landings by netting methods in this region.
South West Coast Salmon Fishery: Since 2000, the number of method days fished (gill nets, haul nets and beach seines only) per year has ranged from 26 (in 2000) to 9172002). In 2009, there were 12 teams licenced to capture salmon in the West Coast Bioregion. However, only 7 of these 12 teams reported salmon catches.
West Coast Beach Bait and South West Beach Seine Fisheries: In 2009, 14 licencees reported landings of whitebait.
Recreational Recent estimates of shthsurveys undertaken in 1996/97 and in 2total effort expended by boat-based recWest Coast Bioregion. The boat-based recreational line fishing effort increased 15.5% from 1996/97 (1,348,000 fisher hours) to 2005/06 (1,557,000 fisher hours). Theseestimates included effort expended on all species, includingdemersal and nearshore species. The proportion of boat-based effort spent targeting nearshore finfish during these surveys is unknown.
The 2000/01 National Recreational and Indigenous Fishing Survey, which included all methods and Biorthe most comprehensive recent information on recreational fishing effort in the West Coast Bioregion. About 95% of the nearshore and estuarine 'fishing events' that were targeting finfish during the survey used line fishing (bait or lure). About 75% of line fishing events in both nearshore and estuarine waters were shore-based. In nearshore waters, the estimated line fishing effort (either bait or lure) in 2000/comprised 946,841 shore-based and 3fishing events during the 12-month survey period.
70 DEPARTMENT OF FISHERIES
WEST COAST BIOREGION
Stock Assessment Assessment complete: Y
Assessment method: Catch rates
Breeding stock levels:
Australian herring
es
Uncertain
ailor Acceptable
Sound)
ssed
le
ries) Not assessed
ble
d
y finfish species - nearshore
n are mainly pre-spawning fish undergoing a estward migration to the West Coast Bioregion, where they
riginate from ast Bioregion, South
h,
ion thern parts of the West Coast Bioregion (Capes,
eographe Bay and Bunbury regions) but stable or increasing vailability in Perth metropolitan waters. Voluntary
f
he cause of low recruitment in the South Coast Bioregion in cent years is not known. The effect of low South Coast
tock abundance on the status of the entire stock is uncertain. esearch is underway to examine the extent of connectivity
tween Bioregions, including annual
e
tes vailability since 2000. The 2009
average of annual landings over
the Estuary suggest a stable trend in the availability
ast Bioregion since 1990 (West catch
y.
hitebait (Acceptable): The 2009 total catch of 131 t of Bait and West Coast Beach rget catch range (60-275 t).
t
orrelated with the environmental conditions in the previous
ability of black bream in this estuary from 2005/6 to 200Coast Nearshore and Estuarine Figure 6). Blac
wan-Canning): Commercial catch rates suggest a stable end in the availability of cobbler in the Peel-Harvey Estuary
tuarine Figure 5). y was assessed via catch
7. Cobbler in Leschenault Esommercial fishery closure in 2000.
was
Canning Estuary until ces
. Swan-Canning catch rates are aA single brCoast Bioregion. Limited evidence suggests regional
of herring populations bevariations in connectivity.
Tailor (Acceptable): Catch rates from a volunteer anglingprogram in the Swan-Canning estuary provide an indicator of the strength of annual tailor recruitment to the lower West Coast fishery. Since this angler-based recruitment index began in 1996 there have been highly variable levels of annual recruitment (West Coast Nearshore and EstuarinFigure 3). Relatively strong recruitment occurred in 1996 and2008.
Southern sea garfish (Acceptable): Commercial catch rates suggest a slight decline in availability of sea garfish in Cockburn Sound since the early 1990s. However, catch rasuggest a stable trend in a
T
Southern sea garfish (Cockburn
Acceptable
Whiting species (not King George) Not asse
Sea mullet Acceptable
Whitebait Acceptable
Black bream (Swan-Canning) Acceptab
Black bream (other estua
catch was slightly above the the 1996-2008 period (West Coast Nearshore and Estuarine Figure 4).
Sea mullet (Acceptable): Commercial catch rates inPeel-Harvey
Cobbler (Swan-Canning) Not acceptable
Cobbler (Peel-Harvey) Accepta
Cobbler (Leschenault) Not assesse
Perth herring Not assessed
of sea mullet in the West CoCoast Nearshore and Estuarine Figure 5). Peel-Harvey rates are assumed to be representative of regional availabilitA single breeding stock of sea mullet occurs in the West Coast Bioregion.
Wwhitebait by West Coast Beach Seine fisheries was within the taKe
An additional 5 t of whitebait was taken by other West CoasAustralian Herring (Uncertain): Australian herring form a single, genetically homogeneous breeding stock across fisheries. Highly variable annual catches are characteristic of
this fishery. The large variations in catch level being strongly southern Australia. Spawning occurs mainly along the lower west coast of WA. Eggs and larvae are dispersed by the Leeuwin Current to coastal nurseries distributed from the
cyear have continued.
West Coast Bioregion to Victoria. A strong current can result in high annual recruitment outside the West Coast Bioregiondue to greater larval dispersal. Herring caught in the South Coast Bioregio
Key finfish species - estuarine
Black bream (Acceptable - Swan-Canning): In the Swan-Canning Estuary, commercial and recreational catch w
will spawn during May-June. These fish ojuvenile nurseries in the South Co
rates suggested an increase in black bream availability between 1990 and 2000, followed by a slight decline from 2000 to 2006 (Smith 2006). Voluntary recreational logbook Australia and (to a lesser extent) Victoria. Herring caught in
the West Coast Bioregion are a combination of these fisplus fish originating from local juvenile nurseries in the West Coast Bioregion.
Since 2000, commercial catch and catch rates suggest declining availability of herring in the South Coast Bioregand in sou
fisher catch rates suggest a stable trend in the avail8/9 (West k bream in
other West Coast estuaries are not assessed.
Cobbler (Acceptable – Peel-Harvey; Not acceptable - StrG
a since 1990 (West Coast Nearshore and Esrecreational logbook fisher catch rates also suggest a stable Cobbler in the Swan-Canning Estuar
rate trends until a fishing ban was imposed in 200trend in the availability of Australian herring in Perth metropolitan waters from 2006 to 2009 (West Coast Nearshore and Estuarine Figure 2). Declining catches in the southern areas reflect the reduced availability of fish due to declining recruitment in the southern areas. Stable metropolitan catch rates possibly reflect more stable levels oannual recruitment in this area.
tuary has not been assessed since the c
Perth herring (Not assessed): Perth herringassessed via commercial catch rate trends in the Swan-
sation of fishing for this species in ecline in the 2007. Catch rates suggested a major d
availability of Perth herring after 1980Tre ssumed to be representative of regional availability.
eeding stock of Perth herring occurs in the West sR
STATE OF THE FISHERIES AND AQUATIC RESOURCES REPORT 2009/10 71
WEST COAST BIOREGION
abundance remains relatively low compared to historical levels. However, insufficient informatioassess current stock status. The developm
nvironmental degradation in the upper reaches of estuaries sulting in low spawning success is believed to be the main
w
ght
and marketed.
apture and release of a significant number of non-target
risks associated with post-rably among species. In
n nearshore and estuarine waters are captured
ble
heries. Commercial fishers re required to report all interactions with protected species.
ecreational fishers using line-fishing methods are unlikely . Interactions are expected to be
significant.
stem Effects n effects: Low
urrent levels of commercial effort are relatively low. removal by commercial and recreational fisheries
f certain species, such as whitebait, Australian herring or almon, from the food chain could potentially impact on prey
ator species including larger fish, cetaceans and eabirds.
abitat effects: Low
he operation of gill nets and haul nets over predominantly and and mud bottoms is unlikely to have any impact on ese habitats in estuaries and nearshore waters. Similarly,
the line fishing methods used by recreational fishers have a negligible impact on the bottom substrates. Anchoring by recreational fishing vessels may have localised impacts on habitats such as seagrass.
yed in various fisheries targeting herring during
y
Economic Effects Estimated annual commercial value (to fishers)
for 2008/09: $ 618,514
Fishery Governance Commercial: Current Fishing (or Effort) Level:
West Coast Estuarine Fishery Acceptable
Cockburn Sound (Fish Net) Fishery Acceptable
South West Salmon Fishery Acceptable
West Coast Australian herring fisheries
Acceptable
West Coast Beach Bait and South West Beach
Seine Fisheries Acceptable
Target commercial catch range:
West Coast Estuaries:
75 – 220 tonnes (Peel/Harvey only)
Cockburn Sound (Fish Net) Fishery:
30 – 112 tonnes (finfish only)
South West Salmon Fishery:
1200 – 2800 tonnes (includes south coast landings)
Social Effects
Commercial - nearshore During 2009, there were 2 commercial fishers operating in the Cockburn Sound (Fish Net) Managed Fishery. Landings from this fishery are used to supply restaurant and retail sectors in the Perth metropolitan area.
In 2009, there were 3-7 commercial fishers per month
n is available to ent of fishery-
independent monitoring methods is required for this species. Erecause of low abundance.
operating within the West Coast Salmon Fishery during the salmon season. There were 12 -23 commercial fishers per Non-Retained Species month emplothe main her
Bycatch species impact: Lo
The small-scale commercial fisheries in nearshore and ring fishing season. Herring and salmon fishers
in the West Coast Bioregion supply local bait and human consumption markets.
Commercial - estuarine In 2009, there was an average of 14 commercial fishers permonth operating in the West Coast Estuarine fishery, largelsupplying fresh fish to meet demand for locally-caught product.
Recreational The estuaries and nearshore waters of the West Coast Bioregion are key areas for recreational fishing and other activities such as snorkelling. Therefore fish resources have a high social value in the region.
estuarine waters mainly use gill, seine and haul nets that are deployed in a targeted manner. Few non-target species are taken. Mesh size regulations ensure that target species cauby these methods are within an appropriate size range. Minimal discarding occurs because virtually all fish taken can be retained
Recreational fishers mainly use line-based methods in nearshore and estuarine waters. This method can result in thecspecies and undersized fish. Therelease mortality vary considegeneral, fish ifrom shallow depths and suffer less barotrauma-related injuries than deep water species.
Protected species interaction: Negligi
No protected species are susceptible to capture by the fishing gear used in these commercial fisa
Rto capture protected speciesin
EcosyFood chai
CExcessiveosand preds
H
Tsth
72 DEPARTMENT OF FISHERIES

WEST COAST BIOREGION
STATE OF THE FISHERIES AND AQUATIC RESOURCES REPORT 2009/10 73
est Coast Australian herring fisheries:
Recreational: Current Fishing (or Effort) Level NA
Target catch range: Not developed
New m initiatives (for t
Develop ment arrangeCoast Ins eratng in neanorth of the Moore Riv e Zuytdorp Cliffs south of Shark Ba l seine fish ies are mullet, and tailor
Impleme w management arranSouth-W y
Exter actors NearshA number of the species in this suite are known to have their abundan y annual variatcurrents Leeuwin and Capappear to influence the recruitment patterns of larvae of nearshore uch as whitebait, tailor,salmon a equent recruitm fishery (Lenan 1) .
W
70 – 185 tonnes
Whitebait fisheries: 60 – 275 tonnes
anagement he next year)
ment of new manage ments for the West hore Net Fishery op
er to thrshore waters from
y. The proposed fishery is a hau net and beach ery. Targeted spec.
whiting, herring
ntation of ne gements for rhe est Beach Seine (SWBS) Fisher (Bunbury sector).
nal Fore
ce levels affected b ion in coastal (particularly the es Currents) that
species s herring and nd thus their subs
ton et al, 2009ent into each
1 Lenanton R C , Kangas M & Craine M
ongoing influence of the Leeuwin Current on economically important fish and invertebrates off temperate Western Australia – has it changed? Journal of the Royal Society of Western Australia 92: 111–127.
The abundance of nearshore species is likely to be affected by the quantity and quality of coastal habitats that are
reduced sea garfish the 1950s, approximately 80% of the seagrass meadows in Cockburn Sound have be s a of medegradation (Cockburn Sound Management Council 20052).
Fluctuating mar significant factorthe annual com ca el o sp
EstuWest Coast estuaries are highly modified, and often degra vir ts. e es , the cts of environmental f on undances ar to be at least as ishing prsuggest that habitat and c changes have altered the
p an dan ish nit est coast estuaries, istorical monitormany c s di to q . However, in the Swan-Canning Estuary, abundant fis ata eviden k es fish abundance since 1990 or arlier ith 20 . Stoc clines est C tuaries
are most pronounced among ‘estuarine-di.e. those that re estua abita r spa , feeding and/or nursery areas (e.g. c er, Pe errin ck bream).
, Caputi N 2009 The
available for spawning, feeding and/or nursery areas. For example, loss of seagrass in Cockburn Sound is likely to have
abundance. Since
en lost a result environ ntal
ket demand is a affecting mercial tch lev f many ecies.
aries
ded, en onmen In thes tuaries impaactorst as f
stock abessure. An
e likelyeports importan ecdotal r
limaticcom osition d abun
although lackce of f
of hcommu ies in w
ing makes of these hange fficult uantify
hery d provides ce of mar ed declin in
e (Sm 063) k de in W oast esepend
ts foent’ species, wningly on rine h
obbl rth h g, bla
2Cockburn Sound Managem uncil. 2005. Environmental
Management Plan for Cockburn Sound and its Catchment. Department of Environment, Perth.
3Smith KA. 2006. Review of fishery resources and status of key fishery stocks in the Swan-Canning Estuary Fisheries Research Report 156. Department of Fisheries, Perth.
ent Co

WEST COAST BIOREGION
WEST COAST NEARSHORE AND ESTUARINE TABLE 1
ercial fisheries in the West Coast Bioregion, 2005 to 2009. Total annual catches from the nearshore and estuarine comm
Catch (tonnes) Species Scientific name
2005 2006 2007 2008 2009
Australian salmon Arripis truttaceus 790.1 1193.4 622.9 333.4 494.6
Whitebait Hyperlophus vittatus 158.2 231.2 99.1 135.8 57.9
Sea mullet Mugil cephalus 111.6 98.4 99.6 80.4 94.8
Australian herring 83.1 43.6 41.5 34.7 32.4 Arripis georgianus
Yellow-eye mullet Aldrichetta forsteri 36.2 26.6 37.0 26.2 17.4
Ye ed whiting llow-finn Sillago schombergkii 34.1 31.7 22.4 21.5 22.4
Sea Garfish Hyporhamphus melanochir 19.1 11.1 11.5 11.0 15.6
Bl t ue spra Spratelloides robustus 12.0 10.3 14.5 13.7 7.1
Perth herring Nematalosa vlaminghi 9.8 4.1 5.6 0.7 1.5
Cobbler Cnidoglanis macrocephalus 3.5 0.7 0.8 6.9 8.3
Tailor Pomatomus saltatrix 4.0 1.8 1.7 1.5 5.3
King George whiting Sillaginodes punctata 2.5 2.0 0.9 5.1 1.7
Yellowtail scad Trachurus novaezelandiae 3.5 1.5 2.2 2.5 1.2
Black bream Acanthopagrus butcheri 4.9 2.4 0.9 1.0 1.1
Trevally Carangidae 0.9 1.5 1.6 0.7 1.4
Other finfish Teleostei 4.6 3.0 2.8 1.1 0.7
Other baitfish (not Whitebait) Clupeidae 1.8 0.1 1.6 0.7 0
Sharks and rays Elasmobranchii 0.3 0.3 0.1 0 0
TOTAL 1280.2 1663.6 966.5 613.3 826.7
WEST COAST NEARSHORE AND ESTUARINE TABLE 2
Estimated total catches of key species by recreational fisheries in nearshore and estuarine waters in the West Coast Bioregion in 2000/01 (Henry and Lyle 20031).
Species Scientific name 2000/01 Catch (tonnes)
Australian herring Arripis georgianus 438
Tailor Pomatomus saltatrix 187
Whiting Sillago spp. 154
King George whiting Sillaginodes punctata 60
Trevally Pseudocaranx spp. 42
Southern sea garfish Hyporhamphus melanochir 35
Black bream Acanthopagrus butcheri 24
TOTAL 940
1 Henry GW and Lyle JM. 2003. The National Recreational and Indigenous Fishing Survey. FRDC Project No. 99/158. NSW Fisheries
Final Report Series No. 48.
74 DEPARTMENT OF FISHERIES

WEST COAST BIOREGION
hers in umner et al. 2008 1).
WEST COAST NEARSHORE AND ESTUARINE TABLE 3
Total annual catch estimates (+ standard error) (tonnes) of key nearshore species by boat-based recreational fisthe West Coast Bioregion in 1996/97 and 2005/06 (S
Species Scientific name 1996/07 Catch (se) 2005/06 Catch (se)
Whiting Sillago spp. 58 (9) 46 (3)
Australian herring Arripis georgianus 46 (7) 40 (2)
Trevally Pseudocaranx spp. 38 (10) 34 (4)
King George whiting Sillaginodes punctata 28 (4) 19 (1)
Snook Sphyraena novaehollandiae 23 (11) 9 (2)
Australian salmon Arripis truttaceus 12 (5) 17 (3)
Tailor Pomatomus saltatrix 14 (4) 3 (0.7)
Southern sea garfish Hyporhamphus melanochir 7 (2) 2 (0.2)
Whitebait
0
50
100
150
200
250
300
350
1975 1978 1981 1984 1987 1990 1993 1996 1999 2002 2005 2008
Cat
ch (
ton
nes
)
Metropolitan
Mandurah
Bunbury
Total
WEST COAST NEARSHORE AND ESTUARINE FIGURE 1
Annual catches of whitebait along the West Coast, by fishing region, 1975 –2009
Sumner NR, Williamson PC, Blight SJ and Gaughan DJ. 2008. A 12-month survey of recreational boat-based fishing between
Augusta and Kalbarri on the West Coast of Western Australia during 2005-06. Fisheries Research Report 177. Department of Fisheries, Perth.
1
STATE OF THE FISHERIES AND AQUATIC RESOURCES REPORT 2009/10 75

WEST COAST BIOREGION
76 DEPARTMENT OF FISHERIES
Voluntary recreational logbook fisher catch rate
Year
of Australian herring, metropolitan area. sh)
hou
r)
2006 2007 2008 2009 To
tal a
nnu
al c
atc
h (
No.
of
fi
To
tal a
nn
ual e
ffo
rt (
hou
rs)
0
1000
2000
30004
0
300
600
900
An
nual
cat
ch r
ate
(fis
h/
0
1
2
3
CatchEffortCatch rate
WEST COAST NEARSHORE AND ESTUARINE FIGURE 2
Total annual catch, effort and catch rate of Australian herring by voluntary recreational logbook fishers in Perth metropolitan area (shore fishing only), 2005 – 2009.
Annual recruitment of tailor, Swan River
Year
1996 1998 2000 2002 2004 2006 2008
Ca
tch
rate
(ta
ilor/
fish
er h
our
)
0
2
4
WEST COAST NEARSHORE AND ESTUARINE FIGURE 3
The annual recruitment index for the lower west coast Tailor fishery over the period 1996 – 2009, derived from volunteer angler catch rates of age 0+ juveniles in the Swan Estuary.
Annual commercial catch rate of sea garfish, Cockburn SoundFish Net fishery
Year
1996 1998 2000 2002 2004 2006 2008
Cat
ch r
ate
(kg/
met
hod
day)
0
100
200
WEST COAST NEARSHORE AND ESTUARINE FIGURE 4
Standardised annual commercial catch rate of sea garfish in Cockburn Sound (Fish Net) Fishery, 1996 – 2009.

WEST COAST BIOREGION
Cobbler
0
20
40
Sea mullet
Year1990 1995 2000 2005
Ca
tch
rat
e (k
g/m
etho
d da
y)Annual commercial catch rates, Peel-Harvey Estuary
NE FIGURE 5
tes of cobbler and sea tuary Fishery, 1990 – 2009.
50
100
0
WEST COAST NEARSHORE AND ESTUARI
Standardised annual commercial catch ra mullet in Peel-Harvey Es
Voluntary recreational logbook fisher catch rateof black bream, Swan-Ca
Year
nning Estuary
2004/5 2005/6 2006/7 2007/8 2008/9 Tot
al
sh)
Ann
ual c
ur)
urs)
0.0
0.5
2.0 6001200
ann
ual
ca
tch
(N
o.
of
fi
ish
/ho
0
400
800
To
tal a
nnu
al e
ffor
t (h
o
1.5
atc
h r
ate
(f
1.0 300
CatchEffortCatch rate
0
ary recreational logbook fishers in Swan-Canning
WEST COAST NEARSHORE AND ESTUARINE FIGURE 6
TE
otal annual catch, effort and catch rate of black bream by voluntstuary, 2004/5 – 2008/9.
STATE OF THE FISHERIES AND AQUATIC RESOURCES REPORT 2009/10 77
WEST COAST BIOREGION
78 DEPARTMENT OF FISHERIES
est Coast Purse Seine Fishery Report: Statistics Only . Molony and E. Lai
anagement input from N. Moore
ishery Description he West Coast Purse Seine Fishery mainly captures ilchards (Sardinops sagax) and the tropical sardine
lemuru (hereafter referred to as sardinella) by urse seine in the West Coast Bioregion. Smaller catches of erth herring (Nematalosa vlaminghi), yellowtail scad rachurus novaezelandiae), Australian anchovy (Engraulis
ustralis) and maray (Etrumeus teres) are also reported.
overning legislation/fishing authority
Resources Management Act 1994 and subsidiary legislation
est Coast Purse Seine Management Plan 1989
isheries Notice 312 Purse Seine Prohibition
isheries Notice 571 Pilchard Fishing Prohibition
isheries Notice 476 Net Hauling Restrictions
est Coast Purse Seine Managed Fishery Licence
93 (specific to the Southern and Northern Development Zones)
ishing Boat Licence Condition 176 (Pilchard Authorisation)
peak body members (e.g. the Western Australian Fishing Industry Council).
Boundaries
There are three defined fisheries. The Perth metropolitan fishery operates between 33° S and 31° S latitude. The Southern Development Zone covers waters between 33° S and Cape Leeuwin. The Northern Development Zone covers waters between 31° S and 22° S.
Management arrangements
This fishery is managed though a combination of input and output controls incorporating limited entry, capacity setting and controls on gear and boat size.
Access to the Perth Metropolitan fishery is limited to 12 licences that must fish in accordance with the West Coast Purse Seine Management Plan 1989. Both pilchards and sardinella are the main target species in the Metropolitan fishery. There are three fishing boat licences with a specific condition that permits the taking of fish using a purse seine net that is hauled by the use of a power block within specific waters of the Southern Development Zone. Two of those fishing boat licences may also retain pilchards. A further three fishing boat licences permit the taking fish using a
purse seine net that is hauled by the use of a power block in the Northern Development Zone and sardinella is the main target species.
Currently, a notional combined total allowable catch (TAC), covering both the Perth metropolitan fishery and the Southern Development Zone, is set for pilchards and another for other small pelagic species. For the 2009/10 licensing period (1 April 2009 – 31 March 2010) a notional TAC of 2,328 t for pilchards, with separate TAC of 672 t for the other small pelagic species (including sardinella) is in place. The Northern Development Zone has a separate notional TAC. Reaching or exceeding the notional TACs will trigger a management response.
Landings and Effort
Effort levels remain low in 2009. Total catches were 45.2 t, down from 139 t in 2007, 121.3 t in 20081 and well below the 4,000 t catches recorded in the mid to late 1990s (West Coast Purse Seine Figure 1).
Fishery Governance Target commercial catch range: 0 – 3,000 tonnes
cceptable
Recently, total catch and effort have varied among years due to factors other than stock size (e.g. demand, economics). In addition, fishers have reported that the presence of schools is not as predictable as in previous years.
New management initiatives (2010/11)
The Department is planning to develop a new management plan for this fishery which will incorporate the Southern and Northern Development zones along with the Perth metropolitan fishery into a single West Coast Purse Seine fishery.
The implementation of the new management plan will move the fishery to a formal quota system with tradeable, individually transferable quota (ITQ) units and a TAC. The ITQ unit values will be reviewed annually and changed as required, depending on stock levels.
WB
M
FTpSardinellapP(Ta
G
Fish
W
F
F
F
W
Fishing Boat Licence Condition
F
Consultation Process
Meetings between the Department of Fisheries, industry and Current Fishing (or Effort) Level: A
1 The 2008 total differs from that reported in the State of the Fisheries 2008/09 Report due to the late submission of returns.

WEST COAST BIOREGION
West Coast Purse Seine
0
1000
00
1975 1978 1981 1984 1987 1990 1993
Cs)
2000atc
3000
onn
e
4000
50
1996 1999 2002 2005 2008
h (
t
Total
Sardinops
Sardinella
WEST COAST PURSE SEINE FIGURE 1
Annual catches of pilchards (Sardinops) and sardinella in the We ine Fishery, 1975 –2009. st Coast Purse Se
STATE OF THE FISHERIES AND AQUATIC RESOURCES REPORT 2009/10 79

WEST COAST BIOREGION
West Coast Demersal ScalefisD. Fairclough, E. Lai and C. Bruce
Management input from N. Harrison, N. Moore and C. Syers
h Fishery Status Report
Main Features
Status
Stock level Inadequate
Acceptable
in 2005/06
(last available complete estimate)
l sector:
3 t
7 t
LF
/09)
Groper 11 t 3 t
ector (2005/06, last estimate)
40 t
10 t
7 t
Fishing Level
Commercial:
Recreational: Unacceptable
Current Landings
Commercia
WCDSIMF (2009) 30
DGDLF (2008/09) 7
Total 380 t
Indicator species WCDSIMF DGD
(2009) (2008
Pink Snapper 110 t 9 t
West Australian Dhufish 48 t 15 t
Baldchin
Recreational s
Indicator species:
Pink Snapper
West Australian Dhufish 186 t
Baldchin Groper 28 t
Charter sector (2009)
Indicator species:
Pink Snapper
West Australian Dhufish 9 t
Baldchin Groper
ishery DescF ription SF)
l, es, suite,
each sector eting West Australian Dhufish (Glaucosoma
Pink Snapper (Pagrus auratus). Substantial taken of other species in this suite, such as
E tus) and Bight Redfish gerrardi). A range of species is taken in
elong to the west coast offshore emersal scalefish suite, including Eightbar Grouper
ofasciatus, Hapuku Polyprion oxygeneios, oglyphe antarctica and Ruby
mmercial fishers operate in the West
ery
within the boundaries of lnet
The West Coast Demersal Scalefish Fishery (WCDincludes mostly line-fishing operations by commerciacharter and recreational sectors. Up to about 100 specimostly from the west coast inshore demersal scalefishare caught in the fishery each year, with fishers in primarily targhebraicum) andcatches are also Baldchin Groper (Choerodon rubescens), Red Throat
mperor (Lethrinus minia(Centroberyx offshore waters that bdHyporthodus octBlue-eye Trevalla HyperSnapper Etelis carbunculus.
Commercial A limited number of coCoast Demersal Scalefish (Interim) Managed Fishery (WCDSIMF). Fishers use handlines and droplines to target demersal species. However, fishers in the West Coast Demersal Gillnet and Demersal Longline (Interim) ManagedFishery (WCDGDLF), the Joint Authority Southern Demersal Gillnet and Demersal Longline Managed Fish(JASDGDLF), the West Coast Rock Lobster Managed Fishery, the Cockburn Sound Pot and Line Fishery and Commonwealth Western Deepwater Trawl Fishery operators also catch demersal species. Note, the WCDGDLF and the part of the JASDGDLF that operatesthe WCDSF is referred to collectively as the demersal giland demersal longline fisheries (DGDLF) in this section.
80 DEPARTMENT OF FISHERIES
WEST COAST BIOREGION
Fishing and Aquatic Tour Industry (Charter) Demersal scalefish are targeted by the fishing activities ocharter boat indu
f the stry in the West Coast Bioregion. Line
fish
n
y
al fishing regulations
eetings between the Department of Fisheries and permit West Coast Demersal Scalefish Interim
mittee (RFAC)
F encompasses the waters of the Indian Ocean
es,
the 250 m depth contour, while the
eational in the West Coast Bioregion encompass the waters of
h of Shark Bay (at 2700’S) to just E) and extend seaward to the
es d arrangements regulating the carriage of lines
he use of VMS
ralian Dhufish
the entire west coast
ent of
fishing is the main method used by operators licensed toin that sector. A small number of fishing tour operators also cater for recreational diving charters.
Recreational Recreational fishers that target demersal species in the WCDSF are almost exclusively boat-based. Line fishing is the main method used by recreational fishers, although spearfishing also occurs, but mainly in shallow waters, i.e. < 20 mdeep.
Governing legislation/fishing authority
Fish Resources Management Act 1994
Fish Resources Management Regulations 1995
Commercial Fishing Boat Licence
West Coast Demersal Scalefish (Interim) Management Pla2007
West Coast Demersal Scalefish Interim Managed FisherPermit
Fishing and Aquatic Tour Industry (Charter) Fish Resources Management Regulations 1995 and
recreational fishing regulations
Fishing Tour Operator Licence, Restricted Fishing Tour Operators Licence and/or Aquatic Eco-Tourism Licence
Recreational Recreation
Consultation process
Commercial M
holders in the Managed Fishery.
The Western Australian Fishing Industry Council
Fishing and Aquatic Tour Industry (Charter) Recreational Fisheries Advisory Com
Charter Boat Owners & Operators Association
Recfishwest
Recreational RFAC and a network of 12 Regional Recreational Fishing
Advisory Committees
Recfishwest
Boundaries
Commercial fishery The WCDSIMjust south of Shark Bay (at 2630’S) to just east of Augusta(at 11530’E) and extends seaward to the 200 nm boundary of the Australian Fishing Zone (AFZ). The commercial
fishery is divided into five management areas comprising four inshore zones and one offshore zone. The inshore zoni.e. Kalbarri, Mid-West, Metropolitan and South-West, extend outwards to Offshore zone extends from the 250 m depth contour to the boundary of the AFZ (West Coast Demersal Scalefish Figure 1). The Metropolitan Inshore zone was closed to commercial operators in the WCDSIMF and WCDGDLF (West Coast Demersal Scalefish Figure 1) in November 2007.
Fishing and Aquatic Tour Industry (Charter) and Recreational fishery The boundaries applicable to the charter and recrsectorsthe Indian Ocean just souteast of Augusta (at 11530’200 nm boundary of the AFZ (West Coast Demersal Scalefish Figure 1). The exact latitudes and longitudes delineating the tour management zones of the charter fishery are listed in Schedule 15 of the Fish Resources Management Act 1994.
Management arrangements
Commercial The West Coast Demersal Scalefish (Interim) Managed Fishery was established in January 2008, following the introduction of the West Coast Demersal Scalefish (Interim)Management Plan 2007. Access to the Fishery is restricted to61 Interim Managed Fishery Permit holders. Gear and other restrictions apply (in the form of maximum numbers of linand hooks anand fish) and boats are monitored under the Vessel Monitoring System (VMS).
Each of the four inshore management areas is allocated a maximum number of hours of fishing time that may be fished on an annual basis. Units are allocated to permits and provideentitlement in “hours” of fishing time. Tallows fishing effort to be monitored and entitlement acquitted accordingly. The total capacity of the Fishery restricts fishing effort at a level to ensure that the demersal scalefish catch limits are not exceeded. The capacity can be adjusted, as required.
The primary management objective is to maintain scalefish catches to at least 50 % of those of scalefish catches recorded in the West Coast Bioregion during 2005/06. The catch in each management zone also should not exceed 50 % of the 2005/06 catch in that zone. Additional specific management objectives (50 % of the 2005/06 catch) are set for each indicator species (Pink Snapper, Western Austand Baldchin Groper) in the WCDSIMF and in each zone in which they are an indicator. The status of the three indicator species are used to indicate the status of demersal suite of scalefish species.
Fishers are required to report their catch using daily/trip statutory fishing returns, which provide the DepartmFisheries with fine-scale reporting (10nm x 10nm blocks) for enhanced catch and effort analyses.
STATE OF THE FISHERIES AND AQUATIC RESOURCES REPORT 2009/10 81

WEST COAST BIOREGION
82 DEPARTMENT OF FISHERIES
ndustry (Charter)
activities, such as snorkelling or ing only allowed for the purpose of a course of the tour. No fish can be taken
activities and fishing is strictly
tances can be demonstrated by the applicant, new
Fishing Tour Operators icences and Aquatic Eco-Tourism Operators Licences’ All
ect to recreational fishing regulations (see
hing rs
st 2005/06 levels. Fishing for “high risk” demersal
on r
two
ill
legal size ,
auma, boat fishers
r
h
h
e status of the stocks to be
etermined.
in 2009.
mmercial and charter
r and West Coast Bioregion and is a
to
st in
Fishing and Aquatic Tour IThere are three types of fishing and aquatic tour licence categories.
Fishing Tour Operators Licence: The focus is on fishing activities where fish can be taken home at the end of the tour.
Restricted Fishing Tour Operators Licence: The focus is on eco-tourismscuba diving, with fishmeal eaten during the home at the end of the tour and any fishing for a meal must be done with a handline. Fishing rods are not permitted on this tour category.
Aquatic Eco-Tourism Operators Licence: The focus is entirely on eco-tourismprohibited.
Within each category, there is the provision for a boat-based operation (boat size larger than 7.5 m), a combination land/aircraft/boat (boat size less than 7.5 m) based operation
operation. Except where extraordinary and a land-basedcircumsFishing Tour Operators Licences are no longer granted. Applications for Restricted Fishing Tour Operators Licences and Aquatic Eco-Tourism Operators Licences are still considered. Currently, the consideration of any Tour Operator’s Licence Application is carried out in accordance with Regulations 128B and 128J of the Fish Resources Management Regulations 1995 and Ministerial Policy Guideline No. 12 ‘Assessment of Applications for the Granting, Renewal or Transfer ofLfishing is subjbelow).
Catches reported in this document are from records of fisfrom all vessels operating under the Fishing Tour OperatoLicence and those vessels that fished operating under the Restricted Fishing Tour Operators Licence.
Recreational The recreational fishery for west coast demersal scalefish is managed using input (e.g. size limits, seasonal spawning closures for particular species and spatial closures) and output controls (e.g. limits on the numbers of fish that can be taken by individuals and boats).
A suite of new management arrangements was introduced during 2009/10 aimed at reducing the recreational take of demersal scalefish in the West Coast Bioregion by at lea50% fromscalefish will be prohibited during a two month closed seasbetween 15 October and 15 December. From 15 Decembe2009 the existing boat limit for “high risk” species will be revoked and the “high risk” species category (combined dailybag limit of four fish) will be separated into a “high risk demersal” species category (combined daily bag limit of fish) and a “pelagic” species category (combined bag limit of two fish).
The individual daily bag limit for dhufish will be reduced from 2 to 1 fish and a boat limit of two dhufish will apply on a private recreational boat. A boat limit of six dhufish w
apply on a licensed charter boat. The minimumlimit for pink snapper will increase from 45 cm to 50 cmwhen taken from the waters of the West Coast Bioregionsouth of Lancelin.
To assist in minimising the effects of barotrwill also be required to carry a ‘release weight’ to fish for, or be in possession of demersal scalefish in the waters of the West Coast Bioregion. From 2 March 2010 all persons fishing from a powered boat anywhere in the state will be required to hold a Recreational Fishing from Boat Licence ofish in the company of a licence holder. The Recreational Fishing from Boat Licence will provide a state-wide database of recreational boat fishers for survey purposes.
Research summary
Research in the WCDSF is focused on monitoring the statusof the indicator species for the fishery, which are West Australian Dhufish, Pink Snapper and Baldchin Groper. Theywere chosen both because of their importance to the fishery, but also because of their inherent vulnerability to fishing, e.g. they are long-lived, have low natural mortality and are relatively slow growing. Their status is used to indicate the status of the entire west coast inshore demersal suite of scalefish species.
Fish frames of the indicator species are collected from botrecreational and commercial fishers in the different zones of the West Coast Bioregion (West Coast Demersal ScalefisFigure 1). Otoliths are used to determine age compositions for each zone and, from which, estimates of fishing mortalityare calculated which enables thd
Surveys of boat-based recreational fishing continued
Catch and effort data both for the cosectors were monitored from fishers’ daily/trip logbooks, which provide fine-scale data from 10 nm 10 nm and 5 nm 5 nm blocks, respectively. Onboard validation of logbook entries will be conducted in the future.
Estimates of the number of individuals of demersal species caught as bycatch by the Rock Lobster fishery were determined from at-sea monitoring in 2008/09. Full details are reported in the Rock lobster fishery status report.
A WAMSI-funded project is underway to investigate the stock structure of West Australian Dhufish, Pink SnappeBaldchin Groper in thecollaboration between the Department of Fisheries, CSIRO and Murdoch University. The project is using both genetic and otolith microchemistry techniques, but is also examining oceanographic influences on larval dispersal.
A project to investigate site-fidelity of adult Pink SnapperCockburn Sound spawning aggregations commenced in 2009, using acoustic telemetry techniques.
Surveys of the numbers of Pink Snapper eggs in Cockburn Sound were conducted to produce an estimate of spawning stock biomass using a daily egg production model.
A State NRM-funded project focused on small juvenile WeAustralian Dhufish (< 150 mm in length) also commenced early 2010.

WEST COAST BIOREGION
Retained Species
tonnes
nes
119 tonnes
commencement of the to
ers e
r the introduction
ts in the latter year and the effects that had
. Commercial fshore , and
CDSIMF catch in 2009 consisted of 72 scalefish pecies or species groups, 51 of which belong to the west
t inshore and offshore demersal scalefish suites and 21 re from either the west coast pelagic or nearshore scalefish uites. Six species comprised 87 % of the total catch and
included the three demersal indicator species, i.e. Pink Snapper (110 t), West Australian Dhufish (48 t) and Baldchin Groper (11 t). The other three species/species groups were the Redthroat Emperor (41 t), Redfish (Centroberyx spp 42 t) and the pelagic Samson Fish (16 t). Catches of species from the west coast offshore demersal suite, such as Eightbar
2 t.
(77 t)
declined from thos
pproximately 3, 30 and 15 t were caught in the Kalbarri, nes, respectively (West Coast
in )
ch is
186 tonnes
nes
eel based surveys of boat-based recreational fishers in the Metropolitan zone of the West Coast Bioregion were undertaken in 2007/08; for the whole Bioregion in both 2008/9 and 2009/10. Analyses of these data are still being completed using the updated techniques suggested by an independent review of the recreational estimation techniques that occurred in 2009/10. In addition to publishing the estimates for the new surveys, the Department will re-analyse the historical recreational catch and effort data and generate new estimates of recreational catch and effort for the West Coast Demersal Scalefish fishery. Using the new analysis methods, it is likely that historical recreational catch estimates will increase and there will be wider confidence limits around these estimates.
Grouper and Hapuku, were each less than
Catches of scalefish in the DGNDLF in 2008/09comprised 64 t of dem
Commercial production ersal species. These catches have
e of demersal species in 2007/08 (84 t) WCDSIMF (2009) 303 tonnes
(West Coast Demersal Scalefish Table 1). DGDLF (2008/09) 77 tonnes West Australian Dhufish: The total WCDSIMF catch of 48 t of dhufish in 2009 was 27 t less than in 2008. Of that,
Total 380
Indicator species
WCDSIMF (2009)
Pink Snapper 110 ton
West Australian Dhufish 48 tonnes
aMid-West and South-west zoDemersal Scalefish Figure 2). The catch of dhufish in the DGDLF was 14.5 t in 2008/09, which is less than in 2007/08 (19.9) (West Coast Demersal Scalefish Table 1).
Pink Snapper: The WCDSIMF catch of Pink Snapper in 2009 (110 t) was lower than in 2008 (141 t). The vast
Baldchin Groper 11 tonnes
DGDLF (2008/09) majority of Pink Snapper was caught in the Kalbarri (66 t) and Mid-west zones (41 t), with only 3 t taken in the South-west zone (West Coast Demersal Scalefish Figure 3). In the DGDLF, the catch of Pink Snapper fell from 14 t in 2007/08 to 8.6 t in 2008/09 (West Coast Demersal Scalefish Table 1).
Baldchin Groper: In 2009, approximately 11 t of BaldchGroper was landed, almost exclusively in the Mid-west (10 tand Kalbarri zones (1 t), with approximately 8 t of that being caught by WCDSIMF entitlement holders operating within the boundaries of the Abrolhos Zone A of the West Coast Rock Lobster Fishery (Abrolhos zone). The total cat
Pink Snapper 9 tonnes
West Australian Dhufish 15 tonnes
Baldchin Groper 3 tonnes
Total
Pink Snapper
West Australian Dhufish 63 tonnes
Baldchin Groper 14 tonnes
Mackerels, bluefin tunas, sharks and rays are not permitted tobe retained by fishers in the West Coast Demersal Scalefish Interim Managed Fishery (WCDSIMF). Catches of these
similar to the 12 t taken in 2008 and below the limit of 17 tfor the WCDSIMF (West Coast Demersal Scalefish Figure 4). The DGDLF catch of Baldchin Groper increased slightly to 3.2 t in 2008/09 from 2 t in 2007/08 (West Coast Demersal Scalefish Table 1).
Last available recreational catch estimate (excluding charter, 2005/06)
Dhufish:
species are reported elsewhere.
Landings
As permits are issued for the calendar year, commercial catches will now be reported in the same way. This is in contrast to years prior to the
Pink Snapper: 40 tonnes
Baldchin Groper: 28 ton
The last published creel survey was conducted in 2005/06 which estimated that 186 t of dhufish and 28 t of baldchin groper were retained, similar to the catch levels of these species by the commercial sector during the same period. The 40 t of pink snapper retained by recreational boat fishers in this period was much lower than the commercial sector(278 t) in that year.
Subsequently, cr
WCDSIMF, for which, catches were reported accordingfinancial year.
In 2009, 303 t of scalefish were caught by commercial fishin the WCDSIMF, which was 110 t less than in 2008, of thtotal catch, 281 t comprised demersal species. The loweoverall catch would have been influenced byof the entitlemenon fishing behaviour as permit-holders rearrange their fishing activities under the new management plancatches in the Kalbarri, Mid-west, South-west and Of
lyzones in 2009 were 118, 116, 63 and 6 t, respectivethose zones comprised 112, 101, 62 and 6 t of demersal species.
The Wscoasas
STATE OF THE FISHERIES AND AQUATIC RESOURCES REPORT 2009/10 83
WEST COAST BIOREGION
Charter catch (2009)
Pink Snapper: 10 tonne
West Australian Dhufish: 9
Baldchin Groper: 7 tonnes
The charter boat catches of Pink Snapper and West Australian Dhufish in 2009
s
tonnes
id not exceed 4 t.
in
estimates of effort as days fished, i.e. the sum of the ays on which each vessel fished in each zone. This did not
ogbooks. The calculation of effort and the use in the calculation of catch
er unit effort (CPUE) will be reviewed in 2012, as part of
tional otal recreational fishing effort for the West Coast Bioregion
cial ear.
1 were lower than in the 2007/08financial year, i.e. 10 vs 22 and 9 vs 15 t, respectively, whilethose of Baldchin Groper were similar to 2007/08 (7 vs 8 t) (West Coast Demersal Scalefish Table 2). Those three species were the highest ranked in terms of catch, while catches of other species, where weights could be determined, d
Fishing effort/access level
Commercial Permit holders in the WCDSIMF are allowed to fish from 1st January to 31st December each year and are allocated entitlements (hours) to fish in specific zones of the fishery that year. Entitlements based on hours were allocated for the first time for the 2009 fishing year.
Previously only statutory logbooks were required which produced dreflect the number of hours fished. The total number of days fished in 2008 (2,435) and 2009 (1,445) is markedly lower than in the financial years prior to the WCDSIMF, e.g. 8,486 days in 2006/07.
Commercial fishers now report the hours spent searching and fishing, the length of their fishing sessions and their trips in statutory daily/trip lmost appropriate measure forpthe next stock assessment.
In 2009, 46 permitted vessels fished for approximately 14,700 hours. In the Kalbarri zone, 4,056 fishing hours were reported by 17 vessels, while 8,015 (35 boats) and 2,623 hours (8 boats) were reported for the Mid-west and South-west zones, respectively. Note that some vessels have entitlements to fish in more than one zone.
RecreaTis not yet available for 2009.
Fishing and Aquatic Tour Industry (Charter) During 20092, 67 charter licenses reported having undertaking charter fishing operations on 14,731 days which
about 67 % of the effort in the 2007/08 finanrepresents y
1 At the time of writing this report, 90 % of charter fishery
logbooks had been submitted for 2009.
2 At the time of writing this report, 90 % of charter fishery logbooks had been submitted for 2009.
ent complete
Fishing mortality
rmination of estimates of using a range of methods, for
ator species are used to reflect the status of the entire species in the West Coast
c assessments of fishing fishery status is achieved by
er
sh
ed offshore emersal species (Eightbar Grouper, Bass Groper, Hapuku, lue-eye Trevalla and Ruby Snapper). These deepwater
the west coast e of their
kefield et al., 20104). In
to be medium.
Stock AssessmAssessment
Yes (last full assessment 2007/08)
Assessment method (Full)
(Intervening Period) Catch by sector
Breeding stock levels
Pink Snapper: Inadequate
West Australian Dhufish: Declining
Baldchin Groper: Declining
Assessments of the status of the stocks in the WCDSF are conducted primarily from the deterates of fishing mortality (F),each of the indicator species (West Australian Dhufish, Pink Snapper and Baldchin Groper). The estimates of F for these indicinshore demersal suite ofBioregion. In addition to periodimortality, annual monitoring of comparing catch and effort data (if available) in each sector of the fishery with catch limits for those sectors.
Age compositions of the indicator species derived fromsamples collected in 2007/08, were dominated by fish less than 15, 10 and 15 years of age, respectively, for dhufish, snapper and baldchin. Using the resultant F values and othancillary information within a weight of evidence based approach, indicated that the breeding stocks for both dhufiand baldchin were declining while that of pink snapper was considered to be inadequate. Two independent external reviews supported these conclusions. For further details see the State of the Fisheries Report 2008/09.
There is limited biological information for targetdBspecies are particularly vulnerable In
erfishing, as the limited knowledgBioregion to ovbiology indicates that they are long-lived and would therefore have low rates of natural mortality and productivity (Wakefield and Newman, 20083; Waaddition, some aggregate to spawn and most suffer barotrauma due to the depths in which they are fished (> 250 m). Risk to the stocks of these species is considered
3 Wakefield, C.B., & Newman, S.J. (2008) Age estimation and
reproductive status of an exceptionally large blue-eye trevalla (Hyperoglyphe antarctica, Centrolophidae) captured off the south coast of Western Australia. Cybiu32, 321-324.
4 Wakefield, C.B., Newman, S.J. & Molony, B.W. (2010) A
based demography and reproduction of hapuku, Polyprion oxygeneios (Polyprionidae), from the south coast of Western Australia: implications for management. ICES Journal of Marine Science, 67, 1164-
m,
ge-
1174.
84 DEPARTMENT OF FISHERIES

WEST COAST BIOREGION
Social Effects Using the assessments of the indicator species as outlinabove, the ecological risks to the suites of inshore and offshore demersal species in the West Coast Bioregion arcurrently assessed as being high and medium/high respectively (see Fletcher, et al., 20101 for details). The inshore suite also has high risks associated with meeting the social and economic objectives for the community. This combination of factors means that this suite of species has been assigned an urgent priority for Departmental actions. The urgent priority and high ecologic
ed
e
al risk associated with equire
-Retained Species
tained nedible
species e.g. Silver Toadfish and small spa
ble
pecies are minimal. Commercial and charter fishers are
nteractions in their g 2009, charter vessels interacted twice with
in effects Low
n FRDC study examined the last 30 years of catch data by ll commercial fisheries in this region and found no evidence
y shift in community structure of this suite of species or the relative proportion of different trophic levels in the
atch.
abitat effects Negligible
he main fishing method used in the commercial and creational fishery for demersal species (line fishing), has ttle physical impact on the benthic environment.
Commercial A total of 61 permits to fish in the WCDSIMF were used on 46 permitted vessels in the fishery during 2009 and, on average, employed one crew member.
the inshore demersal suite indicates that this suite will ra high level of monitoring and assessment. The offshore suite is currently considered to have a medium level priority.
NonBycatch species impact Medium
Line fishing for demersal species using baited hooks is highly selective. Other species that are caught but not reduring demersal fishing activities (this includes i
ecies, such as wrasses) are often susceptible to the effects of barotraumand the substantial numbers of these released fish may not survive.
Protected species interaction Negligi
As line fishing is highly selective, interactions with protectedsrequired to record protected species ilogbooks. Duringrey nurse sharks and twice with Albatrosses. Each animal was released alive.
Ecosystem Effects Food cha
Aaof aninc
H
Treli
1 W.J. Fletcher, J. Shaw, S.J. Metcalf & D.J. Gaughan (2010)
An Ecosystem Based Fisheries Management framework: the efficient, regional-level planning tool for management agencies. Marine Policy 34 (2010) 1226–1238
ishing and Aquatic Tour Industry (Charter) sector of the WCDSF are sis. Thus, data is presented for
ployed in the charter
ses
ial
ile
s per kg vary with supply and demand and
l Current Fishing (or effort) level Acceptable
Catch (or effort) limit range:
WCDSIMF 449-469 tonnes
WCDGDLF/JASDGNDLF (West Coast Bioregion)
80 tonnes
All commercial < 550 tonnes
The catch limit for demersal species in the WCDSIMF for 2009 (449-469 t) was based on 50 % of the 2005/06 catch of wetline fishers in the Kalbarri, Mid-west and South-west zones and also allows ca. 30 t to be taken in the Offshore zone. Acceptable catch levels for each of the indicator species in each zone in which they are an indicator are similarly based on 50 % of their 2005/06 catches (West Coast Demersal Scalefish Table 3). Note that there is now no longer any commercial wetline or gillnet/longline fishing in the Metropolitan zone.
FLicenses to fish in the charterreissued on a financial year bathe last two financial years. In 2008/09, there were 131 charter operators who were licensed to operate in the West Coast bioregion via a Fishing Tour Operators Licence and 21who held a Restricted Fishing Tour Operators Licence and/oran Aquatic Eco-Tourism Operators Licence, while in 2009/10, 125 were licensed only to fish and 23 to fish and run eco-tours. The number of people emindustry has not been estimated.
Recreational Fishing Approximately 70,000 recreational fishing from boat licenhave been issued across the state since 2nd March 2010.
Economic Effects Estimated annual value (to commercial fishers)
for year 2009 $2.94 million
The estimated value of the WCDSIMF in 2009 ($2.94 million) was less than that of the previous reported financyear, i.e. 2007/08 ($3.4 m), as a result of the reduction in effort and catch. Catches of West Australian Dhufish and Pink Snapper contributed $828,000 ($17.06/kg) and $1,034,000 ($9.47/kg), respectively, to the fishery, whRedthroat Emperor contributed $325,000 ($7.99/kg), Bight Redfish $272,000 ($7.29/kg) and Baldchin Groper $136,000 ($12.10/kg). Priceare based on the average price in 2009. Values reported are for the fishing year of 2009, not financial year.
Fishery Governance Commercia
STATE OF THE FISHERIES AND AQUATIC RESOURCES REPORT 2009/10 85

WEST COAST BIOREGION
86 DEPARTMENT OF FISHERIES
he total commercial catch of demersal species in the CDSIMF of 303 t in 2009 was below the catch limit,
cting the restrictions placed on effort in the fishery. imilarly, the total catch of each indicator species in the
ely the same as the limit.
For the purposes of Integrated Fisheries Management, commercial catches of scalefish species by the WCDSIMF and DG region in 2009 would have been like e catch level for that year.
RecreaCurrent Fishing le l To be determined
Catch (or effort) limit range (2009/10):
< ca. 200 tonnes
he proposed catch limit range for the suite of demersal pecies in the recreational and charter sectors in the West oast Bioregion for the 2009/10 year is at most 50 % of the
i.e. < 200 tonnes. The level of reduction to e recreational catch will be dependent on the effect the
hanges to the management had on those sectors.
ommercial review of the rst year of operation of the Fishery since ttroduction of entitlements will occur during the latter half
f 2010. Forma to etermine how catch reductions by the ifferent comm e most efficiently chieved.
Recreational/Charter A review of the effectiveness of the newly introduced recreational arrangements to achieve the 50% reduction in catch from 05/06 levels will be made during the latter half of 2010. The formal Integrated Fisheries Management
ed.
Recruitment success of both West Australian Dhufish and k Sn ghly v d influenced by
those species and ches in hery main on a l ited number of
strong recru ears. This is likely t other s in the WCDSF.
Cockburn Sound is the only wn spawning aggregation ocation fo Snapper West Coast Bioregion. urthermore, juveniles use the area as a ursery for
a ne and a h rs following settlement, leaving Cockburn Sound. Ongoing industrial
e area m e detri ental effects on the environmental conditions that are important for both spawning and juvenile survival and thus influence future recruitment success from Cockburn Sound to the West Coast Bioregion.
The Commonwealth Western Deepwater Trawl Fishery fishes in waters along the west coast of Australia in waters from the 200 m isobath to the boundary of the AFZ and between approximately Exmouth and Augusta. This fishery
several years, of demersal species of interest, e.g. Ruby Snapper Etelis carbunculus and Deepwater Flathead Pla cona eographical overlap of catches by the two fisheries ind tes that they e likely to be fishing the same stocks.
The Commonwealth’s South-west Ma Bioregional Plan incorporates the aim of introducing marine reserves, which are likely to contain areas closed to fishing. This has the potential to restrict access to fishing in parts of the West Coast Bioregion to all sectors, i.e. commercial, recreational and charter.
TWrefleSWCDSIMF and of all species in each zone was below their respective limits (West Coast Demersal Scalefish Table 3). The catch of each indicator species in each zone was below its limit for that zone, except in the case of Pink Snapper in the Kalbarri and the Mid-west zones, where the catch was approximat
arrangements for this fishery are expected to be finalis
External Factors
DLF in the West Coast Bioly to be below the acceptabl
tional/charter ve
TsC2005/06 level, thc
New management initiatives overlaps the WCDSF and has obtained substantial catches, in
CA fi he inod
l decision rules will be developedthe various target
d ercial sectors will ba
Pinenvironmental
apper is hifactors. Thus, th
ariable ane stocks of
cat the fis ly rely imitment y
specieo be similar for
long-lived
knolF
r Pink in the n
approxim tely o alf yeabefore development in th ay hav m
tycephalus tus. The gica ar
rine

WEST COAST BIOREGION
WEST COAST DEMERSAL SCALEFISH TABLE 1.
atches of the demersal gillnet and demersal longline fisheries in the West Coast Bioregion (WCB) from 2006/07-2008/09, which comprises those of the West Coast Demersal Gillnet and Demersal Longline (Interim) Managed Fishery and the part of the Joint Authority Southern Demersal Gillnet and Demersal Longline Managed Fishery that operates in the WCB.
WEST COAST DEMERSAL SCALEFISH TABLE 2.
Catches of West Australian Dhufish, Pink Snapper and Baldchin Groper by charter fishers in the West Coast Bioregion between 2005/06 and 2009.
EST COAST DEMERSAL SCALEFISH TABLE 3. r species in each zone of the WCDSIMF and their totals.
C
2006/07 2007/08 2008/09
West Australian Dhufish 19.2 19.9 14.5
Pink Snapper 16.8 14.0 8.6
Baldchin Groper 3.7 2.0 3.2
Other scalefish 85.8 61.6 51.1
Demersal species 96.3 83.6 64.2
Total scalefish 125.5 102.4 77.4
2005/06 2006/07 2007/08 2009
West Australian Dhufish 20.5 18 15 9
Pink Snapper 17 24 22 10
Baldchin Groper 10 11 8 7
W
Acceptable catch levels for each zone and the indicato
Zone
Kalbarri Mid-west South-west Offshore Total
WCDSIMFA
WCDSIMF 150 197 82 20-40 449-469
West Australian Dhufish - 44 19 - 72
Pink Snapper 65 43 12 120
Baldchin Groper 9B 17 ATotal catch limit for the WCDSIMF represents the sum of the limits in each zone. Indicator species are taken not only in zones where
they are an indicator. Thus, the total catch limit for indicator species for the WCDSIMF is, in some cases, greater than the sum of the zones.
BThe limit for Baldchin Groper represents the limit for the area of the Rock lobster fishery Zone A (Abrolhos Islands), where this species is an indicator.
STATE OF THE FISHERIES AND AQUATIC RESOURCES REPORT 2009/10 87

WEST COAST BIOREGION
WEST COAST DEMERSAL SCALEFISH FIGURE 1
Map showing the boundaries of the West Coast Demersal Scalefish Fishery. Note the northern boundary of 26°30’ S applies to the commercial fishery and is the proposed future boundary for the charter and recreational fishery. The Kalbarri, Mid-west, Metropolitan and South-west zones applicable to the recreational and charter sectors extend from the coast seawards to the Australian Fishing Zone boundary (AFZ), while for the commercial sector those four zones extend from the coast to the 250 m depth contour. The commercial fishery also comprises an offshore zone, which encompasses the waters from the 250 m depth contour outwards to the boundary of the 200 nm AFZ and from 26°30’ S to 115°30’ E.
88 DEPARTMENT OF FISHERIES
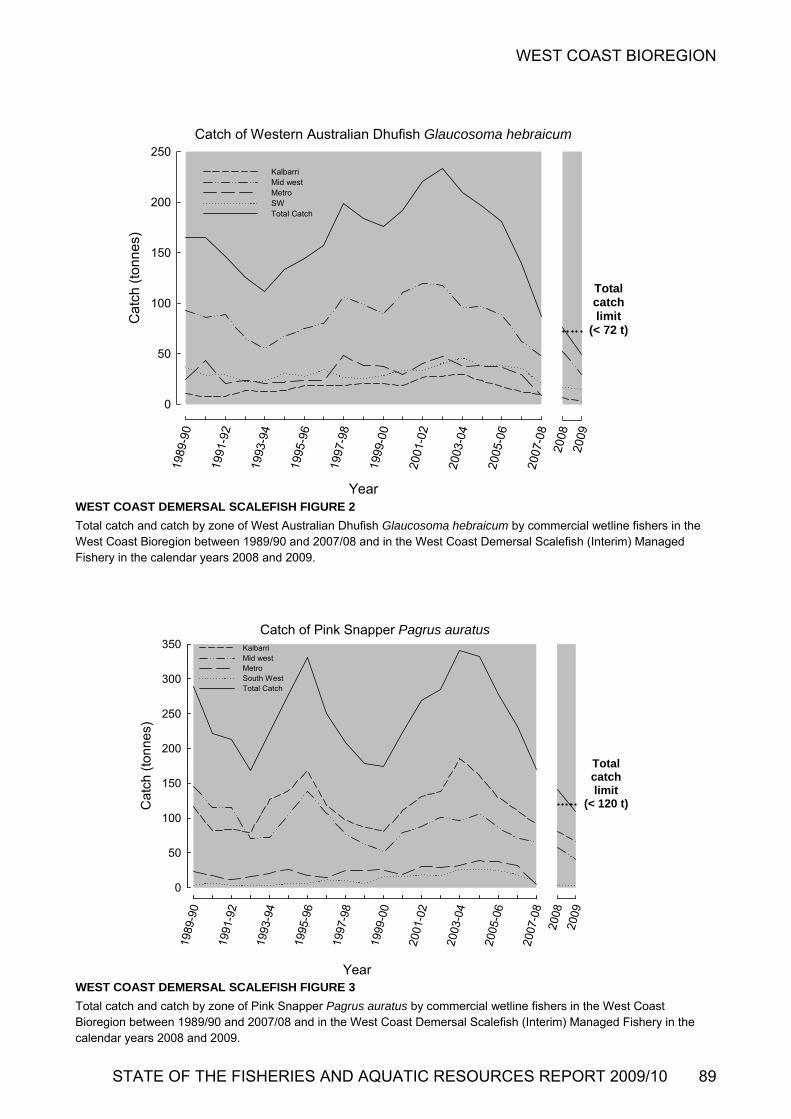
WEST COAST BIOREGION
Catch of Western Australian Dh
Year
ufish Glaucosoma hebraicum
50
100
150
200
250
Kalbarri Mid west Metro SW Total Catch
WEST COAST DEMERSAL SCALEFISH FIGURE 2
otal catch and catch by zone of West Australian Dhufish Glaucosoma hebraicum by commercial wetline fishers in the est Coast Bioregion between 1989/90 and 2007/08 and in the West Coast Demersal Scalefish (Interim) Managed
auratus b etline fishers in the West Coast est Coast Dem he
TWFishery in the calendar years 2008 and 2009.
WEST COAST DEMERSAL SCALEFISH FIGURE 3
Total catch and catch by zone of Pink Snapper Pagrus Bioregion between 1989/90 and 2007/08 and in the Wcalendar years 2008 and 2009.
y commercial wersal Scalefish (Interim) Managed Fishery in t
Ca
tch
(to
nne
s)
Totalcatchlimit
(< 72 t)
0
1989
-90
1991
-92
1993
-94
1995
-96
1997
-98
1999
-00
2001
-02
2003
-04
2005
-06
2007
-08
2008
2009
Catch of Pink Snapper Pagrus auratus
rYea
1989
-90
1991
-92
1993
-94
1995
-96
1997
-98
1999
-00
2001
-02 4 6 8
onne
20 20 20
03-0
05-0
07-0
Cat
ch (
ts)
0
50
100
150
200
300
250
350 KalbarriMid west Metro South West Total Catch
Totalcatchlimit
(< 120 t)
2008
2009
STATE OF THE FISHERIES AND AQUATIC RESOURCES REPORT 2009/10 89

WEST COAST BIOREGION
90 DEPARTMENT OF FISHERIES
WEST COAST DEMERSAL SCALEFISH FIGURE 4
Total catch of Baldchin Groper Choerodon rubescenbetween 1991/92 and 2007/08 and total catch in the Westcatch in the Abrolhos Zone A of the Western Rock L
Catch of Baldchin Groper Choe
Year
rodon rubescens
20
30
40
50
s by comme Coast
obster fisher
ort
rcial wetline fishers in the West Coast Bioregion Demersal Scalefish (Interim) Managed Fishery andy in the calendar years 2008 and 2009.
Octopus Fishery Status RepA. Hart and D. Murphy
Management input from R. Gould and M. Coloper
Main Features
Status
Stock level Acceptabl
Fishing level Acceptab
e
le
t
Current Landings
Commercial – Statewide 71
Recreational – Statewide (2001 estimate) 17 t
Fishery Description Australia primarily targets
ts, UBA divers. In
ct.
ockburn Sound (Line and Pot) Management Plan 1995
of the Fish
Boundaries
Recreational octopus fishing is permitted to operate throughout Western Australian waters, with the exception of
The octopus fishery in WesternOctopus cf. tetricus, with occasional bycatch of O. ornatus and O. cyanea in the northern parts of the fishery, and O. maorum in the southern and deeper sectors.
Fishing activities targeting octopus in Western Australia can be divided in four main categories. The West Coast Rock Lobster Managed Fishery (WCRLF) harvests octopus as a by-product, and currently accounts for the majority of total octopus landings. The Cockburn Sound (Line and Pot) Managed Fishery (CSLPF), uses unbaited or passive (shelter) octopus pots; the Developmental Octopus Fishery (DOF) uses both passive shelter pots and active (trigger pots) traps to selectively harvest octopus. Recreational octopus fishing consists of by-catch from recreational lobster and crab poand targeted octopus fishing, mostly by SCaddition to these 4 main sectors, numerous trawl and trap fisheries land small amounts of octopus as a by-produ
Governing legislation/fishing authority
C
Instrument of Exemption (Section 7(3)(c)Resources Management Act 1994)
West Coast Lobster Management Plan 1993
Consultation process
Meetings between the Department of Fisheries and industry
Developing Fisheries Advisory Committee
Total catch
Abrolhos Zone A
1991
-92
1993
-94
1995
-96
1997
-98
999-
01
0
2001
-02
2003
-04
2005
-06
2007
-08
Tot
al c
atc
h (
tonn
es)
Totalcatchlimit
(< 17 t)
10
0
2008
2009

WEST COAST BIOREGION
reserves and sanctuaries. Each commercial fishing sector islimited spatially to the boundaries inherent in their legislative instruments. Octopus caught in the WCRLF are restricted to
a
tricted to
is
s a
s allowable under the license conditions. The OF is also managed through limited entry (currently only 5
exemption holders) and limits on octopus pot allocation
tional tly
hers annot dive from shore using traps to take octopus).
(677) means of fish traps,
t anagement. Boxed text in this status report provides the
ummary
urrent research is focused on reporting of annual catch and isheries, reported on a
logbook for the DOF
t,
ates of undersize catch. The location f the fishing gear is recorded with a GPS position to enable more precise spatial breakdown of fishing activities and the
ication of fishing zones. In 2008 and 2009, two student rojects investigating aspects of biology and ecology of
he department has also successfully obtained a research rant from the Fisheries Research and Development
s
s (season 2009):
71 tonnes (live weight)
stimate (season 2001):
ch ch r
n a sector-specific level, octopus catch from the WCRLF atch from the CSLP also
atch from the igure 1).
ecreational: No annual estimate of recreational catch al recreational and
d a total catch of 25,600
amounts to a total catch 17 tonnes.
s level
ommercial: Fishing effort in the commercial octopus in which
ys in
ent ssessment complete: Preliminary
Catch rate
)
E for octopus from the WCRL was 1.7 kg/day,
the boundaries of that fishery (between latitude 21° 44´ S and 34° 24´ S). Octopus catch in the CSLPF is limited to Cockburn Sound. Octopus caught in the DOF are limited to the boundaries of the developmental fishery, which is an arebounded by Coral Bay in the north and Esperance in the south. Within this area however, spatial separation of the DOF “Exemption holders” ensures they are each resa section of the coast that excludes the others.
Management arrangements
The keeping of octopus as a by-product in the WCRLF permitted without catch restrictions or size-limits, however the catch rate of octopus within the fishery is monitored aperformance indicator to ensure it is maintained within historical levels (see WCRLF status report). The CSLPF is managed though input controls in the form of limited entryand gear restrictions, with a permitted maximum number of octopus potD
specific for passive (shelter) and active (trigger) octopus traps. Effort is also spatially controlled, with each exemptionholder allocated a specific area of coast.
The current recreational bag limit for octopus is 15 octopus, with a boat possession limit of 30 octopus. The RecreaFishing (Permitted Fishing Methods) Notice (527) currenpermits recreational fishers to use unbaited octopus traps when fishing from a boat (note that recreational fiscHowever, the Fish Traps Prohibition Notice 1994prohibits all persons from taking fish bywith the exception of those persons that hold a recreational fishing licence and are using a rock lobster trap.
A comprehensive Ecologically Sustainable Developmentassessment of this fishery has also been undertaken to identify any potential sustainability risks requiring direcmannual assessment of performance for this issue.
Research s
Ceffort statistics from commercial fmonthly basis. A daily catch and effort was implemented in 2003 and gradually introduced to the DOF between 2003 and 2007. The logbook provides details of the octopus fishing operations such as the depth, habitapot types used and soak times (the period of time pots remainin the water until next pull). Details on catch include catch size categories and estimoaidentifpOctopus cf. tetricus were also completed.
Tg
Corporation for a project titled “Innovative development of the Octopus tetricus fishery in Western Australia”. Resultfrom this project will inform industry and management on the viability of an expanded DOF.
Retained Species Commercial landing
Recreational catch e
17 tonnes (live weight)
Landings
Commercial: In 2009 the total commercial octopus catwas 71 t live weight, a decrease of 37% over last years catof 112 t, mainly due to the lower effort and therefore lowecatch, from the WCRLF (Octopus Figure 1).
Odeclined from 68 to 31 tonnes; cdeclined slightly, from 20 to 17 t, while the cDOF remained steady at 21 tonnes (Octopus F
The developing octopus fishery (DOF) has steadily risen from 4% of the total catch in 2001 to 30% in 2009 (Octopus Table 1). At the same time, share of catch from the lobster fishery has declined from 86% to 44%, primarily as a result of effort reductions.
Rexists for octopus. In 2001, the nation
indigenous fishing survey1
estimateoctopus in WA. Using an average weight of 0.7 kg, this
Fishing effort/acces
Cfishery is measured as the amount of days fishingoctopus was caught. Total octopus effort in the WCRLF in 2009 was 18,300 days, a 38% reduction from 29,400 da2008 (Octopus Table 1). Days fished in the CSLP and DOF were 208 and 217 respectively, a decrease of 6% and 10% from 2009 (Octopus Table 1). Overall there has been a decline in octopus effort from early 2000s (2001 to 2006)compared to the late 2000s (2006 to 2009).
Stock AssessmA
Assessment method:
Breeding stock levels: Adequate
Catch per unit effort: The catch per unit effort (CPUEfrom the three main sectors (WCRL, CSLP, DOF) are the principal indicator of abundance of octopus.
The CPU
1 Henry, G.W. and Lyle, J.M. (eds). 2003. The national
recreational and indigenous fishing survey. FRDC project no. 99/158. NSW Fisheries Final Report Series No. 48.
STATE OF THE FISHERIES AND AQUATIC RESOURCES REPORT 2009/10 91
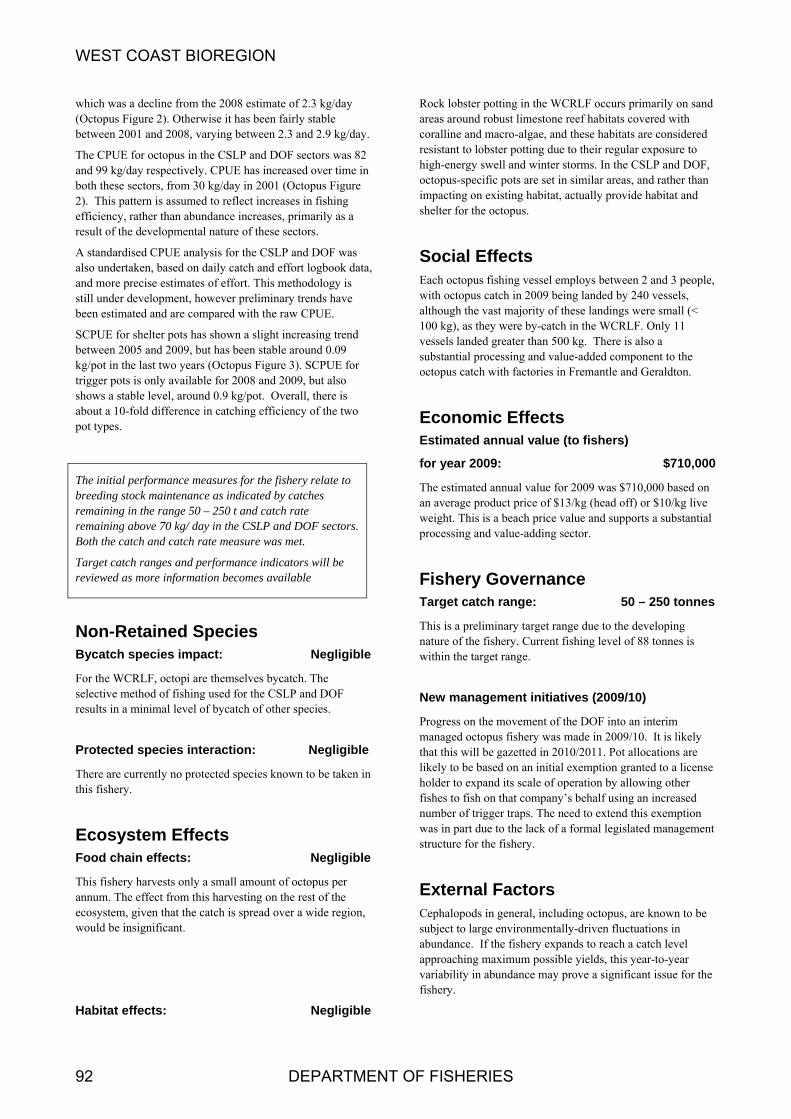
WEST COAST BIOREGION
92 DEPARTMENT OF FISHERIES
hich was a decline from the 2008 estimate of 2.3 kg/day ctopus Figure 2). Otherwise it has been fairly stable
etween 2001 and 2008, varying between 2.3 and 2.9 kg/day.
the CSLP and DOF sectors was 82
as a sult of the developmental nature of these sectors.
A standardised CP ysis f LP and was also undertaken, based on daily d effor k datand more precise estimates of effort. Thisstill under development, however preliminarbeen estimated an mpared the raw C .
SCPUE for shelter as shown a slight incre trend between 2005 and 2009, but has b stable aro 09 kg/pot in the last two pus Figure 3). Strigger pots is only ble for 2 and 2009 so shows a stable level, around 0.9 k t. Overal is about a 10-fold differen e in catching efficiency two pot types.
Non-Retained Species Bycatch species impact: Negligible
For the WCRLF, octopi are themselves bycatch. The selective method of fishing used for the CSLP and DOF results in a minimal level of bycatch of other species.
Protected species interaction: Negligible
There are currently no protected species known to be taken in this fishery.
Ecosystem Effects Food chain effects: Negligible
This fishery harvests only a small amount of octopus per annum. The effect from this harvesting on the rest of the ecosystem, given that the catch is spread over a wide region, would be insignificant.
Rock lobster potting in the WCRLF occurs primarily on sand areas around robust limestone reef habitats covered with coralline and macro-algae, and these habitats are considered resistant to lobster potting due to their regular exposure to high-energy swell and winter storms. In the CSLP and DOF,
than d
shelter for the octopus.
S l E s Each octopus fis en 2 and 3 people, with octopus cat 240 vessels, although the ority se land ere small (< 10 ), as t by-c the WCRLF. Only 11 ve lande than g. Th o a substantial processing and value-added onent to the oc catc ctorie reman Geraldton.
E om fecE ated annual value (to fish
fo ar 20 $710,000
Th imate valu 009 was $710,000 based on an average product price of $13/kg (head off) or $10/kg live weight. This is a beach price value and supports a substantial processing and value-adding sector.
Fishery Governance Target catch range: 50 – 250 tonnes
This is a preliminary target range due to the developing nature of the fishery. Current fishing level of 88 tonnes is within the target range.
New management initiatives (2009/10)
Progress on the movement of the DOF into an interim managed octopus fishery was made in 2009/10. It is likely that this will be gazetted in 2010/2011. Pot allocations are likely to be based on an initial exemption granted to a license holder to expand its scale of operation by allowing other fishes to fish on that company’s behalf using an increased number of trigger traps. The need to extend this exemption was in part due to the lack of a formal legislated management structure for the fishery.
External Factors Cephalopods in general, including octopus, are known to be subject to large environmentally-driven fluctuations in abundance. If the fishery expands to reach a catch level approaching maximum possible yields, this year-to-year
he
The initial performance measures fishery to breeding stock maintenance as indicated by catemaining in the range 50 – 250 t and catch rate emaining above 70 kg/ day in the CSLP and DOF sectors. oth the catch and catch rate measure was met.
Target catch ranges and performance indicators will be reviewed as more information becomes available
w(Ob
The CPUE for octopus inand 99 kg/day respectively. CPUE has increased over time in both these sectors, from 30 kg/day in 2001 (Octopus Figure 2). This pattern is assumed to reflect increases in fishing efficiency, rather than abundance increases, primarily
octopus-specific pots are set in similar areas, and ratherimpacting on existing habitat, actually provide habitat an
re
UE anal or the CS catch an
DOFt logboo a,
methodology is y trends have
d are co with PUE
pots h asingeen und 0.
CPUE for years (Octo availa 008 , but al
g/po l, there of the c
ocia ffecthing vessel employs betwech in 2009 being landed by
vast maj of the ings w0 kgssels
hey wered greater
atch in 500 k ere is als
comptopus h with fa s in F tle and
con ic Ef ts stim ers)
r ye 09:
e est d annual e for 2 for the relate
ches rrB
Habitat effects: Negligible
variability in abundance may prove a significant issue for tfishery.
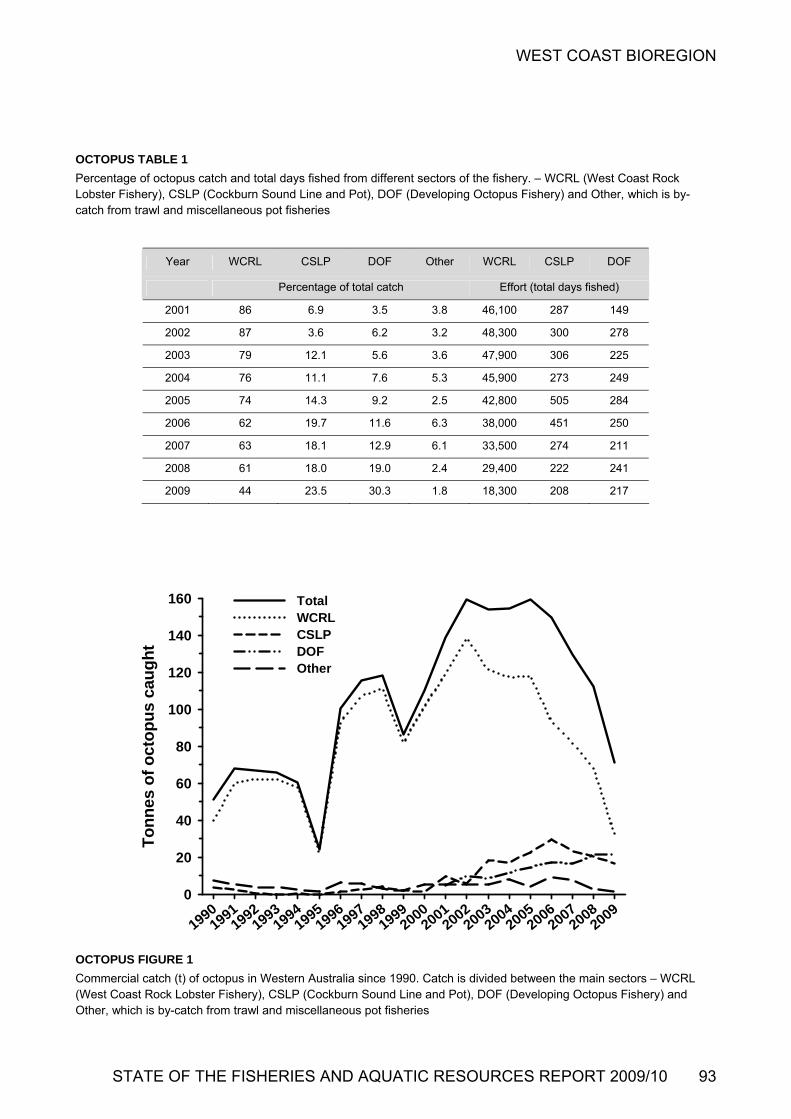
WEST COAST BIOREGION
OCTOPUS TABLE 1
Percentage of octopus catch and total days fished from different sectors of the fishery. – WCRL (West Coast Rock Lobster Fishery), CSLP (Cockburn Sound Line and Pot), DOF (Developing Octopus Fishery) and Other, which is by-catch from trawl and miscellaneous pot fisheries
Year WCRL CSLP DOF Other WCRL CSLP DOF
Percentage of total catch Effort (total days fished)
2001 86 6.9 3.5 3.8 46,100 287 149
2002 87 3.6 6.2 3.2 48,300 300 278
2003 79 12.1 5.6 3.6 47,900 306 225
2004 76 11.1 7.6 5.3 45,900 273 249
2005 74 14.3 9.2 2.5 42,800 505 284
2006 62 19.7 11.6 6.3 38,000 451 250
2007 63 18.1 12.9 6.1 33,500 274 211
2008 61 18.0 19.0 2.4 29,400 222 241
2009 44 23.5 30.3 1.8 18,300 208 217
octopus in Western Australia since 1990. Catch is divided between the main sectors – WCRL
19901991
19921993
19941995
19961997
19981999
20002001
20022003
20042005
20062007
20082
To
nn
es o
f o
cto
pu
s ca
ug
ht
0090
20
40
60
80
100
120
140
160 TotalWCRLCSLPDOFOther
OCTOPUS FIGURE 1
Commercial catch (t) of(West Coast Rock Lobster Fishery), CSLP (Cockburn Sound Line and Pot), DOF (Developing Octopus Fishery) and Other, which is by-catch from trawl and miscellaneous pot fisheries
STATE OF THE FISHERIES AND AQUATIC RESOURCES REPORT 2009/10 93

WEST COAST BIOREGION
94 DEPARTMENT OF FISHERIES
,
) in kg/pot ter pots, and
OCTOPUS FIGURE 2
Catch per unit effort (CPUE) in kg/day of Octopus in the tCSLP (Cockburn Sound Line and Pot), DOF (Develo
hree maping Octopu
in sectors – WCRL (West Coast Rock Lobster Fishery)s Fishery).
OCTOPUS FIGURE 3
Standardised catch per unit effort (SCPUE) (±95% CLsectors. Trends are for two pot types – passive shel
of Octopus in the CSLP (left axis) and DOF (right axis) active trigger pots.
20042005
20020
6 07
SC
P-
Sh
elt
er P
20082009
UE
o
ts
0.00
0.02
0.04
0.08
0.10
0.06
0.12
0.14S
CP
UE
- T
rig
ger
Po
ts
0.0
0.1
0.2
0.3
0.4
0.5
0.6
0.7
0.8
0.9
1.0Shelter PotsTrigger Pots
CSLPDOF
120 3.5
WCRL
80
100
2.5
3.0
an
d D
OF
2002
100
22
002
300
200542006
20072008
2009
CP
UE
- C
SL
P
0
20
40
60
CP
UE
- W
CR
L
1.0
1.5
2.0

WEST COAST BIOREGION
AQUACULTURE Regional Research and Develop
Aquaculture production statistics are compiled at the Western Australian Fisheries and Marine Re
ment Ove
search Laboratories AFMRL) at Hillarys.
ture increased by around
re ow
s is
sing
been made on the development of a
rt
of Understanding to formalise these new
ental Monitoring Plans e
h
lture research team
er for
the
ped
first at
stem as
any was
eight every fortnight, emphasised the potential of
NITY EDUCATION
ldton
s coveryWest education team delivers targeted
f
tail checks and inshore sea-based patrols so
gh formal
ons (wholesale/retail/processors), other resource anagement agencies and community members.
rview
agreed Management and Environm
(W
In 2008/09, the value of aquacul11% and aquaculture tonnage increased by 4% compared toequivalent data for 2007/08 (excluding marine algae and all pearl oysters). However, aquaculture production is still less than the peak in 2003/04.
The framework to allow for the granting of leases for aquacultuhas been finalised; however, its release has been delayed to allfor the amendments to the Land Administration Act by the Department of Regional Development and Lands. The Minister has granted two leases: one for the aquaculture of octopus in Cockburn Sound and another for abalone in Flinders Bay in the south west of the state.
The Department’s review of aquaculture licence conditioncontinuing. The outcome of the review will deliver higher levels of consistency, transparency and certainty in licenand compliance arrangements across all aquaculture industrysectors.
Significant progress hasnew framework for the environmental arrangement for aquaculture applications, both large- and small-scale. The Ecologically Sustainable Development (ESD) reports for marine finfish, land-based finfish and prawns have been completed and Environmental Codes of Practice drafted in conjunction with industry and the Department of Environment and Conservation (DEC). This sector will be the first to be run through a process to deregulate it from PaV of the Environmental Protection Act 1986.
A Memorandumarrangements has been finalised with DEC and the Environment Protection Authority. The process will include
COMPLIANCE AND COMMU
Compliance and community education in commercial and recreational fisheries in the West Coast Bioregion is undertaken by Fisheries and Marine Officers (FMOs) based
and a Guidance Statement for baseline data collection. Theswill be required for all new applications.
Some of the proposed legislative amendments to the FisResources Management Act 1994, designed to improve the regulatory environment and streamline the approvals processes, have received Royal assent and their proclamation is anticipated before June. The remaining amendments are expected to be drafted this financial year.
The Department’s marine finfish aquacucontinued its collaboration with Cognis Australia to developcommercial production of Artemia (brine shrimp) at Hutt Lagoon, Port Gregory. During April 2010, the MinistFisheries Mr Norman Moore officially opened the commercial production site. The project was supported byFRDC and is taking advantage of the red algae (Dunaliellasalina) that the company also farms. DoFWA staff develoand built sophisticated state-of-the art filtration, aeration and harvesting systems to suit the high volume of water passing through the facility. The production system is a world-commercial tank production of Artemia.
A new application was submitted to FRDC to continue the productive collaboration and further optimize the sywell as develop new products.
As well, a new FRDC project in collaboration with a commercial octopus fishing and processing compinitiated. Initial growth trials, achieving a doubling of octopus woctopus to become a major aquaculture species in WA. Following these results the project will research ranching wild-caught juvenile octopus and seek to close the life cycle through larvae rearing.
at the Busselton, Bunbury, Mandurah, Rockingham, Fremantle, Hillarys, Lancelin, Jurien, Dongara and Geraoffices, as well as aboard the large ocean-going patrol vesselsHamelin, McLaughlan, and Walcott. The Department’MarineDiseducation programs throughout the West Coast region. These programs are delivered by Community Education Officers based in Busselton and Fremantle, with the assistance of Fisheries Volunteers (formerly known as Volunteer Fisheries Liaison Officers) based in Busselton, Bunbury, Mandurah, Fremantle, Hillary’s, Dongara, Geraldton and Kalbarri. Staf
from the MarineDiscoveryWest team and the Naturaliste Marine Discovery Centre also provide education services andactivities at Hillary’s and in the Regions.
Services provided by land-based officers include processing inspections, landing and gear inspections, licensing checks, wholesale/reutilizing vessels ranging in size from 5 m to 12 m. They alprovide support to seagoing personnel and provide a wide variety of educational and extension services throuand informal media to commercial fishers, fishing related operatim
STATE OF THE FISHERIES AND AQUATIC RESOURCES REPORT 2009/10 95

WEST COAST BIOREGION
The Department also delivers at-sea marine safety compliance services on behalf of the Department for Planning and Infrastructure in the Metropolitan region extending from Mandurah to Lancelin (excluding the Swan/Canning Rivers). Outside of this area marine safety is unfunded and inspections are carried out in combination withfisheries compliance inspections.
Activities during 2008/09
ent of this time was focused on the g
ddition in undertaking compliance operations and research rojects in the Metropolitan Region. The “PV Waterman” is sed throughout the year and provides a valuable resource for
titlement
pliance and education and shark response as ps
CM ompliance Risk Asse erations ta icant risks including over potting, fishers interfer fishing gear and black market operations, which resulted in a number of apprehensions.
T e also conducted to address illegal fi to release totally protected rock lobsters, and pulling ro lobster pots prior to the prescribed starting ti
W hery, each vessel had its catch inspected by FMOs on at least one o .5 checks per vessel throughout th mpliance Table 2). On average 18.5 baskets were inspected per vessel, an increase on the n r vessel in 2007/08. The percentage o pected was slightly greater than the previous season oximately 2.6 – 3.3% of the catch inspected (ca r than the p -0.0010. T o estimate that between 5.1 and 7.9 tonnes of e consigned during 2008/09.
(Wfish
Ovfish e was a
pre
e compliance activity was directed towards
s. The
e finfish and crabs.
al
al
to
Department of Environment and Conservation in delivering compliance services to marine parks throughout the bioregion. This collaborative approach has worked very effectively, particularly during the metropolitan abalone season, which occurs predominately within the Marmion Marine Park, and in the Jurien Marine Park, where DEC
reasing the effectiveness of compliance service delivery. The level of non-compliance encountered in these parks is low.
As part of the collaborative approaccompliance service delivery, the Department continued its commitment to training officers from DEC, Wa er Corporation and the Rottnest Island Authorit
Throughout the year FMOs undertook joint p with other agencies including Department for Planning and Infrastructure, Australian Customs Service an Police Service.
The Fisheries Volunteer (FVs) program conti play a vital role in educating fishers about fishing ru ch care and fishing techniques, as well as in other education and research activities. Volunteers in the bioregion beach patrols, school talks, fishing worksho ttended various boat shows and festivals.
FVs together with FMOs attended the Mandu rab Fest and Boat Show respectively, to provide advice rfishing regulations to the large number of bo nthusiasts and recreational fishers attending these very popu events.
ves in 2009/10
Drawing on an improved intelligence capaci ber of targeted rock lobster compliance operations ned for the 2009/10 rock lobster season, with a focus onand gear related offences. Additional Fisherie Marine
their
During 2008/09, Fisheries and Marine Officers delivered a total of 14807 hours of compliance and community educationservices in the field (West Coast Bioregion Compliance Table 1. A major componWest Coast Rock Lobster Managed Fishery. A continuinemphasis was placed on employing risk- and intelligence-based approaches to compliance planning and prioritization.
he 12-metre patrol vessel “PV Waterman” was a welcome
issued. Infringement warnings decreased from 244 to 193.
Considerabl
Tapuat sea compliance activity including gear and enchecks in the West Coast Rock Lobster fishery, West Coast Demersal Scalefish fishery, marine safety compliance, Marmion Marine Park com
officers undertake joint patrols with FMOs thereby inc
art of the whole of government approach to the hark hazard program.
ompliance planning for the West Coast Rock Lobster anaged Fishery focused on the outcomes of the C
ssment process. Routine compliance oprgeted a number of signif
ing with other
argeted operations wersh sales, failing
ck me each day.
ithin the West Coast Rock Lobster Managed Fis
ccasion, with an average of 6e fishery (West Coast Co
umber of 17 baskets pef total catch ins
with apprompared to 2.0 – 2.5% in 2007/08). The observed per-
Initiatinimal non-compliance rate for the catch was lowerevious season with an estimated range of 0.0007his range has been used t
illegal rock lobster wer
In addition to the rock lobster fishery, FMO’s focused activity on ensuring high levels of compliance in other officers will be used on board Patrol Vessels to increase
commercial fisheries such as the abalone, demersal scalefish etline), crab, shark, scallop, pilchard and estuarine eries.
erall, compliance in the west coast bioregion commercial eries was similar to previous years, although ther
efficiency.
The Department will continue to improve its at sea patrol capability with the construction of a new 22m Patrol Vesselbased in Geraldton and planned to replace the PV McLaughlan. The new vessel should be launched during
concerning increase in the number of prosecutions from 35 to 73. The number of infringements increased slightly from the
vious year, with a total of 90 infringement notices being
2010.
recreational fisheries within the bioregion, with FMOs achieving 29,201 field contacts with recreational fishermajority of the compliance effort focused on rock lobster, abalone, marin
Of concern was a substantial rise in the amount of illegcrabbing occurring in the Peel-Harvey Estuary. A strong compliance presence in response was responsible for a substantial increase in the number of prosecutions for illegcrabbing, which served to increase the number of prosecutions in the recreational sector from 93 in 2007/08 222 in 2008/09. A total of 662 infringement warnings and 442 infringement notices were instigated for less serious recreational offences during 2008/09.
The Department continues to work collaboratively with the
h towards marine park
ty.
atrols
d WA
nued toles, cat
conductedps, and a
rah Cegarding
ating elar
ty, a numare plan
over potting s and
96 DEPARTMENT OF FISHERIES

WEST COAST BIOREGION
STATE OF THE FISHERIES AND AQUATIC RESOURCES REPORT 2009/10 97
ea based compliance capability will be improved in the etropolitan Region with two new 8.5 metres vessels: PV 5
boat fishing li additional recrea eployed around the starecreational fishing compliance and education activities.
Ensuring that on hers are taking fish for a commercial Interim Managed Fisher y throughout the
Compliance arefine compliaoutcomes througprocesses. Gre
utilising risk analysis can result in deploying resources more efficiently.
The Volunteer program will focus on a Marine Education
Marine Park.
In the Metropolitan area, MarineDiscoveryWest staff continue their focus on school-based incursions working on sustainability and education th veloped as part of the state-wide education strategic plan. They have delivered information and education activit at major events such as the Mandurah Boat Show andMarine Discovery Ce le as the hub for education programs in the M olitan area, catering to students from kindergarten through to tertiary levels, school and environmental educators an roader community.
WEST COAS
west coast bioregion during the
SMbased from Rockingham and PV26 based from Lancelin.
Following the planned implementation of new recreational fishing rules and the introduction of a statewide recreational
Program for the South Coast that will incorporate the management initiatives for the Walpole – Nornalup inlets
cense, planning will take place for eighttional mobile patrol units to be d
te. These patrols will be dedicated to
ly licensed wetline fispurpose in the West Coast Demersal Scalefish
y will be a compliance priorit bioregion.
nd management personnel will continue to nce planning to deliver greater efficiencies and
h the use of risk assessments and intelligence ater capacity to target specific offence types
emes de
ies Crab Fest. The Naturaliste
ntre continues to play its roetrop
d the b
T COMPLIANCE TABLE 1 Summary of compliance and educative contacts and detected offences within the2008/09 financial year.
PATROL HOURS DELIVERED TO THE BIOREGION 14,807 Officer Hours
CONTACT WITH THE COMMERCIAL FISHING COMMUNITY*
Field Contacts by Fisheries & Marine Officers 305
District Office contacts 1406
Infringement warnings 193
Infringement notices 90
Prosecutions 73
CONTACT WITH THE RECREATIONAL FISHING COMMUNITY
F 29,201 ield Contacts by Fisheries & Marine Officers
District Office contacts 13,767
Infringement warnings 662
Infringement notices 442
Prosecutions 222
OTHER FISHING-RELATED CONTACTS WITH THE COMMUNITY**
Field Contacts by Fisheries & Marine Officers 4,898
District Office contacts 7,956
Fishwatch reports** 607
*Commercial West Coast Rock Lobster contacts are excluded from these totals and detailed in West Coast Compliance Table 2.
Contacts are classified according to the specific fishery, which is usually clearly delineated as being either commercial or recreational. The “Other” category is used where multiple fisheries are contacted and it is not possible to accurately classify the contacts into one specific fishery – typically, the majority of these contacts are recreational in nature (e.g. personal contacts in Marine Parks), but contacts made in relation to fish kills, shark patrols and inspections of commercial fish wholesale and retail premises etc. are also included in this category. This table includes contacts made by PV’s Hamelin and McLaughlan. Contacts made by PV Walcott are included in North Coast Compliance Table 1.
* watch reports, both commercial and recreational, since the service provider reporting outhern inland bioregion that wererien, Dongara and Geraldton Distr f.
**
**This represents the total number of Fishmechanism cannot differentiate between sectors. It also includes any calls relating to the sreferred to Busselton, Bunbury, Mandurah, Rockingham, Fremantle, Hillary’s, Lancelin, Ju
ict staf
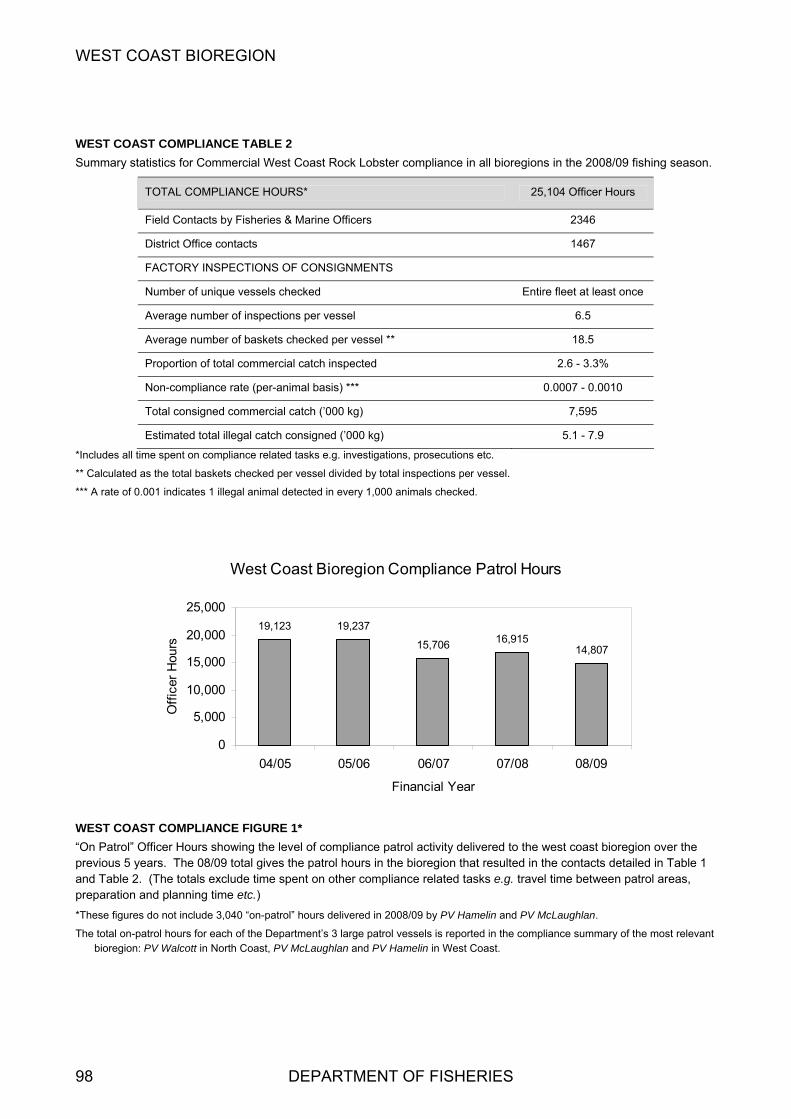
WEST COAST BIOREGION
W ANCE TABLE 2
S ance in all bioregions in the 2008/09 fishing s .
EST COAST COMPLI
ummary statistics for Commercial West Coast Rock Lobster compli eason
TOTAL COMPLIANCE HOURS* 25,104 Officer Hours
Field Contacts by Fisheries & Marine Officers 2346
District Office contacts 1467
FACTORY INSPECTIONS OF CONSIGNMENTS
Number of unique vessels checked Entire fleet at least once
Average number of inspections per vessel 6.5
Average number of baskets checked per vessel ** 18.5
Proportion of total commercial catch inspected 2.6 - 3.3%
Non-compliance rate (per-animal basis) *** 0.0007 - 0.0010
Total consigned commercial catch (’000 kg) 7,595
Estimated total illegal catch consigned (’000 kg) 5.1 - 7.9
*Includes all time spent on compliance related tasks e.g. investigations, prosecutions etc.
** Calculated as the total baskets checked per vessel divided by total inspections per vessel.
*** A rate of 0.001 indicates 1 illegal animal detected in every 1,000 animals checked.
West Coast Bioregion Compliance Patrol Hours
19,123 19,237
15,706 16,91514,807
0
5,000
10,000
15,000
20,000
25,000
04/05 05/06 06/07 07/08 08/09
Financial Year
Off
icer
Hou
rs
WEST COAST COMPLIANCE FIGURE 1* “On Patrol” Officer Hours showing the level of compliance patrol activity delivered to the west coast bioregion over the previous 5 years. The 08/09 total gives the patrol hours in the bioregion that resulted in the contacts detailed in Table 1 and Table 2. (The totals exclude time spent on other compliance related tasks e.g. travel time between patrol areas, preparation and planning time etc.)
*These figures do not include 3,040 “on-patrol” hours delivered in 2008/09 by PV Hamelin and PV McLaughlan.
The total on-patrol hours for each of the Department’s 3 large patrol vessels is reported in the compliance summary of the most relevant bioregion: PV Walcott in North Coast, PV McLaughlan and PV Hamelin in West Coast.
98 DEPARTMENT OF FISHERIES

GASCOYNE COAST BIOREGION ABOUT THE BIOREGION SUMMARY OF FISHING AND AQUAC
100 ACTIVITIES 100
101T
ULTURE
AGEMEN 103
ATION
ECOSYSTEM MANAGEMENT ECOSYSTEM BASED FISHERIES MANFISHERIES AQUACULTURE COMPLIANCE AND COMMUNITY EDUC
107142
143
STATE OF THE FISHERIES AND AQUATIC RESOURCES REPORT 2009/10 99
GASCOYNE COAST BIOREGION
100 DEPARTMENT OF FISHERIES
BIOREGION
IOREGION
yne Coast bioregion
,
,
e f
e
ntinental shelf where, coupled with low
Bay er
usual for its extreme
n
l reef species, and also indicates ect to the second lowest level of environmental
reat of the 18 areas that were investigated.
he Ningaloo reef in the north of the region is the largest ontinuous reef in WA and is one the most significant inging reefs in Australia. The bioregion also has extensive
f mangroves, mostly in Exmouth Gulf while extensive seagrass beds are located in a number of areas.
SUMMARY OF FISHING AND AQUACULTURE ACTIVITIES
Commercial fishing is a very significant industry in the region, with 3 of the State’s more valuable fisheries – the Shark Bay Prawn, Exmouth Gulf Prawn and Shark Bay Scallop Fisheries – landing combined catches valued in the range of $40 – $50 million annually. These fisheries have operated sustainably in the region since the mid-1960s and are internationally recognised as ‘best practice’ in terms of both management and research.
The Gascoyne Coast bioregion has also supported since the 1960s an offshore snapper fishery and the Denham-based beach seine fishery, which respectively provide most of the pink snapper and whiting catch for the state. The fishery for blue swimmer crabs, based primarily in Carnarvon but operating throughout the waters of Shark Bay, is currently the largest Western Australian fishery for this important species. The snapper fishery has been evolving into a broader fishing sector taking demersal species including emperors, cods and deeper water species such as goldband snapper (jobfish). Formal management arrangements for the mackerel fishery were introduced in 2004.
he special features of the Gascoyne coast, coupled with the
yment and shallow-water boat angling (e.g. Shark Bay, Exmouth Gulf and Ningaloo lagoons), and offshore boat angling for demersal and larger pelagic species (e.g. off Ningaloo).
Recreational fishing is predom ntly for tropical species such as emperors, lutjanid snappers, groupers, mackerels, trevallies and other game fish. Some temperate species at the northern end of their ranges, such as pink snapper, tailor and whiting, provide significant catches, particularly in Shark Bay.
In addition, the Gascoyne Coast bioregion supports extensive scuba diving and snorkelling activities, particularly inside the coral lagoons of the Ningaloo reef system. Specialised ‘eco-tourism’ activities include whale shark and manta ray observation at Ningaloo and dolphin and dugong viewing in Shark Bay.
Aquaculture development in the Gascoyne is largely restricted to the production of pearls and pearl oysters in the major embayments. Hatchery production of oysters is of critical importance in this region, driven by the irregular and therefore unreliable recruitment of both large species of pearl oysters in the wild. Hatcheries in Carnarvon and Exmouth supply significant quantities of Pinctada maxima spat to pearl farms in Exmouth Gulf and the Montebello Islands, while several hatcheries supply juveniles of the blacklip pearl
GASCOYNE COAST
ABOUT THE B
he marine environment of the GascoTrepresents a transition between the fully tropical waters of theNorth West Shelf and the temperate waters of the west coast.Offshore ocean temperatures range from about 22°C to 28°Cwhile the inner areas of Shark Bay regularly fall to 15°C in winter. The major fish stocks are generally tropical in naturewith the exceptions of the temperate species, pink snapper, whiting and tailor, which are at the northern end of their range off Shark Bay.
The coastline is characterised by high cliffs in the southern half changing to fringing coral reefs in the north. Coastal waters are generally high-energy in terms of wave action duto the strong trade wind system. The Exmouth Gulf section othe Gascoyne Coast bioregion is seasonally influenced by extreme tropical summer cyclones, while the Shark Bay endof the bioregion receives very infrequent cyclones, but is affected at times by river outflows from inland cyclone-based summer rainfall. The limited local rainfall comes mostly fromthe northern edge of winter storm fronts.
The waters off the Gascoyne coast are also strongly influenced by the unusual southward-flowing Leeuwin Current, generated by flow from the Pacific through thIndonesian archipelago. This tropical current becomes evident in the North West Cape area and flows along the edgeof the narrow corainfall and run-off plus the north flowing Ningaloo current creates the highly diverse Ningaloo Reef system and fish fauna associated with the latter.
The outer area of the large marine embayment of Sharkis also influenced by the warm winter current. The innwaters of the embayment are hypersaline, owing to the highevaporation and low rainfall of the adjacent desert areas. TheWorld Heritage-listed Shark Bay is unhypersalinity at the bay heads, the extensive Wooramel seagrass bank, and associated banks and channels. The sea floor of both Shark Bay and the continental shelf is typically sandy compared to Exmouth Gulf, which has more mud areas and greater turbidity.
The Gascoyne region has been identified as one of the 18 world ‘hotspots’ in terms of tropical reef endemism and the threats facing them. The article ranks this region of WesterAustralia as the second most diverse marine environment inthe world in terms of tropicathat it is subjth
Tcfrareas o
Twarm, dry winter climate and accessible fish stocks, have made it a focal point for winter recreation by the Western Australian community. Fishing is a key component of many tourist visits. A full range of angling activities is available, including beach and cliff fishing (e.g. Steep Point and Quobba), emba
ina

GASCOYNE COAST BIOREGION
oyster Pinctada margaritifera to the bioregion’s developing lack pearl farms.
ANAGEMENT
xtensive trawl closures inside the 200m depth zone in the hark Bay and Exmouth region provide protection to
rotected area with an IUCN category of IV (as per Dudley, 20081; Gascoyne Ecosystem Management Table 1). The e issuch 0% of not trawled (Gascoyne Ecosystem Management Table 1).
In awl based, benthic management rotection, specific commercial fishing regulations
plemented in the 1970s and 1980s preclude the use of rge-mesh gillnets and long-lines throughout the region, to revent the incidental entanglement of dugongs and turtles
abit the region. These controls have also provided rotection for the large shark species which are a feature of is region. More recently, bycatch reduction devices grids’) installed in trawl nets have increased the protection
ays and the occasional turtle encountered on the
e Conservation and Land Management Act 1984 and the coyne e the
rotection Areas.
n to
P)
d
b
ECOSYSTEM M
ESsensitive benthic habitat, including coral reef, sand flats and seagrass beds of the continental shelf. These areas provide significant fish nursery, breeding and feeding habitat (Gascoyne Coast Habitat Protection Figure 1). The extent of these areas means that 35% of the entire shelf region (< 200 m) of the Gascoyne Bioregion could be classified as a marine p
ffective area that that over 9
not trawled is, however, much greater the waters less than 200 m depth are
addition to the tr habitat pimlapwhich inhpth(‘for sharks, r
S
Map sho g areas permanently closed to trawling in gion. The areas permanently
ted area cate
trawl grounds.
There are also a number of other 'formal' marine protected areas in this bioregion that have been established under both
GA COYNE ECOSYSTEM MANAGEMENT FIGURE 1
winthe Gascoyne Coast bioreclosed are consistent with IUCN marine protec
gory IV. thFish Resources Management Act 1994 (see GasEcosystem Management Figure 2). These includNingaloo and Shark Bay marine parks, the Muiron Islands Marine Management Area, and the Quobba and Miaboolya Beach Fish Habitat P
The Australian Government Department of Environment, Water Heritage and the Arts (DEWHA) is also undertaking aprocess of identifying additional protected areas for Commonwealth waters between Shark Bay and the NortherTerritory border. The DEWHA plan was originally complete a draft North West Marine Bioregional Plan (MBin late 2009, but it is currently unclear when this will now be released. The Draft Plan is expected to include proposemarine protected areas, and will be released for a 3 month public consultation period.
1 Dudley, N. (editor) (2008) Guidelines for applying protected
area management categories. IUCN, Gland, Switzerland.
STATE OF THE FISHERIES AND AQUATIC RESOURCES REPORT 2009/10 101

GASCOYNE COAST BIOREGION
he Gascoyne Coast
GASCOYNE ECOSYSTEM MANAGEMENT FIGURE 2
Map showing current and proposed marine parks and F
HPAs in t
ASCOYNE ECOSYSTEM MANAGEMENT TABLE 1
0 m depth) where
G
The areas and proportions of the Gascoyne Bioregion making up continental shelf waters (< 20habitats are protected from the physical disturbance of trawl fishing. The areas which are formally closed to trawling would be equivalent to meet the IUCN criteria for classification as marine protected areas as category IV. The area of habitat effectively protected refers to the total area of the shelf (< 200 m) where trawling doesn’t occur.
Total Area of Shelf
Area of shelf equivalent to IUCN marine Maximum area of actual Total area of habitat effectively protected area <= category IV (%) trawling activity protected from direct damage (%)
15800 sq nm 5600 sq nm
(35%) 1100 sq nm
14700 sq nm (93%)
102 DEPARTMENT OF FISHERIES

GASCOYNE COAST BIOREGION
ECOSYSTEM BASED FISHERIES MANAGE
I cation of Ecological Assets/Resource hframework
tegr ine and l RegiAustralia scheme ion has been divi
eso-scale regions: Zuytdorp, Shark Bay, Ning xmouth Gulf (IMCRA, V 4.0, 2006). This sub-regional
been adopted by the De rough the implementation stem Bas s Man M) fram (Fletcher, et a How to Use section for more details.
In terms of ecologica ource mutilises the followin the swithin the Gascoyne Bioregion:
Ecosystem structure and biodiversity (on a meso-scale basis);
Benthic habitats; and
different suites of exploited fish and invertebrates across the continental shelf.
These sub-components are defined by depth contours (Nearsh ffshore >250m). The full set r ongoing monitoring
.
MENT Captured fish species
Protected species (direct impact – capture or interaction);
dentifis using t e EBFM
External impacts.
onalisation for ded into 4
aloo, and
For some assets a finer level of division of the IMCRA ecosystems is used by the Department. This incorporates the recent management initiatives to recognise that there are
Under the In ated Mar, the bioreg
Coasta
mEscale of management has now
partment thed Fisheriel., 2010) see
of an Ecosyagement (EBF ework
l assets (= res s), the Depart IMCRA region
ent
are presented in Gascoyne Ecosystem Management Figure 3
g categories for
ore 0-20m; Inshore 20-250m; Oof ecological assets identified fo
Exmouth Gulf
Ningaloo
Zuytdorp
Shark Bay
Ecosystems
Exmouth Gulf
Ningaloo
Zuytdorp
Shark Bay
Habitats
NearshoreInshore DemersalOffshore DemersalShark Bay DemersalsPelagic
Finfish
Prawns and ScallopsCrabsPearl Oysters
Invertebrates
Captured Species
Fish
Turtles/SeasnakesMammals
Non 'Fish'
Protected Species
Golo
ascoyne Bioregiongical Resources/AssetsEc
RE 3 GASCOYNE ECOSYSTEM MANAGEMENT FIGU
Component tree showing the ecological assets ide
Risk Assess Ecological Assets
The EBFM process identifies the ecological assets in a h uch that the assets outlined GascoyEcosystem Management Figure 3 are often made up of individual components at the species or In some cases astock level. The risks to each of the individual 'stocks' olower level compone detailed in the indivifishery reports present maind nthe document. The following table (Gascoyne Ecosyste
nt
.
ntified and separately assessed for the Gascoyne Bioregion.
ne
Management Table 2) provides an overview and cumulative assessment of the current risks to the ecological assets of the Gascoyne Bioregion, at a bioregional level and provides a mechanism for reporting on their status and the fisheriesmanagement arrangements that are being applied.
These bioregional level risks are now used by the Departme
ment of
ierarchical manner s
t the r dual of m
as a key input into the Department’s Risk Register which, combined with an assessment of the economic and social values and risks associated with these assets, is integral foruse in the annual planning cycle for assigning priorities for activities across all Divisions in this Bioregion
nts are mostlyed in the re er of this sectio
STATE OF THE FISHERIES AND AQUATIC RESOURCES REPORT 2009/10 103
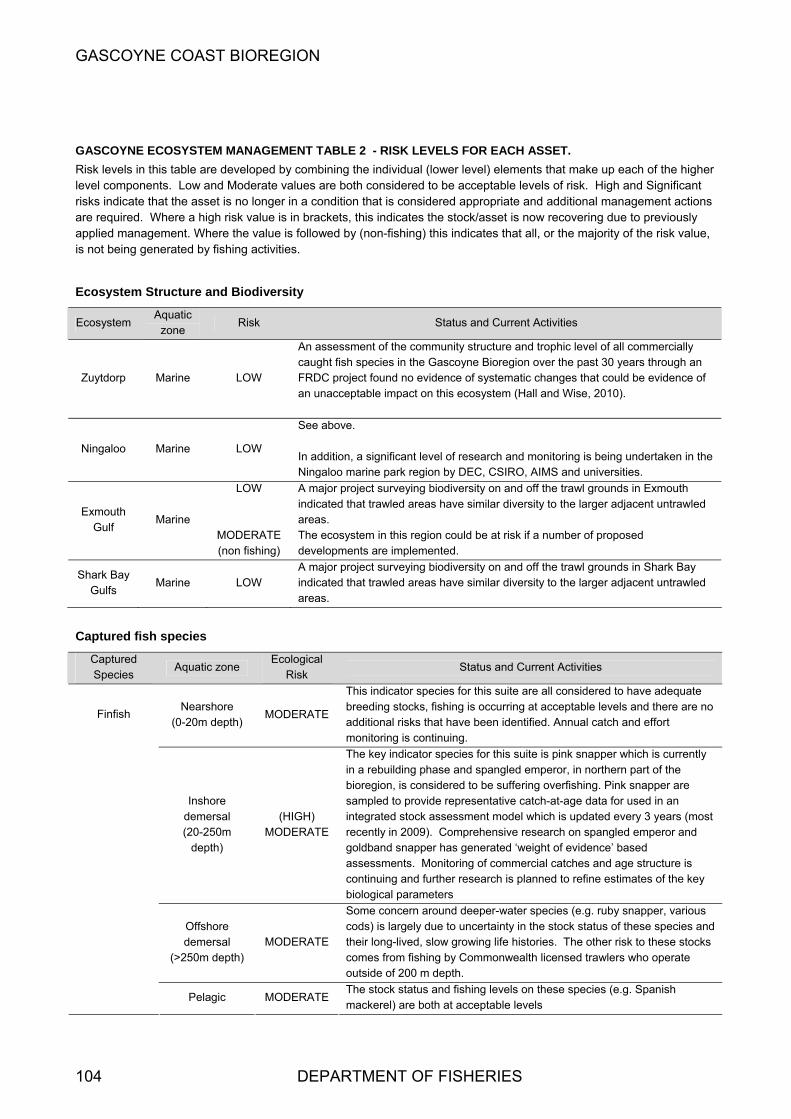
GASCOYNE COAST BIOREGION
GASCOYNE ECOSYSTEM MANAGE ABLE 2 - RISK LEVELS FOR E
Risk levels in this t op n omponents. Low and Moderat
sks indicate that the asset is no longer in a condition that is considered appropriate and additional management actions high risk value is in brackets, this indicates the stock/asset is now recovering due to previously
ap gement. Where the value is followed by (non-fishing) this indicates that all, or the majority of the risk value, is n generate ng activiti
Ecosystem Structure and Biodiversity
MENT T
ed by combinie values are bot
ACH ASSET.
g the individual (lower level) elements that make up each of the higherh considered to be acceptable levels of risk. High and Significant
able are devellevel criare required. Where a
plied manaot being d by fishi es.
Ecosystem Aquatic
zone Risk Status and Current Activities
Zuytdorp Marine LOW
An assescaught fis 0 years through an
prc act on this ecosystem (Hall and Wise, 2010).
sment of the community structure and trophic level of all commercially h species in the Gascoyne Bioregion over the past 3
FRDC an unac
oject found no evidence of systematic changes that could be evidence of eptable imp
Ningaloo Marine LOW
abov In addition, a significant level of research and monitoring is being undertaken in the Ningaloo marine park region by DEC, CSIRO, AIMS and universities.
See e.
ExGulf
Marine
LOW
MODERATE (non fishing)
A major project surveying biodiversity on and off the trawl grounds in Exmouth indicated that trawled areas ha r adjacent untrawled areas. The ecdevelo
ve similar diversity to the largemouth
osystem in this region could be at risk if a number of proposed pments are implemented.
Shark Bay Gulfs
Marine LOW ajo
icateareas.
A mind
r project surveying biodiversity on and off the trawl grounds in Shark Bay d that trawled areas have similar diversity to the larger adjacent untrawled
Captured fish sp ecies
Captured S pecies
Aquatic zone Ecological
Status and Current Activities Risk
Nearshore (0-20m depth)
RATE MODE
This indicator species for this suite are all considered to have adequate breeding stocks, fishing is occurring at acceptable levels and there are no additional risks that have been identified. Annual catch and effort monitoring is continuing.
Finfish
Inshore demersal (20-25
depth)
(HIGH) MODERATE
snapper which is currently in a rebuilding phase and spangled emperor, in northern part of the bioregion, is considered to be suffering overfishing. Pink snapper are sampled to provide representative catch-at-age data for used in an integrated stock assessment model which is updated every 3 years (most recently in 2009). Comprehensive research on spangled emperor and goldband snappe sed
arch is planned to refine estimates of the key biological parameters
The key indicator species for this suite is pink
0m r has generated ‘weight of evidence’ ba
assessments. Monitoring of commercial catches and age structure is continuing and further rese
Offshordeme
(>2MO
w growing life histories. The other risk to these stocks comes from fishing by Commonwealth licensed trawlers who operate outside of 200 m depth.
DERATE
Some concern around deeper-water species (e.g. ruby snapper, variouscods) is largely due to uncertainty in the stock status of these species and their long-lived, slo
e rsal
50m depth)
Pelagic MODERATE The stock status and fishing levels on these species (e.g. Spanish mackerel) are both at acceptable levels
104 DEPARTMENT OF FISHERIES
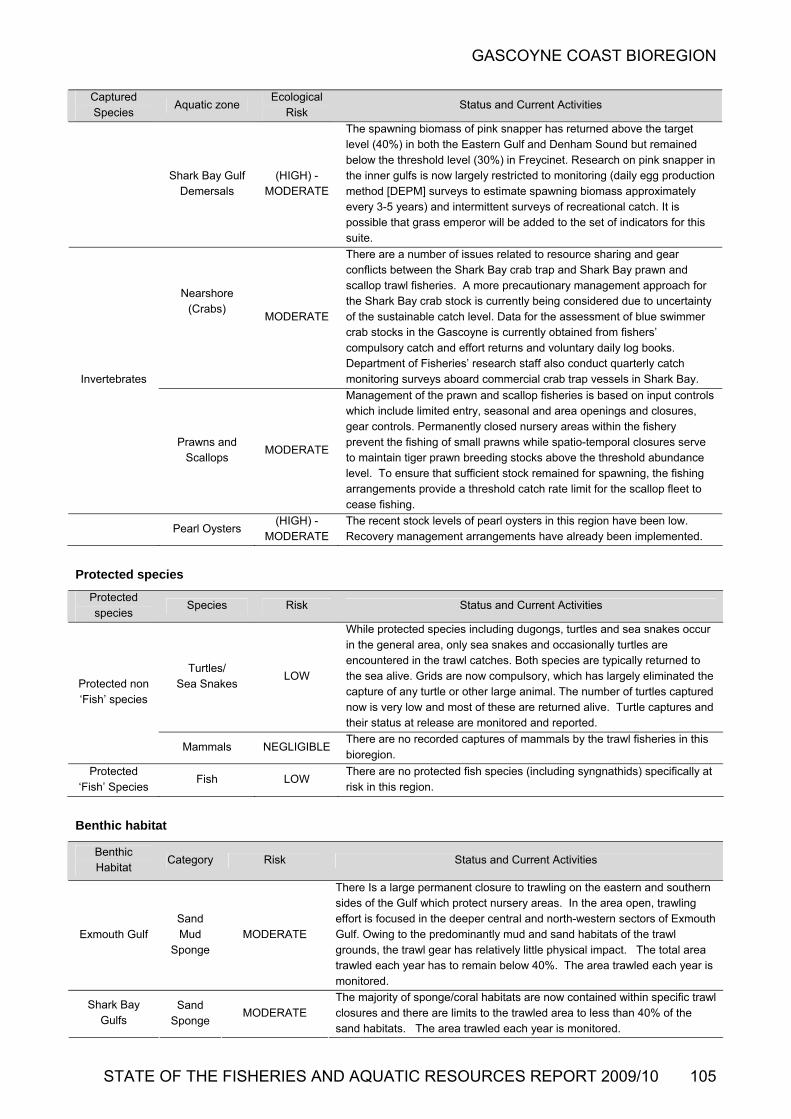
GASCOYNE COAST BIOREGION
Captured Species
Ecological Aquatic zone Status and Current Activities
Risk
Shark Bay Gulf (HIGH) -
levbelow the inn
Demersals MODERATE method [DEevery 3-5 possisuite.
The spawningel (40%) in
the thre er gulfs
PMyear
ble that g
biomass of pink snapper has returned above the target both the Eastern Gulf and Denham Sound but remained shold level (30%) in Freycinet. Research on pink snapper in is now largely restricted to monitoring (daily egg production ] surveys to estimate spawning biomass approximately
s) and intermittent surveys of recreational catch. It is rass emperor will be added to the set of indicators for this
Nearshore (Crabs)
MODERATE
ere are a nu and gear icts between the Shark Bay crab trap and Shark Bay prawn and op trawl fisheries. A more precautionary management approach for
the Shark Bay crab stock is currently being considered due to uncertainty of the sustainable catch level. Data for the assessment of blue swimmer crab stocks in the Gascoyne is currently obtained from fishers’ compulsory catch and effort returns and voluntary daily log books. Department of Fisheries’ research staff also conduct quarterly catch monitoring surveys aboard commercial crab trap vessels in Shark Bay.
Thconflscall
mber of issues related to resource sharing
Invertebrates
Prawns and Scallops
MODERATE
Management of the prawn and scallop fisheries is based on input controls which include limited entry, seasonal and area openings and closures, gear controls. Permanently closed nursery areas within the fishery prevent the fishing of small prawns while spatio-temporal closures serve to maintain tiger prawn breeding stocks above the threshold abundance level. To ensure that sufficient stock remained for spawning, the fishing arrangements provide a threshold catch rate limit for the scallop fleet to cease fishing.
Pearl Oysters (HIGH) -
MODERATE The recent stock levels of pearl oysters in this region have been low. Recovery management arrangements have already been implemented.
Protected species
Protected Species Risk Status and Current Activities
species
Turtles/ Sea Snakes
LOW the sea alive. Grids are now compulsory, which has largely elicapture of any turtle or other large animal. The number of turtl
While protected species including dugongs, turtles and sea snakes occur in the general area, only sea snakes and occasionally turtles are encountered in the trawl catches. Both species are typically returned to
minated the es captured
now is very low and most of these are returned alive. Turtle captures and their status at release are monitored and reported.
Protected non ‘Fish’ species
Mammals NEGLIGIBLE There are no recorded captures of mammals by the trawl fisheries in this bioregion.
Protected ‘
h LOW There are no protected fish species (including syngnathids) specifically at risk in thi on. Fish’ Species
Fiss regi
Benthic habitat
Benthic bitat
Category Risk Status and Current Activities Ha
Sand Mud MODERATE
large sides of the Gulf which protect nursery areas. In the area open, trawling effort is focused in the deeper centraGulf. Owing to the
he trawl gear has relatively little physical impact. The total area ch year has to remain below 40%. The area trawled each year is
There Is a permanent closure to trawling on the eastern and southern
l and north-western sectors of Exmouth predominantly mud and sand habitats of the trawl Exmouth Gulf
Sponge grounds, ttrawled eamonitored.
Shark Bay Gulfs
Sand Sponge
MODERATE The majority of sponge/coral habitats are now contained within specific trawl closures and there are limits to the trawled area to less than 40% of the sand habitats. The area trawled each year is monitored.
STATE OF THE FISHERIES AND AQUATIC RESOURCES REPORT 2009/10 105

GASCOYNE COAST BIOREGION
Benthic Habitat
Category Risk Status and Current Activities
Seagrass NEGLIGIBLE Thall
ere are exten inshore seagr
sive, permanent closures in the Shark Bay fishery coveringass areas.
Ningaloo Sand Coral
LOW There are no tra risk is to coral habitat from tourism and
wl activities in these areas. The main other boating related activities.
Zuytdorp Sand Reef
NEGLIGIBLE There are few direct impacts to these habitats.
External Drivers
External Drivers Risk Status and Current Activities
Introduced Pests This issue is not as high ainternational and interstate
risk as in some other WA bioregions due to lower level of shipping. and Diseases
LOW
MODERATE in short term Bein
Climate HIGH
affected bare
g a transitional regiony climate change
now underway or planin medium term
, the biota in this bioregion are at enhanced risk of being . Projects to examine potential impacts on this bioregion
ned
ssessment of Ecosystem Assets
s into the various assets outlined above. It is
xpected that the community structure analyses completed as Wise will become a
ill be repeated
neral
nt s).
species within each ry.
e
regular part of the monitoring of this bioregion. It is also expected that the biodiversity trawl surveys wSummary of Monitoring and
A at regular intervals.
The Ranked Risk Assessment of Multiple Fisheries (RRAMF) was tested for the Gascoyne Coast Bioregion ofWestern Australia using fishery-independent data for geteleost and elasmobranch bycatch; and fishery-dependedata for threatened, endangered and protected species (TEPThis method allows ranking of bycatch
The Department is a contributor and supporter of the extensive ecological research and monitoring that is underway in the Ningaloo Marine Park, much of this was funded by WAMSI Node 3 (see www.WAMSI.org.au for full details).
Each of the fisheries is undertaking monitoring that feedthe assessment of
fishery and the accumulation of the ranks across multiplefisheries by incorporating the relative impact of each fisheThe analyses are in the final stages of completion and will bwritten up as a Fisheries Research Report. e
part of the FRDC project by Hall and
106 DEPARTMENT OF FISHERIES

GASCOYNE COAST BIOREGION
FISHERIES Shark Bay Prawn and ScallopReport E. Sporer, M. Kangas and S. Brown
Management input from R. Gould
Managed Fisheries Status
Main Features
Status
Stock level
Prawn Acceptabl
Scallop Acc
e
eptable
table
ing Prawns 927 t
300 t
<1t
Fishing level –
Prawn Accep
Scallop Acceptable
Current Landings
K
Tiger Prawns
Endeavour Prawns
Scallops 3391 t
Fishery Description
The Shark Bay Prawn Managed Fishery is the highest producing Western Australian fishery for prawns. It targets the western king prawn (Penaeus latisulcatus) and brown tiger prawn (Penaeus esculentus) and takes a variety of smaller prawn species including endeavour prawns (Metapenaeus spp.) and coral prawns (various species).
The Shark Bay Scallop Managed Fishery catches the saucerscallop (Amusium balloti), and is usually WA’s most productive scallop fisher
y. These two managed fisheries are
icence
ommonwealth Government Environment Protection and on Act 1999 (Export Exemption)
ian Ocean between latitudes 23°34´ S and 26°30´ S
e
of is
rdised net
and y bycatch reduction
h escape devices) are fitted to nets of prawn boats.
200 m isobath, together with those waters of Shark Bay southof 26°30´ south latitude (Shark Bay Prawn and Scallop Figures 1 & 2).
Management arrangements
Management of the prawn and scallop fisheries is based on input controls which include limited entry, seasonal and area openings and closures, gear controls and limits on crew numbers. The prawn fishery also has moon closures. These management arrangements are designed to keep effort at levels that will maintain sufficient spawning stock levelsall target species and achieve optimal yields. Managementalso aimed at catching prawns and scallops at the best size and condition for the market, thereby maximising the economic return while maintaining breeding stock levels. Fishing is undertaken by both fleets using otter trawls, with ‘bison’ otter boards (under exemption) and standard flat wooden otter boards.
Both fleets (prawn and scallop boats) have standaheadrope allocation whereby each boat has an equal allocation of net headrope for each fishery. For the prawn fishery, boats are authorised to operate with two eight fathomnets (29.27 metres) and boat units no greater than 375. The prawn fleet is operating under an exemption from both the net size and the 375 hull unit rule to provide for trawl gearamalgamation and improved economics. The total net headrope capacity for the prawn fleet is 432 fathoms (790 metres). The total headrope net capacity for the scallop fishery A class fleet is 196 fathoms (358.4 metres). The A class boats are permitted to take scallops by a maximum oftwo seven fathom nets (25.6 metres).
Bycatch reduction devices (‘grids’) are fitted to all prawn scallop trawl nets. In addition, secondar
limited entry and both use low opening, otter trawls as the fishing method.
Both A class boats and B class boats are permitted to fish for scallops, but only B class boats can fish for prawns.
Governing legislation/fishing authority
Shark Bay Prawn Management Plan 1993
Shark Bay Prawn Managed Fishery Licence
Shark Bay Scallop Management Plan 1994
Shark Bay Scallop Managed Fishery L
CBiodiversity Conservati
Consultation process
Regular formal and in-season meetings between the Department of Fisheries and industry.
Boundaries
The boundaries of the Shark Bay Prawn Managed Fishery and the Shark Bay Scallop managed Fishery are the waters ofthe Ind devices (fis
Scallop boats have larger 100mm mesh resulting in only a and adjacent to Western Australia on the landward side of th
STATE OF THE FISHERIES AND AQUATIC RESOURCES REPORT 2009/10 107

GASCOYNE COAST BIOREGION
small amount of bycatch being taken during trawl operations and therefore do not require the secondary devices.
The Australian Government Department of Environment, Water, Heritage and the Arts has assessed the fisheries under the provisions of the Environment Protection and Biodiversity Conservation Act 1999 and has accredited the fisheries for a period of five years (re-assessment in 2013), allowing product from the fisheries to be exported from Australia. The comprehensive Ecological Sustainable Development assessment of these fisheries has also identified potential sustainability risks requiring direct management
ues requiring direct management identified
rtment of Fisheries’ Research Division carries out ice
tes.
ontrol spatial and temporal fishing effort. The vessel onitor the activity of all ry.
th licensees. This matter was covered in the
ing season allows the harvesting of
ed eas within the fishery prevent the fishing of small
ide habitat preservation, while spatio-mporal closures serve to maintain tiger prawn breeding
ithin the main fishing period, there are various subsidiary fish large size, quality and
protecting the stocks
ents.
nd the full moon and hence less catchable.
er providing a total of 176 nights fishing with
ing.
f t
s area in southern Denham n 19 March the A class scallop boats
shing p
eased on
on.
eys have proved to be valuable in are targeted at an optimal market
h levels onitor the threshold levels and catch shares. In addition,
annual research survey is carried out in November, which,
actions. The iss
For 2009, the prawn season opened on 16 March and closed on 13 Octob173 nights actually fished. Fishing from the 16 to 18 March inclusive was for prawns only in the more northern part of Shark Bay. Fishing during the season involved flexible fishing arrangements and voluntary rolling area openings, based on assessment of both king and tiger prawn size through fishery-independent surveys.
Scallops The scallop catch is taken by boats licensed to take only scallops (14 A class licences) and boats that also fish for prawns in the Shark Bay Prawn Managed Fishery (27 B classlicences).
The opening date of the scallop fishing season is a compromise between maintaining breeding stock levels (measured by a pre-season survey of stock abundance and commercial catch rates during the fishing season) and the seasonal decline in meat condition associated with spawn
An early opening has the aim of increasing the total weight oscallops caught by taking them at a time when the meat sizeis large prior to spawning. However, to ensure that sufficienstock remained for spawning, the fishing arrangementsprovided a threshold catch rate limit for the scallop fleet to cease fishing.
The 2009 scallop season officially opened on 15 March with fishing beginning in the Lead
through this process were the breeding stock levels of the targeted prawn and scallop species, bycatch species impacts,protected species interactions (including loggerhead turtles), habitat effects and provisioning effects. Boxed text in this status report provides the annual assessment of performance measures/indicators for each of these issues.
The Depadaily monitoring of the scallop fleet catch to provide advon when to close areas based on the threshold catch raThis is a major element of the management strategy to cmonitoring system continues to mlicensed Fishing Boats in this fishe
The most equitable and economically efficient means to manage sharing of the available scallop catch between Aclass and B class licensees in the Scallop Managed Fishery and managing the associated competition for the scallop catch has been an ongoing unresolved and contentious management issue and the subject of extensive and ongoingconsultation wi
Sound of Shark Bay. Omoved into the northern part of Shark Bay to continue fiscallops together with the B class boats. The A class scalloboats moved to Denham Sound on 2 April and remained there until 20 April, then returning to northern Shark Bay to continue fishing scallops. A and B class scallop boats cfishing on 7 May, which was the commencement of the moclosure for the B class boats and when the threshold catch rate was reached. The B class scallop boats continued to retain scallops from August after the key spawning perioduntil the close of the fishing seas
recently published Fisheries Management Paper 235 Shark Bay Prawn and Scallop Fisheries Review and publication of this paper is likely to renew focus on matters in 2010- 2011.
Prawns The yearly cycle of operation for the prawn fishery is dynamic as it depends on the strength and timing of recruitment therefore the opening and closing dates for the fishing seasons vary each year depending on environmental conditions, moon phase and the results of fishery independent surveys to estimate recruitment strength. The timing and spatial pattern of the fish
Research summary
Research activities continue to focus on stock assessment and annual monitoring of the target stocks, particularly tiger prawns and scallop stocks. All boats complete detailed daily log books, and these, together with pre-season recruitment surveys and in-season surveys of size composition and spawning stock, provide the information sources for monitoring the status of the stocks.
In-season prawn surv
the current season’s recruits and the large residual prawns not caught in the previous fishing season. Permanently closnursery arprawns and provtestocks above the threshold abundance level.
ensuring that the prawnssize. W
openings and closures designed tooptimise market value of prawns while Research for monitoring the status of the scallop stock in
Shark Bay also requires real-time monitoring of catcfrom recruitment over-fishing. Non-fishing periods occur to man
around the full moon, commonly known as moon closures. These moon closure periods are variable and can range from five to ten days and are set out in the season arrangemKing prawns are photosensitive, which makes them less
together with existing detailed biological knowledge, enables an annual catch forecast to be provided. These survey data are also used as the basis for the management arrangements in the following year.
A two-year FRDC project on research into prawn/scallop gear interactions, scallop and prawn larval movement
active arouIndustry has voluntarily extended these closures to increase economic efficiency by shifting fishing effort away from these times of reduced catch rate.
108 DEPARTMENT OF FISHERIES

GASCOYNE COAST BIOREGION
patterns in Shark Bay and potential effects of area closures scallop/prawn management commenced in March 2008 andue for completion in 2010.
Retained Species Commercial production (season
in d is
2009)
s
ht)
for
d.
ange
ort
8 n. However, the total landings for 2009 were
e l
further two years to be adjusted to reflect current fishing/targeting strategies.
Tiger prawn landings (300 t) were below the target catch range (400-700 tonnes) with the average catch over the last 15 years being 556 tonnes. For two consecutive years the tiger prawns have been below the target catch range. As with king prawns, effort was not focused as much on the tiger prawns as in past years. This due to increased scallop abundance and because scallops provide more value and cash flow in the first part of the year. However, the price for tiger prawns has declined and they no longer attract a premium price over king prawns. The expectation is that, with the reduced scallop catch prediction for 2010 and the focus of effort in the early part of the season on prawn, catch rates should improve for 2010 season.
Scallops The total scallop landings for this fishery, which includes the catch from both A and B class scallop boats, was 3391 t (whole weight) (Shark Bay Prawn and Scallop Figure 4). A class boats landed 2315 t (68%) and the B class boats landed 1076 t. The 2008 scallop survey provided a catch prediction of 3150 t of scallop (whole weight) for the entire Shark Bay scallop fishery. The scallop caught from Red Cliff and North West Peron areas from the scallop and prawn boats were 2381 t. This area provided the majority of scallop catch in Shark Bay for the 2009 season. The scallop landing from Denham Sound was 899 t. Denham Sound has provided
1 t of ortunus pelagicus), 1 t of coral crabs
ta), 21 t of squid, 22 t of cuttlefish, 15 t of ing), 2 t of bugs (Thenus orientalis) < 1 t each of
mus
d
r ad gear (4 x
of
ats
last low the adjusted effort of the mid 1990s of
lose to 60,000 hours.
he total effort recorded by the A class scallop boats in 2009 as 9,871 hours. The effort for both 2008 and 2009 is
Stock Assessment Assessment complete: Yes
Assessment method: Direct survey/catch rate
Breeding stock levels:
Prawns
King Adequate
Tigers Adequate
Scallops: Adequate
Prawns The catch per unit of effort for the fishery can be used as an indicator to monitor changes in stock levels from year-to-year. Spawning stock and recruitment indices are derived from survey data and tiger prawn spawning stock catch rate levels verified using logbook data. Conservative tiger prawn threshold catch rate levels are in place to maintain spawning
Prawns 1,228 tonne
Scallops 3,391 tonnes (whole weig
Landings
Prawns The total (whole weight) landings of major prawn speciesthis fishery was 1228 tonnes, comprising 927 tonnes of kingprawns, 300 tonnes of tiger prawns, less than 1 tonne of endeavour prawns (Shark Bay Prawn and Scallop Figure 3). These total landings were similar to the last two years’ of 1250 and 1232 t but below the target catch range (1501 to 2330 tonnes). In addition, 197 t of coral prawns (variousspecies but mainly Metapenaeopsis crassissima) were lande
King prawn landings (927t) were below the target catch r(1100 to 1600 tonnes). The focus by industry on capturing prawns of a larger size combined with the reduction of effthrough fishing with a less number of boats, has resulted in lower landings, of around the 950 to 1450 tonnes,undernormal environmental conditions compared to historical catch ranges. In 2009, there was an effort increase and an associated increase in total catch compared to the 200fishing seasoslightly below the proposed target level mainly because of thlower effective effort on king prawns. The target catch leveis still being reviewed and it is anticipated that it will take a
consistent catches since 2002. The A class boats caught 111 t from “the Leads” area.
By-product By-product landings from the prawn fishery included 25blue swimmer crab (P(Charybdis feriatuna (wetlinoctopus, mantis shrimp (Squillidae) mulloway (Argyrosohololepidotus), snapper (Pagrus auratus) and other finfish species.
Byproduct landings for the A class boats in the scallop fishery included 2t of blue swimmer crabs (Portunus pelagicus), and < 1 tonne of bugs (Thenus orientalis).
Fishing effort/access level
There are 27 licences in the Shark Bay Prawn ManageFishery, but as a result of changes in gear configuration resulting in amalgamation of net headrope onto lesser numbeof boats, 18 boats operated in 2009, towing qu5.5-fathom nets). This was accompanied by a reductiontotal headrope length used of 8% from 432 fathoms to 396 fathoms.
The total nominal effort recorded by the prawn fleet in 2009 was 28,368 hours and is 37% lower than that historically recorded by 27 boats between 1990 and 2004 (mean 44,864 hours). The impact of gear amalgamation means that effective effort has not reduced as much as nominal effort. An adjustment was made to the nominal effort for the increased headrope (37.5% per boat) towed by the quad bowith the 2009 adjusted effort being 39,977 hours (twin-gear equivalent effort). This adjusted effort is 17% higher than year but well bec
Twsimilar.
Recreational component: Nil
STATE OF THE FISHERIES AND AQUATIC RESOURCES REPORT 2009/10 109
GASCOYNE COAST BIOREGION
stock above acceptable levels. Logbooks provide information on the daily catch (kg) of target species and effort (hours trawled) expended in specific fishing areas. Catch per unit effort can then be derived for each fishing area by each boat by species. Fishery-independent surveys are undertaken for king and tiger prawn stock levels, which are monitored and assessed using size, catch and effort information from recruit surveys (March and April), surveys in Denham Sound (king prawns) and breeding stock surveys in July and August (tiger prawns). Recruitment surveys are undertaken mainly to provide information regarding abundance and size structure of prawns. This is used to determine the extent of areas opened to fishing to meet prevailing market requirements. These data will also be used in the future to forecast a predicted catch range for tiger and king prawns. One additional survey was carried out during May 2009 to obtain size grade information of king and tiger prawns within the Carnarvon/Peron line to assist with harvesting strategies and optimise returns to fishers.
Catch assessment The overall catch rate of 23.8 kg/hr (for adjusted effort equivalent to twin gear units) for king prawns observed in 2009 was slightly higher than last year’s rate of 22.6 kg/hr. It should be noted that some effort was directed towards callops and indicates that, if more effort was directed
s te of
7.7 kg/hr was below the m
s,
g of
e
king prawn catch rate was only 15.3
ssess if there has been a shift of tiger prawn abundance (i.e. change in migration patterns) to areas adjacent to the TPSA (hence the lower catch rates observed within the TPSA) and if more tiger prawn stock was carried over from the previous season into the northern part of the bay.
From early August onwards, the Extended Nursery Area (ENA) is closed to protect smaller prawns (primarily king prawns) moving onto the trawl grounds from the nursery area. In addition, the Denham Sound opening is now later (July/August) in the year, which gives protection to these smaller prawns early in the season allowing a higher spawning biomass in this region.
Fishery-independent survey data allows fishing to target appropriate prawn sizes for market value each season with the longer-term aim of providing catch predictions with standardised recruitment indices. The recruitment index for
ger and king prawns in 2010 was higher than observed in
d.
ly have resulted from varying effort levels and environmental
ffects on recruitment, not from the spawning stock
eids (predominantly coral
In 2009, the TPSA was closed to fishing on 6 July, thereforthe assessment surveys were undertaken in July and August. The mean catch rate of tiger prawns from these two surveys was 16.8 kg/hr, which was low compared to the threshold range, and the mean kg/hr. No increase in catch rates were observed between the July and August surveys indicating little movement of tiger prawns into this area during this period. A review of tiger prawn spatial catch and effort data is being undertaken to a
stowards king prawns, it may have increased total landingand improved catch rates. The 2009 tiger prawn catch ra
ti2009. The increased recruitment of tiger prawns in 2010, even though the tiger prawn catch rate was below target ean catch rate (10-11 kg/hr)
observed in the 1990’s to 2000.
To maintain adequate breeding stock levels for tiger prawnthe tiger prawn spawning area (TPSA) is closed when the mean catch rate reaches the threshold level. The threshold catch rate was conservatively adjusted for quad gear (four 5.5-fathom nets) to 27.5 kg/hr, with a range of 25 to 30 kg/hr. Some of the king prawn breeding stock is also protected by this closure and their catch rates are also recorded during the surveys. In 2009, the mean fleet tiger prawn catch rate was within the threshold range at 26 kg/hr when the TPSA opened to fishing but this declined to 12 kg/hr by the second fishinperiod and subsequently the TPSA was closed at the endthis fishing period.
Survey assessment The multi-species nature of this fishery requires the levels of harvest for both king and tiger prawn stocks to be carefully monitored to achieve optimum sustainable catches.
highlights the conservative nature of the current thresholThis threshold range will be reviewed in the future.
Current stock and recruitment assessment indicates that, at current exploitation levels, the king prawn stock remains above the level where recruitment is affected by spawning stock levels. Thus, at the current level of exploitation, fluctuations in the annual king prawn harvest are most liketoeabundance.
Variable quantities of minor penaprawns) are retained, depending on the catch of the target species. Owing to the small size of these species, it is likely that the majority of the stock is able to pass through the trawlmesh, suggesting that the overall exploitation is low and that breeding stock levels will therefore be adequate. Due to the current low market prices for these minor species their retention is minimal.
110 DEPARTMENT OF FISHERIES
GASCOYNE COAST BIOREGION
Scallops The catch rate of 46.9 kg/hr (based on A class boats) for scallops indicates maintenance of previous fishing efficiency. For the last three years the fishing regime has focussed on fishing pre-spawning scallops and fishing to a curate. This was done in consultation with industry e it provided the best opportunities to enhance fishin and associated profitability.
The status of the scallop stock is determined frompre-season survey of recruitment and residual stoout in November–December. This survey enablemanagement arrangements of the fishery to be d a way that take into account fishing scallops at asize and allows an adequate spawning stock.
Recruitment of juveniles to the stock and residua
enham Sound. The survey design f the data provides asts for the Shark into two sectors, rk Bay (Red
West Peron) and ound, allowing g dates for each ise scallop meat
ondition each season. ature at about one e and spawning typica April to
ovember. Fishing is therefore controlled to ensure that e key spawning season eriod for generating
008 g
P
ht)
Th or the 2010 season is based on the 2009
r
ly 1155 t whole weight, a reduction compared to r
80 t whole weight. The catch projection for the fishery as a 2100 t whole
dicator of
t since 2005 that have been significantly altered by the at fishing occurs and allowing carryover of scallops.
is intended to complete this revision during 2010/11which data with the new fishing
d for such an analysis.
y e shallow
ot er
The 2008 November survey showed that a moderate The main performance measures for the prawn fishery ance of breeding stocks for each of the
tle fishing effort occurred in the TPSA
years was
between 20 to 25 kg/hr range and a review needs to be undertaken to determine if this threshold level is
was higher than ing prawns annual landings catch
ns es
proportion of the scallops were left at the end of the 2season (but less than that observed in 2007) which providedsome carry over of residual stock into the 2009 season addinto the season’s catch and breeding stock.
relate to maintenmajor target prawn species. In 2009, the breeding stock indicator for tiger prawns was below the level set therefore, not met. The surveys in July and August indicated a mean catch rate in the TPSA that was lower than the target range. Only in May was the catch rate within the range. Fishing for tiger prawns was then monitored in the TPSA but catch rates remained low without any build up of stock levels. Because of the low
The performance measure is to ensure adequate breeding
nd the 400 kg/boat day for both areas
‘normal’ environmental conditions. It is considered the
s
stock levels. Since 2004, a catch rate threshold level is used to cease fishing to maintain breeding stock during the key spawning period. In 2009 the fishing season was opened prior to the start of the spawning season, however a cut-off threshold catch rate was applied for the fishery based on daily fleet average catch of 400 kg/boat day in both northern Shark Bay and in Denham Sound (day fishing only) to ensure adequate breeding stock levels remain for the spawning period. This catch rate has continued to be adjusted upwards since being implemented a
catch rates very litand there was insufficient information to close the area during a fishing period prior to July. Analysis of daily logbook data for the fleet indicated that catch rates declined from 26 kg/hr on average to 12 kg/hr on average within two fishing periods (May and June). Infuture years, if early surveys indicate low catch rates, amore conservative approach may be warranted for fishing and subsequent closure of this area. The catchrate at which fishing ceased for the last four (Shark Bay north and Denham Sound) may be adequate
to provide recruitment in the acceptable range given
cut-off catch rate of 400 kg/boat day should be trialled for a further three years to determine if this level ensurean adequate breeding stock. Also the fishing strategy has involved leaving part of the stock to be carried over to the following year providing a buffer in case of low recruitment and this should remain part of the sustainable fishing strategy.
adequate as recruitment in 2010observed in 2009. The kwere below the indicator range but there is little concernfor the king prawn stock as spawning is more widespread and over a more protracted period of time. It should be noted that for both species, targeting larger size prawand some shift of effort from prawns to scallop reductotal landings.
rojected scallop catch next season (2010):
1735 tonnes (whole weig
e catch projection fsurvey results. On the main fishing grounds (North West Peron and Red Cliff) in Shark Bay, recruitment was lowethan the previous three years with a moderate abundance of residuals. This resulted in a catch forecast for this area of approximate
t off catch to ensurg efficiancy
last year’s forecast of 2250 t. Recruitment levels were highethan residuals in Denham Sound, giving a predicted catch of
the annual ck carried s the etermined inn optimum
ls are estimated using the data from the scallop survey for the main fishing grounds and in D
5whole is therefore 1735 t with a range of 1350 -weight. These predictions provide a relative incatch trends based on historic fishing practices. These estimates are being revised to take into account managemenchangestiming thIt
and analysis oBay separated
catch forecnorthern Sha
provides a total of five years of strategies, the minimum neede
Cliff and North Denham S
Non-Retained Species Bycatch species impact: Low
Prawn trawlers
separate openin area to optimsize and cyear of ag
Scallops mlly occurs from
Nsufficient scallops remain through th(April to July), which is the critical p Bycatch composition for the prawn fishery is dominated b
dead wire weed, which breaks off from the extensivWooramel seagrass bank annually over summer. The bycatchalso contains a number of small size fish species mostly ntaken by other sectors. Small blue swimmer crabs and oth
future recruits.
STATE OF THE FISHERIES AND AQUATIC RESOURCES REPORT 2009/10 111

GASCOYNE COAST BIOREGION
crustacean species are also taken in significant quantities but are generally released alive. Overall bycatch taken in trawnets are moderate relative to other subtropical trawl fisheries at about 4–8 times the prawn catch. Field sampling for a study on the bycatch of trawled and untrawled
l
areas of Shark
allop trawlers or the scallop fishery owing to the legislated design of the ets (which use 100 mm mesh) and the relatively short
of the fishery, the total bycatch of fish is minimal.
rotected species interaction: Low
lthough protected species including whales, dolphins, ugongs, turtles and sea snakes are particularly abundant in
Shark Bay generally, only sea snakes are seen regularly in the trawl catches in certain areas, and these are mostly returned to the sea alive. The full implementation of bycatch reduction devices (grids) in the fishery since 2002 has generally eliminated the occasional capture of turtles in trawl nets.
Ecosystem Effects Food chain effects: Low
Although the harvest rates of the retained target species are high, such species have very high natural mortality rates and make up a relatively small proportion of the ‘fish’ biomass on the trawl grounds. Thus, most prawn and scallop predators are opportunistic due to these natural variations in prawn and
Bay used by the
e
Habitat effects:
Prawn fishery Moderate
Scallop fishery Low
There are extensive permanent and temporary closures in the Shark Bay fishery. Inside Shark Bay, is 4652 nm 2 and represents 38% of the fishery area (including closed areas). (Shark Bay Prawn and Scallop Figure 1).
Prawn trawlers The prawn fleet operates in approximately 7% of the overall fishery. The permitted trawl area inside Shark Bay is 1768
he
redominantly sand/shell habitats) of the central bay, north and northeast of Cape Peron and in the northern area of Denham Sound. The majority of sponge/coral habitats are contained within specific trawl closures to protect these areas.
Scallop trawlers The scallop fleet operates in approximately 3% of the overall fishery. The permitted trawl area inside Shark Bay is 1483 nm2 and represents 32% of inner Shark Bay (excluding the closed areas). Trawl fishing is focused in predominantly sand/shell habitats of the central bay, north west of Cape Peron and in the northern area of Denham Sound. The majority of sponge/coral habitats are contained within specific trawl closures to protect these areas.
Social Effects During 2009, approximately 250 skippers and crew were employed in the prawn and scallop fisheries. There are also processing and support staff employed at Carnarvon, Geraldton and Fremantle. These industries are a major contributor to regional employment.
Performance measures for habitat impact relate to the spatial extent of prawn trawling within Shark Bay’s sand/shell and coral/sponge habitats. Both the prawn and scallop fleet permitted trawl areas are below the 40% level of the inner Shark Bay area. Most sponge/coral habitats in Shark Bay are now protected by fishery permanent closures which will limit the actual trawl area below 40% at any time. In 2009 the performance measure was met as the total area trawled within inner Shark Bay by the prawn fleet was approximately 801 square nautical miles or 17% of inner Shark Bay and the scallop area trawled was approximately 407 square nautical miles or 9 % of the inner Shark Bay.
Bay is now available (Kangas et al. 2008). Grid and secondary bycatch reduction devices (square mesh panels in cod-ends) are fully implemented and should further reduce
e quantity of small fish retained in trawls.
scallop populations. Consequently, it is considered unlikely that the commercial take of prawns and scallops impacts significantly on the upper trophic levels within the Sharkecosystem. The reduced levels of effort nowfishery, combined with the modifications to gear to reducunwanted catch, will have further reduced the potential for indirect food chain impacts to occur.
th
ScFnduration
P
Ad
nm2 and represents 38% of inner Shark Bay (excluding tclosed areas). Trawl fishing is focused in the deeper areas(p
The two performance measures for the fishery relate to:
(i) its impact on biodiversity through the take of non-target (bycatch) species, and (ii) its impact on associated species, e.g. dolphins, through the discarding of bycatch
trawled areas have similar diversity to the larger adjacent untrawled areas, indicating that the performance indicator will be met. For provisioning, the indicator has been met due to the lower and more targeted trawl effort and implementation of BRDs in the fleet. Both actions have reduced the rate of discards relative to the pre-BRD period.
(provisioning). In the case of biodiversity, a major project surveying bycatch species on and off the trawl grounds has been completed. Data analysis indicates that
One performance measure for the fishery is for 90% of turtles from non-BRD nets to be returned alive. These fisheries have BRDs (grids) in all net so this performance measure is no longer valid. For the 2009 season, 5 turtles were recorded as caught in nets in the prawn fishery and were recorded as being returned to the sea alive. For the scallop fishery, 13 turtles were reported as being taken in scallop nets and all were retuned back to the sea alive.
112 DEPARTMENT OF FISHERIES

GASCOYNE COAST BIOREGION
Economic Effects Estimated annual value (to fishers) for year 2009:
Prawns $13.8 million
Scallops $13.2 million
Ex-vessel prices for prawns vary, depending on the type of product and the market forces operating at any one time, and average ex-boat prices were as follows:
King prawns $10.50/kg
Tiger prawns $12.00/kg
Coral prawns $2.50/kg
Scallops $3.90/kg
Fishery Governance Target catch range:
Prawns (Historical range) 1501 - 2330 tonnes
Prawns (New interim range) 950 - 1450 tonnes
Scallop 1250 – 3000 tonnes whole weight
Under previous effort levels, normal environmental conditions and based on catches in the 1990s following the restructuring of the fishery to 27 licences, the target catch range had been set for major penaeids at 1501 – 2330 t. Similarly, the target catch ranges for individual species were king prawns 1100 – 1600 t, tiger prawns 400 – 700 t and endeavour prawns 1 – 30 t.
Now that the focus by industry is to target larger size prawns, the resulting effort shift has reduced expected total landings to around the 950 to 1450 tonnes under normal environmental conditions compared to historical catch ranges. This reduction in total landings will be reviewed after a few more years and a new target catch range developed. As effort has been directed to avoid areas of smaller prawns, which is where endeavour prawns were mainly taken, the catch of this species will no longer be included as a performance indicator for the fishery.
The target catch range for scallops remains at approximately
year period 1995 – 1999. This period excludes the high catches of the early 1990s (Shark Bay Scallop Figure 1), apparently created by an unprecedented four years of El Niño conditions.
The projected catch for next season (1735 t) whole weight, based on a pre-season survey, is within the target catch range.
New management initiatives (2010)
Discussions with Industry continued on the implementation of a scallop catch share between the A and B class scallop boats.
External Factors High costs of fishing and lower returns due to the current economic climate and competition from aquaculture on small prawns has required focussing management and harvesting practices to reduce fishing costs (i.e. only fish efficient catch periods) and to target larger prawns and to shift the emphasis on domestic markets rather than the export market.
The catches of prawns in Shark Bay are relatively stable compared with other Penaeid fisheries. The major environmental factor influencing these stocks appears to be the flow of the Leeuwin Current along the outside of the embayment. A relationship between current strength (as measured by Fremantle sea level) and king prawn catches has been identified and may be used to indicate broad catch trends. The mechanism proposed is that higher current flows increase water temperatures which may increase the growth and catchability of the prawns.
A relationship exists between sea level (at Fremantle) and the recruitment of scallops in Shark Bay, particularly in the Red Cliff area. Generally, high sea levels corresponding to strong Leeuwin Current correlate with poor recruitment. Due to this variability a redirection in effort away from prawn areas can artificially lower prawn catches when scallops are very abundant, due to a shift in effort/targeting.
The Department of Fisheries is currently examining the mechanisms that control recruitment succe in greater detail, in order to explain more of the inter-annual ation that occurs.
ss vari
1250 – 3000 t whole weight, based on catches over the five-
STATE OF THE FISHERIES AND AQUATIC RESOURCES REPORT 2009/10 113

GASCOYNE COAST BIOREGION
SHARK BAY PRAWN AND SCALLOP FIGURE 1
The main boundaries of the Shark Bay Prawn Fishery, Inner Shark Bay, TPSA, ENA, trawl closures, permitted trawl (extends out to the 200m isobath) area and area trawled in 2009.
114 DEPARTMENT OF FISHERIES
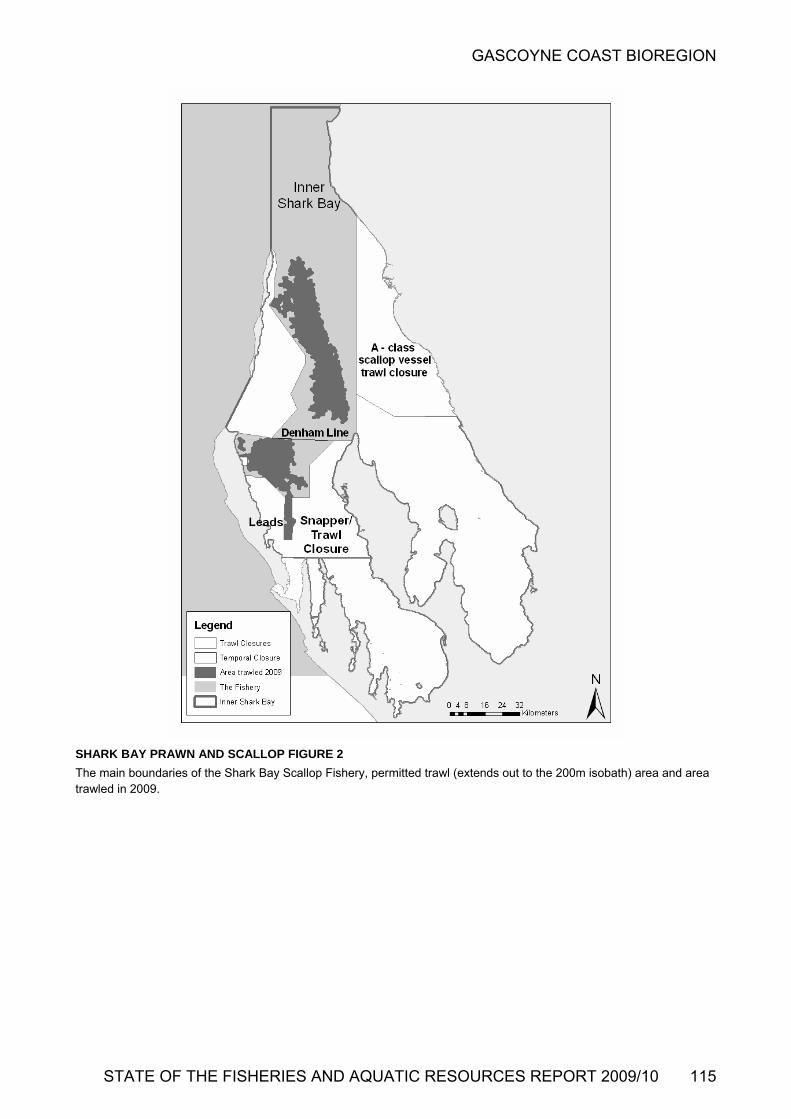
GASCOYNE COAST BIOREGION
trawl (extends out to the 200m isobath) area and a
SH
T
ARK BAY PRAWN AND SCALLOP FIGURE 2
he main boundaries of the Shark Bay Scallop Fishery, permitted rea trawled in 2009.
STATE OF THE FISHERIES AND AQUATIC RESOURCES REPORT 2009/10 115

GASCOYNE COAST BIOREGION
2,500 800
SHARK BAY PRAWN AND SCALLOP FIGURE 3
Shark Bay Prawn Managed Fishery annual landings and
effort (adjusted to twin gear units) 1962 – 2009.
SHARK BAY PRAWN AND SCALLOP FIGURE 4
Shark Bay Scallop Managed Fishery annual landings
1983 – 2009.
0
500
62 64 66 68 70 72 74 76 78 80 82 84
Y
700King
Tiger
Effort
1,000
1,500
2,000
Lan
din
gs
(to
nn
es)
200
300
400
500
600
Eff
ort
(h
ou
rs x
100
)
86 88 90 92 94 96 98 00 02 04 06 08
ear
0
100
Shark Bay
6,000
8,000
10,000
12,000
14,000
16,000
La
nd
ing
s (
wh
ole
we
igh
t to
nn
es
)
Annual S
83 84 85 86 87 88 89 90 91 92 93 94 95 96 9
Year
callop Catch
Class A Boats (Scallops Only)
Class B Boats (Prawn + Scallops)
4,000
2,000
0
7 98 99 00 01 02 03 04 05 06 07 08 09
116 DEPARTMENT OF FISHERIES

GASCOYNE COAST BIOREGION
Exmouth Gulf Prawn ManagedE. Sporer, M. Kangas and S. Brown
Fis
aged Fishery targets western
)
try.
ment arrangements
These signed
g the
d
fo28fuop Nfore18 hed. There
ere spatio-temporal closures during the early part of the ason (April – July) to avoid fishing on small prawns.
e that spawning stock
and
d
e
ze
nt.
Thfleclst
MTP ed upA mreen r an e threshold.
ishery is subject to a maximum total headrope llocation. However, the gear configuration package (net and
ard sizes) permitted within this total allocation is under review, with vessels currently operating under an exemption
hery Status Report
conditions, moon phase and the results of fishery-independent surveys that estimate tiger prawn recruitment (abundance and size) and spawning stock and provides a prediction of catch. The Department’s vessel monitoring system (VMS) monitors the activities of all boats durinseason.
In recent seasons, management arrangements have provide
Management input from R. Gould
Fishery Description
Main Features
Status
Stock level Acceptable
Fishing level Acceptable
Current Landings
412t
3t
Tiger
Kings 28
Endeavours 132t
r a fishing period of about 200 nights with a minimum of non-fishing nights for moon closures (i.e. four nights each ll moon) during the period. For the 2009 season, official ening and closing dates were formally set at 1 April and 28
ovember respectively, providing a maximum of 203 nights r fishing. The season commenced on 1 April, based on sults from pre-season surveys and it closed at 0800 hrs on November resulting in a total of 183 nights fis
The Exmouth Gulf Prawn Manking prawns (Penaeus latisulcatus), brown tiger prawns (Penaeus esculentus), endeavour prawns (Metapenaeus spp.and banana prawns (Penaeus merguiensis). This limited entry fishery operates in the sheltered waters of Exmouth Gulf using low opening, otter prawn trawl systems.
Governing legislation/fishing authority
Exmouth Gulf Prawn Management Plan 1989
Exmouth Gulf Prawn Managed Fishery Licence
Commonwealth Government Environment Protection and Biodiversity Conservation Act 1999 (Export Exemption)
wse
Stringent measures are in place to ensurlevels are maintained at adequate levels and that the prospect of both recruitment and growth over-fishing is avoided. These measures will continue to be applied, while incorporating a flexible fishing regime to optimise sizevalue of prawns.
There is a consultative process in operation whereby the Department of Fisheries (the Department) and industry jointly decide on the timing and extent of areas to be fisheor closed, according to size and abundance of prawns. Research staff are onboard the commercial boats to undertakfishery independent recruitment and breeding stock surveys and, at times, industry undertake within season surveys to determine changes in prawn distribution, abundance and sicomposition. This enables a rapid response to resource fluctuations to maximise tiger and king prawn size (and hence market value) while still providing a sustainable approach to stock manageme
Consultation process
Meetings between the Department of Fisheries and indus
Boundaries
The main boundaries for the Exmouth Gulf Prawn Managed Fishery, which includes the areas where trawling is generally permitted, the Tiger Prawn Spawning Area (TPSA) and closed areas are shown in Exmouth Gulf Figure 1.
Manage
Management of this fishery is based on input controls which include limited entry, seasonal and area openings and closures, moon closures and gear controls.
e Research Division monitors the catch and effort of the et and provides real time advice about when to open and
ose areas which is a key part of the fishery’s management rategy for spatial and temporal closures.
anagement guidelines prescribe a mandatory closure of the SA when the tiger prawn catch rate falls to 25 kg/hr (bason ‘quad gear’ catch rate, 4 x 6-fathom nets) or on 1
ugust, whichever is the sooner. From 1 November, after theain spawning period, the catch rate threshold level is duced from 25 kg/hr to 19 kg/hr. Also, fishing ceases at the d of the season according to the size of king prawns and o agreed to catch rat
sophisticated set of management arrangements are deto keep fishing effort at levels that will maintain sufficient spawning biomass of prawns (particularly tiger prawns). The yearly cycle of operation for the fishery is dynamic and involves real-time management with the opening and closing dates varying each year, depending on environmental
The fabo
STATE OF THE FISHERIES AND AQUATIC RESOURCES REPORT 2009/10 117

GASCOYNE COAST BIOREGION
allowing the use of ‘quad gear’ (four smaller nets) rather than the standard twin 7.5-fathom nets. This has resulted in a reduction in the number of boats operating with the headropallocation redistributed among the remaining boats. The reduction of boat numbers and overall net allocation is ongoing with the aim of maximizing economic efficiency but still maintaining overall catch in this fishery as well as ensuring sustainability.
Bycatch reduction devices (BRDs) are utilised in this fishewith all vessels required, by way of a condition on the
e
ry,
anaged fishery licence, to fish with a ‘grid’ and a secondary RD (fish escape device) in each net. Industry, in association
gained certification from
lso
8 nder the provisions of the Environment Protection and
to
Research activities continue to focus on stock assessment and surveys to monitor annual recruitment of tiger prawns and
, and ng
e
area based on threshold catch rates. All boats complete detailed daily logbooks, which, together with urvey data and factory catch unload records, provide the formation sources for managing the fishery. The joint
tation of gear modifications to ve product quality is ongoing.
andings
he total landings of major penaeids for the 2009 season ere 828 t, comprising 283 t of king prawns, 412 t of tiger rawns and 132 t of endeavour prawns and less than 1 t of
banana prawns. This was lower than last year’s catch of 1170 t, mainly due to reductions in tiger and endeavour prawn catches. The tiger prawn and endeavour prawn
atch range of 250–550 t and
500 t.
ince drope capacity for this
t at 240 fathom 16 boats each oms of net hele maintaining tch levels, there
ation o a reduced number of these ch 9 boats operated in
total of 206 f et headrope. There ere two differing net headrope sizes 5.5, and 6 fathoms
um size of 6-fathom t.
ts
ssessment complete: Yes
reeding stock levels: Adequate
son (2010):
ns
stocks ys
/hr.
cause of the decline in annual landings. The season commenced early, however, areas of small prawns were closed to fishing in the early part of the season to ensure that size and quality was maintained. Also, the season ceased according to the catch rate threshold and size of king prawn protocol. The fishery is closed when the king prawns size
landings were within the target c120-300 t respectively (Exmouth Gulf Prawn Figure 2). King prawn landings were still under the target catch range of 350–
Recorded landings of by-product included 25 t of coral prawns, 16 t of squid, 10 t of octopus, 10 t of blue swimmer crab (Portunus pelagicus) and 2 t of bugs (Thenus orientalis).
Fishing effort/access level
There are 16 Managed Fishery Licenses in this fishery. S1990 the total allocation of net heafishery was setowing 15 fath
s, based onadrope. To improve the economic
efficiency whi
mBwith the Department, successfullythe US Department of State in 2008 that the fishery is BRD-compliant, in terms of potential turtle captures. This allows sustainable calicensees to export product to the US market. Industry auses ‘hopper’ in-water sorting systems since 2002, which provide an improved quality of prawns and reduced mortality for some bycatch species.
The Australian Government’s Department of Environment, Water, Heritage and the Arts has assessed the fishery in 200
has been an amalgamult of
f gear ontoboats. As a res2009 towing a
anges, onlyathoms of n
wbecause 5 boats cannot tow the maximheadrope nets allocated for each boa
u Total nominal effort for the 2009 season was 17,934 hours. Biodiversity Conservation Act 1999 and has accredited the fishery for a period of five years, allowing product from the
The adjusted effort was 27,851 hours, which was similar to that in 2008. Of the 200 nights allocated to fishing, the fleet
fishery to be exported from Australia. The comprehensive Ecologically Sustainable Development assessment of this fishery identified risks to breeding stock levels of target prawn species, bycatch species impacts, habitat and provisioning effects that required specific management actions. Boxed text in this status report provides the annual assessment of performance measures/indicators relatedthese issues.
Research summary
fished 183 nights during the 2009 season. This is the highest number of nights fished since 2002. This may reflect the lower number of boats fishing. Although the annual landings were below the historical catch range, effort was focused on king prawns to ensure that this species was exploited to ipotential this season. Therefore, the overall effort for the 2009 season was slightly higher than expected for the total catch taken.
Stock Assessment A
breeding stock surveys to monitor spawning stock levelsa pre-season survey of king prawns to assist with harvestistrategies (these are detailed above in the management arrangements). Monitoring of fishing activity is undertaken inreal time to determine the specific timing of the closure of thtiger prawn spawning
Assessment method: Direct survey/catch rate
B
Projected catch next sea
342 (270 - 410) tonnes tiger praw
The standardised catch per unit effort data from the fishery is an indicator of abundance, which can be used to monitor changes in stock levels from year to year. The average catch and catch rate is compared to a ten-year reference point (1989 to 1998) for each species. The tiger and king prawns
sinevaluation and implemenreduce bycatch and impro
are also assessed each year using standardised surve(recruitment and breeding stock).
Catch assessment The adjusted catch rate 10.2 per kg/hr, for king prawns is slightly below the reference catch rate level of 11.7 kgEven though the landings of king prawns were below the target catch range, overfishing does not appear to be the
Retained Species Commercial production (season 2009):
828 tonnes
L
Twp
118 DEPARTMENT OF FISHERIES

GASCOYNE COAST BIOREGION
composition reaches approximately, on average 23 to 25 per
unt per pound (particularly if the catch rate of king prawns is low at 20 to 25 kg/hr).
The catch rate of 14.8 kg/hr for tiger prawn is high compared to the reference point catch rate of 10 kg/hr. The high catch rates of tiger prawns reflect their high abundance because of favourable environmental conditions. Although both tiger and endeavour prawns occupy similar inshore structured habitats, fishing effort was focused on tiger prawns rather than endeavour prawns. This was reflected in an endeavour prawn catch rate of 4.8 kg/hr which was below the reference point catch rate of 5.6 kg/hr. This catch rate may not represent the actual abundance of endeavour prawns because not all endeavour prawns caught were landed due to the daily vessel catch cap (industry practice) and skippers tended to high grade towards retention of tiger prawns.
Survey assessment For tiger prawns, this process involves analysis of survey-based indices of recruitment and spawning stock, which are used for catch prediction and assessed against the spawning stock–recruitment relationship. For the 2009 season the total landings were below the catch prediction, based on recruitment survey indices (549 tonnes with a range of 439–659 tonnes). Tiger prawn breeding stock levels are maintained at adequate levels by real-time monitoring the tiger prawn catches to determine when fishing should cease
trategy maintains
were monitored from grounds closed on 1
August. Thr tiger prawn breeding stock s gust to October with an average CPUE of 29.7 kg/hr in the main spawning area (Q1). T aintained above the threshold l October surveys showed a C d 26.4 kg/hr respectively. Tficatk
The spawning survey regime extends to the central Gulf (Q2 a ces for the three surveys w
Kmaintaine d breeding period and due to the lower cva
There is no formal assessment for endeavour prawns, a secondary target species whose distribution overlaps that of tiger prawns, and they are fished to varying levels depending n the abundance of (and hence the fishing effort applied to) e more valuable tiger prawns. The breeding stock of
be adequate because their r prawns and the tiger
prawn closures also protect a significant portion of the
prawns are also considered to be more resilient to fishing pressure due to their smaller size and lower catchability, which is similar to king prawns.
Environmental conditions were generally favorable for all species during the 2009 season, i.e. no cyclonic impacts or heavy rainfall during the summer months (December to March).
The catch prediction for tiger prawns is based on the relationship between recruitment survey indices (early and late March and early April) and the season’s landings (April–November of the same year). The projected tiger prawn catch range for 2010 is 270-410 tonnes.
Non-Retained Species Low
ively low by ies of
significance to other fishing sectors being taken. Trialing of secondary bycatch reduction devices continues (including square mesh cod-end nets) in order to reduce the volume of overall bycatch species retained in the trawls whilst improving the quality of the prawn catch. In addition, all boats used hopp systems), which
t for bycatch survival and ours) in 2009 was slightly
higher
seasons prior
The main performance measures for the fishery relate to maintenance of breeding stocks for each of the major target prawn species. In 2009 the breeding stock indicators (catches within specified ranges) for tiger and endeavour prawns were met. The king prawns were below the target range, however there is a conservative harvesting strategy in place for this species. The low banana prawn landings recorded corresponded to a low rainfall year.
pound, or if 50% or greater of the daily catches are 21-30 and 31 + co
endeavour prawn breeding stock. In addition, endeavour
in the main tiger prawn fish grounds. This sthe spawning biomass of tiger prawns above the historically Bycatch species impact: determined biological reference point. The present cut-off threshold catch rate is 25 kg/hr based on 6-fathom nets in quad gear configuration.
Bycatch levels for Exmouth Gulf are relattropical trawl fisheries standards, with few spec
During 2009, tiger prawn catch ratesMay to August and the tiger prawn
ee standardisedurveys carried out from Au
ers (in-water catch sortingadd another level of improvemenherefore the stock level was m
evel. The August, September andPUE of 25.5 kg/hr, 34.0 kg/hr an
product quality. Fishing effort (in hthan expected for the total landings but still low
compared to historical levels, however, there was a slight he tiger prawn spawning area (Area B) was re-opened for shing on 26 October and closed 16 November when the decrease in the area trawled (27% of the whole fishery)
ch rate level declined to the threshold cut off level (19 g/hr).
compared to the 2008 season and much lower compared to to the 1990's.
rea) and the mean spawning indi The two performance measures for the fishery relate to (i)
similar diversity to the larger adjacent untrawled areas , indicating that the
ing, the
ere higher (45.2 kg/hr) in this region. its impact on biodiversity through the take of non-target (bycatch) species, and (ii) its impact on associated species, e.g. dolphins, through the discarding of bycatch
ing prawn breeding stock levels in the fishery are levels through controls on fishing ed at adequate
ffort and the extende (provisioning). Analysis indicates that trawled areas have
atchability of the species compared to tiger prawns. The (even though abundances may vary)performance indicator will be met. For provision
ariability in the abundance of the king prawn stock has been ssessed since 2002 by a pre-season recruitment survey.
indicator has been met due to the lower and more targeted trawl effort and implementation of BRDS in the fleet. Both actions have reduced the rate of discards relative to the pre-BRD period.
othendeavour prawns is considered to distribution overlaps that of the tige
STATE OF THE FISHERIES AND AQUATIC RESOURCES REPORT 2009/10 119
GASCOYNE COAST BIOREGION
Protected species interaction: Low
While protected species including dugongs, turtles and sea snakes occur in the general area, only sea snakes and occasionally turtles are encountered in the trawl catches. Bospecies are typically returned to the sea alive. Grids are now compulsory, whic
th
h has largely eliminated the capture of any all
nlikely to be significant in view
from ts.
than 12 m in depth) containing sponge habitats,
ut the refocusing of the fishery into deeper waters to take prawns since the early 1980s has reduced this
teraction. The trawling effort is now focused in the deeper
e trawl gear has relatively little physical impact. verall, the nature of this particular trawl fishery and the
onmental
T yment in the fishery for the year 2009 ew. Additional processing and support
hin
emxmouth township.
Effects fishers) for year 2009:
$8.9 million
e of
vertical integration, with e fishing companies which own the boats undertaking
of the product into overseas markets. For roduct prices quoted can only be estimates,
s
hing level: Acceptable
neously). These overall and individual figures re generally based on a 10-year average (1989-1998). The
ll three species combined iger and endeavour
thin each species range but king prawns were
il
h is
r
) on small size
te to the ea of the
was met as the total area trawled, at approximately 311
EconomicEstimated annual value (to
Ex-vessel prices for prawns vary, depending on the typproduct and the market forces operating at any one time. In
y there is a high degree of turtle or other large animal. In addition, secondary bycatchreduction devices (square mesh panels) were implementednets in 2005. Three turtles (unidentified) were reported as being caught in nets and returned alive during 2009.
Ecosystem Effects Food chain effects: Low
Although the prawn species are managed such that the relatively high levels of annual harvest, the impact of the catch on local food chains is u
this fisherthdirect marketingthis reason, the phowever prices are similar to the Shark Bay fishery. Estimated prices were as follows:
King prawns $11.00/kg
Tiger prawns $11.50/kg
Endeavour prawns $6.00/kg
Coral prawns $3.00/kg
Fishery Governance Target catch range: 771 – 1,276 tonne
Current fis
of the high natural mortality, extent of non-trawled nurseryareas and variable biomass levels of prawns resultingvariable environmental conditions, such as cyclone even
Habitat effects: Low
Historically, the fishery has impacted on some shallow waterareas (less
Under current fishing effort levels, the target catch range for major penaeids is 771–1,276 t. The long-term target catch ranges for individual species are king prawns 350–500 t, tiger prawns 250–550 t and endeavour prawns 120–300 t (noting that maximum or minimum catches do not occur for all species simulta
blargerincentral and north-western sectors of Exmouth Gulf. Owing to the predominantly mud and sand habitats of the trawl grounds, th
atarget catch ranges for the total of awere within the target catch range. TO
very tight controls on effort indicate that its envireffect is now likely to be low.
prawns were wilower for the 2009 season.
New management initiatives (2010): N
External Factors High costs of fishing and lower returns due to the current economic climate and competition from aquaculture on small prawns has required focussing management and harvesting practices to reduce fishing costs (i.e. only fish efficient catc
Performance measures for habitat impact relaspatial extent of trawling within the licensed arExmouth Gulf fishery. In 2009 the performance measure
square nautical miles (27%) per cent of Exmouth Gulf, was below the 40% level.
periods) and to target larger prawns and to shift the emphason domestic markets rather than the export market.
Cyclones appear to have a significant effect on the productivity of Exmouth Gulf. Cyclone impacts can be eithepositive or negative. Early (December to February) cyclones can have a negative impact (high mortality
Social Effects he estimated emplo
was 27 skippers and crstaff are also based in Exmouth Gulf and Fremantle. Witthe Exmouth area, the fishery is one of the major regional
ployers and contributes to the economic viability of the prawns in the shallow nursery areas. There are other environmental factors that have not been fully investigated that can affect the spawning stock – recruitment relationship.
E
120 DEPARTMENT OF FISHERIES

GASCOYNE COAST BIOREGION
STATE OF THE FISHERIES AND AQUATIC RESOURCES REPORT 2009/10 121
EXMOUTH GULF PRAWN FIGURE 1
The main boundaries of the Exmouth Gulf Prawn Fis2009.
hery, TPSA rea trawled in
IGURE 2 ual landings and adjust 63 – 2009.
and Q1 and Q2, potential trawl area and a
0
200
400
1,000
1,200
1,400
63 65 67 69 71 73 75 77 79 81 83 85 87
Year
50
60
King
Tiger
Endeavour
Banana
Effort
20
30
40
Eff
ort
(h
ou
rs x
1,0
00)
600
800
Lan
din
gs
(to
nn
es)
89 91 93 95 97 99 01 03 05 07 09
0
10
EXMOUTH GULF PRAWN FExmouth Gulf Prawn Managed Fishery ann ed effort (twin-gear), 19
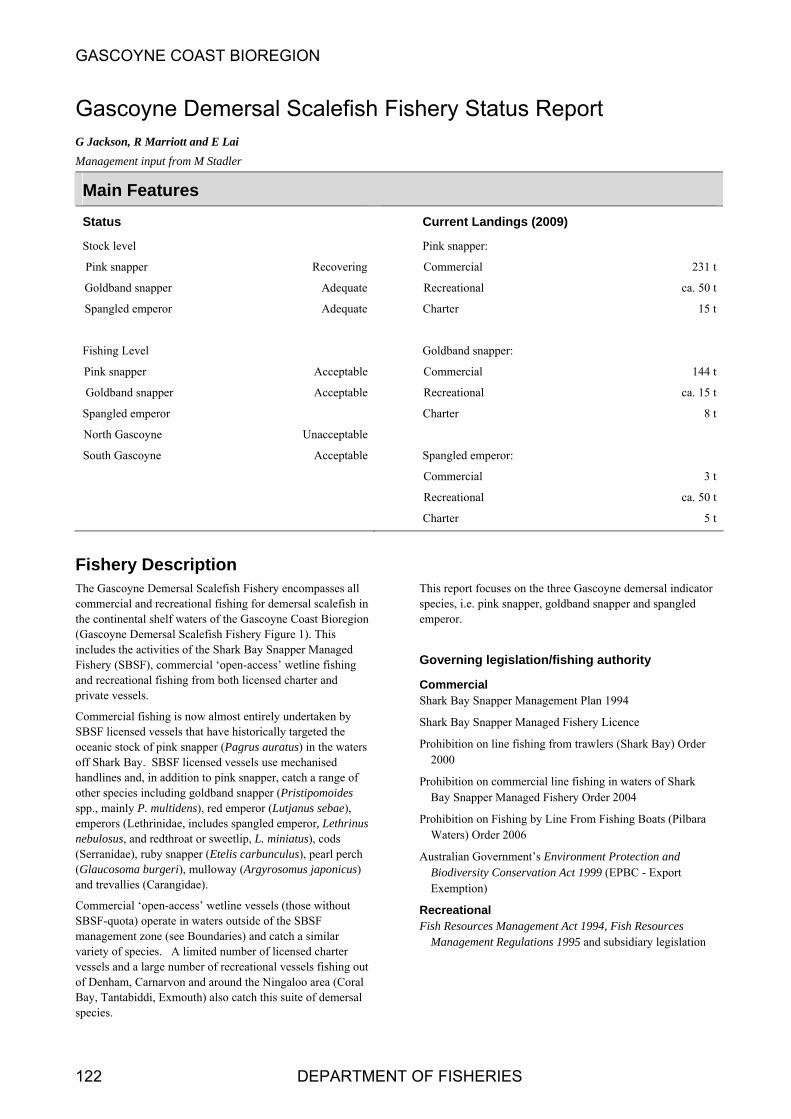
GASCOYNE COAST BIOREGION
Gascoyne Demersal Scalefish G Jackson, R Marriott and E Lai Management input from M Stadler
Fishery Status Report
Main Features
Status
Stock level
Pink snapper Recovering
Goldband snapper Adequate
Spangled emperor Adequate
Goldband snapper
South Gascoyne Acceptable
Current Landings (2009)
Pink snapper:
Commercial 231 t
Recreational ca. 50 t
Charter 15 t
Goldband snapper:
Commercial 144 t
Recreational ca. 15 t
Charter 8 t
Spangled emperor:
Commercial 3 t
Recreational ca. 50 t
Charter 5 t
Fishing Level
Pink snapper Acceptable
Acceptable
Spangled emperor
North Gascoyne Unacceptable
Fishery Description The Gasc
mmercial and recreational fishing for demersal scalefish in
s
t of Denham, Carnarvon and around the Ningaloo area (Coral Bay, Tantabiddi, Exmouth) also catch this suite of demersal species.
This report focuses on the three Gascoyne demersal indicator species, i.e. pink snapper, goldband snapper and spangled emperor.
Governing legislation/fishing authority
Commercial Shark Bay Snapper Management Plan 1994
Shark Bay Snapper Managed Fishery Licence
Prohibition on line fishing from trawlers (Shark Bay) Order 2000
Prohibition on commercial line fishing in waters of Shark Bay Snapper Managed Fishery Order 2004
Prohibition on Fishing by Line From Fishing Boats (Pilbara Waters) Order 2006
Australian Government’s Environment Protection and Biodiversity Conservation Act 1999 (EPBC - Export Exemption)
Recreational Fish Resources Management Act 1994, Fish Resources
Management Regulations 1995 and subsidiary legislation
oyne Demersal Scalefish Fishery encompasses all cothe continental shelf waters of the Gascoyne Coast Bioregion(Gascoyne Demersal Scalefish Fishery Figure 1). This includes the activities of the Shark Bay Snapper Managed Fishery (SBSF), commercial ‘open-access’ wetline fishing and recreational fishing from both licensed charter and private vessels.
Commercial fishing is now almost entirely undertaken by SBSF licensed vessels that have historically targeted the oceanic stock of pink snapper (Pagrus auratus) in the watersoff Shark Bay. SBSF licensed vessels use mechanised handlines and, in addition to pink snapper, catch a range of other species including goldband snapper (Pristipomoides spp., mainly P. multidens), red emperor (Lutjanus sebae), emperors (Lethrinidae, includes spangled emperor, Lethrinunebulosus, and redthroat or sweetlip, L. miniatus), cods (Serranidae), ruby snapper (Etelis carbunculus), pearl perch(Glaucosoma burgeri), mulloway (Argyrosomus japonicus) and trevallies (Carangidae).
Commercial ‘open-access’ wetline vessels (those without SBSF-quota) operate in waters outside of the SBSF management zone (see Boundaries) and catch a similar variety of species. A limited number of licensed charter vessels and a large number of recreational vessels fishing ou
122 DEPARTMENT OF FISHERIES

GASCOYNE COAST BIOREGION
Consultation process
Commercial Department–industry meetings
Recreational Recreational Fishing Advisory Committee
Regional Recreational Fishing Advisory Committees (Denham, Carnarvon, Exmouth)
Boundaries
Commercial The SBSF operates in the waters of the Indian Ocean and Shark Bay between latitudes 23°34’ S and 26°30’S (Gascoyne Demersal Scalefish Fishery Figure 1). SBSF vessels are not permitted to fish in inner Shark Bay. A limited number of
mmercial vessels without SBSF-quota are permitted to fish north of 21°56’S, and (ii) between 23°07’ and 23°34’S.
d
eserves and
ubject to individual
und basis. A minimum holding of 100 quota
7’S (Gascoyne Demersal Scalefish Fishery
l target
ears.
essels; atch
only, to monitor individual quotas) and creational survey data.
ed here covers all e waters between
al
ink snapper: Detailed research on the oceanic pink
atch-at-age data. An integrated stock assessment model has and is updated
A Western Australian
d
timates of the key biological parameters.
Bioregion is continuing.
co(i)No state-licensed commercial vessels are permitted to fish between 21°56’ and 23°07’S (‘Point Maud-Tantabiddi Well’closure). Management arrangements for the West Coast Demersal Scalefish Fishery (WCDSF) permit a limited number of commercial vessels licensed in that fishery to operate in waters up to the southern boundary of the SBSF(26°30’S).
Recreational The recreational fishery (which includes activities by licensecharter vessels) operates in all Gascoyne waters with the exception of Sanctuary Zones, Marine Nature RConservation Areas within the Ningaloo and Shark Bay Marine Parks.
Management arrangements
Commercial Commercial fishing for pink snapper (oceanic stock) came under formal management for the first time in May 1987. Between then and 2000, pink snapper catches taken during the peak season (May–August) were squotas while gear controls applied in the off-peak season (September-April). From 2001, the SBSF has been quota-managed on a year-roquota units applies and all units are transferable. These units operate from 1 September to 31 August (‘quota-year’), with a total of 5,125 units in the fishery (value of one quota unit = total allowable commercial catch [TACC] 5,125).
In response to scientific advice on stock status there have been a number of significant reductions in TACC in recent years. The TACC was reduced from 563,750 kg to 338,250 kg in 2004, it was further reduced to 297,250 kg in April 2007, and most recently to 276,750kg, in September 2007. An EPBC assessment for the SBSF fishery was completed in 2003 and was re-assessed in early 2009.
‘Open-access’ commercial wetline fishing in waters between 2334’S and 230Figure 1) will be incorporated within the Gascoyne Demersal Scalefish Fishery Management Plan (see Fisheries Management Paper No. 224 for further details). As previously noted, commercial fishing below 26°30’ S has been managed as part of the WCDSF since January 2008.
Minimum legal sizes apply to many of the commerciaspecies (emperors, pink snapper, red emperor, cods).
Recreational The recreational fishery (including charter vessels) is managed using daily bag, possession, trip and size limits coupled with limitations on the use of certain fishing g
Research summary
Catch and effort monitoring for this fishery includes analyses of commercial (daily/trip returns for SBSF licensed vmonthly returns for ‘open access’ vessels) and charter cand effort (monthly) returns and catch-disposal records (SBSF, pink snapper re
Commercial catch and effort data reportcommercial line fishing within Gascoyn114°50’E and 26°30’S. Commercial catches are reported for the period of the SBSF quota-year, i.e. September 1 2008 - August 31 2009 (referred to hereon as the ‘season 2009’). Charter catches are reported for the period January – December 2009. The most recent survey of boat-based recreational fishing within the Gascoyne Coast Bioregion wasfor April 2007 and March 2008 (equates to commerci‘season 2007’).
Psnapper stock and the associated SBSF was undertaken throughout the 1980s and early 1990s. Commercial catches are sampled throughout the year to provide representative cbeen used to determine stock status since 2003every 3 years (most recently in 2009). Marine Science Institute (WAMSI) project has been investigating the relationships between pink snapper stocks from Shark Bay to the South Australian border based on genetics and otolith chemistry; results from this project will be available in late 2010.
Goldband snapper: Comprehensive research on goldbansnapper commenced in 2007 as part of a Gascoyne IntegratedFisheries Management (IFM) project. A ‘weight of evidence’ based assessment has been completed and is pending externalreview. Monitoring of commercial catches and age structure is continuing and further research is planned to refine es
Spangled emperor: Comprehensive research on spangled emperor commenced in 2007 also as part of the Gascoyne IFM project. A ‘weight of evidence’ based assessment has been completed and is pending external review. Limited monitoring of recreational catches landed at fishing tournaments in the
STATE OF THE FISHERIES AND AQUATIC RESOURCES REPORT 2009/10 123

GASCOYNE COAST BIOREGION
Retained Species Commercial landings (season 2009):
Total 478 tonnes
Pink snapper 231 tonnes
Goldband snapper 144 tonnes
pangled emperor 3 tonnes
100 tonnes
e in
ther
e (2007/08):
nes
(oceanic stock) hing in Gascoyne waters
gulfs of Shark Bay). The recreational catch
.
23°34’S and 26°30’ S is ducted by SBSF licensed vessels. The SBSF
demersal Coast Bioregion
total of 802 days in waters between 23°34’S and 26°30’ S in th2009.
The level of effort target
y SBSF vessels that caught more than 4 t each of pink
SF vessels
Yes
es
t
y
quate
e)
d on an integrated
d
mass) would be essment is scheduled for 2012.
l,
of at
d.
ent
l to
S
Other species
The total commercial catch of 478 t taken in the Gascoyn2009 included 231 t of pink snapper (oceanic stock), 144 t ofgoldband snapper, 3 t of spangled emperor and 100 t of other scalefish species.
Of the total commercial catch, SBSF licensed vessels fishing within the waters of the SBSF caught 224 t of pink snapper (TACC = 277 t) plus 158 t of other species including 87 t of goldband snapper, 2 t of spangled emperor and 68 t of oscalefish species.
Recreational catch estimat
Pink snapper 71 tonnes
Goldband snapper 23 ton
peror 56 tonnes Spangled em
In 2007/08, an estimated 49 t of pink snapperwas taken by recreational vessels fis(excluding innerof pink snapper (oceanic stock) reported by licensed charter boats in 2009 was 15 t, a reduction on the 22 t reported in 2008.
An estimated 51 t of spangled emperor was taken by recreational vessels fishing in Gascoyne waters in 2007/08. The recreational catch of spangled emperor reported by charter boats in 2009 was 5 t (same in 2008).
An estimated 14 t of goldband snapper was taken by recreational vessels fishing in Gascoyne waters in 2007/08The recreational catch of goldband snapper reported by charter boats in 2009 was 8 t (9 t in 2008).
Fishing effort/access level
Commercial Commercial line fishing betweennow entirely conlanded 80% of the total commercial catch ofscalefish target species in the Gascoyne(includes pink snapper) in the 2009 season. At the start of the season there were 55 licences in the SBSF with a total of 14 vessels actively participating in fishing (21 vessels in 2008). These vessels fished for a
e period September 2008-August
ed at pink snapper by SBSF vessels varies on a seasonal basis, historically peaking in June–July, when pink snapper aggregate to spawn. Pink snapper catch
are assessed using ‘standard boat days’, i.e. days fishedrates b
snapper by line during the period June–July. SBfished for 257 boat days during June-July 2009 while targeting pink snapper.
Recreational Total recreational boat fishing effort (fisher days) across the entire Gascoyne in 2009 was likely to be similar to that estimated from the last recreational fishing survey (April 2007 - March 2008), i.e. ca. 240,000 fisher days.
Stock Assessment Assessment complete:
Pink snapper
Goldband snapper Y
Spangled emperor Yes
Assessment method:
Pink snapper Composite Assessmen
Catch Rates
Goldband snapper Fishing Mortality
Spangled emperor Fishing Mortalit
Breeding stock levels:
Pink snapper Recovering
Goldband snapper Adequate
Spangled emperor Ade
(overall, but declining in North Gascoyn
Pink snapper: A stock assessment baseage-structured model indicated that the spawning biomass of the oceanic pink snapper stock was at a depleted level in 2002-2003. The most recent assessment, that incorporatedata from the 2008 season, indicated that the spawning biomass in 2008 was close to the threshold level (30% of theunexploited spawning biomass). The model estimated that at 2008 harvest levels (total annual catch ca. 300 t), the target level (40% of the unexploited spawning bioreached by 2014. The next ass
Prior to the development of the integrated assessment modethe breeding stock was assessed using a pink snapper catchrate based on catch and effort information from the peak the spawning season (June-July) only. It is recognised ththe use of catch rate as an index of pink snapper abundance must be treated with caution, due to the aggregating behaviour of the species during the winter spawning perio
This indicator was used in the original EPBC Act assessmwith a trigger level set at a minimum of 500 kg pink snapper/standard boat day. The pink snapper catch rate in 2009 (SBSF licensed vessels fishing in June–July only) fel507 kg pink snapper/standard boat day (see box below).
124 DEPARTMENT OF FISHERIES
GASCOYNE COAST BIOREGION
Goldban r: Historical teBSF were to be uninformativ using f relative abundance. Catch rate data were not considered
this purpose because changing catch rates have likely reflected an increased market demand and concomitant changes in targeted fishing effort for this species. These historical data were also considered too coarse for a reliable analysis. Several more years of data collection from the daily trip logbooks (implemented in January 2008), will provide scope for analyses of an improved time series of catch rates for predicting trends in relative stock biomass.
A ‘weight of evidence’ approach, based on an assessment of fishing mortality (F) was used. Sufficient data from sampling the commercial fishing catches in both the 2006 and 2008 quota years were available for this analysis. Preliminary estimates of F for both years were within the target range, indicating that fishing is not currently having an unacceptable impact on the age structure of the population. However, while the breeding stock levels and fishing level are currently assessed as adequate, due to the limited data available, there is high uncertainty in the estimates.
The completed ‘weight of evidence’ assessment is pending external review and will be released as a Fisheries Research Report in late 2010.
Spangled emperor: Commercial catch rate data for spangled emperor were found to be uninformative as an index of abundance. A ‘weight of evidence’ approach, based on an assessment of fishing mortality, has been used in each of two study regions in the Gascoyne Coast Bioregion (North Gascoyne, South Gascoyne) using data collected primarily in 2007. Biological assessments have shown spangled emperor to be moderately long-lived (maximum age ca. 30 years). Individuals commence life as females, then either change sex to male or remain as female prior to reaching sexual maturity. The average length at sex change and length at female
observed age of 30 years ld. In the North Gascoyne, F was above the limit level,
that localised over-fishing is occurring north of oint Maud. Relatively few individual spangled emperor
older than 10 years old were sampled from the North Gascoyne in 2007, indicating that older fish had been
ry oo Marine Park. That F exceeded the
limit level indicates, given available evidence, that the current level of fishing on the spangled emperor population is too high in the North Gascoyne (i.e. unacceptable). The spangled empero
timated to be ce ev e n but noting significant reductions in the relative numbers of older (breeding ag gle ror No coyne due to ed d ns ( eclin norcom d ‘w of ev ce’ a ent nding ext wi lea a Fi Research Report in late 2010.
N e ed ecB s i egligible
The commercial catch consists of a large number of demersal species of medium to high market value; therefore there are few species captured by the fishery that are not retained.
Commercial operators must return any sharks caught and are not permitted to use wire trace, in order to minimise interactions with sharks.
Protected species interaction Negligible
The line fishing methods used do not catch protected species.
Ecosystem Effects Food chain effects Low
Pink snapper are generalist feeders and just one of a number of such species inhabiting the continental shelf waters in this Bioregion. Food chain effects due to fishing for pink snapper are considered to be low because the quota system restricts SBSF catches to a relatively small percentage of the total biomass. The juvenile and sub-adult components of the stock are likely subject to large, mostly-environmentally driven fluctuations in abundance even in the absence of fishing, due to significant variability in annual recruitment strength.
Habitat effects Negligible
The nature of the fishery, targeting aggregations of adult pink snapper and other demersal scalefish using hooks and lines, means that the commercial fishery has virtually no direct impact on habitat.
Social Effects
for deeper water species (goldband snapper, ruby snapper) throughout the rest of the year.
In 2009, 11 vessels fished for more than 10 days during the
The current performance measure for the Shark Bay removed by fishing, at least from areas outside of sanctuazones of the Ningal
Managed Snapper Fishery is that the pink snapper catch rate for the peak months (June–July) should not fall below a minimum trigger level of 500 kg pink snapper/standard boat day.
Catch rates steadily declined through the 1990s and early 2000s re w ofsnapper 20 inc e(TACC was reduced significantly in 2004), despite marked ch rates verWhile th re fall in, 507 kg p 2009, it remains level kg psnapper/standard boat day.
r population the Biore
is a gion. The
single g breeding s
enetic stock tock is esaching a lo 450 kg pink throughout
/standard boat day in 04. S e that tim at an ac ptable l el for th Bioregio overall
e) span d empe in the rth Gaslocalis
pleteepletioeight
i.e. diden
ing inssessm
th). The is pe
ernal revi
fluctuations, cat have increased o all. e catch rate has mostink snapper/standard boat day in
cently en aga to
above the trigger of 500 ink ew and ll be re sed as sheries
on-R tain Sp ies d snappe found
catch rae for
data fromas an ind
the ex ycatch pecies mpact NS
ouseful for
maturity were both shown to be below the current minimum legal size limit.
Estimates of fishing mortality (F) indicated that in the South Gascoyne, F was close to the target level, with many older fish collected, up to the maximum
The pattern of fishing by SBSF vessels in 2009 was similar to previous years and reflects the combination of focus on fishing for pink snapper during the peak season and fishing
oindicatingP
STATE OF THE FISHERIES AND AQUATIC RESOURCES REPORT 2009/10 125
GASCOYNE COAST BIOREGION
peak season with average crew of 2-3.
Fishing and associated fish processing are important sources
Economic Effects Estimated annual value (commercial sector)
(season 2009) $ 3.8 million
The overall value of the commercial component of the Gascoyne Demersal Scalefish Fishery (catch taken by SBSF and ‘open-access’ wetline vessels combined) was around $ 3.8 million in 2009 with $1.7 million from pink snapper and $2.0 million from all other scalefish species. Note: the estimated value of the commercial catch reported here includes all species landed and is based on entitlement (quota) year not financial year.
While a dollar value is difficult to assign to recreational and charter catches at this stage, the availability of demersal target species underpins the local tourism industry and generates significant income for the regional economy.
Fishery Governance Commercial: Current effort level (season 2009): Acceptable
Target catch (and effort) range:
Pink snapper 277 tonnes/380-540 days
In 2009, SBSF vessels required 442 boat days to catch 224 t of pink snapper (oceanic stock, TACC = 277 t). The available TACC was not entirely taken due to quota being left in the water by prawn/scallop vessels and a number of SBSF vessels not actively fishing for a range of reasons.
The average catch rate at 507 kg pink snapper/boat day for the 2009 season was above the EPBC Act performance measure (500 kg/standard boat day). This catch rate-based EPBC Act performance measure will be re-assessed when sufficient higher resolution (daily/trip catch and effort returns) data are available, possibly as part of the next EPBC Act review (due in 2014).
Recreational: Current effort level (2007/08):
Pink snapper Acceptable
Goldband snapper Acceptable
Spangled emperor
Unacceptable (North Gascoyne)
Acceptable (South Gascoyne)
Estimates of fishing mortality indicate localised over-fishing of spangled emperor is occurring north of Point Maud.
New management initiatives (2009/10)
The most recent stock assessment indicated that the spawning biomass of the oceanic pink snapper stock in 2008 had recovered to the threshold level (30% of unexploited level of
(all
el of spawning biomass) will be reached by 2014, which is within the agreed 10-year recovery timeframe. Based on this assessment, the Department indicated that the current TACC (277 t) would be retained for the 2009/10, 2010/11 and 2011/12 seasons; the assessment will be updated and consideration of management arrangements in early 2012 ahead of commencement of the 2012/13 season.
Concerns around the sustainability of fishing for deeper-water species (e.g. goldband snapper, ruby snapper, various cods) remain, largely due to uncertainty in the stock status of these species and their long-lived, slow growing life histories. As an interim measure, SBSF fishers initiated an effort day cap to control fishing effort in the SBSF until management arrangements for the Gascoyne Demersal Scalefish Fishery are implemented. The interim effort day cap was implemented through a licence condition on 1 January 2009 and restricts operators to a maximum of 30 fishing days in the fishery per 100 units of pink snapper quota held.
A Vessel Monitoring System (VMS) became operational in the SBSF in May 2008. A management plan introduced for the West Coast Demersal Scalefish Fishery (adjacent to the southern boundary of the SBSF) and compulsory VMS introduced for these operators in May 2008 has significantly improved the integrity of management arrangements for both Bioregions.
A state-wide recreational boat fishing license was in introduced in March 2010. The new licensing system will provide a database of boat fishers across Western Australia, which will assist in determining who is fishing, where they are fishing and what they are catching.
Reports on the stock status of the three demersal indicator species (pink snapper, goldband snapper and spangled emperor) will be made available in late 2010 following external review. The information contained in these reports will used as the basis for management recommendations, to be developed in conjunction with stakeholders in 2010/11, as part of the IFM process in the Gascoyne.
External Factors Under the Offshore Constitutional Settlement, commercial trawlers licensed by the Commonwealth may operate in waters outside the 200 m isobath as part of the Western Deepwater Trawl Fishery (WDWTF). Information on catches of pink snapper or other key species taken or returned by WDWT vessels in 2009 is not available (last reported catch of pink snapper was <0.5 t in 2006).
Climate change has the potential to impact fish stocks in range of ways including influencing their geographic distribution (latitude shift) with temperate species such as pink snapper likely to shift southwards. A review of the impacts and responses to marine climate change in Australia has recently been undertaken by CSIRO, and is available at www.oceanclimatechange.org.au.
of local employment in Denham and Carnarvon.
Recreational fishing in Shark Bay and Ningaloo are very popular activities in this region, including being major tourist attractions especially during the winter months and school holidays.
spawning biomass). At a level of annual catch of ~300 tsectors combined), the model projected that the target level (40% of unexploited lev
126 DEPARTMENT OF FISHERIES
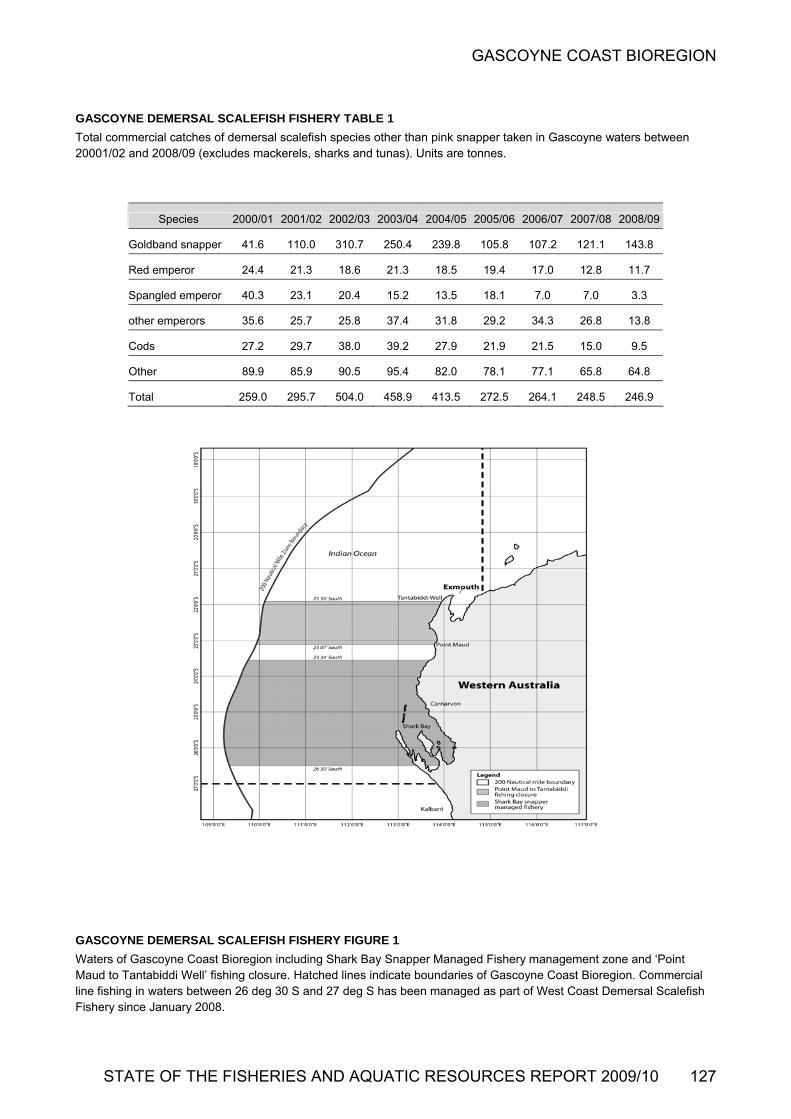
GASCOYNE COAST BIOREGION
GASCOYNE DEMERSAL SCALEFISH FISHERY TABLE 1
Total commercial catches of demersal scalefish species other than pink snapper taken in Gascoyne waters between mackerels, sharks and tunas). Units are tonnes.
20001/02 and 2008/09 (excludes
r Managed Fishery management zone and ‘Point undaries of Gascoyne Coas
GASCOYNE DEMERSAL SCALEFISH FISHERY FIG
Waters of Gascoyne Coast Bioregion including Shark BaMaud to Tantabiddi Well’
URE 1
y Snappefishing closure. Hatched lines indicate bo t Bioregion. Commercial
S has beeline fishing in waters between 26 deg 30 S and 27 deg Fishery since January 2008.
n managed as part of West Coast Demersal Scalefish
Species 2000/01 2001/02 2004/05 2005/06 2006/07 2002/03 2003/04 2007/08 2008/09
Goldband snapper 41.6 110.0 310.7 250.4 239.8 105.8 107.2 121.1 143.8
Red emperor 24.4 21.3 18.6 21.3 18.5 19.4 17.0 12.8 11.7
Spangled emperor 40.3 23.1 20.4 15.2 13.5 18.1 7.0 7.0 3.3
other emperors 35.6 25.7 25.8 37.4 31.8 29.2 34.3 26.8 13.8
Cods 27.2 29.7 38.0 39.2 27.9 21.9 21.5 15.0 9.5
Other 82.0 78.1 77.1 65.8 64.8 89.9 85.9 90.5 95.4
Total 458.9 5 246.9 259.0 295.7 504.0 413.5 272.5 264.1 248.
STATE OF THE FISHERIES AND AQUATIC RESOURCES REPORT 2009/10 127
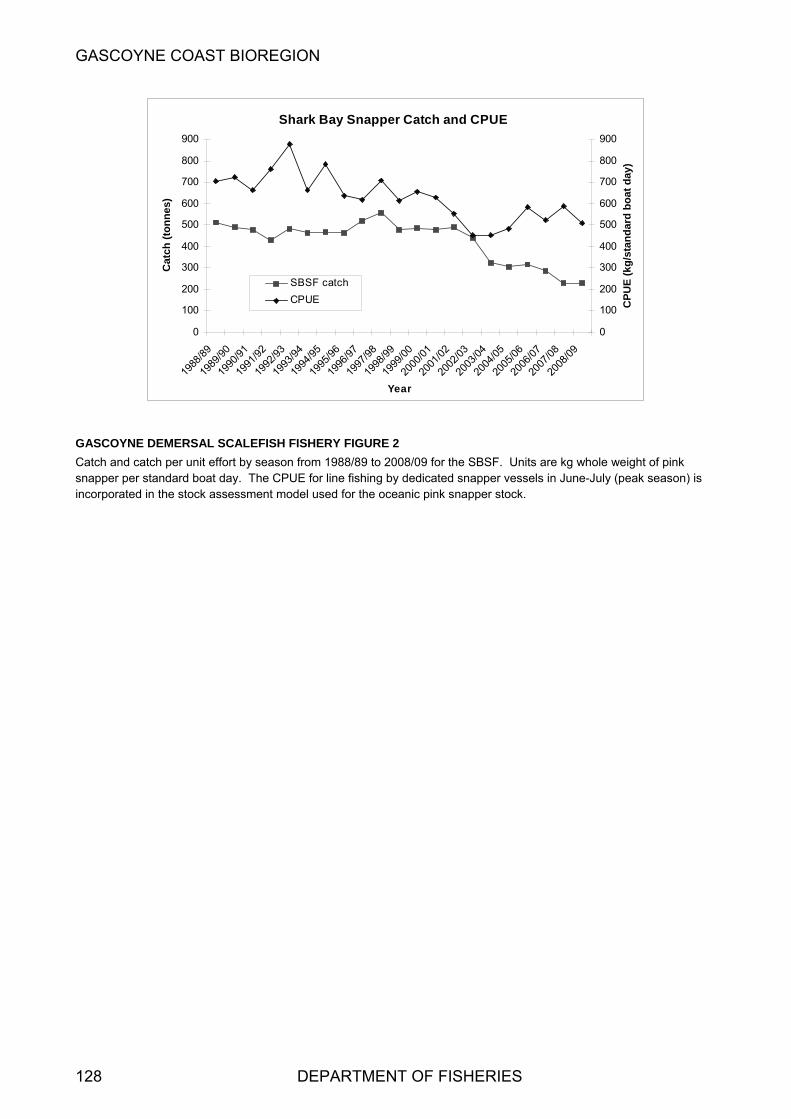
GASCOYNE COAST BIOREGION
Shark Bay Sn
800
900
apper Ca
500
700
198
1989
/9
1990
1991
/999
2/9
1993
/94
994/
95
1995
/96
1996
/97
997/
98
1998
/99
1999
/00
2000
/
tch and CPUE
600
700
800
900
0
100
200
300
400
8/89 0
/91 2 3
Cat
ch (
ton
nes
) 600
1 1 1
011/
022/
033/
044/
055/
066/
077/
088/
09
200
Year
400
500
stan
dar
d b
oat
day
)
200
200
200
200
200
200
200
0
100
200
300
CP
UE
(kg
/
SBSF catch
CPUE
GASCOYNE DEMERSAL SCALEFISH FISHERY FIG
Catch and catch per unit effort by season from 1988/89 to snapper per standard boat day. The CPUE for line fishin
URE 2
2008/0g by de is
eanic
9 for the SBSF. Units are kg whole weight of pink dicated snapper vessels in June-July (peak season) pink snapper stock. incorporated in the stock assessment model used for the oc
128 DEPARTMENT OF FISHERIES
GASCOYNE COAST BIOREGION
Inner Shark Bay Scalefish Fishery
eine and Mesh Net Managed Fishery
ority
ish Resources Management Act 1994 and subsidiary
ee and Regional Recreational Fishing Advisory Committees
Future consultation process to be est.
Status Report
fishers also take significant numbers of blue swimmer crabs, mostly in the Eastern Gulf.
A limited number of licensed charter vessels operate out of Denham (mostly fishing in the oceanic waters off Cape Inscription) and Monkey Mia.
G Jackson and J Norriss
Management input from M Stadler
Main Features
Status Current Landings
Commercial (2009) Stock level:
Whiting Adequate
Fishery Description The Inner Shark Bay Scalefish Fishery encompasses commercial and recreational fishing for scalefish species within the waters of the Eastern Gulf, Denham Sound and Freycinet Estuary in inner Shark Bay (Inner Shark Bay Fishery Figure 1). This includes the activities of the Shark Bay Beach S(SBBSMNF) and the Inner Shark Bay Recreational Fishery.
The SBBSMNF operates from Denham and uses a combination of beach seine and haul net gears to mainly takefour species/groups: whiting (Sillago schomburgkii and S. analis), sea mullet (Mugil cephalus), tailor (Pomatomus saltatrix) and yellowfin bream (Acanthopagrus latus).
Most recreational fishing is boat-based using rod & line or handline. The key recreational species are black snapper (grass or blue-lined emperor, Lethrinus laticaudis), western butterfish (Pentapodus vitta), whiting (Sillago spp.), pink snapper (Pagrus auratus), Queensland school mackerel (Scomberomorus queenslandicus), tailor, and blackspot tuskfish (bluebone, Choerodon schoenleinii). Recreational
Governing legislation/fishing auth
Commercial Shark Bay Beach Seine and Mesh Net Management Plan
1992
Shark Bay Beach Seine and Mesh Net Managed Fishery Licence
Recreational F
legislation
Consultation process
Commercial Department–industry meetings
Recreational Prior to 2010 - Recreational Fishing Advisory Committ
(Denham, Carnarvon). facilitated by RecFishW
Direct consultation with local community on specific issues (e.g. Shark Bay Inner Gulf Pink Snapper Working Group, convenes every 3 years)
Mullet Adequate
Adequate
Adequate
Pink snapper Ea
t
t
17 t
8 t
Pink Snapper 1 t
)
9)
7)
Whiting 112
Mullet 104
Tailor
Yellowfin bream
Tailor
Yellowfin bream
stern Gulf – Adequate
Denham Sound – Adequate
Freycinet Estuary – Recovering Recreational (Pink Snapper only)
Fishing Level:
Whiting Acceptable
Mullet Acceptable
Tailor Acceptable
Yellowfin bream Acceptable
Pink snapper Eastern Gulf – Acceptable
Denham Sound – Acceptable
Freycinet Estuary – Acceptable
Eastern Gulf 4 t (2007)
Charter 1 t (2009
Denham Sound 4 t (2007)
Charter 0.5 t (200
Freycinet 2 t (200
STATE OF THE FISHERIES AND AQUATIC RESOURCES REPORT 2009/10 129
GASCOYNE COAST BIOREGION
Boundaries
The areas covered by this report are shown in Inner Shark re 1. Fishing is not permitted in the Hamelin
ommercial ugh input controls in the strictions (e.g. vessel size,
one
e-fishing for pink snapper and other species
d are
Gulf, Denham Sound and Freycinet
nnes (approx. 12 tonnes recreational, 3 nnes commercial)
12 tonnes recreational, 3
costseparately assess the status
08 (next
ulsory monthly catch
ch ating back to the 1960s. Performance indicators for the BBSMNMF were determined as part of an ESD risk-based ssessment that was undertaken in 2002-03 for Departmental urposes.
esearch on pink snapper in the inner gulfs is now largely monitoring (daily egg production method
EPM] surveys to estimate spawning biomass pproximately every 3-5 years). At the last meeting of the
le the stock e updated prior to their next scheduled
ed recreational fishing s at the three main
completed in December
104 tonnes
ailor 17 tonnes
8 tonnes
7
uding 1 t of pink snapper (taken as
onnes
es
nes
s
the TAC-based management in 2003, recreational
tuary are assumed to be milar to recent years.
pink snapper was taken in the am Sound by licensed charter
.
In 2009, of the 12 SBBSMNF licenses, seven vessels were actively involved in fishing.
Fishing effort in the SBBSMNF declined slightly (7%) in 2009 (1,118 boat days) compared with 2008 (1,200 boat days).
Recreational In 2007, boat-based recreational fishing effort in the inner gulfs was estimated at approximately 33,000 fisher days.
Bay Fishery FiguPool Marine Nature Reserve.
Management arrangements
CThe SBBSMNF is managed throform of limited entry and gear renet length and mesh size). A unit in the fishery comprisesprimary vessel, a maximum of three netting dinghies and a maximum fishing team of three individual fishers. Commercial linhas not been permitted in these waters since 1996 (see ‘Gascoyne Demersal Scalefish Fishery’).
Recreational For most species, the recreational fishery is managed using the normal combination of daily bag, possession, size angear limits. For pink snapper more complex arrangementsused within the EasternEstuary (Inner Shark Bay Fishery Figure 1). These stocks are managed separately with explicit total allowable catches (TACs). In 2008, the TACs for pink snapper were as follows:
Eastern Gulf – 15 toto
Denham Sound – 15 tonnes (approx.tonnes commercial)
Freycinet Estuary – 5 tonnes (approx. 1,400 fish, i.e. 1,050 recreational and 350 commercial)
Research summary
Pink snapper in the inner gulfs have been the focus of mprehensive research since 1996/97. Integrated age-
ructured stock assessment models have been used to of the Eastern Gulf, Denham
Sound and Freycinet Estuary stocks, and to determine appropriate levels of TAC since 2002. These assessments are updated every 3 years, most recently in 20assessment is scheduled for 2011).
Estimates of recreational catch and effort were derived from annual surveys (except 1999/00) involving interviews withboat crews returning to the Monkey Mia, Denham, and Nanga boat ramps between 1998/99 and 2007/08.
The catch by species for licensed commercial and charter fishing vessels is derived from compreturns. The status of the four SBBSMNMF target species(whiting, sea mullet, tailor and yellowfin bream) is monitoredeach year using data from commercial catch returns coupled with the extensive scientific knowledge gained from resear
Shark Bay Inner Gulf Pink Snapper Working Group (June 2008), the Department committed to completing a DEPM survey in each of the three areas to enabassessments to bmeeting in 2011. A survey of boat-basin inner Shark Bay involving interviewboat ramps commenced in January 2010 and will be
2010.
Retained Species Commercial landings (season 2009):
Whiting 112 tonnes
Mullet
T
Yellowfin bream
Pink snapper 1 tonne
The total commercial catch taken by SBBSMNF licensed vessels in 2009 was 251 t, a decline on the 269 t taken in 2008. This comprised 112 t of whiting, 104 t of sea mullet, 1t of tailor, 8 t of yellowfin bream and 10 t of other mixed scalefish species inclbycatch by net fishing gears).
Last available recreational catch estimates (including charter, season 2007)
Pink snapper Eastern Gulf 4.5 t
Denham Sound 4 tonn
Freycinet Estuary 2 ton
Black snapper 14 tonne
As a direct result of management intervention, including introduction ofcatches of pink snapper decreased significantly after 1998. While no recreational fishing survey was conducted in 2009, recreational catches of pink snapper in the Eastern Gulf, Denham Sound and Freycinet Essi
In 2009, approximately 1 t of Eastern Gulf and 0.5 t in Denhvessels; no catches from the Freycinet Estuary were reportedNo catches of black snapper were reported by charter vesselsin 2009.
Fishing effort/access level
Commercial
dSap
Rrestricted to [Da
130 DEPARTMENT OF FISHERIES
GASCOYNE COAST BIOREGION
Stock Assessment ssessment complete
Yes
Pink snapper Yes (2007)
ent method:
et/Ta /YF Bre
ink snapper Composite Assessment
lack snapper Fishing Mortality
reeding stock levels
Whiting Adequate
Mullet Adequate
Tailor Adequate
Yellowfin bream Adequate
Pink snapper Eastern Gulf – Adequate
Denham Sound - Adequate
Freycinet - Recovering
Black snapper Adequate
Whiting, Mullet, Tailor, Yellowfin bream: Assessment of the four main SBBSMNF target species is based on annual analysis of the commercial catch and effort data. A target range of annual catch and a CPUE trigger level have been determined for the fishery overall and for each species separately.
The total catch (all species) was 251 tonnes in 2009 and was within the target range (235–335 tonnes). The overall CPUE of 224 kg/boat day (all species) was slightly below the long-term average since 1990 (230 kg/boat day). The catch and CPUE for whiting (112 tonnes, 100 kg/boat day), mullet (104 tonnes, 93 kg/boat day) and yellowfin bream ((8 tonnes, 7 kg/boat day) were all within the respective target (catch) ranges and above the minimum (CPUE) trigger levels in 2009 (Inner Shark Bay Fishery Table 1). However, the tailor catch (17 tonnes) was again below the target range and the CPUE (15 kg/boat day) still below the minimum trigger level. While some reduction in natural abundance cannot be discounted, low tailor catches can mostly be attributed to local processing restrictions.
Pink snapper: DEPM surveys that directly estimate pink g biomass were conducted annually in the
astern Gulf, Denham Sound and Freycinet Estuary during
been conducted each year since 1996. Integrated age-
structured assessment models have been used to assess the status of the three stocks in relation to the management target (40% of the unexploited spawning biomass) since 2002. These assessments are now updated every 3 years (in 2005 and 2008).
The most recent assessments (2008) estimated the spawning
astern Gulf and Denham Sound but remained below the threshold level (30%) in Freycinet; however the spawning stock is rebuilding and is projected to reach the arget el 2 wi babi
Black sn per: Bas age- dat llected2005, fishing mort F) wa ated to undthresho vel (F=M, natural mortality). Minformation on F for this species is not available.
Non- ed Species Bycatch species impact Low
Bycatch is minimal in the SBBSMNF because netting operations selectively target specific schools of fish. Based on experience, fishers can determine the species and size of the school, and the size of individual fish within the school, before deploying the net. Fish are readily observed in the very shallow near-shore waters of Shark Bay. Non-target species and under-sized fishes are avoided in most cases.
Protected species interaction Negligible
As nets are actively set and hauled, if any protected species such as dugongs, dolphins or marine turtles are caught (a rare event) they are immediately released.
Ecosystem Effects Food chain effects Low
The overall catch levels in the fishery have been relatively stable over several decades, despite a long-term reduction in effort, suggesting that recruitment of the main target species has not been significantly affected by fishing mortality. The total biomass of the key target species appears sufficient to maintain trophic function in these waters.
Habitat effects Negligible
Seine nets are set and hauled over shallow sand banks, including intertidal areas. Sand habitats are naturally dynamic environments with resident infauna adapted to cope with regular physical disturbances. Combined with the low frequency of fishing in any one location, this indicates that the fishery would have no lasting effect on the habitat.
Social Effects Commercial Currently around 20 fishers are employed in the SBBSMNF based on 7 managed fishery licenses actually operating.
iated fish processing is an important source of local employment - the fishery, although relatively small-
A
Whiting
Mullet Yes
Tailor Yes
Yellowfin bream Yes
biomass of pink snapper was above the target level (40%) inboth the E
Black snapper Yes (2005)
Assessm
Whiting/Mull ilor am
Catch, Catch Rate
P
B
B
snapper spawninEthe period 1997-2004 and periodically since. Research trawl surveys, to monitor variation in juvenile recruitment, have Fishing and assoc
t (40%) lev by 201 th a pro lity of 80%.
ap ed on ality (
structures estim
a co be aro
in the
ld le ore recent
Retain
STATE OF THE FISHERIES AND AQUATIC RESOURCES REPORT 2009/10 131

GASCOYNE COAST BIOREGION
scale, makes a significant contribution to the Denham conomy and community.
ecreational is a very popular tourist destination, especially
uring the winter months and school holidays: data indicate at approximately 30% of all visitors participate in creational fishing during their stay.
conomic Effects
ommercial he overall value of the SBBSMNMF in 2009 was estimated t $1.50 million and includes catch values of $870,000 for
0 for sea mullet, $40,000 for yellowfin ream and $83,000 for tailor. Note: the estimated value of e commercial catch reported here includes all species nded and is based on calendar year not financial year.
Recreational While a dollar value is difficult to assign to recreational and charter catches, the availability of quality fishing underpins the tourism industry and generates significant income for the regional economy.
Fishery Governance Commercial Current effort level (2009): Acceptable
Target catch range (2009):
All species (ex Pink snapper) 235–335 tonnes
Pink snapper Eastern Gulf 3 tonnes
Denham Sound 3 tonnes
Freycinet 1.2 tonnes
Total fishing effort in SBBSMNMF declined by 7% (to 1,118 boat days) in 2009 compared with 2008.
The total commercial catch in 2009 was 251 t, i.e. within the acceptable target range (235–335 t). Acceptable catch ranges for the four main target species (Inner Shark Bay Fishery Table 1) were developed, based on catch data from 1990-2003, to incorporate natural variations in stock abundance in the acceptable catch levels. At this time, this fishery is considered to have a low risk in terms of sustainability, and a low research/management priority.
Commercial catches of pink snapper taken as bycatch by SBBSMNMF vessels in 2009 were less than 1 tonne overall, i.e. well within their allocation within the respective pink
snapper TACs, with 0.5 tonne from the Eastern Gulf and 0.5 tonne from Denham Sound. No catch of pink snapper was recorded from the Freysinet Estuary.
Recreational Target catch range (2009):
Pink snapper Eastern Gulf 12 tonnes
Denham Sound 12 tonnes
Freycinet Estuary 3.8 tonnes
Catches of pink snapper taken by recreational vessels in 2009
tags were allocated to recreational fishers In 2009 via the lottery.
New management initiatives (2009/10)
As an outcome of the ‘Wetline Review’ (see Fisheries Management Paper No. 224 for details), a management plan will be developed for the proposed Gascoyne Inshore Net Fishery. The Plan may incorporate the existing SBBSMNF, the Exmouth Gulf Beach Seine Fishery and commercial net fishing in the Carnarvon area as separate zones under a single management plan.
Exemptions (administered through the Denham Fisheries Office), that previously had allowed recreational fishers to land more pink snapper than the Shark Bay inner gulf bag limit when the fish were caught in oceanic waters and landed at Denham no longer apply.
A state-wide recreational boat fishing license was in introduced in March 2010 which includes the majority of recreational fishing activities in Shark Bay. The new licensing system will provide a database of boat fishers across Western Australia, which will assist in determining who is fishing, where they are fishing and what they are catching.
Integrated Fisheries Management (IFM) in the Gascoyne is scheduled to begin in 2011 and will include consideration of the inner Shark Bay Fishery and other scalefish fisheries in the Gascoyne Coast Bioregion.
External Factors The inner Shark Bay environment is particularly stable as a result of its low-rainfall, arid environment. The abundances of some target species tend to be relatively stable with fishery production mostly determined by levels of fishing effort. However, species including pink snapper, yellowfin bream and possibly tailor appear to be influenced by environmentally driven variations in recruitment.
e
RShark Baydthre
EEstimated annual value (commercial sector)
(2009) $1.50 million are not known but assumed to be similar to those in recent years. A totla of 950 Freycinet Estuary management quota
CTawhiting, $468,00bthla
132 DEPARTMENT OF FISHERIES

GASCOYNE COAST BIOREGION
INNER SHARK BAY SCALEFISH FISHERY TABLE 1
Annu ort (kg/boat day) and minimum CPUE trigger levels for key species taken by Shark Bay Beach S aged Fishery vessels for the peri d 2001-2009.
al catch per unit effeine and Mesh Net Man o
INNER SHARK BAY SCALEFISH FISHERY FIGURE 1 he commercial (scaleT fish) and recreational fishing areas of inner Shark Bay. .
Trigger 2005 2006 2007 2008 2009 Species 2001 2002 2003 2004
Level
W 114 hiting 75 92 79 86 102 110 100 98 100
M 137 ullet 62 93 80 120 74 60 90 89 93
T 23 ailor 20 21 21 22 17 20 22 19 15
Bream 5 6.2 13 19 26 23 22 14 6 7
STATE OF THE FISHERIES AND AQUATIC RESOURCES REPORT 2009/10 133
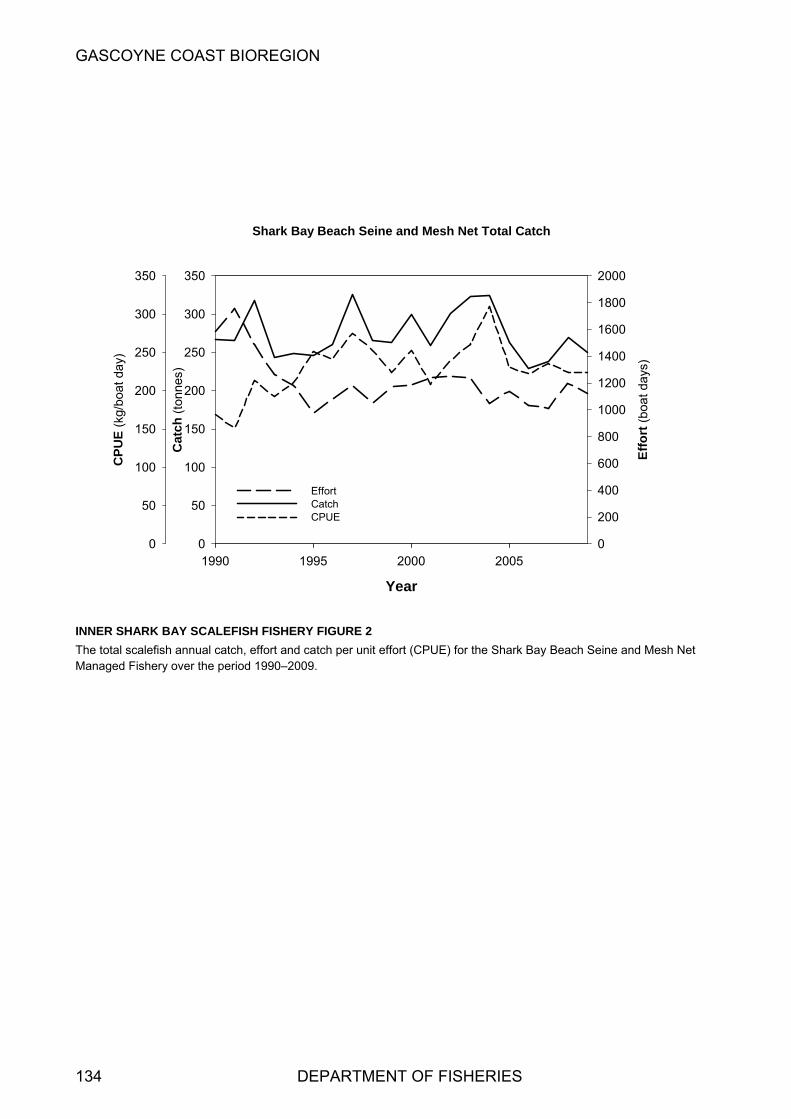
GASCOYNE COAST BIOREGION
Shark Bay Beach Seine and Mesh Net Total Catch
Year
1990 1995 2000 2005
Eff
ort
(bo
at
days
)
0
200
400
600
800
1000
1200
1400
1600
1800
2000
Cat
ch
(to
nnes
)
0
50
100
150
200
250
300
350
CP
UE
(kg
/boa
t da
y)
0
150
200
250
300
350
50
100
EffortCatchCPUE
INNER SHARK BAY SCALEFISH FISHERY FIGURE 2
nit effort (C Beach Seine and Mesh Net The total scalefish annual catch, effort and catch per uManaged Fishery over the period 1990–2009.
PUE) for the Shark Bay
134 DEPARTMENT OF FISHERIES
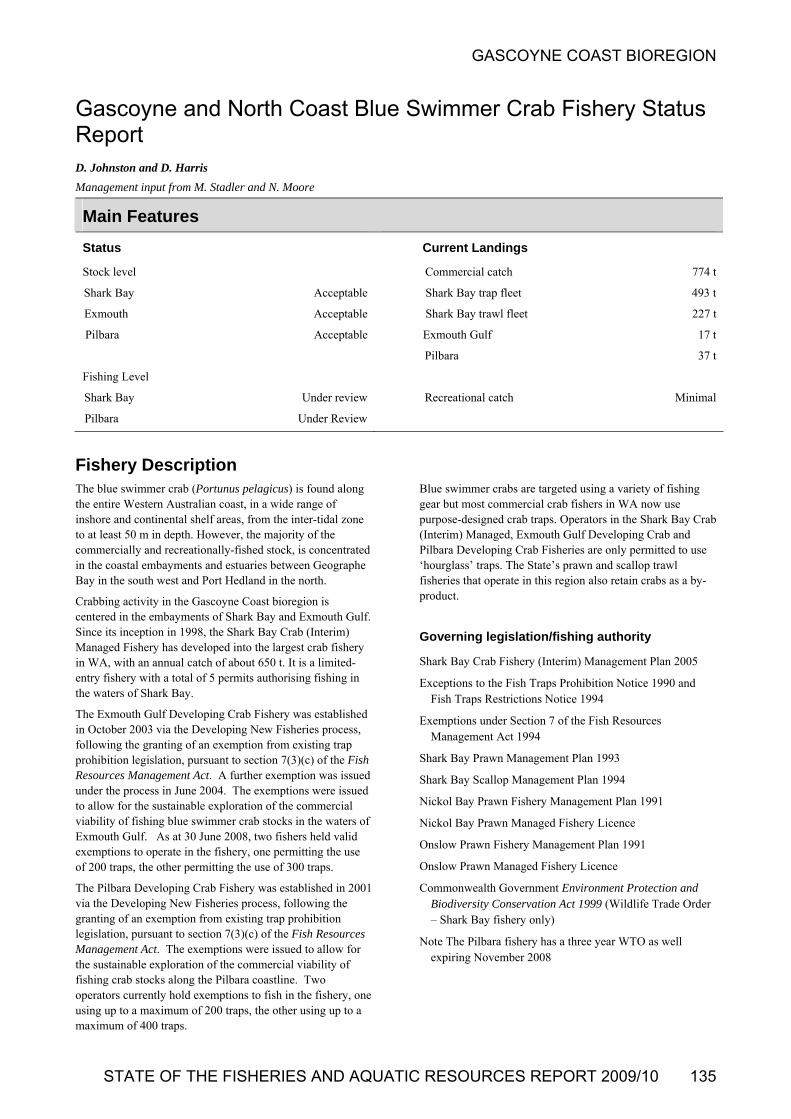
GASCOYNE COAST BIOREGION
Gascoyne and North Coast Blue Swimmer Crab Fishery Status Report D. Johnston and D. Harris
Management input from M. Stadler and N. Moore
Main Features
Status
Stock level
Shark Bay Acceptab
Exmouth
le
Acceptable
le
Under Review
t
227 t
t
37 t
l
Pilbara Acceptab
Fishing Level
Shark Bay Under review
Pilbara
Current Landings
Commercial catch 774
Shark Bay trap fleet 493 t
Shark Bay trawl fleet
Exmouth Gulf 17
Pilbara
Recreational catch Minima
Fishery Description The blue swimmer crab (Portunus pelagicus) is found along the entire Western Australian coast, in a wide range of inshore and continental shelf areas, from the inter-tidal zone
ered in the embayments of Shark Bay and Exmouth Gulf. ince its inception in 1998, the Shark Bay Crab (Interim)
loped into the largest crab fishery
as issued
f. As at 30 June 2008, two fishers held valid e
1
of ocks along the Pilbara coastline. Two
y, one to a
traps.
lue swimmer crabs are targeted using a variety of fishing hers in WA now use ators in the Shark Bay Crab Developing Crab and
only permitted to use
overning legislation/fishing authority
erim) Management Plan 2005
Exceptions to the Fish TrFish Traps Restrictions Notice 1994
Fish Resources
Bgear but most commercial crab fispurpose-designed crab traps. Oper(Interim) Managed, Exmouth GulfPilbara Developing Crab Fisheries are‘hourglass’ traps. The State’s prawn and scallop trawl fisheries that operate in this region also retain crabs as a by-product.
G
to at least 50 m in depth. However, the majority of the commercially and recreationally-fished stock, is concentrated in the coastal embayments and estuaries between Geographe Bay in the south west and Port Hedland in the north.
Crabbing activity in the Gascoyne Coast bioregion is centSManaged Fishery has devein WA, with an annual catch of about 650 t. It is a limited-entry fishery with a total of 5 permits authorising fishing in the waters of Shark Bay.
The Exmouth Gulf Developing Crab Fishery was establishedin October 2003 via the Developing New Fisheries process, following the granting of an exemption from existing trap prohibition legislation, pursuant to section 7(3)(c) of the FishResources Management Act. A further exemption wunder the process in June 2004. The exemptions were issued to allow for the sustainable exploration of the commercial viability of fishing blue swimmer crab stocks in the waters of Exmouth Gulexemptions to operate in the fishery, one permitting the usof 200 traps, the other permitting the use of 300 traps.
The Pilbara Developing Crab Fishery was established in 200via the Developing New Fisheries process, following the granting of an exemption from existing trap prohibition legislation, pursuant to section 7(3)(c) of the Fish ResourcesManagement Act. The exemptions were issued to allow for the sustainable exploration of the commercial viabilityfishing crab st
Shark Bay Crab Fishery (Int
aps Prohibition Notice 1990 and
Exemptions under Section 7 of the Management Act 1994
Shark Bay Prawn Management Plan 1993
Shark Bay Scallop Management Plan 1994
Nickol Bay Prawn Fishery Management Plan 1991
Nickol Bay Prawn Managed Fishery Licence
Onslow Prawn Fishery Management Plan 1991
Onslow Prawn Managed Fishery Licence
Commonwealth Government Environment Protection and Biodiversity Conservation Act 1999 (Wildlife Trade Order – Shark Bay fishery only)
Note The Pilbara fishery has a three year WTO as wellexpiring November 2008
operators currently hold exemptions to fish in the fisherusing up to a maximum of 200 traps, the other using up maximum of 400
STATE OF THE FISHERIES AND AQUATIC RESOURCES REPORT 2009/10 135

GASCOYNE COAST BIOREGION
Consultation process
Meetings between the Department of Fisheries and industry
Meetings with Regional Recreational Fishing Advisory Committees (future consultations to be facilitated by RecFishWest).
The Exmouth Gulf Developing Crab Fishery operates souof a line drawn between the northern most point of North West Cape and Locker Point, and within waters east of a line drawn due north from Point Murat (21° 48.90’ south latitude and 114° 11.46’ east longitude) and west of 115° 06.5’ east longitude (Onslow).
Crabbing activity along the Pilbara coast is centred larg
B
Tw ier aSPis n.
th
ely on
llop,
vant status report elsewhere within
s ents
he
ily
e the size at
Shark Fishery (Interim) Management Plan 2005 which
e
r,
n
cated elsewhere.
second comprehensive Ecologically Sustainable ay fishery was Department of the
rk-
t on or 40
patial
the
f also
k Bay.
ome base-line information on the biology and ecology of erated by a number of ent Corporation (FRDC)-
y.
ta 2009 suggests that the size
ructure of the blue swimmer crab population still appears
oundaries
he Shark Bay Crab Interim Managed Fishery covers the aters of Shark Bay north of Cape Inscription , to Bern
nd Dorre Islands and Quobba Point (Gascoyne Coast Blue wimmer Crab Figure 1). In addition, two Shark Bay Crab ermit holders with long-standing histories of targeting crabs
n Shark Bay are permitted to fish in the waters of Shark Bay outh of Cape Inscriptio
the inshore waters from Onslow through to Port Hedland, with most commercial and recreational activity occurring in and around the embayment of Nickol Bay.
The boundaries of the Shark Bay Prawn, Shark Bay ScaExmouth Gulf Prawn, Onslow Prawn and Nickol Bay Prawn Managed Fisheries which also capture crabs as by-product are described in the relethis document.
Management arrangements
Commercial access to blue swimmer crab stocks in WA igoverned by a series of separate management arrangemprovided for under the legislative framework of the Fish Resources Management Act 1994. Individual fisheries are managed under an input control system, primarily through tregulation of vessel and trap numbers. Supplementary controls cover retainable species and associated minimum size limits, gear specifications, and area, seasonal and datime restrictions.
The principal management tool employed to ensure adequatebreeding stock in the commercial crab fisheries involves maintaining minimum size limits well abovsexual maturity. Male blue swimmer crabs in Shark Bay become sexually mature at 115 mm carapace width, while females become sexually mature below 100 mm carapace width. The commercial minimum size of 135 mm carapace width should ensure adequate egg production for associated blue swimmer crab stocks under typical environmental conditions.
Five crab trap peermits operate in Shark Bay under the Bay Crabsets the number of traps that can be fished, fishery specific spatial closures, gear specifications and other controls. Two permit holders also have a Fishing Boat Licence (FBL) condition that allows them to fish no more than 200traps south of Cape Peron (south of the existing waters of th
SBCIMF). The FBL condition reflects a long-standing history of these two operators fishing in this area. Howeveat no time may more than 300 traps in total be used by eachof these operators across all of the waters of Shark Bay.
The management arrangements for the Exmouth Gulf and Pilbara Developing Crab Fisheries are set by conditions othe exemptions and are aimed at ensuring the stock and environment are protected. The management measuresinclude gear restrictions, a minimum size limit, spatial closures and reporting requirements. While a maximum of 600 pots are permitted in the fishery, only 400 traps may be used in Nickol Bay.
Management controls for the various prawn trawl fisheries that capture crabs are lo
ADevelopment assessment of the Shark Bcompleted in 2007. The CommonwealthEnvironment, Water, Heritage and the Arts approved the fishery to export product for a further three years, subject toseveral conditions and recommendations - for details refer tohttp://www.environment.gov.au/coasts/fisheries/wa/shabay/index html.
Recreational fishing for blue swimmer crabs in WA is managed through a series of input and output controls. As with commercial fishing, the principal management tool employed to sustain an adequate breeding stock involves maintaining minimum size limits well above the size at sexual maturity. A minimum legal size limit of 127 mm carapace width applies in the waters of the Gascoyne Coasbioregion, along with a bag limit of 20 crabs per perscrabs per boat. Restrictions also govern gear types that can beused to take blue swimmer crabs, along with localised sand temporal closures.
Research summary
Data for the assessment of blue swimmer crab stocks in Gascoyne and North Coast bioregions are obtained from fishers’ compulsory catch and effort returns and voluntarydaily log books. Department of Fisheries’ research stafconduct quarterly catch monitoring surveys aboard commercial crab trap vessels in Shar
Sblue swimmer crabs has been genFisheries Research and Developmfunded projects conducted by the Department of Fisheries and Murdoch University over the past decade. An FRDC project completed in early 2005 produced a preliminary stock assessment of the Shark Bay blue swimmer crab fisher
A review of the available blue swimmer crab research dafor Shark Bay conducted insthealthy but an accurate assessment of sustainable catch levels could not be provided due to insufficient scientific data. As a result of this uncertainty, management options for the commercial trap and trawl sectors are being considered untila more robust stock assessment can be completed.
136 DEPARTMENT OF FISHERIES
GASCOYNE COAST BIOREGION
Retained Species Commercial landings (season 2008/09):
774 tonnes (total)
hark Bay trap fleet 493 tonnes
t 227 tonnes
t
t year’s catch of 770 t.
he annual blue swimmer crab catch from the Shark Bay s 493 t, marginally lower Gascoyne Coast Blue
s by the Shark
s
from e
y
l
ey nal blue swimmer catch estimate of 968
g, representing less than 1% of the total catch. Most of the Shark Bay. A survey was conducted in
March 2008,
from creational surveys targeting pink snapper. Data collected
n
om , as commercial operations targeting
l
tches.
by
along the Pilbara coast was
tock Assessment
ed)
s
Acceptable
ptable
to maintain a
onducted since 1998, with consistent size distributions being the fishery.
the t
S
Shark Bay trawl flee
Exmouth Gulf 17 tonnes
Pilbara 37 tonnes
The total combined catch for the Gascoyne and North Coasbioregions during 2008/09 was 774t, which accounted for 91% of the state catch of blue swimmer crabs. This was similar to las
Tcrab trap fishery for 2008/09 wathan the 2007/08 catch of 514 t (Swimmer Crab Figure 2, 3). Landings of crabBay prawn trawl fleet were 227 t in 2008/09, similar to the 223 t for 2007/08.
A total of 17 t of blue swimmer crabs was landed in the Exmouth Gulf region during 2008/09, similar to the previouyear’s catch of 18 t (Gascoyne Coast Blue Swimmer Crab Figure 2). All of this crab catch for Exmouth was landed as by-product from prawn trawlers, with no commercial trap fishing undertaken in Exmouth Gulf during 2008/09. The trap fishery was formally closed in June 2009.
The combined commercial catch of blue swimmer crabsdedicated crab fishers and prawn trawlers operating along thPilbara coast during 2008/09 was 37 t, compared to the verlow catch of 14 t caught in 2007/08 (Gascoyne Blue Swimmer Crab Figure 4).
Recreational catch:
Gascoyne Bioregion < 1 % of total
Pilbara coast approximately 35% of tota
A recreational survey monitoring crabbing in the Gascoyne Coast bioregion was carried out during 1998/99. The survprovided a recreatiokrecreational catch was taken in innersubsequent recreational fishing creelthe Gascoyne region between March 2007 andand analysis of the collected data is expected to be published in 2010/11.
Information on recreational blue swimmer catches in the inner gulfs of Shark Bay has also been extractedrealso indicated that the recreational crab catch was minimal compared with the take by commercial fishers operating in the gulfs. The surveys provided estimates of 0.7 t, 1.7 t and1.3 t of blue swimmer crabs taken by recreational fishers ithe gulfs for the 2005, 2006 and 2007 calendar years, respectively.
A small amount of recreational crabbing also occurs in Exmouth Gulf.
A survey of recreational crabbing in Nickol Bay estimated a recreational catch of blue swimmer crabs of 20 t for the 2000
calendar year. This represented the majority of the catch frNickol Bay in that yearblue swimmer crabs in the area did not begin until the following year. No further surveys quantifying recreationacatch have been undertaken since the 2000 survey. If this level of recreational effort has been maintained and the abundance has been consistent, it would provide for about 35% of the total catch based on current commercial ca
Fishing effort/access level
Effort in the Shark Bay crab fishery remained stable during2008/09, as operators continued to maximize profitabilitycapitalizing on peak catch periods. Shark Bay crab trap fishers reported 317,416 pot lifts (Gascoyne Coast Blue Swimmer Crab Figure 3) – similar to the 324,401 pot lifts reported for the previous year.
No effort was expended in the Exmouth Gulf crab trap fishery during 2008/09. The fishery was officially closed in June 2009.
The significant increase in catchmirrored by a similar increase in effort. Commercial crab fishers operated on 151 fishing days during 2008/09, compared to just 52 days during the previous year.
SAssessment complete:
Shark Bay: Yes (to be review
Exmouth: Ye
Pilbara: Yes
Assessment method:
Catch rate/Size Distributions
Breeding stock levels:
Shark Bay: Acceptable
Exmouth:
Pilbara: Acce
Length-frequency data gathered from ongoing monitoring programs in the Shark Bay crab fishery and the Pilbara crab fishery suggests that management controls currently in place appear to have provided adequate measuressustainable level of breeding stock.
Monitoring of the commercial catch in Shark Bay has been crecorded between years within
The development of appropriate mesh sizes for use on commercial crab traps has eliminated the catch of juvenile crabs (< 80 mm carapace width) and significantly reduced catch of undersize crabs < 120 mm carapace width, withouimpacting on legal catches. Improved work practices have also reduced the mortality of returned undersize and berried crabs caught in commercial traps to negligible levels. Catch
STATE OF THE FISHERIES AND AQUATIC RESOURCES REPORT 2009/10 137

GASCOYNE COAST BIOREGION
rates from each fishery provide an index of abundance that an be used to assess fishery performance from year-to-year.
hark Bay: Following the establishment of the dedicated ishery in 1998, blue swimmer crab trap catches in Shark
Bay increased almost five-fold over the next 5 years (Gascoyne Coast Blue Swimmer Crab Figure 2). This
increase was achieved with only a three-fold increase in effort. Consequently, there was a significant increase in catch per unit effort during this initial period of development, reflecting the more efficient fishing of blue swimmer stocks in Shark Bay as the commercial operators’ knowledge of stock dynamics and distribution increased over time and improvements were made to fishing gear and vessels.
Catch and effort have since stabilised in the Shark Bay crab trap fishery, with the mean annual CPUE since 2000/01 ranging between 1.4 and 1.8 kg/trap lift. During 2008/09 the catch rate was 1.55 kg/traps lift (Gascoyne Coast Blue Swimmer Crab Figure 3), similar to the 2007/08 catch rate of 1.59 kg/trap lift. A review of the interim management plan is planned for 2010/11.
There has been a substantial increase in the quantity of blue swimmer crabs retained as by-product by the prawn trawl fleet, and to a lesser extent scallop trawl fleet, in Shark Bay over the past decade. Shark Bay trawlers tend to retain more crabs as a by-product of their fishing operations in years when their target prawn and scallop catches are lower. Market factors have also influenced the quantity of crabs retained by the trawl fleet, with more crabs retained as demand from processors and subsequent returns to vessels has increased. Furthermore, several of the smaller trawlers in the fleet have been replaced with larger vessels, able to carry more crew and with larger freezer capacity to facilitate greater crab retention.
Exmouth Gulf: Catch and effort levels on blue swimmer crabs in the Exmouth Gulf trawl fishery have been relatively stable and are considered acceptable.
Pilbara: Trap catch rates in the Pilbara Developing Crab Fishery have generally increased since the commencement of exploratory fishing along the Pilbara coast. This reflects a more efficient fishing of blue swimmer stocks in the Pilbara region, as the commercial operators’ knowledge of the spatial distribution of resident stocks and localized environmental influences increased over time. The increase in catch rate can
so be attributed to improvements to fishing gear and
/trap ft the previous year. This decrease was primarily due to ome effort being used for exploratory fishing during the ear.
The minimum legal size at first capture (127mm carapace width for recreational fishers; 135mm carapace width for commercial fishers based on industry agreement) for crab fisheries in the Gascoyne Coast Bioregion is set well above the size at first maturity (85 – 115 mm carapace width) of the resident stocks. Consequently, breeding stock levels are expected to be adequate to maintain stocks in all current fishing areas under normal environmental conditions.
The breeding stocks in the Gascoyne Coast bioregion and along the Pilbara coast are also supported by the influence of the warmer waters that occur at these latitudes which extends the spawning period over the whole year, whereas spawning is restricted to the late spring and early summer months on the lower West Coast.
Non-Retained Species Bycatch species impact Negligible
The shift from using gillnets to traps in most blue swimmer crab fisheries has resulted in a substantial reduction in bycatch from dedicated crab fishing. Pots are purpose-designed to minimise the capture of non-target species and are therefore an inefficient way to capture fish, the majority of which are able to escape through the entrance gaps when the pot is soaking or being hauled.
Small numbers of fish are infrequently captured in crab pots, but the fishers are not permitted to retain them. The low number of fish caught and returned by crab fishers is considered to pose a negligible risk to these stocks.
Discarded bycatch from trawl fisheries that retain crabs as a by-product is dealt with in those sections of this report specific to the trawl fisheries.
Protected species interaction Negligible
The crab trap longline system used in the targeted crab fisheries has little possibility of interacting with protected species. The fishery is conducted in a manner that avoids mortality of, or injuries to, endangered, threatened or protected species and avoids or minimises impacts on threatened ecological communities.
Ecosystem Effects Food chain effects Low
As the commercial take of crabs represents a relatively small portion of the biomass, which is effectively renewed annually, secondary food chain effects are likely to be minimal in these fisheries.
Habitat effects Negligible
Fishing with traps results in limited habitat disturbance, with only minor dragging of traps on the sea bottom occurring
et brought to the surface in commercial blue swimmer crab traps, as the mesh used on traps is sufficiently large to allow the escape of any sand-dwelling macro-benthos.
The performance measure for the Shark Bay fishery requires that the breeding stocks be maintained. The breeding stock is reported as adult crab abundance (catch per unit effort - CPUE). The CPUE in the Shark Bay fishery for 2008/09 was 1.55 kg/trap lift – well above the Environment Protection and Biodiversity Conservation Act 1999 performance measure of 1.0 kg/trap lift. This level of breeding stock has proven adequate to support recruitment to the fishery to date.
c
Strap f
alvessels.
The Pilbara Developing Crab Fishery recorded a mean catch rate for 2008/09 of 0.7 kg/trap lift – down from 0.9 kg
during trap retrieval. Sand and associated biota does not g
lisy
138 DEPARTMENT OF FISHERIES
GASCOYNE COAST BIOREGION
Although seagrasses are occasionally uprooted and brought to e surface with the trap, the infrequent nature of this
ce, and the small amount of living seagrass removed, results in minimal habitat damage.
uring 2008/09, approximately 15 people were employed as crew on vessels fishing for blue swimmer crabs
the Gascoyne Coast bioregion and a further 4 people along the Pilbara coast. Additional employment for some 25-30 workers has been created in Carnarvon and Point Samson through the development of post-harvest processing of the crab catch.
Economic Effects Estimated annual value (to fishers)
for year 2008/09 $3.5 million
Blue swimmer crab landings from the Gascoyne Coast bioregion during 2008/09 were worth $3.5 million, down slightly on the $3.9 million generated during 2007/08. This marginal decrease was largely due to a slight reduction in the catch of blue swimmer crabs by the Shark Bay trap fleet, and no catch from the Exmouth Gulf trap fleet. The catch from the Pilbara region for 2008/09 was valued at approximately $170,000, a substantial increase on the $69,000 from 2007/08.
Beach prices for blue swimmer crabs from the major trap fisheries throughout 2008/09 ranged from $5/kg to $15/kg live weight, with the average price in the Gascoyne fisheries for the year around $5.50-$6/kg. The frozen crabs landed by trawlers generally attract a slightly lower beach price than
several Shark Bay fishers have been eveloping markets in south-east Asia and focusing on the
adding of product for the domestic market. The crab atch from the Pilbara region was sold through local and terstate markets.
hark Bay: Under review
review of these blue swimmer crab fisheries is being en and target catch ranges will be set.
l: Shark Bay: NA
nsion as the fishery
ap fishing effort may have stabilized. The trap catch rate h and
crabs captured as by-product by the Shark Bay trawl fleet over the last decade.
With the closure of the Exmouth Gulf Developing Crab Fishery and only slight inter-annual variability in fishing pressure from the Exmouth Gulf trawl fleet, the current level
While the Pilbara Developing Crab Trap Fishery has undergone a steady expansion since exploratory fishing for blue swimmer crab stocks between Onslow and Port Hedland began in 2001, effort levels in the fishery are acceptable. The large area covered by the fishery and the remote nature of much of this coastline provides significant logistical and financial challenges in returning the harvested catch to market in an acceptable time period. Improvements to fishing gear and vessels, along with a substantial increase in the understanding of localised environmental influences such as tide and wind, has allowed commercial fishers to maintain catch levels with reduced effort. Fishing effort in this region is further limited by very hot weather experienced during the summer months, which generally restricts fishing effort to between April and November.
Because of the logistical and financial difficulty in fishingthis area, only one licensee has renewed their exemption for the 2008/09 fishing season, reducing the number of traps from 600 down to 400.
New management initiatives (2009/10)
The Shark Bay Crab Interim Management Plan has been extended until 31 August 2011 to provide more time to resolve a number of issues related to resource sharing and gear conflicts between the Shark Bay crab trap and Shark Bay prawn and scallop trawl fisheries. A more precautionary management approach for the Shark Bay crab stock is currently being considered due to uncertainty of the
(south of Cape Peron) with the interim managed fishery will also be considered.
Both the Exmouth Gulf and Pilbara Developing Crab Fisheries were formally reviewed in mid-2007 by the Developing Fisheries Assessment Committee (DFAC) as part of the ‘Developing New Fisheries’ process.
The Exmouth Gulf Developing Crab Fishery was not
Developing Fisheries Assessment Committee. On this basis, in June 2009, the CEO of the Department decided to close the Exmouth Gulf Developing Crab Fishery.
The Department proposes to bring the Pilbara Crab DNF under formal management arrangements during 2010/11.
External Factors ny of the crab fisheries fluctuate ses of these variations are not
fully understood, it is considered most likely due to val
r
thoccurren
Social Effects of effort in Exmouth Gulf is considered acceptable.
Dskippers andin
those landed from traps.
While the majority of the product was sold through local and inter-state markets,
sustainable catch level. The issue of better integrating the activities of the two fishers in the southern part of Shark Bay
dvalue-cin
Fishery Governance Target catch (or effort) range: considered economically viable in the long-term by the
S
Aundertak
Current fishing (or effort) leve
Following several years of rapid expadeveloped, current trap catch and effort in the Shark Bay Crab (Interim) Managed Fishery suggests that commercial
Levels of recruitment to maconsiderably. While the cau
trwill be monitored closely, along with the trend in catceffort from all sectors.
Improved markets and greater vessel and crew capacity has seen a significant increase in the retention of blue swimmer
environmental influences on spawning success and lar
survival through to recruitment. The relationship between environmental factors, recruitment and catch is being furtheevaluated as data becomes available.
STATE OF THE FISHERIES AND AQUATIC RESOURCES REPORT 2009/10 139
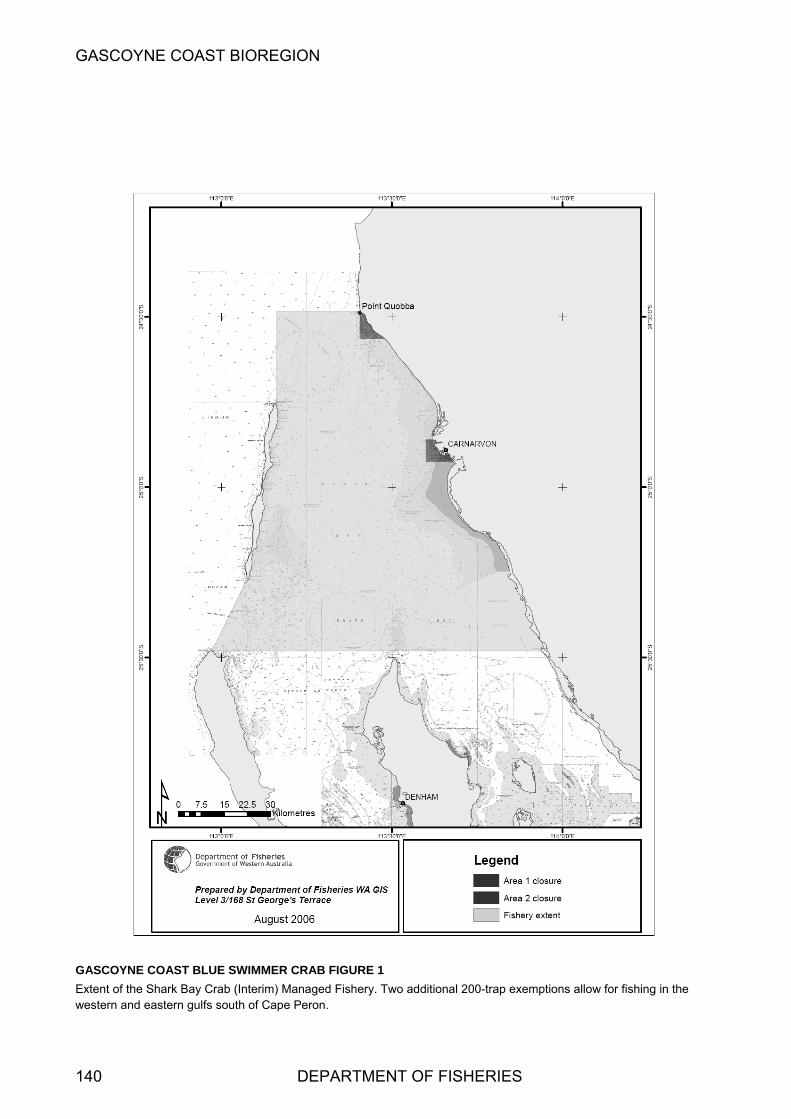
GASCOYNE COAST BIOREGION
GASCOYNE COAST BLUE SWIMMER CRAB FIGURE 1
Extent of the Shark Bay Crab (Interim) Managed Fishery. Two additional 200-trap exemptions allow for fishing in the western and eastern gulfs south of Cape Peron.
140 DEPARTMENT OF FISHERIES

GASCOYNE COAST BIOREGION
Blue Swimmer Crab - Catch by Fishing Area
Year
93/94 94/95 95/96 96/97 97/98 98/99 99/00 00/01 01/02 02/03 03/04 04/05 05/06 06/07 07/08 08/09
Cat
ch
(to
nnes
)
0
100
200
300
400
500
600
700
Shark Bay trapShark Bay trawlExmouth Gulf
elagicus) fisheries in the Gascoyne Coast bioregion of
GASCOYNE COAST BLUE SWIMMER CRAB FIGURE
Commercial catch history for the blue swimmer craWestern Australia between 1989/90 and 2008/09.
2
b (Portunus p
Blue Swimmer CSrab - Tra
hark Ba
Year
p Catch and efforty
89/9
0
90/9
1
91/9
2
92/9
3
93/9
4
94/9
5
95/9
6
96/9
97/9
98
7 8
/99
99/0
0
00/0
1
01/0
2
02/0
3
03/0
4
04/0
5
05/0
6
06/0
7
07/0
8
08/0
9
Cat
ch (
tonn
es)
and
eff
ort
(tr
ap li
fts
x 1,
000)
0
100
200
300
400
500
600
700
CP
UE
(kg
/trap
lift
)
0.0
0.2
1.8
0.4
0.6
0.8
1.0
1.2
1.4
1.6
2.0
CatchEffortCPUE
GASCOYNE COAST BLUE SWIMMER CRAB FIGURE
Blue swimmer crab catch (t), effort (trap lifts x 1,000) and cusing traps.
3
atch per unit effort (kg/trap lift) in Shark Bay from 1989/90
STATE OF THE FISHERIES AND AQUATIC RESOURCES REPORT 2009/10 141
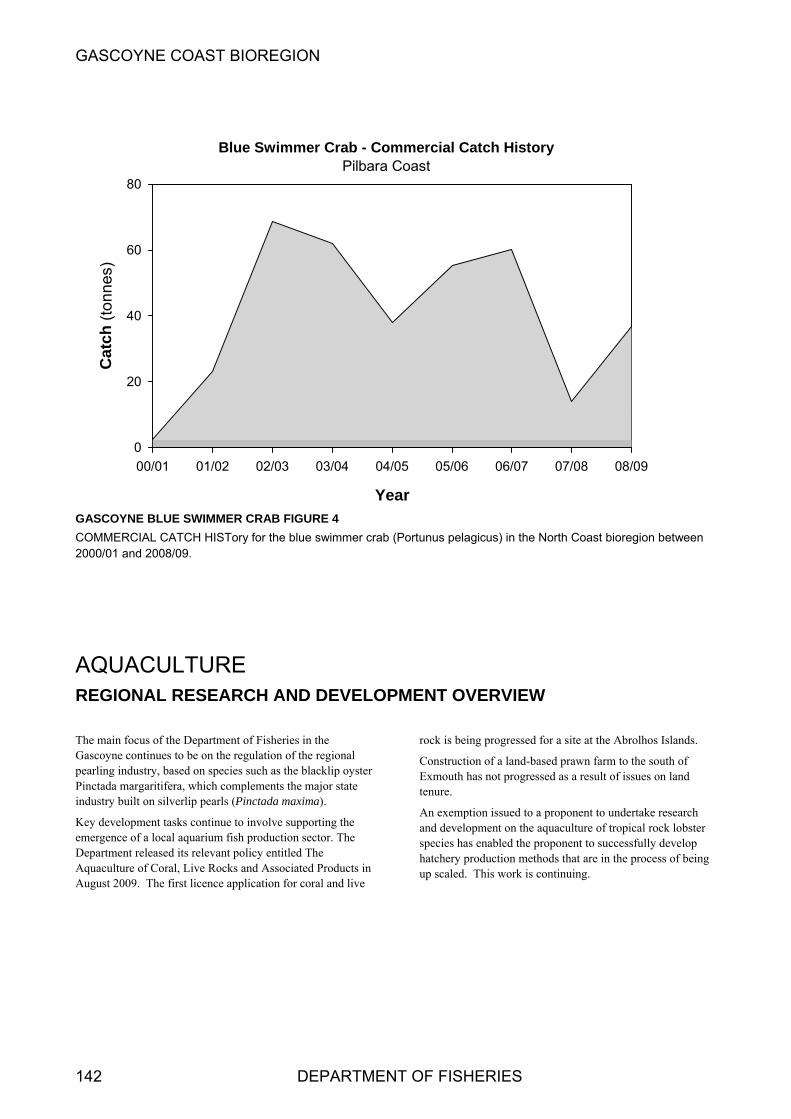
GASCOYNE COAST BIOREGION
Blue Swimmer CrabPilba
- Commra Coa
Year
ercial Catch Historyst
00/01 01/02 02/03 03/04 04/05 05/06 06/07 07/08 08/09
Cat
ch
(to
nnes
)
0
20
40
60
80
GASCOYNE BLUE SWIMMER CRAB FIGURE 4
COMMERCIAL CATCH HISTory for the blue swimmer crab 2000/01 and 2008/09.
(Port
ELOPME
ster
ts in and live
progressed for a site at the Abrolhos Islands.
onstruction of a land-based prawn farm to the south of d as a result of issues on land
r
hatch tion methods that are in the process of being
unus pelagicus) in the North Coast bioregion between
NT OVERVIEW
rock is being
AQUACULTURE REGIONAL RESEARCH AND DEV
The main focus of the Department of Fisheries in the Gascoyne continues to be on the regulation of the regional pearling industry, based on species such as the blacklip oyPinctada margaritifera, which complements the major state industry built on silverlip pearls (Pinctada maxima).
Key development tasks continue to involve supporting the emergence of a local aquarium fish production sector. The Department released its relevant policy entitled The Aquaculture of Coral, Live Rocks and Associated ProducAugust 2009. The first licence application for coral
CExmouth has not progressetenure.
An exemption issued to a proponent to undertake research and development on the aquaculture of tropical rock lobstespecies has enabled the proponent to successfully develop
ery producup scaled. This work is continuing.
142 DEPARTMENT OF FISHERIES

GASCOYNE COAST BIOREGION
CO UNITY E
Com sc ies and
Maradm
alloccom eational fisheries, marine parks, pearling nd aquaculture operations and fish habitat protection areas. he region covers approximately 2700 kilometers of the estern Australian (WA) coastline, some 13% of the WA
oast. The various coastal landscapes represent some of the ost remote, isolated, pristine and dangerous marine and rrestrial environments in the state.
MOs carry out at-sea marine safety compliance as part of eir normal patrol routine, inspecting recreational and
pport the Recreational Skippers icket, the new EPIRB units and safer boating practices
furtheplianc
ascoynsignifica o Marine Park and the associated Com ark and Shark Bay Marine P orld Heritage Area. These two Marine Park er 70% of the Gascoyne Coast Bi with the Department of Environm rvation (DEC), FMO’s monitor and deliver compliance and education programs covering some 30 Sanctprotected
FMOs undertake regular and sea patrols program ery model supported by a risk ass ciated operational planning framework. Thr egion they employ specially equipped cles, quad bikes and small towable sophisticated surveillance, mapping and GPS equipment to assist in evidenceand phot
FMOs at e of the recently commiss e PV Edwards to condu s throughout Shark Bay.
GuCoapp
thefor erial surveillance, dive inspections, at-sea and on-land catch, cence, gear and marine safety inspections, and attended
community events as well as school education programs.
The the Shark Bay Snapper Managed
man allenge. The monitoring of commercial catch
r mainspCDR’s. Re snapper tags in the Freycinet Estuary area continues to be another positive method for managing the pink snapper recovery in this area. Ensuring fair, balanced and equal access to the fishery for both commercial and recreational fishers whilst ensuring the sustainability of the species remains a high priority for management and FMOs in the region.
The continuing recovery of the Shark Bay Inner Gulf pink snapper stocks has been, in large part, attributable to the efforts of the Department’s staff in the Gascoyne Coast Bioregion and the officers of the Denham District in
FMOs continue to support and maintain important and long-term relationships with the community through their participation in community n of
ational and interpretive activities ring peak periods bioregion. These peak eriods commence in
late March and finish in early October. During this peak season, fishing competitions like th rfin, Shark Bay Fishing Fiesta and Gamex; and com ents such as the Whale Shark Festival and Gascoyne Expo provide high exposure community education opportunities for FMOs. FMOs make a substantial contribution to the pre-season preparations of the Shark Bay and Exmouth trawl fleets by providing advice, pre-season briefings and inspections of
, fishing and safety equipment.
The Department’s satellite-based vessel monitoring system (VMS) continues to be a central compliance and management tool enabling positional surveillanc onitoring of commercial vessels and provides an important safety tool for fishers in case of emergency. The VM for fishery-specific management plan closures to enforced remotely by triggering an alarm should a bound be crossed or an unauthorized activity be detected. FMOs can program their
imes and apply their investigation methods more efficiently by using the faciliti ided by VMS. The expansion of the VMS into other f es such as the snapper and mackerel fisheries has that a higher and more effective rate of compliance is a ieved.
-
1 which excludes Gascoyne pearling compliance activities
cial year (Gascoyne Coast Compliance Patrol Hours Figure 1). The total budgeted hours for compliance were not delivered by FMOs in the region during 2008/09. This was due again to staff shortages for significant periods of time during the
MPLIANCE AND COMM DUCATION
sustainability of
pliance and community education services in theFishery continues to be a high priority and major
agement chGa oyne Coast Bioregion are delivered by Fisher
ine Officers (FMOs) and associated management and inistrative support staff based at District Offices in quota via the “Catch and Disposal Record” (CDR) process
e ins a pivotal part of the management process, as does the ection of catch landed ashore in accordance with the
creational
Denham, Carnarvon and Exmouth. During 2008/09 the three district offices supported a total of nine FMO positions
ated to deliver services to several client groups including mercial and recr
aTWcmte
Fthcommercial vessels for compliance with marine safetylegislation as well as promoting safer boating practices. They continue to promote and su
particular.
Tgenerally.
Acom
r significant aspect of their work is the provision of e services to the State’s Marine Parks. The
educthroughout the
G e Coast Bioregion has two of WA’s most iconic and nt Marine Parks, Ningalo
monwealth Marine Park and the associated W
s occupy just ovoregion. In partnership
ent and Conse
uary Zones and Marine Managed Areas and other vessels areas.
land, airmed using a compliance delivessment process and asso
oughout the bior four-wheel-drive vehivessels. They also make use of
gathering. This includes high-powered telescopes inspection regographic mapping technology.
Denham make extensive usioned 13-metre patrol vessel (PV) thct compliance activitie
FMOs in Exmouth use the 8-meter PV Gnulli and a 7.3-meter rigid inflatable boat to conduct at-sea inspections in Exmouth
lf and within the Ningaloo Marine Park and mmonwealth Marine Park. In both Districts FMOs spend roximately 100 days a year at sea on patrol duties. Large
Activities during 2008/09
During 2008/09 FMOs delivered a total of 5889 hours of “infield” compliance activity (Gascoyne Coast Bioregion Table
patrol vessels (greater than 20 m in length) also assist FMOs at various times of the year for offshore patrols, especially in
Shark Bay Prawn and Scallop Fisheries; this accounted 12 days of at-sea patrols in 2008/09. FMOs also conduct
which are reported in the North Coast Bioregion), representing a significant increase on the previous finan
events and coordinatiodup
e Carnamunity ev
e and m
S allows be ary
es provisheri
ensuredch
ali
STATE OF THE FISHERIES AND AQUATIC RESOURCES REPORT 2009/10 143

GASCOYNE COAST BIOREGION
year. It has been demonstrated in previous years that the ngoing positive effects of a stable FMO work group have
in a better working relationship between fishers and MOs, especially commercial fishers, however previous fforts might be at risk because of the ongoing issue of staff
shortages. Commercial and recreational fishers alike continue to provide positive feedback that the routine attendance of familiar FMOs in their workplace and recreational fishing locations has led to a better understanding and knowledge of the regulations and a higher rate of compliance.
In delivering compliance services to the Gascoyne, FMOs under the management of the Compliance Manager make use of a risk assessment and intelligence analysis-driven model to compliance planning and prioritization. All the existing Operational Compliance Plans (OCP) were reviewed and updated during the 2008/09 year using this model. Several other OCP’s were completed, including the Patrol Vessel Business Unit –Gascoyne Operations. This continues to be the model for delivering compliance across the agency and continues to provide the most effective and efficient method for a planned and measurable approach to compliance delivery. The OCP’s deliver agreed outcomes and provide a
ion
rab Interim Managed ishery, Shark Bay Snapper Managed Fishery, Gascoyne quaculture and Pearling Fishery, and, for the management
of the Ningaloo Marine Park, Shark Bay Marine Park and Commonwealth Ningaloo Marine Park. A more targeted, effective and relevant compliance service in terms of both cost and activities was delivered using this planning and delivery process.
FMOs delivered compliance activities directed at commercial fisheries mostly through pre-season inspections, catch inspections and quota monitoring, as well as at-sea inspections and investigations resulting from suspected breaches detected via the VMS and intelligence led operations. FMO effort was again directed at building stronger relationships with industry through higher levels of contact both at sea and in port. The number of suspected breaches of closed waters detected through the VMS and other monitoring methods has continued to remain at a high level in 2008/09. However, compliance overall is assessed as being at an acceptable level across all the fisheries except for the Shark Bay Prawn Fishery where issues regarding VMS compliance remain an ongoing concern. Compliance staff assess that the commercial fishing industry continues to demonstrate a positive approach to complying with regulations and playing their part to ensure the sustainability of their fisheries. A total of 9 infringement warnings and 8 infringement notices were issued and no prosecutions were instigated from a total of 385 field contacts with commercial fishers. Field contacts were lower than 2007/08 because of the previously highlighted staff shortages.
The monitoring of marine park activities with respect to recreational fisheries has divided the recreational fishing compliance program from a stand-alone program into two distinct programs, one with a marine park focus. FMOs
increased their compliance activities in relation to both Ningaloo Marine Park and Shark Bay Marine Park in line with the increased importance and focus of government on marine parks across the State. The number of infringement warnings (78) was significantly higher, as was infringement notices issued (99). Prosecutions instigated (8) have decreased considerably from the previous year. This was inline with a new direction in referring marine park matters to the court. This was achieved from a total of 10,920 recreational fishing field contacts, which reflects the increased importance placed on recreational fishing and marine parks in general across the Gascoyne. Recreational fisher contacts were approximately 13% higher in 2008/09, especially in the Ningaloo Marine Reserve. This reflects the direct effects of better management and plannin processes, a stable workforce with more expert knowledge of their sanctuary zones and offender profiles and a greater emphasis on intelligence driven activities.
Two FMOs from “Mobile 1” were active in the Gascoyne in 2008/09. “Mobile 1” provides a dedicated mobile recreational fishing patrol using specialized remote-area-equipped vehicles and surveillance equipment. “Mobile 1” patrols operated mainly in the Denham and Carnarvon Districts, working in a coordinated approach with District
Shark rea.
The bioregion’s Volunteer Fisheries Liaison Officer (VFLO) program continued to find it difficult to attract volunteers during 2008/09. As in previous years, with a population base of less than 12,000 people in the Gascoyne Region, all organizations (including emergency services) find it hard to attract people to the large number of volunteer organisations existing within the region. Solutions to this problem remain elusive, however the regions management team has entered into a partnership arrangement with DEC in the Coral Bay area that has returned very positive outcomes. Utilizing DEC’s Volunteer program, volunteers provide a joint DEC/DoF information service at Coral Bay. The information service focuses on fishing rules and sanctuary zone restrictions.
Initiatives in 2009/10
For the 2009/10-year a number of initiatives across the Gascoyne Bioregion have been planned. These include: -
Delivery of the replacement vessel for the PV Gnulli in Exmouth;
Delivery of the replacement vessel for the 7.8 Naiad destroyed in a motor vehicle accident;
Providing driver training and trailer driver training to all staff in the region;
Trialing an education program that will tour Denham, Carnarvon and Exmouth. The program will focus on delivering DoF education sessions to all regional schools and at recreational fishing events and competitions;
Commencing a dedicated Recreational Fishing Mobile Patrol. This Patrol will be a high profile mobile unit that will attend high use areas and events across the
oresultedFe
more accountable and realistic process for budget creatand the actual services that are to be delivered.
OCP’s have been operating for several years now, the Exmouth Gulf Prawn Fishery, Shark Bay Prawn Fishery, Shark Bay Scallop Fishery, Shark Bay C
Officers to provide greater coverage and improved compliance outcomes. The focus for this unit was again on education and enforcing management arrangements for Bay Inner Gulf pink snapper and the Gnarraloo Bay a
FA
g
144 DEPARTMENT OF FISHERIES

GASCOYNE COAST BIOREGION
Gascoyne delivering education and advice as well as compliance services;
Develop and arelevant to theand develop e Delivering education and advice to commercial fishers
regarding the introduction of the Gascoyne Demersal Scalefish Managed Fishery Management Plan;
Provide educational, interpretive and access infrastructure to the Point Quobba and Miaboolya Fish Habitat Protection Araes;
Develop a project plan for raising the profile of the DoF across the Gascoyne region, its objectives, activities and achievements;
nalyze the various offender profiles Shark Bay and Ningaloo Marine Parks ducational and compliance remedies to
achieve higher rates of voluntary compliance amongst these groups:
Commence construction of a new DoF building in Denham;
Develop a business proposal for an Education Officer to service the Midwest and Gascoyne Regions in a shared arrangement.
G
ummary of compliance and educative contacts and detected offences within the Gascoyne coast bioregion during the 008/09 financial year.
*Contacts are classified according to the specific fishery, which is usually clearly delineated as being either commercial or recreational. The “Other” category is used where multiple fisheries are contacted and it is not possible to accurately classify the contacts into one specific fishery – typically, the majority of these contacts are recreational in nature (e.g. personal contacts in Marine Parks), but contacts made in relation to fish kills, shark patrols and inspections of commercial fish wholesale and retail premises etc. are also included in this category.
**This represents the total number of Fishwatch reports, both commercial and recreational, since the service provider reporting mechanism cannot differentiate between sectors. It also includes any calls relating to the northern inland bioregion that were referred to Exmouth, Carnarvon or Denham District staff.
ASCOYNE COAST COMPLIANCE TABLE 1
S2
PATROL HOURS DELIVERED TO THE BIOREGION 5,889 Officer Hours
CONTACT WITH THE COMMERCIAL FISHING COMMUNITY
Field Contacts by Fisheries & Marine Officers 385
District Office contacts 1,515
Infringement warnings 9
Infringement notices 8
Prosecutions 0
CONTACT WITH THE RECREATIONAL FISHING COMMUNITY
Field Contacts by Fisheries & Marine Officers 10,920
District Office contacts 2,860
Infringement warnings 78
Infringement notices 99
Prosecutions 8
OTHER FISHING-RELATED CONTACTS WITH THE COMMUNITY*
Field Contacts by Fisheries & Marine Officers 1,103
District Office contacts 4,166
Fishwatch reports**
STATE OF THE FISHERIES AND AQUATIC RESOURCES REPORT 2009/10 145
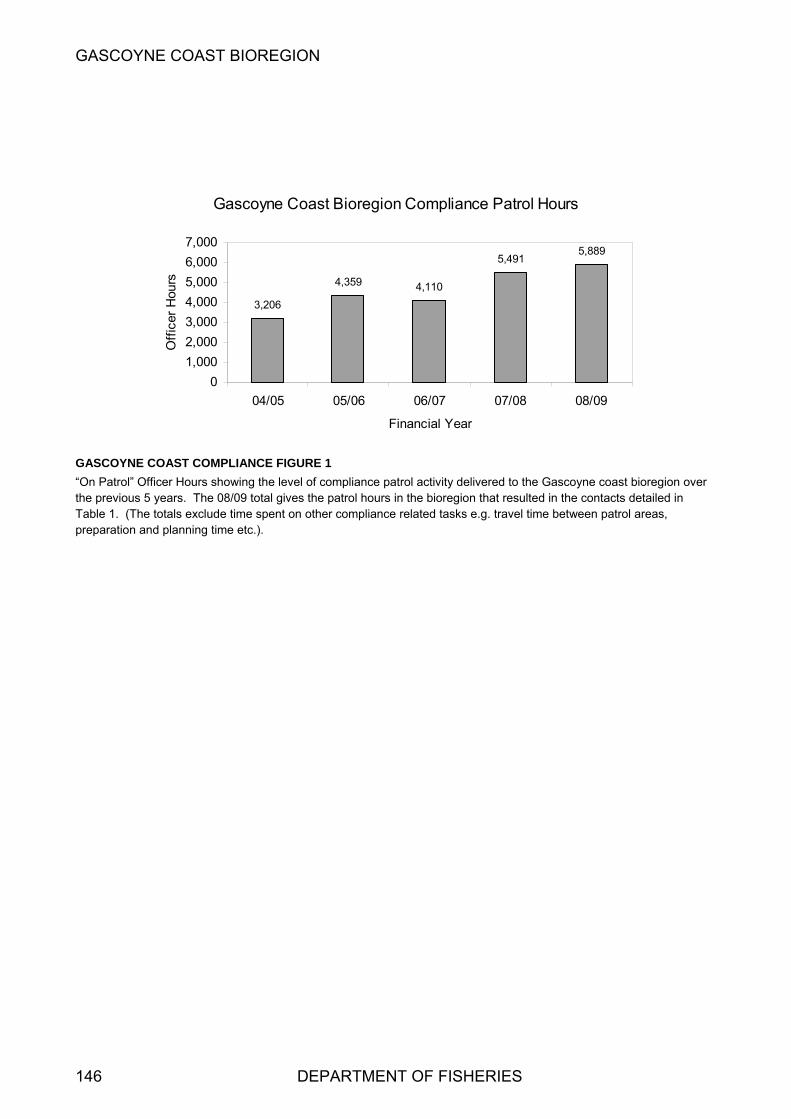
GASCOYNE COAST BIOREGION
Gascoyne Coast Bioregion Compliance Patrol Hours
4,
3,206
359 4,110
5,4915,889
0
1,000
2,000
3,000
04/05 05/0
Off
icer
4,000
5,000
6,000
7,000
Hou
rs
6 0
Finan
ce patrol ver urs in th
mpliance rela reas,
6/07 07/08 08/09
cial Year
GASCOYNE COAST COMPLIANCE FIGURE 1
“On Patrol” Officer Hours showing the level of complianthe previous 5 years. The 08/09 total gives the patrol hoTable 1. (The totals exclude time spent on other co
activity delivered to the Gascoyne coast bioregion oe bioregion that resulted in the contacts detailed in ted tasks e.g. travel time between patrol a
preparation and planning time etc.).
146 DEPARTMENT OF FISHERIES
NORTH COAST BIOREGION ABOUT THE BIOREGION 148
ACTIVITIES 148
T 151
SUMMARY OF FISHING AND AQUACECOSYSTEM MANAGEMENT ECOSYSTEM BASED FISHERIES MANFISHERIES AQUACULTURE COMPLIANCE AND COMMUNITY EDUC
ULTURE149
AGEMEN155210
ATION 210
STATE OF THE FISHERIES AND AQUATIC RESOURCES REPORT 2009/10 147

NORTH COAST BIOREGION
NORTH COAST BIOREGION
ABOUT THE BIOREGION SUMMARY OF FISHING The oceanograp oits origins i ciIndonesian arch and from the India current. The Integrated Marine and Coastal Regionalisation for Australia (IMCRA V 4.0) scheme divides egion into
meso-scale regions: Pilbara inshore, Pilbara offshore, North ty Mile Beach, Canning, King Sound,
Oceanic Shoals and Kimberley.
nature of the hinterland, particularly along the Pilbara coastline. Fish stocks in the North Coast bioregion are entirely tropical, with most having an Indo-Pacific distribution extending eastward through Indonesia to the Indian subcontinent and Arabian Gulf regions.
Coastal waters are generally low-energy in terms of wave action, but are seasonally influenced by infrequent but intense tropical cyclones, storm surges and associated rainfall run-off. These cyclone events generate the bulk of the rainfall, although the Kimberley section of the coastline does receive limited monsoonal thunderstorm rainfall over summer.
Significant river run-off and associated coastal productivity can be associated with cyclone events, with run-off ceasing during winter. The entire north coastal region is subject to very high evaporation rates (3 metres per year), although the Pilbara coastline is more arid than the Kimberley, due to its lower cyclone frequency.
The second significant influence on coastal waters is the extreme tidal regime, related to the wide continental shelf. Spring tides range from up to 11 metres along the Kimberley section of the coast down to around 2 metres at Onslow in the west Pilbara.
As a result of these factors, the generally tropical low-
of the North Coast Bioregion. Along the Kimberley coastline, waters are turbid and relatively productive, while the Pilbara coast with its lower run-off and lesser tidal influence has the clear waters more typical of the tropics.
The coastal geography of the various sections of the coastline also differs. The Kimberley coast is highly indented, with bays and estuaries backed by a hinterland of high relief. Broad tidal mudflats and soft sediments with fringing mangroves are typical of this area. The eastern Pilbara coast is more exposed than the Kimberley, with few islands and extensive inter-tidal sand flats. Softer sediments and mangroves occur around the river entrances. The western Pilbara coastline is characterised by a series of significant but low-relief islands including the Dampier Archipelago, Barrow Island and the Montebello Islands. Near-shore coastal waters include rocky and coral reef systems, creating significant areas of protected waters. West Pilbara shorelines also include areas of soft sediment and mangrove communities.
UA TIE
One of the principal commercia es in the North Coast bioregion focuses on tropical finfish, particularly the high-value emperors, snappers and cods that are taken by the Pilbara Fish Trawl Fishery and the Pilbara and Northern Demersal trap fisheries. The typical catch is in the order of
d annual value of around $12 million, the most valuable finfish sector in the state.
Another significant commercial fishery in this bioregion is based on the collection of pearl oysters (Pinctada maxima) for use in the aquaculture production of pearls (see below). These are collected from the fishing grounds primarily off the Eighty Mile Beach, with smaller catches being taken around the Lacepede Islands (north of Broome).
The North Coast Bioregion also has a number of small, limited-entry trawl fisheries for prawns, producing about 700 t annually, valued at around $10 million.
A number of other finfish fisheries operated in the region including surface trolling for Spanish mackerel, demersal line fishing, near-shore beach seining and gillnetting for barramundi/threadfin salmon and shark. However, the bioregion is increasingly coming under threat from international poaching, particularly for sharks.
Recreational fishing is experiencing significant growth in the North Coast Bioregion, with a distinct seasonal peak in winter when the local population is swollen by significant numbers of metropolitan and inter-state tourists travelling through the area and visiting, in particular, the Onslow, Dampier Archipelago and Broome section e coastline. This has been added to by the increased recreational fishing
n or operation of major g to the high tidal range,
much of the angling activity is boat-based, with beach fishing limited to periods of flood tides and high water.
The numerous creek systems, mangroves and rivers, and ocean beaches provide shore and small boat fishing for a variety of species including barramundi, tropical emperors, mangrove jack, trevallies, sooty grunter, threadfin, mud crabs and cods. Offshore islands, coral reef systems and continental shelf waters provide species of major recreational interest including saddletail snapper and red emperor, cods, coral and coronation trout, sharks, trevally, tuskfish, tunas, mackerels and billfish.
Aquaculture development in the north coast bioregion is dominated by the production of pearls from the species P. maxima. A large number of pearl oysters for seeding are obtained from wild stocks but are supplemented by hatchery-produced oysters, with major hatcheries operating at Broome and King Sound. Pearl farm sites are located mainly along the Kimberley coast, particularly in the Buccaneer Archipelago,
hy of the Nn the flow of Pa
ipelago
rth Coast bioregion has some of fic Ocean waters through the
n Ocean
this bior8West Shelf, Eigh
Ocean temperatures range between 22°C and 33°C, with localised higher temperatures in coastal waters due to the arid 3,000 t annually, making these fisheries, at an estimate
AND AQACTIVI
CULTURES
l fisheri
s of thnutrient offshore waters can, in the few locations with rivers, be significantly influenced by rainfall run-off and tidal mixing to generate varying water quality in different sections
by those involved in the constructiodevelopments in this region. Owin
148 DEPARTMENT OF FISHERIES

NORTH COAST BIOREGION
in Roebuck Bay and at the Montebello Islands.
Developing marine aquaculture initiatives in this region include growing trochus and barramundi. A focus of quaculture development is provided by the Department of a
Fisheries’ Broome Tropical Aquaculture Park, which houses a commercial pearl oyster hatchery, an indigenous-owned multi-species hatchery and the Kimberley Colleaquaculture training facility.
ge of TAFE
Ecologically Sustainable Development (ESD) quirements in accordance with Australian Government
‘Guidelines for the Ecologically Sustainable Management of Fisheries’ under the Environment Protection and Biodiversity Conservation Act 1999. The extent of these areas means that 41% of the entire shelf region of the North Coast Bioregion could be classified as a marine protected area with an IUCN category of IV (as per Dudley, 20081; North Coast Ecosystem Management Table 1).
protected areas including the Montebello and Barrow Islands Rowley Shoals proclaimed under the Conservation and Land Management Act 1984, and closures to fishing under section 43 of the Fish Resources Management Act 1994 at Point Samson, Peron Peninsula and the wreck of the Kunmunya Samson II (Delambre Reef) (see North Coast Ecosystem Management Figure 2). The proposed Dampier Archipelago marine conservation reserves are still under consideration by Government.
The Department of Fisheries has also participated in marine conservation reserve planning process in this region. There is considerable interest in developing marine protected areas within the Kimberley area, including the Camden Sound region which has recently been proposed by the State Government. The Department continues to work closely with relevant agencies and stakeholders to develop strategies to minimize environmental effects in the marine environment including the Kimberley Science and Conservation Strategy with DEC.
The Australian Government’s Department of Environment, Water, Heritage and the Arts (DEWHA) is also undertaking a Marine Bioregional Planning process for Commonwealth waters between Shark Bay and the Northern Territory border, with a view to completing a draft North West Marine Bioregional Plan in 2010. The Draft Plan will be released
ECOSYSTEM MANAGEMENT
Extensive fisheries closures in coastal and most offshore waters have been introduced to manage finfish trawling by Australian vessels (North Coast Ecosystem Management Figure 1). However, trawling is still permitted in a number oflocations (see specific commercial trawl fishery reports elsewhere in this volume). This activity is carefully managed to ensure that impacts are acceptable. The trawling is subject tore
In addition to these habitat related marine protected area closures, the bioregion has a number of other marine
1 Dudley, N. (editor) (2008) Guidelines for applying protected
area management categories. IUCN, Gland, Switzerland.
r a 3 month public review, and contain proposed marine
stern sing pressure through a
lt of increased ing in the area.
Dep age with the Environmental pact
assessment process by providing advice on individual ich if implemented, have the
erse impact on the marine i lude new (and upgraded) port
nd
d
e
arine environment because of the potential for the introduction of non-indigenous marine organisms (including animals, plants, pathogens and diseases) into WA’s coastal environment.
The recent Montara oil spill that occurred in this region highlights the potential risks to this area from oil and gas production. The outcome of this incident on fishery resources and assets may not be known for some time.
foprotected areas.
Marine habitats within the North Coast Bioregion of WeAustralia are experiencing increarange of activities but most notably as a resuresource development activity that is occurr
The artment continues to engProtection Authority through the environmental im
development proposals, whpotential to have an advenv ronment. These incdevelopments in the Pilbara region, as well as offshore anearshore oil and gas extraction projects in the Kimberley and Pilbara region Major developments recently assessed for which the Department has played a key role include the Gorgon Gas Development at Barrow Island, and the proposeKimberley LNG processing site.
The increase in international shipping movement and dredging activity associated with resource development in thNorthern region is considered to present a high risk to the m
STATE OF THE FISHERIES AND AQUATIC RESOURCES REPORT 2009/10 149
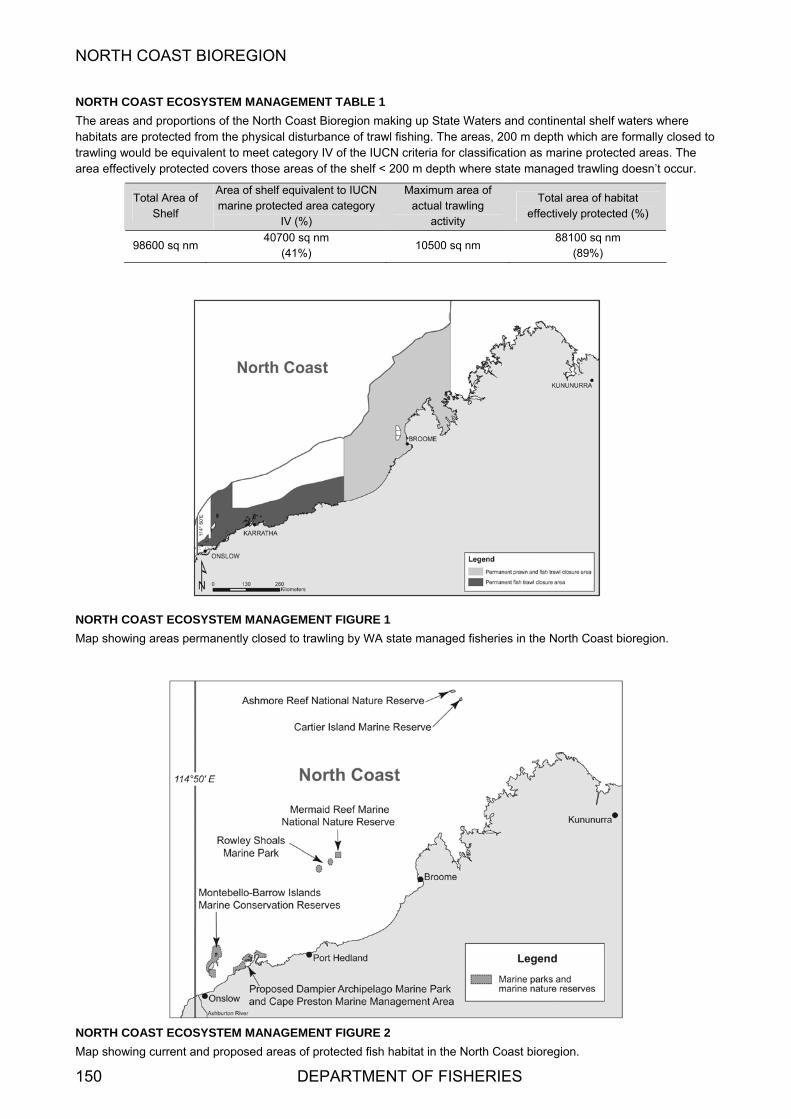
NORTH COAST BIOREGION
150 DEPARTMENT OF FISHERIES
BLE 1
ion making urbance of trawl fishi
awling would be equivalent to meet category IV of the IUCN crit shelf < 200 m
NORTH COAST ECOSYSTEM MANAGEMENT TA
The areas and proportions of the North Coast Bioreghabitats are protected from the physical dist
up State Waters and continental shelf waters where ng. The areas, 200 m depth which are formally closed toeria for classification as marine protected areas. The
area effectively protected covers those areas of the depth where state managed trawling doesn’t occur. tr
Total Area of Shelf
Area of shelf equivalent to IUCN marine protected area category
Maximum area of
IV (%) actual trawling
activity
Total area of habitat effectively protected (%)
98600 sq nm 40700 sq nm
(41%) 10500 sq nm
88100 sq nm (89%)
NORTH COAST ECOSYSTEM MANAGEMEN
Map showing areas permanently closed to traw
T FIGURE 1
ling by WA state managed fisheries in the North Coast bioregion.
NORTH COAST ECOS ANAG R
Map showing current and proposed areas of protected fi
YSTEM M EMENT FIGU E 2
sh habitat in the North Coast bioregion.
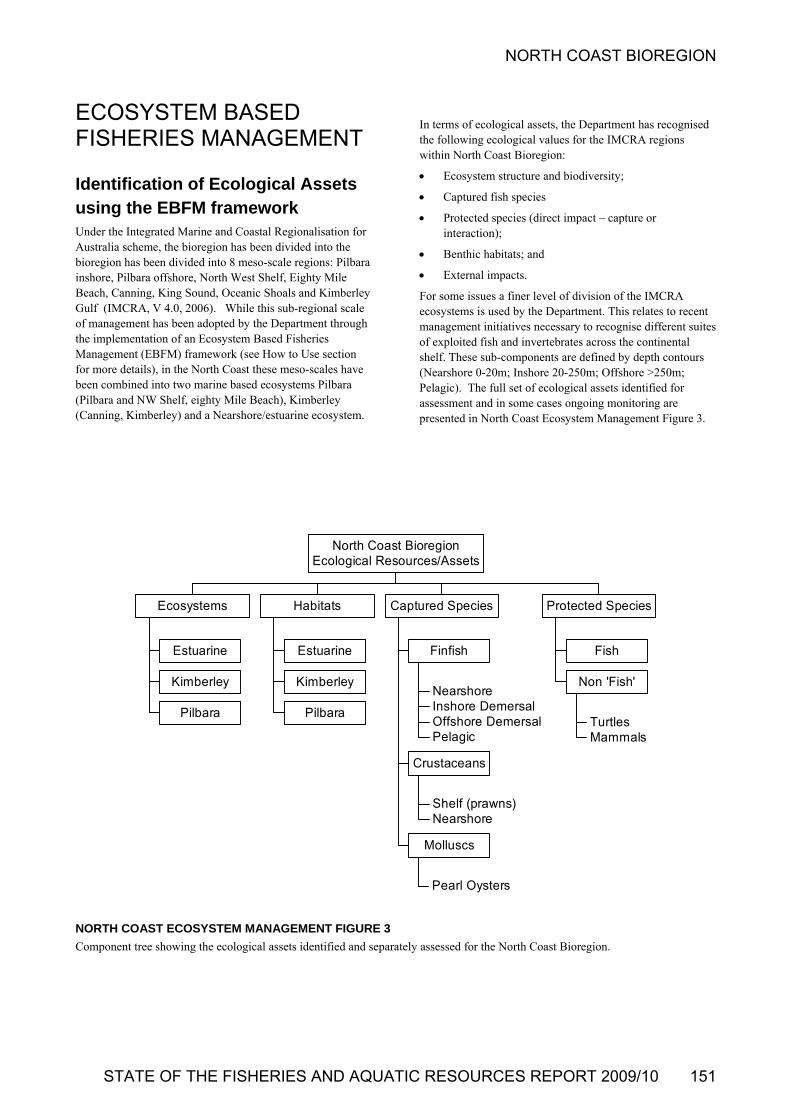
NORTH COAST BIOREGION
ECOSYSTEM BASED FISHERIES MANAGEMENT
Ide ion of using the EBFM framework
Under the Integrated Marine and Coastal Regionalisation for Australia scheme, the bioreg dividedbior een divided eso-scale reg ilbarainshore, Pilbara offshore, North West Shelf, Eighty Mile
each, Canning, King Sound, Oceanic Shoals and Kimberley 06). While this sub-regional scale
adopted by the Department through th n of a m Based ies Management (EBFM) framework (see How to Use section for more details), in the t th hb ased e(P helf, e(Canning, Kimberley) hore s
For some issues a finer level of division of the IMCRA ecosystems is used by the Department. This relates to recent management initiatives necessary to recognise different suites of expl ss the continental shelf. These sub-components are defined by depth contours
Pelagic). The full set of ecological assets identified for
ent Figure 3.
In terms of ecological assets, the Department has recognised the following ecological values for the IMCRA regions within North Coast Bioregion:
Ecosystem structure and biodiversity;
Captured fish species
Protected species (direct impact – capture or interaction);
ntificat Ecological Assets
ion has been into 8 m
into the ions: Pegion has b
Benthic habitats; and
External impacts.
BGulf (IMCRA, V 4.0, 20of management has been
e implementatio n Ecosyste Fisher oited fish and invertebrates acro
North Coasarine b
ese meso-scales cosystems Pilbar
ave a
(Nearshore 0-20m; Inshore 20-250m; Offshore >250m; een combined into two milbara and NW S eighty Mile B
and a Nearsach), Kimberley /estuarine ecosy tem.
assessment and in some cases ongoing monitoring are presented in North Coast Ecosystem Managem
Estuarine
Kimberley
Pilbara
Ecosystems
Estuarine
Kimberley
Pilbara
Habitats
NearshoreInshore DemersalOffshore DemersalPelagic
Finfish
Shelf (prawns)Nearshore
Crustaceans
Pearl Oysters
Molluscs
Captured Species
Fish
TurtlesMammals
Non 'Fish'
Protected Species
North Coast BioregioncoE logical Resources/Assets
ORTH COAST ECOSYSTEM MANAGEMENT FIGURE 3
omponent tree showing the ecological assets identified and separately assessed for the North Coast Bioregion.
N
C
STATE OF THE FISHERIES AND AQUATIC RESOURCES REPORT 2009/10 151
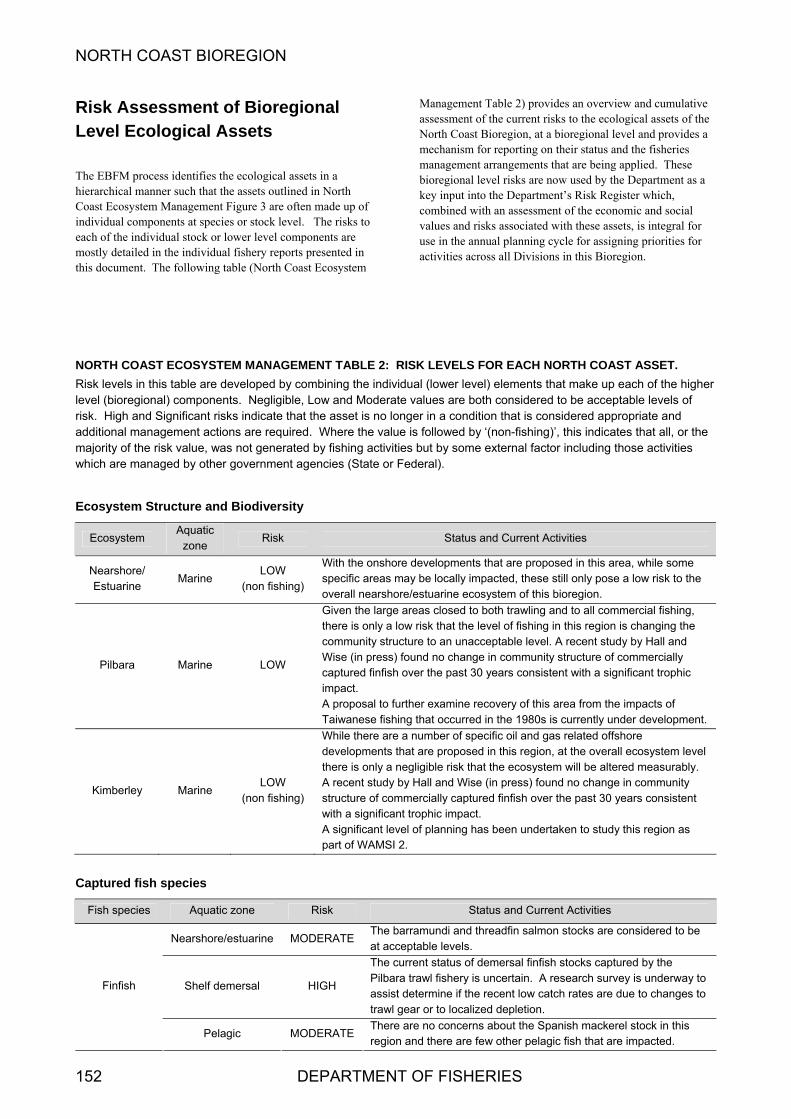
NORTH COAST BIOREGION
Risk Assessment of BioregioLevel Ecological Assets
nal
p of sks to
osystem
lative he
es a
E 2: RIS
individua l) elements that make up each of the higher oderate v no longe
value is tivities ies
te or Fed
The EBFM process identifies the ecological assets in a hierarchical manner such that the assets outlined in North Coast Ecosystem Management Figure 3 are often made uindividual components at species or stock level. The rieach of the individual stock or lower level components are mostly detailed in the individual fishery reports presented in this document. The following table (North Coast Ec
NORTH COAST ECOSYSTEM MANAGEMENT TABL
Risk levels in this table are developed by combining thelevel (bioregional) components. Negligible, Low and Mrisk. High and Significant risks indicate that the asset isadditional management actions are required. Where the majority of the risk value, was not generated by fishing acwhich are managed by other government agencies (Sta
Management Table 2) provides an overview and cumuassessment of the current risks to the ecological assets of tNorth Coast Bioregion, at a bioregional level and providmechanism for reporting on their status and the fisheries management arrangements that are being applied. These bioregional level risks are now used by the Department as a key input into the Department’s Risk Register which, combined with an assessment of the economic and social values and risks associated with these assets, is integral for use in the annual planning cycle for assigning priorities for
Ecosystem Structure and Biodiversity
activities across all Divisions in this Bioregion.
K LEVELS FOR EACH NORTH COAST ASSET.
l (lower levealues are both considered to be acceptable levels of r in a condition that is considered appropriate and followed by ‘(non-fishing)’, this indicates that all, or thebut by some external factor including those activiteral).
Aquatic Ecosystem Risk Status and Current Activities
zone
Nearshore/ Estuarine
Marine LOW
(non fishing)
With the onshore developments that are proposed in this area, while some specific areas may be locally impacted, these still only pose a low risk to the overall nearshore/estuarine ecosystem of this bioregion.
Pilbara Marine LOW
Given the large areas closed to both trawling and to all commercial fishing, there is only a low risk that the level of fishing in this region is changing the community structure to an unacceptable level. A recent study by Hall and Wise (in press) found no change in community structure of commercially captured finfish over the past 30 years consistent with a significant trophic impact. A proposal to further examine recovery of this area from the impacts of Taiwanese fishing that occurred in the 1980s is currently under development.
Kimberley Marine LOW
(non fishing)
While there are a number of specific oil and gas related offshore developments that are proposed in this region, at the overall ecosystem level there is only a negligible risk that the ecosystem will be altered measurably. A recent study by Hall and Wise (in press) found no change in community structure of commercially captured finfish over the past 30 years consistent with a significant trophic impact. A significant level of planning has been undertaken to study this region as part of WAMSI 2.
Captured fish species
Fish species Aquatic zone Risk Status and Current Activities
Nearshore/estuarine MODERATE The barramundi and threadfin salmon stocks are considered to be at acceptable levels.
Shelf demersal HIGH
The current status of demersal finfish stocks captured by the Pilbara trawl fishery is uncertain. A research survey is underway to assist determine if the recent low catch rates are due to changes to trawl gear or to localized depletion.
Finfish
Pelagic MODERATE There are no concerns about the Spanish mackerel stock in this region and there are few other pelagic fish that are impacted.
152 DEPARTMENT OF FISHERIES

NORTH COAST BIOREGION
Fish species Aquatic zone Risk Status and Current Activities
Nearshore/Estuarine LOW There is a small amount of fishing for mud ccrabs in some estuarine and inshore areas.
rabs and blue swimmer
Crustaceans
Shelf MODERATE
There are a number of separate prawn stocks and fisheries within this bioregion that each have limited entry, seasonal and area closures. Annual recruitment to these stocks is variable, which combined with the higher costs of operating in this region, has resulted in fishing effort being much lower in recent years.
LOW The fishery only targets a very small section of the stock both spatially a nge. Recent catches have been
ell belownd the available size raMolluscs Pearls
w the quota levels due to low market demand,
Protected species
Protected fish Species Risk Status and Current Activities
species
Non fish NEGLIGIBLE Crocodiles are occasionally captured in nets but are released alive. Protected non ‘Fish’ species
Mammals MODERATE Dolphins are ca l fishery, but dolphin excluder devices have ceptable levels.
ptured by the Pilbara trawreduced this incidence to ac
Protected Fish LOW
The sawfish (Pnorthern river sh is garricki), are captured in small numbers by net fishing in small regions of the Kimberly region.
‘Fish’ Species
ristidae), speartooth shark (Glyphis glyphis) or the ark (Glyph
Benthic habitat
External Drivers (NON FISHING)
Benthic Habitat Category Risk Status and Current Activities
Estuaries/
LOW The main risks t
Nearshore (non Fishing) o nearshore habitats come from oil and gas developments.
Pilbara MODERATE
This blarge arwhere tra
ioregion hea perm
wling aappropriately ma
as fish trawling but this activity is tightly constrained. The anently closed to trawling and the relatively small area ctually occurs indicates that the habitat in this region is naged.
Kimberley LOW
(Non Fishing)
Except fopactivitipark. The most likeand gas
r someeriods each year, most of this r in closed to trawling. These
es will be
ly infrastru
small areas where prawn trawlers operate for short egion
examined as part of the proposed Camden Sound marine
potential impacts to the habitat in this area are from oil cture and operations.
External Drivers Risk Status and Current Activities
The extremely high level o a high risk that an introdu The department is working
developing and im .
f international shipping that operates in this region posesced pest may be imported.
Introduced Pests and Diseases
HIGH towards plementing a suitable monitoring and inspection program
Climate LOW esThis area is predicted to h
pecially in the coming d tial impacts
ave relatively minor impacts from climate change, ecade compared to more southerly locations. Projects to are planned. examine poten
STATE OF THE FISHERIES AND AQUATIC RESOURCES REPORT 2009/10 153

NORTH COAST BIOREGION
Summary of Monitoring and Assessment of Ecosystem Assets
The Department of Fisheries continues to provide advice to
r
ogram within DAFF (Department of
quatic organism incursion and fish ill incident response programs already in place.
artment of Fisheries’ Research Drsity and Biosecurity Branch has
imed at establishing resourcmonitoring protocols for
l and maberley. The review of
highlighted those areas ofregion. These knowledge
trait studies of particuale oceanographic studies to identify major ocean current
. a
artment has been provided with funds to begin a
the Environmental Protection Authority on development proposals, which, if implemented, have the potential to impact on the aquatic environment. The Department is working closely with the Australian Government and other jurisdictions to develop and implement the National System for the Prevention and Management of Marine Pest Incursions that will minimise the biosecurity risks associated with increased shipping in the Pilbara and Kimberley regions.Within WA, this will be achieved through the Fish Resources Management Act 1994 and the Biosecurity and Agriculture Management Act 2007. Associated regulations and subsidiary legislation are currently being developed. Work has also been undertaken to develop monitoring designs fointroduced marine species for the Port of Dampier. The design has been developed in conjunction with the Invasive Marine Pests PrAgriculture Fisheries and Forestry). This work is expected tocontribute to introduced ak
The Dep ivision’s Biodive
recently completed a
pilot project a e condition the Pilbara and Kimberley. The
ive surveyproject focussed on an extensliterature relating to the coasta
of the research rine environments in
the Pilbara and Kim the literature has research that are lacking from the gaps ranged in scope from fine
scale life history lar species; to large-scdynamics, and oceanic primary production from plankton.
The vast and remote coastline of the region dictates that remote sensing (satellite imagery and aerial photography) will be the primary tool for resource condition monitoringThe project concentrated on developing remote sensing asmonitoring tool, and developing a suite of resource condition indicators that accurately portray the health of the numerous marine and coastal environments, and set bench marks for which to assess environmental change, within the Pilbara and Kimberley.
The Depmonitoring program during 2011/12 for the marine protected area being developed in the Camden Sound region. Further initiatives are being developed as part of the broader Kimberly Science and Conservation strategy and in the submission for WAMSI 2.
154 DEPARTMENT OF FISHERIES
NORTH COAST BIOREGION
STATE OF THE FISHERIES AND AQUATIC RESOURCES REPORT 2009/10 155
erieFISHERIES Northern Prawn Managed Fish s Status Report M. Kangas, E. Sporer and S. Brown
Management input from R. Gould
Main Features
Status
Stock level Acceptabl
Fishing level Acceptable
e t
< 2 t
Current Landings
Onslow: 57
Nickol Bay: 126 t
Broome:
Kimberley: 238 t
Fishery Description There are four small prawn fisheries that operate in the northern bioregion which are all undertaken using otter
part of the
d
f
so catches tiger prawns
Prawn Managed Fishery Licence
imberley Prawn Fishery Management Plan 1993
ent Protection and 999 (Export Exemption)
Fisheries and
e Western Australian waters bBay prawn fishery east of 114º39.9' on the lan
orporating the
° east longitude
the
rawn fisheries are
trawls.
The Onslow (OPMF) and Nickol Bay (NBPMF) Prawn Managed Fisheries operate along the westernNorth-West Shelf and OPMF targets western king prawns (Penaeus latisulcatus), brown tiger prawns (Penaeus esculentus), endeavour prawns (Metapenaeus spp.) whereas NBPMF primarily targets banana prawns (Penaeus merguiensis).
The Broome Prawn Managed Fishery (BPMF) operates in a designated trawl zone off Broome and targets western king prawns (Penaeus latisulcatus) and coral prawns (a combinecategory of small penaeid species).
The Kimberley Prawn Managed Fishery (KPMF) operates ofthe north of the state between Koolan Island and Cape Londonderry. It predominantly targets banana prawns (Penaeus merguiensis) but al(Penaeus esculentus), endeavour prawns (Metapenaeus endeavouri) and western king prawns (Penaeus latisulcatus).
Governing legislation/fishing authority
Onslow Prawn Fishery Management Plan 1991
Onslow Prawn Managed Fishery Licence
Nickol Bay Prawn Fishery Management Plan 1991
Nickol Bay Prawn Managed Fishery Licence
Broome Prawn Managed Fishery Management Plan 1999
Broome
K
Kimberley Prawn Managed Fishery Licence
Commonwealth Government EnvironmBiodiversity Conservation Act 1
Consultation process
Annual meetings between the Department ofindustry.
Boundaries
The boundaries of the OPMF are ‘all thetween the Exmouth Prawn Fishery and the Nickol
dward side of the 200 m depth isobath and is divided into three parts with associated size management fish grounds (SMFGs) and nursery areas for prawns as follows: Area 1, incAshburton SMFG; Area 2, incorporating the Mangrove Island and Weld Island SMFGs and Coolgra Point Nursery; and Area 3, incorporating the Fortescue SMFG (Northern Prawn Figure 1).
The boundaries of the NBPMF are ‘all the waters of the Indian Ocean and Nickol Bay between 116°45' east longitudeand 120° east longitude on the landward side of the 200 m isobath’ (Northern Prawn Figure 2).
The boundaries of the BPMF are ‘all Western Australian waters of the Indian Ocean lying east of 120and west of 123°45' east longitude on the landward side of the 200 m isobath’ . The actual trawl area is contained withina delineated small area north west of Broome as shown in Northern Prawn Figure 3.
The boundaries of the KPMF are ‘all Western Australian waters of the Indian Ocean lying east of 123°45´ east longitude and west of 126°58´ east longitude’. It abutswestern boundary of the Commonwealth Northern Prawn Fishery (NPF) (Northern Prawn Figure 4).
Management arrangements
Management controls for all the northern pbased on limited entry, seasonal and area closures, and gear controls including bycatch reduction devices.
The Department's vessel monitoring system (VMS) monitors the activities of all boats.

NORTH COAST BIOREGION
Annual meetings are held with licence holders to considerstatus of the stocks and recommend changes to the opening and closing dates that operate within the season. These are designed to protect smaller prawns and allow access to the various target species, primarily tiger and banana prawns, at appropriate times.
the
involve
has an equal allocation of nt
and 3
in
he net size and boat unit rule pecifically for Area 1 and the 375 hull unit rule for Areas 2
and 3.
TO
A ber
A ber
A er
Fortescue SMFG 17 May – 12 September
A gust
W
M r
Moon va g season across all a
Dt f g number of licensed boats:
, 2 and 3 (four MFLs)
1 August
gust
r
or
mum total headrope ngth for the entire fleet is 200 fathoms (365.8 metres).
ened the Fishery on 17 June , providing
ys
ed with those f the adjacent NPF. A significant number of vessels hold
d the NPF. ent large shifts
ds
inable Development D) assessment of these fisheries has been undertaken to
ainability risks requiring direct only issue identified through this
epartments’ Research Division decide on the extent of an rea to be fished within the areas that are officially opened. or the BPMF a De Lury depletion analysis is usually ndertaken when sufficient fishing activity occurs nsufficient effort in 2009) which assists in the assessment of
ing prawn stocks within the permitted fishing area.
Nickol Bay 17 May –
(Day fishing only 17 May – 1 June)
Extended Nickol Bay SMFG 17 May – 9 November
Depuch SMFG 17 May – 1 Au
(Day fishing only 17 May – 1 June)
De Grey SMFG 17 May – 9 Novembe
BPMF: The BPMF management arrangements provide fstandard otter trawl nets not exceeding 40 fathoms (73.16 metres in either twin or quad gear configuration). Each boat has an equal allocation and the maxile
The 2009 season arrangements opand it officially closed at 0800 hrs 26 September72 fishing nights. Only one boat entered the BPMF fishery at the commencement of the season and fished for seven dathen left the fishery to fish in the Northern Prawn Fishery (NPF).
KPMF: The KPMF Management Plan permit the use of two otter trawl nets where the total headrope, length including bridles and sweeps does not exceed 32 fathoms (58.5metres) and mesh of trawl nets does not exceed 50 mm.
Seasonal dates for the KPMF are generally align
OPMF: The management arrangements in the OPMFusing a standardised net headrope allocation whereby each Managed Fishery Licence (MFL) net headrope length in each area. However, there are differenet sizes permitted between Areas. Area 1 boats are authorised to use two trawl nets each having a maximumheadrope length of 6 fathoms (10.98 metres). In Area 2a maximum headrope length of 16 fathoms (29.27 metres) is permitted in either twin or quad gear configuration. Trawl net headrope amalgamation between MFLs has been permittedthe OPMF consistent with other trawl fisheries. The fleet iscomposed of trawlers up to 23 metres in length, operating under an exemption from ts
he official season arrangements for the various areas in the PMF were as follows:
rea 1 1 April – 26 Octo
rea 2 1 April – 26 Octo
rea 3 1 April – 26 Octob
shburton SMFG 17 June – 1 Au
eld Island SFMG 17 May – 12 September
angrove Island SFMG 1 April – 26 Octobe
closures were again implemented this season on a oluntary basis. The moon closure period was three days round each full moon during the fishin
oauthorisations to operate in both the KPMF anOpening and closing dates are aligned to prevof fishing effort into the KPMF. Consequently, the 2009 season opened on 7 April and closed mid-season closure on 16 June. The fishery re-opened on 1 September, with a promulgated final season closure on 1 December. The total allowable effort cap system was in place for both periowith a total of 1500 days allocated.
A comprehensive Ecologically Susta(ESidentify any potential sustmanagement action. The process related to the breeding stock levels of target species (e.g. banana, tiger and king prawns). Boxed text in this status report provides the annual assessment of performance for this
.
reas.
ifferent licence classes apply to the OPMF, allowing boats o trawl in specific zones. These classes are listed below, withigures in brackets indicatin issue
Class A Areas 1
Class B Areas 2 and 3 (three MFLs)
Class C Area 2 (12 Exmouth Gulf prawn MFLs)
Class D Area 3 (12 Nickol Bay prawn MFLs)
NBPMF: The NBPMF management arrangements provide for authorised boats to use standard otter trawl nets not exceeding 16 fathoms (29.27 metres in either twin or quad gear configuration) whereby each boat has an equal allocation and the maximum total headrope length for the entire fleet is 224 fathoms (409.78 metres). The 2009 season opened on 14 March with a closure on 9 November. The major fishing areas opened during these periods:
Research summary
Research programs are focused to underpin the sustainable management of these small fisheries involves stock monitoring and assessment utilising information from daily logbooks and processor unloads. For the NBPMF and KPMF rainfall records are also used to update the rainfall-catch relationship for banana prawns. In the OPMF a field-based consultative process is undertaken whereby industry and the DaFu(ithe k
156 DEPARTMENT OF FISHERIES

NORTH COAST BIOREGION
Retained Species Commercial production (season 2009):
Onslow: 57 tonnes
Nickol Bay: 126 ton
Broome: < 2 tonnes
Kimberley: 238 tonnes
nes
dings of major penaeids for the 2prising 9 t of king prawns, 42 t
awns and 2 t of banana praiger and banana prawns were within the target catch range
of
eason were 126 t, comprising 123 t of banana prawns, 0.1 t tiger prawns and no reported
Tngs of banana prawns in 2009 were hi the projected catch range (160 to 240
et catch range. The king prawn landings were xtremely low and below the target ranges for the species
2
PMF: The total recorded landings in the KPMF were 238 t, 1 t of banana prawns, 12 t of tiger prrawns (Northern Prawn Figure 8). Ba were within their target catch range (
but slightly below the projected catch range (230 to 350t) d
shing periods for 2009 unlike the previous two years (2007 ere only the second part of the season was
shed (with the aim to increase the size of prawn) however, effort was still low, possibly reducing total catch for these species. Negligible quantities of byproduct were reported as landed.
Recreational component: Nil
Fishing effort/access level
OPMF: Two boats fished in 2009 with a total of 265 boat days, an increase compared to 155 boat days in 2008. This is still low compared to the days fished between 2000 and 2005
s and
two boats, licensed to sh all areas, onto one boat, resulting in a reduction of net
from 32 fathoms to 20 fathoms in 2008 but ope has been voluntarily reducedthoms in 2009 for fuel efficiency.
ats fished during the 2009 season ggregated total of 178 boat days, a low level of effort.
cated to fish and the lowest since 1990 hen effort estimates were first made.
h relationship for NBPMF and KPMF
r banana prawns,
analysis for BPMF (when te))
rawns
he
ntributing to the low catches. Tiger prawn landings (43 t) show an increase compared to 2007 and 2008 fishing seasons and a return to average tiger prawn landings. The banana prawn landings were low at 2 t. Generally there is a positive correlation between early seasonal rainfall and the catch of banana prawns. However, this generally requires a few consecutive years of rainfall to provide a stock build-up. With relatively high rainfall levels in 2007/08 and 2008/9 the correlation between rainfall and anticipated higher banana catches did not occur for the 2009 season.
NBPMF: The recorded landings of banana prawns (123 t) in 2009 were higher than in 2008 and within the target catch range. The king and tiger prawn landings were extremely low and below the target ranges for these species.
Landings
OPMF: The total lanseason were 57 t, com
009 of tiger
prawns, 3 t of endeavour pr wns. Twhereas king and endeavour prawns were just below the target catch range. The landing of tiger prawns in 2009 was an increase on the catch recorded in 2008 (Northern Prawn Figure 5). The low landings overall are exacerbated by low effort caused by the current economic conditions and market prices.
Recorded landings of by-product species in the OPMF included 1 t of bugs (Thenus orientalis) with the landings all other species being less than one tonne.
NBPMF: The total landings of major penaeids for the 2009 sof king prawns, 2 t ofof endeavour prawns (Northern Prawn Figure 6).
landings he
recorded landi gher than 2008 but below
the targt) but
within ewhilst the tiger prawn catch was within the target catch range. Recorded byproduct landings for 2009 were extremely low.
BPMF: Recorded landings in the BPMF were very low (<t) for target species and negligible for byproduct species (Northern Prawn Figure 7).
Kcomprising 22 awns, 5 t of endeavour pprawn landings
nana 200-450
t)calculated using the relationship between summer rainfall ancatches. Both tiger and endeavour prawns were slightly below their target catch ranges. Fishing occurred in both fiand 2008) whfi
inclusive. In Area 1, one boat was exempted to fish with larger nets using a total net headrope length of 18 fathoms (four 4.5-fathom nets) instead of the permitted 16 fathoms total net headrope length because of economic conditionlow abundance of prawns in recent years. This required the amalgamation of net allocations from fiheadrope length the overall headr by the licensee to 18 fa
NBPMF: Seven bo for an a
BPMF: Only seven days of fishing effort was expended by one boat in this fishery in 2009.
KPMF: Eleven boats operated in the fishery during 2009. The total number of days fished is 448 days well under the total days (1500) allow
Stock Assessment Assessment complete: Yes
Assessment method: Catch(Rainfall catcfo
DeLury depletionappropria
Breeding stock levels: Adequate
Projected catch next season (2010):
NBPMF: 45t banana prawns
KPMF: 220t banana p
For the northern prawn fishery stocks, their short life cycle, high fecundity and dispersed nature prevent fishing from reducing breeding biomass to critical levels. Historical catch levels from periods where it is known that recruitment was not affected by fishing effort have been used as the basis for calculating target catch ranges. These catch ranges are used as an indicator of breeding stock adequacy.
OPMF: The 2009 season king prawn catch (9 t) remains lowcompared to the mean catch of 33 t for 1985 to 2007. In tlast few years the decline in effort may also be co
STATE OF THE FISHERIES AND AQUATIC RESOURCES REPORT 2009/10 157

NORTH COAST BIOREGION
The catch projection for banana prawns in Nickol Bay is ased on the summer rainfall level between December and
ern Prawn Figure 9). The total rainfall between December 2009 and March 2010 (at Roebourne) was 42 mm and the predicted catch for 2010 is around 45 tonnes with a range of 30 –60 tonnes of banana prawns. BPMF: Very low fishing effort (and resultant catch) occurred in this fishery during 2009 so no stock assessment was completed. KPMF: Banana prawns were within the target catch range and tiger and endeavour prawns were below their target ranges. Effort levels were at historic low levels.
The relationship identified between the early season rainfall and catches of banana prawns (the dominant species taken in this area) provides a degree of forecasting. The projected catch based on the rainfall (241 mm) in Kalumburu and Derby in January and February 2010 is 220 tonnes with a range of 170-260 tonnes.
Non-Retained Species Bycatch species impact: Low
Bycatch from the northern prawn fisheries is typical of tropical trawl fisheries (i.e. from 2:1 up to about 5:1 relative to the target species), but the effort levels and spatial coverage are too low to impact bycatch species’ populations. The introduction of fish escapement devices (FEDs) within all the nets towed by each vessel should have reduced this risk even further. The NBPMF and KPMF fishery operates predominantly by specifically targeting schools of banana prawns. This results in relatively low effort and minimal bycatch compared with other trawl fisheries. The impact on bycatch in the BPMF was negligible due to very low effort.
Protected species interaction:
OPMF: Low
NBPMF, BPMF, KPMF: Negligible
The northern prawn fisheries have previously caught the occasional turtle and sea snake. These are generally returned to the sea alive, and the overall low effort level and targeted coverage suggest that such interactions would not have been significant. Bycatch reduction devices (‘grids’) and FEDs are now fully implemented minimising the capture of large animals including turtles. Two unidentified turtles and one green turtle was reported as caught but released alive in the ONPMF and NBPMF respectively.
Ecosystem Effects Food chain effects: Low
For all the northern prawn fisheries and in particular the OPMF and BPMF the limited spatial coverage of the fisheries and low levels of catch, it is unlikely to have any significant ecological consequences. In addition for the NBPMF and the KPMF the highly variable nature of banana prawn recruitment, positively related to cyclonic rainfall, any food chain impacts from fishing are likely to be m imal, despite the relatively high annual exploitation rate.
Habitat effects:
BPMF: Negligible
OPMF, NBPMF, KPMF: Low
In 2009 the area fished in all four fisheries was less than 1-
minimal long-term physical impact.
Social Effects Estimated employment in these fisheries for 2009 was 60 to 80 skippers and crew with additional people involved in local processing.
Economic Effects Estimated annual value (to fishers) for year 2009:
OPMF: $0.6 million
NBPMF: $1.0 million
BPMF: Negligible
KPMF: $1.7 million
The main performance measures for the OPMF, NBPMF and KPMF relate to maintenance of breeding stocks for each of the major target prawn species. In 2009 the breeding stock indicators in the OPFM (catches within
ance’
ur prawns were just below the target catch range. The overall low catches were in part due to low effort.
The breeding stock indicator for banana prawns in the NBPMF was met but was below the projected catch range.
w and below the
An assessment of breeding stock could not be made for the BPMF due to very low fishing effort.
The breeding stock indicators in KPMF (catches within specified ranges) for banana prawns were met but tiger and endeavour prawns were below the target ranges. This may be due to low effort.
bMarch (North
in
section) for tiger and banana prawns were met whereas king and endeavo
3% of the overall fishery. The fisheries are generally restricted to clean sand and mud bottoms, where trawling has
target ranges for these species. This is likely to be a result of the low effort and very limited targeting of these species this year.
specified ranges, as set out in the ‘Fishery Govern
The king and tiger prawn landings were lo
158 DEPARTMENT OF FISHERIES

NORTH COAST BIOREGION
Fishery Governance OPMF Target catch range: 60 – 180 tonnes
Current fishing level: Acceptable
Under normal effort levels and previous environmental conditions, the target ranges of prawn catches, based on the catches of the 1990s, are as follows:
King prawns 10 – 55 t
Tiger prawns 10 – 120 t
Endeavour prawns 5 – 20 t
Banana prawns 2 – 90 t
NBPMF Target catch range: 90 – 300 tonnes
Current fishing level: Acceptable
Historical catch ranges from periods where it is known that recruitment was not affected by fishing effort have been used as the basis for target catch ranges for these species. These historical catch ranges are used as an indicator of breeding
evels and previous nges of prawn catches,
anana prawns 40 – 220 t
ing prawns 20 – 70 t
iger prawns 2 – 40 t
55 – 260 tonnes
Current fishing level: Acceptable
environmental catches are as follows:
ing prawns 35 – 170 t
oral prawns 20 – 90 t
or king prawns the target range is based on the catches of e 1990s, while for coral prawns it is based on the seven-
ear range (1996 – 2002) since catches were first recorded.
KPMF Target catch range: 240 – 500 tonnes
Current fishing level: Acceptable
Under current effort levels and previous environmental conditions, the target ranges of prawn catches, based on the catches of the 1990s, are as follows:
Banana prawns 200 – 450 t
Tiger prawns 15 – 60 t
Endeavour prawns 7 – 80 t
The overall target range for all species combined is different from the aggregate of the individual species ranges shown above. This is because the environmental circumstances that benefit banana prawns generally result in decreased catches of the other species.
New management initiatives (2010): Nil
Alternative management arrangements (to the interim effort cap currently in place) will be pursued during 20 0/11 for the KPMF to improve fishing efficiency and to optim e value of stocks whilst ensuring sustainability.
External Factors Banana prawns are rainfall dependent and can be highly variable annually in the KPMF, NBPMF and for the OPMF where banana prawns may be in some years be taken predominantly off the mouth of the Ashburton River. Due to high costs of fishing and low prawn prices, some boats in these fisheries are choosing not to fish in years of relatively low banana prawn catches. In the BPMF one factor influencing catches is the timing of the season which is set by the mid-season closure for the Northern Prawn Fishery, and,
e years the ation patterns
may not result in significant abundances in the permitted fishing area. The success of this fishery depends on how the limited fishing season coincides with the king prawn recruitment and catchability, which is strongly influenced by the lunar period. The KPMF fishing season also been set to mirror dates used in the NPF to prevent the KPMF from attracting too much fishing effort from the NPF.
stock adequacy. Under current effort lenvironmental conditions, the target rabased on the catches of the 1990s, are as follows:
B
K
T
BPMF Target catch range:
Under current effort levels and previousconditions, the target ranges of prawn
:
since the permitted fishing area is small, in somtiming of prawn recruitment and the prawn migr
K
C
Fthy
1ise th
STATE OF THE FISHERIES AND AQUATIC RESOURCES REPORT 2009/10 159
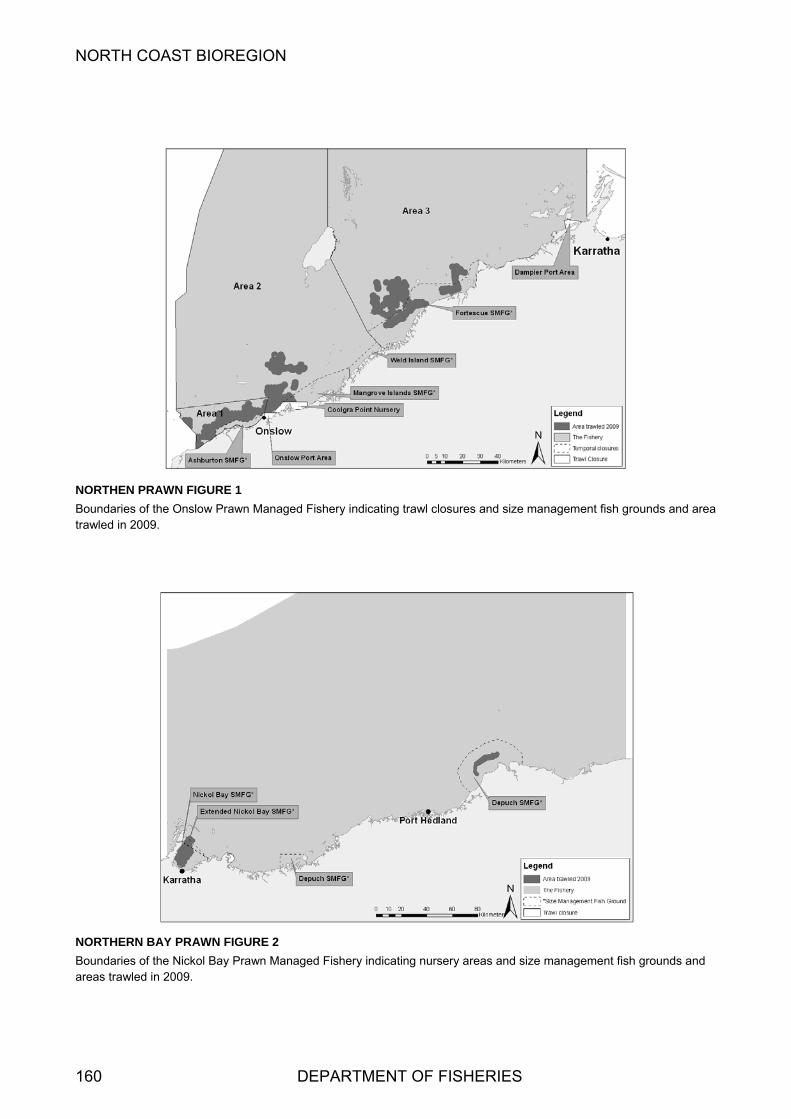
NORTH COAST BIOREGION
NORTHEN PRAWN FIGURE 1
Boundaries of the Onslow Prawn Managed Fishery indicating trawl closures and size management fish grounds and area awled in 2009. tr
NORTHERN BAY PRAWN FIGURE 2
Boundaries of the Nickol Bay Prawn Managed Fishery indicating nursery areas and size management fish grounds and areas trawled in 2009.
160 DEPARTMENT OF FISHERIES
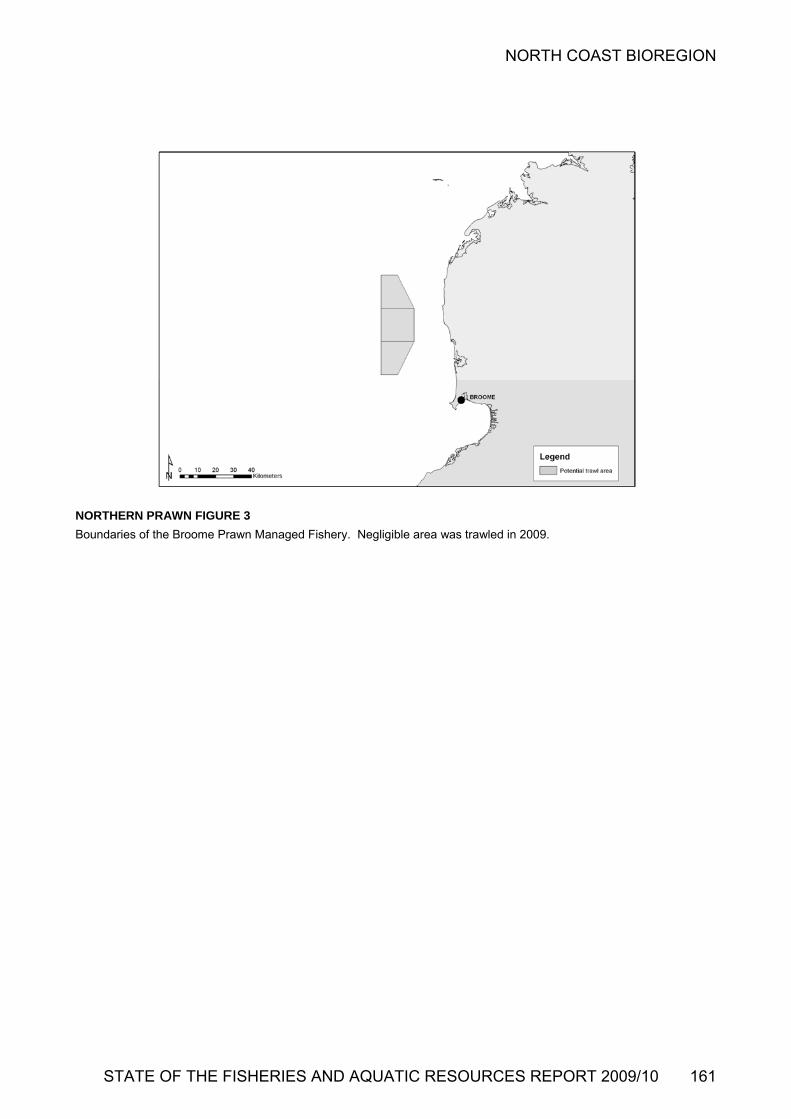
NORTH COAST BIOREGION
NORTHERN PRAWN FIGURE 3
Boundaries of the Broome Prawn Managed Fishery. Negligible area was trawled in 2009.
STATE OF THE FISHERIES AND AQUATIC RESOURCES REPORT 2009/10 161

NORTH COAST BIOREGION
NORTHERN PRAWN FIGURE 4
A 009 an
reas fished in the Kimberley Prawn Managed Fishery in 2 d the inshore trawl closures implemented.
162 DEPARTMENT OF FISHERIES

NORTH COAST BIOREGION
NORTHERN PRAWN FIGURE 5
s and number of boat days (from 2000) for the On
l Bay Pr n Managed Fishery, 1990 – 2009.
Annual landing slow Prawn Managed Fishery, 1990 – 2009.
NORTHERN PRAWN FIGURE 6
Annual landings and boat days (from 2000) for the Nicko aw
0
100
200
300
99 00
Year
400
500
Lan
din
gs
(to
nn
es)
600
700
800
900
1000
90 91 92 93 94 95 96 97 98 01 02 03 04 05 06 07 08 09
King
Tiger
Endeavour
Banana
Boat days
0
90 91 92 93 94 95 96 97 98
20
40
60
80
La
nd
i
100
ng
s (
ton
ne
s)
120
140
160
180
200
99 00 01 05 06 07 08 09
-100
500
Bo
at d
ays
02 03 04
100
300
700
900
1100
Tiger
King
Endeavour
Banana
Boat Days
STATE OF THE FISHERIES AND AQUATIC RESOURCES REPORT 2009/10 163

NORTH COAST BIOREGION
NORTHERN PRAWN FIGURE 7
Annual landings and fishing effort for the Broome Pra
wn Managed Fishery, 1990 – 2009.
NORTHERN PRAWN FIGURE 8
Annual landings and number of boat days (from 1990) for the Kimberley Prawn Managed Fishery, 1980 – 2009.
0
90 91 92 93 94 95 96 97 98
20
40
60
80
100
120
140
160
180
Lan
din
gs
(To
nn
es)
200
99 00
Year
Eff
ort
(H
ou
rs)
01 02 03 04 05 06 07 08 09
KingCoralEffort hours
0
50
100
150
200
250
80 81 82 83 84 85 86 87 88 89 90 91 92
Lan
di
300
350
93 94 95 9
Year
ng
s (t
on
nes
)
400
450
500
6 97 98 99 00 01 02 03 04 05 06 07 08 09
King
Tiger
Endeavour
Banana
Boat days (x10hrs)
164 DEPARTMENT OF FISHERIES
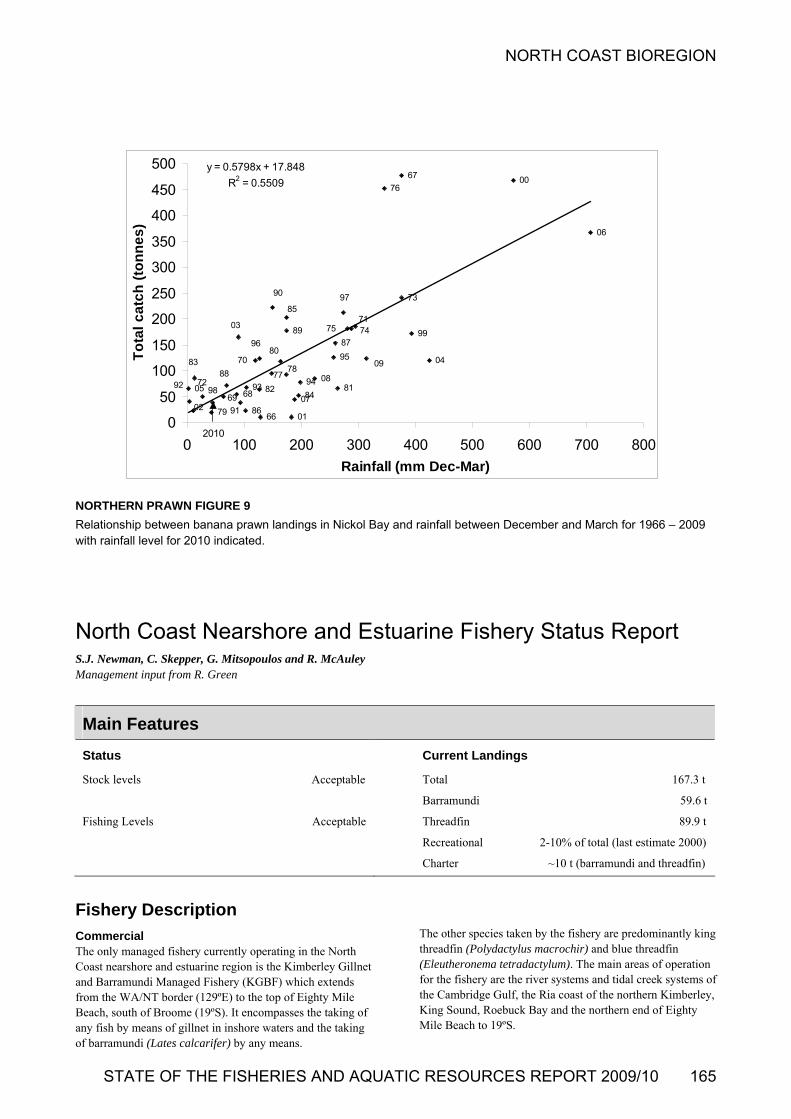
NORTH COAST BIOREGION
09
0067
76
73
NORTHERN PRAWN FIGURE 9
Relationship between banana prawn landings in Nickol Bawith rainfall level for 2010 indicated.
North Coast Nearshore and ES.J. Newman, C. Skepper, G. Mitsopoulos and R. McAuleyManagement input from R. Green
y and rainfall between December and March for 1966 – 2009
stua
ishery Description
ed fishery currently operating in the North et
to 19ºS.
rine Fishery Status Report
F
Commercial The only managCoast nearshore and estuarine region is the Kimberley Gillnand Barramundi Managed Fishery (KGBF) which extends from the WA/NT border (129ºE) to the top of Eighty Mile Beach, south of Broome (19ºS). It encompasses the taking ofany fish by means of gillnet in inshore waters and the taking of barramundi (Lates calcarifer) by any means.
The other species taken by the fishery are predominantly kingthreadfin (Polydactylus macrochir) and blue threadfin (Eleutheronema tetradactylum). The main areas of operation for the fishery are the river systems and tidal creek systems ofthe Cambridge Gulf, the Ria coast of the northern Kimberley, King Sound, Roebuck Bay and the northern end of Eighty Mile Beach
Main Features
Status
Stock levels Accep
99
04
7174
87
7589
96150
40
fall (mm
al
9790
85
03
y = 0.5798x + 17.848
R2 = 0.5509
200
250
300
350
400
450
500
ca
tch
(to
nn
es
)
957080
7883
88100
To
t
81
01
84
9477
92
02
7298
79
69
6691 86
6893 8205
07
08
0
50
0 100 200 300
Rain
06
0 500 600 700 800
Dec-Mar)
2010
table
rent Landings
167.3 t
t
9 t
0)
Fishing Levels Acceptable
Cur
Total
Barramundi 59.6
Threadfin 89.
Recreational 2-10% of total (last estimate 200
Charter ~10 t (barramundi and threadfin)
STATE OF THE FISHERIES AND AQUATIC RESOURCES REPORT 2009/10 165
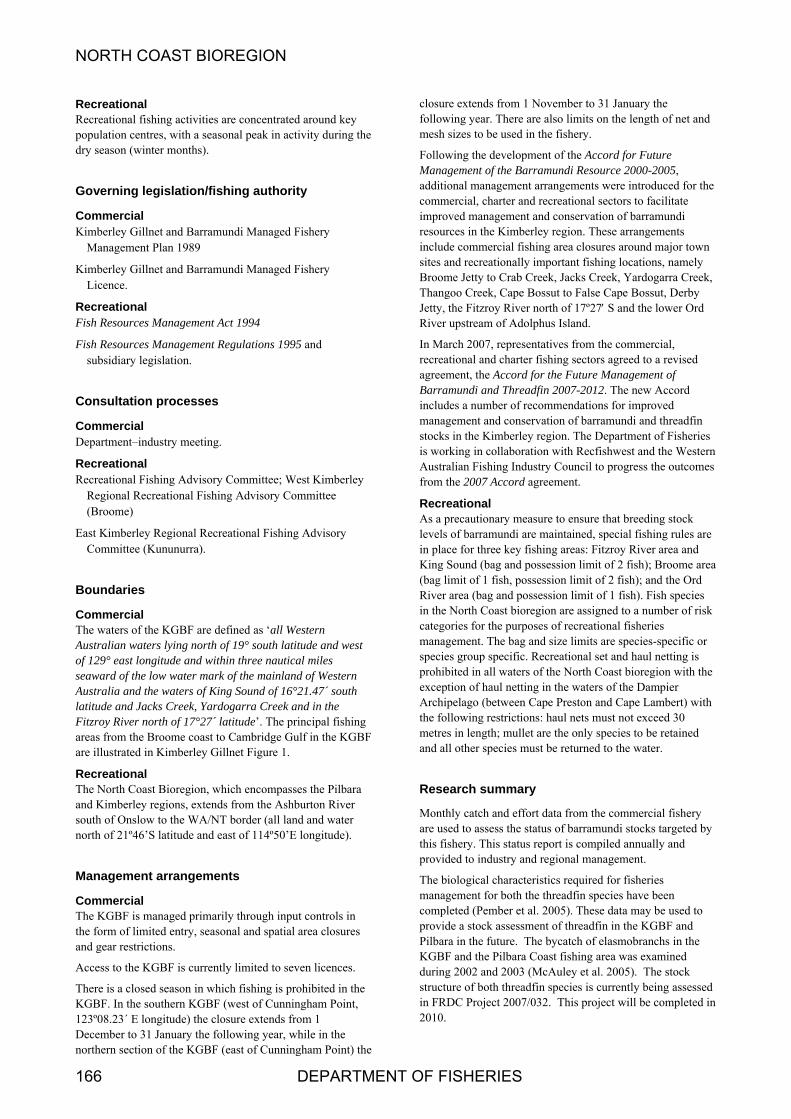
NORTH COAST BIOREGION
166 DEPARTMENT OF FISHERIES
the
et and Barramundi Managed Fishery Management Plan 1989
Gillnet and Barramundi Managed Fishery Licence.
ecreational ish Resources Management Act 1994
ns 1995 and
Consultation processes
Commercial Department–industry meeting.
Recreational R y tte st rley
Regional Recreational Fishing Advisory Committee me)
ast Kimberley Regional Recreational Fishing Advisory Committee (Kununurra).
oundaries
t longitude and within three nautical miles seaward of the mark of the mainland of Western Australia and t f King Sound of 16°21.47´ south latitude and Jac garra Creek and in the Fitzroy River n ´ latitude’. The principal fishing areas from the ambridge Gulf in the KGBF are illustrated in Kimberley Gillnet Figure 1.
Recreational The North Coas ich encompasses the Pilbara and Kimberley om the Ashburton River south of Onslow to order (all land and water north of 21º46’ d east of 114º50’E longitude).
anagement arrangements
ommercial he KGBF is managed primarily through input controls in
the form of limited entry, seasonal and spatial area closures and gear restrictions.
Access to the KGBF is currently limited to seven licences.
There is a closed season in which fishing is prohibited in the KGBF. In the southern KGBF (west of Cunningham Point, 123º08.23´ E longitude) the closure extends from 1 December to 31 January the following year, while in the northern section of the KGBF (east of Cunningham Point) the
e
of barramundi resources in the Kimberley region. These arrangements include commercial fishing area closures around major town sites and recreationally important fishing locations, namely Broome Jetty to Crab Creek, Jacks Creek, Yardogarra Creek, Thangoo Creek, Cape Bossut to False Cape Bossut, Derby Jetty, the Fitzroy River north of 17º27 S and the lower Ord River upstream of Adolphus Island.
In March 2007, representatives from the commercial, ational and charter fishing sectors agreed to a revised
agreement, the Accord for the Future Management of 7-2012. The new Accord
includes a number of recommendations for improved a a er of un th
stocks in the Kimberley region. The Department of Fisheries or co ati R we ern
Australian Fishing Industry Council to progress the outcomes 7 Accord ag .
riona en t br g s
levels of barramundi are maintained, special fishing rules are in place for three key fishing areas: Fitzroy River area and King Sound (bag and possession limit of 2 fish); Broome area (bag limit of 1 fish, possession limit of 2 fish); and the Ord River area (bag and possession limit of 1 fish). Fish species in the North Coast bioregion are assigned to a number of risk
or species group specific. Recreational set and haul netting is
ibited in all water oast bioregion with the tion of haul netting the Dampier
ago (between Cape P ton and Cape Lambert) with following restrictions: ts must not exceed 30 tres in length; mullet ar nly species to be retained all other species must rned to the water.
search summary
onthly catch and effort da m the commercial fishery used to assess the status rramundi stocks targeted by
y. This status report is compiled annually and ided to industry and re management.
The biological characteristics required for fisheries management for both the threadfin species have been completed (Pember et al. 2005). These data may be used to provide a stock assessment of threadfin in the KGBF and Pilbara in the future. The bycatch of elasmobranchs in the KGBF and the Pilbara Coast fishing area was examined during 2002 and 2003 (McAuley et al. 2005). The stock structure of both threadfin species is currently being assessed in FRDC Project 2007/032. This project will be completed in 2010.
Recreational Recreational fishing activities are concentrated around keypopulation centres, with a seasonal peak in activity during dry season (winter months).
Governing legislation/fishing authority
Commercial imberley GillnK
Kimberley
RF
Fish Resources Management Regulatiosubsidiary legislation. recre
ecreational Fishing Advisor Commi e; We Kimbe
(Broo
E
B
Commercial The waters of the KGBF are defined as ‘all Western Australian waters lying north of 19° south latitude and west of 129° eas
categories for the purposes of recreational fisheries management. The bag and size limits are species-specific
low water he waters oks Creek, Yardo
orth of 17°27Broome coast to C
t Bioregion, wh regions, extends fr
the WA/NT bS latitude an
M
CT
closure extends from 1 November to 31 January the following year. There are also limits on the length of net and mesh sizes to be used in the fishery.
Following the development of the Accord for Future Management of the Barramundi Resource 2000-2005, additional management arrangements were introduced for thcommercial, charter and recreational sectors to facilitate improved management and conservation
Barramundi and Threadfin 200
man gement nd cons vation barram di and readfin
is w king in llabor on with ecfish st and the West
from the 200 reement
RecAs a pre
eationacaut
l ry measure to sure tha eedin tock
proh s of the North C in the waters of
resexcepArchipelthe haul nemeand
e the obe retu
Re
M ta froarethis fisher
of ba
prov gional
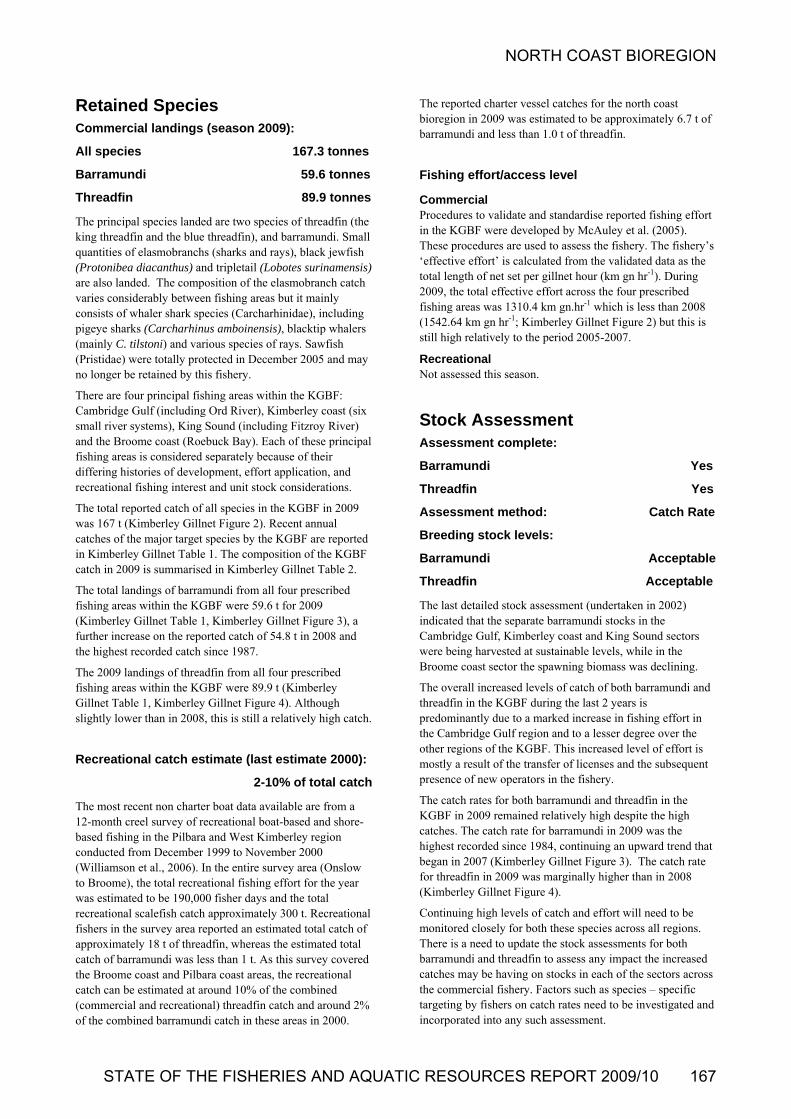
NORTH COAST BIOREGION
Retained Species Commercial landings (season 2009):
All species 167.3 tonnes
Barramundi 59.6 tonnes
Threadfin 89.9 tonnes
The principal species landed are two species of threadfin (the king threadfin and the blue threadfin), and barramundi. Small quantities of elasmobranchs (sharks and rays), black jewfish (Protonibea diacanthus) and tripletail (Lobotes surinamensis) are also landed. The composition of the elasmobranch catch varies considerably between fishing areas but it mainly consists of whaler shark species (Carcharhinidae), including pigeye sharks (Carcharhinus amboinensis), blacktip whalers (mainly C. tilstoni) and various species of rays. Sawfish (Pristidae) were totally protected in December 2005 and may no longer be retained by this fishery.
There are four principal fishing areas within the KGBF: Cambridge Gulf (including Ord River), Kimberley coast (six small river systems), King Sound (including Fitzroy River) and the Broome coast (Roebuck Bay). Each of these principal fishing areas is considered separately because of their differing histories of development, effort application, and recreational fishing interest and unit stock considerations.
e KGBF in 2009 t annual
illnet Table 2.
he total landings of barramundi from all four prescribed fishing areas within the KGBF were 59.6 t for 2009
Gillnet Figure 3), a 54.8 t in 2008 and
fin from all four prescribed fishing areas within the KGBF were 89.9 t (Kimberley Gillnet Table 1, Kimberley Gillnet Figure 4). Although slightly lower than in 2008, this is still a relatively high catch.
Recreational catch estimate (last estimate 2000):
2-10% of total catch
The most recent non charter boat data available are from a 12-month creel survey of recreational boat-based and shore-based fishing in the Pilbara and West Kimberley region conducted from December 1999 to November 2000 (Williamson et al., 2006). In the entire survey area (Onslow to Broome), the total recreational fishing effort for the year was estimated to be 190,000 fisher days and the total recreational scalefish catch approximately 300 t. Recreational fishers in the survey area reported an estimated total catch of approximately 18 t of threadfin, whereas the estimated total catch of barramundi was less than 1 t. As this survey covered the Broome coast and Pilbara coast areas, the recreational catch can be estimated at around 10% of the combined (commercial and recreational) threadfin catch and around 2% of the combined barramundi catch in these areas in 2000.
The reported charter vessel catches for the north coast bioregion in 2009 was estimated to be approximately 6.7 t of barramundi and less than 1.0 t of threadfin.
Fishing effort/access level
Commercial Procedures to validate and standardise reported fishing effort in the KGBF were developed by McAuley et al. (2005). These procedures are used to assess the fishery. The fishery’s ‘effective effort’ is calculated from the validated data as the total length of net set per gillnet hour (km gn hr-1). During 2009, the total effective effort across the four prescribed fishing areas was 1310.4 km gn.hr-1 which is less than 2008 (1542.64 km gn hr-1; Kimberley Gillnet Figure 2) but this is still high relatively to the period 2005-2007.
Recreational Not assessed this season.
Stock Assessment Assessment complete:
Barramundi Yes
Threadfin Yes
Assessment method: Catch Rate
le
Threadfin Acceptable
The last detailed stock assessment (undertaken in 2002) indicated that the separate barramundi stocks in the Cambridge Gulf, Kimberley coast and King Sound sectors
Broome coast sector the spawning biomass was declining.
The overall increased levels of catch of both barramundi and threadfin in the KGBF during the last 2 years is predominantly due to a marked increase in fishing effort in the Cambridge Gulf region and to a lesser degree over the other regions of the KGBF. This increased level of effort is mostly a result of the transfer of licenses and the subsequent presence of new operators in the fishery.
The catch rates for both barramundi and threadfin in the KGBF in 2009 remained relatively high despite the high catches. The catch rate for barramundi in 2009 was the highest recorded since 1984, continuing an upward trend that began in 2007 (Kimberley Gillnet Figure 3). The catch rate for threadfin in 2009 was marginally higher than in 2008 (Kimberley Gillnet Figure 4).
Continuing high levels of catch and effort will need to be monitored closely for both these species across all regions. There is a need to update the stock assessments for both barramundi and threadfin to assess any impact the increased catches may be having on stocks in each of the sectors across the commercial fishery. Factors such as species – specific targeting by fishers on catch rates need to be investigated and incorporated into any such assessment.
The total reported catch of all species in thwas 167 t (Kimberley Gillnet Figure 2). Recencatches of the major target species by the KGBF are reported in Kimberley Gillnet Table 1. The composition of the KGBF catch in 2009 is summarised in Kimberley G
Breeding stock levels:
Barramundi Acceptab
T
(Kimberley Gillnet Table 1, Kimberley further increase on the reported catch ofthe highest recorded catch since 1987.
The 2009 landings of thread
were being harvested at sustainable levels, while in the
STATE OF THE FISHERIES AND AQUATIC RESOURCES REPORT 2009/10 167

NORTH COAST BIOREGION
168 DEPARTMENT OF FISHERIES
Non-Retained Species Bycatch species impact: Low
The fishery operates at a relatively low intensity over a wide area of the Kimberley region, specifically targeting barramundi and threadfin. The fishing gear uses large mesh sizes, and hence does not generate a significant bycatch of species important to other sectors, but does take some sharks and rays. Where practicable, sharks and rays are released alive. However, there is some mortality of sharks and rays associated with gillnet capture. Because of the low spatial density of fishing effort relative to the widespread distribution of these species and the size-selectivity of the permitted mesh sizes, these impacts are unlikely to be significant to the stocks involved.
Protected species interaction: Low
The fishing gear used for this fishery (gillnets) is known to result in the bycatch of protected estuarine crocodiles (Crocodylus porosus) and sawfish (Family Pristidae). These species are generally released alive or avoided as far as is practicable. Because of the low effort levels and the low spatial intensity of fishing effort, these impacts are unlikely to pose a significant threat to the sustainability of the stocks
servation ct 1999 as critically endangered and endangered,
respectively are rare in the KGBF. However, as these species look similar to other whaler shark species, they may be
hery’s low effort
ishing operations of the KGBF are unlikely to pose a significant threat to the sustainability of the stocks of these species.
Ecosystem Effects Food chain effects: Low
This fishery is unlikely to be having anything but a minimal effect on the nearshore and estuarine ecosystem of the Kimberley region.
Habitat effects: Low
The fishing gear has minimal impact on the habitat. The area and habitat fished is subject to extreme tidal currents and associated effects.
Social Effects Commercial During 2009, seven vessels fished in the KGBF with an average crew level of approximately 2.8 people, indicating that at least 20 people were directly employed in the fishery. There was additional employment through local processors and distribution networks. The fishery provides fresh fish for the local communities and the tourism industry throughout
the Kimberley region.
Recreational A significant number of recreational and charter anglers also fished across the region.
Economic Effects Estimated annual commercial value (to fishers)
for year 2009: $1 Million
The KGBF landed a total of 167 t of fish in 2009, for a catch value of approximately $1 million. This estimate is based on the landed weight of each species recorded in the CAES system and the 2009 average price per kilogram of whole weight of each species as supplied by fish processors.
Fishery Governance Current Fishing (or Effort) Level Acceptable
The fishery is operating above the current target catch range for the key indicator species (barramundi). The catch rate for this species is slightly above the maximum of the past five years. The breeding stock levels of barramundi are considered adequate and therefore the current fishing and effort levels are acceptable but should be reviewed.
Target commercial catch range:
Barramundi 25-40 tonnes
The target catch range for barramundi (25–40 t) was derived from a double exponential smoothed forecasting model of the
e five years from 1999 to 2003, the level of barramundi catch was at the top end of the target catch range. The catch in 2004 exceeded the target range, although this was achieved at a CPUE reflecting higher abundance levels than during the 1980s and 1990s. The barramundi catch in 2009 was above the target range and while it was considered acceptable a review of the status of barramundi is required.
New management initiatives (2010/11)
In March 2007, representatives from the commercial, recreational and charter fishing sectors agreed to a revised agreement, the Accord for the Future Management of Barramundi and Threadfin 2007-2012. The new Accord includes a number of recommendations for improved management and conservation of barramundi and threadfin stocks in the Kimberley region. The Department of Fisheries plans to develop a community awareness and education package to facilitate the release of outcomes of the Accord process, in order to support the recommended legislative changes for the improved management of these stocks.
The Department plans to review the KGBF management plan in order to modernise the fishery management arrangements and address concerns in relation to transferability of licences and the potential for shifting of effort and localised depletion of stocks.
of these species.
Catches of the speartooth shark (Glyphis glyphis) or the northern river shark (Glyphis garricki), which are listed under the Environment Protection and Biodiversity Con
A
captured but misidentified. Given the fislevels, particularly inside the freshwater drainages in which these species are most likely to occur, the f
annual barramundi catches of the KGBF up to 1999. For th
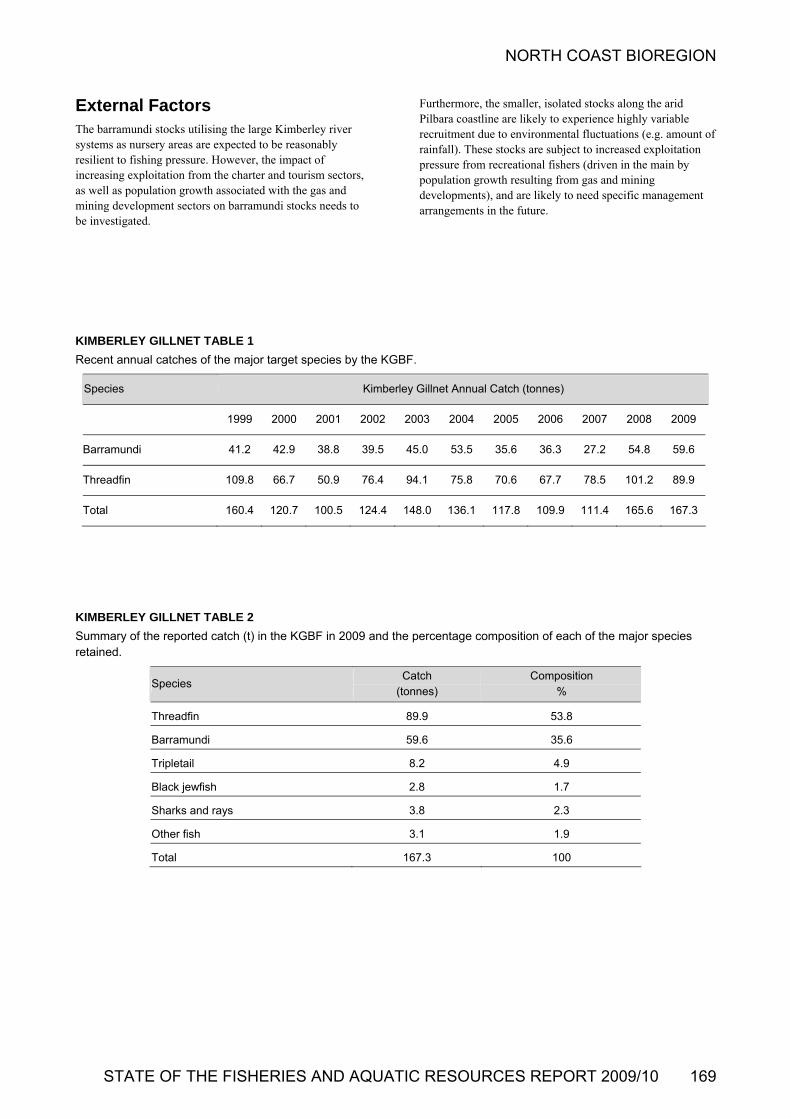
NORTH COAST BIOREGION
External Factors The barramundi stocks utilising the large Kimberley river
Furthermore, the smaller, isPilbara coastline are likely
systems as nursery areas are expected to be reasonably recruitment due to environmental fluctuations (e.grainfall). These stocks are subject to increas
resilient to fishing pressure. However, the impact of increasing exploitation from the charter and tourism sectors,
th associated with the gas and rs on barramundi stocks needs to
gated.
olated stocks along the arid to experience highly variable
. amount of ed exploitation
pressure from recreational fishers (driven in the main by population growth resulting from gas and mining developments), and are likely to need specific management arrangements in the future.
KGBF.
as well as population growmining development sectobe investi
KIMBERLEY GILLNET TABLE 1 Recent annual catches of the major target species by the
Species Kimberley Gillnet Annual Catch (tonnes)
1999 2000 2001 2002 2003 2004 2005 2006 2007 2008 2009
Barramundi 41.2 42.9 38.8 39.5 45. 27.2 54.8 59.6 0 53.5 35.6 36.3
Threadfin 109.8 66.7 50.9 76.4 94.1 75.8 70.6 67.7 78.5 101.2 89.9
Total 160.4 120.7 100.5 124.4 148.0 136.1 117.8 109.9 111.4 165.6 167.3
2
nd the p osition of each of the major species
KIMBERLEY GILLNET TABLE
Summary of the reported catch (t) in the KGBF in 2009 aretained.
ercentage comp
Species Catch Composition
(tonnes) %
Threadfin 89.9 53.8
Barramundi 59 35.6 .6
Tripletail 8 4.9 .2
Black jewfish 2.8 1.7
Sharks and rays 3.8 2.3
Other fish 3.1 1.9
Total 167.3 100
STATE OF THE FISHERIES AND AQUATIC RESOURCES REPORT 2009/10 169

NORTH COAST BIOREGION
KIMBERLEY GILLNET FIGURE 1
Location of the principal fishing areacoast (six small river systems), King
s for barramundi and threadf Sound (including Fitzroy Riv
GBF. Note: this map is indicative only
in (Cambridge Gulf (including Ord River), Kimberley er) and the Broome coast (Roebuck Bay)) within the
K
Kimberley Gillnet Annual Catch and Effort
Year
19841985
19861987
19881989
19901991
1992199
19941995
19961993 7
19981999
20002001
20022003
20042005
20062007
20082009
Cat
ch (
tonn
es)
0
20
40
60
80
100
120
140
160
180
Eff
ecti
ve E
ffo
rt (
km g
n-hr
-1)
600
800
1000
1200
1400
2400
1600
1800
2000
2200
CP
UE
(kg
/km
gn-
hr-1
)
0
20
40
60
80
100
120
140
160
Catch (tonnes)Effort (km gn hr)
CPUE (kg/km gn hr)
hours) and catc ver
KIMBERLEY GILLNET FIGURE 2
The annual total catch, effective effort (km gillnetthe period 1984 to 2009.
h per unit effort (CPUE, km gn.hr ) from the KGBF o-1
170 DEPARTMENT OF FISHERIES
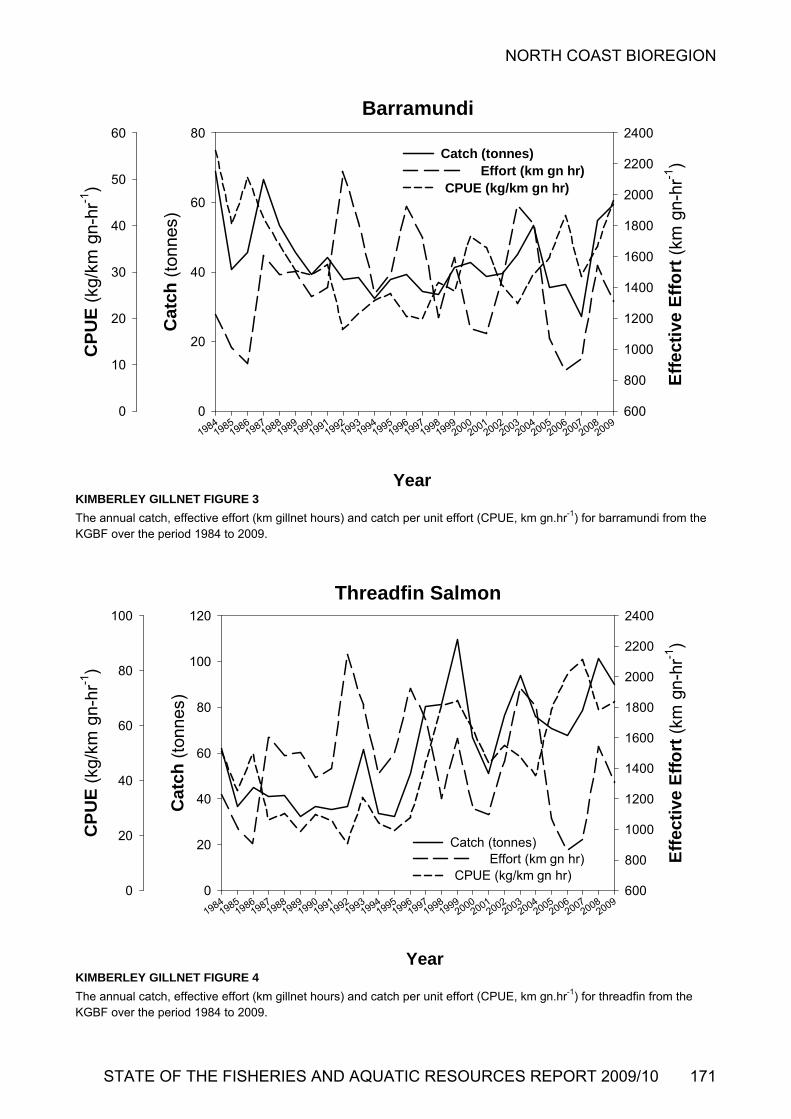
NORTH COAST BIOREGION
Barramundi
Year
19841985
19861987
19881989
19901991
199 9931994
19951996
19921
71998
19992000
20012002
20032004
20052006
20072008
2009
Cat
ch (
tonn
es)
0
20
40
60
80
Eff
ecti
ve E
ffo
rt (
km g
n-hr
-1)
600
800
1000
1200
1400
1600
1800
2000
2200
2400
CP
UE
(kg
/km
gn-
hr-1
)
0
10
20
30
40
50
60
Catch (tonnes)Effort (km gn hr)
CPUE (kg/km gn hr)
ch pe
KIMBERLEY GILLNET FIGURE 3
The annual catch, effective effort (km gillnet hours) and cat r unit effort (CPUE, km gn.hr-1) for barramundi from the KGBF over the period 1984 to 2009.
Threadfin
Y
Salmon
60
80
100
ear
19841985
19861987
19881989
19901991
199 931994
19951996
199219
71998
19992000
20012002
20032004
20052006
20072008
2009
Cat
ch (
tonn
es)
60
80
100
120 2400
2000
2200
gn-
hr-1
)
g/km
gn-
hr-1
)
1400
1600
1800
ffo
rt (
km
CP
UE
(k
0
20
40
Eff
ecti
ve E
0
20
40
600
800
1000
1200
Catch (tonnes)Effort (km gn hr)
CPUE (kg/km gn hr)
r unit effort (CPUE, km gn.hr-1) for threadfin from the
KIMBERLEY GILLNET FIGURE 4
The annual catch, effective effort (km gillnet hours) and cKGBF over th
atch pee period 1984 to 2009.
STATE OF THE FISHERIES AND AQUATIC RESOURCES REPORT 2009/10 171
NORTH COAST BIOREGION
North Coast Demersal Fisheries S. Boddington, M. s and B. Rome
tatus Report S.J. Newman, C. Wakefield, P. Stephenson, C. Skepper, D
Management input from R. Green and S. Blazeski
Cliff, G. Mitsopoulo
Main Features
Status
Pilbara:
Stock level Acceptabl
Fishing Level
Trap Fishery
e
Acceptable
ishing Level Acceptable
eror 159 t
t
Trawl Fishery Review required
Kimberley:
Stock level Acceptable
F
Current Landings
Pilbara:
Total 1622 t
Red emp
Rankin cod 75 t
Bluespotted emperor 173 t
Pilbara Fish Trawl Fishery 1044 t
Pilbara Fish Trap 455 t
Pilbara Line 123 t
Recreational 1.5% of total (2009)
Charter < 25 t
Kimberley (NDSF):
Total 1046 t
Red emperor 156
Goldband snapper 485 t
Recreational <1% of total (2009)
Charter < 5 t
Fishery Description The demersal fisheries in this region target, to varying levels, some or all of the following species, bluespotted emperor (Lethrinus punctulatus), rosy threadfin bream (Nemipterus furcosus), brownstripe snapper (Lutjanus vitta), crimson
)
. The main species landed are red emperor and
ilbara Trap Managed Fishery Management Plan 1992
snapper (Lutjanus erythropterus), red emperor (Lutjanus sebae), saddletail snapper (Lutjanus malabaricus), goldband snapper (Pristipomoides multidens), spangled emperor (Lethrinus nebulosus), frypan snapper (Argyrops spinifer) and Rankin cod (Epinephelus multinotatus).
Commercial
Pilbara The Pilbara demersal scalefish fisheries include the Pilbara Fish Trawl (Interim) Managed Fishery, the Pilbara Trap Managed Fishery and the Pilbara Line Fishery. The trawl fishery has until recently dominated the landed catch of demersal finfish in the Pilbara targeting all 10 species, with asubset of the main species taken by the trap and then the linefishery.
Kimberley The Northern Demersal Scalefish Managed Fishery (NDSFoperates off the north-west coast of Western Australia in the waters east of 120° E longitude. The permitted means of operation within the fishery include handline, dropline and fish trapsgoldband snapper.
Recreational Recreational fishing activities are concentrated in inshore areas around key population centres, with a peak in activity during the dry season (winter months).
Governing legislation/fishing authority
Commercial
Pilbara P
North Coast Shark Fishing (Professional) Notice 1993
Prohibition on Commercial Fishing for Demersal Scalefish (Pilbara Area) Order 1997
Pilbara Fish Trawl Fishery (Interim) Management Plan 1997
Prohibition on Fishing by Line from Fishing Boats (Pilbara Waters) Order 2006
Australian Government Environment Protection and Biodiversity Conservation Act 1999 (Wildlife Trade Order).
Kimberley Northern Demersal Scalefish Managed Fishery Management
Plan 2000
Commonwealth Government Environment Protection and Biodiversity Conservation Act 1999 (Export Exemption).
172 DEPARTMENT OF FISHERIES
NORTH COAST BIOREGION
Recreational Fish Resources Management Act 1994
l
epartment - in liaison with:
mmittee;
gional Recreational Fishing Advisory Committee
d
ish Trawl Fishery is situated in the Pilbara
6 ,500, 2,300 and 7,200 square
r iles. The exact latitudes
delineating the areas are listed in the Pilbara
ing the 30 m isobath. The exact latitudes and
ater mark on the western side
ing d
ngitudes delineating the Fishery are listed in the on Fishing by Line from Fishing Boats (Pilbara
out to the edge of the Australian Fishing Zone (200 autical mile) limit under the Offshore Constitutional
th Coast Figure 2). The fishery
Figure
ctivity. Zone A is an inshore developmental area and Zone C elopmental area representing e inshore waters in the vicinity
are closed to commercial fishing. This closure
onal
ged
d nt
bara
Trawl Fishery is closed to
rea
ch
e
Fish Resources Management Regulations 1995 and other subsidiary legislation.
Consultation processes
Commercial
Pilbara Department - engagement with:
Industry meetings for the fish trawl, trap and line fisheries; and
Western Australian Fishing Industry Council (WAFIC).
Kimberley Department – industry meeting for the NDSF and an annua
Broome Consultative Forum.
Recreational D
Recreational Fishing Advisory Co
Pilbara Re(Karratha);
West Kimberley Regional Recreational Fishing Advisory Committee (Broome);
Annual Broome Consultative forum; an
Recfishwest and stakeholder meetings
Boundaries
Commercial
Pilbara The Pilbara Fregion in the north west of Australia. It occupies the waters north of latitude 21°35’S and between longitudes 114°9’36”E and 120°E. The Fishery is seaward of the 50 m isobath and landward of the 200 m isobath (North Coast Figure 1).
The Fishery consists of two zones, Zone 1 in the south west of the Fishery (which is closed to trawling) and Zone 2 in the North, which consists of six management areas. Areas 1 to each cover 1,300, 1,800, 880, 1nautical miles respectively. The total area available fotrawling is 14,980 square nautical mand longitudesFish Trawl Fishery (Interim) Management Plan 1997.
The Pilbara Trap Managed Fishery (North Coast Figure 1) lies north of latitude 21°44’S and between longitudes 114°9´.6’E and 120°00’E on the landward side of a boundary approximating the 200 m isobath and seaward of a line generally followlongitudes delineating the fishery are listed in the Pilbara Trap Management Plan 1992.
The Pilbara Line fishing boat licensees are permitted tooperate anywhere within "Pilbara waters". This means all waters bounded by a line commencing at the intersection of 21°56’S latitude and the high wof the North West Cape on the mainland of Western Australia; thence west along the parallel to the intersection of
21°56’S latitude and the boundary of the Australian FishZone and north to longitude 120E. The exact latitudes anloProhibitionWaters) Order 2006.
Kimberley The waters of the Northern Demersal Scalefish Fishery are defined as all Western Australian waters off the north coast of Western Australia east of longitude 120E. These waters extendnSettlement arrangements (Noris further divided into two fishing areas, an inshore sector (Area 1) and an offshore sector (Area 2) (see North Coast
2). Under a voluntary industry agreement, the offshore sector (Area 2) has been further divided into 3 zones, A, B and C. Zone B comprises the area of historical fishing ais an offshore deep slope devwaters deeper than 200 m. Thof Broomewas put in place to reduce the potential for conflict between commercial fishers and recreational, charter and customary fishers. This closure is represented in North Coast Figure 2 as the area that is closed to trap fishing.
RecreatiThe north coast bioregion, which encompasses the Pilbaraand Kimberley regions, extends from the Ashburton River south of Onslow to the WA/NT border (all land and water north of 21º46’S latitude and east of 114º50’E longitude), with the exception of some areas within Marine Parks.
Management arrangements
Commercial
Pilbara The Pilbara Fish Trawl Interim Managed Fishery is manathrough a combination of area closures, gear restrictions, andby the use of output controls in the form of individual transferable effort allocations monitored by a satellite-basevessel monitoring system (VMS). This Interim ManagemePlan was implemented for the fish trawl fishery in the Pilin 1998, with effort levels determined to achieve the best yield from the Fishery while keeping exploitation rates of the indicator species at sustainable levels. A large amount of the area of thetrawling, and has been since the implementation of the (Interim) Management Plan. Zone 1 of the Fishery and A3 of Zone 2 of the Trawl Fishery have been closed since 1998. In addition, Area 6 of Zone 2 has been closed since the commencement of the Plan except for two periods of researtrawling in 1998 and 1999. The area inshore of the 50 mdepth isobath is also closed to trawling. Areas 1, 2, 4 and 5are open to fishing all year, with separate effort allocations (in hours) in each Area, as outlined in the (Interim) Management Plan. The open areas of the Trawl Fishery artrawled with varying intensity due to differing effort allocation, substrate composition and economic considerations (e.g. distance from port). There are 11 permits for the Fishery, with the combined effort allocations being consolidated over time onto 3 full-
STATE OF THE FISHERIES AND AQUATIC RESOURCES REPORT 2009/10 173

NORTH COAST BIOREGION
174 DEPARTMENT OF FISHERIES
e
se
00 dealt with
to shers.
the Prohibition Waters)
Order 2006. 9 Fishing Boat Licences are exempted from this prohibition for any nominated 5-month block period within the year.
Comprehensive Ecologically Sustainable Development (ESD) assessments were submitted in 2004 for both the Pilbara Trap and Trawl Fisheries. These ESD assessments determined that performance should be assessed annually for breeding stock levels, protected species interactions and habitat effects. As a result, the Pilbara Trap Fishery was declared an approved Wildlife Trade Operation in November 2004 for a period of three years. This lapsed in December 2007. The Pilbara Fish Trawl Interim Managed Fishery was n approved Wildlife Trade Operation until June 2010. The
Environment, Water, Heritage and the Arts
fishing days per 160 unit licence), in order to
l
rget
days.
will
eror are forthcoming. In 2009, the Zone A
)
ls (trap
ually assigned to the 11 licences. Each trap must have n internal volume equal to or less than 2.25 m3. There is no
the number of traps that can be fished per vessel. However, as each licensee is allocated an annual effort quota in ‘standard fishing days’ based on the use of 20 traps (or 5 lines) per day, if the number of traps (or lines) being fished increases, the number of allowable fishing days declines. The number of days fished, as recorded by the vessel monitoring system, is converted to standard fishing days. A comprehensive ESD assessment of this fishery has determined that performance should be reported annually against measures relating to breeding stocks of the two indicator species, red emperor and goldband snapper, and the cod/grouper complex (a suite of more than 10 species), as reflected by their catch levels.
Recreational Demersal fish in the North Coast bioregion are assigned to a number of risk categories for the purposes of recreational fisheries management.
ersal fish, particularly the icon species such as coral ime recreational
ues will be a ents across this
h summary
f
determined species, red emperor, rankin cod, bluespotted
aged are
f two indicator ecies, red emperor and rankin cod, is assessed using the
time vessels.
The Trap Fishery is also managed primarily by the use of input controls in the form of individual transferable effort allocations monitored with a satellite-based vessel monitoringsystem (VMS). There has also been a closure to trapping inArea 3 since 1998. A review of the Trap Fishery was undertaken in 1996 and based on performance criteria, thnumber of licences was halved.
The authority to fish in the Trap Fishery is limited by reference to a specified number of trap days expressed in terms of units of entitlement. The capacity is currently limited to 5456 trap days, however, the Management Plan allows the Chief Executive Officer to alter the value of theunits.
The individual transferable effort management arrangements introduced into the Trap Fishery in January 20the issue of latent effort in the Fishery and proved effective atholding the Fishery within its acceptable 300 t limit at the time. The catch range has since been increased in responsethe increased stock size in the areas used by the trap fiThere are 6 licences in the Fishery, with the allocation consolidated onto 2 vessels in 2009.
The Line Fishery continues to be restricted byon Fishing by Line from Fishing Boats (Pilbara
aDepartment of(DEWHA) is currently in the process of assessing a new application from the Department of Fisheries for another Pilbara Fish Trawl Fishery Wildlife Trade Operation.
Kimberley The Northern Demersal Scalefish Fishery is managed primarily through input controls in the form of an annual fishing effort capacity, with supplementary gear controls and area closures. The annual fishing effort capacity limits the amount of effort available in the fishery to achieve the notional target total allowable catch (TAC). The annual effort capacity is based on the available research advice andin consultation with licensees. The effort capacity is set by the Chief Executive Officer and is then allocated among license holders through units of entitlement on Managed Fishery Licences, for use in Area 2 of the Fishery. An Exemption provides for additional effort in Zone A (56 standard fishing days per 160 unit licence) and Zone C (50 standardencourage fishers to explore the lesser-fished offshore waters of the NDSF.
The notional target TAC for Zone B is a recommended leveof catch for the entire demersal species complex and is
derived from the estimated sustainable catch of the key taspecies (determined through stock assessments) and their historical proportions in the catch. In 2009, Zone B effort allocation was 1,144 standard fishing
The areas that encompass Zone A and Zone C are likely to be lower in productivity compared with Zone B, and thus the notional exploratory TAC set for Zone A and Zone Cneed to be revised if substantial catches of either goldband snapper or red empeffort allocation was 616 standard fishing days.
Access to the offshore sector (Area 2) of the NDSF is limitedto 11 licences under an individually transferable effort (ITEsystem. This allows the effort quota to be operated by a lesser number of vessels. For example, during 2009, 7 vessefishing only) collectively held and operated the effort individarestriction on
Demtrout and red emperor, are considered prtarget species. As such, resource-sharing issconsideration in future management arrangembioregion.
Researc
Pilbara Monitoring and assessment of the Pilbara trawl, trap and line fisheries includes the collection of spatial data on effort and catch of 10 major target species from logbooks, VMS data, and weighed catches from unload data. Assessment of the status of the suite of retained demersal scalefish is based onthe performance of indicator species using various assessment methods. These methods include trend analysis ocatch rates using two measures of effort for five indicator species and the total catch in each of the trawl managed areas. In addition, otoliths are collected and ages for the indicator emperor, and goldband snapper in each of the trawl-manareas and the trap fishery. Estimates of fishing mortalityderived from each of these age structures and compared to internationally recognised benchmarks or Exploitation Reference Points (ERPs, see Stock Assessment section). Every four years the spawning biomass osp
NORTH COAST BIOREGION
age-composition and catch rate data in an age-structured
trawling in Areas 3 and 6 on the North West Shelf.
cies, red
200
sources of this zone are unlikely to be substantial, nd given the lower production potential of these longer-
, deeper-slope reef fish, the sustainable catch from this zone is likely to be low.
Retained Species Commercial landings (season 2009):
Pilbara Fish Trawl 1,044 tonnes
Pilbara Fish Trap 455 tonnes
Pilbara Line 123 tonnes
Kimberley (NDSF) 1,046 tonnes
ilbara major species for 2009 are shown in North
et and
mperor 108 t 52 t), crimson snapper 92 t (107 t), goldband snapper 69 t
emperor 66 t (55 t), brownstripe snapper 62 t (47 cod 13 t (15 t) and
-product d squid.
ere red emperor 92 t (97 t), crimson snapper 78 t t),
1996 (North Coast Figure 4). Following 1996,
. The as
008 due mainly to an increased vel of catch from Zone A of the fishery (North Coast Table
Lutjanus sebae)
g the remainder of the catch. The catch of the major
n
the
f goldband snapper up from 457
to 2009 (45 . The catch of the major species by zone in the NDSF is
described in North Coast Table 8. the catch, effort and catch rates of red emperor, goldband snapper and the cod/grouper complex in Zone B are depicted in North coast Figures 5-7.
The 2009 catch of goldband snapper, red emperor and cods/groupers were all within acceptable levels as defined in the exemption for this fishery (see ‘Fishery Governance’ section), although the catch of goldband snapper was close to the trigger point (20% increase in average catch of the previous 4 years). The commercial catches of key species and species groups from across the North Coast Bioregion and
eir relative contribution to catches within the Pilbara and tors in 2009 are summarised in North Coast
ilbara 1.5%
<1%
and
ilbara ies. The reported charter vessel
rsal scalefish in the offshore waters of the
ents, catches are likely to
model.
Discussions are in progress on developing a collaborative project with CSIRO to assess ecosystem recovery since closure to
Kimberley Monitoring and assessment of the status of the demersal fishstocks in the NDSF is determined annually using catch andcatch rates of the major species or species groups, and every three to four years using an age-based stock assessment model to assess the status of the two indicator speemperor and goldband snapper based on age-composition data collected in the previous years. Ongoing monitoring of this fishery is being undertaken using both catch and effort logbook and VMS data.
An FRDC-funded research project commenced in late 2006. This project aims to examine the relative catching efficiency of traps in the NDSF and to investigate resource availability and contribute to the stock assessment process in the NDSF.
The future catch from the NDSF may also include somespecies from the waters of Zone C in depths greater thanm. The realived
PCatches of theCoast Table 1. The catches by different fishing methods for the years 1985 to 2009 are shown in North Coast Table 2.
The fish trawl catch decreased in 2009 and is below the targcatch range. The decrease was due to a decrease in effortcatch rate of some species. The major target species landedby the trawl fishery in 2009 (2008 catch in brackets) were rosy threadfin bream 165 t (142 t), bluespotted e(1(78 t), redt), saddletail snapper 51 t (57 t), Rankin spangled emperor 10 t (10 t). The total retained bywas 73 t (37 t) including shark, bugs, cuttlefish, an
The trap fishery catch decreased from 508 t in 2008 to 455 t in 2009, back within the 400-500 t target catch range. Major species taken by the trap fishery in 2009 (2008 figures in brackets) w(34 t), bluespotted emperor 65 t (97 t), Rankin cod 60 t (54 goldband snapper 32 t (25 t) and spangled emperor 15 t (29t).
Demersal scalefish catches taken by line fishing in 2009 wereslightly higher than that reported in 2008. This was mainly due to an increase in catches of ruby snapper from 12 t in
2008 to 37 t in 2009. Catches of goldband snapper in 2009 were similar to 2008, 22 t and 24 t, respectively (North Coast Table 1).
Kimberley The reported catch in the NDSF rose steadily after the initial development period from 1990 to 1992, reaching a peak in catch levels incatch levels decreased and were relatively stable in the period from 1998 to 2003; total catch began to increase in 2004total catch of demersal scalefish in the NDSF in 2009 whigher than that reported in 2le7 and 8).
The NDSF principally targets red emperor (and goldband snapper (Pristipomoides multidens and related Pristipomoides species), with a number of species of snappers (Lutjanidae), cods (Serranidae) and emperors (Lethrinidae) comprisintarget and secondary target species over the last six years isprovided in North Coast Table 7. The species composition ofthe landed catch in 2009 is similar to that reported in 2008. I2009 the total catch of red emperor was 156 t, down fromreported catch of 173 t in 2008. However, there was an increase in the landed catch ot in 2008 to 485 t in 2009, as well as a slight decrease in the cods/groupers catch, down from 148 t in 2008 to 142 t in 2009. The composition of the cod/grouper catch complex isdominated by Rankin cod (Epinephelus multinotatus). The
Rankin cod decreased from 2008 (57 t)catch oft)
thKimberley secTable 10.
Recreational catch estimate (season 2009):
P
Kimberley
Pilbara While there is a major recreational fishery in the Pilbarathe charter sector is an increasing user of the resource, the inshore closures to the commercial sector provide a high degree of spatial separation between the user groups. The recreational and charter sectors do not catch significant quantities of most species targeted by the commercial Pfish trawl, trap and line fishercatch of demePilbara (depth > 30 m) in 2009 is estimated to be 1% (~19 t) of the commercial catch. Due to the increasing population in the Pilbara from mining developm
STATE OF THE FISHERIES AND AQUATIC RESOURCES REPORT 2009/10 175

NORTH COAST BIOREGION
increase in the future.
Kimberley Historically, there has been little recreational or charter boat fishing effort directed towards the deeper-water fish species in Area 2 of the NDSF that are the key species targeted by commercial fishers. However, this is now changing with charter vessels moving into the offshore waters of the NDSF. The reported charter vessel catch of demersal scalefish in thoffshore waters of the NDSF (depth > 30 m) in 2009 is estimated to be less than 1% (<5 t) of the commercial catch.Most of the recreational fishing effort targeting demersafinfish in the Kimberley region is thought to be concentrin the Broome sector of
e
l ated
Area 1, which is closed to
oast Table 3). The trawl fishery effort is
e 87.5% in Area 1, 104.5% in in Area 4 and 97.4% in Area 5. Note, that
t in trap days ith a value per unit of 1 unit = 1 trap day), with 97% of the
S. This number of units 6 days fished with an
istory of effort allocation in the NDSF since the introduction detailed in North
e 9.
in Zone B in 2009 was 104 fishing boat
was not used.
Yes
ch rates
l
ptable
here are three forms of assessment used that combined, mine stock ies that
he entire demersal suite of species. The different
re
et
shing mortality should not exceed; (2) Threshold
ass levels
s shown in North Coast Figures 3 are derived
in each management area on ach trip from VMS data. VMS data has only been available
rt was pooled for each vessel ed to determine the annual
95% confidence intervals with a natural log
commercial fishing. The magnitude of recreational fishing catch is small relative to the total commercial catch. However, the increasing number of vessels associated with oil and gas developments in the Kimberley region has the capacity to significantly increase the level of recreational catch taken from inshore and offshore waters of the NDSF.
Fishing effort/access level
Pilbara The fishing effort in the trap and line sectors of the commercial fishery is based on the monthly catch and effort returns (North Crecorded as the net bottom time (hours) taken from skippers’ logbook data, validated by VMS data.
The trawl fleet had the equivalent of four full-time vessels. The percentage of allocated hours used by the trawl fleet during the 2008/09 season werArea 2, 104.2%trawling has not been permitted in either Area 3 or Area 6 since 1998 and trapping has not been permitted in Area 3 since 1998.
The number of trap days allocated, the number of days used and the percentage of the allocation used for the period 2000–2009 are shown in North Coast Table 4. In 2009, trap fishers were allocated 5,456 trap days (capacity is sewunits used as calculated from the VMequates to 469 days allocated and 45average of 10.3 traps per day.
In 2009, line fishers reported operating for 294 days, compared with 326 days in 2008.
Kimberley The six fish trap vessels that fished in the NDSF in 2009 reported using between 20 and 38 fish traps per day. No line fishing was undertaken in Zone B of the NDSF in 2009. The hof the ITE management system in 1998 isCoast Tabl
The effort allocated days per licence, or a total of 1,144 standard fishing days (i.e. using 20 traps) (North Coast Table 9). The number of standard fishing days (SFDs) recorded in Zone B using VMS data was 938 SFDs (82%). That is, 18% of effort allocated to Zone B in 2009
A total of 616 standard fishing days was allocated to Zone Ain 2009. The number of standard fishing days (SFDs)
recorded using VMS data was 149, indicating that 76% remained unutilised in Zone A at the end of the season.
Stock Assessment Assessment complete:
Pilbara Yes
Kimberley
Assessment method:
Pilbara Cat
Fishing mortality and age-structured mode
Kimberley Age Structured Model
Breeding stock levels:
Pilbara
Trap Fishery Acceptable
Trawl Fishery Acceptable
Kimberley Acce
Pilbara Tconstitute a weight of evidence approach to deterstatus based on the performance of indicator specrepresent tforms of assessment are applied to each indicator species. Catch rate analyses are used to assess five indicator species and the total catch for trawl managed Areas 1, 2, 4 and 5. Fishing mortality estimates (F) derived from age structudata are used to assess red emperor, rankin cod, goldband snapper and bluespotted emperor relative to internationally recognised exploitation reference points (ERP) based on ratios of natural mortality. The ERPs include (1) the Targlevel, where F ≤ 2/3 the ratio of natural mortality (M), for which filevel, where F = M, which indicates fishing has exceeded sustainable levels; and (3) Limit level, where F = 1.5M, which indicates that fishing has greatly exceeded sustainable levels. An age-structured model incorporating catch rates and mortality estimates is used to assess spawning biomfor red emperor and rankin cod.
The catch rateusing logbook catch data and adjusted according to the unload data, so that the catch matches the reported unloads and the spatial component is obtained from the logbooks. There are two measures of effort used to derive catch rates including the duration of the trawl shots as reported in logbooks and the time spent esince 2000. The catch and effoand month and an ANOVA uscatch rate andtransformation. A moderate efficiency measure (1-2%) was included in the graphs but not the analyses.
The mean trawl catch rates of the indicator species and the total catch have been decreasing annually since about 2004
176 DEPARTMENT OF FISHERIES

NORTH COAST BIOREGION
(North Coast Figures 3). In 2009, mean trawl catch ratfour of the five indicator species (excl
es of uding goldband
ipe snapper and the total catch. This is most
igh rate of fishing mortality of red emperor (> ERP imit level) in the western areas (Areas 1 and 2) of the trawl shery (Table 5), and the declining catch rates of several pecies including the indicator species red emperor and nkin cod led to a reduction in effort of 16% in Areas 1 and
and 4% in Area 4 in 2009. This followed an industry agreed 07 and 2008.
rate catch and effort data, biological information and age composition data. The ass dicated that the spawning biomass for these indicator species of the Pilbara Dem le w els indicating satisfactory breeding stock levels.
KimberleThe catch per to 2009 was based on mean catch r from monthly retu 009 a major tr onthly returns to tr toof s l catch re rting. As a consequence there were two sources of catch returns for vessels operating in the NDSF during 2009; daily returns and monthly returns. Cat t mined for each source of return, and a weighting factor (based on SFD’s used under ach return type) applied to determine a composite single gure for CPUE. During 2009, Zone B catch rates for the
std day for red emperor, 582 g/std day for goldband snapper and 145 kg/std day for ods/groupers. Catch rates of goldband snapper were much igher than those in 2008 (434 kg/std day), while catch rates r cods/groupers also increased (126 kg/std day in 2008). atch rates for red emperor fell slightly (147 kg/std day in 008).
hile the 2009 level of catch for goldband snapper exceeded at in 2008, catches did not exceed the ESD trigger point of 20% increase in catch above the average of the past four ears. The 2009 catches of red emperor and cods/groupers
below
The most recent (2007) model outputs were reviewed by Prescott and Bentley in 2009. They concluded that the age-structured model used by the Department was appropriate although would benefit from modifications including the better determination of levels of model uncertainty. Improvements on the model have continued in 2009 and 2010.
Non-Retained Species B h s ies ct:
Pilbara Moderate
Kimberley Low
Pilbara T pen obs rogr esi moby and protected species in ctio com in September 2009. The outcomes of the observer program are reported in the FRDC report fo ect 008/ is project identified the need to trial a top-opening in the trawl nets to potentially further reduce the incidental capture of dolphins and turtles. A top-opening net configuration is currently being developed by industry and is scheduled for scientific trials in late 2010. The fish trap and line fisheries have minimal bycatch (see Kimberley below).
Kimberley As a result of the catching capacity of the gear and the marketability of most species caught, there is a limited quantity of non-retained bycatch in this fishery. The most common bycatch species is the starry triggerfish, Abalistes stellaris, but the numbers taken are not considered to be significant, and most are released alive.
snapper) and the total catch in Area 1 were higher in 2009 than in 2008. The mean trawl catch rates were also higher in Area 2 in 2009 compared to 2008 for red emperor, rankincod, brownstrlikely due to a reduction in effort in Areas 1 and 2 since 2007. The trends in mean trawl catch rates for indicator species (except goldband snapper) and the total catch continued to decrease in Areas 4 and 5 in 2009.
were below those taken in 2008. While the cods/grouper catch was above the average of the past 4 years it was the trigger point. The catch of red emperor was well below the average of the previous 4 years.
The spawning biomass of the key target species in the NDSF has been estimated by an age-structured stock assessment model in 2002 and 2007, in relation to the accepted international reference point for these types of species of 40% of virgin biomass.
The hLfisra2effort reduction in Area 1 in 20
A comprehensive assessment was conducted for red emperor and rankin cod using an age-structured model to integ
NDSF: The performance measures for this fishery relate he mai dequ sto
e ind y t atch e es of goldband creased from 20
t ex the performance indicator of a 20in e average ca of the
ding years. The 2009 level tches emperor and cods/groupers were both below that taken
8, w e red emperor catch also below taverage of the preceding four years. All three
s/gr are to c ntly have adequk leve ver cur elat
evel atc se s s r s furtion
essment in
ersal Fishery as a who ere above their target lev
y determination of unit of effort (CPUE) prior
ates calculatedansition from m establish an improved level
rns. During 2ip returns was undertakenpatial and tempora po
ch per unit of effort was de er
efiindicator species were 141 kg/kchfoC2
Wtha y
ycatc pec impa
he indecatch
dent erver p am dtera
gned tons was
nitor pleted
r Proj No. 2 048. Th
Pilbara: The major performa h stocks inbreeding sto long in rget g biomass is 40% of vel whe rst re el is 30 l spawning biomass. The spawning biomass levels of the target sp ssed as adeqsynthesizing the available data in an age structured m
nce measures for the fissheries relate to the Pilbara demersal fi
ck levels of the dicator species. The ta
-lived and shorter-lived level of spawnin
the initial lecorded. The limit lev
n the catch was fi% of the initia
ecies were asse uate in 2007 by
odel.
to t ntenance of a ate breeding cks for the key indicator speci s as icated b he c levels. In2009, thdid no
catchceed
in 08, but %
increase prece
catch above th four
tch of ca of red
in 200 ith th he
specie oups likely urre ate breeding shigh l
tocs of c
ls. Howeh of the
, the pecie
rent require
ively ther
investiga .
STATE OF THE FISHERIES AND AQUATIC RESOURCES REPORT 2009/10 177
NORTH COAST BIOREGION
178 DEPARTMENT OF FISHERIES
rotected species interaction:
ilbara Moderate
Negligible
ottle nosed dolphins, turtles, sea snakes, pipefish and seahorses. Turtles and sea snakes are generally returned toalive but dolphins, pipef seahors generallywhen landed. The catch of e species ded inskippers’ logbooks and r annual e Commonwealth Department of Environment, Water, Heritage and the Arts. The repor h of protected species in 2009 is shown in North Coast . The b h of dolphand turtles was similar in 2009 to 2008 and elow levels prior to the introduction usion gr awl nets2005. Given the area of ution an population size of these protected s e impa e fish trfishery on the stocks of otected s is likely minimal. There is a small h of green h, a specthat is protected in WA The tra ry has a negligible impact on pro es ( imberley below).
Kimberley Using trap gear in continental shelf regions is very unlikely to interact with protected s Recent observatiindicate that the potato c inephelus tukula), a totaprotected species, is pres igh numbers at discrete locations within the fish e potato arely entetraps due to its large size rth that its capacitpass through the entrance funnel into th .
Ecosystem Effects n effects:
ilbara Low
imberley Negligible
ilbara he current fish trawl fishery operates with standard stern awling gear (single net with extension sweeps) within an rea previously trawled by a Taiwanese fleet. Historical search by CSIRO has suggested that the extensive aiwanese pair trawl fishery caused a significant decrease in e biomass of finfish on the North West Shelf, and a change species composition towards smaller species. The current
WA fish trawl fishery, which developed when the fish stocks had begun to recover, uses a much larger mesh size and much lighter ground gear, and operates at lower exploitation rates. At the present levels of fish trawl, fish trap, and line catch,
Kimberley The need to maintain rela els of biomass for the
ies caug is fishery stock recruitment irement s in a negl sk to the overall
cosystem fr fishery.
Habitat effects:
Pilbara Moderate
ey w
bara th tat are limite those of the fish trawl
y, which to aro the North West igure 1). 3 and the waters inside
are pe ly closed to trawling, Zone 1 is to fish trawling, and Area no fish trawl
t alloca ce 1998.
in the a ually traw st research has indicated approx the sessile benthic fauna (e.g. ges) is d per year. I not known whether the chment eeds the ra re-growth.
berleyesign, th y has little impact on
abitat o lthough there may be some rare actions ral habitats are not common in
areas where the fishery operates.
l EPilbara It is estimated that 18 fishers on 4 vessels were directly employed during 2008 in the Pilbara Fish Trawl Fishery, and 6 fishers on 2 vessels in the trap fishery. The level of employment in the line-fishing sector is not available. At least 30 people were directly employed in the Pilbara demersal scalefish fisheries.
Kimberley Six vessels fished in the 2009 fishing season, with generally three crew per vessel, indicating that at least 18 people were directly employed in the NDSF.
P
P
Kimberley
Pilbara The fish trawl fishery has an incidental capture of b
the broader effect of the fishery on the food chain of the North West Shelf is considered to be at an acceptable level.
the water ish and
theses are is recor
dead
eported ly to th
ted catcTable 6 ycatc
well bins
of excl ids in tr in distribpecies, th
d expectedct of th awl
these pr specie to be catc
waters. sawfis
p fisheies
tected speci see K
pecies. video ons od (Epent in h
lly
ery. Th cod r rs and gi limits
e trapsy to
Food chai
P
K
PTtrareTthin
tively high levspecrequ
ht in ths result
to meet igible ri
e om the
Kimberl Lo
PilImpacts to e habi d tofisherShelf (North
is restricted Coast F
und 7% ofArea
50 m rmanent fishclosed effor
6 has hadtion sin
With reas act led, paPilbara: The performance measures for the impact of the trawl fishery on prote ies: sk quto record incidents of and to ise mortaIn 2009, the dolphin mortality rate was 4.8 per 1000 shots The present cat is less than that in 2005when grids were used e-tenth th 2005 whgrids were not being u he turtle rate wasper 1000 shots. Sygna wfish, an asnake catwere all below their maximum levels and erefore thcatch level is consider ptable (N Coast Ta6).
that spon
imately 10% ofdetache t is
deta rate exc te of
Kim As a result ofthe h
the gear dverall, a
e fisher
inter
cted spec ippers are re ired capture minim lity.
ch rate and onsed. T
at incatch
en 1.5
with co which
Socia ffects
thid, sa d se ches th
ortheir ble ed acce
Pilbara: formance measure for the fish trawl pact o rth West Sh cosystem was set as a
maximum area of operation by the trawlers. With the rrent c within the sed area of the fishery
epth), 46% e area is accessible to trawl v Plots of trawl activity from VMS data
dicate al area tra less than this as me of t is too rou trawled.
The perim n the No elf e
cu losures licen(50 m to 200 m d of ththe in
essels. the actu wled being
so his area gh to be
NORTH COAST BIOREGION
Economic Effects stimated annual commercial value
Kimberley $8.4 Million
These current estimated commercial values for the north coast Fisheries are based n the most recent price values for each specie e calculated for 009 calendar year, not neces the individual f y entitlement year.
Pilbara This estimate is based on landed weight and price of each species as supplied by ocessors. There little overall increase in fis in the last few The fish trawl demersal finfish catch is dominated by lower-valued species such as bluesp mperor and thre ream, and its value in 2009 was n. The fish d line catches are dominated valuable specie as red emperor and goldband snapper, and the deme calefish catch from these sectors valued at approxim ely $3.1 million (fish trap) and illion (line). Tfishery also has a sma nt of retained b uct valued at $0.1 million.
The catches from the P fisheries domina estern Australian metropolita ets and support cal fish-processing sector. The exports from this fisher ave been minimal in the last few due to the incre of the Australian dollar.
Kimberley The NDSF principally the higher-valu es such as the goldband snapp emperor. Th ery landed a total of 1046 t of de 2009 catch value of approximatel illion. This est is based on the landed weight species recorde tch returns and the average price per kilogram of whole weight of each species as suppli sh processors.
Fishery Governance Target commercial catch range:
Pilbara Fish Traw 2,000–2,800 tonnes
Pilbara Fish Trap 400–500 tonnes
Pilbara Line 50–115 tonnes
Kimberley (NDSF) 600–1000 tonnes (All Zones)
Current Fishing (or Effort) Level
Pilbara
Trap Fishery Acceptable
Trawl Fishery Not Acceptable
Kimberley Acceptable
Pilbara In the fish trawl fishery, the total catch was well below the target catch range, it is unclear if this is due to changed net
designs to reduce protected species captures or from reduced abundances in the trawled areas. The target catch range for the trawl fishery will be revised in late 2010 in association with a review of the status of the indicator species.
et her than the target
tch range due creased cat er water ecies.
berley or the 2009 calendar year, the total allowable effort was set
at 1,144 standard fishing days in Zone B, and 616 standard shing days in Zone A, of the fishery respectively. The Zone allocation aims cilitate the exp ation and velopment of th ea of the fishery, while there is also rther scope for fishers to develop Zone C (the deep slope
. At these levels total effort and t recent catch rates, total catch of hery is expect be in the range of 0–1,000 t.
addition to th rmance easures state t nnual catch of the key target ecies/groups (r peror, goldband snapper and the
comp y the fisher t increase by ore than 20% above the average evious four years. one of the key pecies/groups performance measures
were exceeded in 2009, with the red emperor catch gnificantly be trigger leve
ew manage nitiatives (2010/11)
ilbara In 2009, the Pilbara Fish Trawl Interim Managed Fishery
anagement Pl tion date w ed to expire on June 2011. Th nsion was p allow for the
of the Fisheries Research elopment orporation (FRDC) Project 2008/ cing dolphin
ch in the Pi ish trawl fisher ompleted in late 09 and assessment regarding the future of the
ilbara Fish Trawl Interim Manage , including consideration of moving the fishery to “managed” fishery
atus.
hould the Minis prove movin bara Fish Trawl y to a managed y, the
epartment of Fi s will then undertake statutory public nsultation as re under the urces
Management Act 1994 and move to new anagement plan for the Fishery.
imberley There is a need to incorporate the industry agreed zoning and effort allocation arrangements of Area 2 of the NDSF into the management plan. The Department continues to consider projects related to the outcomes of the Prescott Review in consultation with licensees.
External Factors Pilbara The available fishing area has decreased over recent years as a result of exclusion zones for gas pipelines and associated facilities. Seismic surveys also restrict the operation of fishers. However, neither of these operations are expected to
E
(to fishers) for year 2009: $15.7 Million
Pilbara $7.3 Million In the fish trap fishery, the total catch was within the targcatch range. The line catch was slightly higcasp
to the in ch of deep
KimF
o inputteds and ar
sarilythe 2isher
fiAde
to fais ar
lor
fuarea)the
of the fis
aed to
60
Inm
e overall catch target, ESD perfohat the a of each
sp ed emcod/grouperm
lex) b y should nofor the pr
N target s
si low the l.
N ment i
P
M an cessa as extend30conclusion
e exte rovided to and Dev
C 048 Redubycat20
lbara finf y, c long-term
P d Fishery
st
S ter ap g the PilInterim Managed FisherD
Fishersherie
co quired Fish Reso develop a
m
K
the fish pr has been
h prices years.
otted e adfin b$3.7 millio by the
trap ans suchrsal s
was $0.52 m
athe fish trawl
ll amou y-prod
ilbara te the Wn mark the lo
y hased value years
targets e specier and red e fish
mersal scalefish iny $8.4 m
, for aimate
of each d in ca
ed by fi
l
STATE OF THE FISHERIES AND AQUATIC RESOURCES REPORT 2009/10 179
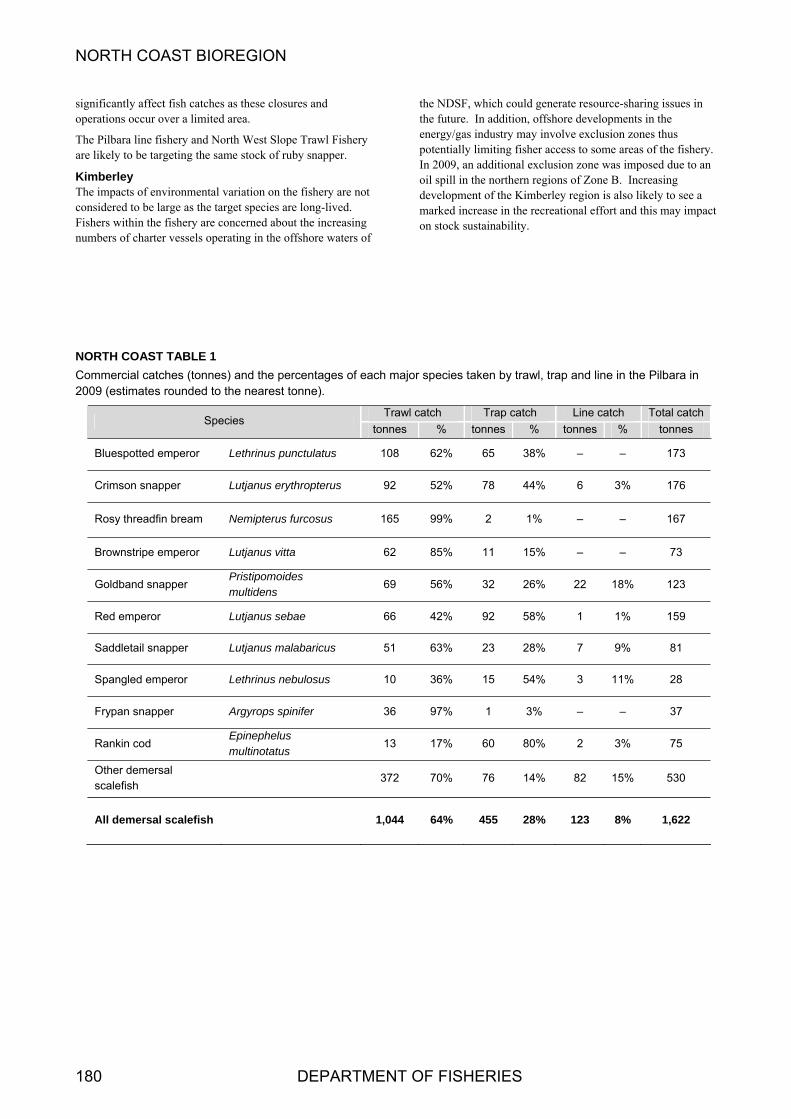
NORTH COAST BIOREGION
180 DEPARTMENT OF FISHERIES
these closures and
fishery and North West Slope Trawl Fishery are likely to be targeting the same stock of ruby snapper.
Kimberley The impacts of environme riation on the fisher t considered to be large as the target species are long-lived. Fishers within the fishery cerned about the in ing numbers of charter vessels ng in the offshore waters of
the NDSF, which could generate resource-sharing issues in
energy/gas industry may involve exclusion zones thus ng fisher access to some areas of the fishery. ional ex imposed due to an
oil s e northern regions of Zone B. Increasing development of the Kimberley n is also likely to see a marked increase in the recreational effort and this may impact on stock sustainability.
NORTH COAST TABL
Commercial catches (tonnes) and the percentages of each major spe ken by trawl, trap e in the Pilbara in 2009 (estimates rounded t e nearest tonne).
significantly affect fish catches asoperations occur over a limited area.
The Pilbara line
the future. In addition, offshore developments in the
ntal va y are no
are con creas operati
potentially limitiIn 2009, an addit
pill in thclusion zone was
regio
E 1
cies ta and lino th
Trawl catch Trap catch Line catch Total catch Species
tonnes % tonnes % tonnes % tonnes
Bluespotted emperor Lethrinus punctulatus 108 62% 65 38% – – 173
Crimson snapper Lutjanus erythropterus 92 52% 78 44% 6 3% 176
Rosy threadfin bream Nemipterus furcosus 165 99% 2 1% – – 167
Brownstripe emperor Lutjanus vitta 62 85% 11 15% – – 73
Goldband snapper Pristipomoides multidens
69 56% 32 26% 22 18% 123
Red emperor Lutjanus sebae 66 42% 92 58% 1 1% 159
Saddletail snapper Lutjanus malabaricus 51 63% 23 28% 7 9% 81
Spangled emperor Lethrinus nebulosus 10 36% 15 54% 3 11% 28
Frypan snapper Argyrops spinifer 36 97% 1 3% – – 37
Rankin cod Epinephelus multinotatus
13 17% 60 80% 2 3% 75
Other demersal scalefish
372 70% 76 14% 82 15% 530
All demersal scalefish 1,044 64% 455 28% 123 8% 1,622

NORTH COAST BIOREGION
NORTH COAST TABLE 2
Summary of reported commercial catches (tonnes) of demersal scalefish by line, trap and trawl in the Pilbara fishery, as well as by–product from the fish trawl fishery.
Demersal Scalefish By-product*
Year Line Trap Trawl Total Trawl*
1985 180 168 348
1986 65 113 178
1987 67 192 3 262
1988 136 243 3 382
1989 104 457 124 685
1990 157 407 421 985 4
1991 107 119 754 980 14
1992 63 148 1,413 1,624 21
1993 67 178 1,724 1,969 42
1994 79 207 2,506 2,792 102
1995 95 222 2,821 3,138 77
1996 136 302 3,201 3,639 102
1997 109 234 2,630 2,973 133
1998 78 250 2,512 2,840 119
1999 50 371 2,136 2,419 69
2000 59 257 1,995 2,314 80
2001 99 266 2,221 2,592 150
2002 90 306 2,310 2,706 180
2003 81 363 2,860 3,304 154
2004 240 395 2,837 3,449 113
2005 260 408 2,371 3,005 80
2006 105 473 2,222 2,800 46
2007 102 460 1,704 2,266 36
2008 86 508 1,210 1,804 37
2009 123 455 1,044 1,622 73 * By-product in 2009 consists of shark, cuttlefish, squid, bugs, and tropical lobster.
STATE OF THE FISHERIES AND AQUATIC RESOURCES REPORT 2009/10 181

NORTH COAST BIOREGION
NORTH COAST TABLE 3
Summary of the fishing effort in the Pilbara Demersal Scalefish Fishery. The trap, line and trawl effort (days) is from monthly catch and effort returns. The trawl effort (hours) is nominal effort from operators’ logbook data.
Year Line Trap Trawl Trawl
(days) (days) (days) (hours)
1985 809 709 - -
1986 655 548 19 -
1987 614 507 17 -
1988 985 804 32 -
1989 863 1,198 310 -
1990 1,332 1,321 698 -
1991 740 472 1,132 8,660
1992 514 681 983 10,030
1993 876 696 832 10,725
1994 732 545 1,484 22,087
1995 852 608 1,571 21,529
1996 814 513 1,550 25,246
1997 809 483 1,389 19,810
1998 692 503 1,291 20,555
1999 453 842 1,139 15,963
2000 500 518 957 14,084
2001 401 446 1,162 15,330
2002 660 418 1,035 14,830
2003 715 412 1014 14,663
2004 769 418 953 15,372
2005 985 431 886 14,721
2006 397 464 914 15,792
2007 385 425 841 14,197
2008 326 461 831 11,966
2009 294 456 711 10,605
182 DEPARTMENT OF FISHERIES
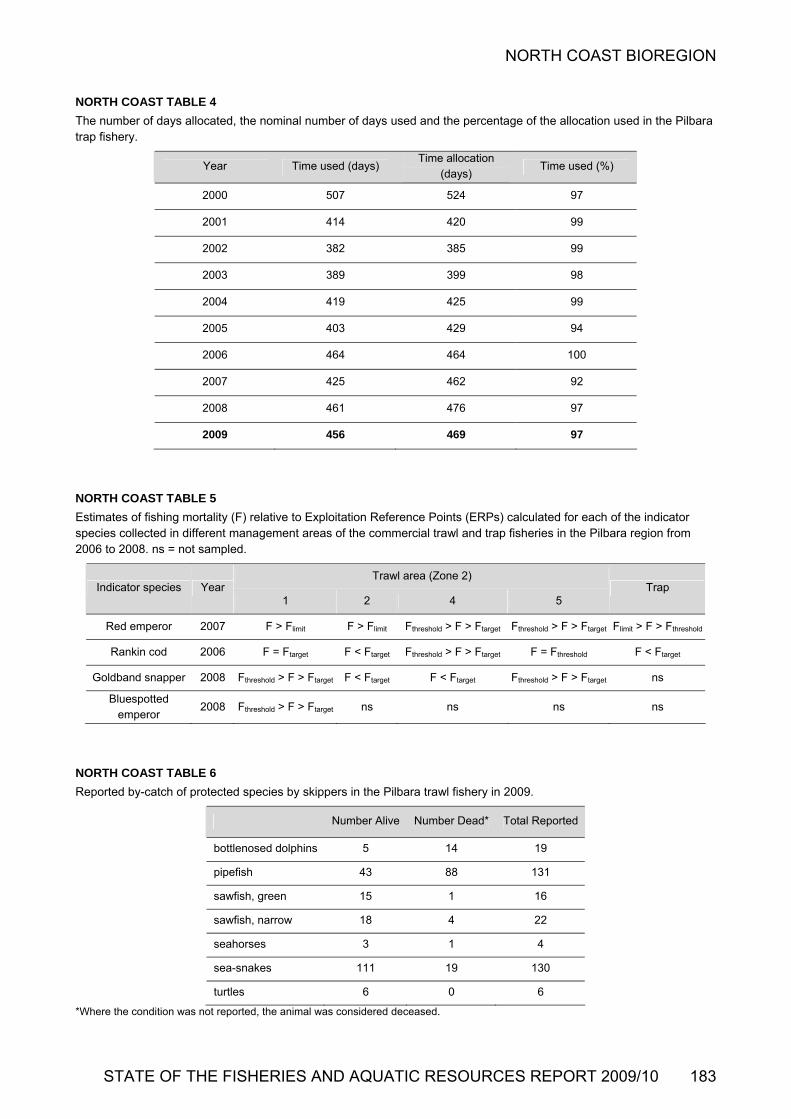
NORTH COAST BIOREGION
STATE OF THE FISHERIES AND AQUATIC RESOURCES REPORT 2009/10 183
NORTH COAST TABLE 4
The number of days allocated, the nominal number of days used and the percentage of the allocation used in the Pilbara trap fishery.
Year Time used (days) Time allocation
(days) Time used (%)
2000 507 524 97
2001 414 420 99
2002 382 385 99
2003 389 399 98
2004 419 425 99
2005 403 429 94
2006 464 464 100
2007 425 462 92
2008 461 476 97
2009 456 469 97
NORTH COAST TABLE 5
Estimates of fishing mortality (F) relative to Exploitation Reference Points (ERPs) calculated for each of the indicator species collected in different management areas of the commercial trawl and trap fisheries in the Pilbara region from 2006 to 2008. ns = not sampled.
Trawl area (Zone 2) Indicator species Year
1 2 4 5 Trap
Red emperor 2007 F > Flimit F > Flimit Fthreshold > F > Ftarget Fthreshold > F > Ftarget Flimit > F > Fthreshold
Rankin cod 2006 F = Ftarget F < Ftarget Fthreshold > F > Ftarget F = Fthreshold F < Ftarget
Goldband snapper 2008 Fthreshold > F > Ftarget F < Ftarget F < Ftarget Fthreshold > F > Ftarget ns
Bluespotted emperor
2008 Fthreshold > F > Ftarget ns ns ns ns
NORTH COAST TABLE 6
Reported by-catch of protected species by skippers in the Pilbara trawl fishery in 2009.
Number Alive Number Dead* Total Reported
bottlenosed dolphins 5 14 19
pipefish 43 88 131
sawfish, green 15 1 16
sawfish, narrow 18 4 22
seahorses 3 1 4
sea-snakes 111 19 130
turtles 6 0 6
*Where the condition was not reported, the animal was considered deceased.
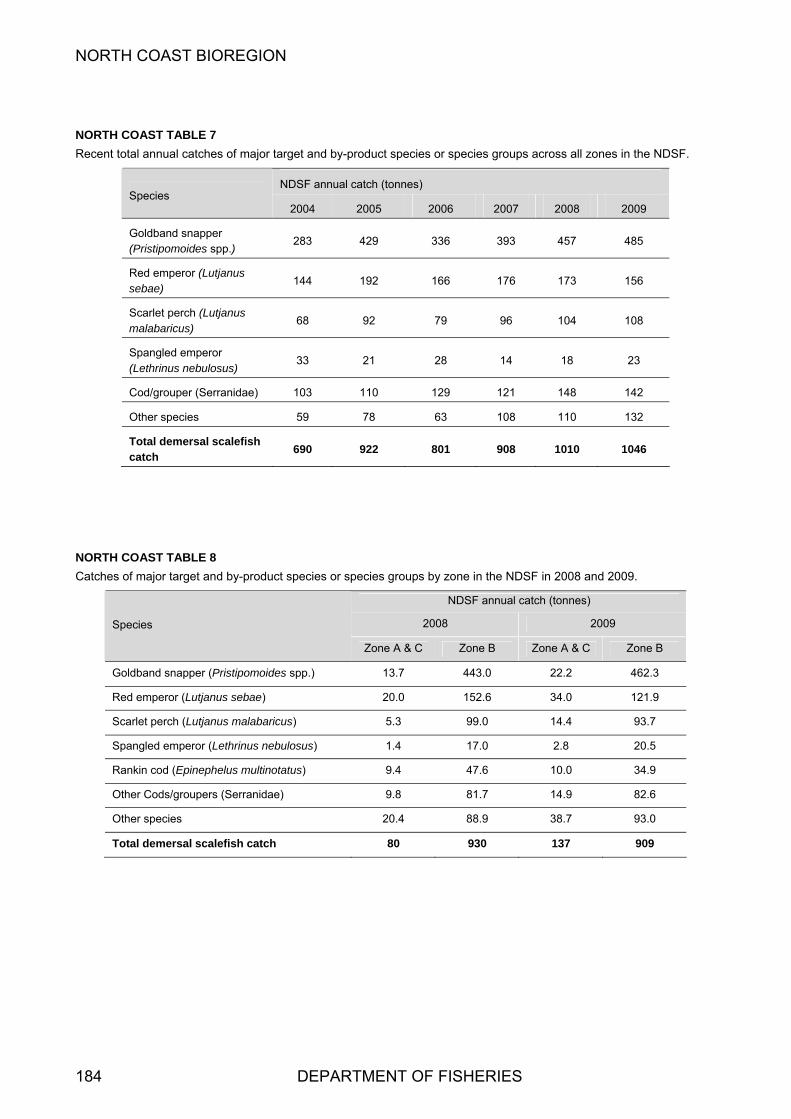
NORTH COAST BIOREGION
NORTH COAST TABLE 7
Recent total annual catches of major target and by-product species or species groups across all zones in the NDSF.
NDSF annual catch (tonnes) Species
2004 2005 2006 2007 2008 2009
Goldband snapper (Pristipomoides spp.)
283 429 336 393 457 485
Red emperor (Lutjanus sebae)
144 192 166 176 173 156
Scarlet perch (Lutjanus malabaricus)
68 92 79 96 104 108
Spangled emperor (Lethrinus nebulosus)
33 21 28 14 18 23
Cod/grouper (Serranidae) 103 110 129 121 148 142
Other species 59 78 63 108 110 132
Total demersal scalefish catch
690 922 801 908 1010 1046
NORTH COAST TABLE 8
Catches of major target and by-product species or species groups by zone in the NDSF in 2008 and 2009.
NDSF annual catch (tonnes)
2008 2009 Species
Zone A & C Zone B Zone A & C Zone B
Goldband snapper (Pristipomoides spp.) 13.7 443.0 22.2 462.3
Red emperor (Lutjanus sebae) 20.0 152.6 34.0 121.9
Scarlet perch (Lutjanus malabaricus) 5.3 99.0 14.4 93.7
Spangled emperor (Lethrinus nebulosus) 1.4 17.0 2.8 20.5
Rankin cod (Epinephelus multinotatus) 9.4 47.6 10.0 34.9
Other Cods/groupers (Serranidae) 9.8 81.7 14.9 82.6
Other species 20.4 88.9 38.7 93.0
Total demersal scalefish catch 80 930 137 909
184 DEPARTMENT OF FISHERIES

NORTH COAST BIOREGION
NORTH COAST TABLE 9
Total catches (t) of demersal finfish and effort (days) by line and trap vessels in the NDSF since the introduction of full management arrangements in 1998.
Year Total allowable Line Line Trap Trap Total
effort catch effort catch effort catch
(days) (t) (days) (t) (days) (t)
1998 1,684 45 78 497 916 542
1999 1,716 91 228 486 992 577
2000 1,562 67 155 409 890 476
2001 1,672 47 136 462 928 509
2002 1,760 0 0 434 900 434
2003 1,760 0 0 552 1,060 552
2004 1,760 0 0 690 1,300 690
2005 1,760 0 0 922 1,318 922
2006 1,144 0 0 801 1,193 801
2007 1,144 0 0 908 1,235 908
2008 1,144 7 0 1,003 1,150 1,010
2009 1,144 0 0 1,046 1,090 1,046
(2009 Estimated Catch: Zone A = 132 t, Zone B = 909 t; 2009 Estimated Effort: Zone A = 149 SFDs, Zone B = 938 SFDs)
NORTH COAST TABLE 10
Summary of the commercial catches and the relative contribution (% composition) of each of the major species taken within the Pilbara and Kimberley sectors of the North Coast bioregion in 2009.
Pilbara catch Kimberley (NDSF) catch Total catch Species
tonnes % tonnes % tonnes
Red emperor 159 51% 156 49% 315
Saddletail snapper 81 43% 108 57% 189
Crimson snapper 176 83% 35 17% 211
Brownstripe snapper 73 94% 5 6% 78
Goldband snapper 123 20% 485 80% 608
Spangled emperor 28 55% 23 45% 51
Bluespotted emperor 173 92% 15 8% 188
Rankin cod 75 62% 45 38% 120
Frypan snapper 37 100% 0 0% 37
Rosy threadfin bream 167 100% 0 0% 167
Other demersal scalefish 530 75% 174 25% 704
Total all demersal scalefish 1,622 61% 1,046 39% 2,668
STATE OF THE FISHERIES AND AQUATIC RESOURCES REPORT 2009/10 185
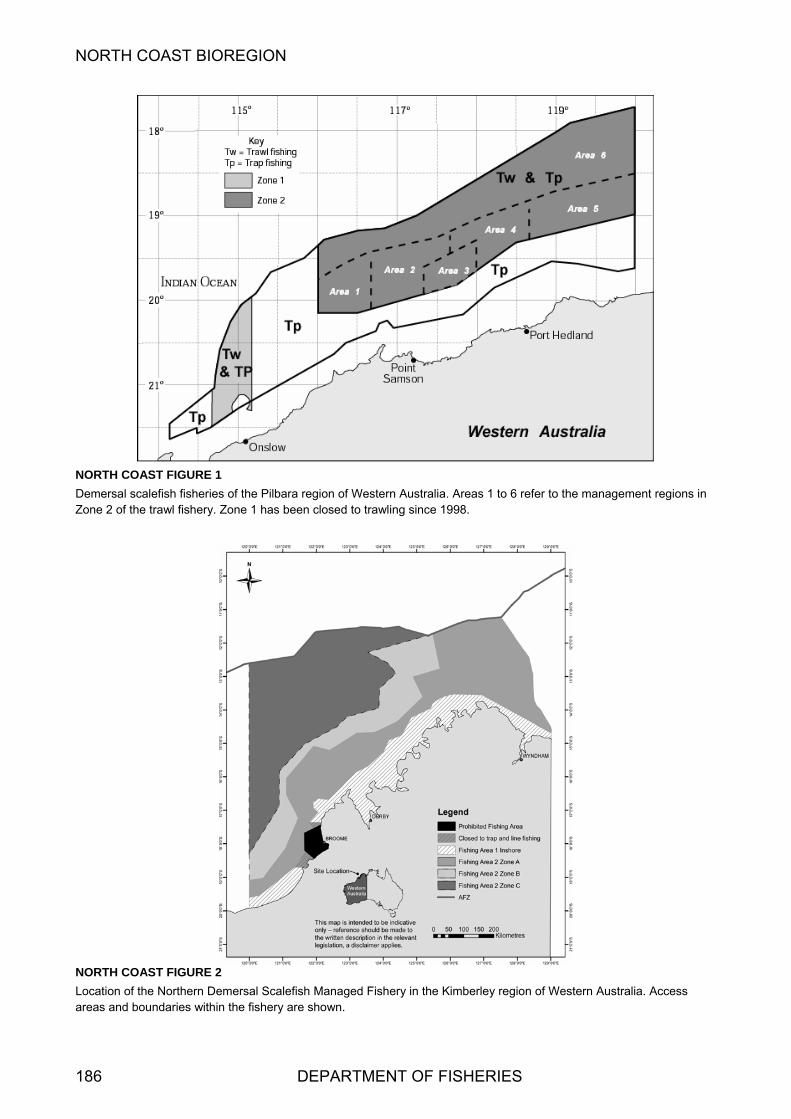
NORTH COAST BIOREGION
NORTH COAST FIGURE 1
Demersal scalefish fisheries of the Pilbara region of Western Australia. Areas 1 to 6 refer to the management regions in Zone 2 of the trawl fishery. Zone 1 has been closed to trawling since 1998.
NORTH COAST FIGURE 2
Location of the Northern Demersal Scalefish Managed Fishery in the Kimberley region of Western Australia. Access areas and boundaries within the fishery are shown.
186 DEPARTMENT OF FISHERIES
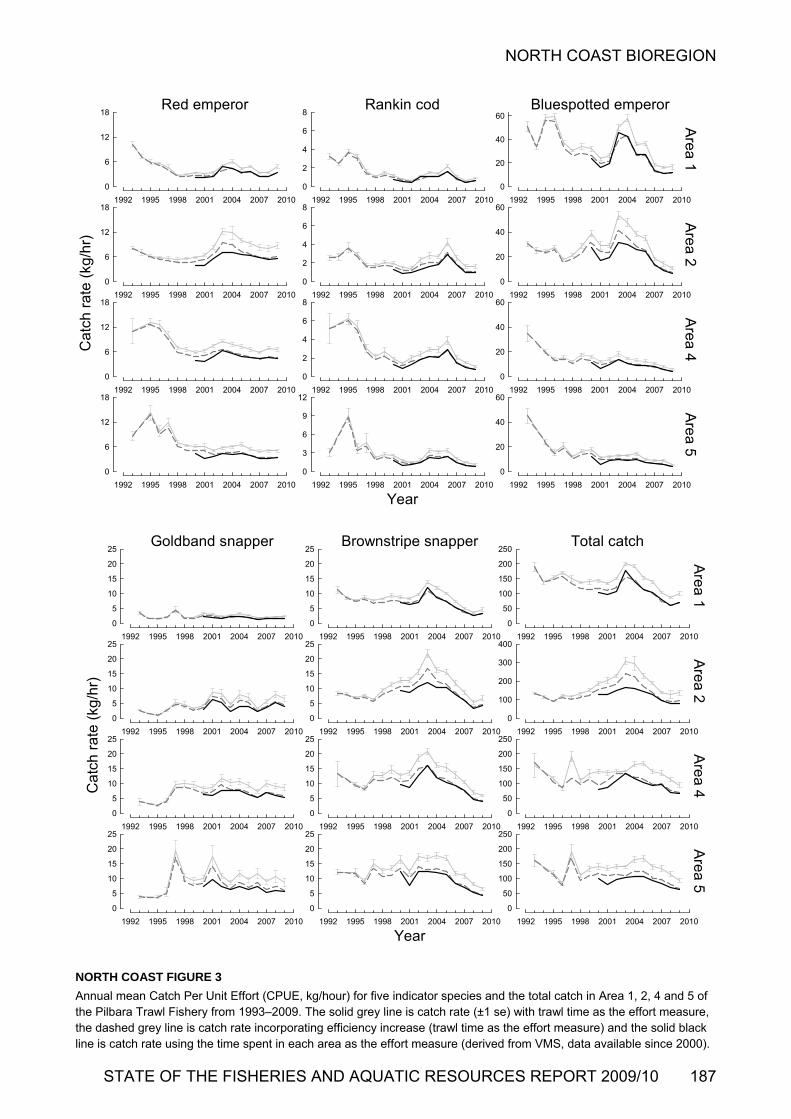
NORTH COAST BIOREGION
Red emperor
1992 1995 1998 2001 2004 2007 2010
0
6
12
18
1992 1995 1998 2001 2004 2007 2010
0
6
12
18
Rankin cod
1992 1995 1998 2001 2004 2007 2010
0
2
4
6
8
1992 1995 1998 2001 2004 2007 2010
0
2
4
6
8
1992 1995 1998 2001 2004 2007 2010
0
2
4
6
8
Year1992 1995 1998 2001 2004 2007 2010
0
3
6
9
12
Bluespotted emperor
1992 1995 1998 2001 2004 2007 2010
0
20
40
60
1992 1995 1998 2001 2004 2007 2010
0
20
40
60
1992 1995 1998 2001 2004 2007 2010
0
20
40
60
1992 1995 1998 2001 2004 2007 2010
0
20
40
60
Are
a 1
Are
a 2
Are
a 4
Are
a 5
1992 1995 1998 2001 2004 2007 2010
0
6
12
18
1992 1995 1998 2001 2004 2007 2010
Cat
ch r
ate
(kg/
hr)
0
6
12
18
1992 1995 1998 2001 2004 2007 2010
0
5
10
15
20
25
Brownstripe snapper
1992 1995 1998 2001 2004 2007 2010
0
5
10
15
20
25
1992 1995 1998 2001 2004 2007 2010
0
5
10
15
20
25
1992 1995 1998 2001 2004 2007 2010
0
5
10
15
20
25
Year1992 1995 1998 2001 2004 2007 2010
0
5
10
15
20
25
Total catch
1992 1995 1998 2001 2004 2007 2010
0
50
100
150
200
250
1992 1995 1998 2001 2004 2007 2010
0
100
200
300
400
1992 1995 1998 2001 2004 2007 2010
0
50
100
150
200
250
1992 1995 1998 2001 2004 2007 2010
0
50
100
150
200
250
Are
a 1
Are
a 2
Are
a 4
Are
a 5
Goldband snapper
1992 1995 1998 2001 2004 2007 2010
0
5
10
15
20
25
1992 1995 1998 2001 2004 2007 2010
0
5
10
15
20
25
1992 1995 1998 2001 2004 2007 2010
Ca
tch
rate
(kg
/hr)
0
5
10
15
20
25
NORTH COAST FIGURE 3
Annual mean Catch Per Unit Effort (CPUE, kg/hour) for five indicator species and the total catch in Area 1, 2, 4 and 5 of the Pilbara Trawl Fishery from 1993–2009. The solid grey line is catch rate (±1 se) with trawl time as the effort measure, the dashed grey line is catch rate incorporating efficiency increase (trawl time as the effort measure) and the solid black line is catch rate using the time spent in each area as the effort measure (derived from VMS, data available since 2000).
STATE OF THE FISHERIES AND AQUATIC RESOURCES REPORT 2009/10 187

NORTH COAST BIOREGION
NORTH COAST FIGURE 4
Catch levels of demersal finfish in the NDSF by line and trap, 1989–2009 (All Zones).
NORTH COAST FIGURE 5
Catch, effort and catch per unit of effort of red emperor in the NDSF by trap, 1998–2009 (2006-2009 for Zone B only). Standard error bars for 2009 illustrate variability in CPUE from two sources of catch returns (daily and monthly).
188 DEPARTMENT OF FISHERIES

NORTH COAST BIOREGION
NORTH COAST FIGURE 6
Catch, effort and catch per unit of effort of goldband snapper in the NDSF by trap, 1998–2009 (2006-2009 for Zone B only). Standard error bars for 2009 illustrate variability in CPUE from two sources of catch returns (daily and monthly).
NORTH COAST FIGURE 7
Catch, effort and catch per unit of effort of cods in the NDSF by trap, 1998–2009 (2006-2009 for Zone B only). Standard error bars for 2009 illustrate variability in CPUE from two sources of catch returns (daily and monthly).
STATE OF THE FISHERIES AND AQUATIC RESOURCES REPORT 2009/10 189

NORTH COAST BIOREGION
Mackerel Managed Fishery Report: Statistics Only B. Molony and E. Lai
Management input from S. Blazeski
Fishery Description
Commercial The Mackerel Fishery uses near-surface trolling gear from small vessels in coastal areas around reefs, shoals and headlands to target Spanish mackerel (Scomberomorus commerson). Jig fishing is also used to capture grey mackerel (S. semifasciatus), with other species from the genera Scomberomorus, Grammatorcynus and Acanthocybium also contributing to commercial catches.
Recreational Recreational fishers target similar species using a range of gears including trolls, shore-based drift fishing with balloons and spearguns.
Boundaries
Commercial The Fishery extends from the West Coast Bioregion to the WA/NT border, with most effort and catches recorded north of Geraldton, especially from the Kimberley and Pilbara coasts of the Northern Bioregion. Catches are reported for three areas: Area 1 - Kimberley (121º E to WA/NT border); Area 2 - Pilbara (114º E to 121º E); Area 3 - Gascoyne (27º S to 114º E) and West Coast (Cape Leeuwin to 27º S).
Recreational The fishery operates between the West Coast Bioregion and the WA/NT border, with most activity occurring between Perth and Dampier.
Management arrangements
Commercial An Interim Management Plan was implemented for the Mackerel Fishery in August 2004, with fishing commencing under the plan in 2005. On 1 January 2006, an Individual Transferable Quota system was introduced including setting Total Allowable Commercial Catches (TACCs) for each Area of the Fishery, allocation of the entitlement to take quota in the form of units, and establishment of minimum unit holding requirements to operate in the Fishery.
The maximum quantity of mackerel that may be taken from each Area of the Fishery during any permit period is limited to the quantity of mackerel that the Chief Executive Officer determines. The Total Allowable Commercial Catch (TACC) for each area of the fishery is currently:
Spanish and other mackerel Grey mackerel
Area 1: 205 t 60 t
Area 2: 126 t 60 t
Area 3: 79 t 60 t
The plan includes limitations on the number of permits to fish in the Fishery and the type of gear that can be used. Boats operating in the Fishery are monitored by VMS and the master of an authorised boat is required to submit logbook returns and catch and disposal records. Seasonal closures were removed in May 2008, as they were no longer a necessary tool to maintain sustainable and efficient management of the Fishery after quotas were put in place in 2006. A management plan amendment in May 2008 now permits the heading of broad-barred Spanish mackerel as compliance experience over the last two seasons indicates this will not be detrimental to the integrity of the quota management system. The amendment also modified the minimum operating holding from a percentage of units to a real number.
Permit holders may only fish for mackerel by trolling or handline. There are currently 78 permits in the Fishery with 35, 22 and 21 in Zones 1, 2 and 3 (respectively). Of these, 38 permits are active on 4, 7 and 6 boats operating within Zones 1, 2 and 3 (respectively).
A comprehensive Ecological Sustainable Development (ESD) assessment of this Fishery determined that levels of Spanish mackerel breeding stock should be used as an annual performance measure for the fishery. The annual assessment of performance is provided within the boxed text.
Landings and Effort (Season 2009)
Spanish mackerel 284.2 tonnes
Grey mackerel 11.1 tonnes
Other mackerel 0.4 tonnes
Commercial The majority of the catch is taken in the Kimberly region, reflecting the tropical distribution of mackerel species (Spanish mackerel Figure 1). Estimates of catches are monitored through mandatory logbook systems with the total catch of Spanish mackerel in the 2009 season estimated at 284.2 t which is lower than the total Spanish mackerel catch taken in 2008 (331.1 t). This reflects reductions in fishing effort across all zones (approximately 15% reduction cf. 2008 levels) with most effort reductions reported in the Gascoyne.
The 11.5 tonnes of other mackerel (which is dominated by grey mackerel) landed in 2009 is also lower than in 2008. These estimates do not include fish caught and released or lost to sharks.
Recreational Catch estimates and resource share by this sector are only available through creel surveys which occur periodically (Table 1). Reported annual catches of Spanish mackerel by recreational charter boats are relatively minor.
190 DEPARTMENT OF FISHERIES

NORTH COAST BIOREGION
STATE OF THE FISHERIES AND AQUATIC RESOURCES REPORT 2009/10 191
Fishery Governance Target commercial catch range: 246 – 410 tonnes
The total catch in 2009 of 284.2 t was within the acceptable catch range. The reported catch from the Kimberley Area of 177.4 t was within this areas acceptable catch range (110 – 205 t) but catches for the Gascoyne/West Coast Area of 45.2 t (56 – 79 t) and the Pilbara Area of 61.6 t (80 – 126 t) were slightly below their acceptable ranges. Effort within these two areas during 2009 was 30% and 20% lower, respectively, compared to effort levels in 2008. The lower total effort (approximately 15% lower effort in 2009 compared to 2008) is likely to account for the lower catches in all areas.
The performance measure set for the fishery is the status of the Spanish mackerel spawning stock. As the minimum legal size of 900 mm total length is similar to the size at maturity for this species, the spawning stock is essentially the same as the exploited stock. In this context, catch rates across the major areas of the fishery are a general indicator of breeding stock levels, as reflected by catches being within target ranges. The total catch for 2009 was within the target catch
range and overall catch rates have been increasing since 2000.
Current Fishing (or Effort) Level: Acceptable
Fishing effort throughout the fishery appears has stabilised since 2006 following declines due to management changes. This is reflected by an increasing catch rate in the fishery.
New management initiatives (2010/11)
In December 2009, the Mackerel Fishery (Interim) Management Plan cessation date was extended to expire on 31 December 2011. The Minister for Fisheries has approved moving this Fishery to a managed Fishery and therefore the extension will allow for the development of a draft Mackerel Management Plan and statutory public consultation as required under the Fish Resources Management Act 1994.
In November 2009, the Fishery was exempt from the export controls of the Environment Protection and Biodiversity Conservation Act 1999 for a period of five years.
SPANISH MACKEREL TABLE 1
Recreational catch estimates of Spanish mackerel in Western Australia
SPANISH MA
Annual catch of Spanish mackerel in Western Australia, 1979–2009
Bioregion Year Retained catch Share Source
Pilbara (including Broome)
1999/2000 Spanish: 28 t
Other: 11 t 21 % 15 %
Williamson et al. (2006)
Gascoyne 1998/1999 Spanish: 48 t
Other: 8 t 42 % 10 %
Sumner et al. (2002)
West Coast 2005/2006 Spanish: 7 t Other: <1 t
45 % < 3 %
Sumner et al. (2008)
Spanish Mackerel Annual Catch
0
100
200
300
400
500
600
1980 1983 1986 1989 1992 1995 1998 2001 2004 2007
Cat
ch (
ton
nes
)
Kimberley
Pilbara
Gascoyne/West Coast
Total
CKEREL FIGURE 1

NORTH COAST BIOREGION
Northern Shark Fisheries Status Report R. McAuley
Management input by Lindsay Joll
Fishery Description The ‘northern shark fisheries’ comprise the state-managed WA North Coast Shark Fishery (WANCSF) in the Pilbara and western Kimberley, and the Joint Authority Northern Shark Fishery (JANSF) in the eastern Kimberley. The primary fishing method employed in these fisheries is demersal longline with a relatively small amount of pelagic gillnetting occurring in the JANSF. The northern shark fisheries have targeted a variety of species including sandbar (Carcharhinus plumbeus), blacktip (various Carcharhinus spp.), tiger (Galeocerdo cuvier), hammerhead (Sphyrnidae) and lemon sharks (Negaprion acutidens). Due to the commonality of fishing methods and target species in the WANCSF and JANSF, data from the two fisheries are combined and considered as a single fishery for reporting purposes. As the number of active vessels in these fisheries has significantly reduced since new management arrangements were introduced in 2005, fishing returns data from the last three years have been combined to ensure individuals’ fishing activities cannot be identified.
Governing legislation/fishing authority
Fisheries Notice no. 476 (Section 43 Order)
Fisheries Notice no. 602 (Section 43 Order)
Fisheries Notice no. 601 (Section 43 Order)
Offshore Constitutional Settlement 1995
Condition 127 and 129 on a Fishing Boat Licence
Other written authorities
Ministerial Exemption (WANCSF)
Consultation processes
Department–Northern Shark Industry Association meetings
WA Fishing Industry Council
Boundaries
The WANCSF extends from longitude 114°06’ E (North West Cape) to 123°45’ E (Koolan Island), and the JANSF from longitude 123°45’ E to the WA/NT border (Northern Shark Figure 1).
Management arrangements
The commercial take of shark in Western Australian waters east of 123°45 E longitude is jointly managed by the Commonwealth Government and the State of Western Australia under an arrangement agreed through the Offshore Constitutional Settlement in February 1995. Under this arrangement, the State was given management responsibility for the JANSF on behalf of the WA Fisheries Joint Authority, whose members include the State and Commonwealth Ministers for Fisheries. Permitted fishing methods are longlines and gillnets.
The solely Western Australian-managed sector of the northern shark fishery was closed by a Section 43 order of the Fish Resources Management Act 1994 in 2005. Those subsequently permitted to fish in the WANCSF were restricted to approximately 40% of the fishery’s previous area under a Ministerial Exemption. This exemption entitled the use of longlines with metal snoods and pelagic gillnets. Longlines are restricted to a maximum of 1,000 hooks and gillnets are limited to 2 kilometres maximum length, 160 – 185 mm stretched mesh size and a maximum drop of 100 meshes. Additionally, gillnets must be attached to vessels at all times and may not come into contact with the seabed.
The WANCSF is now effectively zoned into three areas with separate levels of access. The area between North West Cape and a line of longitude at 120° E and all waters south of latitude 18° S has been closed indefinitely, primarily to protect the breeding stock of sandbar sharks. Operators are only allowed to fish in the area between 16° 23’ S and 18° S latitude between 1 October and 31 January. Operators are allowed to fish in the remaining area (north of 16° 23’ S latitude and between 120° and 123° 45’ E longitude) throughout the year. A total of 200 gillnet fishing days and
Main Features
Status
Stock level
Sandbar shark Depleted
Blacktip sharks Uncertain
Fishing Level Unacceptable
Current Landings
Total sharks (2006/07- 2008/09 combined) 834 t
Total scalefish (2006/07- 2008/09 combined) 9 t
Shark catches by other commercial Fisheries
(2006/07- 2008/09 combined) 11 t
Recreational Not assessed
Charter Not assessed
192 DEPARTMENT OF FISHERIES

NORTH COAST BIOREGION
100 longline fishing days are permitted in the WANCSF, with no more than 100 of those days allowed in the southern area (i.e. between 16° 23’ and 18° S latitude). All vessels operating in the WANCSF are now required to report fishing activities via Vessel Monitoring System (VMS) and daily logbooks.
Formal management arrangements have not been implemented in the JANSF and management arrangements for this fishery (and the associated WANCSF) have been a matter of ongoing dialogue between the State and Commonwealth. In April 2008 the JANSF’s export approval under the EPBC Act was revoked due to the lack of implementation of formal management arrangements and concerns about the fishery’s ecological sustainability. In February 2009 the Wildlife Trade Operation Exemption that allowed the export of products from the WANCSF also expired and therefore, product from either fishery cannot now be legally exported.
Given that the majority of income from these fisheries has historically been generated by the export of shark fins, the ongoing economic viability of the northern shark fisheries is uncertain. The Department of Fisheries has reviewed future options for managing the WANCSF and is working with the Commonwealth Government to finalise a review of the JANSF.
Research summary
Research to assess the status of northern shark stocks was initiated as an extension of research into the targeted shark fisheries operating in the South and West Coast Bioregions. A three-year FRDC-funded project provided an age-structured demographic assessment of the status of the northern shark fisheries’ principal target species, the sandbar shark (Carcharhinus plumbeus) and an improved understanding of the fisheries and of northern shark stocks more generally. Additional information on these fisheries and others that take sharks as bycatch in the North Coast Bioregion was collected during a series of Department of Environment and Heritage and FRDC-funded research projects to assess sustainability risks to Australia’s tropical sharks and rays. Results from those projects have provided risk assessments for 75 elasmobranch species caught by 29 fisheries operating across the northern half of Australia.
Demonstrating the ecological sustainability of the northern shark fisheries is dependent on establishing robust estimates of sustainable harvest levels for target, byproduct and bycatch species. In particular, issues associated with blacktip shark, sandbar shark and mackerel sustainability, as well as Threatened, Endangered and Protected (TEP) species interactions require evaluation. Further research to estimate key biological parameters and fishing mortality rates for these and other species are therefore required.
To improve understanding of the northern shark fisheries’ operations, a new daily/trip catch and effort reporting system was introduced in 2006/07. However, as some discrepancies were identified in the initially submitted logbook data, catches and fishing effort could not previously be reported with sufficient confidence for 2006/07 and 2007/08.
As those data have now been assessed and, where necessary, adjusted, they are reported below for the three years between 2006/07 and 2008/09.
Retained Species Commercial landings (season 2006/07- 2008/09 combined):
Northern Shark Fisheries:
Total sharks 834 tonnes
Sandbar shark 188 tonnes
Blacktip sharks 202 tonnes
Scalefish 9 tonnes
Other Commercial Fisheries 11 tonnes
The total shark catch by the northern shark fisheries has decreased substantially from its peak of 1,294 t in 2004/05 as a result of the new management arrangements that were introduced in 2005. Between 2006/07 and 2008/09, the mean annual shark catch was 278 tonnes, slightly lower than its long-term (1994/95-2005/06) mean level of 339 t. However, the mean sandbar shark catch of 63 t over the last 3 years was more than 3 times the level estimated by demographic analysis to be sustainable (see Stock Assessment section of Demersal Gillnet and Longline Fisheries Status Report). Although the mean blacktip shark catch of 67 t during the last 3 years was similar to previous years and considerably less than its peak of 178 t in 2002/03, the sustainability of these catches cannot be determined (see Stock Assessment below).
Sharks are also incidentally caught by other commercial fisheries operating in the Northern Bioregion although isnce 2006 only three non-target shark fisheries are now authorised to retain shark catches (Pilbara Fish Trawl, Northern Demersal Scalefish1 and Marine Aquarium Fish) when sharks and rays were commercially protected throughout the State. In the three years between 2006/07 and 2008/09, vessels licensed in those authorised fisheries reported total landings of 11 t of sharks and rays from the area between North West Cape and the WA/NT border. By comparison 31 t of sharks were reported from non-target commercial fisheries in 2005/06. It is expected that landings will remain at these low levels in the future.
The northern shark fisheries have a small scalefish catch that is generally retained for sale. Most of the fisheries’ scalefish catch reported between 2006/07 and 2008/09 was caught by gillnets and included 6.2 t of grey mackerel, 1.3 t of estuary cod, 0.6 t of Spanish mackerel and 0.3 t of other mackerel. While such small catches are considered an insignificant risk to stock sustainability, the potential for a thirty-fold increase in pelagic gillnet effort and targeting of mackerel schools represent major sustainability risks and additional measures to manage this byproduct will need to be developed if these risks are realised.
Recreational catch estimate: Not assessed
1 Within a 2 shark trip limit.
STATE OF THE FISHERIES AND AQUATIC RESOURCES REPORT 2009/10 193
NORTH COAST BIOREGION
Commercial Fishing effort/access level
There were two active licenses in the northern shark fisheries during 2008/09 (one less than 2007/08 and the same as 2006/07). During the 3 years between 2006/07 and 2008/09, approximately 48% of permitted longline fishing effort and 3% of permitted gillnet fishing effort was utilised (based on one shot per vessel per day).
Stock Assessment Assessment complete: Yes
Assessment method:
Sandbar shark:
Catch (relative to previous direct survey)
Blacktip sharks: Catch
Breeding stock levels:
Sandbar shark Depleted
Blacktip sharks Uncertain
For details of sandbar shark assessment, see Demersal Gillnet and Longline Fisheries Status Report.
The status of the multi-species northern Australian blacktip shark stock complex was previously assessed using an age-structured model and time-series of CPUE data from the various Australian and Taiwanese-operated fisheries that have exploited them. However, that assessment did not provide specific advice on the status of blacktip stock components in Western Australian waters and the reliability of catch, effort and biological data upon which the model relies is questionable. Assessing the status of these stocks is further complicated by the cryptic impacts of illegal foreign fishing, unreported catches in domestic fisheries and uncertainty in the species composition of catches. Given these issues, previous estimates of maximum sustainable yield (at least 2,000 tonnes per year) are considered unsuitable for assessment of Western Australian stock components.
Assessing the status of other Northern Bioregional shark stocks is even more complicated as most species were poorly identified in catch returns prior to 2000 and the biological information needed for developing assessment models is generally lacking. Thus, monitoring the status of other stocks taken by the northern shark fisheries will necessarily rely on analyses of reported catches and fishing effort for the foreseeable future. Although nominal catch rates of tiger and hammerhead sharks were at historically high levels between 2006/07 and 2008/09, the reported 94% and 96% declines in their respective CPUE between 1998/99 and 2005/06, suggests that these stocks were also depleted by the escalation of fishing effort as the northern shark fisheries developed. The causes of the high catch rates reported in daily logbooks since 2006/07 are uncertain.
Non-Retained Species Bycatch species impact: Not fully assessed
There has previously been some observed discarded bycatch of unsaleable sharks, rays and scalefish in these fisheries although the magnitude of this bycatch cannot be reliably assessed. Although risks to other scalefish species were previously rated as a low to negligible during the ESD risk assessment process, these assessments will require revaluation if the level of pelagic gillnet fishing effort escalates.
Protected species interactions (Longline only)
The northern shark fisheries were rated as having a generally low risk of interacting with Threatened, Endangered and Protected (TEP) species through the ESD risk assessment process. However, as this assessment was based on the majority of fishing effort being applied by longlines, these interactions will need to be reassessed if the gillnet fishing effort increases. Previous ESD risk assessments for individual TEP species groups in the northern shark fisheries are discussed with reference to contemporary data below.
Sharks and rays: Because the northern shark fisheries generally operate some distance offshore, they pose a negligible risk to speartooth sharks (Glyphis garricki and G. glyphis) and sawfish (Pristidae), which have primarily inshore, estuarine and riverine distributions. The closure of the south western portion of the WANCSF is expected to reduce the risk of interactions with white sharks (Carcharodon carcharias) and grey nurse sharks (Carcharias taurus) as these species have primarily temperate and sub-tropical distributions. Whale sharks (Rhincodon typus) are extremely unlikely to be caught by demersal longlines. However, the risk of entanglement in pelagic gillnet gear is uncertain.
Turtles: No turtle captures have either been observed or reliably reported in the northern shark fisheries. Although turtles are possibly more susceptible to capture by pelagic gillnets than demersal longlines, the amount of active gillnet effort over the last three years is small relative to the fisheries’ operational area and historical levels of gillnet effort in the fisheries.
Billfish: The small observed bycatch of billfish by demersal longlines in the northern shark fisheries was previously assessed as being insufficient to impact breeding stocks. This level of bycatch is unlikely to increase given the restrictions on fishing effort.
Cetaceans: As almost all northern shark fishery effort prior to 2005/06 was applied by demersal longlines, the risk of interaction with cetaceans was previously assessed as negligible. Although the potential increase in the use of gillnets may result in higher levels of interaction with cetaceans, there are no empirical data from domestic pelagic gillnet fisheries to estimate cetacean capture rates. However, as the bycatch of dolphins is cited as the primary reason for restricting the Taiwanese-operated pelagic gillnet fishery that operated in the same area during the 1970s and 1980s, the risk of cetacean interactions would need to be re-assessed should gillnet effort increase.
194 DEPARTMENT OF FISHERIES
NORTH COAST BIOREGION
Ecosystem Effects Food chain effects: Negligible
Given the smaller shark catches intended under current effort restrictions, the associated risk of any detrimental food chain effects is likely to be negligible. However, given the long recovery times expected for overexploited stocks of long-lived sharks, such as sandbar (and possibly tiger and hammerhead) sharks, unassessed residual food chain effects may persist for decades. It may also be necessary to reassess this risk if higher levels of fishing effort resume.
Habitat effects: Negligible
The principal types of fishing gear that may be used to target sharks in the region are set so that they either do not or only unintentionally come into contact with the seabed, and their physical impact on the seabed is therefore considered to be minimal. Despite fishing being constrained to a smaller area in 2005, the contemporaneous reduction in overall effort capacity is likely to have reduced the risk of habitat effects further.
Social Effects Direct: Northern shark fishing vessels reported crews of between 3 and 5 (mean of 5 in 2006/07 and 2007/08 and 4.2 in 2008/09). However, as only two or three fishing vessels have operated for a few months each year, the fisheries therefore represent a part time source of employment.
Indirect: Sharks are viewed as a menace by some members of the community due to their perceived danger to bathers and their predation of prized recreationally caught fish. However, others consider them to be important components of marine ecosystems that need to be conserved.
Economic Effects Estimated annual value (to fishers)
For year 2006/07 $224,000
Shark and scalefish $101,000
Shark fin* $123,000
For year 2007/08 $1,031,000
Shark and scalefish $525,000
Shark fins* $506,000
For year 2008/09 $985,000
Shark and scalefish $488,000
Shark fins* $497,000
*As fishers do not separately identify the weight of shark fins in catch returns, fin weight was calculated at an average of 3% of sharks’ whole weight and value was estimated using an average price of $45/kg. Categories of shark which do not have saleable fins were excluded from fin valuation.
Fishery Governance Target effort range: 600 gillnet days
(1,200 kilometre gillnet days) maximum
300 longline days
(300,000 hook days) maximum
Target catch range:
Sandbar sharks < 20 tonnes
Vessels operating in the northern shark fisheries reported using 516 (57%) of the 900 permitted longline fishing days and 59 (3%) of the permitted 1800 gillnet fishing days between 2006/07 and 2008/09. As operators generally reported using less than the maximum permitted amount of fishing gear (i.e. 1,000 longline hooks or 2,000 m of gillnet), 47% of the 900,000 permitted hook days and 3% of the 3,600 permitted km gillnet days were used during these three years.
Although total shark catches have declined significantly from their 2004/05 peak of 1,294 tonnes, the mean 2006/07-2008/09 annual sandbar shark catch of 63 tonnes far exceeded the upper target limit of 20 tonnes between 2006/07 and 2008/09 (Northern Shark Figure 2 and 3).
Current fishing (or effort) level:
Effort unacceptable (although below target)
Sandbar shark catch unacceptable
As longlining has been by far the dominant method employed in the fisheries, total effort is expressed in standardised units of number of hooks (or ‘hook days’) by converting the historically small amount of gillnet effort into the equivalent longline effort by comparing gillnet catches with longline Catch Per Unit Effort (CPUE) of all sharks. Total fishing effort was significantly lower in the northern shark fisheries between 2006/07 and 2008/09 than pre-2005/06 levels (Northern Shark Figure 2).
As breeding biomass of the sandbar stock is likely to be at the minimal acceptable limit reference point (40% of unfished biomass) and possibly continuing to decline (see Demersal Gillnet and Longline Fisheries Status Report), the excessive catches of this species in the northern shark fisheries over the last three years were unacceptable.
New management initiatives (2009/10)
Future management arrangements for the JANSF and the WANCSF are the subject of continuing discussion between the State and Commonwealth.
External Factors The primary external factor affecting the northern shark fisheries is the withdrawal and expiry of their export approvals under the Commonwealth Government’s EPBC Act. Development of demonstrably ecologically sustainable management arrangements required for the fisheries’ re-approval is hampered by a lack of contemporary pelagic
STATE OF THE FISHERIES AND AQUATIC RESOURCES REPORT 2009/10 195

NORTH COAST BIOREGION
gillnet data in the Northern Bioregion and other factors beyond the WA fisheries’ control including: Illegal, Under-reported and Unreported (IUU) shark catches, cross-jurisdictional catches of target and byproduct stocks and
long-term impacts on the breeding stock of sandbar sharks, which is critical to the sustainability of West Coast Demersal Gillnet and Demersal Longline Fishery catches (see Demersal Gillnet and Longline Fisheries Status Report).
NORTHERN SHARK TABLE 1
Northern shark fisheries’ (WANCSF and JANSF) elasmobranch catch from 2001/02 to 2005/06. Data for 2006/07 are not reported due to confidentiality of records from fewer than five vessels.
2006/07 - 2008/09 catch (tonnes)
Name Species or taxon Total Mean annual
Blacktip shark Carcharhinus spp. 202.0 67.3
Sandbar shark Carcharhinus plumbeus 188.5 62.8
Pigeye shark Carcharhinus amboinensis 138.4 46.1
Tiger shark Galeocerdo cuvier 103.1 34.4
Hammerhead sharks Sphyrnidae 82.9 27.6
Lemon shark Negaprion acutidens 45.4 15.1
Spot-tail shark Carcharhinus sorrah 36.2 12.1
Dusky shark Carcharhinus obscurus 10.4 3.5
Shovelnose rays Rhinobatidae, Rhynchobatidae 8.5 2.8
Other elasmobranchs 18.9 6.3
Total elasmobranchs 834.4 278.1
Grey mackerel Scomberomorus 6.2 2.1
Cod Serranidae 1.3 0.4
Spanish mackerel Scomberomorus commerson 0.6 0.2
Mackerel, other Scombridae 0.3 0.1
Other scalefish Teleostii 0.7 0.2
Total scalefish 9.1 3.0
196 DEPARTMENT OF FISHERIES
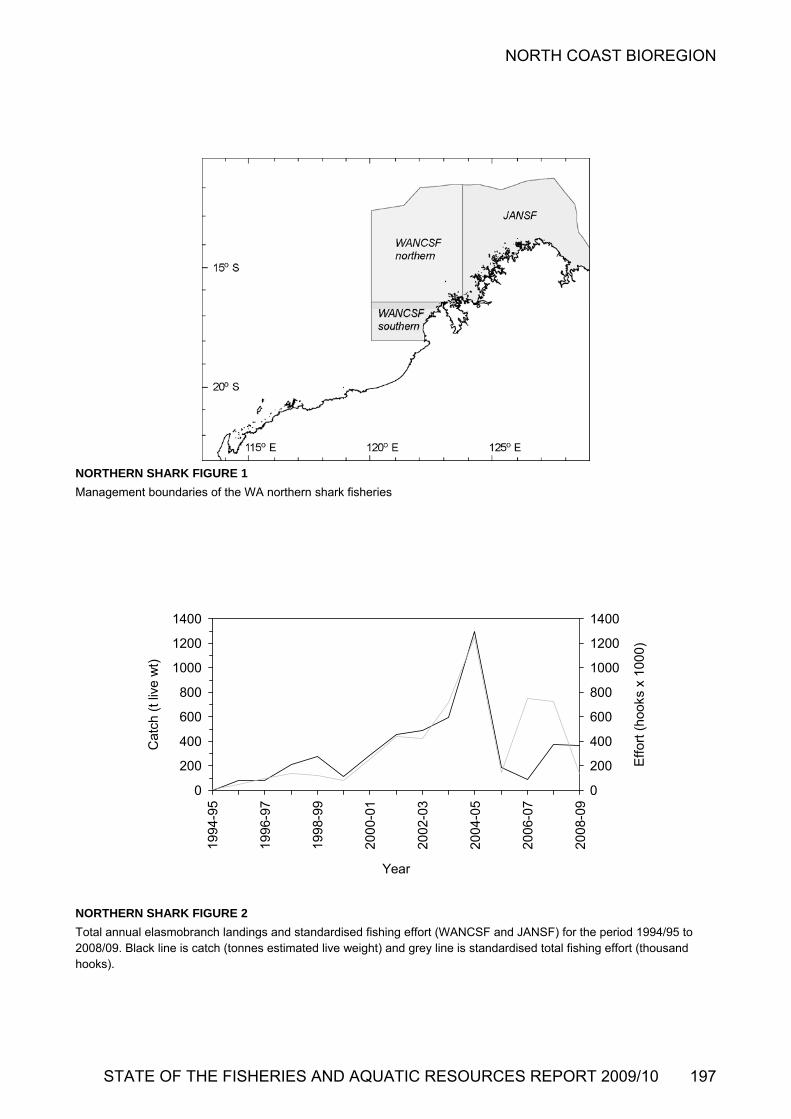
NORTH COAST BIOREGION
NORTHERN SHARK FIGURE 1
Management boundaries of the WA northern shark fisheries
Year
1994
-95
1996
-97
1998
-99
2000
-01
2002
-03
2004
-05
2006
-07
2008
-09
Cat
ch (
t liv
e w
t)
0
200
400
600
800
1000
1200
1400
Eff
ort (
hook
s x
1000
)
0
200
400
600
800
1000
1200
1400
NORTHERN SHARK FIGURE 2
Total annual elasmobranch landings and standardised fishing effort (WANCSF and JANSF) for the period 1994/95 to 2008/09. Black line is catch (tonnes estimated live weight) and grey line is standardised total fishing effort (thousand hooks).
STATE OF THE FISHERIES AND AQUATIC RESOURCES REPORT 2009/10 197
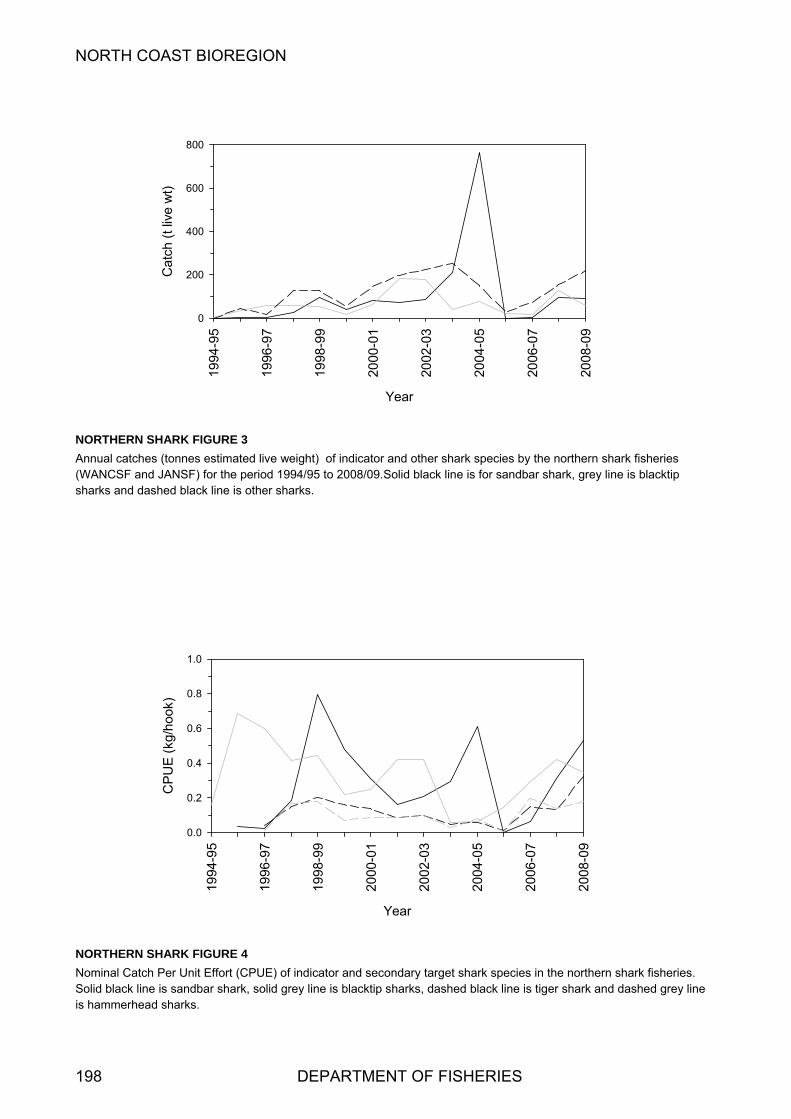
NORTH COAST BIOREGION
198 DEPARTMENT OF FISHERIES
Year
1994
-95
1996
-97
1998
-99
2000
-01
2002
-03
2004
-05
2006
-07
2008
-09
Cat
ch (
t liv
e w
t)
0
200
400
600
800
NORTHERN SHARK FIGURE 3
Annual catches (tonnes estimated live weight) of indicator and other shark species by the northern shark fisheries (WANCSF and JANSF) for the period 1994/95 to 2008/09.Solid black line is for sandbar shark, grey line is blacktip sharks and dashed black line is other sharks.
Year
1994
-95
1996
-97
1998
-99
2000
-01
2002
-03
2004
-05
2006
-07
2008
-09
CP
UE
(kg
/hoo
k)
0.0
0.2
0.4
0.6
0.8
1.0
NORTHERN SHARK FIGURE 4
Nominal Catch Per Unit Effort (CPUE) of indicator and secondary target shark species in the northern shark fisheries. Solid black line is sandbar shark, solid grey line is blacktip sharks, dashed black line is tiger shark and dashed grey line is hammerhead sharks.
NORTH COAST BIOREGION
Pearl Oyster Managed Fishery Status Report A. Hart and D. Murphy
Management input by J. Froud
Main Features
Status
Stock level Acceptable
Fishing level Acceptable
Current Landings
Commercial Pearl Oyster Catch
Shell numbers (All Zones) - 260,002 culture shells
Fishery Description The Western Australian pearl oyster fishery is the only remaining significant wild-stock fishery for pearl oysters in the world. It is a quota-based, dive fishery, operating in shallow coastal waters along the North-West Shelf.
The harvest method is drift diving, in which six to eight divers are attached to large outrigger booms on a vessel and towed slowly over the pearl oyster beds, harvesting legal-sized oysters by hand as they are seen. The species targeted is the Indo-Pacific, silver-lipped pearl oyster (Pinctada maxima).
Governing legislation/fishing authority
Pearling Act 1990
Pearling (General) Regulations 1991
Australian Government Environment Protection and Biodiversity Conservation Act 1999 (Export Exemption)
Consultation process
Meetings between the Department of Fisheries and industry
Boundaries
The fishery is separated into 4 zones (Pearl Figure 1), as follows:
Pearl Oyster Zone 1: NW Cape (including Exmouth Gulf) to longitude 119°30´ E. There are 5 licensees in this zone.
Pearl Oyster Zone 2: East of Cape Thouin (118°20´ E) and south of latitude 18°14´ S. The 9 licensees in this zone also have full access to Zone 3.
Pearl Oyster Zone 3: West of longitude 125°20´ E and north of latitude 18°14´ S. The 2 licensees in this zone also have partial access to Zone 2.
Pearl Oyster Zone 4: East of longitude 125°20´ E to the Western Australia/Northern Territory border. Although all licensees have access to this zone, exploratory fishing has shown that stocks in this area are not economically viable. However, pearl farming does occur.
There is also a ‘buffer zone’, which may be accessed by licensees from Zones 1 and 2; in practice, it is generally only utilised by Zone 1 licensees.
Management arrangements
The Western Australian pearling industry comprises three main components: the collection of pearl oysters from the wild; production of hatchery-reared pearl oysters; and grow-out of pearls on pearl farm leases. Quota limits are set for the take of pearl oysters from the wild to ensure the long-term sustainability of the resource.
In 1996 the WA Government granted hatchery options to licensees as part of an incentive program to encourage them to adopt new technology that enabled the production of pearls from oysters reared in hatcheries, thus reducing the reliance on the wild stocks of pearl oysters. The number of pearls produced from hatchery-reared pearl oysters is now also governed by quota limitations.
The pearl oyster fishery is managed primarily through output controls in the form of a total allowable catch (TAC) divided up into individually transferable quotas (ITQs). There are 572 wild-stock ITQ units allocated across three management zones (Zone 1 – 115; Zone 2 – 425; Zone 3 – 32) and 350 hatchery ITQ units allocated amongst 17 pearling licensees.
The value of a hatchery quota unit is 1,000 shell. The value of wild-stock quota units varies, depending on status of wild stocks, but historically has been about 1,000 shell per unit when pearl stocks are at normal levels. However, wild stock quota units for Zone 2/3 for the 2010 season were set at 3,200 shell (TAC: 1,500,000), as result of high stock levels (Pearl Table 1).
Wild stocks are reviewed each year by the Department of Fisheries to enable the TAC to be set for each zone of the fishery. There is a minimum legal size of 120 mm shell length, and maximum legal sizes and area-specific TACs have been set where appropriate, for example in Exmouth Gulf in Zone 1.
A comprehensive Ecologically Sustainable Development assessment of this fishery has been undertaken to identify any potential sustainability risks requiring direct management. The only issue identified through this process related to the breeding stock levels of pearl oysters. Boxed text in this status report provides the annual assessment of performance for this issue.
STATE OF THE FISHERIES AND AQUATIC RESOURCES REPORT 2009/10 199

NORTH COAST BIOREGION
Research summary
Current stock assessment research is focused on:
Stock assessment using catch and effort statistics (taking into account discard rates) and settlement and length-frequency sampling to estimate the total allowable catch.
Monitoring an index of settlement for predicting future years catch levels using the relative number of piggy back spat.
Research on decision rules for determining the TAC
Understanding environmental drivers of pearl oyster abundance
The Department of Fisheries’ Research Division’s Fish Health Unit also provides a comprehensive disease-testing program to the industry.
There are several other significant research projects being carried out by the pearling industry focusing on environmental management, pearl oyster health, and improved health and safety for pearl divers. The main aims of this research are to:
Investigate aspects of oyster oodema disease (OOD) in Pinctada maxima, to assist in mitigating the impacts and understand pathways to disease and disease response in pearl oysters;
demonstrate that the pearling industry operates in a manner acceptable to public standards for access to the marine environment; and
develop a culture of best practice and continuous self-improvement with regard to environmental management and health and safety
Retained Species Commercial landings (season 2009):
260,002 oysters
In 2009, the number of wild-caught pearl oysters was 260,002, in comparison to 810,115 oysters caught in 2008 (Pearl Tables 1 and 2). The TAC for the pearl oyster fishery for 2009 was 1,060,400, therefore only 25% of the TAC was caught. The reduced take was due to an economic decision by industry, given the number of oysters they required, and not due to low abundance of the stock.
Zone 2 was the only area fished (Pearl table 1) with no fishing in Zone 1 or Zone 3 since 2008 (Pearl Table 2).
Fishing effort/access level
Total effort was 3,284 dive hours (Pearl Tables 1 and 2), a reduction of 80% from the 2008 of 15,785 hours.
Stock Assessment Assessment complete: Yes
Breeding stock levels: Acceptable
A stock assessment of the Pinctada maxima fishery was undertaken for the 2009 fishing season based on catch and
effort statistics, settlement analysis (44,571 shell sampled for ‘piggyback’ spat to obtain estimates of age 0+ and 1+ relative abundance), length-frequency sampling (8,700 shells measured), shell discard rates by size and location, population surveys, and an evaluation of the predictive capacity of 0+ and 1+ spat settlement data.
These were used to generate trends in stock indicators, from which the determination of the TAC for 2010 was undertaken. Results for each zone, and issues relevant to stock sustainability, were as follows:
Zone 2/3: The catch rate achieved by the fishery is an indicator of the abundance of the 3/4 to 6/7-year-old oysters specifically targeted for pearl production. Year-to-year variations reflect changes in recruit abundance, while the long-term trend in catch per unit effort (CPUE) involves an element of effort efficiency change. In 2009, CPUE was 79 shells per dive hour which was the highest since this times series began in 1979 and a 50% increase from the 2008 catch rate (53 shells/hour – Pearl Table 1) but this occurred with a substantial reduction in catch and effort and an increase was therefore to be expected.
Catch Prediction: Recruitment to the fishery is predicted by the piggyback spat abundance index at 3 to 5 years prior to the current fishing year. A very high 0+ recruitment detected in the Zone 2 fishery in 2005 was confirmed in the 1+ year class in 2006, and again in the 2+ age class from population surveys in 2007. This cohort entered the commercially fished population in 2008 and 2009, resulting in the highest CPUE for over 30 years.
The 2010 stock abundance in Zone 2 is predicted to be higher than 2009. Consequently, the 2010 TAC in Zone 2/3 has been increased to 1,500,000 (3,200 shell per unit). This is 220 % above the baseline level of 1,000 shell per unit. (Pearl Table 1).
Zone 1: The Zone 1 fishery has not been fished for two years.
Breeding stock: Under average growth and mortality, recruitment into the pearl oyster breeding stock exceeds natural mortality, and hence breeding stocks are likely to be increasing in most years. This results from the ‘gauntlet’ fishing strategy employed by the industry, in which the young, fast-growing shell (principally males) of 120 – 165 mm shell length are targeted for their fast pearl-producing qualities.
Animals that survive this ‘gauntlet’ are effectively protected from 6 to 7 years of age onward, and may live for another 15 to 20 years. With very low natural mortalities, this results in a large residual broodstock being built-up over time. In Zone 1, breeding stock should also be increasing due to the low effort since 2002, including no fishing in 2004 and 2009 (Pearl Table 2).
200 DEPARTMENT OF FISHERIES

NORTH COAST BIOREGION
Non-Retained Species Bycatch species impact: Negligible
Divers have the ability to target pearl oysters of choice (species, sizes and quality of P. maxima). Pearl oysters brought to the vessel after hand collection are young and have relatively little epiphytic growth (fouling organisms). A small number of over-sized or under-sized oysters are returned to the substrate.
Protected species interaction: Negligible
There is no interaction between the pearl oyster fishing operation and protected species.
Ecosystem Effects Food chain effects: Negligible
The fishery removes only a small proportion of the biomass of pearl oysters on the fishing grounds and is considered to have negligible impact on the food chain in the fishing area.
Habitat effects: Negligible
Pearl divers have minimal contact with the habitat during fishing operations. The main habitat contact is by pearl oysters held in mesh panels on holding sites following capture. However, these sites cover a very small proportion of the habitat and the activity concerned is unlikely to cause any lasting effect.
Similarly, the pearl farming operation, which uses longline systems in areas of high tidal flow to culture pearls, has limited impact on the environment. Physical effects are limited to static anchoring systems in typically sand/mud habitats. Environmental management research (see ‘Research summary’) has found categorically that pearl farming has negligible impacts on habitat and environment.
Social Effects Direct Pearl oyster fishing vessels operate from the Lacepede Islands north of Broome to Exmouth Gulf in the south. The number of vessels in the fishing fleet has been slowly reducing from 16 in 1997 (overall), mostly due to increased fleet efficiency and increased reliance on hatchery-produced shells. In 2009, with the negative impact of the Global
Financial Crisis (GFC) on the industry, only two vessels fished.
Most vessels presently operate 10 – 14 crew for the fishing of pearl oysters between March and June each year. These vessels also support a number of other pearl farm functions throughout the year.
Indirect Prior to the GFC, the pearling industry provided employment for approximately 500 people in the northern coastal regions, including in the operation of the pearl farms. However the impact of the GFC resulted in a substantial reduction in personnel employed in the pearling industry.
Economic Effects Estimated annual value (to fishers)
2009 (Total Industry value): $85.5 million
A precise estimate of the total industry value is difficult to achieve, owing to the variable time lags that occur between harvesting and sale to offshore buyers, and the costs incurred in marketing before sales take place. Based on information provided by the industry, the value of cultured pearls and by-products in 2009 was considered to be approximately $85.5 million.
Fishery Governance Target effort range: 14,071 - 20,551 hours
The target effort range relates to the time required to achieve the TAC in the pearl oyster fishery of 1,060,400 oysters in 2009 (1,005,400 oysters in Zone 2/3, and 55,000 oysters in Zone 1).
Acceptable effort ranges for individual management zones are 11,456 – 15,819 dive hours for Zone 2/3 and 2,615 – 4,732 dive hours for Zone 1. These ranges are based on the 5-year period (1994 – 1998) following the introduction of global positioning systems (GPS) into the fishery, and reflect the typical variation in abundance of the stock under natural environmental conditions.
Zone 2/3 of the pearl oyster fishery achieved its catch with 3,284 dive hours (Pearl Table 1), which was well below the target range. The low effort was the result of only 26% of the TAC being caught, which was a consequence of cost-restraint within the industry deriving from GFC.
Zone 1 of the pearl oyster fishery was not fished in 2009 (Pearl Table 2).
The CPUE is at an all time high in Zone 2, indicating that stocks are at higher than average levels in Zone 2.
Current effort level: Acceptable
Overall fishery effort level is acceptable, but current levels do not reflect stock abundance.
The performance measures for this fishery, which relate to breeding stock biomass, include the area of fishing compared to the distribution of the stock and the catch rates of young oysters within each of the fishing zones.
All performance measures were met for 2009. The area of fishing remains substantially less than 60% of the distribution of oysters within this region. The catch rates in Zones 2 and 3 were both still above their respective performance levels, with a combined catch rate of 79 oysters/hour.
STATE OF THE FISHERIES AND AQUATIC RESOURCES REPORT 2009/10 201

NORTH COAST BIOREGION
New management initiatives (2010)
The Minister has approved a new departmental funding model for the industry through the establishment of access fees based on the gross value of the wild stock taken and lease fees rather than a recovery of management costs model. The Minister has also disbanded the Pearling Industry Advisory Committee. The Department is also continuing discussions with the pearling industry with a view to introducing a more delegated model of co-management in the pearling industry. Under such a model, the responsibility for completing certain tasks currently performed by the Department could instead be delegated to the pearling industry. Furthermore, the Department is intending to rationalise the legislation that is currently used to regulate the pearling industry by incorporating it into the broader fisheries legislation framework.
External Factors The pearl oyster stocks underpinning the fishery in Zone 2/3 continue to provide a sufficient level of production to support this major Western Australian industry, however preliminary research points to environmental factors being an external driver of the current high abundance. The industry will continue to experience difficulty from the Global Financial Crisis, which had a major impact on the market for luxury goods, including pearls. The low catch and effort in 2009 are a direct result of companies opting not to fish because of this. Future signs for 2010 suggest a modest recovery and overall catches are expected to be higher, although the TAC will still not be taken. Finally, the on-going issue of the OOD (oyster oedema disease) continues to hamper hatchery-production capacity in some sectors of the Industry, however to date there is no evidence the disease has affected wild stocks.
202 DEPARTMENT OF FISHERIES

NORTH COAST BIOREGION
STATE OF THE FISHERIES AND AQUATIC RESOURCES REPORT 2009/10 203
PEARL TABLE 1
Pearl shell catch and effort – Broome area (Zone 2/3).
Notes: Total catches exceeding quota are a result of fisher shell tally error and the collection of broodstock shell being included as part of culture shell tallies. 1 ‘MOP’ is an abbreviation for mother-of-pearl; 2 wild stock quota in 2008 initially set at 639,800 (see SOF 2007 report), however a mid-season review increased It to 822,600 because of enhanced stock abundance
Year Wild stock
quota No. of culture
shells No. of MOP1
shells Total shells Dive hours
Culture shells/hr
Average Total depth shells/hr
1979 371,806 355,599 727,405 16,068 23.1 45.3
1980 364,502 260,714 625,216 18,568 19.6 33.7
1981 481,193 210,649 691,842 23,320 20.6 29.7
1982 460,000 439,092 132,931 572,023 15,710 27.9 36.4
1983 520,000 365,381 87,049 452,430 19,019 19.2 23.8
1984 375,000 242,828 47,230 290,058 11,615 20.9 25
1985 342,000 272,869 53,831 326,700 12,423 21.0 26.3
1986 360,000 337,566 10,929 348,495 16,478 20.5 21.2
1987 380,000 365,397 0 365,397 17,476 20.9 20.9
1988 445,000 379,657 0 379,657 14,600 26.0 26.0
1989 445,000 445,364 0 445,364 18,625 23.9 23.9
1990 457,000 453,705 0 453,705 23,263 19.5 15.3 19.5
1991 457,000 460,608 0 460,608 21,657 21.3 16.1 21.3
1992 457,000 461,599 0 461,599 19,455 23.7 13.9 23.7
1993 457,000 457,186 0 457,186 14,733 31.0 15.7 31.0
1994 457,000 456,832 0 456,832 12,384 36.9 11.4 36.9
1995 512,000 511,633 0 511,633 12,217 41.9 12.4 41.9
1996 512,000 511,756 0 511,756 12,774 40.1 16.8 40.1
1997 512,000 512,314 0 512,314 16,893 30.3 12.9 30.3
1998 457,000 457,266 0 457,266 14,499 31.5 12.6 31.5
1999 457,000 457,842 0 457,842 10,300 44.4 11.6 44.4
2000 502,500 501,419 0 501,419 9,258 54.2 11.2 54.2
2001 502,500 502,484 0 502,484 12,054 41.7 12.1 41.7
2002 479,750 479,562 0 479,562 15,661 30.6 13.4 30.6
2003 457,000 456,988 0 456,988 14,242 32.1 13.6 32.1
2004 457,000 404,984 0 404,984 11,994 33.8 12.3 33.8
2005 502,500 488,303 0 488,303 14,807 32.9 12.1 32.9
2006 502,500 467,436 0 467,436 11,992 39.0 13.7 39.0
2007 548,400 550,972 0 550,972 12,514 44.0 12.9 44.0
2008 822,600 810,115 0 810,115 15,387 52.6 14.7 52.6
2009 1,005,400 260,002 0 260,002 3,284 79.2 11.4 79.2
2010 1,500,000

NORTH COAST BIOREGION
PEARL TABLE 2
Pearl shell catch and effort in Zone 1 since 1983.
Year Wild stock quota Culture
No. of culture shells Dive hours shells/hr
1983 27,895 542 51.5
1984 45,690 827 55.3
1985 55,000 46,009 897 51.3
1986 55,000 39,663 1,104 35.9
1987 55,000 46,269 1,194 38.7
1988 55,000 43,046 1,243 34.6
1989 55,000 52,937 1,010 52.4
1990 55,000 43,711 1,146 38.1
1991 55,000 63,774 1,681 37.9
1992 55,000 53,386 1,266 42.2
1993 115,000 79,465 2,395 33.2
1994 115,0001 132,3162 6,291 21.0
1995 115,0001 121,3122 6,247 19.4
1996 115,0001 80,163 5,013 16.0
1997 115,0001 110,348 9,494 11.6
1998 115,000 108,056 6,094 17.7
1999 115,000 90,4143 4,789 18.9
2000 115,000 66,772 5,893 11.3
2001 115,000 68,931 9,480 7.3
2002 55,000 29,126 2,729 10.7
2003 45,0004 22,131 1,647 13.4
2004 45,0004 05 05
2005 55,0006 25,572 1,084 23.6
2006a 55,0007 36,546 1,343 27.2
2006b 35,0007 34,900 349 100
2007 55,000 49,686 2,138 23.0
2008 55,000 10,092 398 25.3
2009 55,000 0 0
2010 55,000
1. A developmental period was introduced into the fishery from 1993 to 1997 to encourage hatchery production technology. The main undertakings were the introduction of 3 new Zone 1 pearl industry licences, and an increase in TAC of pearl shell in Zone 1 (from 55,000 to 115,000 shell).
2. Management arrangements in 1994 and 1995 allowed fishing of quota a year ahead.
3. Hatchery stock used since 1999 has reduced the need for wild-stock shell between 1999 and 2005.
4. In 2003 and 2004, the 115,000 Zone 1 quota was still maintained, however only 45,000 could be caught from wild stock due to hatchery shell substitution.
5. In 2004, no wild-stock quota was taken as only hatchery oysters were used.
6. Post 2005, the wild-stock quota for management and compliance purposes was returned to its long-term sustainable level of 55,000.
7. A higher TAC in 2006 was the result of an additional 35,000 experimental quota (2006b) allocated for a lightly-exploited stock within a pearl farm lease, and 34,900 of this quota was caught in 349 dive hours at a CPUE of 100 shells per hour. The remainder was caught at 27.2 shells per hour.
204 DEPARTMENT OF FISHERIES
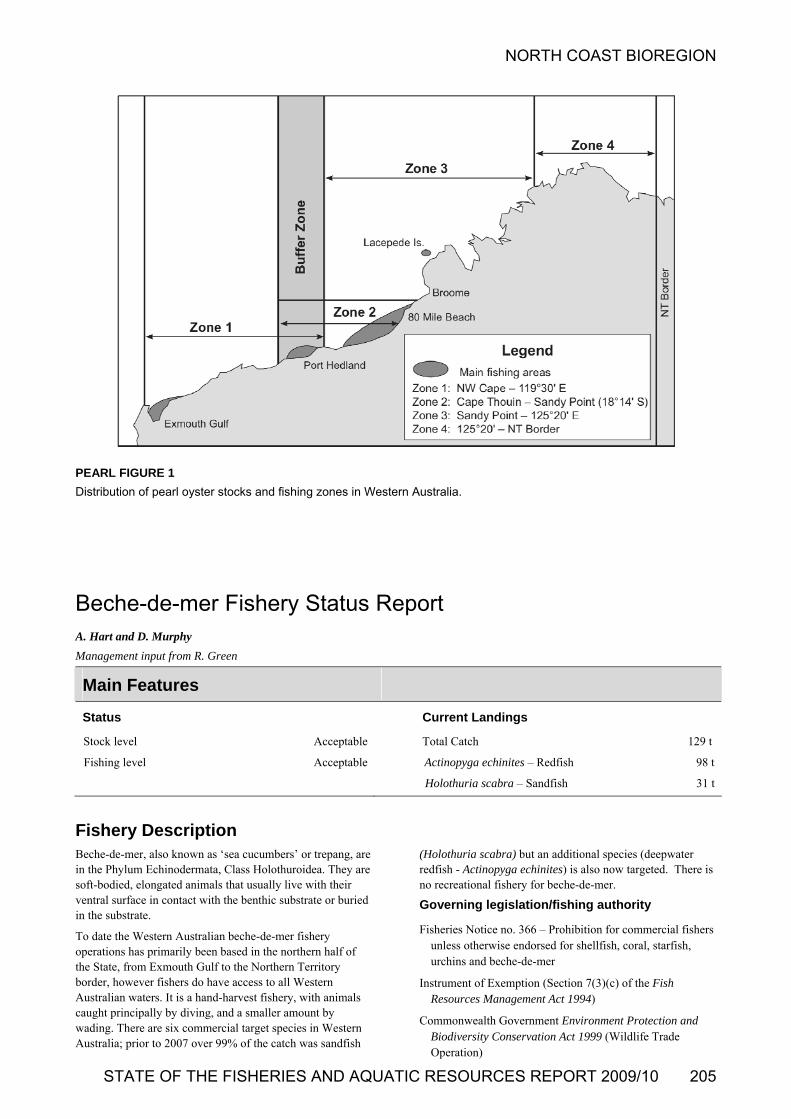
NORTH COAST BIOREGION
STATE OF THE FISHERIES AND AQUATIC RESOURCES REPORT 2009/10 205
PEARL FIGURE 1
Distribution of pearl oyster stocks and fishing zones in Western Australia.
Beche-de-mer Fishery Status Report A. Hart and D. Murphy
Management input from R. Green
Main Features
Status
Stock level Acceptable
Fishing level Acceptable
Current Landings
Total Catch 129 t
Actinopyga echinites – Redfish 98 t
Holothuria scabra – Sandfish 31 t
Fishery Description Beche-de-mer, also known as ‘sea cucumbers’ or trepang, are in the Phylum Echinodermata, Class Holothuroidea. They are soft-bodied, elongated animals that usually live with their ventral surface in contact with the benthic substrate or buried in the substrate.
To date the Western Australian beche-de-mer fishery operations has primarily been based in the northern half of the State, from Exmouth Gulf to the Northern Territory border, however fishers do have access to all Western Australian waters. It is a hand-harvest fishery, with animals caught principally by diving, and a smaller amount by wading. There are six commercial target species in Western Australia; prior to 2007 over 99% of the catch was sandfish
(Holothuria scabra) but an additional species (deepwater redfish - Actinopyga echinites) is also now targeted. There is no recreational fishery for beche-de-mer.
Governing legislation/fishing authority
Fisheries Notice no. 366 – Prohibition for commercial fishers unless otherwise endorsed for shellfish, coral, starfish, urchins and beche-de-mer
Instrument of Exemption (Section 7(3)(c) of the Fish Resources Management Act 1994)
Commonwealth Government Environment Protection and Biodiversity Conservation Act 1999 (Wildlife Trade Operation)
NORTH COAST BIOREGION
Consultation process
Department-industry meetings and an annual Broome Consultative Forum.
Boundaries
The beche-de-mer fishery is permitted to operate throughout Western Australian waters with the exception of a number of specific closures around the Dampier Archipelago, Cape Keraudren, Cape Preston and Cape Lambert, the Rowley Shoals and the Abrolhos Islands.
Management arrangements
The developing fishery for beche-de-mer is managed through input controls including limited entry, maximum number of divers, species-dependent minimum legal size limits, and gear restrictions. Access to the fishery is limited to the 6 Fishing Boat Licence holders listed in the Instrument of Exemption enabling the take of beche-de-mer.
Beche-de-mer may only be harvested by hand or diving by licensed commercial fishers operating under the authority of a Fishing Boat Licence that is listed on the Instrument of Exemption.
The maximum number of divers (per endorsed fishing boat licence) allowed to dive for beche-de-mer at any one time is four, with a maximum number of six crew allowed on the vessel.
There are six target species of beche-de-mer harvested in Western Australia. At present, the minimum target lengths for these commercial beche-de-mer species are based on the Northern Territory’s minimum sizes, which have been set based on size at sexual maturity.
A comprehensive Ecologically Sustainable Development assessment of this fishery has been undertaken to identify any potential sustainability risks requiring direct management. The only issue identified through this process related to the breeding stock levels of beche-de-mer. Boxed text in this status report provides the annual assessment of performance for this issue.
Research summary
Current research is focused on reporting of annual catch and effort statistics. A daily catch and effort logbook has been tested and designed for the fishery and was implemented in 2007. The logbook obtains species-specific, fine-scale catch and effort data and appropriate environmental information, such as depth fished.
Retained Species Commercial landings (season 2009):
129 tonnes (live weight)
Landings
In 2009 the total beche-de-mer catch was 129 t live weight (Beche-de-mer Table 1), a decrease of 35% over last years catch of 196 t, mainly due to less catch from the newly
developing redfish fishery.
On a species-specific level, the 129 t catch was made up of 31 t (24%) Holothuria scabra (Sandfish) and 98 t (76%) Actinopyga echinites (Redfish) (Beche-de-Mer Figure 1). This is the third year that redfish has been caught in high numbers and represents a new target species within the fishery. The catch of sandfish, while up on the last 2 years is still relatively low.
Fishing effort/access level
Only 2 licensed vessels fished for beche-de-mer in 2009, the same as 2008 and 2007. This represents 33% of the potential number of vessels that have an endorsement to fish.
Total effort was 441 crew days – about 22% lower than in 2008 and similar to 2004 to 2008 average effort level (Beche-de-mer Table 1).
Stock Assessment Assessment complete: Yes
Assessment method: Catch rate
Breeding stock levels: Adequate
The overall catch rate for beche-de-mer (diving only in 2009) was 292 kg/crew day, which is the 2nd highest in the history of the fishery, after 2008. The principal reason for this was the continued development of a new target species (deepwater redfish), which had a CPUE of 350 kg/day and the overall lower level of effort. There was also a high catch rate in the existing sandfish fishery associated with reduced fishing for this species over the last 3 years (Beche-de-mer Figure 1).
Estimates of Maximum Sustainable Yield (MSY) of sandfish were obtained for the entire WA fishery and Kimberley sub-regions using a biomass dynamics model. Current average catch of sandfish is below the MSY (Beche-de-mer Table 2), indicating that the level of fishing is sustainable. However, large variability in the estimates of q (0.21 – 0.57) for the same species suggests that a cautious interpretation of the model outputs is required. The model is updated with new data every year.
The initial performance measures for the fishery relate to breeding stock maintenance as indicated by catches remaining in the range 50 – 150 t and catch rate remaining above 80 kg/crew day. Both the catch and catch rate measure was met.
Target catch ranges and performance indicators will be reviewed as finer-scale species-specific information becomes available
206 DEPARTMENT OF FISHERIES

NORTH COAST BIOREGION
Non-Retained Species Bycatch species impact: Negligible
No bycatch species are known to be taken in this fishery. Given the selective method of fishing used (diving or wading, collection by hand only), the minimal level of interaction with other species is likely to be maintained.
Protected species interaction: Negligible
There are currently no protected species known to be taken in this fishery.
Ecosystem Effects Food chain effects: Negligible
This fishery harvests only a small amount of sandfish and redfish per annum. The effect from this harvesting on the rest of the ecosystem, given that the catch is spread over a wide region, would be insignificant.
In addition, predation on the beche-de-mer is relatively infrequent due to the toxins present in their body tissues. It is highly unlikely these animals are a major diet for higher-order predators, due to these toxins acting as an effective defence system.
Habitat effects: Negligible
Divers collect beche-de-mer as they drift over the bottom; there is minimal impact on the habitat as divers are highly selective in their fishing effort and no fishing gear or lines contact the seabed. The vessels work during the day and anchor at night, usually further inshore where they are protected from the open ocean that is subject to higher seas and wind. Most fishers are mindful of the habitat they choose to anchor over, so they avoid more diverse bottom habitat.
There are some areas where fishers can access beche-de-mer by wading through shallow water mangrove lagoons and estuaries. This is a minor component of the fishery. This method may be applied in areas of the Kimberley that are
accessible and prone to extreme tidal movements. Wading usually occurs on soft sandy substrates, with minimal impact on these habitats.
Social Effects In 2009, two vessels with a total of nine crew were working in the fishery. Additional individuals are employed for the processing of the product. These activities are mostly located in the Northern Territory where the fishing fleet is based.
Economic Effects Estimated annual value (to fishers)
for year 2009: $430,000
The estimated annual value for 2009 was $430,000 based on an average product price of $10.00/kg (gutted and boiled) or $3.33/kg live weight. This is a farm gate value and supports a substantial processing and value-adding sector.
Fishery Governance Target catch range: 50 – 150 tonnes
Current fishing level of 129 tonnes is within the target range.
New management initiatives (2009/10)
A daily catch and effort logbook has been implemented and is beginning to provide species-specific information on catch and effort. This will enable species-specific management response and performance indicators to be developed.
External Factors The remoteness of the currently fished stock and the large tidal ranges where it occurs are natural barriers to uncontrolled expansion of fishing of beche-de-mer. Marine park planning processes may also impact on the potential extent of the fishery.
STATE OF THE FISHERIES AND AQUATIC RESOURCES REPORT 2009/10 207

NORTH COAST BIOREGION
208 DEPARTMENT OF FISHERIES
BECHE-DE-MER TABLE 1
Catch and effort of Beche-de-mer in Western Australia since 1995.
Year 1Live Wt (t) (all species)
Live Wt (t) (Sandfish)
Live Wt (t) (Redfish)
Live Wt (t) (Teatfish)
Crew Days (all methods)
1995 93 93 0 0 737
1996 257 257 0 0 945
1997 382 371 9 2.8 1,852
1998 310 310 0 0 2,565
1999 176 176 0 0 1,757
2000 83 83 0 0 607
2001 90 88 2 0.2 663
2002 87 87 0 0 535
2003 122 121 1 0 1,019
2004 81 81 0 0.2 470
2005 78 75 0 0 545
2006 58 55 3 0.3 660
2007 113 26 87 0 392
2008^ 1962 27 169 0 564
2009 129 31 98 0 441
1 Sandfish represented 99% of catch until 2006 2 Redfish represented 86% of catch in 2008
^ Diving only method used in recent years
BECHE-DE-MER TABLE 2
Estimates of Maximum Sustainable Yield (MSY) of sandfish in the Western Australian Beche-de-Mer fishery.
Parameter estimates*
Area MSY
(t) Current average catch
(2005-2009) (t) r K (t) q
Entire Fishery 139 43 0.820 970 0.21
Kimberley region (Grid 1425 and 1426)
70 37 0.95 418 0.57
* r – intrinsic rate of increase
k – carrying capacity (Virgin biomass)
q – catchability or fishing power
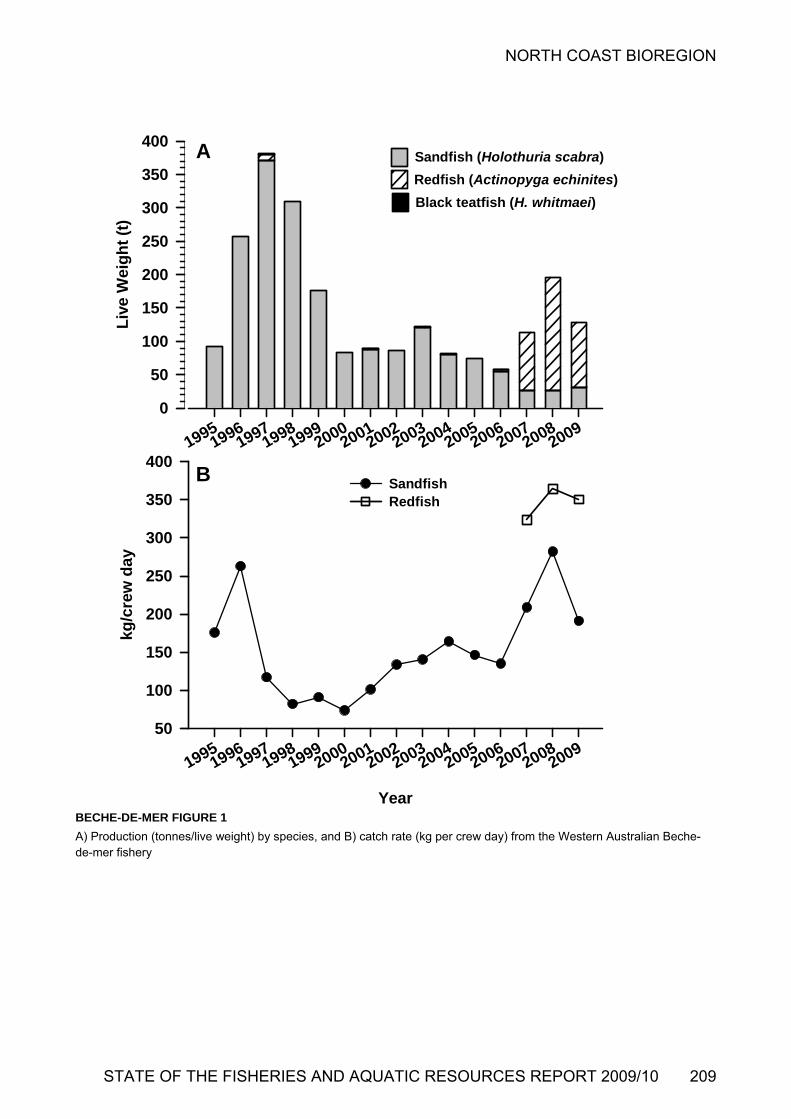
NORTH COAST BIOREGION
STATE OF THE FISHERIES AND AQUATIC RESOURCES REPORT 2009/10 209
BECHE-DE-MER FIGURE 1
A) Production (tonnes/live weight) by species, and B) catch rate (kg per crew day) from the Western Australian Beche-de-mer fishery
19951996
19971998
19992000
20012002
20032004
20052006
20072008
2009
Liv
e W
eig
ht
(t)
0
50
100
150
200
250
300
350
400
Year
19951996
19971998
19992000
20012002
20032004
20052006
20072008
2009
kg/c
rew
day
50
100
150
200
250
300
350
400SandfishRedfish
B
A Sandfish (Holothuria scabra)
Black teatfish (H. whitmaei)
Redfish (Actinopyga echinites)

NORTH COAST BIOREGION
AQUACULTURE Regional Research and Development Overview
Aquaculture in the north coast bioregion is dominated by the production of pearls from the species Pinctada maxima (south-sea pearls). This industry sector utilises both wild-caught and hatchery-reared oysters for the production of cultured pearls. The wild-stock fishery is reported in the North Coast bioregion section of this volume.
The Department of Fisheries also has a major role in the management and regulation of pearl hatcheries, seeding activities and pearl oyster farm leases.
A Memorandum of Understanding (MOU) between the Western Australian and Northern Territory fisheries ministers was signed in June 2006. The MOU recognises that WA and the NT comprise the entire Australian south-sea pearling industry and that product from both jurisdictions supplies the same market.
The Department of Fisheries is currently working with the pearling industry to investigate the potential for increasing the level of industry self-management in the pearl oyster fishery.
The operator of a fish farm producing barramundi (Lates calcarifer) in Cone Bay is successfully increasing production following approval by the EPA to increase output to 1,000 tonnes per annum.
The Department of Fisheries continues to oversee the development of several indigenous aquaculture projects in this region, targeting the aquaculture of barramundi in sea-cages and earthen ponds, cherabin (Macrobrachium rosenbergii), edible rock oysters (Saccostrea sp.) and ornamental species
.
COMPLIANCE & COMMUNITY EDUCATION
The North Coast is one of the largest bioregions in WA – stretching from Onslow to the Western Australia/Northern Territory border with over 2600 kilometres of coastline.
The North Coast Bioregion has many biodiversity rich areas including the Rowley Shoals, Montebello Islands, Barrow Islands and hundreds of islands and atolls. These areas attract many people – especially for fishing.
Tourism is a major part of the coastal towns in the North Coast with over 600,000 additional people visiting the area each year. The transient population usually increases in the cooler months from May to October including international, interstate and intrastate tourists.
Many of the towns in this bioregion support mining communities where the majority of the population are fly in/ fly out. Surveys have shown that a large proportion of mining community and tourists take part in fishing while visiting the bioregion.
Two district offices located in Broome and Karratha provide compliance and education across the region with eight permanent Fisheries and Marine Officers and one Community Education officer. During the peak season from May to October an additional two officer mobile patrol also operates in the area. Compliance is delivered to several sectors including commercial and recreational fisheries, pearling, aquaculture, fish habitat and bio-security.
The North Coast Region is sparsely populated in most areas with much of the terrain remote and difficult to access. Remote patrols are partaken for up to two weeks at a time to get to these areas. Specialised equipment is required for patrols including four wheel drive vehicles and a variety of vessels for inshore coastal and inland waters, when offshore patrols occur a 23 metre vessel is utilised.
A range of compliance duties are carried out in the bioregion including complaint investigation, catch, licence, gear, processor, retail and transport inspections. These are carried out through roadside checks, dive inspections, land & sea patrols and aerial surveillance.
FMOs not only spend time on compliance but also dedicate time to community education by maintaining a presence at a variety of expos, fishing competitions and community fairs. Annual fairs are held throughout the bioregion with the Department represented every year at most events. In addition, FMOs also coordinate and manage the Fisheries Volunteer program – where trained community members educate the public on bag and size limits and a variety of other fishing rules.
Education of school-aged children is the primary role of the community and education officer. In-school and school holiday programs are the main method of reaching students in both the Pilbara and Kimberley.
Activities during 2008/09
During 2008/09, the North Coast bioregion’s FMOs delivered a total of 2665 officer hours of active compliance patrol time - a small increase from the previous year (North Coast Compliance Figure 1). FMOs also achieved 6,388 personal compliance contacts with the community and fishers.
In the commercial sector FMOs undertook prosecution action as a result of compliance operations in 2008/09. This resulted in 7 infringement warnings and 8 infringements notices being issued, with 32 matters resulting in prosecution action.
Compliance inspections were also carried out on Pearl oyster fishing and seeding operations, during transport of Pearl
210 DEPARTMENT OF FISHERIES

NORTH COAST BIOREGION
STATE OF THE FISHERIES AND AQUATIC RESOURCES REPORT 2009/10 211
oysters and at various Pearl oyster lease sites. Considerable travel time is required to reach many of the lease sites, due to their remote locations.
In the recreational sector 56 infringement warnings were issued, 77 infringement notices and 15 matters resulted in prosecution action.
Volunteer Fisheries Liaison Officer (VFLO) groups from across the bioregion were provided with training and support.
Initiatives in 2009/10
Pilbara based Fisheries Volunteers will go on an inland tour to mining communities including Tom Price, Pannawonica and Paraburdoo with the newly purchased education trailer. Schools and shopping centres will have access to the trailer where fisheries education messages will be communicated.
The North Coast bioregions FMOs will continue to use a risk assessment based approach to fisheries compliance to ensure areas and activities of a high risk of non-compliance are
targeted.
The FMOs will continue to assist with ongoing checks of bio-security of vessels entering the states’ waters for introduced marine pests.
The Fisheries mobile patrol unit, Mobile 1, will focus on compliance during peak fishing periods in this bioregion. Together with the district officers they will work together to increase coverage across the region to try and target people in remote areas.
The Department of Fisheries received a grant for the community education officer to tour the Pilbara schools to implement fisheries education programs. Schools in Onslow, Karratha and Dampier will receive hands-on, in-school education activities.
The community education officer will run a joint holiday program with DEC in Karratha over the October school holidays. Both departments will work together to communicate marine environment messages.
NORTH COAST COMPLIANCE TABLE 1 This table gives a summary of compliance and educative contacts and detected offences within the North Coast bioregion during the 2008/09 financial year
* Pearling contacts are excluded from these totals and detailed in North Coast Compliance Table 2.
** Contacts are classified according to the specific fishery, which is usually clearly delineated as being either commercial or recreational. The “other fishing related contacts within the community” category is used where multiple fisheries are contacted and it is not possible to accurately classify the contacts into one specific fishery – typically, the majority of contacts are these contacts are recreational in nature (e.g. personal contacts in marine parks), but contacts made in relation to fish kills, shark patrols and inspections of commercial fish wholesale and retail premises, etc, are also included in this category. This table includes contacts made by PV Walcott. Contacts made by PVs Hamelin and McLaughlan are included in West Coast Compliance Table 1.
*** This represents the total number of Fishwatch reports, both commercial and recreational, since the service provider reporting mechanism cannot differentiate between sectors. It also includes any calls relating to the Northern Inland bioregion that were referred to Karratha or Broome district staff.
PATROL HOURS DELIVERED TO THE BIOREGION 2,665 Officer Hours
CONTACT WITH THE COMMERCIAL FISHING COMMUNITY*
Field contacts by Fisheries & Marine Officers 57
District Office contacts 70
Infringement warnings 7
Infringement notices 8
Prosecutions 32
CONTACT WITH THE RECREATIONAL FISHING COMMUNITY
Field contacts by Fisheries & Marine Officers 6,030
District Office contacts 2,580
Infringement warnings 56
Infringement notices 77
Prosecutions 15
OTHER FISHING-RELATED CONTACTS WITH THE COMMUNITY**
Field contacts by Fisheries & Marine Officers 301
District Office contacts 1,833
Fishwatch reports***
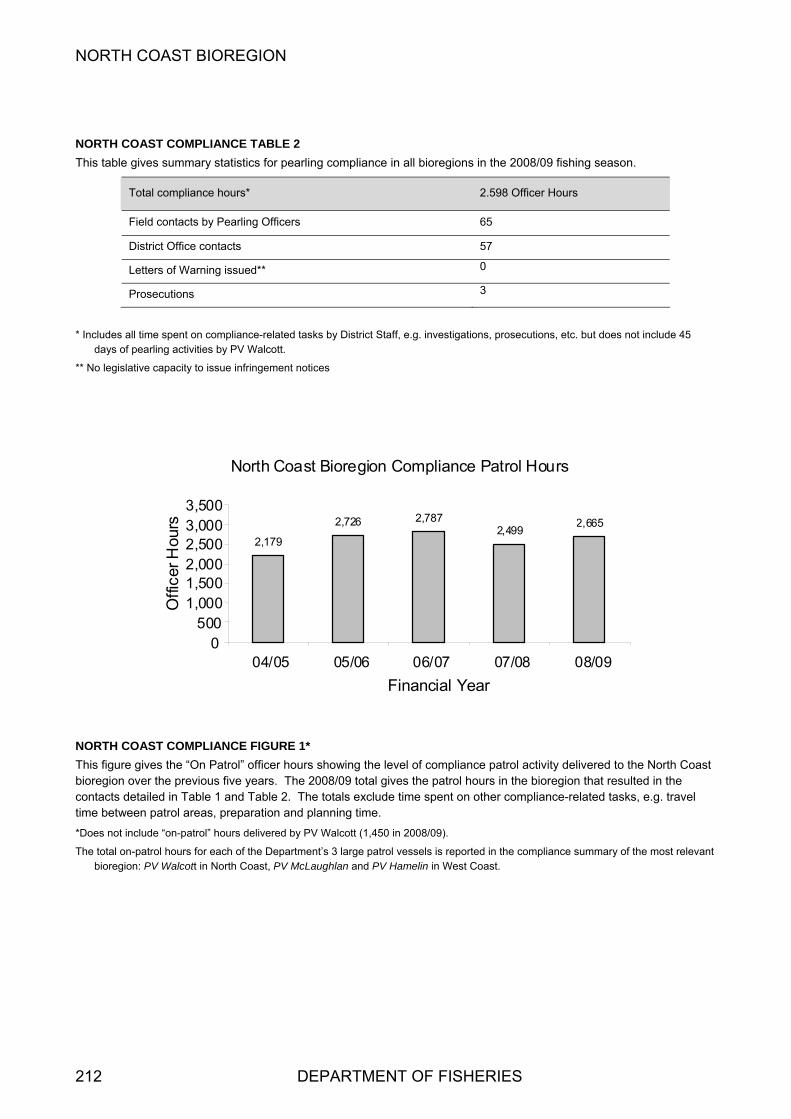
NORTH COAST BIOREGION
NORTH COAST COMPLIANCE TABLE 2
This table gives summary statistics for pearling compliance in all bioregions in the 2008/09 fishing season.
Total compliance hours* 2.598 Officer Hours
Field contacts by Pearling Officers 65
District Office contacts 57
Letters of Warning issued** 0
Prosecutions 3
* Includes all time spent on compliance-related tasks by District Staff, e.g. investigations, prosecutions, etc. but does not include 45 days of pearling activities by PV Walcott.
** No legislative capacity to issue infringement notices
North Coast Bioregion Compliance Patrol Hours
2,179 2,726 2,787
2,4992,665
0 500
1,000 1,500 2,000 2,500 3,000 3,500
04/05 05/06 06/07 07/08 08/09
Financial Year
Offi
cer H
ours
NORTH COAST COMPLIANCE FIGURE 1*
This figure gives the “On Patrol” officer hours showing the level of compliance patrol activity delivered to the North Coast bioregion over the previous five years. The 2008/09 total gives the patrol hours in the bioregion that resulted in the contacts detailed in Table 1 and Table 2. The totals exclude time spent on other compliance-related tasks, e.g. travel time between patrol areas, preparation and planning time.
*Does not include “on-patrol” hours delivered by PV Walcott (1,450 in 2008/09).
The total on-patrol hours for each of the Department’s 3 large patrol vessels is reported in the compliance summary of the most relevant bioregion: PV Walcott in North Coast, PV McLaughlan and PV Hamelin in West Coast.
212 DEPARTMENT OF FISHERIES

SOUTH COAST BIOREGION ABOUT THE BIOREGION 214SUMMARY OF FISHING AND AQUACULTURE ACTIVITIES 214ECOSYSTEM MANAGEMENT 215ECOSYSTEM BASED FISHERIES MANAGEMENT 215FISHERIES 218AQUACULTURE 260COMPLIANCE AND COMMUNITY EDUCATION 261
STATE OF THE FISHERIES AND AQUATIC RESOURCES REPORT 2009/10 213

SOUTH COAST BIOREGION
214 DEPARTMENT OF FISHERIES
SOUTH COAST BIOREGION
ABOUT THE BIOREGION
The continental shelf waters of the South Coast bioregion are generally temperate but low in nutrients, due to the seasonal winter presence of the tail of the tropical Leeuwin Current and limited terrestrial run-off. Sea surface temperatures typically range from approximately 15°C to 21°C, which is warmer than would normally be expected in these latitudes due to the influence of the Leeuwin Current. The effect of the Leeuwin Current, particularly west of Albany, limits the winter minimum temperatures away from terrestrial effects along the beaches to about 16 to 17°C.
Fish stocks in the region are predominantly temperate, with many species' distributions extending right across southern Australia. The occasional more tropical species that are found are thought to have been brought into the area as larvae, but are unlikely to form breeding populations.
The south coast is a high-energy environment, heavily influenced by large swells generated in the Southern Ocean. The coastline from Cape Leeuwin to Israelite Bay is characterised by white sand beaches separated by high granite headlands. East of Israelite Bay, there are long sandy beaches backed by large sand dunes, until replaced by high limestone cliffs at the South Australian border. There are few large areas of protected water along the south coast, the exceptions being around Albany and in the Recherche Archipelago off Esperance.
Along the western section of the coastline that receives significant winter rainfall, there are numerous estuaries fed by winter-flowing rivers. Several of these, such as Walpole/Nornalup Inlet and Oyster Harbour, are permanently open, but most are closed by sandbars and open only seasonally after heavy winter rains. The number of rivers and estuaries decreases to the east as the coastline becomes more arid. While these estuaries, influenced by terrestrial run-off, have higher nutrient levels (and some, such as Oyster Harbour and Wilson Inlet, are suffering eutrophication), their outflow to the ocean does not significantly influence the low nutrient status of coastal waters.
The marine habitats of the south coast are similar to the coastline, having fine, clear sand sea floors interspersed with occasional granite outcrops and limestone shoreline platforms and sub-surface reefs.
A mixture of seagrass and kelp habitats occurs along the south coast, with seagrass more abundant in protected waters and some of the more marine estuaries. The kelp habitats are diverse but dominated by the relatively small Ecklonia radiata, rather than the larger kelps expected in these latitudes where waters are typically colder and have higher nutrient levels.
SUMMARY OF FISHING AND AQUACULTURE ACTIVITIES
The major commercial fisheries of the South Coast bioregion are the abalone fishery, the purse seine fishery targeting pilchards and other small pelagics, and a demersal gillnet fishery for sharks. Other smaller commercial fisheries are the long-standing beach seine fishery for Australian salmon and herring, a trap fishery targeting southern rock lobsters and deep-water crabs, and the intermittent scallop fishery. There is also a commercial net fishery for finfish operating in a number of south coast estuaries. South coast commercial fishing vessel operators often hold a number of licences to create a viable year-round fishing operation.
As much of the south coast is remote or difficult to access, recreational beach and boat fishing tends to be concentrated around the main population and holiday centres. The major target species for beach and rock anglers are salmon, herring, whiting and trevally, while boat anglers target pink snapper, queen snapper, Bight redfish, a number of shark species, samson fish and King George whiting. The third major component of the recreational fishery is dinghy and shoreline fishing of estuaries and rivers, focused in the western half of the bioregion. Here the main angling targets are black bream and whiting (including King George whiting). Recreational netting, primarily targeting mullet, also occurs in these estuaries.
The predominant aquaculture activity undertaken on the south coast is the production of mussels and oysters from Oyster Harbour at Albany. This activity is restricted to this area where there are sufficient nutrient levels related to terrestrial run-off to provide the planktonic food necessary to promote growth of filter-feeding bivalves.
Other forms of aquaculture (e.g. sea cage farming) are restricted on the south coast by the high-energy environment and the very limited availability of protected deep waters typically required by this sector. As a consequence, most recent development activity has focused on land-based ‘raceway’ culture of abalone, using pumped sea water.

SOUTH COAST BIOREGION
ECOSYSTEM MANAGEMENT
The inshore marine habitats of the south coast are largely unaffected by human activities. While there are few permanent closures to trawling in this region, the actual level of such activities is very small with about 98% of the region not affected by these activities.
The estuaries and near-shore marine embayments where there is restricted water exchange, for example Princess Royal and Oyster Harbours and Wilson Inlet, have experienced eutrophication events associated with high nutrient loads from adjacent land-based activity.
The Walpole–Nornalup Marine Park was declared on the 8th May 2009 and is the first marine protected area on the south coast. There are three existing fishing closures under s.43 of the Fish Resources Management Act 1994 surrounding the wreck of the ‘Perth’ (Albany), wreck of the ‘Sanko Harvest’ (east of Esperance), and Esperance Jetty.
The Australian Government’s Department of Environment Water, Heritage, Water and the Arts is undertaking a Marine Bioregional Planning process for Commonwealth waters between Kangaroo Island, South Australia and Shark Bay, with a view to completing a draft South West Marine Bioregional Plan (MBP) in 2010. The Draft Plan was expected to be released for a 3 month public review and this will include proposed marine protected areas.
The Department of Fisheries continues to provide advice to the Environmental Protection Authority on development proposals, which if implemented, have the potential to impact on the aquatic environment. The Department also continues to actively engage with the natural resource management groups for the south coast to promote sustainable use of the aquatic environment. New proposals currently being progressed for the South Coast include ones for mineral resource development and associated port facilities, and for
petroleum exploration.
ECOSYSTEM BASED FISHERIES MANAGEMENT
Identification of Ecological Assets using the EBFM framework
Under the Integrated Marine and Coastal Regionalisation for Australia scheme, the South Coast bioregion has been divided into 2 meso-scale regions: WA South Coast, Eucla (IMCRA, V 4.0, 2006). This sub-regional scale of management has now been adopted by the Department through the implementation of an Ecosystem Based Fisheries Management (EBFM) framework (Fletcher,et al., 2010) see How to Use section for more details.
In terms of ecological assets, the Department has recognised the following ecological values for the IMCRA regions within the South Coast Bioregion:
Ecosystem structure and biodiversity (on a meso-scale basis);
Captured fish species
Protected species (direct impact – capture or interaction);
Benthic habitats; and
External impacts.
For some issues a finer level of division of the IMCRA ecosystems is used by the Department. This relates to recent management initiatives necessary to recognise different suites of exploited fish and invertebrates across the continental shelf. These sub-components are defined by depth contours (Estuarine, Nearshore 0-20m; Demersal 20-250m and Pelagic). The full set of ecological assets identified for ongoing monitoring are presented in South Coast Ecosystem Management Figure 1.
STATE OF THE FISHERIES AND AQUATIC RESOURCES REPORT 2009/10 215

SOUTH COAST BIOREGION
216 DEPARTMENT OF FISHERIES
EstuarineMarine
WA South Coast
Eucla
Ecosystems
Estuarine
Shelf
Habitats
EstuarineNearshoreDemersalPelagic
Finfish
Shelf
Crustaceans
Nearshore (abalone)Shelf (Scallops)
Molluscs
Captured Species
Fish
Non 'Fish'
Protected Species
South Coast BioregionEcological Resources/Assets
SOUTH COAST ECOSYSTEM MANAGEMENT FIGURE 1
Component tree showing the ecological assets identified and separately assessed for the South Coast Bioregion
Risk Assessment of Regional Ecological Assets
The EBFM process identifies the ecological assets in a hierarchical manner such that the assets outlined South Coast Ecosystem Management Figure 1 are often made up of individual components at species or stock level. The risks to each of the individual stock or lower level components are mostly detailed in the individual fishery reports presented in this document. The following table (South Coast Ecosystem
Management Table 1) provides an overview and cumulative assessment of the current risks to the ecological assets of the South Coast Bioregion, at a bioregional level and provides a mechanism for reporting on their status and the fisheries management arrangements that are being applied. These bioregional level risks are now used by the Department as a key input into the Department’s Risk Register which, combined with an assessment of the economic and social values and risks associated with these assets, is integral for use in the annual planning cycle for assigning priorities for activities across all Divisions in this Bioregion.
SOUTH COAST ECOSYSTEM MANAGEMENT TABLE 1: RISK LEVELS FOR EACH ASSET.
Risk levels in this table are developed by combining the individual (lower level) elements that make up each of the higher level components. Low and Moderate values are both considered to be acceptable levels of risk. High and Significant risks indicate that the asset is no longer in a condition that is considered appropriate and additional management actions are required. Where the value is followed by (non-fishing) this indicates that all, or the majority of the risk value, was not generated by fishing activities.
Ecosystem Structure and Biodiversity
Ecosystem Aquatic zone Risk Status and Current Activities
Estuarine Marine MODERATE (non fishing)
The most likely cause of changes to community structure in estuarine regions is changing rainfall levels and the manual opening or closing of bars at river mouths.
Marine Marine LOW
The recent assessment by Hall and Wise (in press) of finfish community structure using commercial data for the past 30 years found no evidence of any concerning trend in mean trophic level, mean length or FIB. Few other species are captured in this region.

SOUTH COAST BIOREGION
Ecosystem Aquatic zone Risk Status and Current Activities
Eucla Marine NEGLIGIBLE As above
Captured fish species
Fish species Aquatic zone Risk Status and Current Activities
Estuarine MODERATE The catch and catch rate of this suite has been reasonably stable for 10 years.
Nearshore HIGH The capture of herring has been in decline for some years no. A study is currently underway to determine if this is related to stock issues or merely marketing problems
Demersal HIGH There is a concern that the increase in targeting of demersal fishing on the south coast may need to be examined more closely.
Finfish
Pelagic LOW While the spawning biomass has returned to appropriate levels, the capture levels of pilchards and other pelagic fish has not returned to pre-virus levels.
Crustaceans Shelf MODERATE The catch levels of lobsters and crabs remains at relatively low bu t consistent levels.
Nearshore MODERATE The stocks of abalone are maintained at appropriate levels Molluscs
Shelf NEGLIGIBLE The stocks of scallops varies annually and fishing is focused only when stocks are abundant
Protected species
Protected fish Species Risk Status and Current Activities
species
Non fish (birds) MODERATE The capture of shearwaters in purse seine operations has been addressed by a code of conduct Protected non
‘Fish’ species Mammals MODERATE
The potential for the capture of sealions and seals by all fishing operations in this region, but especially gill nets is to be investigated.
Protected ‘Fish’ Species
Fish NEGLIGIBLE There are few risks to the protected fish species in this region
Benthic habitat
External Drivers (Non Fishing)
Benthic Habitat Risk Status and Current Activities
Estuaries/ Nearshore
LOW (non fishing)
There are few fishing activities that would impact on nearshore or estuarine habitats. There may be risks at some locations due to coastal development activities.
Shelf NEGLIGIBLE The shelf region in this bioregion has very little habitat disturbance. Less than 3% of the area is trawled and there are no other activities that would materially impact on the habitats in these areas.
External Drivers Risk Status and Current Activities
Introduced Pests and Diseases
HIGH The recent location of the pest algae Codium fragile in Albany highlights the issues that now face many ports in Australia
Climate LOW This area is not as likely to be impacted by climate change as West Coast and Gascoyne areas of WA.
STATE OF THE FISHERIES AND AQUATIC RESOURCES REPORT 2009/10 217

SOUTH COAST BIOREGION
218 DEPARTMENT OF FISHERIES
FISHERIES South Coast Crustacean Fisheries Report: Statistics Only A. Thomson and P. Unsworth
Management input by N. Chambers
Fishery Description The ‘south coast crustacean fisheries’ are pot-based fisheries, which operate from Augusta to the South Australian border. They include the Windy Harbour/Augusta Rock Lobster Managed Fishery, the Esperance Rock Lobster Managed Fishery (ERLF), the rock lobster pot fishery operating in the Albany and Great Australian Bight sectors, and the deep-sea crab fishery.
The fisheries are multi-species and take southern rock lobsters (Jasus edwardsii) and western rock lobsters (Panulirus cygnus) as well as deep-sea crab species including giant crabs (Pseudocarcinus gigas), crystal crabs (Chaceon albus) and champagne crabs (Hypothalassia acerba).
Southern rock lobsters comprise the majority of the catch in the eastern areas of the fishery, with crab species becoming more prevalent in the south-western region. Western rock lobsters are a significant component of the catch in the Windy Harbour fishery (not reported here due to confidentiality provisions relating to the small number of licensees).
Boundaries
Management boundaries for the south coast crustacean fisheries are shown in South Coast Crustacean Figure 1. The ‘boundaries’ of the deep sea crab component of the fishery (Condition 105) include all the waters of these fisheries deeper than 200 metres, excluding those of the ERLF, where crabs may only be taken by the holders of an Esperance Rock Lobster Managed Fishery Licence.
Management arrangements
Commercial These commercial fisheries are managed primarily through input controls in the form of limited entry, pot numbers, size limits and seasonal closures.
In 2008/09, 2 vessels were licensed to fish for rock lobsters in the Windy Harbour/Augusta Rock Lobster Managed Fishery, 8 were licensed to fish in the Esperance Rock Lobster Managed Fishery and 28 vessels were licensed to fish for rock lobster in the Great Australian Bight and Albany zones. There were 24 licences that include condition 105 permitting them to fish for deep-sea crabs outside the Esperance sector.
The season for fishing for rock lobsters throughout the south coast crustacean fisheries mirrors the West Coast Rock Lobster Managed Fishery season (15 November to 30 June). Fishing for deep-sea crabs can currently occur all year, but during the rock lobster season operators must only use the number of pots endorsed on their rock lobster authorisation/licence.
Recreational Recreational fishers generally only target rock lobsters. They are restricted to the use of 2 pots per person and divers are only permitted to take rock lobster by hand, or with the use of a loop or other device that is not capable of piercing the rock lobster.
Size limits, bag limits and seasonal closures apply and all recreational fishers are required to hold a current recreational fishing licence authorizing them to take rock lobster.
Landings and Effort
Commercial Southern rock lobster 39 tonnes
Deep-sea crab 24 tonnes
The 2008/09 season total catch of southern rock lobsters was 39 t, an increase of 5% from the 2007/08 season (South Coast Crustacean Table 1). A catch of 18 t of southern rock lobsters was taken in the ERLF in 2008/09 – a decrease of 22% on the catch taken in the 2007/08 season (23 t).
The combined catch for the GAB and Albany southern rock lobster fishery zones in 2008/09 was 21 t, a 50% increase of the catch taken in 2007/08 (Table 1). The catch in the Albany zone was 3 t, a decrease of 25% compared to the 2007/08 season, however, the catch in the GAB zone increased by 80% to 18 t.
As a secondary target of the rock lobster fishery, a total of 24 t of deep sea crabs was caught (South Coast Crustacean Table 1). In the Albany zone this included 0.8 t of giant crabs (a decrease of 0.4 t over the 2007/08 season), 5.6 t of champagne crabs (a decrease of 2.5 t over 2007/08 season) and 12.4 t of crystal crabs (an decrease of 0.4 t over the 2007/08 season). In the ERLF, 2.1 t of giant crabs were landed (representing no change from 2007/08).
The fishing effort in the Esperance fishery (ERLF) continued to decline in 2008/09 (south coast crustacean table 1). The effort increased by 200% in the Albany zone, however, it is not possible to split the effort targeting lobsters from that targeting deep-sea crabs.
Recreational Southern rock lobsters <5 tonnes
Estimates from mail surveys sent to a random selected sample of rock lobster licence holders suggest that the recreational catch of southern rock lobsters on the south coast is less than 5 t per year.
Numbers of recreational rock lobster licence holders that catch southern rock lobsters are small and estimating the

SOUTH COAST BIOREGION
recreational catch more accurately would require a dedicated survey or at least a different sampling strategy to the current mail survey.
Fishery Governance Target commercial catch range:
Southern rock lobsters 50 – 80 tonnes
In 2008/09, the south coast catch of 39t was outside the target range. This target catch range will be reviewed as a part of the overall review of the management for this fishery, which is underway.
Current Fishing (or Effort) Level Acceptable
Comparative catch and effort levels for the deep-sea crab and lobster catches are provided by management zone, in South Coast Crustacean Table 1 and for lobsters in Figure 2.
New management initiatives (2009/10)
Since the release in January 2009 of the Fisheries Management Paper 232, a discussion paper on the future management of crustacean fisheries on the south coast, the Department has progressed the development of the single management plan for the fishery as indicated by the proposals within the paper. As per legislative arrangements the Department will be releasing a draft management plan for comment prior to its introduction.
SOUTH COAST CRUSTACEAN TABLE 1
Comparisons of fishing effort and southern rock lobster and crab catch in 2007/08 and 2008/09 in the south coast crustacean fisheries.
Management zone Season Pot lifts Southern rock lobster Deep-sea crabs catch
catch (tonnes) (tonnes)
ERLF 2007/08 35,000 23 3
2008/09 28,000 18 3
difference -20% -20% 0%
Albany 2007/08 13,000 4 22
2008/09 38,000 3 19
difference +200% -25 % -14%
Great Australian Bight 2007/08 26,000 10 0
2008/09 43,000 18 2
difference +65% +80% -
STATE OF THE FISHERIES AND AQUATIC RESOURCES REPORT 2009/10 219

SOUTH COAST BIOREGION
SOUTH COAST CRUSTACEAN FIGURE 1
Management boundaries in the South Coast crustacean fisheries.
South Coast Rock Lobster Annual Catch
0
10
20
30
40
50
60
70
80
75/76 77/78 79/80 81/82 83/84 85/86 87/88 89/90 91/92 93/94 95/96 97/98 99/00 01/02 03/04 05/06 07/08
Season
Cat
ch(t
on
nes
)
Esperance Managed Fishery
Bight Region
Albany Zone
SOUTH COAST CRUSTACEAN FIGURE 2 Seasonal catches of southern rock lobster by management area since 1975/76.
220 DEPARTMENT OF FISHERIES

SOUTH COAST BIOREGION
Greenlip/Brownlip Abalone Fishery Status Report A. Hart, F. Fabris and T. Baharthah
Management input from M. Holtz
Main Features
Status
Stock level Acceptable
Fishing level Acceptable
Current Landings
Commercial
Greenlip 160 t
Brownlip 39 t
Recreational 3-4% of total catch
Fishery Description The Western Australian greenlip and brownlip abalone fishery is a dive fishery that operates in the shallow coastal waters off the south-west and south coasts of Western Australia. The fishery targets 2 large species of abalone: greenlip abalone (Haliotis laevigata), and brownlip abalone (H. conicopora), both of which can grow to approximately 200 mm shell length.
Abalone divers operate from small fishery vessels (generally less than 9 metres in length). The principal harvest method is a diver working off ‘hookah’ (surface supplied breathing apparatus) or SCUBA using an abalone ‘iron’ to prise the shellfish off rocks – both commercial and recreational divers employ this method.
Governing legislation/fishing authority
Fish Resources Management Act 1994
Fish Resources Management Regulations 1995
Abalone Management Plan 1992
Ministerial Policy Guideline no. 10
Abalone Managed Fishery Licence
Commonwealth Government Environment Protection and Biodiversity Conservation Act 1999 (Export Exemption)
Recreational Fishing Licence
Consultation process
Meetings between the Department of Fisheries and industry
Recreational Fishing Advisory Committee
Boundaries
Commercial The Abalone Management Plan covers all Western Australian coastal waters, which are divided into eight management areas. Commercial fishing for greenlip/brownlip abalone is managed in three separate areas (Greenlip/Brownlip Abalone Figure 1).
Recreational The recreational abalone fishery regulations relate to three zones: the Northern Zone (from Greenough River mouth to the Northern Territory border), the West Coast Zone (from
Busselton Jetty to Greenough River mouth) and the Southern Zone (from Busselton Jetty to the South Australian border). Greenlip and brownlip abalone are only fished in the Southern Zone.
Management arrangements
Commercial The commercial greenlip/brownlip abalone fishery is part of the overall Abalone Managed Fishery which is managed primarily through output controls in the form of Total Allowable Commercial Catches (TACCs), set annually for each species in each area and allocated to licence holders as Individual Transferable Quotas (ITQs).
The overall TACC for 2009 was 213 t (whole weight). The TACC is administered through 16,100 ITQ units, with a minimum unit holding of 450 units. The licensing period runs from 1 April to 31 March of the following year.
The legal minimum length for greenlip and brownlip abalone is 140 mm shell length, although the commercial industry fishes to self-imposed size limits of 153 mm, 150 mm and 145 mm in various parts of the main stocks. In ‘stunted stocks’ areas, greenlip can be fished from 120 mm under special exemptions with such fishing strictly controlled to pre-arranged levels of catch and effort.
Recreational The recreational component of the fishery for greenlip and brownlip abalone is managed under a mix of input and output controls and occurs primarily on the south and south-west coasts. Recreational fishers must purchase a dedicated abalone recreational fishing licence or an umbrella licence (which covers all licensed recreational fisheries). Licences are not restricted in number, but the recreational fishing season is limited to 7.5 months – from 1 October to 15 May.
The combined daily bag limit for greenlip and brownlip abalone is five per fisher, and the household possession limit (the maximum number that may be stored at a person’s permanent place of residence) is 20.
General A comprehensive Ecologically Sustainable Development assessment of this fishery has been undertaken to identify any potential sustainability risks requiring direct management. The only issues identified through this process were the
STATE OF THE FISHERIES AND AQUATIC RESOURCES REPORT 2009/10 221
SOUTH COAST BIOREGION
breeding stock levels of greenlip and brownlip abalone. Boxed text in this status report provides the annual assessment of performance for these issues.
Research summary
Current research is focused on stock assessment using catch and effort statistics, meat weight indices, and length-frequency sampling. Commercial abalone divers are required to provide daily catch information on the weight and number of abalone collected, the hours fished, the date and location of harvest and the name of the person(s) harvesting. The divers also supply a random selection of abalone shells from each fishing day, and these are measured and used to estimate fishing mortality.
An annual standardized catch per unit effort (CPUE) index was developed that took into account diver, sub-area and month of fishing as well as technological improvements that aid fishing efficiency. This index forms the basis of the revised decision-rule framework for the quota setting in each area of the fishery.
Current research initiatives include the use of digital video imagery assessment by industry divers, who survey selected sites with an underwater video camera, fishery-independent survey data collected from 140 sites across the fishery, and mark-recapture analysis of growth and mortality in brownlip abalone.
The telephone diary survey estimates the statewide catch of greenlip and brownlip abalone at regular intervals. For the last survey, in 2007, around 500 licence holders were randomly selected from the licensing database, with selection stratified by licence type (abalone or umbrella) and respondent location (country or Perth metropolitan area). The licence holders were sent a diary to record their fishing activity and were contacted every 3 months by telephone for the duration of the abalone season.
Research on stock enhancement and greenlip abalone habitat continued in 2009, with funding successfully obtained from the Australian Seafood Cooperative Research Centre (Seafood CRC) for a project titled “Bioeconomic evaluation of commercial scale stock enhancement in abalone”. Results from this project will inform industry and management on the viability of stock enhancement as a management tool for this fishery.
Retained Species Commercial landings (season 2009): 199 tonnes
In 2009 the greenlip/brownlip catch was 199 t whole weight (Greenlip Brownlip Abalone Table 1), which was 1% higher than the 2008 catch of 197 t. The Area 1 (Nullarbor fishery) exploratory quota remained at 1.2 t but was not fished in 2009.
The greenlip catch of 160.2 t whole weight from a total quota of 171.3 t, was 2% higher than the catch in 2008. The brownlip catch of 39 t whole weight for the 2009 season was similar to last year's catch of 39.5 t. and 95% of the quota of 41.9 t (Greenlip Brownlip Abalone Table 1).
Recreational catch (season 2007): 8 tonnes
Recreational catch: 3 – 4% of total catch
The estimate of recreational catch of greenlip and brownlip abalone, based on the telephone diary survey of recreational licence holders in 2007, was 8 t (range: 0 – 16 t), which is similar to the 2006 estimate of 7 t. Given the catch estimates from 2004, 2006 and 2007, the recreational catch corresponds to approximately 3 – 4% of the total (commercial and recreational) catch (Greenlip Brownlip Abalone Table 2) and it is unlikely that this catch level would have differed greatly in 2009.
Fishing effort/access level
Commercial Total fishing effort on the main stocks in 2009 was 1,205 days. This was slightly higher than 2008 (1,144 days).
Recreational For the 2009 season, approximately 25,700 abalone licences were issued. This was a 5% increase over the 2007 figure of 24,500 licenses (Greenlip Brownlip Abalone Figure 2). Overall license numbers were stable for 6 years between 2001 and 2006, but have increased by 21% in the last 3 years (Greenlip Brownlip Abalone Figure 2). It is likely, however, that the vast majority of these new licenses have been issued to fishers targeting the Perth metropolitan roe's abalone fishery (see Roe’s abalone report).
Effort estimates for recreational abalone fishing on the west coast (excluding the Perth metropolitan area), from the 2007 telephone diary survey, was 6,300 days (3,800 – 8,800 days), while the estimated effort on the south coast was 4,900 days (1,700 – 8,000 days) (Greenlip Brownlip Abalone Table 2).
Stock Assessment Assessment complete: Yes
Assessment method:
Standardised Catch rates / Fishing mortality
Breeding stock levels: Adequate
A stock assessment of the greenlip/brownlip abalone fishery was undertaken for the 2009 fishing season, based on commercial catch and effort statistics, length-frequency and shell morphometry sampling, biological growth studies, and some fishery-independent surveys.
Standardised catch per unit effort (SCPUE): As a result of a recent review1, the SCPUE for the greenlip fishery is now used as the principal indicator of the abundance of legal-sized abalone and the basis for the decision-rule framework. This indicator replaces the raw CPUE data (kg whole wt per diver per day) used in previous State of the Fisheries Reports, but these raw CPUE data will still be presented for comparative purposes this year.
1 Hart A, Fabris F, Caputi C (2009). Performance indicators,
biological reference points and decision rules for Western Australian abalone fisheries (Haliotis sp.): (1) Standardised catch per unit effort. Fisheries Research Report No. 185. Department of Fisheries, Western Australia. 32p.
222 DEPARTMENT OF FISHERIES
SOUTH COAST BIOREGION
In 2009, the SCPUE for the combined greenlip stocks was 34 kg whole weight per hour (Greenlip Brownlip Abalone Table 1). This index has been close to this level since 2002, which is close to the long-term average SCPUE of 35 kg per hour (Greenlip Brownlip Abalone Table 1).
Fishing mortality: This analysis determines the proportion of the available abalone stock that is being harvested. Fishing mortality of greenlip abalone declined between 2007 and 2008 for all areas, but increased again in 2009 (Greenlip Brownlip Abalone Figure 3a). This pattern is indicative of above average recruitment in 2008, returning to normal levels in 2009.
Fishing mortality of brownlip abalone also increased between 2008 and 2009, after having remained stable or falling among areas in the previous year (Greenlip Brownlip Abalone Figure 3b).
Breeding stock: Greenlip abalone mature between 80 and 110 mm shell length, and brownlip abalone mature between 90 and 130 mm shell length. These are both below the legal minimum size limit set across the fishery (140 mm shell length), which equates to an average meat weight of 140 g for greenlip and 160 g for brownlip. At these weights, animals are expected to have spawned at least twice before reaching legal size.
Industry-imposed length limits that are larger than the minimum legal limits have been set in areas of fast-growing stocks. In Area 2, there is a general 145 mm minimum length across the fishing grounds. In Area 3, fishers have imposed a minimum size limit of 153 mm shell length for the faster-growing portions of the fishing grounds, and 150 mm for the remainder.
For brownlip, the assessment showed that the TACC was being caught at high average weights and the TACC was therefore maintained at 41.9 t in 2010 (Greenlip Brownlip Abalone Table 1).
Non-Retained Species Bycatch species impact: Negligible
Divers have the ability to target abalone of choice (species, sizes and quality of abalone) and do not inadvertently harvest bycatch in their normal fishing activities.
Protected species interaction: Negligible
The only protected species interaction occurring in this fishery is with the great white shark (Carcharodon carcharias), which has been known to attack divers. Most divers now use diving cages or electronic shark deterrent devices for their personal protection. However, divers are reporting encounters with C. carcharias, and this will be quantified in future reports.
Ecosystem Effects Food chain effects: Negligible
Commercial abalone diving occurs over a small proportion of the total abalone habitat of the Western Australian coastline. In view of the relatively low exploitation rates and consequent maintenance of a high proportion of the natural biomass of abalone, it is considered unlikely that the fishery has any significant effect on the food chain in the region.
Habitat effects: Negligible
The fishing activity makes minimal contact with the habitat, which typically consists of hard rock surfaces in a high wave-energy environment. As abalone are drift algae feeders, their removal is considered to result in little change in algal growth cover in areas fished.
Social Effects There are 14 vessels operating in the greenlip/brownlip commercial fishery, employing approximately 35 divers and deckhands. The dispersed nature of the greenlip and brownlip abalone fishery means that small coastal towns from Busselton to the South Australian border receive income from the activity of divers.
Recreational diving for greenlip and brownlip abalone is a small but active sector, with dive shops and vessel manufacturers’ benefiting from this activity. The recreational fishery provides a major social benefit to those sectors of the community that appreciate the abalone as a delicacy. There were 25,700 licenses issued that would have allowed fishers to participate in the recreational abalone fishery, although most of these would have targeted the Roe’s abalone fishery in the Perth metropolitan area.
Economic Effects Estimated annual value (to commercial fishers)
for year 2009: $7.7 million
The estimated average price received by commercial fishers was $105/kg meat weight ($39/kg whole weight) for greenlip and $91/kg meat weight ($36/kg whole weight) for brownlip abalone, resulting in a fishery valued at $7.7 million, compared to $9.2 million in 2008, and $8.8 million in 2007.
Greenlip prices in 2009 were lower than 2008 ($130/kg), and were also the lowest for the last 10 years.
The main performance measures for the fishery relate to the maintenance of adequate breeding stocks in each area of the fishery. This is assessed using a combination of measures that reflect the average size of breeding individuals and the overall biomass of breeding stock.
In 2009, the average sizes of greenlip and brownlip caught were 193 g and 265 g respectively. These were well above the minimum breeding sizes of 140 g for greenlip and 160 g for brownlip. The effort (days fished) required to take the quota (1,205 days) were within the set range that indicates sufficient biomass of breeding stock for the fishery overall (907 – 1,339 days – see ‘Fishery Governance’ section).
STATE OF THE FISHERIES AND AQUATIC RESOURCES REPORT 2009/10 223
SOUTH COAST BIOREGION
Fishery Governance Target effort range: 907 – 1,339 days
To assess whether the catch quota set is appropriate (sustainable) relative to the stock available, the effort required to take a full season’s quota (213 t in 2009) from the main stocks should fall within the effort range (907 – 1,339 diver days) derived from the 5-year period 1994 – 1998. This range reflects the acceptable variation in catch rates for the main stocks due to weather and natural recruitment cycles.
The fishing effort in 2008 was 1,205 days (main stocks), which is within the governance range and indicates that the fishery as a whole is performing satisfactorily.
The overall greenlip/brownlip quota for 2010 remained at 213 t, as in 2009 (Greenlip Brownlip Abalone Table 1).
Current effort level: Acceptable
New management initiatives (2010/11)
The AbMac (abalone management committee) was formally dissolved in early 2010. The commercial industry has
expressed interest in enhancing the value of their ITQs through the use of stock enhancement and management models to accommodate this activity are likely to be deliberated upon during 2010/11. Consultation also took place with industry on relatively minor operational changes to the Abalone Management Plan 1992. These matters are currently being progressed.
External Factors In the last few years there have been a number of changes which impact on fishery governance, and particularly on catch rates. Lease divers are becoming more common, industry size limits have been varied substantially above the legal minimum sizes and the value of the abalone has decreased. Also, the increasing value of the Australian dollar in 2009/10 has exacerbated the overall depressed price of seafood products resulting from the Global Financial Crisis and consequently, abalone beach prices are low relative to previous years.
In addition, environmental effects, such as weather conditions, and the effect of technology changes, continue to have significant effects on diver efficiency.
224 DEPARTMENT OF FISHERIES
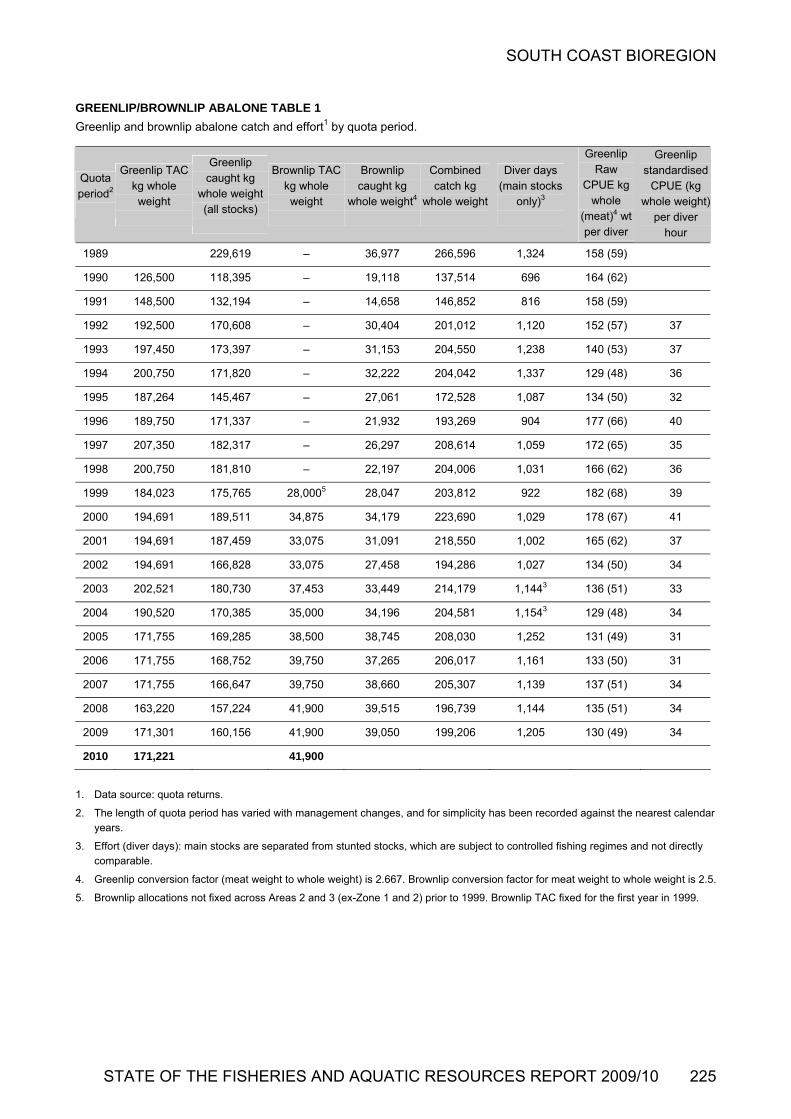
SOUTH COAST BIOREGION
GREENLIP/BROWNLIP ABALONE TABLE 1
Greenlip and brownlip abalone catch and effort1 by quota period.
1. Data source: quota returns.
2. The length of quota period has varied with management changes, and for simplicity has been recorded against the nearest calendar years.
3. Effort (diver days): main stocks are separated from stunted stocks, which are subject to controlled fishing regimes and not directly comparable.
4. Greenlip conversion factor (meat weight to whole weight) is 2.667. Brownlip conversion factor for meat weight to whole weight is 2.5.
5. Brownlip allocations not fixed across Areas 2 and 3 (ex-Zone 1 and 2) prior to 1999. Brownlip TAC fixed for the first year in 1999.
Quota period2
Greenlip TAC kg whole weight
Greenlip caught kg
whole weight (all stocks)
Brownlip TAC kg whole weight
Brownlip caught kg
whole weight4
Combined catch kg
whole weight
Greenlip
Diver days (main stocks
only)3
Raw CPUE kg
whole (meat)4 wt per diver
Greenlip standardised
CPUE (kg whole weight)
per diver hour
1989 229,619 – 36,977 266,596 1,324 158 (59)
1990 126,500 118,395 – 19,118 137,514 696 164 (62)
1991 148,500 132,194 – 14,658 146,852 816 158 (59)
1992 192,500 170,608 – 30,404 201,012 1,120 152 (57) 37
1993 197,450 173,397 – 31,153 204,550 1,238 140 (53) 37
1994 200,750 171,820 – 32,222 204,042 1,337 129 (48) 36
1995 187,264 145,467 – 27,061 172,528 1,087 134 (50) 32
1996 189,750 171,337 – 21,932 193,269 904 177 (66) 40
1997 207,350 182,317 – 26,297 208,614 1,059 172 (65) 35
1998 200,750 181,810 – 22,197 204,006 1,031 166 (62) 36
1999 184,023 175,765 28,0005 28,047 203,812 922 182 (68) 39
2000 194,691 189,511 34,875 34,179 223,690 1,029 178 (67) 41
2001 194,691 187,459 33,075 31,091 218,550 1,002 165 (62) 37
2002 194,691 166,828 33,075 27,458 194,286 1,027 134 (50) 34
2003 202,521 180,730 37,453 33,449 214,179 1,1443 136 (51) 33
2004 190,520 170,385 35,000 34,196 204,581 1,1543 129 (48) 34
2005 171,755 169,285 38,500 38,745 208,030 1,252 131 (49) 31
2006 171,755 168,752 39,750 37,265 206,017 1,161 133 (50) 31
2007 171,755 166,647 39,750 38,660 205,307 1,139 137 (51) 34
2008 163,220 157,224 41,900 39,515 196,739 1,144 135 (51) 34
2009 171,301 160,156 41,900 39,050 199,206 1,205 130 (49) 34
2010 171,221 41,900
STATE OF THE FISHERIES AND AQUATIC RESOURCES REPORT 2009/10 225

SOUTH COAST BIOREGION
GREENLIP/BROWNLIP ABALONE TABLE 2
Summary of telephone diary surveys of recreational effort (fisher days), catch rate (abalone per fisher day) and catch (tonnes whole weight) for the greenlip and brownlip abalone fisheries in 2004, 2006, and 2007.
Greenlip Brownlip
Catch Location Year Effort Catch Rate Catch (tonnes) Catch Rate
(tonnes)
West Coast 2004 10,100 (6,500 – 13,600) 0.6 4 (2–6) 0.4 3 (1–5)
2006 8,000 (4,700 – 11,300) 0.3 2 (0–3) 0.4 3 (0–5)
2007 6,300 (3,800 – 8,800) 0.7 3 (0–6) 0.1 <1 (0–1)
South Coast1 2004 2,700 (1,700 – 3,700) 2.4 2 (1–5) <0.1 <1 (0–1)
2006 2,800 (1,600 – 3,900) 1.6 2 (0–4) 0.5 1 (0–2)
2007 4,900 (1,700 – 8,000) 1.8 4 (0–8) 0.2 <1 (0–1)
1. Survey area is South Coast bioregion (i.e. east of Black Point).
GREENLIP/BROWNLIP ABALONE FIGURE 1
Maps showing the distribution of (a) greenlip and (b) brownlip abalone in Western Australia, and (c) the management areas used to set quotas for the commercial fishery. Area 4 currently has no quota allocated.
226 DEPARTMENT OF FISHERIES

SOUTH COAST BIOREGION
STATE OF THE FISHERIES AND AQUATIC RESOURCES REPORT 2009/10 227
GREENLIP/BROWNLIP
The number of Data are license counts
ABALONE FIGURE 2
licences issued in the recreational abalone fishery, by licence type, for the period since 1992. at the end of the Perth metro abalone season (mid-December).
Year
19921993
19941995
19961997
19981999
20002001
20022003
20042005
20062007
20082009
Nu
mb
ers
of
recr
eati
on
al li
cen
ces
0
2000
4000
6000
8000
10000
12000
14000
16000
18000
20000
22000
24000
26000 All licensesAbalone recreational licensesUmbrella recreational licenses

SOUTH COAST BIOREGION
228 DEPARTMENT OF FISHERIES
GREENLIP/BROWNLIP ABALONE FIGURE 3
Fishing mortality for greenlip (A) and brownlip (B) abalone. Estimates of fishing mortality (F) apply only to harvest-size animals, and are derived from catch-curve analysis using length-frequency data, and annualised growth increments based on following growth models. West Coast Greenlip: L∞=185 mm, K = 0.30; South Coast Greenlip: L∞=179 mm, K = 0.25; Brownlip: L∞=200 mm, K = 0.30. Natural mortality (M) is assumed to be 0.25.
(A)
2004 2005 2006 2007 2008 2009
Fis
hin
g M
ort
alit
y (F
)
0.15
0.20
0.25
0.30
0.35
0.40
0.45
0.50
0.55
0.60
15
20
25
30
35
40
45Area 3 (Augusta)Area 3 (South Coast)Area 2
(B)
2004 2005 2006 2007 2008 2009
Fis
hin
g M
ort
alit
y (F
)
0.10
0.15
0.20
0.25
0.30
0.35
0.40
0.45
0.50
0.55
% o
f st
ock
ha
rves
ted
10
15
20
25
30
35
40Area 3Area 2
% o
f s
toc
k h
arve
sted

SOUTH COAST BIOREGION
South Coast Nearshore and Estuarine Finfish Resources Status Report K. Smith and J. Brown
Management input from N. Chambers
Main Features
Status
Stock levels :
Australian herring Uncertain
Australian salmon Acceptable
Sea mullet Acceptable
Black bream (Stokes Inlet) Acceptable
Black bream (Beaufort Inlet) Acceptable
Black bream (Wilson Inlet) Acceptable
Black bream (Oyster Harbour) Acceptable
Black bream (Walpole-Nornalup Inlet) Not assessed
Cobbler (Wilson Inlet) Acceptable
Cobbler (Oyster Harbour) Acceptable
Fishing Level Acceptable
Current Landings (2009)
Commercial total 618 t (finfish only)
South Coast Salmon Fishery 257 t (salmon only)
South Coast herring trap net fishery 124 t
South Coast Estuarine Fishery 217 t (finfish only)
Recreational not available for current year.
Most recent survey was in 2000/01.
2000/01 finfish catch 368 t (key species only)
Fishery DescriptionCommercial - Nearshore Beach-based commercial fishers in nearshore waters of the South Coast Bioregion target various finfish species, mainly using trap nets (herring only), beach seines, haul nets and gill nets. The main targets are the western species of Australian salmon (Arripis truttaceus) and Australian herring (Arripis georgianus), with small quantities of southern sea garfish (Hyporhamphus melanochir) also taken.
Australian salmon form large migratory schools, particularly during the autumn spawning season, that move along the coast in nearshore waters between South Australia and Kalbarri (WA). The species is targeted in WA by 2 commercial fisheries – the South Coast Salmon Managed Fishery and the South-West Coast Salmon Managed Fishery (see later in this report). Fishers target schools of migrating fish mainly during late summer and autumn. Salmon fishing is conducted by teams of fishers setting beach seine nets using either row boats or small jet-powered boats.
Most of the commercial catch of Australian herring in WA is taken on beaches along the south coast using herring trap nets (also known as ‘G’ trap nets). Trap nets are used principally during the autumn migration of this species. Seine nets, gill nets and line fishing in the South Coast Bioregion and West Coast Bioregions take the remainder of commercial herring landings.
Commercial - Estuarine Approximately 25 major estuaries exist in the South Coast Bioregion, extending from Black Point in the west, to the WA/SA border to the east. Of which, 13 are conditionally
open to commercial fishing as part of the South Coast Estuarine Managed Fishery. This is a multi-species fishery targeting many finfish species, with the main fishing methods being gill net and haul net. The main target species are cobbler (Cnidoglanis macrocephalus), black bream (Acanthopagrus butcheri), sea mullet (Mugil cephalus) and Australian herring.
Recreational Most finfish caught recreationally in South Coast estuaries and nearshore waters are taken by line fishing. Shore and boat-based fishing are both popular. The most commonly captured recreational species include Australian herring, whiting (various species), trevally (Pseudocaranx spp.), black bream (estuaries only), Australian salmon and southern sea garfish.
A relatively small amount of recreational net fishing occurs in the South Coast Bioregion. Recreational net fishing is mainly used to target sea mullet.
Governing legislation/fishing authority
Commercial South Coast Estuarine Fishery Management Plan 2005
South Coast Estuarine Managed Fishery Licence
Fish Resources Management Act 1994 and subsidiary legislation
Fisheries Notice No. 478 of 1991 (Section 43 Order) (Herring ‘G’ nets)
STATE OF THE FISHERIES AND AQUATIC RESOURCES REPORT 2009/10 229
SOUTH COAST BIOREGION
Fishing Boat Licence Condition 42 (Herring ‘G’ nets)
South Coast Salmon Fishery Management Plan 1982
South Coast Salmon Managed Fishery Licence
Proclaimed Fishing Zone Notice (South Coast) 1975
Salmon Block Net Prohibition Notice 1996
Salmon and Snapper Purse Seining Prohibition Notice 1987
Commonwealth Government Environment Protection and Biodiversity Conservation Act 1999 (Export Exemption)
Recreational Fish Resources Management Act 1994 and subsidiary
legislation
Consultation processes
Meetings between the Department of Fisheries, industry and peak body members (e.g. the Western Australian Fishing Industry Council) and Recfishwest
Boundaries
Commercial - Nearshore Australian herring can be taken commercially by holders of an unrestricted fishing boat licence on the south coast, east of Black Point. The use of trap nets is restricted to holders of fishing boat licenses with Condition 42, who operate at 10 specific beaches along the south coast.
The South Coast Salmon Managed Fishery: WA waters from Cape Beaufort to the eastern boundary of the State on the south coast of Western Australia.
Commercial - Estuarine The South Coast Estuarine Fishery encompasses ‘the waters of all estuaries on the south coast of Western Australia between Cape Beaufort and 129º east longitude, including Princess Royal Harbour and Oyster Harbour, and all the rivers, streams and all the tributaries that flow into those estuaries.’ The areas that are open to commercial fishing are (from west-to-east) Broke Inlet, Irwin Inlet, Wilson Inlet, Princess Royal Harbour, Oyster Harbour, Waychinicup Inlet, Beaufort Inlet, G mersley Inlet, Culham Inlet, Jerdacuttup Lakes, Oldfield Inlet and Stokes Inlet.
Recreational Recreational line fishing is permitted in most areas within estuaries and nearshore waters of the South Coast Bioregion. Some spatial closures exist, including closures around Dive Wrecks.
A limited number of areas within estuaries and nearshore waters of the South Coast Bioregion are open to recreational netting. Recreational net fishers must hold a licence. Recreational net fishing regulations are complex – please refer to the 'Recreational Net Fishing Guide' for details.
Management arrangements
Commercial The south coast nearshore and estuarine commercial fisheries are managed primarily through input controls in the form of limited entry and gear restrictions, as well as seasonal and
time closures, area closures and size limits.
The South Coast Salmon Fishery management plan provides for licence holders to operate from assigned beaches between Shoal Cape and Cape Beaufort, with each fishing team having access to a single nominated beach only. These are the only fishers with authority to land and sell Australian salmon in the South Coast Bioregion.
The Herring Trap Net Notice (Order 478 of 1991) prohibits the use of herring trap nets except by licensed commercial fishers using a fishing boat with the appropriate fishing boat licence condition (Condition 42). Holders of fishing boat licences with this condition may take Australian herring using ‘G’ trap nets on 10 separately nominated south coast beaches. There is a closed season for the use of ‘G’ trap nets (10 February to 25 March each year) that closely matches the peak Australian salmon migration season along the south coast. Australian herring may also be commercially caught by beach seine, set net and line methods by any licensed commercial fisher holding an unrestricted Fishing Boat Licence, provided the use of this method is permitted in the particular area and the waters being fished are not subject to other fishery management arrangements.
Recreational Recreational fishers in South Coast estuaries and nearshore waters take a diverse array of finfish species. South Coast size and possession limits apply to these species when caught recreationally in the Bioregion. Refer to the 'Recreational Fishing Guide - South Coast Bioregion' for details.
As many of the recreationally targeted species are also targeted by the commercial sector, resource-sharing issues are a major consideration in these fisheries.
Key species Australian herring and sea mullet are assigned to the ‘low risk’ category. Australian salmon and black bream are assigned to the ‘medium risk’ category. Cobbler is assigned to the ‘high risk’ category.
Research summary
Monitoring of fisheries and fish stocks in South Coast estuaries and nearshore waters is based on commercial catch and effort statistics (CAES) from compulsory monthly returns, recreational catch and effort data from recreational fishing surveys and fishery-independent surveys to monitor annual juvenile recruitment by various fish species (including herring, salmon, whiting, mullet and cobbler).
While commercial fishery catch levels are determined annually from data reported in compulsory monthly commercial returns, recreational catch levels are estimated only occasionally when recreational fishing surveys are conducted. Relevant surveys include a shore-based creel survey on the west and south coasts in 1994 and 1995 (Ayvazian et al. 19971), a national phone survey in 2000/01
ordon Inlet, Ha
1 Ayvazian SG, Lenanton RCJ, Wise B, Steckis R and Nowara
G. 1997. Western Australian salmon and Australian herring creel survey. FRDC Final Report. Project No. 93/79. 93 pp. WA Fisheries, Perth
230 DEPARTMENT OF FISHERIES
SOUTH COAST BIOREGION
(Henry and Lyle 20031) and an estuary creel survey in 2002/03 (Smallwood and Sumner 20072).
Fishery-independent surveys of juvenile Australian herring, salmon, whiting and mullet species are conducted annually at 6 beach sites along the south and lower west coasts of WA. Using a beach seine net, the number of juveniles of each species caught per haul are used to generate a relative index of annual recruitment for the south-west region, which is then used to forecast adult abundance and commercial fishery catches 2-3 years later for herring and 3-4 years later for salmon. A relative index of annual recruitment of cobbler in Wilson Inlet is generated from catch rates during an annual fishery-independent trapping program. Catch rates are then used to forecast adult abundance and fishery catches in Wilson Inlet 4 to 5 years later.
The interpretation of trends in recruitment, catch and catch rates is assisted by the substantial amount of biological information already available for key nearshore and estuarine species.
A 12-month, state NRM-funded research project designed to provide more rigorous monitoring and assessment of the status of Australian herring commenced in mid-2009. Volunteer anglers and commercial fishers provided samples of herring to enable researchers to determine the age structure of recreational and commercial catches in the West Coast and South Coast Bioregions. This information will be used to assess the feasibility of ongoing age-based assessments and to develop methods, if appropriate, to monitor levels of annual fishing mortality for herring. The NRM-funded project is also examining aspects of stock structure, including the proportions of herring in the West Coast fishery that originate from nursery sites in the South Coast Bioregion.
Retained Species Total commercial finfish landings (2009):
401 tonnes in nearshore waters
217 tonnes in estuarine waters
Commercial landings by fishery (2009):
South Coast Salmon 257 tonnes (salmon only)
Herring trap net 124 tonnes (herring only)
South Coast Estuarine 217 tonnes (finfish only)
The commercial catches reported in South Coast Nearshore and Estuarine Table 1 are taken by estuarine fisheries and beach-based nearshore fisheries using trap nets (herring only), gill nets, haul nets and beach seines. Minor quantities of the same species that are taken by other methods (e.g. fish traps) are not included in Table 1. Catches by all methods and all fisheries are included in the catches reported for key
1 Henry GW and Lyle JM. 2003. The National Recreational
and Indigenous Fishing Survey. FRDC Project No. 99/158. NSW Fisheries Final Report Series No. 48.
2 Smallwood CB and Sumner NR. 2007. A 12-month survey of recreational estuarine fishing in the South Coast bioregion of Western Australia during 2002/03. Fisheries Research Report 159. Department of Fisheries, Perth.
species in the following sections and in individual stock assessments.
In 2009, the total commercial catch of finfish by estuarine and beach-based fisheries in the South Coast Bioregion included approximately 29 species. The majority of the catch consisted of Australian salmon (42% by weight) caught by the South Coast Salmon Managed Fishery, Australian herring (25%) caught primarily by the trap net fishery and cobbler (14%) caught by the South Coast Estuarine Managed Fishery.
In 2009, the nearshore catch was comprised mainly of salmon (64% by weight) and herring (33%). The estuarine catch was comprised mainly of cobbler (40%), black bream (23%), sea mullet (12%) and Australian herring (9%).
Since 2000, 96% of landings by the South Coast Estuarine Fishery have been finfish. The majority of finfish landings were taken by gill nets (88%) and haul nets (11%). A small proportion (1%), mainly leatherjackets (Monocanthidae) in Princess Royal Harbour, was taken by fish traps.
Key finfish species - nearshore
Australian herring: This species is targeted commercially in Western Australia and South Australia. Negligible quantities are also taken commercially in Victoria. The proportion of total commercial landings taken in South Australia has remained relatively constant since the mid-1970s at approximately 27%.
Since 2000, 83% of total commercial landings of Australian herring in WA have been taken in the South Coast Bioregion, with the remaining 17% taken in the West Coast Bioregion. Within the South Coast Bioregion, 92% of landings were taken by the trap net fishery (i.e. Condition 42 licence holders), 3% taken in estuaries and the remainder taken by other fishers in nearshore waters. All trap net fishery landings were taken in the Albany area.
Since 2000, the total state annual commercial catch of herring steadily declined from 818 t in 2000 to 184 t in 2009 (South Coast Nearshore and Estuarine Figure 1). Annual landings in both bioregions followed a similar downward trend – declining from 700 t to 151 t in the South Coast and from 143 t (in 2001) to 32 t in the West Coast Bioregion. Commercial fishery landings in South Australia also followed this trend.
Total WA commercial landings of herring peaked at 1537 t in 1991, when an historical peak catch of 1427 t was taken in the South Coast Bioregion. The annual South Coast catch declined sharply to 633 t in 1993, and then fluctuated between 626-1001 t per year from 1993 to 2000. Annual landings declined rapidly from 705 t in 2000 to 203 t in 2005. The decline continued at a slower rate after 2005, reaching 151 t in 2009.
The downward trend in the total South Coast catch essentially reflects declining catches by the trap net fishery. The cause of the decline is believed to be a combination of factors – reduced availability of fish due to multiple recent years of low recruitment and lack of targeting in response to low market demand.
Australian salmon: Since 2000, 67% of total commercial landings of Australian salmon in WA have been taken in the South Coast Bioregion, with the remaining 33% taken in the West Coast Bioregion. Within the South Coast Bioregion,
STATE OF THE FISHERIES AND AQUATIC RESOURCES REPORT 2009/10 231
SOUTH COAST BIOREGION
232 DEPARTMENT OF FISHERIES
almost 100% of landings were taken by the South Coast Salmon Managed Fishery.
Total WA landings of salmon have been declining since 1995 (South Coast Nearshore and Estuarine Figure 2). This trend reflects declining catches on the south coast, where the annual catch has steadily declined from an historical peak of 4046 t in 1995 to 258 t in 2009. By contrast, the West Coast catch trend has been stable (see West Coast Nearshore and Estuarine report). As for herring, the cause of the decline in the South Coast salmon catch is believed to be a combination of factors – reduced availability of fish due to low recruitment in recent years and lack of targeting in response to low market demand.
Key finfish species - estuarine
Cobbler: Commercial targeting of cobbler is essentially restricted to estuaries. From 2000 to 2009, 95% of commercial landings of cobbler were caught in estuaries of the South Coast Bioregion, with the remaining 5% from the West Coast Bioregion. Over this period, total annual landings in the South Coast Bioregion ranged from 40 t (in 2004) to 95 t (in 2003), with 79% of these landings caught in Wilson Inlet, 8% from Oyster Harbour, 7% from Hamersley Inlet and 1% from Princess Royal Harbour.
In 2009, 71 t of cobbler was caught in Wilson Inlet, which was 82% of the total cobbler catch in the South Coast Bioregion. Wilson Inlet has historically produced the vast majority of South Coast landings of cobbler.
In Wilson Inlet, annual cobbler landings steadily increased after the 1940s (minimal catch at this time) until the mid 1980s. Since 1985, annual landings have varied substantially but the overall trend has been stable. From 1985 to 2009, the average annual catch was 52 t. Annual landings reached an historical peak of 79 t in 1985 and again in 2003. Fluctuations in landings are believed to mainly reflect variations in the availability of cobbler due to variations in recruitment.
Sea mullet: From 2000 to 2009, 42% (by weight) of total commercial landings of sea mullet in WA were taken in the West Coast Bioregion, with 45% from the Gascoyne, 12% from the South Coast and 1% from the North Coast Bioregions.
The historical peak in annual sea mullet landings within the South Coast Bioregion was 92 t in 1992. Annual landings have since declined gradually, reflecting an ongoing reduction in commercial effort in estuarine waters as a result of a fishery adjustment scheme (licence buy-backs). Since 2000, the total annual South Coast commercial catch of sea mullet has fluctuated between 22 (in 2000) and 62 t (in 2007).
From 2000 to 2009, 27% of total commercial landings of sea mullet in the South Coast Bioregion were taken in Wilson Inlet, 15% in Oyster Harbour, 15% in Gordon Inlet, 14% in Beaufort Inlet and 10% in Jerdacuttup Lakes. Minor sea mullet landings were reported in all other estuaries open to commercial fishing over this period. Overall, 97% of landings were taken in estuaries.
Black bream: From 2000 to 2009, 95% of commercial landings of black bream were caught in the South Coast Bioregion, with the remaining 5% from the West Coast Bioregion. In the South Coast Bioregion, total landings over this period were mainly taken in Beaufort Inlet (33% of landings), Stokes Inlet (27%), Wilson (17%) and 12% in Oyster Harbour. Minor bream landings were reported in all other estuaries open to commercial fishing over this period.
Since 2000, total annual South Coast landings of bream have ranged from 30 t (in 2000) to 63 t (in 2005), including 50 t taken in 2009.
Since 1980, Stokes Inlet has contributed the greatest proportion of bream landings of any single estuary (34%) and had the most stable trend in annual landings (average 11 t per year 1980-2009). Culham Inlet has contributed 21% of total landings since 1980. However, most landings were between 1987 and 1995. In 1992, total landings peaked at 97 t in Culham Inlet after favourable environmental conditions led to strong recruitment and subsequent high catches in that system.
Beaufort Inlet has contributed 17% of total landings since 1980. Minimal landings were taken in this estuary prior to 1993. From 1993 to 2005, landings gradually increased and have remained relatively high in subsequent years. Annual landings of bream in Wilson Inlet (contributed 8% of landings since 1980) have followed an almost identical trend. Landings in Oyster Harbour and Oldfield Inlet have also increased markedly since the mid 1990s. These simultaneous increases in various estuaries resulted in an overall increase in South Coast bream landings from the mid 1990s until 2005, followed by a stable trend in total landings from 2005 to 2009.
Recreational catch estimate (2009): NA
Most recent catch estimate (2000/01)
Nearshore + estuarine: 368 tonnes
(key finfish species only)
Most recent catch estimate (2002/03)
Estuarine only 53 tonnes
(key finfish species only)
The recreational catch levels of finfish in nearshore and estuarine waters of the South Coast Bioregion were not estimated for 2009. The most recent nearshore estimates are from the National Recreational and Indigenous Fishing Survey conducted in 2000/01 (South Coast Nearshore and Estuarine Table 2). The most recent estuarine estimates are from a creel survey in 2002/03 (South Coast Nearshore and Estuarine Table 3). While the dominant species in the catch are probably similar to those caught in recent surveys, the catch and effort levels by recreational fishers may have changed substantially. Therefore, current total catch level cannot be estimated.
Overall, the most abundant species in the retained catch (nearshore and estuarine combined) in 2000/01 were

SOUTH COAST BIOREGION
Australian herring (45% by number), King George whiting (Sillaginodes punctata) (12%), trevally (Pseudocaranx spp.) (10%), whiting (various species, excluding King George) (8%), black bream (7%) and salmon (3%). The nearshore and estuarine waters in the region from Denmark to Esperance contributed 90% of all catches. Shore fishers caught 73% of retained fish in nearshore waters and 28% in estuaries.
In nearshore waters, the most abundant species in the retained catch in 2000/01 were Australian herring (52% by number), trevally (11%), King George whiting (10%), whiting (various species, excluding King George) (9%) and salmon (3%). In estuarine waters, the most abundant species in the retained catch in 2000/01 were black bream (39% by number), King George whiting (23%), Australian herring (11%), mullet (Mugilidae) (6%) and trevally (4%).
The 2002/03 survey involved 17 estuaries, including 11 of the 13 estuaries open to commercial fishing (no commercial catches were taken in the remaining 2 estuaries during the study period). The most commonly reported species were King George whiting, black bream, Australian herring, skipjack trevally (Pseudocaranx georgianus), pink snapper (Pagrus auratus), flathead (Platycephalidae), tarwhine (Rhabdosargus sarba) and garfish, comprising approximately 80% of all fish (by number) retained by recreational fishers during the survey.
In the commercially-fished estuaries, the recreational catch of these 7 species was estimated to be approximately 29% (by weight) of the combined recreational and commercial catch of these species during the survey period. A total of 48 species were reported in the recreational catch from south coast estuaries. However, the total recreational catch (by weight) of all species could not be estimated in 2002/03 due to uncertainties associated with small samples of less abundant species and limited data on the average size of fish in the catch.
With the inclusion of less abundant species and catches taken in estuaries closed to commercial fishing, the recreational catch share of recreationally-targeted finfish species in South Coast estuaries is estimated to be 30-40%. If the landings of non-recreational species (cobbler, sea mullet and yellow-eye mullet) are also included, the recreational catch share of total finfish landings is estimated to be approximately 20%.
In 2002/03, the highest recreational fishing catch and effort of any south coast estuary was reported from the Walpole/Nornalup Inlet, which is closed to commercial fishing. The main species taken in this estuary was black bream, with an estimated recreational catch of 15 t during the survey period.
Approximate recreational catch shares (by weight):
The recreational catch share of total finfish landings in nearshore and estuarine waters of the South Coast Bioregion cannot be determined for the current year. Approximate catch shares have been estimated where data are available.
Key species
6% of South Coast Australian salmon catch
11% of South Coast Australian herring catch
50% of South Coast black bream catch
65-75% of South Coast King George whiting catch
99% of South Coast other whiting catch
99% of South Coast trevally catch
Estuaries
20% of total finfish catch
Fishing effort/access level
Commercial Since 1990, the number of licences in nearshore and estuarine commercial fisheries has been substantially reduced via Voluntary Fishery Adjustment Schemes (i.e. licence buy-backs). The removal of licences has eliminated a significant amount of latent effort (inactive licences) that previously existed in these fisheries.
Fishing effort in nearshore and estuarine fisheries is sometimes reported as the number of units of access (vessels, teams, licencees, etc). These measures of effort provide a general indication of effort changes over time and are often the only types of effort data available throughout the history of each fishery. Where possible, effort is also calculated as the number of days fished by each method. It is considered that ‘method days fished’ generally provides a more accurate measure of the effort undertaken in each fishery.
South Coast Estuarine Fishery: Declines in total fishery effort over the past decade reflect a reduction in the number of licensees in the fishery due to a Voluntary Fisheries Adjustment Scheme. This resulted in the number of licensees being reduced from 66 in 1987 to 25 in 2002.
The total annual reported fishing days peaked at 6,747 days in 1992 and then steadily declined until about 2004. Similarly, the average number of boats fishing per month peaked at 42.9 in 1992 and then declined. Total effort has followed a stable trend since 2004 with the number of fishing days per year ranging from 3,638 to 3972 and the average number of boats fishing per month ranging from 15 to 18. In 2009, the fishery reported a total of 3690 fishing days and an average of 17 boats fished per month.
In 2009, 52% of effort (method days) occurred in Wilson Inlet, 15% in Princess Royal Harbour, 13% in Oyster Harbour, 6% in Irwin Inlet, 5% in Beaufort Inlet, 4% in Broke Inlet and the remainder in 7 other estuaries. All of the 13 estuaries in the fishery were fished in 2009.
Herring trap net fishery: The number of herring trap net teams that operate during each trap net fishing season provides an approximate measure of effort in this fishery. The total number of licensed teams reached a peak of 30 in 1984, and has since been reduced by a Voluntary Fisheries Adjustment Scheme to the current level of 11 (operating from 10 beaches). In 2009, only 5 teams recorded effort during the
STATE OF THE FISHERIES AND AQUATIC RESOURCES REPORT 2009/10 233
SOUTH COAST BIOREGION
season. This is a continuation of the low participation level in this fishery in recent times. Commercial fishers report that these historically-low effort levels are in response to the lack of markets and low wholesale prices paid for Australian herring. South Coast Salmon Fishery: The commercial method of fishing for Australian salmon (i.e. beach-based netting) includes a considerable amount of time spent observing or searching for fish (‘spotting’). Hence effort in this fishery is difficult to accurately quantify. The number of licensed teams that operate during each fishing season provides an approximate measure of effort in this fishery. Since 1999, there have been 18 licencees in this fishery, who collectively have operated a total of between 9 teams (in 2007) and 21 teams (in 2001 and 2002) per year. Effort (number of teams) has followed a declining trend since 2002. In 2009, salmon landings were reported by 16 teams.
Recreational Current estimates of recreational effort for the South Coast Bioregion are unavailable.
The 2000/01 National Recreational and Indigenous Fishing Survey, which included all methods and Bioregions, provided the most recent information on total recreational fishing effort in the South Coast Bioregion. About 90% of the nearshore and estuarine 'fishing events' that were targeting finfish during the survey used line fishing (bait or lure). About 85% of all line fishing events occurred in nearshore waters. The estimated nearshore line fishing effort in 2000/01 comprised 223,158 shore-based and 50,368 boat-based fishing events during the 12-month survey period. In estuaries, the line fishing effort comprised 21,800 shore-based and 30,087 boat-based fishing events.
Recreational fishing effort in 17 south coast estuaries was estimated by a creel survey conducted in 2002/03. Total effort during the survey period was estimated at 254,171 fisher hours or 86,482 fisher days. This total included boat-based (202,658 hours), shore-based (47,816 hours) and house boat (3,698 hours) fishing. Recreational netting and charter boat effort was not quantified in this survey, but was considered to have been negligible (less than 2% of total effort).
In the 2002/03 survey, recreational fishing effort was estimated to have occurred mainly in Walpole/Nornalup Inlet (33% of total effort), Oyster Harbour (29%), Princess Royal Harbour (12%), Wilson Inlet (12%) and Wellstead Estuary (6%).
Stock Assessment Assessment complete Yes
Assessment method Catch rates
Breeding stock levels:
Australian herring Uncertain
Australian salmon Acceptable
Sea mullet Acceptable
Black bream (Stokes Inlet) Acceptable
Black bream (Beaufort Inlet) Acceptable
Black bream (Wilson Inlet) Acceptable
Black bream (Oyster Harbour) Acceptable
Black bream (Walpole-Nornalup Inlet)
Not assessed
Cobbler (Wilson Inlet) Acceptable
Cobbler (Oyster Harbour) Acceptable
Australian herring: Australian herring form a single, genetically homogeneous breeding stock across southern Australia. Spawning occurs mainly along the lower west coast of WA. Eggs and larvae are dispersed by the Leeuwin Current to coastal nurseries distributed from the West Coast Bioregion to Victoria. A strong current can result in high annual recruitment outside the West Coast Bioregion due to greater larval dispersal. Herring caught by the trap net fishery in the South Coast Bioregion are mainly pre-spawning fish undergoing a westward migration to the West Coast Bioregion, where they will spawn during May-June. These fish originate from juvenile nurseries in the South Coast Bioregion, South Australia and (to a lesser extent) Victoria. Herring caught in the West Coast Bioregion are a combination of these fish, plus fish originating from local juvenile nurseries in the West Coast Bioregion.
Since 2000, commercial catch and catch rates suggest declining availability of herring in the South Coast Bioregion, in southern parts of the West Coast Bioregion (Capes, Geographe Bay and Bunbury regions) and in South Australia, but stable or increasing availability in Perth metropolitan waters (South Coast Nearshore and Estuarine Figures 1 and 3). Voluntary recreational logbook fisher catch rates also suggest a stable trend in the availability of Australian herring in Perth metropolitan waters from 2006 to 2009. Declining catches in the southern areas reflect the reduced availability of fish due to declining recruitment (especially 2005 and 2006) in the southern areas (South Coast Nearshore and Estuarine Figure 4). Stable metropolitan catch rates possibly reflect more stable levels of annual recruitment in this area.
The cause of low recruitment in the South Coast Bioregion in recent years is not known. The effect of low South Coast stock abundance on the status of the entire stock is uncertain. Research is underway to examine the extent of connectivity of herring populations between Bioregions, including annual variations in connectivity.
Australian salmon: Australian salmon form a single breeding stock across southern Australia. Spawning occurs mainly along the lower west coast of WA. Eggs and larvae are dispersed by the Leeuwin Current to coastal nurseries distributed from the West Coast Bioregion to Victoria. As for herring, salmon in the South Coast Bioregion undertake a westward migration to the West Coast Bioregion, where they spawn during autumn. Unlike herring, salmon then migrate back to the South Coast. Traditionally, salmon have been targeted by commercial fishers during the autumn (mainly March/April) pre-spawning migration, but in recent years salmon has also been targeted during the late winter/spring post-spawning migrations. From 2000 to 2004, only 2% of total landings were taken during the July-December period. From 2005 to 2009, 32% of total landings were taken during the July-December period.
234 DEPARTMENT OF FISHERIES
SOUTH COAST BIOREGION
Annual commercial landings of salmon in the South Coast Bioregion have historically been highly variable, ranging from 753 (in 2009) to 4223 t (in 1968). The South Coast commercial catch and catch rate have been declining since 2002 (South Coast Nearshore and Estuarine Figures 2 and 5). The catch was 753 t in 2009, which was similar to the previous minimum of 755 t in 1978. Reduced targeting of salmon by commercial fishers is believed to be the main reason for lower South Coast catch levels, due to the lack of markets and low wholesale prices paid for this species.
The commercial catch and catch rate in the West Coast Bioregion continue to follow a stable trend (South Coast Nearshore and Estuarine Figures 2 and 5). The total West Coast commercial catch was 258 t in 2009.
Salmon recruitment has been variable since recruitment surveys commenced in 1994, with relatively high levels in 2008 and 2009 (South Coast Nearshore and Estuarine Figure 4). Higher recruitment in 2008 and 2009 is predicted to result in higher commercial catch rates 3-4 years later.
Sea mullet: A single breeding stock of sea mullet is believed to occur in the South Coast Bioregion. Adults typically occur in estuaries, except in winter when they migrate to ocean waters to spawn. Juveniles recruit to estuaries, where they remain until maturity.
Sea mullet abundance in Oyster Harbour is assumed to be representative of regional abundance. This estuary is permanently open to the sea. Catch rates of sea mullet in other estuaries that are seasonally closed can vary according to the extent of connectivity to the sea (i.e. sand bar openings) rather than regional abundance.
The annual commercial catch and catch rates in Oyster Harbour suggest a stable trend in the availability of sea mullet in the South Coast Bioregion from 1980 to 2002 (South Coast Nearshore and Estuarine Figure 6). Higher catch rates from 2002 to 2007 suggest greater availability during these years. The catch rates in 2008 and 2009 suggest recent sea mullet availability has been similar to the long-term average level.
Black bream: Black bream are restricted to estuaries. Each estuary hosts a discrete breeding stock of bream, which is genetically distinct to other estuarine populations.
The majority of commercial bream landings in the South Coast Bioregion are taken in four main estuaries - Stokes Inlet, Beaufort Inlet, Wilson Inlet and Oyster Harbour. Commercial catch rates in these estuaries were relatively low and followed a stable trend from 1980 until 1995, then steadily increased until about 2005 (South Coast Nearshore and Estuarine Figure 7). Since 2005, catch rates have been relatively stable in Beaufort and Stokes Inlets, declined slightly in Wilson Inlet and continued to increase in Oyster Harbour.
Bream landings vary in response to environmental factors in individual estuaries. Simultaneous increases in catch rates in numerous South Coast estuaries from 1995 to 2005 suggest that a widespread factor, such as rainfall, has influenced bream availability and recruitment across the region.
The current status of bream in Walpole-Nornalup Inlet (closed to commercial fishing) cannot be assessed due to lack of recent data from the recreational fishery.
Cobbler: Commercial targeting of cobbler is essentially restricted to estuaries. Each estuary hosts a discrete breeding stock of cobbler, which is genetically distinct to other estuarine populations and also distinct to cobbler populations in adjacent ocean waters. Historically, commercial targeting of cobbler in the South Coast Bioregion has mainly occurred in Wilson Inlet and in the estuaries around Albany (Oyster Harbour, Princess Royal Harbour).
Commercial catch rates suggest a stable long-term trend in the availability of cobbler in Wilson Inlet and Oyster Harbour since 1980 (South Coast Nearshore and Estuarine Figure 8). Catch rates suggest a slight increase in availability in Oyster Harbour after 2000. In Wilson Inlet, catch rates exhibit substantial annual variations that are believed to reflect large variations in recruitment. In particular, catch rates suggested relatively high cobbler availability in the mid 1990s and mid 2000s. The catch rate in 2009 was also relatively high. The Department of Fisheries has conducted annual fishery-independent surveys of juvenile recruitment of cobbler in Wilson Inlet since 2006. Information from these surveys will assist in predicting variations in future catch rates.
Non-Retained Species Bycatch species impact: Low
The small-scale commercial fisheries in nearshore and estuarine waters mainly use gill, seine and haul nets that are deployed in a targeted manner. Few non-target species are taken. Mesh size regulations ensure that target species caught by these methods are within an appropriate size range. Minimal discarding occurs because virtually all fish taken can be retained and marketed.
Recreational fishers mainly use line-based methods in nearshore and estuarine waters. This method can result in the capture and release of a significant number of non-target species and undersized fish. The risks associated with post-release mortality vary considerably among species. In general, fish in nearshore and estuarine waters are captured from shallow depths and suffer less barotrauma-related injuries than deep water species.
Protected species interaction: Negligible
It is compulsory for commercial fishers to report all interactions with protected and listed marine species. New Zealand fur seals and Australian sea lions are occasionally surrounded by beach seine nets used in the South Coast nearshore and estuarine fisheries, but are released immediately by the fishers. This is possible because seine netting is a labour-intensive operation and the fishing team will immediately notice a seal in the net. Fishers are able to release a seal from their seine net without injury to the animal.
The abundance of fur seals on the south coast has steadily increased over the last 15 years, resulting in an increasing level of interaction with fishers, especially in estuaries of the Albany region (R. Campbell, pers. comm.). There have been no reports of incidental mortalities of seals in these fisheries and it is believed that the present level of interaction (direct and indirect) is not a significant threat to the populations of
STATE OF THE FISHERIES AND AQUATIC RESOURCES REPORT 2009/10 235

SOUTH COAST BIOREGION
fur seals and sea lions. An assessment of the impact of interactions is performed on an annual basis and, if required, appropriate management plans will be devised to mitigate these interactions.
Recreational fishers using line-fishing methods are unlikely to capture protected species. Interactions are expected to be insignificant or nil.
Ecosystem Effects Food chain effects: Low
Excessive removal by commercial and recreational fisheries of certain species, such as Australian herring or salmon, from the food chain could potentially impact on prey and predator species including larger fish, cetaceans and seabirds. However, commercial fishing effort directed towards these species in recent years has been relatively low.
Habitat effects: Negligible
The operation of gill nets and haul nets over predominantly sand and mud bottoms is unlikely to have any impact on these habitats in estuaries and nearshore waters. Similarly, the line fishing methods used by recreational fishers have a negligible impact on the bottom substrates. Anchoring by recreational fishing vessels may have localised impacts on habitats such as seagrass.
Haul nets may be deployed low or medium density seagrass. This type of net tends to ‘roll’ over the surface of seagrass beds without removing attached leaves or uprooting plants. At times, haul nets may collect floating vegetation including seagrass leaves or algae.
Social Effects Commercial In 2009, there were approximately 44 commercial fishers involved in the South Coast Salmon Fishery and approximately 16 commercial fishers involved in the South Coast herring trap net fishery. In 2009, the South Coast Estuarine Fishery employed an average of 13.8 fishers per month. Additional employment is created by these fisheries in the processing and distribution networks and retail fish sales sectors.
Herring and salmon fisheries in the South Coast Bioregion supply WA bait and human consumption markets. The South Coast Estuarine Fishery is an important source of fresh local fish to regional centres. Additionally, a small proportion of estuarine landings are sold to zoos across Australia as animal food.
The use of trap nets and seine nets by herring and salmon fishers may temporarily impact on beach access by members of the public.
Recreational The 2000/01 National Recreational and Indigenous Fishing Survey estimated that approximately 12% of the State’s total recreational fishing effort occurs in the South Coast
Bioregion (Henry and Lyle 20031, Barharthah 20062). Fish resources in estuaries and nearshore waters of the Bioregion are a focus for recreational fishers and have a high social value in the region.
Within the South Coast Bioregion, approximately 21% of the recreational fishing effort is estimated to occur in estuaries and rivers. A high proportion of people who fish in each south coast estuary are non-residents, travelling from Perth, other WA regions or interstate. Consequently, fishing in south coast estuaries has a great benefit to local tourism.
Australian herring is the most common finfish species retained by recreational fishers in the South Coast Bioregion (and in WA) and therefore has high social value. In 2000/01 Australian herring were estimated to comprise 15% of all finfish retained by South Coast recreational fishers.
Economic Effects Estimated annual commercial value (to fishers)
for 2008/09:
South Coast Estuarine Fishery $983,290
(finfish only)
South Coast Salmon Fishery + Herring trap net
fishery $260,478
Fishery Governance Commercial Current Fishing (or Effort) Level
South Coast Estuarine Fishery Acceptable
Herring trap net fishery Acceptable
South Coast Salmon Fishery Acceptable
The current effort levels directed towards Australian herring and Australian salmon are very low compared to historic levels and considered acceptable at this time.
Target commercial catch range:
South Coast Estuarine Fishery 200 – 500 tonnes
South Coast herring 475 – 1200 tonnes
South Coast Salmon Fishery 1200 – 2800 tonnes
(includes West Coast landings)
The 2009 South Coast Estuarine Fishery total catch of finfish (217 t) was within the target range of 200-500 t.
The 2009 South Coast catch of Australian herring (151 t) was below the target range of 200-500 t. Low catches in 2009 are
1 Henry GW and Lyle JM. 2003. The National Recreational
and Indigenous Fishing Survey. FRDC Project No. 99/158. NSW Fisheries Final Report Series No. 48.
2 Barhathah T. 2006. Department of Fisheries community survey 2005. Fisheries Occasional Paper No. 33. Department of Fisheries, Perth.
236 DEPARTMENT OF FISHERIES
SOUTH COAST BIOREGION
STATE OF THE FISHERIES AND AQUATIC RESOURCES REPORT 2009/10 237
believed to be due to the combined effects of low availability of fish in the South Coast Bioregion due to low recent recruitment and lack of targeting due to weak market demand.
The total state commercial catch of Australian salmon in 2009 (753 t) was below the target range of 1200-2800 t, reflecting low catches in the South Coast Bioregion. Low South Coast catches in 2009 are believed to be due to the combined effects of lack of targeting due to weak market demand, low catchability due to environmental factors and low availability of fish due to low recent recruitment in 2006 and 2007 (South Coast Nearshore and Estuarine Figure 4).
Recreational Current Fishing (or Effort) Level Not available
Target catch range: Not developed
New management initiatives (for the next year)
An Order prohibiting the use of herring “G” nets is in its final stages of being drafted. This order will include a list of fishing boat licences that are excepted from the order and therefore enable those licences to continue fishing using herring “G” nets. Once the Order has been gazetted condition 42 will be removed from all fishing boat licenses. In October 2009 the mixed bag limit for Category 3 fish on the west coast will be reduced from 40 to 30.
With the closure to a section of Geographe Bay now permanent and the closure to the Voluntary Fishery Adjustment Scheme for West Coast Salmon fishers there are no new management initiatives for the south or west coast salmon fisheries.
External Factors Nearshore It is likely that annual variation in coastal currents (particularly the Leeuwin and Capes Currents) influences the recruitment patterns of larvae of nearshore species such as herring and salmon and thus their subsequent recruitment into each region. Coastal currents also influence the distribution and catchability of adult fish. For example, warmer beach water temperatures are associated with lower catchability of salmon.
On the south coast, an increased abundance of fur seals (R. Campbell, personal communication), which consume Australian herring and Australian salmon, could have impacted on stock levels in recent years. Australian salmon also consume herring.
Fluctuating market demand is a significant factor affecting the annual commercial catch level of many species. Limited demand and low wholesale prices paid for Australian herring and Australian salmon in recent years have limited commercial catch and effort levels. By purchasing only a limited quantity of herring and salmon each year, fish processors effectively restrict the catch level. Commercial fishers sometimes elect not to capture a school of fish, or release part of their catch, when a market is not available.
Estuaries Variations in the abundance of target species in south coast estuaries are largely driven by environmental factors, independent of fishing. These factors, which are outside the control of the Department of Fisheries, often have a dominant influence on the commercial catch and effort from year-to-year. For example, high rainfall may contribute to higher catches of black bream.
Catchment processes, such as clearing of vegetation, flow regulation and nutrient input, can have major downstream effects on estuary condition and on fishery production. Attempts to quantify the influence of these complex, interacting factors on fishery production are difficult, with the limited biological and environmental monitoring data that are available from south coast estuaries.
The influence of environmental factors on recruitment to estuaries is further complicated by the practice of human intervention to breach estuarine sandbars, mostly for reasons related to estuarine amenity coupled with ecosystem ‘health’.
Increased predation by the expanding fur seal population along the south coast may be impacting on the abundance of some target species. Declining levels of effort expended in Oyster Harbour and Princess Royal Harbour since 2002 largely reflect attempts by commercial fishers to avoid interactions with fur seals, which have increased in numbers in recent years and have become problematic to the fishers due to damage to gear and the removal of fish from nets.

SOUTH COAST BIOREGION
SOUTH COAST NEARSHORE AND ESTUARINE TABLE 1
Total annual catches from the estuarine and beach-based nearshore commercial fisheries in the South Coast Bioregion, 2005 to 2009.
Catch (tonnes)
Species Scientific name 2005 2006 2007 2008 2009
Australian salmon Arripis truttaceus 689.4 790.7 246.2 545.1 258.0
Cobbler Cnidoglanis macrocephalus 49.4 44.5 68.1 77.4 86.6
Australian herring Arripis georgianus 203.1 302.1 192.2 236.3 151.3
Black bream Acanthopagrus butcheri 63.5 34.0 46.2 37.8 49.9
Sea mullet Mugil cephalus 32.8 27.3 59.3 23.3 26.3
Sea Garfish Hyporhamphus melanochir 12.7 15.7 18.0 16.8 7.6
Flathead Platycephalidae 12.0 8.8 9.1 9.2 5.2
King George whiting Sillaginodes punctata 11.9 5.8 8.0 9.1 6.3
Leatherjacket Monocathidae 10.5 12.6 6.7 5.5 2.2
Tarwhine Rhabdosargus sarba 4.3 3.7 3.1 5.3 2.7
Yellow-eye mullet Aldrichetta forsteri 3.7 3.6 3.0 4.6 3.4
Pink snapper Pagrus auratus 0.9 1.9 3.2 3.6 2.1
Yellowtail scad Trachurus novaezelandiae 5.3 3.5 1.1 0.3 0.2
Trumpeters Teraponidae 1.9 3.4 2.5 0.3 1.7
Seapike Sphyraena obtusa 0.6 1.3 2.4 2.9 1.9
Flounder Pleuronectidae 3.1 2.7 1.7 1.1 0.2
Trevally Pseudocaranx georgianus 0.7 3.4 3.1 2.4 2.9
Yellow-finned whiting Sillago schombergkii 2.5 0.1 0.1 1.1 0.6
Other finfish Teleostei 4.3 3.8 3.7 4.2 3.4
Other baitfish (not Whitebait) Clupeidae 1.5 0.9 1.3 0.5 0.9
Sharks and rays Elasmobranchii 1.7 3.5 2.9 3.8 1.6
TOTAL 1115.6 1273.3 681.8 990.7 615.0
SOUTH COAST NEARSHORE AND ESTUARINE TABLE 2
Estimated total recreational catches of key species in nearshore and estuarine waters in the South Coast Bioregion in 2000/01 (Henry and Lyle 20031).
Species Scientific name 2000/01 Catch (tonnes)
Australian salmon Arripis truttaceus 117
Trevally Pseudocaranx spp. 93
Australian herring Arripis georgianus 79
King George whiting Sillaginodes punctata 40
Black bream Acanthopagrus butcheri 28
Whiting Sillago spp. 11
TOTAL 368
1 Henry GW and Lyle JM. 2003. The National Recreational and Indigenous Fishing Survey. FRDC Project No. 99/158. NSW Fisheries
Final Report Series No. 48.
238 DEPARTMENT OF FISHERIES

SOUTH COAST BIOREGION
SOUTH COAST NEARSHORE AND ESTUARINE TABLE 3
Estimated total recreational catches of key species in estuaries in the South Coast Bioregion in 2002/03 (Smallwood and
Sumner 2007).1
Species Scientific name 2002/03 Catch (tonnes)
Black bream Acanthopagrus butcheri 23.3
King George whiting Sillaginodes punctata 10.9
Trevally Pseudocaranx spp. 6.1
Australian herring Arripis georgianus 4.1
Southern blue-spotted flathead Platycephalus speculator 2.6
Pink snapper Pagrus auratus 2.6
Tarwhine Rhabdosargus sarba 0.5
Southern sea garfish Hyporhamphus melanochir 0.2
Annual commercial catch of Australian herring
Year1975 1980 1985 1990 1995 2000 2005 2010
Ann
ual c
atch
(t)
0
500
1000
1500 Total WA South Coast BioregionWest Coast Bioregion
SOUTH COAST NEARSHORE AND ESTUARINE FIGURE 1
Total annual commercial catches of Australian herring in the South Coast and West Coast Bioregions, 1976 – 2009.
1 Smallwood CB and Sumner NR. 2007. A 12-month survey of recreational estuarine fishing in the South Coast bioregion of Western
Australia during 2002/03. Fisheries Research Report 159. Department of Fisheries, Perth.
STATE OF THE FISHERIES AND AQUATIC RESOURCES REPORT 2009/10 239

SOUTH COAST BIOREGION
240 DEPARTMENT OF FISHERIES
Annual commercial catch of Australian salmon
Year
1965 1970 1975 1980 1985 1990 1995 2000 2005 2010
Ann
ual c
atch
(t)
0
1000
2000
3000
4000
Total WA South Coast BioregionWest Coast Bioregion
SOUTH COAST NEARSHORE AND ESTUARINE FIGURE 2
Total annual commercial catches of Australian salmon in the South Coast and West Coast Bioregions, 1965 – 2009.
Annual catch, effort and catch rate ofSouth Coast herring trap net fishery
Year
1994 1996 1998 2000 2002 2004 2006 2008
Cat
ch (
t)
0
250
500
750
1000
Effo
rt (
num
ber
of a
ctiv
e te
am
s)
0
5
10
15
20
Cat
ch r
ate
(ton
nes
per
activ
e te
am)
0
30
60
CatchEffortCatch rate
SOUTH COAST NEARSHORE AND ESTUARINE FIGURE 3
Total annual catch, effort and catch rate of Australian herring by the South Coast commercial trap net fishery, 1994 – 2009.
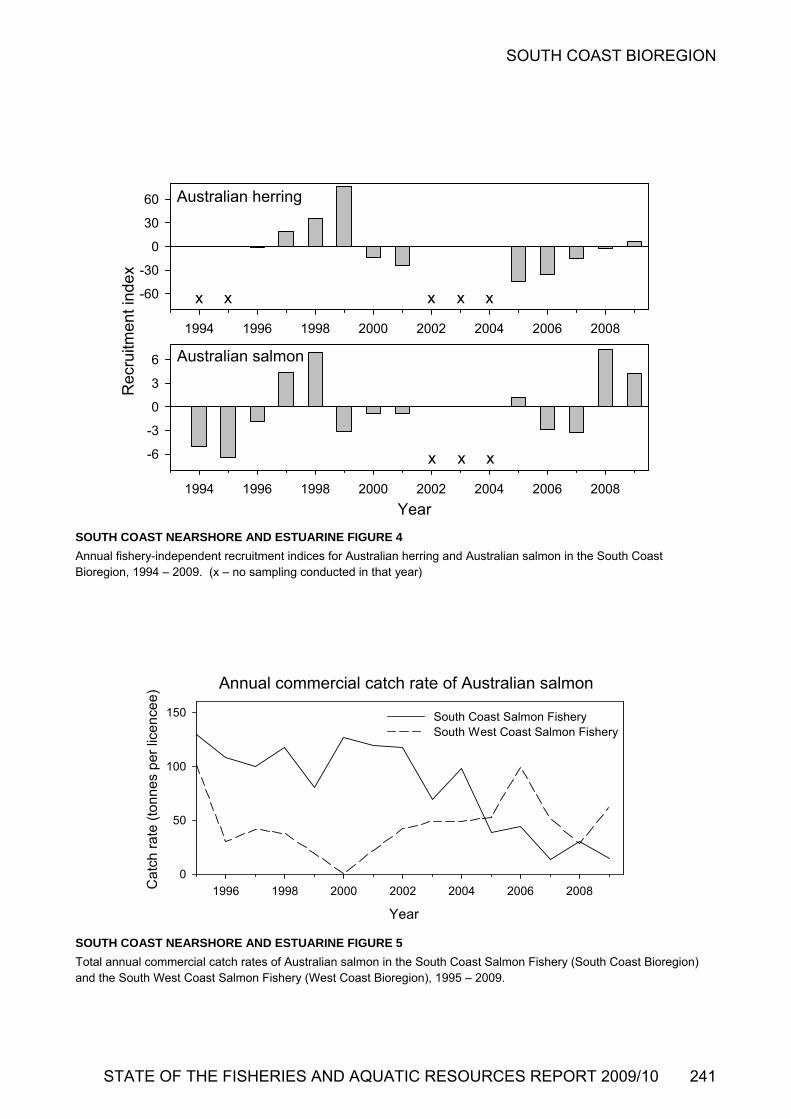
SOUTH COAST BIOREGION
Australian herring
1994 1996 1998 2000 2002 2004 2006 2008
-60
-30
0
30
60
Australian salmon
Year1994 1996 1998 2000 2002 2004 2006 2008
Rec
ruitm
ent i
nde
x
-6
-3
0
3
6
x x xx x
x x x
SOUTH COAST NEARSHORE AND ESTUARINE FIGURE 4
Annual fishery-independent recruitment indices for Australian herring and Australian salmon in the South Coast Bioregion, 1994 – 2009. (x – no sampling conducted in that year)
Annual commercial catch rate of Australian salmon
Year
1996 1998 2000 2002 2004 2006 2008Ca
tch
ra
te (
ton
ne
s p
er
lice
nce
e)
0
50
100
150 South Coast Salmon FisherySouth West Coast Salmon Fishery
SOUTH COAST NEARSHORE AND ESTUARINE FIGURE 5
Total annual commercial catch rates of Australian salmon in the South Coast Salmon Fishery (South Coast Bioregion) and the South West Coast Salmon Fishery (West Coast Bioregion), 1995 – 2009.
STATE OF THE FISHERIES AND AQUATIC RESOURCES REPORT 2009/10 241

SOUTH COAST BIOREGION
Annual commercial catch rate of sea mullet
Year
1980 1985 1990 1995 2000 2005 2010
Sta
ndar
dise
d ca
tch
rate
(kg/
met
hod
day)
0
10
20
SOUTH COAST NEARSHORE AND ESTUARINE FIGURE 6
Annual commercial catch rate of sea mullet in Oyster Harbour, 1980 – 2009.
242 DEPARTMENT OF FISHERIES

SOUTH COAST BIOREGION
Annual commercial catch rate of black bream
0
50
100
150Beaufort Inlet
Year1980 1985 1990 1995 2000 2005 2010
0
100
200
Sta
ndar
dis
ed c
atch
rat
e (k
g/m
eth
od d
ay)
0
5
10
15
0
15
30
45
Wilson Inlet
Oyster Harbour
Stokes Inlet
SOUTH COAST NEARSHORE AND ESTUARINE FIGURE 7
Annual commercial catch rates of black bream in Beaufort Inlet, Wilson Inlet, Oyster Harbour and Stokes Inlet, 1980 – 2009.
STATE OF THE FISHERIES AND AQUATIC RESOURCES REPORT 2009/10 243

SOUTH COAST BIOREGION
Annual commercial catch rate of cobbler
0
20
40
60
Year
Sta
ndar
dise
d ca
tch
rate
(kg
/met
hod
day)
0
10
20
30
79/8
0
84/8
5
89/9
0
94/9
5
99/0
0
04/0
5
09/1
0
Wilson Inlet
Oyster Harbour
SOUTH COAST NEARSHORE AND ESTUARINE FIGURE 8
Annual commercial catch rates of cobbler in Wilson Inlet and Oyster Harbour, 19/79/80 – 2008/09.
South Coast Purse Seine Fishery Report: Statistics Only B. Molony and E. Lai
Management input from Noel Chambers
Fishery Description This fishery is based on the capture of pilchards (Sardinops sagax) by purse seine nets in the waters between Cape Leeuwin and the Western Australia/South Australia border. The management plan also covers the take of yellowtail scad (Trachurus novaezelandiae), Australian anchovy (Engraulis australis) and maray (Etrumeus teres).
Boundaries
The Fishery consists of three major management zones. The Albany Zone (including the King George Sound zone) extends from Point D’Entrecasteaux to Cape Knob. The Bremer Bay Zone extends from Cape Knob to longitude 120ºE. The Esperance Zone from 120ºE to the WA/SA border. An additional zone exists between Cape Leeuwin and Point D’Entrecasteaux but has not been significantly fished to date.
Management arrangements
This fishery is primarily managed through output controls in the form of individually transferable quota (ITQ) units. Each zone in the fishery has been allocated a set amount of ITQ units whose values are reviewed annually and changed, if necessary, depending on the results of stock assessment. The sum of ITQ holdings within each zone for any one year equates to an annual total allowable catch (TAC). The total quota units allocated across each of the five zones in the fishery amount to 890 and remained unchanged from the previous season. The quota season for the South Coast Purse Seine Managed Fishery runs from 1 July to 30 June each year. The Albany zone has an annual TAC of 2683 tonnes, while both the Bremer Bay and Esperance zones have an annual TAC of 1500 tonnes each.
244 DEPARTMENT OF FISHERIES

SOUTH COAST BIOREGION
STATE OF THE FISHERIES AND AQUATIC RESOURCES REPORT 2009/10 245
Landings and Effort
Commercial pilchard catches during the 2008/09 season were 2,001.8 t, up from 1,735.3 t in 2007/08, extending the trend of gradually increasing total catches in this fishery since the late 1990s (South Coast Purse Seine Figure 1). An additional 4 t of other species were also landed, dominated by yellowtail scad. Increased catches were reported despite a decline in overall effort in this fishery in 2008/09 (effort decreased by approximately 6% compared to 2007/08 effort). Most of the commercial catches continue to be reported from the Albany Zone (1,350.9 t), with much lower catches reported in the Bremer Bay and Esperance Zones (511.7 t and 139 t, respectively). However, catches from the Bremer Bay and Esperance Zones in 2008/9 were much higher than those reported in 2007/08. Nonetheless, overall effort and catches remain below those recorded during the late 1980s and 1990s.
Fishery Governance Target commercial effort range: Not available
For the 2008/09 season, the catch was well below the total TAC for the entire fishery (5,683 t). The fleet and infrastructure for this fishery is rebuilding, but irregular
availability of market-sized fish, particularly in Bremer Bay and Esperance, influence how much of the TAC is caught. These factors, combined with the variability in unit holdings within the fishery and resultant variability in fishing behaviour by different operators, mean that it is currently difficult to estimate a target effort range for the fishery.
Current Fishing (or Effort) Level: Acceptable
Based on the most recent assessment (completed in 2006) and the recent history of the fishery, the level of spawning biomass in each major management zone is likely to be appropriate and the current level of fishing is acceptable.
New management initiatives (2010/11)
As a result of the code of conduct from the working group established by the Department of Fisheries in 2006 to reduce interactions in the south coast purse seine fishery, the fishery continues to reduce the number and severity of interactions with fleshy footed shearwaters. The Department has introduced a new catch and disposal record book for this fishery, the book is designed to allow for easy recording of protected species interactions.
SOUTH COAST PURSE SEINE FIGURE 1
Annual catches of pilchards along the south coast, by fishing zone
South Coast Purse Seine
0
1,000
2,000
3,000
4,000
5,000
6,000
7,000
8,000
9,000
1965 1968 1971 1974 1977 1980 1983 1986 1989 1992 1995 1998 2001 2004 2007
Cat
ch (
tonn
es)
Albany
Bremer Bay
Esperance
Total
SOUTH COAST BIOREGION
246 DEPARTMENT OF FISHERIES
Demersal Gillnet and Longline Fisheries Status Report R. McAuley and T. Leary
Management input from Nikki Sarginson
Main Features
Status
Stock level
Gummy shark Acceptable
Dusky shark Depleted
Sandbar shark Depleted
Whiskery shark Recovering
Fishing Level
JASDGDLF Zone 1 Acceptable
JASDGDLF Zone 2 Acceptable
WCDGDLF Acceptable
Current Landings (2008/09)
Demersal Gillnet and Demersal Longline Fishery
Total sharks and rays 1238 t
Scalefish 220 t
Indicator species
Gummy shark 600 t
Dusky shark 170 t
Sandbar shark 81 t
Whiskery shark 141 t
Catch of sharks and rays by other commercial fisheries
(2008/09) 9 t
Recreational catch (2005/06) <5% of commercial catch
Fishery Description The Joint Authority Southern Demersal Gillnet and Demersal Longline Managed Fishery (JASDGDLF) and the West Coast Demersal Gillnet and Demersal Longline (Interim) Managed Fishery (WCDGDLF) employ demersal gillnets and demersal longlines with power-hauled reels along the south and lower west coasts. The majority of operators use demersal gillnets to target sharks, with demersal scalefish also being a legitimate component of the catch. The main shark species targeted by fishers on the south coast are gummy shark (Mustelus antarcticus) and dusky shark (Carcharhinus obscurus), while on the west coast fishers primarily target dusky shark and sandbar shark (Carcharhinus plumbeus). Whiskery shark (Furgaleus macki) is also an important component of both fisheries’ catch. As their stocks span multiple bioregional boundaries, dusky, sandbar and whiskery sharks are assessed and monitored as indicators of the Statewide inshore demersal suite of species. Gummy sharks, on the other hand, are an indicator species of the south coast bioregion inshore demersal suite. The two fisheries are reported together here because extensive research has demonstrated that they share these key unit stocks.
Governing legislation/fishing authority
South Coast Joint Authority Southern Demersal Gillnet and Demersal
Longline Management Plan 1992
Joint Authority Southern Demersal Gillnet and Demersal Longline Managed Fishery Licences
West Coast West Coast Demersal Gillnet and Demersal Longline
(Interim) Management Plan 1997
West Coast Demersal Gillnet and Demersal Longline (Interim) Managed Fishery Permits
Consultation processes
Meetings between the Department of Fisheries and the WA Demersal Gillnet and Longline Association; the Western Australian Fishing Industry Council; regional meetings with authorisation holders and masters; and direct correspondence.
Boundaries
The Joint Authority Southern Demersal Gillnet and Demersal Longline Managed Fishery spans the waters from 33° S latitude to the WA/SA border and comprises two separate management zones. Zone 1 extends southwards from 33°S to 116°30’E longitude off the south coast. Zone 2 extends from 116°30’E to the WA/SA border (129°E).
The West Coast Demersal Gillnet and Demersal Longline (Interim) Managed Fishery technically extends northwards from 33° S latitude to North West Cape (114°06’E longitude). However, the use of shark fishing gear has been prohibited north of 26°30’S (Steep Point) since 1993. Demersal gillnet and longline fishing inside the 250 metre depth contour has also been prohibited off the Metropolitan coast (between latitudes 31° S and 33° S) since 15 November 2007.
See Figure 1 for management boundaries of both fisheries.

SOUTH COAST BIOREGION
Management arrangements
The southern and west coast fisheries are regulated through two complementary management plans. The JASDGDLF management plan was introduced in 1988 and is managed by the Western Australian Government on behalf of a Joint Authority comprising the Western Australian and Commonwealth Governments. The WCDGDLF is administered by the Western Australian Government under a management plan introduced in 1997.
Both fisheries are managed via input controls in the form of transferable time/gear effort units, with additional restrictions on mesh and hook sizes, net height (‘drop’) and maximum net length. Historically, each unit has permitted the use of one length of net or an equivalent number of hooks for one month. However, since 2006/07, the Department has been working with operators to transition the fishery to a more explicit hourly effort management system, with the objectives of removing latent effort capacity and restricting effort within each management zone to 2001/02 levels. Once formally implemented, through amendments to the management plans, all units will permit the use of 27 m of gillnet or 9 hooks on a longline for either 288 hours (in the WCDGDLF), 264 hours (in Zones 1 and 3 of the JASDGDLF) or 380 hours (in Zone 2 of the JASDGDLF).
Additional measures to address remaining sustainability concerns for key stocks were introduced during the 2006/07 season. These included:
a two month closure of the fisheries (16 August to 15 October), including the inshore waters to 200m depth throughout all of the WCDGDLF and the waters of the South Coast west of 118° E (in the JASDGDLF) to assist in the recovery of the over-exploited whiskery shark stock;
a maximum size limit for dusky sharks to protect their breeding stock; and
a prohibition of metal trace wire and large hooks, which had previously been used to target large whaler sharks.
The above shark management arrangements are supported by more precautionary regulations in non-target fisheries, including the State-wide commercial protection of all sharks and rays, which is intended to restrict their landings to a handful of fisheries.
In addition, to further assist in the protection of medium-high risk whaler shark stocks, a maximum size limit for whaler sharks taken by recreational fishers within the waters of the South Coast and West Coast Bioregions, was introduced in February 2009.
The metropolitan zone has now been closed to the WCDGDLF. To offset the Metropolitan Area Closure and mitigate against shifts in effort to northern grounds of the WCDGDLF, the Government established a Voluntary Fisheries Adjustment Scheme with the aim of buying-back 33% of WCDGDLF entitlement. This scheme is now closed and approximately 35% of entitlement was reduced.
In April 2009, the temperate demersal gillnet and demersal longline fisheries were declared approved Wildlife Trade Operations following re-assessment under the Commonwealth Environment Protection and Biodiversity Conservation Act 1999. The accreditation allows continued
export of product from these fisheries for a period of three years.
Research summary
Major FRDC-funded studies of the shark fishery on the south and west coasts of Western Australia, undertaken over the period 1993–2004, have provided a detailed basis for monitoring and assessing the fishery. The extensive biological and fishery information gained from these studies have been reported in three FRDC final reports, numerous international journal publications and the data have been used to develop stock assessment models for the fisheries’ key target stocks to determine their likely responses to current levels of exploitation and to test alternative harvest regimes.
Current research monitoring involves analysis of fishing returns data and periodic biological sampling of commercial and fishery-independent catches. To support the new fishery management arrangements that were introduced in 2006, improve assessments of key stocks and to facilitate the more detailed reporting requirements of the fisheries’ export accreditation under the Commonwealth Environment Protection and Biodiversity Conservation (EPBC) Act, a new daily/trip catch and effort reporting system was introduced in 2006/07. To resolve initial instances of missing, misreported and confounded catches in daily/trip logbook data, an extensive data recovery and correction exercise has been undertaken and all logbook data for 2006/07 to 2008/09 are reported below (see Demersal Gillnet and Longline Tables 1-3 and Figures 2-4).
In addition to research on the fisheries’ target stocks, some tactical research has been completed on grey nurse shark (Carcharias taurus) and Australian sea lion (Neophoca cinerea) bycatch issues. Two National Heritage Trust funded projects investigated movements and aggregation site locations of grey nurse sharks and a recent FRDC-funded project examined the relative spatial risks of sea lion interactions with demersal gillnets.
Retained Species Commercial landings (seasons 2006/07 - 2008/09):
All sharks (and rays): 1,275 tonnes (2006/07)
1,505 tonnes (2007/08)
1238 tonnes (2008/09)
Key shark species: 1,008 tonnes (2006/07)
1,226 tonnes (2007/08)
993 tonnes (2008/09)
Gummy: 575 tonnes (2006/07)
755 tonnes (2007/08)
600 tonnes (2008/09)
Dusky: 158 tonnes (2006/07)
142 tonnes (2007/08)
170 tonnes (2008/09)
STATE OF THE FISHERIES AND AQUATIC RESOURCES REPORT 2009/10 247
SOUTH COAST BIOREGION
Whiskery: 147 tonnes (2006/07)
171 tonnes (2007/08)
141 tonnes (2008/09)
Sandbar: 128 tonnes (2006/07)
159 tonnes (2007/08)
81 tonnes (2008/09)
Other finfish (i.e. non shark) catch: In addition to their primary catch of sharks, the JASDGDLF and WCDGDLF land a number of scalefish species, which totalled 240 t in 2006/07, 227 t in 2007/08 and 220 t in 2008/09 (Demersal Gillnet and Longline Figure 4). This included catches of 64.2 to of demersal scalefish from the West Coast Bioregion in 2008/9 (Demersal Gillnet and Longline Table 3). For details of other fisheries’ demersal scalefish catches in the same bioregions that the demersal gillnet and demersal longline fisheries operate, see Demersal Scalefish Fishery Status Report (pp. xx-yy) and South Coast Wetline Fishery Report (pp. xxx-yyy).
Shark catches in other fisheries: Sharks were also historically caught off the south and west coasts in a variety of other commercial fisheries. However, due to the very poor standard of reported species identification of non-targeted shark catches and their contribution to identified sustainability risks to some stocks (eg. dusky shark), the retention of sharks and rays was prohibited in most non-target fisheries in November 2006 throughout the State by commercially protecting all sharks and rays (elasmobranchs). Reported elasmobranch catches by vessels operating in other managed fisheries between North West Cape and the South Australian border consequently declined to 5 t in 2006/07, 3.4 t in 2007/08 and 3.9 t in 2008/09.
Recreational catch estimate (season 2005/06):
< 5% of total catch
The recreational catch of sharks by fishers operating from trailer-boats between Augusta and Kalbarri was estimated from two Department of Fisheries surveys conducted in 1996/97 and 2005/06. The total recreational shark catch was estimated to have declined from ca. 7,000 sharks per year in 1996/97 to ca. 5,500 sharks per year in 2005/06, although only about half of these were reported to have been retained. The reported species composition of the retained catch in 2005/06 was similar to that of the Demersal Gillnet and Demersal Longline fisheries, Whaler shark species were the most commonly retained group (31%), followed by hound sharks (gummy, whiskery, etc.; 28%), wobbegongs (14%) and hammerheads (10%). Assuming an average weight of 5 kg per shark, then the west coast recreational take of sharks at the time of the survey would have been about 13.5 t, or approximately 3% of the west coast commercial shark catch in that year. However, as WCDGDLF catches (and effort) have declined by approximately 70% since 2005/06 and recreational fishing effort is likely to have increased over the same period, the relative magnitude of recreational shark catches, particularly in the west coast bioregion, requires re-evaluation.
Fishing effort/access level
There are 57 licences in the JASDGDLF, 24 in Zone 1 and 33 in Zone 2. However, only 9 Zone 1 and 17 Zone 2 vessels reported active fishing returns during 2008/09 (6 Zone 1 and 15 Zone 2 vessels in 2006/07 and 7 Zone 1 and 17 Zone 2 vessels in 2007/08). At the commencement of the 2008/09 fishing season there were 26 permits in the WCDGDLF. As a result of the WCDGDLF Voluntary Fisheries Adjustment Scheme, the Government had bought back 6 WCDGDLF permits by the end of the 2008/09 season. Only 6 (the same as 2007/08 and one less than 2006/07) reported active fishing returns during the year.
As gillnetting is by far the dominant method employed in the fisheries, effort is expressed in standardised units of kilometre gillnet hours (km gn hr) by converting the historically small amount of longline effort into the equivalent gillnet effort by comparing longline catches with gillnet Catch Per Unit Effort (CPUE). Fishing effort is shown for the 3 reported years in Demersal Gillnet and Longline Tables 1-3 and in Demersal Gillnet and Longline Figure 5. Effort was below target levels of 36,663 km gn hr for Zone 1, 115,012 km gn hr for Zone 2 and 55,522 km gn hr, for the WCDGDLF in all zones and years, except during 2008/09, when Zone 1 effort was estimated to have been 106% of its target level. It should be noted that as more than 30% of WCDGDLF units were removed via a Voluntary Fisheries Adjustment Scheme in 2008/09, the target effort level will be proportionally reduced in next year’s report.
Stock Assessment Assessment complete: Yes
Assessment method:
Gummy shark CPUE
(relative to previous age structured model)
Dusky shark CPUE
(relative to previous direct survey)
Sandbar shark CPUE
(relative to previous direct survey)
Whiskery shark Age Structured Model
Breeding stock levels:
Gummy shark acceptable
Dusky shark unacceptable
Sandbar shark unacceptable
Whiskery shark recovering
Stock assessments are carried out for the four indicator shark species caught by the fishery using a combination of catch and effort data, periodic empirical estimates of fishing mortality rates, biological information and dynamic biomass and demographic models. Historical catch and effort data are corrected to account for missing fishing returns and inaccurately reported species compositions prior to 1989/90 and an increasing efficiency of 2% yr-1 prior to 1995/96. Missing, misreported and confounded catches in the daily/trip
248 DEPARTMENT OF FISHERIES

SOUTH COAST BIOREGION
logbook data submitted since 2006/07 were recovered and/or corrected using fishers’ personal records, fish processor returns, face to face and phone interviews with fishers or were derived from average fish weights from accurately-reported logbook records or from observed size compositions of demersal gillnet and demersal longline catches and available length weight relationships.
Trends in the status of the fisheries’ four key species are assessed using corrected gillnet-only catch and effort data taken from each one degree x one degree reporting block that overlaps the species’ primary distributions within the fishery (as defined below). Due to the introduction of an annual two month whiskery shark ‘pupping’ closure in 2006 and the prohibition of demersal gillnet fishing in the metropolitan region in November 2007, historical data from west of 118°E during August, September and October and from latitudes 31°S to 33°S have been excluded from analysis. To investigate apparent changes in CPUE data arising from the shift to daily/trip logbook reporting and to account for uncertainty in the combined time series of catch and effort data, two methods have been used to calculate an ‘effective’ annual CPUE for each species. The first divides the sum of monthly block catches by the sum of monthly block effort (ratio of the means) and the second calculates the annual mean of the monthly block CPUE values (mean of the ratio). However, until some discrepancies between the two sets of effective CPUE estimates can be resolved, inferences on stock status are made from both trends.
Gummy shark: The best (median) estimate from age-structured modelling indicated that the Western Australian gummy shark stock was 42.7% of its virgin biomass (hereafter referred to as B0) in 1997/98, slightly above its minimum acceptable level of 40% of B0. Subsequent catches and upwards trends in both estimates of effective catch rates (taken from the area off the south coast between 116°E and 129°E longitudes) have indicated little cause for concern (Demersal Gillnet and Longline Figure 6). As gummy shark catches are almost exclusively comprised of adults, the increasing trends in CPUE suggest that the breeding biomass is increasing. However, as catches since 2006-07 have been between 28% and 68% above the upper limit of their target catch range and the stock has not been comprehensively assessed since 1998, a new model that incorporates contemporary catch, effort and size or age data requires development.
Dusky shark: The status of the Western Australian dusky shark stock was first assessed in 1999 and again in 2005, using revised demographic modelling techniques, updated biological parameters and additional fishing mortality rate estimates. Subsequent assessments have relied on analysis of catch and CPUE trends in relation to the stock’s estimated demographic rates prior to 2005.
The updated demographic analysis confirmed that rates of demersal gillnet and longline fishing mortality were most likely to have been sustainable for sharks born between 1994 and 1995. However, the model also predicted that additional low levels (1–2% yr-1) of fishing mortality applied to sharks older than 10 years of age would result in negative rates of population growth. These results suggest that the stock is highly susceptible to unrecognised mortality of older sharks and provide a plausible explanation for the declining trend
observed in one of the effective CPUE trends (ratio of the means) since 1994/95. However, the same downwards trend is not evident in the mean of ratios estimates (Demersal Gillnet and Longline Figure 7).
Because dusky sharks give birth to live young, there is likely to be a relatively direct relationship between recruitment and breeding stock biomass. Therefore, the declining CPUE of juvenile dusky sharks in the gillnet fishery evident in one of the effective CPUE series, may indicate declining breeding stock biomass. However, discrepancies between the different effective CPUE trends require further investigation.
Whiskery shark: Between 2005/06 and 2008/09, both estimates of effective whiskery shark CPUE remained stable above 1990s levels. When applied separately in the age-structured population model, which was last updated in 2007, both effective CPUE series indicated that the whiskery shark stock has begun to recover after its significant depletion during the 1980s and continued gradual decline through the 1990s (Demersal Gillnet and Longline Figure 8).
Median estimates of total biomass were calculated to have increased by an average of 3.5% to 3.6% per year between 2006/07 and 2008/09. The best estimates of total biomass in 2008/09 were 37.4% and 47.6% of B0, with 95% confidence that the stock was between 35.9% and 38.8% or between 44.4% and 49.4% of B0, respectively. When combined, results from the two models suggest that total biomass in 2008/09 was 42.5% (±0.95%) of B0. The model estimated that mature female biomass had, on average, increased by between 6.3% and 7.3% per year between 2006/07 and 2008/09. As the full benefits of additional management measures, designed to reduce whiskery catches and improve recruitment to the stock (see management arrangements above), have not yet become evident, stock recovery is expected to accelerate when sharks born during the closed season begin to reach reproductive age in 2012.
Sandbar shark: Sandbar shark stock assessment was undertaken using empirically-derived estimates of fishing mortality and demographic modelling techniques, similar to those used for dusky shark. As age-specific fishing mortality rates were estimated for the period 2001/02 to 2003/04, subsequent assessments of this stock have relied on analysis of catch and CPUE trends. The model indicated that combined levels of fishing mortality from the northern shark fisheries, the temperate demersal gillnet and longline fisheries and non-target fisheries (corresponding to combined catches of 250 – 440 tonnes per year) were increasingly unsustainable between 2001 and 2004 and had probably been so since at least 1997/98. Given these results, the combined targeted catch of 918 tonnes in 2004/05 (762 tonnes of which was reported by the northern shark fisheries) is considered to have been highly unsustainable.
Although both estimates of effective sandbar shark CPUE reflect an increase in catch rates since 2005/06, one shows a marked decline between 2002/03 and 2005/06, while the other is stable for the same period (Demersal Gillnet and Longline Figure 9). The declining trend evident in the former data is consistent with the model-predicted decline in recruitment beginning in the late 1990s. Furthermore, fishery-independent survey data collected from the area between northern Shark Bay and Eighty Mile Beach, where mature sandbar sharks are prevalent, suggest a significant decline in
STATE OF THE FISHERIES AND AQUATIC RESOURCES REPORT 2009/10 249
SOUTH COAST BIOREGION
breeding stock abundance between 2002 and 2005. As breeding biomass is already likely to be close to the minimum acceptable limit (40% of B0) and possibly continuing to decline, this stock requires careful monitoring and may require additional species-specific recovery measures in the future.
Other sharks: The four indicator species of the temperate shark ‘suite’ account for approximately 80% of the fisheries’ and bioregional shark catch. As they also represent the range of life history strategies of other shark species caught by the fisheries, their status is believed to generally reflect the status of other sharks in the South and West coast bioregion. However, as dusky and sandbar sharks have among the lowest intrinsic population growth rates of all continental shelf distributed sharks and because previous impacts on their stocks were largely a result of targeted fishing activities, remaining concerns for their sustainability may not represent the risks faced by the rest of the species suite.
Non-Retained Species Bycatch species impact: Low
The catch composition of the fishery was examined in detail for the period 1994 to 1999 (McAuley and Simpfendorfer 2003). There is some discarded bycatch of unsaleable species of sharks, rays and scalefish. During ESD risk assessment of these fisheries in 2002, all impacts on stocks of bycatch species were determined to be low risk. As fishing effort is now explicitly capped at approximately 65% of the level of mid to late 1990s, bycatch levels in all management zones are expected to be proportionally reduced. Recent multi-fisheries bycatch risk assessment has identified the Port Jackson shark among the higher risk bycatch species in the west coast
bioregion (Evans, in prep)1
. Although this species is one of the largest components of the demersal gillnet and demersal longline fisheries bycatch and is recorded as bycatch in other commercial fisheries, cumulative risks were assessed as low-moderate.
Protected species interaction: Negligible-Low
Observed rates of protected species captures were very low throughout the fishery during the mid to late 1990s (McAuley and Simpfendorfer 2003). Marine mammal captures were observed at a rate of just over 1 per 10,000 km gillnet hours, seabirds at 1 capture per 25,000 km gillnet hours and turtles at 1 capture per 100,000 km gillnet hours. It should be noted that demersal gillnet and longline fishing are not permitted between Steep Point (26°30’ S) and a line drawn north of North West Cape (114°06’ E), or within 3 nautical miles of the Abrolhos Islands baselines, where populations of turtles and dugongs are present.
Small numbers of white sharks (Carcharodon carcharias) and grey nurse sharks (Carcharias taurus) have been reported in daily logbooks since 2006/07 (mean of 11/yr and < ca. 66/yr, respectively). In keeping with previous
1 Evans, R. In prep. Ranked Risk Assessment of Multiple fisheries: a new bioregional risk assessment method. Final report to the Western Australian Marine Science Institution.
observervations, the majority of these sharks were reported to have been released alive. Evans (in prep) also assessed the cumulative bycatch risk to these species as low-moderate.
Two studies have highlighted risks to Australian sea lions from demersal gillnet captures in these fisheries. Evans (in prep) assessed sea lion bycatch risk to be moderate-high in the West Coast Bioregion and Campbell (in prep) suggested that that several sea lion colonies in the south east of the State and at Beagle Island on the west coast to be at greatest risk. However, further work is required to estimate actual levels of sea lion bycatch in these fisheries or to verify the very low capture rate observed by McAuley and Simpfendorfer (2003).
Ecosystem Effects Food chain effects: Not assessed
Habitat effects: Negligible
The level of effort is such that the gear is deployed infrequently over approximately 40% of the fisheries’ area and under normal circumstances the physical impact of the gear on the bottom is minimal.
Social Effects Direct: Estimated employment during the period 2006/07 to 2008/09 was between 49 and 65 skippers and crew in the JASDGDLF and between 9 and 18 in the WCDGDLF. Unlike other regions, sharks are generally not targeted by recreational fishers in Western Australia, thus their direct social importance to this group is negligible.
Indirect: Sharks are viewed as a menace by some members of the community due to their perceived danger to bathers and their predation of prized recreationally caught fish. However, others consider them to be important components of marine ecosystems that deserve to be conserved.
Economic Effects Estimated annual commercial value (to fishers)
for year 2006/07:
JASDGDLF: $4.2 million (shark*)
$0.7 million (scalefish)
WCDGDLF: $0.9 million (shark*)
$0.4 million (scalefish)
for year 2007/08:
JASDGDLF: $5.2 million (shark*)
$0.8 million (scalefish)
WCDGDLF: $0.9 million (shark*)
$0.3 million (scalefish)
250 DEPARTMENT OF FISHERIES

SOUTH COAST BIOREGION
for year 2008/09:
JASDGDLF: $4.6 million (shark*)
$0.9 million (scalefish)
WCDGDLF: $0.5 million (shark*)
$0.2 million (scalefish)
* As fishers do not specify the value of fins on their catch returns, fin values were calculated at an average of 3% of sharks’ whole weight and value was conservatively estimated using a price of $35/kg. Categories of shark which do not have saleable fins were excluded from fin valuation.
Fishery Governance Current Fishing (or Effort) Level
JASDGDLF Zone 1 Acceptable
JASDGDLF Zone 2 Acceptable
WCDGDLF Acceptable
Maximum acceptable effort levels for each management zone have been set at their respective 2001/02 levels. These levels are considered likely to deliver sustainable harvests of the fisheries’ key target species and acceptably low levels of bycatch and protected species interactions. Under explicit hourly-gear input control arrangements, effort should not exceed these limits.
Target commercial catch range:
Key shark and ray species 725–1,095 tonnes
Individual target catch ranges for the key species in 2008/09 were as follows:
Gummy shark 350–450 tonnes
Dusky shark 200–300 tonnes
Sandbar shark < 120 tonnes
Whiskery shark 175–225 tonnes
Gummy shark catches have exceeded the upper limit of their acceptable range since 2003-04, and reached historically high levels in 2006-07 (575 t), 2007-08 (755 t) and 2008-09 (600 t). Although these unprecedented catches are believed to be a result of increasing stock abundance, updated stock assessment modelling is required to evaluate their implications to stock sustainability.
Dusky shark catches were between 71% (2007/08) and 85% (2008/09) of their minimum acceptable level during the last 3 years. However, as over 30% of WCDGDLF units were removed in 2008/09 as a result of a Voluntary Fishery Adjustment Scheme, the acceptable dusky shark catch range will need to be adjusted downwards to 180-280 tonnes next year. In relation to this revised acceptable catch range, catches between 2006/07 and 2008/09 were between 79% and 95% of the minimum acceptable catch limit, consistent with the proportion of effort expended in the fisheries.
Catches of sandbar sharks exceeded the maximum acceptable catch of 120 t by 7% and 35% in 2006/07 and 2007/08. However, following a 66% reduction in WCDGDLF effort between 2005/06 and 2008/09, the sandbar catch declined to 81 tonnes in the most recent year reported. Recent catches of sandbar shark off the north coast are reported in the Northern Shark Fisheries Status Report.
New management initiatives (for 09/10)
The remaining components of the new JASDGDLF and WCDGDLF management arrangements foreshadowed in previous status reports are expected to be in place by the commencement of the 2009/2010 season (for the WCDGDLF) and by the end of 2009 (for the JASDGDLF). Currently, the outstanding elements of this package are:
formal conversion of existing monthly gear units to hourly units;
explicitly capping effort within each zone at their 2001/02 levels; and
formal implementation of the vessel monitoring system.
To support and assess the success of these management changes, there will need to be increased monitoring of these fisheries, with a focus on size composition of catches and tagging to update harvest rates, particularly for dusky shark and sandbar sharks.
Following the outcomes of the Wetline Review, the Government has made a commitment to address the long-term sustainability of demersal scalefish on the West Coast by reducing both commercial and recreational catches of demersal scalefish by at least 50% of 2005/06 levels. Demersal scalefish is an important component of the temperate demersal gillnet and demersal longline fisheries catch, and these fisheries will be monitored against the demersal scalefish objectives on the West Coast, in addition to shark and ray sustainability objectives.
External Factors
There are a number of factors outside of the control of the fishery which are negatively impacting the performance of key temperate shark stocks. These include incidental catches of dusky shark, sandbar and gummy sharks in other State and Australian Government-managed fisheries and in overlapping WA-managed fisheries. For the sandbar population particularly, continued high catches of the breeding stock in the northern shark fisheries is a cause for considerable concern. The ongoing mortality of older juvenile and adult dusky sharks from entanglement in plastic packing straps may also be compromising future recruitment to this stock. Targeted gummy shark fishing by Australian Government-managed vessels also occurs to the east of Zone 2 of the JASDGDLF. However, as that fishery is tightly managed via quota controls, it is unlikely that current catches are causing any detrimental effect to the WA fisheries. All of these outside influences however need to be taken into account in the stock assessment process for these species and accommodated in the management strategy.
STATE OF THE FISHERIES AND AQUATIC RESOURCES REPORT 2009/10 251

SOUTH COAST BIOREGION
DEMERSAL GILLNET AND LONGLINE TABLE 1
Summary of 2006/07 catch (t live wt.) by the WA temperate Demersal Gillnet and Demersal Longline Fisheries. Data are given by management zone and also by bioregion (italicised). Indicator species and catches are highlighted in bold.
JASDGLF Bioregion
Name Species or taxon Zone 1 Zone 2 WCDGDLF South West Coast Coast
Total
Gummy Mustelus antarcticus 37.6 525.9 11.4 541.7 33.2 574.9
Dusky whaler Carcharhinus obscurus 84.2 38.6 34.8 63.4 94.2 157.7
Whiskery Furgaleus macki 39.9 80.7 26.8 97.8 49.6 147.4
Sandbar Carcharhinus plumbeus 20.7 0.9 106.3 8.7 119.1 127.8
Hammerheads Sphyrnidae 25.1 21.5 18.4 27.8 37.2 65.0
Wobbegongs Orectolobidae 38.8 7.8 22.5 20.0 49.1 69.1
Bronze (copper) whaler Carcharhinus brachyurus 16.3 18.8 7.9 26.4 16.5 42.9
Spinner (long nose grey) Carcharhinus brevipinna 11.0 0.1 23.0 1.6 32.4 34.1
Rays Batoidea 1.5 9.3 3.6 10.0 4.3 14.3
School Galeorhinus galeus 0.0 1.8 0.0 1.8 0.0 1.9
Other elasmobranchs 8.6 16.4 15.5 27.1 23.5 50.6
Total elasmobranchs 283.6 721.8 270.0 826.4 459.1 1285.5
Queen Snapper Nemadactylus valenciennesi
20.2 24.0 7.7 36.8 15.1 51.8
Blue Groper Achoerodus gouldii 19.3 15.6 4.7 21.7 17.9 39.7
Pink snapper Pagrus auratus 6.5 10.7 15.7 15.9 16.8 32.8
Dhufish Glaucosoma hebraicum 13.2 1.5 9.6 5.1 19.2 24.4
Sweetlips Haemulidae 0.0 0.0 14.5 0.0 14.5 14.5
Samsonfish Seriola hippos 2.2 1.7 12.4 3.6 12.7 16.3
Mulloway Argyrosomus hololepidotus 1.0 7.1 6.4 7.4 7.2 14.6
Redfishes Centroberyx spp. 2.9 4.3 0.7 6.5 1.4 7.9
Boarfishes Pentacerotidae 0.9 4.0 0.6 4.5 1.0 5.5
Baldchin groper Choerodon rubescens 0.4 0.0 2.1 0.0 3.7 3.7
Other scalefish 8.4 9.4 11.2 12.9 16.1 29.0
Total scalefish 74.7 78.3 87.0 114.5 125.5 240.1
'Demersal scalefish suite' component 64.6 62.9 62.8 94.0 96.3 190.2
Fishing effort (equivalent km gillnet hours x 1000) 33.8 62.3 47.9 141.5
252 DEPARTMENT OF FISHERIES

SOUTH COAST BIOREGION
STATE OF THE FISHERIES AND AQUATIC RESOURCES REPORT 2009/10 253
DEMERSAL GILLNET AND LONGLINE TABLE 2
Summary of 2007/08 catch (t live wt.) by the WA temperate Demersal Gillnet and Demersal Longline Fisheries. Data are given by management zone and also by bioregion (italicised). Indicator species and catches are highlighted in bold.
JASDGLF Bioregion
Name Species or taxon Zone 1 Zone 2 WCDGDLF South Coast
West Coast
Total
Gummy Mustelus antarcticus 44.6 693.1 17.3 720.2 34.8 755.0
Dusky whaler Carcharhinus obscurus 71.5 43.4 27.0 66.5 75.4 141.9
Whiskery Furgaleus macki 44.8 110.3 15.5 132.4 38.2 170.6
Sandbar Carcharhinus plumbeus 6.7 1.1 150.8 1.9 156.6 158.5
Hammerheads Sphyrnidae 16.6 30.3 15.1 34.6 27.4 62.0
Wobbegongs Orectolobidae 32.2 9.5 11.4 18.4 34.7 53.2
Bronze (copper) whaler Carcharhinus brachyurus 12.0 43.9 2.4 48.0 10.3 58.3
Spinner (long nose grey) Carcharhinus brevipinna 14.5 5.5 14.9 8.2 26.6 34.8
Rays Batoidea 1.7 7.8 3.0 9.3 3.2 12.5
School Galeorhinus galeus 0.0 14.4 0.0 14.4 0.0 14.4
Other elasmobranchs 4.6 13.7 25.8 18.2 31.0 49.2
Total elasmobranchs 249.3 972.9 283.0 1072.1 438.3 1510.4
Queen Snapper Nemadactylus valenciennesi
16.7 33.7 3.3 43.3 10.4 53.7
Blue Groper Achoerodus gouldii 18.9 20.4 3.1 28.1 14.4 42.5
Pink snapper Pagrus auratus 8.4 13.1 9.9 17.4 14.0 31.4
Dhufish Glaucosoma hebraicum 13.9 1.4 9.5 5.0 19.9 24.8
Sweetlips Haemulidae 0.0 0.0 17.1 0.0 17.1 17.1
Samsonfish Seriola hippos 1.2 2.8 6.2 3.9 6.4 10.3
Mulloway Argyrosomus hololepidotus 1.7 4.5 4.4 4.6 6.0 10.7
Redfishes Centroberyx spp. 0.8 6.8 0.3 7.4 0.5 7.9
Boarfishes Pentacerotidae 1.1 4.7 0.3 5.3 0.8 6.1
Baldchin groper Choerodon rubescens 0.2 0.0 1.8 0.0 2.0 2.0
Other scalefish 6.3 7.2 7.4 10.0 10.9 20.9
Total scalefish 69.1 94.6 63.6 125.0 102.4 227.3
'Demersal scalefish suite' component 61.0 82.0 49.5 108.9 83.6 192.5
Fishing effort (equivalent km gillnet hours x 1000) 34.7 89.1 52.4 175.5

SOUTH COAST BIOREGION
DEMERSAL GILLNET AND LONGLINE TABLE 3
Summary of 2008/09 catch (t live wt.) by the WA temperate Demersal Gillnet and Demersal Longline Fisheries. Data are given by management zone and also by bioregion (italicised). Indicator species and catches are highlighted in bold.
JASDGLF Bioregion
Name Species or taxon Zone
1 Zone 2 WCDGDLF
South West Coast Coast
Total
Gummy Mustelus antarcticus 28.9 570.6 0.8 580.1 20.2 600.3
Dusky whaler Carcharhinus obscurus 93.4 53.9 23.0 87.3 83.0 170.2
Whiskery Furgaleus macki 41.4 90.4 9.4 102.7 38.5 141.2
Sandbar Carcharhinus plumbeus 8.4 1.9 70.8 8.4 72.7 81.1
Hammerheads Sphyrnidae 18.6 41.1 6.7 46.3 20.2 66.4
Wobbegongs Orectolobidae 31.6 11.3 6.2 24.5 24.6 49.2
Bronze (copper) whaler Carcharhinus brachyurus 12.5 35.8 0.4 39.4 9.3 48.7
Spinner (long nose grey) Carcharhinus brevipinna 19.4 2.3 8.4 7.0 23.1 30.1
Rays Batoidea 2.2 15.0 1.4 15.9 2.8 18.6
School Galeorhinus galeus 0.0 6.0 0.0 6.0 0.0 6.0
Other elasmobranchs 2.3 14.7 8.9 15.7 11.0 26.7
Total 258.9 842.9 135.9 933.2 305.3 1238.4
Queen Snapper Nemadactylus valenciennesi
21.6 38.7 0.1 51.5 8.9 60.4
Blue Groper Achoerodus gouldii 27.0 28.0 0.4 40.4 15.1 55.4
Pink snapper Pagrus auratus 6.3 12.5 5.6 15.8 8.6 24.4
Dhufish Glaucosoma hebraicum 14.6 2.2 4.6 6.9 14.5 21.4
Sweetlips Haemulidae 0.0 0.0 9.1 0.0 9.1 9.1
Samsonfish Seriola hippos 2.2 2.3 3.4 3.0 4.9 7.9
Mulloway Argyrosomus hololepidotus 2.0 1.0 1.9 1.4 3.4 4.9
Redfishes Centroberyx spp. 2.3 8.8 0.0 10.2 0.9 11.1
Boarfishes Pentacerotidae 1.1 5.0 0.1 5.6 0.6 6.2
Baldchin groper Choerodon rubescens 0.1 0.0 1.8 0.0 3.2 3.2
Other scalefish 6.0 5.3 4.8 7.8 8.2 16.1
Total 83.0 103.8 33.2 142.6 77.4 220.0
'Demersal scalefish suite' component 73.6 96.8 25.9 132.2 64.2 196.4
Fishing effort (equivalent km gillnet hours x 1000) 38.7 103.6 27.1 169.3
254 DEPARTMENT OF FISHERIES
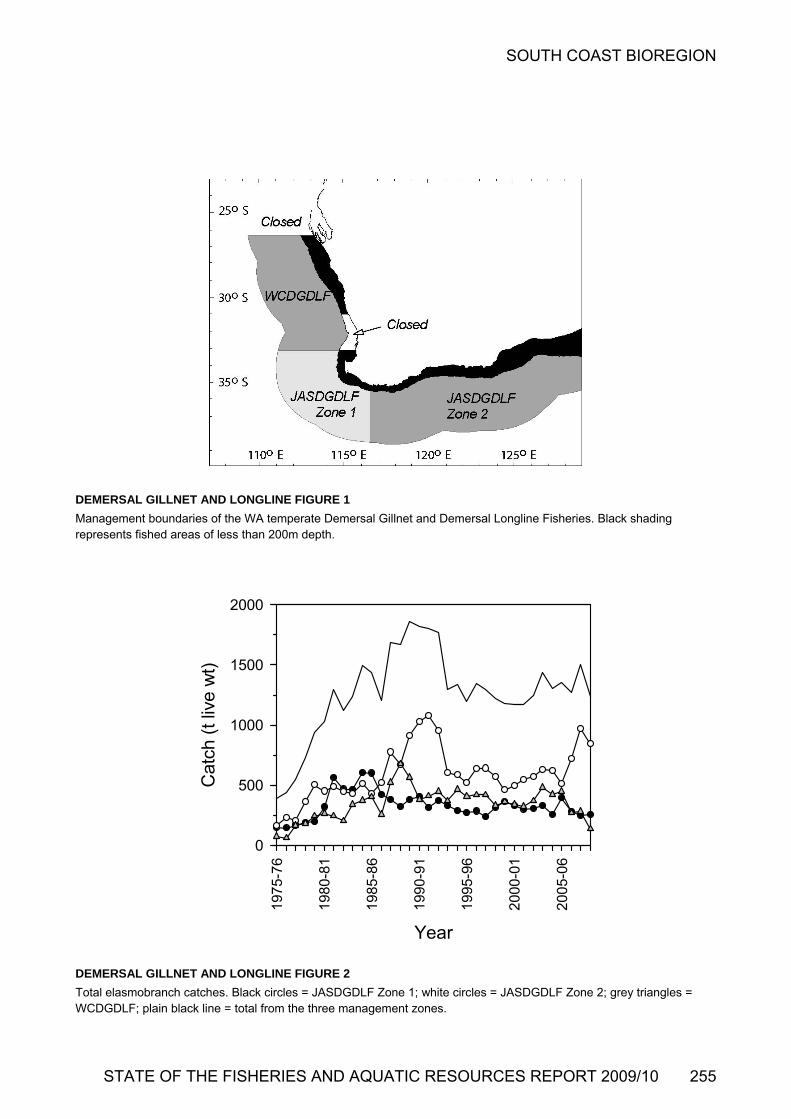
SOUTH COAST BIOREGION
DEMERSAL GILLNET AND LONGLINE FIGURE 1
Management boundaries of the WA temperate Demersal Gillnet and Demersal Longline Fisheries. Black shading represents fished areas of less than 200m depth.
Year
197
5-76
198
0-81
198
5-86
199
0-91
199
5-96
200
0-01
200
5-06
Cat
ch (
t liv
e w
t)
0
500
1000
1500
2000
DEMERSAL GILLNET AND LONGLINE FIGURE 2
Total elasmobranch catches. Black circles = JASDGDLF Zone 1; white circles = JASDGDLF Zone 2; grey triangles = WCDGDLF; plain black line = total from the three management zones.
STATE OF THE FISHERIES AND AQUATIC RESOURCES REPORT 2009/10 255

SOUTH COAST BIOREGION
Year
19
75-7
6
19
80-8
1
19
85-8
6
19
90-9
1
19
95-9
6
20
00-0
1
20
05-0
6
Ca
tch
(t l
ive
wt)
0
200
400
600
800
DEMERSAL GILLNET AND LONGLINE FIGURE 3
Shark indicator species catches (all management zones).Solid black line = gummy shark; dashed black line = dusky shark; solid grey line = whiskery shark; dashed grey line = sandbar shark.
Year
1975
-76
1980
-81
1985
-86
1990
-91
1995
-96
2000
-01
2005
-06
Catc
h (
t liv
e w
t)
0
100
200
300
400
DEMERSAL GILLNET AND LONGLINE FIGURE 4
Total scalefish catch. Black circles = JASDGDLF Zone 1; white circles = JASDGDLF Zone 2; grey triangles = WCDGDLF; plain black line = total from the three management zones. Catches prior to 1989/90 cannot be distinguished from other gillnet and longline catches and have been omitted.
256 DEPARTMENT OF FISHERIES

SOUTH COAST BIOREGION
STATE OF THE FISHERIES AND AQUATIC RESOURCES REPORT 2009/10 257
Year
19
75
-76
19
80
-81
19
85
-86
19
90
-91
19
95
-96
20
00
-01
20
05
-06
Effort
(km
gn h
r x1
000
0
100
200
300
400
500
DEMERSAL GILLNET AND LONGLINE FIGURE 5
Standardised demersal gillnet and demersal longline effort. Black circles = JASDGDLF Zone 1; white circles = JASDGDLF Zone 2; Grey triangles = WCDGDLF and plain black line = total of the three management zones.
Year
197
5-76
198
0-81
198
5-86
199
0-91
199
5-96
200
0-01
200
5-06
CP
UE
(kg
/km
gn
hr)
0
2
4
6
8
DEMERSAL GILLNET AND LONGLINE FIGURE 6
Gummy shark effective CPUE. Black line = ratio of the means estimates; grey line = mean of the ratios estimates.

SOUTH COAST BIOREGION
Year
1975
-76
1980
-81
1985
-86
1990
-91
1995
-96
2000
-01
2005
-06
CP
UE
(kg
/km
gn
hr)
0
1
2
3
4
DEMERSAL GILLNET AND LONGLINE FIGURE 7
Dusky shark effective CPUE. Black line = ratio of the means estimates; grey line = mean of the ratios estimates.
Year
197
5-76
198
0-81
198
5-86
199
0-91
199
5-96
200
0-01
200
5-06
CP
UE
(kg
/km
gn
hr
0
1
2
3
4
5
6
DEMERSAL GILLNET AND LONGLINE FIGURE 8
Dusky shark effective CPUE. Black line = ratio of the means estimates; grey line = mean of the ratios estimates.
258 DEPARTMENT OF FISHERIES
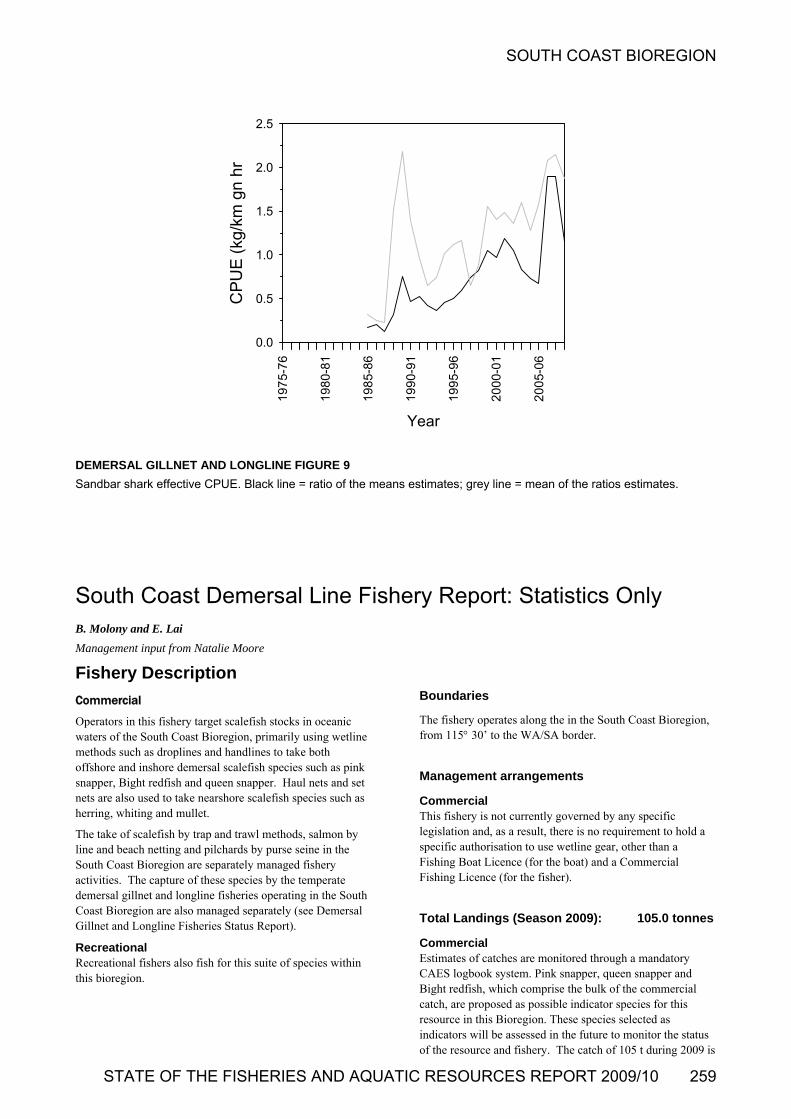
SOUTH COAST BIOREGION
Year
19
75-
76
19
80-
81
19
85-
86
19
90-
91
19
95-
96
20
00-
01
20
05-
06
CP
UE
(kg
/km
gn
hr
0.0
0.5
1.0
1.5
2.0
2.5
DEMERSAL GILLNET AND LONGLINE FIGURE 9
Sandbar shark effective CPUE. Black line = ratio of the means estimates; grey line = mean of the ratios estimates.
South Coast Demersal Line Fishery Report: Statistics Only B. Molony and E. Lai
Management input from Natalie Moore
Fishery Description
Commercial
Operators in this fishery target scalefish stocks in oceanic waters of the South Coast Bioregion, primarily using wetline methods such as droplines and handlines to take both offshore and inshore demersal scalefish species such as pink snapper, Bight redfish and queen snapper. Haul nets and set nets are also used to take nearshore scalefish species such as herring, whiting and mullet.
The take of scalefish by trap and trawl methods, salmon by line and beach netting and pilchards by purse seine in the South Coast Bioregion are separately managed fishery activities. The capture of these species by the temperate demersal gillnet and longline fisheries operating in the South Coast Bioregion are also managed separately (see Demersal Gillnet and Longline Fisheries Status Report).
Recreational Recreational fishers also fish for this suite of species within this bioregion.
Boundaries
The fishery operates along the in the South Coast Bioregion, from 115 30’ to the WA/SA border.
Management arrangements
Commercial This fishery is not currently governed by any specific legislation and, as a result, there is no requirement to hold a specific authorisation to use wetline gear, other than a Fishing Boat Licence (for the boat) and a Commercial Fishing Licence (for the fisher).
Total Landings (Season 2009): 105.0 tonnes
Commercial Estimates of catches are monitored through a mandatory CAES logbook system. Pink snapper, queen snapper and Bight redfish, which comprise the bulk of the commercial catch, are proposed as possible indicator species for this resource in this Bioregion. These species selected as indicators will be assessed in the future to monitor the status of the resource and fishery. The catch of 105 t during 2009 is
STATE OF THE FISHERIES AND AQUATIC RESOURCES REPORT 2009/10 259

SOUTH COAST BIOREGION
similar the catch levels taken in the previous 8 years during which time the catches have fluctuated between 85 t and 145 t (South Coast Wetline Figure 1). The slightly lower catch reported in 2009 may be due to some catches being allocated to the West Coast Bioregion as a result of recent management and boundary changes.
Recreational Estimates of recreational catches are unavailable at this time. New recreational arrangements may result in broad estimates being available in the future.
Fishery Governance Target commercial catch range: Not available
This is the first year of separately reporting these catches in a stand alone report and a formal catch range has not been developed. Given that the last years catch falls within the 85 t -145 t catch ranges seen during the past decade there is no immediate concerns, however, the catch levels in future years will be monitored closely given changes to other fisheries (see below).
Current Fishing (or Effort) Level Not available
This fishery is likely to undergo review in the near future. An interim catch range will be included next year.
New management initiatives (2010/2011)
Since January 2008, there has been a substantial risk of shifts in effort and resultant increases in catches of scalefish off the south coast following the introduction of the West Coast Demersal Scalefish (Interim) Management Plan 2007 and recent reductions in effort applied to the West Coast Rock Lobster Managed Fishery.
In the absence of assessments of demersal scalefish stocks off the south coast such as pink snapper, queen snapper and Bight redfish, a potential increase in fishing mortality may increase the risks to unacceptable levels. Furthermore, recent data suggests that hapuku stocks off the south coast are possibly being overfished.
The nearshore species targeted by open access inshore (oceanic) netters are also vulnerable and the recent increase in this activity has led to resource sharing and user group conflict.
The Department will continue to monitor the fishery and may develop more formal management arrangements for wetline fishing off the south coast should a isgnificant increase in effort and catch occur. These arrangements will aim to restrict effort and catches of demersal scalefish and may help to address social issues such as easing the conflict between users that share the inshore scalefish resource.
AQUACULTURE Regional Research and Development Overview
Abalone is considered a key species for aquaculture development on the south coast of WA.
The future expansion of an abalone farm near Bremer Bay will be subject to the development of a biosecurity plan, which the proponent is developing with input by the Department of Fisheries.
The Department of Fisheries has approved an application for an offshore abalone farm near Augusta, which is linked to a proposed land-based hatchery. The operator is currently undertaking trials to assess abalone growth and survival in the offshore production system.
The Department of Fisheries is close to releasing a new Abalone Aquaculture Policy, which was developed in consultation with the wild-capture and aquaculture industry sectors. The Department continues to closely monitor an abalone disease outbreak off the coast of Victoria and has implemented measures to prevent the entry of the virus into Western Australia.
The Department of Fisheries is also reviewing licensing and leasing arrangements for the mussel industry on the south coast.
260 DEPARTMENT OF FISHERIES
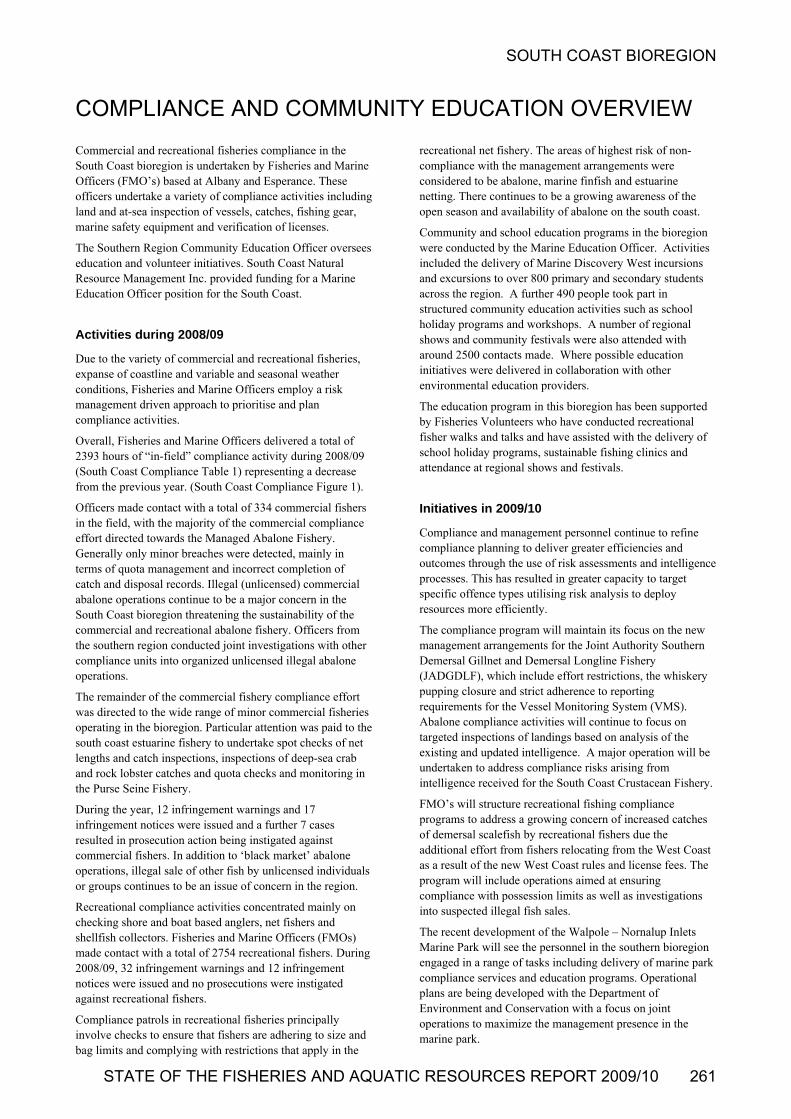
SOUTH COAST BIOREGION
STATE OF THE FISHERIES AND AQUATIC RESOURCES REPORT 2009/10 261
COMPLIANCE AND COMMUNITY EDUCATION OVERVIEW
Commercial and recreational fisheries compliance in the South Coast bioregion is undertaken by Fisheries and Marine Officers (FMO’s) based at Albany and Esperance. These officers undertake a variety of compliance activities including land and at-sea inspection of vessels, catches, fishing gear, marine safety equipment and verification of licenses.
The Southern Region Community Education Officer oversees education and volunteer initiatives. South Coast Natural Resource Management Inc. provided funding for a Marine Education Officer position for the South Coast.
Activities during 2008/09
Due to the variety of commercial and recreational fisheries, expanse of coastline and variable and seasonal weather conditions, Fisheries and Marine Officers employ a risk management driven approach to prioritise and plan compliance activities.
Overall, Fisheries and Marine Officers delivered a total of 2393 hours of “in-field” compliance activity during 2008/09 (South Coast Compliance Table 1) representing a decrease from the previous year. (South Coast Compliance Figure 1).
Officers made contact with a total of 334 commercial fishers in the field, with the majority of the commercial compliance effort directed towards the Managed Abalone Fishery. Generally only minor breaches were detected, mainly in terms of quota management and incorrect completion of catch and disposal records. Illegal (unlicensed) commercial abalone operations continue to be a major concern in the South Coast bioregion threatening the sustainability of the commercial and recreational abalone fishery. Officers from the southern region conducted joint investigations with other compliance units into organized unlicensed illegal abalone operations.
The remainder of the commercial fishery compliance effort was directed to the wide range of minor commercial fisheries operating in the bioregion. Particular attention was paid to the south coast estuarine fishery to undertake spot checks of net lengths and catch inspections, inspections of deep-sea crab and rock lobster catches and quota checks and monitoring in the Purse Seine Fishery.
During the year, 12 infringement warnings and 17 infringement notices were issued and a further 7 cases resulted in prosecution action being instigated against commercial fishers. In addition to ‘black market’ abalone operations, illegal sale of other fish by unlicensed individuals or groups continues to be an issue of concern in the region.
Recreational compliance activities concentrated mainly on checking shore and boat based anglers, net fishers and shellfish collectors. Fisheries and Marine Officers (FMOs) made contact with a total of 2754 recreational fishers. During 2008/09, 32 infringement warnings and 12 infringement notices were issued and no prosecutions were instigated against recreational fishers.
Compliance patrols in recreational fisheries principally involve checks to ensure that fishers are adhering to size and bag limits and complying with restrictions that apply in the
recreational net fishery. The areas of highest risk of non-compliance with the management arrangements were considered to be abalone, marine finfish and estuarine netting. There continues to be a growing awareness of the open season and availability of abalone on the south coast.
Community and school education programs in the bioregion were conducted by the Marine Education Officer. Activities included the delivery of Marine Discovery West incursions and excursions to over 800 primary and secondary students across the region. A further 490 people took part in structured community education activities such as school holiday programs and workshops. A number of regional shows and community festivals were also attended with around 2500 contacts made. Where possible education initiatives were delivered in collaboration with other environmental education providers.
The education program in this bioregion has been supported by Fisheries Volunteers who have conducted recreational fisher walks and talks and have assisted with the delivery of school holiday programs, sustainable fishing clinics and attendance at regional shows and festivals.
Initiatives in 2009/10
Compliance and management personnel continue to refine compliance planning to deliver greater efficiencies and outcomes through the use of risk assessments and intelligence processes. This has resulted in greater capacity to target specific offence types utilising risk analysis to deploy resources more efficiently.
The compliance program will maintain its focus on the new management arrangements for the Joint Authority Southern Demersal Gillnet and Demersal Longline Fishery (JADGDLF), which include effort restrictions, the whiskery pupping closure and strict adherence to reporting requirements for the Vessel Monitoring System (VMS). Abalone compliance activities will continue to focus on targeted inspections of landings based on analysis of the existing and updated intelligence. A major operation will be undertaken to address compliance risks arising from intelligence received for the South Coast Crustacean Fishery.
FMO’s will structure recreational fishing compliance programs to address a growing concern of increased catches of demersal scalefish by recreational fishers due the additional effort from fishers relocating from the West Coast as a result of the new West Coast rules and license fees. The program will include operations aimed at ensuring compliance with possession limits as well as investigations into suspected illegal fish sales.
The recent development of the Walpole – Nornalup Inlets Marine Park will see the personnel in the southern bioregion engaged in a range of tasks including delivery of marine park compliance services and education programs. Operational plans are being developed with the Department of Environment and Conservation with a focus on joint operations to maximize the management presence in the marine park.

SOUTH COAST BIOREGION
The marine education program for the south coast will continue to expand its presence in schools and build on existing networks within the wider community. The Marine education Officer will continue to work with other
departments and agencies to deliver a program that will incorporate the management initiatives for the Walpole-Nornalup Marine Park.
SOUTH COAST COMPLIANCE TABLE 1
Summary of compliance and educative contacts and detected offences within the South Coast bioregion during the 2008/09 financial year.
PATROL HOURS DELIVERED TO THE BIOREGION 2,393 Officer Hours
CONTACT WITH THE COMMERCIAL FISHING COMMUNITY
Field Contacts by Fisheries & Marine Officers 334
District Office contacts 256
Infringement warnings 12
Infringement notices 17
Prosecutions 7
CONTACT WITH THE RECREATIONAL FISHING COMMUNITY
Field Contacts by Fisheries & Marine Officers 2754
District Office contacts 667
Infringement warnings 32
Infringement notices 12
Prosecutions 0
OTHER FISHING-RELATED CONTACTS WITH THE COMMUNITY*
Field Contacts by Fisheries & Marine Officers 88
District Office contacts 280
Fishwatch reports**
*Contacts are classified according to the specific fishery, which is usually clearly delineated as being either commercial or recreational. The “Other” category is used where multiple fisheries are contacted and it is not possible to accurately classify the contacts into one specific fishery – typically, the majority of these contacts are recreational in nature (e.g. personal contacts in Marine Protected Areas), but contacts made in relation to fish kills, shark patrols and inspections of commercial fish wholesale and retail premises etc. are also included in this category.
**This represents the total number of Fishwatch reports, both commercial and recreational, since the service provider reporting mechanism cannot differentiate between sectors. It also includes any calls relating to the southern inland bioregion that were referred to Albany or Esperance District staff.
262 DEPARTMENT OF FISHERIES
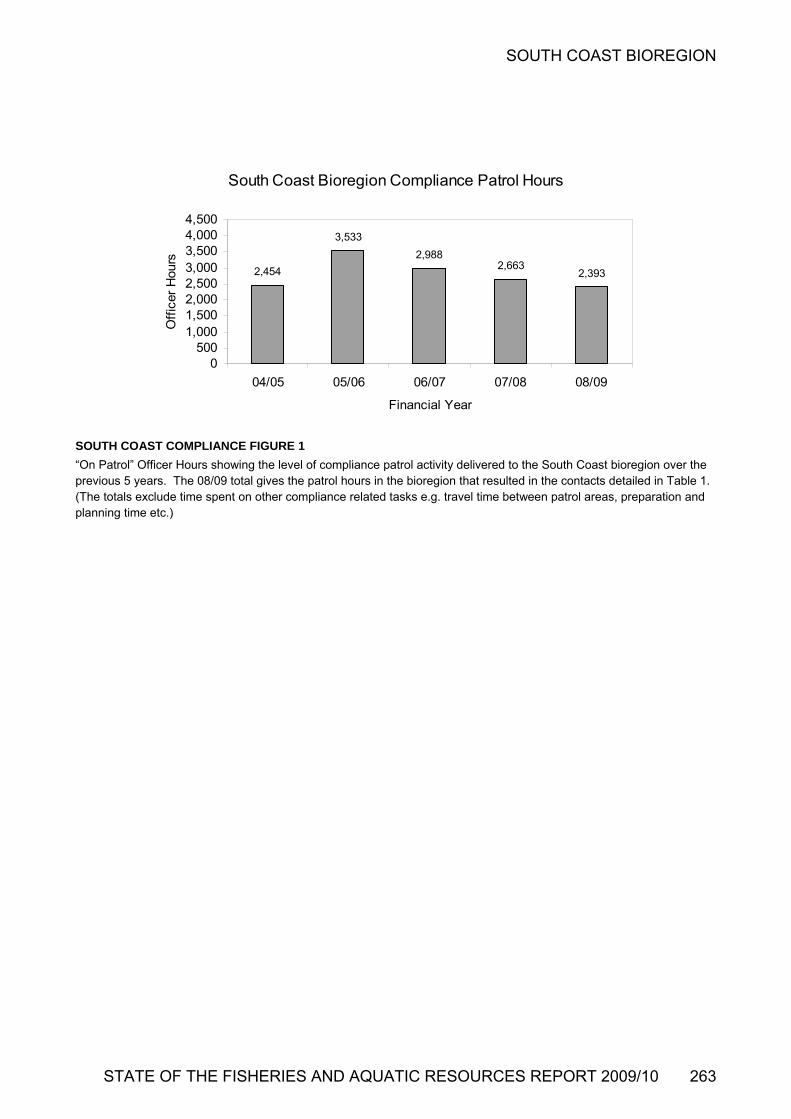
SOUTH COAST BIOREGION
South Coast Bioregion Compliance Patrol Hours
2,454
3,533
2,9882,663
2,393
0500
1,0001,5002,0002,5003,0003,5004,0004,500
04/05 05/06 06/07 07/08 08/09
Financial Year
Off
icer
Hou
rs
SOUTH COAST COMPLIANCE FIGURE 1
“On Patrol” Officer Hours showing the level of compliance patrol activity delivered to the South Coast bioregion over the previous 5 years. The 08/09 total gives the patrol hours in the bioregion that resulted in the contacts detailed in Table 1. (The totals exclude time spent on other compliance related tasks e.g. travel time between patrol areas, preparation and planning time etc.)
STATE OF THE FISHERIES AND AQUATIC RESOURCES REPORT 2009/10 263

NORTHERN INLAND BIOREGION ABOUT THE BIOREGION 265SUMMARY OF FISHING AND AQUACULTURE ACTIVITIES 265ECOSYSTEM MANAGEMENT 265ECOSYSTEM BASED FISHERIES MANAGEMENT 265FISHERIES 267AQUACULTURE 269COMPLIANCE AND COMMUNITY EDUCATION 269
264 DEPARTMENT OF FISHERIES

NORTHERN INLAND BIOREGION
NORTHERN INLAND BIOREGION
ABOUT THE BIOREGION
The Northern Inland bioregion, encompassing the northern half of Western Australia, is predominantly a desert area, with few permanent water bodies. As a result of occasional summer cyclones, the various river systems flow at flood levels for short periods before drying-out to residual waterholes. The only exceptions to this are man-made dams, which trap rainfall for water supply purposes and irrigation.
The only significant fishable water body in the region is Lake Argyle, created by the damming the Ord River. The continuous release of water from the dam has resulted in the Ord River maintaining its freshwater fish populations year-round, as does the lake, where some freshwater native fish populations have expanded.
Populations of reptiles, such as the protected freshwater crocodile, are also supported by the expanded food chain of native fish, and are thought to have increased significantly from their original billabong-based populations.
SUMMARY OF FISHING AND AQUACULTURE ACTIVITIES
The creation of Lake Argyle has produced a unique inland aquatic environment which is now home to various fishing and tourism-related activities. The lake supports the State’s only commercial freshwater fishery – for the silver cobbler or catfish – together with a processing facility supplying predominantly Western Australian and interstate markets. The lake and its associated river system also support recreational fishing for the freshwater component of the barramundi stock and cherabin (freshwater prawns).
Aquaculture development operations in the region have previously included the production of barramundi from a cage operation in Lake Argyle, and a small but growing pond production of redclaw crayfish in the Ord River irrigation system around Kununurra.
ECOSYSTEM MANAGEMENT
As one of the key ecosystem risks is the introduction of non-endemic species, the Department has an approval process in place for assessing proposals to translocate live non-endemic fish species into and within Western Australia, so as to minimise the environmental risks to freshwater ecosystems associated with this activity.
ECOSYSTEM BASED FISHERIES MANAGEMENT
Identification of Ecological Assets using the EBFM framework
The Department is now implementing an Ecosystem Based Fisheries Management (EBFM) framework (see How to Use section for more details. In terms of ecological assets, the Department has recognised the following ecological values for the Northern Inland Bioregion:
Ecosystem structure and biodiversity;
Captured fish species
Protected species (direct impact – capture or interaction);
The full set of ecological assets identified for ongoing monitoring are presented in Northern Inland Ecosystem Management Figure 1
Riverine
Lakes
Ecosystems
Native Species
Exotics
Captured Species Protected Species
Northern Inland BioregionEcological Resources/Assets
NORTHERN INLAND ECOSYSTEM MANAGEMENT FIGURE 1
Component tree showing the ecological assets identified and separately assessed for the Northern Inland Bioregion
STATE OF THE FISHERIES AND AQUATIC RESOURCES REPORT 2009/10 265

NORTHERN INLAND BIOREGION
Risk Assessment of Regional Ecological Assets
The EBFM process identifies the ecological assets in a hierarchical manner such that the assets outlined Northern Inland Figure 1 are often made up of individual components at species or stock level. The risks to each of the individual stock or lower level components are mostly detailed in the individual fishery reports presented in this document. The following table (Northern Inland Ecosystem Management
Table 1) provides an overview and cumulative assessment of the current risks to the ecological assets of the Northern Inland Bioregion, at a bioregional level and provides a mechanism for reporting on their status and the fisheries management arrangements that are being applied. These bioregional level risks are now used by the Department as a key input into the Department’s Risk Register which, combined with an assessment of the economic and social values and risks associated with these assets, is integral for use in the annual planning cycle for assigning priorities for activities across all Divisions in this Bioregion.
NORTHERN INLAND ECOSYSTEM MANAGEMENT TABLE 1: RISK LEVELS FOR EACH ASSET.
Risk levels in this table are developed by combining the individual (lower level) elements that make up each of the higher level components. Low and Medium values are both considered to be acceptable levels of risk. High and Significant risks indicate that the asset is no longer in a condition that is considered appropriate and additional management actions are required. Where the value is followed by (non-fishing) this indicates that all, or the majority of the risk value, was not generated by fishing activities.
Ecosystem Structure and Biodiversity
Ecosystem Risk Status and Current Activities
Ecosystems LOW
(non fishing) Minimal threats and these would be due to non fishing activities
Captured fish species
Fish species Risk Status and Current Activities
Finfish Native LOW The stocks of freshwater fish are not under any material threat
Finfish Exotics LOW As above
Protected species
Protected fish Species Risk Status and Current Activities
species
Protected Species
Crocodiles LOW A small number of crocodiles have been reported captured in nets in Lake Argyle. The numbers are small and would not affect these stocks.
Summary of Monitoring and Assessment of Ecosystem Assets
The Department of Fisheries actively supports a number of studies into the native freshwater fish fauna and their habitats in northern river systems in conjunction with Murdoch University, the Department of Water and the Department of Environment
and Conservation, and through involvement with local natural resource management councils. New aquaculture ventures are also subject to strict environmental evaluation under the Department’s licensing and on-going arrangements, in conjunction with industry and TAFE.
The Department has introduced aquatic organism incursion and fish kill incident response programs in place.
266 DEPARTMENT OF FISHERIES
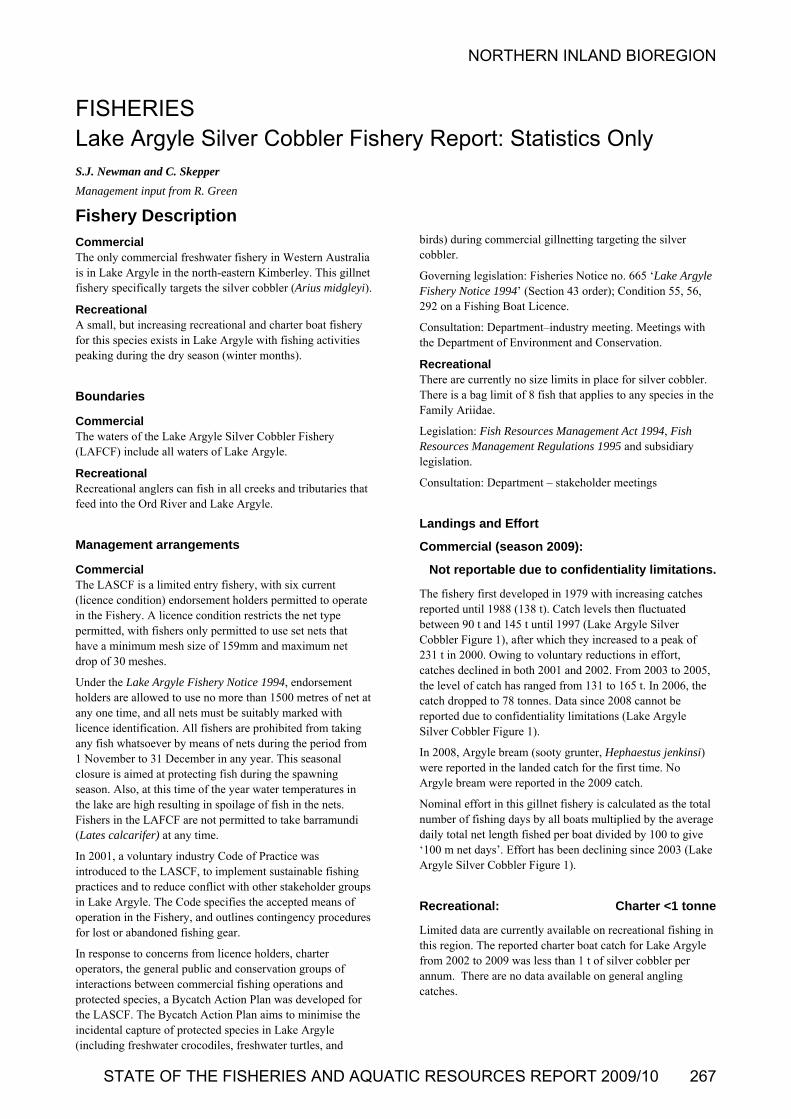
NORTHERN INLAND BIOREGION
FISHERIES Lake Argyle Silver Cobbler Fishery Report: Statistics Only S.J. Newman and C. Skepper
Management input from R. Green
Fishery Description
Commercial The only commercial freshwater fishery in Western Australia is in Lake Argyle in the north-eastern Kimberley. This gillnet fishery specifically targets the silver cobbler (Arius midgleyi).
Recreational A small, but increasing recreational and charter boat fishery for this species exists in Lake Argyle with fishing activities peaking during the dry season (winter months).
Boundaries
Commercial The waters of the Lake Argyle Silver Cobbler Fishery (LAFCF) include all waters of Lake Argyle.
Recreational Recreational anglers can fish in all creeks and tributaries that feed into the Ord River and Lake Argyle.
Management arrangements
Commercial The LASCF is a limited entry fishery, with six current (licence condition) endorsement holders permitted to operate in the Fishery. A licence condition restricts the net type permitted, with fishers only permitted to use set nets that have a minimum mesh size of 159mm and maximum net drop of 30 meshes.
Under the Lake Argyle Fishery Notice 1994, endorsement holders are allowed to use no more than 1500 metres of net at any one time, and all nets must be suitably marked with licence identification. All fishers are prohibited from taking any fish whatsoever by means of nets during the period from 1 November to 31 December in any year. This seasonal closure is aimed at protecting fish during the spawning season. Also, at this time of the year water temperatures in the lake are high resulting in spoilage of fish in the nets. Fishers in the LAFCF are not permitted to take barramundi (Lates calcarifer) at any time.
In 2001, a voluntary industry Code of Practice was introduced to the LASCF, to implement sustainable fishing practices and to reduce conflict with other stakeholder groups in Lake Argyle. The Code specifies the accepted means of operation in the Fishery, and outlines contingency procedures for lost or abandoned fishing gear.
In response to concerns from licence holders, charter operators, the general public and conservation groups of interactions between commercial fishing operations and protected species, a Bycatch Action Plan was developed for the LASCF. The Bycatch Action Plan aims to minimise the incidental capture of protected species in Lake Argyle (including freshwater crocodiles, freshwater turtles, and
birds) during commercial gillnetting targeting the silver cobbler.
Governing legislation: Fisheries Notice no. 665 ‘Lake Argyle Fishery Notice 1994’ (Section 43 order); Condition 55, 56, 292 on a Fishing Boat Licence.
Consultation: Department–industry meeting. Meetings with the Department of Environment and Conservation.
Recreational There are currently no size limits in place for silver cobbler. There is a bag limit of 8 fish that applies to any species in the Family Ariidae.
Legislation: Fish Resources Management Act 1994, Fish Resources Management Regulations 1995 and subsidiary legislation.
Consultation: Department – stakeholder meetings
Landings and Effort
Commercial (season 2009):
Not reportable due to confidentiality limitations.
The fishery first developed in 1979 with increasing catches reported until 1988 (138 t). Catch levels then fluctuated between 90 t and 145 t until 1997 (Lake Argyle Silver Cobbler Figure 1), after which they increased to a peak of 231 t in 2000. Owing to voluntary reductions in effort, catches declined in both 2001 and 2002. From 2003 to 2005, the level of catch has ranged from 131 to 165 t. In 2006, the catch dropped to 78 tonnes. Data since 2008 cannot be reported due to confidentiality limitations (Lake Argyle Silver Cobbler Figure 1).
In 2008, Argyle bream (sooty grunter, Hephaestus jenkinsi) were reported in the landed catch for the first time. No Argyle bream were reported in the 2009 catch.
Nominal effort in this gillnet fishery is calculated as the total number of fishing days by all boats multiplied by the average daily total net length fished per boat divided by 100 to give ‘100 m net days’. Effort has been declining since 2003 (Lake Argyle Silver Cobbler Figure 1).
Recreational: Charter <1 tonne
Limited data are currently available on recreational fishing in this region. The reported charter boat catch for Lake Argyle from 2002 to 2009 was less than 1 t of silver cobbler per annum. There are no data available on general angling catches.
STATE OF THE FISHERIES AND AQUATIC RESOURCES REPORT 2009/10 267
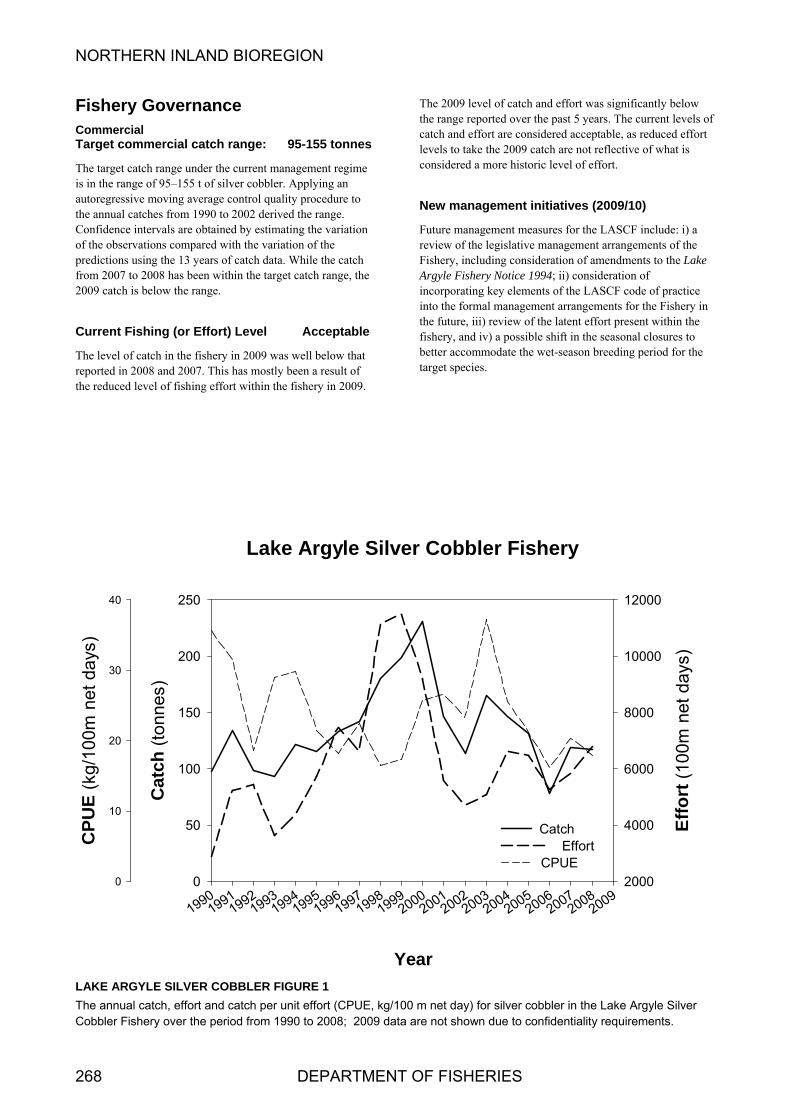
NORTHERN INLAND BIOREGION
268 DEPARTMENT OF FISHERIES
Fishery Governance Commercial Target commercial catch range: 95-155 tonnes
The target catch range under the current management regime is in the range of 95–155 t of silver cobbler. Applying an autoregressive moving average control quality procedure to the annual catches from 1990 to 2002 derived the range. Confidence intervals are obtained by estimating the variation of the observations compared with the variation of the predictions using the 13 years of catch data. While the catch from 2007 to 2008 has been within the target catch range, the 2009 catch is below the range.
Current Fishing (or Effort) Level Acceptable
The level of catch in the fishery in 2009 was well below that reported in 2008 and 2007. This has mostly been a result of the reduced level of fishing effort within the fishery in 2009.
The 2009 level of catch and effort was significantly below the range reported over the past 5 years. The current levels of catch and effort are considered acceptable, as reduced effort levels to take the 2009 catch are not reflective of what is considered a more historic level of effort.
New management initiatives (2009/10)
Future management measures for the LASCF include: i) a review of the legislative management arrangements of the Fishery, including consideration of amendments to the Lake Argyle Fishery Notice 1994; ii) consideration of incorporating key elements of the LASCF code of practice into the formal management arrangements for the Fishery in the future, iii) review of the latent effort present within the fishery, and iv) a possible shift in the seasonal closures to better accommodate the wet-season breeding period for the target species.
Lake Argyle Silver Cobbler Fishery
Year
19901991
19921993
19941995
19961997
19981999
20002001
20022003
20042005
20062007
20082009
Cat
ch (
tonn
es)
0
50
100
150
200
250
Eff
ort
(10
0m n
et d
ays)
2000
4000
6000
8000
10000
12000
CP
UE
(kg
/100
m n
et d
ays)
0
10
20
30
40
CatchEffort
CPUE
LAKE ARGYLE SILVER COBBLER FIGURE 1
The annual catch, effort and catch per unit effort (CPUE, kg/100 m net day) for silver cobbler in the Lake Argyle Silver Cobbler Fishery over the period from 1990 to 2008; 2009 data are not shown due to confidentiality requirements.

NORTHERN INLAND BIOREGION
AQUACULTURE Regional Research and Development Overview
The process to identify a site for providing for aquaculture around Lake Argyle as part of the implementation of the Ord Stage II final agreement is progressing slowly. The process is under way to issue an aquaculture lease in the Lake Argyle region for the Mirriuwung Gajjerong Aboriginal Corporation, in accordance with requirements for the Ord Stage II final agreement. An area will eventually be vested in the Minister
for aquaculture purposes. The lease was expected to be issued by the end of June 2008; however, the group has recently expressed its wish to consider an alternate site. The Department has also issued an Aquaculture Licence to allow the production of 500 tonnes per annum of barramundi in Lake Argyle; however, identifying a site suitable for land based support facilities has proved difficult.
COMPLIANCE & COMMUNITY EDUCATION
The Northern Inland bioregion includes the freshwater rivers, lakes, billabongs and wetlands primarily located in the Kimberley. Commercial fishing is permitted in Lake Argyle (man-made lake) and in the tidal area of the mouth of the lower Ord River.
Compliance and education for the freshwater systems in the North Inland bioregion focuses on:
translocation inspections of non-endemic freshwater species;
protected species interaction;
monitoring of introduced fish species;
aquaculture lease and licence compliance;
localised depletion of barramundi as a target recreational species;
cherabin catches; and
commercial Silver Cobbler fishery in Lake Argyle.
Patrols continue to focus on the Fitzroy and Ord Rivers, due to the large number of campers and fishers accessing the inland Kimberley rivers during the peak tourism period of May to October and the area-specific barramundi size and possession limit legislation. Both the Fitzroy River and the Ord River are identified as major breeding areas for barramundi.
Officers pay particular attention to catch of any protected sawfish species, disused recreational fishing gear and
localised impacts of fishers.
Activities during 2008/09
During 2008/09, Fisheries and Marine Officers (FMOs)
recorded 531 hours of active compliance patrol time in the Northern Inland bioregion – an increase compared to the previous year but aligned with historic levels of patrol activity (Northern Inland Compliance Patrol Hours Figure 1).
Across the Northern Inland bioregion, personal contact was made with 1299 fishers and non-fishers across the commercial, recreational and other sectors (Northern Inland Compliance Table 1). FMOs focused on freshwater fishing compliance in areas of known high visitation or local complaints regarding non-compliant netting.
Compliance and education was also undertaken in the Lake Argyle area, where FMOs inspected commercial silver cobbler fishers and aquaculture sites to ensure that compliance with management, protected species interaction and environmental objectives were being met.
Initiatives in 2009/10
Compliance service delivery will continue to target any areas of complaint and high levels of recreational fishing pressure. These locations are reviewed during annual risk-assessment processes.
Compliance activities relating to the only freshwater commercial fishery, which targets the Lake Argyle silver cobbler, will continue. The operators in this fishery are inspected to ensure that high levels of compliance and community confidence are maintained.
Improved levels of engagement with children in regional towns and remote Aboriginal communities are planned, through fishing clinics and school presentations promoting ‘fish for the future’ messages.
STATE OF THE FISHERIES AND AQUATIC RESOURCES REPORT 2009/10 269
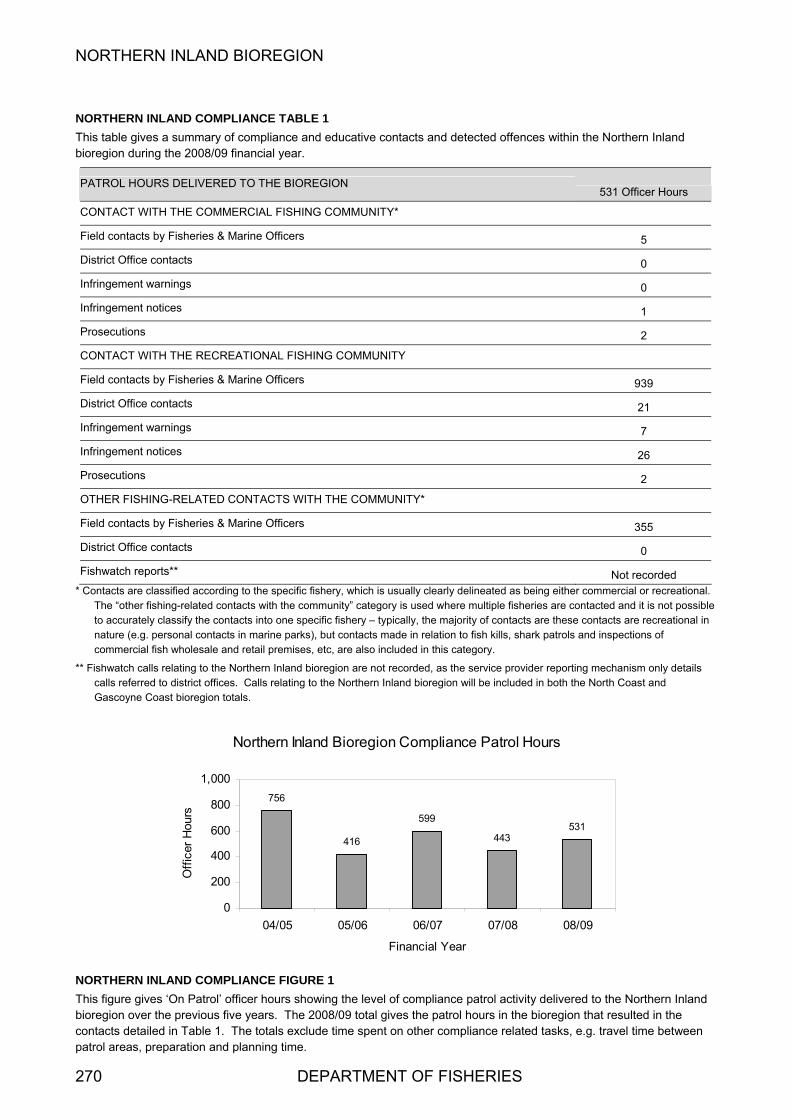
NORTHERN INLAND BIOREGION
NORTHERN INLAND COMPLIANCE TABLE 1 This table gives a summary of compliance and educative contacts and detected offences within the Northern Inland bioregion during the 2008/09 financial year.
PATROL HOURS DELIVERED TO THE BIOREGION 531 Officer Hours
CONTACT WITH THE COMMERCIAL FISHING COMMUNITY*
Field contacts by Fisheries & Marine Officers 5
District Office contacts 0
Infringement warnings 0
Infringement notices 1
Prosecutions 2
CONTACT WITH THE RECREATIONAL FISHING COMMUNITY
Field contacts by Fisheries & Marine Officers 939
District Office contacts 21
Infringement warnings 7
Infringement notices 26
Prosecutions 2
OTHER FISHING-RELATED CONTACTS WITH THE COMMUNITY*
Field contacts by Fisheries & Marine Officers 355
District Office contacts 0
Fishwatch reports** Not recorded * Contacts are classified according to the specific fishery, which is usually clearly delineated as being either commercial or recreational.
The “other fishing-related contacts with the community” category is used where multiple fisheries are contacted and it is not possible to accurately classify the contacts into one specific fishery – typically, the majority of contacts are these contacts are recreational in nature (e.g. personal contacts in marine parks), but contacts made in relation to fish kills, shark patrols and inspections of commercial fish wholesale and retail premises, etc, are also included in this category.
** Fishwatch calls relating to the Northern Inland bioregion are not recorded, as the service provider reporting mechanism only details calls referred to district offices. Calls relating to the Northern Inland bioregion will be included in both the North Coast and Gascoyne Coast bioregion totals.
Northern Inland Bioregion Compliance Patrol Hours
756
416
599
443531
0
200
400
600
800
1,000
04/05 05/06 06/07 07/08 08/09
Financial Year
Off
icer
Hou
rs
AND COMPLIANCE FIGURE 1 NORTHERN INL
This figure gives ‘On Patrol’ officer hours showing the level of compliance patrol activity delivered to the Northern Inland bioregion over the previous five years. The 2008/09 total gives the patrol hours in the bioregion that resulted in the contacts detailed in Table 1. The totals exclude time spent on other compliance related tasks, e.g. travel time between patrol areas, preparation and planning time.
270 DEPARTMENT OF FISHERIES

SOUTHERN INLAND BIOREGION ABOUT THE BIOREGION 272SUMMARY OF FISHING AND AQUACULTURE ACTIVITIES 272ECOSYSTEM MANAGEMENT 272ECOSYSTEM BASED FISHERIES MANAGEMENT 272FISHERIES 275AQUACULTURE 276COMPLIANCE AND COMMUNITY EDUCATION 277
STATE OF THE FISHERIES AND AQUATIC RESOURCES REPORT 2009/10 271
SOUTHERN INLAND BIOREGION
SOUTHERN INLAND BIOREGION
ABOUT THE BIOREGION
This region contains WA’s only natural permanent freshwater rivers, which are fed by rainfall through winter and spring. These permanent rivers are restricted to the high-rainfall south-west corner of the State and flow through the significant native forest areas. Some of the rivers are more saline in their upper reaches owing to the effects of agricultural clearing of native vegetation in more inland areas.
Across the remainder of the Southern Inland bioregion, rivers flow primarily during the 3 months of winter rainfall, with very occasional summer flows from inland rain-bearing depressions resulting from decaying cyclones. Most large fresh water bodies are man-made irrigation, water supply or stock-feeding dams. There is a diverse variety of natural water bodies in this region ranging from numerous small springs and billabongs, up to Lake Jasper, the largest permanent freshwater Lake in the south west region, with 440 ha of open water up to 10 m deep. In combination these diverse natural and man-made permanent waterbodies provide valuable habitat for fish and freshwater crustaceans during the summer months. Some natural salt lakes also occur but generally dry out over summer each year.
The few natural freshwater rivers and man-made lakes support a small native fish fauna and create an environment, particularly in forest areas, which is highly valued by the community for a variety of recreational pursuits.
SUMMARY OF FISHING AND AQUACULTURE ACTIVITIES
While there are no commercial fisheries in the Southern Inland bioregion, it provides significant recreational fishing opportunities. The major species fished recreationally are native marron, trout (both rainbow and brown trout) stocked by the Department of Fisheries into public dams and rivers, and feral redfin perch, an introduced, self-perpetuating stock. The native freshwater cobbler is also taken in small numbers, as are black bream artificially stocked into some inland impoundments.
Aquaculture development in the Southern Inland bioregion is dominated by the farm-dam production of yabbies, which can reach about 200 t annually depending on rainfall and market demand. Semi-intensive culture of marron in purpose-built pond systems provides around 60 t per year and has the potential to expand significantly.
Trout have historically been the mainstay of finfish aquaculture production in this region, originating from heat-tolerant stock maintained at the Department’s Pemberton
Freshwater Research Centre. Silver perch are also grown in purpose-built ponds to supply local markets.
ECOSYSTEM MANAGEMENT
The conservation of the 13 species of freshwater native fish in freshwater ecosystems in the south-west of WA is a growing issue for the Department of Fisheries. Many of these species are endemic to WA, and under pressure through increasing salinity, feral fish populations, infrastructure (bridges and dams) and adjacent land-use development.
The Department works with representatives from the Department of Water and the Department of Environment and Conservation, to facilitate information exchange and identify research projects and associated funding sources to mitigate environmental impacts and so better protect native fish species.
The Department also has an approval process in place for assessing proposals to translocate live non-endemic fish species into and within Western Australia, so as to minimise the environmental risks to freshwater ecosystems associated with this activity.
ECOSYSTEM BASED FISHERIES MANAGEMENT Identification of Ecological Assets using the EBFM framework
The Department is now implementing an Ecosystem Based Fisheries Management (EBFM) framework (see How to Use section for more details). In terms of ecological assets, the Department has recognised the following ecological values for the Southern Inland Bioregion:
Ecosystem structure and biodiversity;
Captured fish species
Protected species (direct impact – capture or interaction);
External Drivers
The full set of ecological assets identified for ongoing monitoring are presented in Southern Inland Ecosystem Management Figure 1
272 DEPARTMENT OF FISHERIES
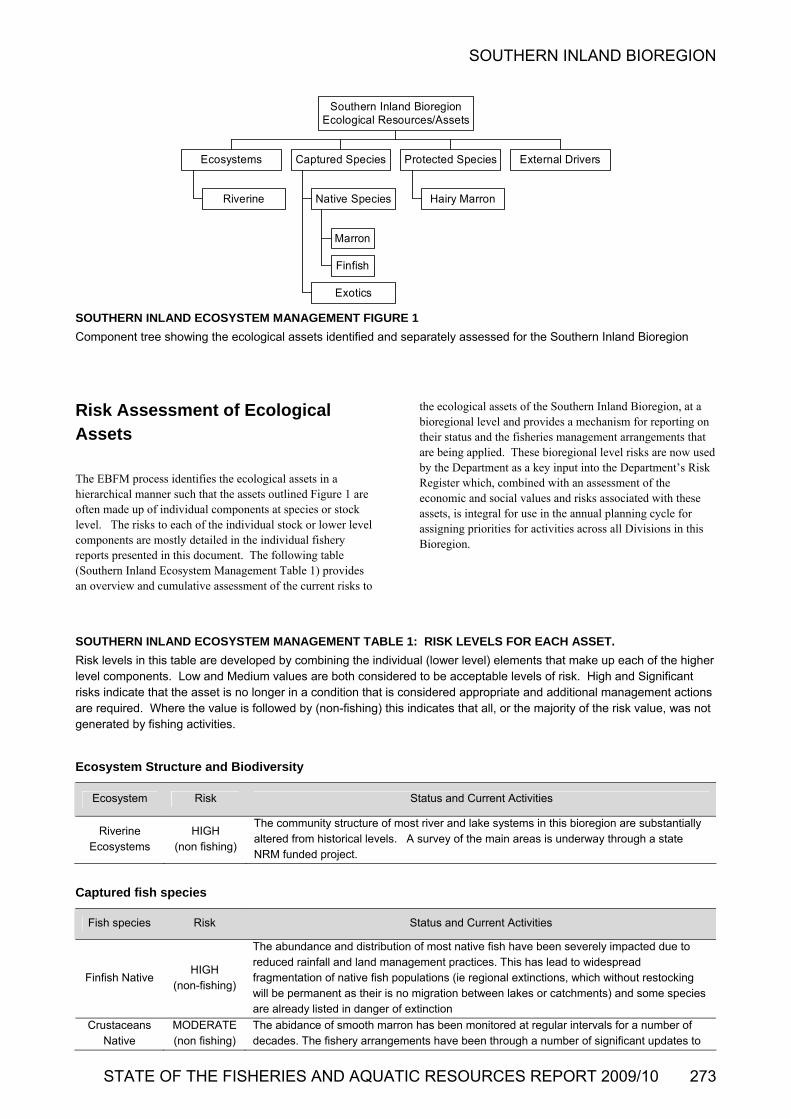
SOUTHERN INLAND BIOREGION
STATE OF THE FISHERIES AND AQUATIC RESOURCES REPORT 2009/10 273
Riverine
Ecosystems
Marron
Finfish
Native Species
Exotics
Captured Species
Hairy Marron
Protected Species External Drivers
Southern Inland BioregionEcological Resources/Assets
SOUTHERN INLAND ECOSYSTEM MANAGEMENT FIGURE 1
Component tree showing the ecological assets identified and separately assessed for the Southern Inland Bioregion
Risk Assessment of Ecological Assets
The EBFM process identifies the ecological assets in a hierarchical manner such that the assets outlined Figure 1 are often made up of individual components at species or stock level. The risks to each of the individual stock or lower level components are mostly detailed in the individual fishery reports presented in this document. The following table (Southern Inland Ecosystem Management Table 1) provides an overview and cumulative assessment of the current risks to
the ecological assets of the Southern Inland Bioregion, at a bioregional level and provides a mechanism for reporting on their status and the fisheries management arrangements that are being applied. These bioregional level risks are now used by the Department as a key input into the Department’s Risk Register which, combined with an assessment of the economic and social values and risks associated with these assets, is integral for use in the annual planning cycle for assigning priorities for activities across all Divisions in this Bioregion.
SOUTHERN INLAND ECOSYSTEM MANAGEMENT TABLE 1: RISK LEVELS FOR EACH ASSET.
Risk levels in this table are developed by combining the individual (lower level) elements that make up each of the higher level components. Low and Medium values are both considered to be acceptable levels of risk. High and Significant risks indicate that the asset is no longer in a condition that is considered appropriate and additional management actions are required. Where the value is followed by (non-fishing) this indicates that all, or the majority of the risk value, was not generated by fishing activities.
Ecosystem Structure and Biodiversity
Ecosystem Risk Status and Current Activities
Riverine Ecosystems
HIGH (non fishing)
The community structure of most river and lake systems in this bioregion are substantially altered from historical levels. A survey of the main areas is underway through a state NRM funded project.
Captured fish species
Fish species Risk Status and Current Activities
Finfish Native HIGH
(non-fishing)
The abundance and distribution of most native fish have been severely impacted due to reduced rainfall and land management practices. This has lead to widespread fragmentation of native fish populations (ie regional extinctions, which without restocking will be permanent as their is no migration between lakes or catchments) and some species are already listed in danger of extinction
Crustaceans Native
MODERATE (non fishing)
The abidance of smooth marron has been monitored at regular intervals for a number of decades. The fishery arrangements have been through a number of significant updates to
SOUTHERN INLAND BIOREGION
Fish species Risk Status and Current Activities
ensure that the catch is sustainable. The biggest threat to these stocks is from non fishing causes.
Exotics (Stocked)
MODERATE Trout have been stocked into a limited number of streams in WA for decades. The trout are produced from the Pemberton Hatchery and are heat tolerant.
Protected species
Protected fish Species Risk Status and Current Activities
species
Protected Species
Hairy Marron Western Minnow
(non fishing)
SIGNIFICANT There is a monitoring and restoration program for hairy marron and there is a captive breeding program for endangered finfish (see details below)
External Drivers (non fishing)
Summary of Monitoring and Assessment of Ecosystem Assets
Researchers from the Biodiversity and Biosecurity Branch are involved in several research projects related to freshwater biodiversity and conservation. One of these projects has been monitoring and assisting the restoration of hairy marron (freshwater crayfish) populations in the Margaret River. The critically endangered hairy marron (freshwater crayfish) is endemic to the Margaret River. However, the common, wide-spread smooth marron was accidentally introduced to the lower reaches of the river in the early 1980s. Over time, smooth marron have replaced hairy marron, first from the lower reaches (in the 1980s), then the middle reaches (in the 1990s) and at present hairy marron are only found in significant number in the upper reaches, but together with smooth marron.
Hairy crossed with smooth marron hybrids are common in the upper reaches of the Margaret River and the hybrids are fertile and appear to have similar ecological fitness. The displacement of hairy marron by smooth marron is most likely driven by hybridization of what appear to have been two geographically distinct sub-species. Maintaining populations of hairy marron in the upper reaches of the Margaret River is vital for the conservation of the sub-species and will require ongoing removal of smooth marron in combination with re-stocking pure hairy marron from the captive breeding program.
In 2005 The Department of Fisheries was successful in obtaining a grant from the SWCC (South West Catchments Council) to collect “hairy” marron from the wild and establish a breeding program to save this rare species from extinction.
DNA fingerprinting was developed in collaboration with UWA to distinguish between pure “hairy” marron and hybrids. The DNA testing identified 230 pure “hairy” marron that were transferred to the Department of Fisheries Pemberton Freshwater
Research Centre (PFRC) to establish a genetic repository of this critically endangered species. The breeding program has been very successful and has now progressed to the stage where sufficient “hairy” marron have been produced to permit restocking of the Margaret River with this critically endangered species. This will re-establish this species in its natural environment and prevent its extinction.
A different project funded by the Swan-Canning Research and Innovation Program (SCRIP) is aimed at determining the invasive potential of the feral cichlid (Geophagus brasiliensis) in Bennet Brook, a tributary of the Swan River. Recent salinity tolerance trails showed that this feral cichlid can easily cope with high salinities (>20 PPT). These results suggest that this feral cichlid could spread more widely throughout the Swan catchment in the future, posing a serious threat to native fish.
Most freshwater fish species are no longer present in large areas of their original range and some have been listed as critically endangered (e.g. Western trout minnow Galaxias truttaceus hesperius, and Margaret River marron Cherax cainii). While others have been listed as vulnerable to extinction (e.g. Balston’s pygmy perch Nannatherina balstoni). This has resulted in a reduced abundance and distribution of many species in lakes, rivers and streams in the southwest bioregion.
The Department has therefore established a captive breeding program for the most critically endangered and vulnerable species at its Pemberton Freshwater Research Centre and Aquaculture and Native Fish Breeding Laboratory at the UWA Field Station Shenton Park (See Appendix 4). The project aims to: i) prevent extinction of endangered species by establishing living gene banks at research facilities; ii) develop techniques to breed endangered native fish and crustaceans; iii) produce endemic species suitable for restocking natural water bodies; iv) address human health concerns (e.g. Ross River virus) by restocking wetlands with native fish species that control mosquito populations.
External Drivers Risk Status and Current Activities
Pests and Diseases
HIGH
A high number of exotic fish species have been released into the south west catchments. There is an assessment program underway to determine the extent of this and which of these events can be addressed by eradication.
274 DEPARTMENT OF FISHERIES

SOUTHERN INLAND BIOREGION
FISHERIES Licensed Recreational Marron Fishery Report: Statistics Only Prepared by N.Sumner
Management input by Nathan Harrison
Fishery Description Marron are endemic to Western Australia and are the third largest crayfish in the world. Recreational fishing occurs in freshwater dams and rivers throughout the southern part of the State extending from as far north as Geraldton, to Esperance in the east. Fishers may only use legal scoop nets, drop nets or snares to take marron.
Boundaries
The recreational marron fishery extends from the Hutt River north of Geraldton to waters near Esperance. The fishery operates in both freshwater dams and rivers although access to drinking water supply dams servicing the Perth metropolitan area and southwest regional centres are closed to the public by the Water Corporation.
Management arrangements
This fishery is managed through input controls of licences, closed seasons and gear restrictions, and the output controls of size and bag limits (see http://www fish.wa.gov.au/).
All marron fishers require a special marron recreational fishing licence. Licensed fishers were permitted to fish for marron from 26th January to 18th February 2009. Three types of legal gear exist; scoop nets, drop nets and snares. In most waters there is a minimum size of 80 mm carapace length and a bag limit of 10 marron per day. However, Harvey Dam, Waroona Dam and Hutt River are managed as ‘Trophy Waters’ with a minimum legal size 90 mm carapace length and a daily bag limit and possession limit of 5 marron.
Landings and effort
Commercial component: Nil
Recreational catch estimate
(season 2009) 102,900 marron
The total catch for the 2009 season was estimated at approximately 102,900 ± 9,400 standard error (SE) marron or 30.6 ± 2.8 tonnes of marron (average weight marron 297g, based on logbook data). This is an increase (~100%) compared to the previous season (2008: 47,400 ± 4,400 marron or 14.1 ± 1.3 tonnes). The catch for 2009 is closer to the catch of 69,900 ± 6,900 marron or 20.8 ± 2.1 tonnes taken during 2007. The increase in catch in numbers is due to a increase in effort and increase in catch rate. The catch for 2009 is within the target catch range (see Fishery Governance below).
The overall CPUE (dams and rivers combined) recorded by fishers, based on phone surveys, was 4.0 marron per fisher per day. This is higher than the CPUE for the previous
season of 3.4 marron per fisher per day.
Note that the change in minimum legal size from 76 to 80 mm RCL during the 2007 season significantly increased the long-term, stable average weight of retained marron from 230g (1971-2006) to 300g in 2007.
Total effort for the 2009 season was estimated from phone surveys at around 25,700 days. Fishing effort significantly increased (~84%) compared to the previous season of 14,000 days. This increase was due to a increase (~69%) in the number of participating licensed fishers from 5,200 in 2008 to 8,800 in 2009. The average number of fishing days per fishermen increased slightly from 2.7 in 2008 to 2.9 during 2009. The season length was 23 days in 2007 and 2008. The season increased to 29 days in 2009. The effort for 2009 is closer to the effort of 20,300 days for the 2007 season.
The proportion of effort allocated to dams (~30%) and rivers (~70%) has remained stable between 2000 and 2009. Harvey and Wellington dams receive by far the most fishing effort, with Harvey Dam being the most popular dam since 2005. Effort is more widely spread among the rivers in the South-West. The Blackwood River is the most popular site (~25% effort) followed by the Warren River (~15%). The Collie, Murray, Preston and Donnelly all received similar amount of effort of around 5-10%.
Fishery Governance Target catch (or effort) range:
96,000-136,000 marron
In 2006, the Recreational Freshwater Fisheries Stakeholder Subcommittee (RFFSS) proposed that, based on the available research data and the knowledge of the marron fishery, the fishery be managed to a maximum target catch of between 96,000-136,000 marron. It should be noted that under current management arrangements (short 16-29 day season since 2003) the average estimated recreational catch has been around 55,000 marron. The most likely explanation for the current low annual catch is not limited marron stocks but the sharp reduction in effort since 2003. In 2007 the marron season was increased from 16 to 23 days. The season was increased to 29 days in 2009. Assuming relative stable marron abundance, a limited growth in the fishery is allowed while maintaining catches at a sustainable level. Developments in marron abundance (fishery independent surveys) and marron catches (phone survey and logbook) will be monitored in future to determine the impact of the changes in season length and increase in legal minimum size.
STATE OF THE FISHERIES AND AQUATIC RESOURCES REPORT 2009/10 275

SOUTHERN INLAND BIOREGION
Current fishing (or effort) level Acceptable
Fishing effort has been low under current management arrangements. Since 2003 when the reduced 16 day season was introduced effort (fishing days) dropped considerably from ~40,000 fishing days (2000-2002) to ~11,000 fishing days (2003-2006). The season length was extended from 16 to 23 days in 2007 and a significant increase in effort from ~11,000 (2003-2006) to ~17,000 fishing days (2007-2008)
was observed. The effort increased to 25,700 fishing days in 2009 with a 29 day season.
New management initiatives (2009/10)
For 2010 the marron season will start on 8 January and run for a 28 day period until 5 February.
AQUACULTURE Regional Research and Development Overview
Previous research undertaken at the Pemberton Freshwater Research Centre focused on marron husbandry and selective breeding research, captive breeding programs for conserving endangered native fish and crayfish and evaluation of the use of grains in aquaculture feeds. Industry sectors continue to apply the results of the research to commercial operations.
A Ministerial Exemption issued to enable a commercial operator to collect marron from farm dams on a number of
private properties will expire in May 2010. The current policy only allows one property on a licence. Undertaken with the co-operation of local compliance officers in the southwest, information generated from the trial project, which ran for three years, will enable the Department of Fisheries to determine whether a review of the current policy is warranted.
COMPLIANCE AND COMMUNITY EDUCATION
Fisheries and Marine Officers (FMOs) based in Geraldton, Dongara, Jurien, Lancelin, Hillarys, Fremantle, Rockingham, Mandurah, Bunbury, Busselton, Albany and Esperance conduct recreational fishing compliance and education activities in the Southern Inland bioregion.
The Fisheries Volunteer program assists with the delivery of education in the Southern Inland bioregion. Although the volunteer program is based in major coastal centres, it is used particularly prior to - and during - the opening of the marron season to conduct peer-to-peer education.
The highest risk of non-compliance in the Southern Inland bioregion is within the recreational marron fishery. As the marron season lasts for just 23 days (28 days as of 2010), the risk of illegal fishing during the closed season (February-December) is extremely high. This illegal fishing is particularly high during the period from September to December, after the winter rains and prior to the next season opening.
Increasingly, dams and catchment areas once open to marroning are being closed by the Water Corporation, which presents further challenges to ensure compliance in these areas. A number of Water Corporation Rangers have been authorized as honorary FMO’s to assist with the compliance of illegal fishing on Water Corporation dams. Some DEC officers have also been authorized as honorary FMO’s and
play an important role in the marron compliance throughout the South West. During the open marron season, illegal activities (such as the use of scoop and drop nets in ‘snare only’ waters, take of undersize marron, and adherence to possession limits, particularly in trophy waters such as Harvey Weir) are a focus of compliance activities. FMOs continue to carry out joint initiatives with police to investigate the theft of marron from private properties and licensed aquaculture sites.
The other main fishery in the Southern Inland bioregion is the recreational trout fishery. Compliance and education in this fishery focuses on the illegal use of baits in ‘artificial lure-only’ waters, exceeding bag limits, fishing without a current freshwater recreational fishing licence, and the taking of trout during the closed season.
Compliance patrols for the other recreational fisheries in these inland areas, as well as inspections of fish wholesale and retail premises also form part of the compliance activities conducted by FMOs in the southern inland bioregion.
Commercial fishing activity in rivers is also included in the southern inland bioregion and some compliance patrols target fishing activity in the West Coast and South Coast estuarine fisheries. The compliance effort in this fishery focuses mainly on closed waters, setting times, net lengths and licensing.
276 DEPARTMENT OF FISHERIES
SOUTHERN INLAND BIOREGION
Activities during 2008/09
During 2008/09, FMOs delivered 2341 hours of compliance patrol hours to the Southern Inland bioregion (Southern Inland Compliance Table 1) – which is an increase from the compliance hours delivered in the previous year.
Officers conducted patrols throughout the bioregion in vehicles, dinghies and canoes, making 1025 field contacts with recreational fishers and 101 contacts with commercial fishers. During the year, 31 infringement warnings and 24 infringement notices were issued with 36 prosecutions instigated for recreational offences.
The marron fishery continues to be the major focus for the compliance and education program in this bioregion. The 2009 marron season was the fourth year of the five year marron management strategy, public acceptance of the new rules is good and catches generally do not seem to have changed greatly in most areas. As was the case in 2008 the compliance activities for the 2009 marron season were developed from a risk assessment process, and targeted areas of high risk identified through that process. The marron season start date has been reviewed to permit better long term planning for recreational fishers and the Department of Fisheries. As of 2010 the new 28 day season start date will be the 8th January each year and end on the 5th February.
Aquaculture compliance activities (classified as 'commercial' In Table 1) are also a major focus in the Southern Inland bioregion for FMOs. Activities mainly involve inspection of aquaculture facilities, oversight of broodstock collection to ensure compliance with exemption conditions, and inspection of proposed aquaculture sites to ensure that the harvesting does not affect the wild stocks in WA waters. FMO’s also
carry out joint patrols with police to investigate theft from farm dams.
Initiatives for 2009/10
Joint operations with regional Water Corporation Rangers and DEC officers will continue during 2009/10. These joint patrols will increase the compliance presence in the marron fishery and the expert knowledge the Water Corporation rangers have of the dam areas and activities greatly assist in the compliance operations.
Poaching of wildstock marron during the closed season and theft of marron from dams on private property and aquaculture facilities will be a focus for compliance activities. District FMOs will also continue to work in partnership with local police to develop joint initiatives, facilitate the transfer of intelligence information and respond to compliance situations.
The southern regional Community Education Officer will again be conducting several education activities promoting awareness of endemic freshwater fish and crustaceans of the south-west and highlighting potential threats, including feral fish species. Some of these activities will be carried out in partnership with other agencies and natural resource management groups to enable a holistic approach to catchment management and issues facing the sustainability of freshwater species.
The Volunteer program will be instrumental in delivering information to marron fishers and campers during the opening of the marron season at the Collie River, Harvey Dam and through the Blackwood River basin
.
STATE OF THE FISHERIES AND AQUATIC RESOURCES REPORT 2009/10 277

SOUTHERN INLAND BIOREGION
SOUTHERN INLAND COMPLIANCE TABLE 1
This table gives a summary of compliance and educative contacts and detected offences within the Southern Inland bioregion during the 2008/09 financial year.
PATROL HOURS DELIVERED TO THE BIOREGION 2,341 Officer Hours
CONTACT WITH THE COMMERCIAL FISHING COMMUNITY
Field contacts by Fisheries & Marine Officers 101
District Office contacts 0
Infringement warnings 1
Infringement notices 0
Prosecutions 0
CONTACT WITH THE RECREATIONAL FISHING COMMUNITY
Field contacts by Fisheries & Marine Officers 1025
District Office contacts 2723
Infringement warnings 31
Infringement notices 24
Prosecutions 36
OTHER FISHING-RELATED CONTACTS WITH THE COMMUNITY*
Field contacts by Fisheries & Marine Officers 1099
District Office contacts 0
Fishwatch reports** Not recorded * Contacts are classified according to the specific fishery, which is usually clearly delineated as being either commercial or recreational.
The “other fishing-related contacts with the community” category is used where multiple fisheries are contacted and it is not possible to accurately classify the contacts into one specific fishery – typically, the majority of contacts are these contacts are recreational in nature (e.g. personal contacts in marine protected areas), but contacts made in relation to fish kills, shark patrols and inspections of commercial fish wholesale and retail premises, etc, are also included in this category.
** Fishwatch calls relating to the Southern Inland bioregion are not recorded, as the service provider reporting mechanism only details calls referred to district offices. Calls relating to the Southern Inland bioregion will be included in both the South Coast and West Coast bioregion totals.
Southern Inland Bioregion Compliance Patrol Hours
1,544
1,9821,820
1,974
2,341
0
500
1,000
1,500
2,000
2,500
3,000
04/05 05/06 06/07 07/08 08/09
Financial Year
Off
icer
Hou
rs
SOUTHERN INLAND COMPLIANCE FIGURE 1
In this figure, “On Patrol” Officer Hours shows the level of compliance patrol activity delivered to the Southern Inland bioregion over the previous five years. The 2008/09 total gives the patrol hours in the bioregion that resulted in the contacts detailed in Table 1. The totals exclude time spent on other compliance related tasks, e.g. travel time between patrol areas, preparation and planning time.
278 DEPARTMENT OF FISHERIES
STATE OF THE FISHERIES AND AQUATIC RESOURCES REPORT 2009/10 279
STATEWIDE ECOSYSTEM BASED FISHERIES MANAGEMENT 280FISHERIES 282

STATEWIDE
STATEWIDE
ECOSYSTEM BASED FISHERIES MANAGEMENT
Identification of State-wide Ecological Assets using the EBFM framework
While the bioregional scale of management has been adopted by the Department through the implementation of an Ecosystem Based Fisheries Management (EBFM) framework (see How to Use section for more details), due to their life histories or broader impacts, a small number of ecological assets cannot realistically be managed at the bioregional level but need to be considered at either a statewide or at a multiple bioregional level.
South West Sharks
North West Sharks
Aquarium Fish
Captured Species
Climate
Introduced Diseases/Pests
External Drivers
StatewideEcological Resources/Assets
STATEWIDE ECOSYSTEM MANAGEMENT FIGURE 1
Component tree showing the State-wide ecological assets and external drivers identified and separately assessed.
Risk Assessment of Statewide Ecological Assets and External Drivers
The EBFM process identifies the ecological assets in a hierarchical manner such that the assets outlined Figure 5 are often made up of individual components at species or stock level. The risks to each of the individual stock or lower level components are mostly detailed in the individual fishery reports presented in this document. The following table
(Statewide Ecosystem Management Table 1) provides an overview and cumulative assessment of the current risks to those ecological assets that function at a statewide level and provides a mechanism for reporting on their status and the fisheries management arrangements that are being applied. These level risks are now used by the Department as a key input into the Department’s Risk Register which, combined with an assessment of the economic and social values and risks associated with these assets, is integral for use in the annual planning cycle for assigning priorities for activities across all Divisions for Statewide Issues.
280 DEPARTMENT OF FISHERIES

STATEWIDE
STATEWIDE ECOSYSTEM MANAGEMENT TABLE 1 - RISK LEVELS FOR EACH ASSET. Low and Medium values are both considered to be acceptable levels of risk. High and Significant risks indicate that the asset is no longer in a condition that is considered appropriate and additional management actions are required.
Captured fish species
Fish species Aquatic zone Risk Status and Current Activities
South and lower west
MODERATE The stock levels of most sharks in these regions are now either at acceptable levels or are deemed to be recovery at acceptable rates following management intervention.
Sharks
Mid West – North HIGH
The stocks levels of some sharks in these regions are at unacceptable levels or have a high level of uncertainty. Some of these risks are being by fishing that is occurring outside of the direct jurisdiction of WA.
Aquarium Fish Marine LOW The level of capture is low and the management restrictions are such that that these species are not at risk.
External Drivers (NON FISHING)
Summary of Monitoring and Assessment of Statewide Assets
The Department is working closely with the Australian Government and other jurisdictions to develop and implement the National System for the Prevention and Management of Marine Pest Incursions that will minimise the biosecurity risks associated with increased shipping in all parts of the State. Within WA, this will be achieved through the Fish Resources Management Act 1994 and the Biosecurity and Agriculture Management Act 2007. Associated regulations and subsidiary legislation are currently being developed. Work has also been undertaken to develop monitoring designs for introduced marine species for most of the key Ports in WA. The design has been developed
in conjunction with the Invasive Marine Pests Program within DAFF (Department of Agriculture Fisheries and Forestry). This work is expected to contribute to introduced aquatic organism incursion and fish kill incident response programs already in place.
The Department of Fisheries’ Research Division’s Biodiversity and Biosecurity Branch recognises that the vast and remote coastline of the region dictates that remote sensing (satellite imagery and aerial photography) will be the primary tool for resource condition monitoring. Future directions of the project will concentrate on developing remote sensing as a monitoring tool, and developing a suite of resource condition indicators that accurately portray the health of the numerous marine and coastal environments.
External Drivers Risk Status and Current Activities
Introduced Pests and Diseases
HIGH
There is a high risk that some exotic species will be introduced into the state through the increasing levels of international shipping that is occurring at ports around the country. Many of these pest species are capable of invading beyond a single bioregion.
Climate
MODERATE in short term
HIGH
in Medium term
The predictions for impacts of climate change affecting the Statewide ecosystems and process are moderate in the short term. The risk escalates to a higher level in the medium term.
STATE OF THE FISHERIES AND AQUATIC RESOURCES REPORT 2009/10 281

STATEWIDE
282 DEPARTMENT OF FISHERIES
FISHERIES Marine Aquarium Fish Managed Fishery Report: Statistics Only S.J. Newman, C. Bruce and M. Cliff
Management input from S. Brand-Gardner and M. Holtz
Fishery Description
Commercial The Marine Aquarium Fish Managed Fishery (MAF) has the capacity to target more than 250 species of fish under the management plan. However, the number of species targeted and/or landed by the fishery varies from year to year (e.g. in 2009 only 180 species were landed). By way of a Section 43 Order and Ministerial Exemption, fishermen also take coral, live rock, algae, seagrass and invertebrates. It is primarily a dive-based fishery that uses hand-held nets to capture the desired target species from boats up to 8 m in length. While the MAF operates throughout all Western Australian waters, catches are relatively low in volume due to the special handling requirements of live fish. Fishing operations are heavily weather-dependent due to the small vessels used and the potentially hazardous conditions (e.g. waves, swell) encountered. In addition, human constraints (i.e. physiological effects of decompression) limit the amount of effort exerted in the fishery, the depth of water and the offshore extent where collections can occur.
Recreational There is no documented recreational fishery. If members of the public wish to collect specimens for their own private aquariums they are permitted to do so, but are restricted to normal recreational bag limits and, for some species, size limits. There is a complete ban on the recreational take of coral, live rock and totally protected fish such as leafy seadragons.
Boundaries
Commercial The MAF operates in Western Australia’s state waters spanning the coastline from the Northern Territory border in the north to the South Australian border in the south. The effort is spread over a total gazetted area of 20,781 km. During the past three years the fishery has been active in waters from Esperance to Broome with popular areas being around Perth, Geraldton, Carnarvon, Exmouth and Dampier.
.
Management arrangements
This fishery is managed primarily through input controls in the form of limited entry to the fishery and permanent closed areas. There are 12 licences in the fishery following the cancellation of 1 licence in 2009 in response to the expansion of the Ningaloo marine reserve. In 2009, 10 licences operated in the fishery.
Licencees are not permitted to operate within any waters closed to fishing (e.g. Rowley Shoals, Reef Protected Areas, sanctuary zones). The fishery is permitted to operate in general-purpose zones of marine parks for the collection of
fish and some invertebrates (usually excluding coral and live rock). Fishing is also prohibited on Cleaverville Reef in order to exclude the take of coral and associated organisms.
Fish caught in this fishery may not be used for food purposes, and operators are not permitted to take species covered by other specific commercial management arrangements or management plans.
The MAF is permitted to take most species from the Syngnathid family (seahorses and pipefish), which is listed under the Environment Protection and Biodiversity Conservation Act 1999. However, there is a total ban on the take of leafy seadragons (Phycodurus eques). If the current ESD trigger value of 2000 individual syngnathids is reached, a review will be initiated, and the results used to determine whether further management action is required.
Landings and Effort
A total of over 18,915 fish were landed in 2009. Collectors in this ornamental fishery can earn a high return from the capture of very small quantities of individuals. Therefore, the catches are small in comparison to the more common, food-fish fisheries. Fishers report the level of catch (kg, numbers or litres) by species or species group. A summary of the 2009 levels of catch is provided in Marine Aquarium Fish Table 1. The reported landings of aquarium fish for 2009 are less than those reported in 2008, with the syngnathid catch for 2009, being significantly less than that reported in 2008.
Effort in the fishery has decreased from 981 and 932 fishing days in 2007 and 2008, respectively, to 639 fishing days in 2009, with 10 licences reporting some level of activity (the level of effort in the MAF now includes the effort of both MAF licensees and also those fishers that hold an exemption authorisation to collect land hermit crabs - Coenobita variabilis). Effort in the fishery is concentrated in discrete areas adjacent to the limited number of boat landing sites along the Western Australian coastline.
Given that the specimens are collected for a live market, licences are restricted in terms of the quantities that they can safely handle and transport (for example, by boat to shore, by vehicle to the holding facility and then on to the retailer) without impacting on the quality of the product. The size of the holding facility and access to regular freight and infrastructure services (such as airports, particularly in the remote northern locations of WA) restricts the levels of effort that can be expended in the fishery at any given time.

STATEWIDE
Fishery Governance Target commercial catch range: Not assessed
Current Fishing (or Effort) Level: Acceptable
The current effort level in the fishery is fairly constant from year to year and the operating extent of the fishery is low relative to the widespread distribution of the plethora of species targeted. No other fisheries exploit these species and
therefore there is limited potential for impact on breeding stocks. Therefore the current level of fishing activity is considered acceptable.
New management initiatives (2009/10)
Compulsory daily logbooks and a requirement to notify the Department prior to fishing for coral and live rock were introduced in 2009. Amendments to subsidiary legislation regulating the take of coral and live rock has provided an increase in the amount of live rock that can be taken by licencees and introduced a small daily bag limit of 5 kg of the coral species Catalaphyllia jardinei in the Dampier Archipelago region. The Australian Government Department of Environment and Water Resources approved the MAF as environmentally sustainable under the provisions of the Environment Protection and Biodiversity Conservation Act 1999 and therefore declared the fishery as an approved
Wildlife Trade Operation (WTO) for three years.
MARINE AQUARIUM FISH TABLE 1
Summary of the reported catch landed from the Marine Aquarium Managed Fishery and associated endorsements in 2009.
1 This total includes both MAF licensees and also those fishers that hold an exemption authorisation to collect land hermit crabs - Coenobita variabilis.
2 The soft coral category includes 4,913kg of coral like anemone groups such as corallimorphs and zooanthids in the Class Anthozoa. These are harvested under an invertebrate Ministerial Exemption and are not part of the annual coral TAC.
3 Due to confidentiality provisions the reported catch of ‘live feed (mainly shrimps)’ cannot be shown in Marine Aquarium Fish Table 1 in 2009.
4 Due to confidentiality provisions the reported catch of Bryozoans cannot be shown in the Marine Aquarium Fish Table 1 in 2009.
The performance measures for the fishery relate to the catch of the syngnathids. The MAF is permitted to take species from the syngnathid family (seahorses and pipefish), which are listed under the Environment Protection and Biodiversity Conservation Act 1999. In 2009, the catch level of syngnathids was 340 and is significantly less than that reported in 2008. Note, that there is a prohibition on the take of leafy seadragons (Phycodurus eques) in the MAF.
Common Name Quantity
(numbers) Weight Litres
(kg) (l)
Fish 18,575
Syngnathidae (not included in Fish) 340
Hermit crabs (land hermit crabs only - Coenobita variabilis)1
110,250
Invertebrates 32,972
Algae/Seagrasses 441
Hard coral 6,111
Soft coral2 5,450
Live rock 3336
Sponges 4,837
STATE OF THE FISHERIES AND AQUATIC RESOURCES REPORT 2009/10 283
STATEWIDE
Specimen Shell Managed Fishery Status Report A. Hart, C. Bruce and M. Cliff
Management input from S. Brand-Gardner and M. Holtz
Main Features
Status
Stock level Acceptable
Fishing level Acceptable
Current Landings
Specimen Shell Catch Total
Shell numbers 8,644 shells
Fishery Description The Specimen Shell Managed Fishery (SSF) is based on the collection of individual shells for the purposes of display, collection, cataloguing, classification and sale.
More than 200 different shellfish species are collected mainly by hand by a small group of divers operating from small boats in shallow coastal waters. While the fishery covers the entire Western Australian coastline, there is some concentration of effort in areas adjacent to population centres such as Karratha, Exmouth, Carnarvon, Geraldton, metropolitan Perth, Bunbury and Albany.
Governing legislation/fishing authority
Specimen Shell Management Plan 1995
Specimen Shell Managed Fishery Licence
Commonwealth Government Environment Protection and Biodiversity Conservation Act 1999 (Export Exemption)
Consultation process
Meetings between the Department of Fisheries and industry
Boundaries
The fishing area includes all Western Australian waters between the high water mark and the 200 m isobath.
Management arrangements
This fishery is managed through input controls in the form of limited entry, gear restrictions and permanent closed areas. The primary controls in the fishery are operational limitations – depth, time and tide.
This is a limited entry fishery with 32 licences in the fishery, with 23 of the licences being active. Furthermore, a maximum of 2 divers are allowed in the water per license at any one time and specimens may only be collected by hand.
There are a number of closed areas where the SSF is not permitted to operate. This includes within various marine parks and aquatic reserves and other closed waters such as Reef Observation Areas and Fish Habitat Protection Areas. Much of the west side of North-West Cape and the Ningaloo Marine Park are prohibited areas for the fishery. The exclusion of Marmion Marine Park in the Perth metropolitan
area is also important because of its populations of 2 rare cowrie species.
The SSF is not permitted to take any mollusc species for which separate management arrangements exist – such as abalone, mussels, scallops and pearl oysters.
A comprehensive Ecologically Sustainable Development assessment of this fishery has been undertaken to identify any potential sustainability risks requiring direct management. The only issue identified through this process related to the breeding stock levels of specimen shell species. Boxed text in this status report provides the annual assessment of performance for this issue.
Some minor-scale collection of dead shells is also undertaken above the high water mark by collectors operating under the authority of a commercial fishing licence, mainly for sale into the souvenir, pet supply and hobby craft markets. However, this activity does not form part of the Specimen Shell Managed Fishery.
Research summary
Current fishery-dependent data collection systems monitor the catch (species-specific), effort and catch rates for the fishery. Fishers within the SSF provide monthly returns under the statutory catch and effort system (CAES). These returns contain information on catch (species, numbers and spatial area), and days and hours fished by month and year.
In August 2004, fishers commenced reporting using 10 x 10 nautical mile (nm) grids rather than 60 x 60 nm grids, providing a finer spatial scale to the data collected. At the same time, they began collecting additional information on sightings of the 8 mollusc species identified as potentially ‘vulnerable.’ These data are used as the basis to provide research advice for fisheries management.
Retained Species Commercial landings (season 2009): 8,644 shells
Recreational catch estimate (season 2009):
Unknown
Commercial Landings In 2009, the total number of specimen shells collected was 8,644, distributed over a wide range of species. In the past 5
284 DEPARTMENT OF FISHERIES

STATE OF THE FISHERIES AND AQUATIC RESOURCES REPORT 2009/10 285
years, more than 492 separate species of molluscs have been collected, with an average of more than 200 species per year – the majority in low numbers.
There is some focus of effort on mollusc families most popular with shell collectors, such as cowries, cones, murexes and volutes. For example, Cypraea venusta, C. marginata and C. friendii (including identified sub-species) make up approximately 18% of those collected in 2008 and 31% of those collected in 2009. Cypraeidae or cowries are noted for their localised variations in both shape and colour, making them attractive to collectors.
(Note reported total landings exclude Trochus hanleyanus taken by the Marine Aquarium Fishery.)
Fishing effort/access level
Although there are 32 licences in the fishery, only about 9 of these are regularly active. Effort has been stable over the past 5 years, at an average of around 1,130 days fished. In 2009, 1,057 days were fished.
Recreational component: Not assessed
Shell collecting is a popular recreational pastime, and members of the public are permitted to collect shells for their private collections. The recreational catch, while unknown, is considered to be declining, as evidenced by declining membership in shell collecting associations.
Stock Assessment Assessment complete: Yes
Breeding stock levels: Adequate
During the 2009 season the catch rate was approximately 8 shells per day (excluding Trochus hanleyanus).
Ponder and Grayson (1998) examined the specimen shell industry on a nationwide basis, rating vulnerability to over-exploitation on the basis of species biology, accessibility to collection, and rarity. Species collected in Western Australia which were identified by Ponder and Grayson as potentially vulnerable comprised of 6 cowries (Cypraea (Austrocypraea) reevei, Cypraea (Zoila) friendii vercoi, Cypraea (Zoila) marginata (albanyensis), Cypraea (Zoila) marginata (consueta), Cypraea (Zoila) rosselli and Cypraea (Zoila) venusta) and 2 volutes (Amoria damoni (keatsiana) and Amoria damoni (reevei)).
‘Shell sighting’ is a new abundance category. It is a measure of the population of vulnerable shells that is observed but not taken, and provides evidence for the breeding stock being conserved each year. Of the 8 vulnerable species (including related sub-species), an overall average of approximately 61% in 2005, 59% in 2006, 64% in 2007, 77% in 2008 and 61% in 2009 of the shells sighted were not harvested. The measure of the number of shells sighted is reported correctly in about 22% of the cases where one of the vulnerable species is reported.
The figures for ‘sighted’ versus ‘taken’ of vulnerable shells is continually improving by licensees, but the majority of licences still record this poorly. It is anticipated that current
sightings are an under estimate of the available populations.
The reporting of catch and effort on the finer spatial scale of 10 x 10 nm blocks from August 2004 is also providing more accurate information on the distribution of certain species. The 2009 season has seen a wider adoption by licensees of the smaller spatial resolution grid blocks rather than reporting the 60 x 60 nm blocks.
All species collected in Western Australia, including the 8 prized species, occur over wide geographic ranges (hundreds or thousands of kilometres) and wide depth ranges (up to 200 m) where a substantial portion of the population cannot for logistical and safety reasons be collected.
Even in shallow waters, many localities cannot be fished because of the lack of access to the beach and the small boats used, and collecting is prohibited in many of the more easily reached areas which are now in marine parks and reserves. Additional protection is afforded by the fact that collectors will ignore any specimens with slight visual imperfections, but their reproductive potential in the population remains undiminished. In summary, it is considered that the fishery has very little likelihood of having an unacceptable impact on breeding stocks.
Non-Retained Species Bycatch species impact: Negligible
There is no bycatch in this fishery owing to the highly selective fishing methods.
Protected species interaction: Negligible
The fishery had no reported interactions with protected species during 2009. Reports of interactions with protected species are required to be recorded on monthly catch and effort returns.
Ecosystem Effects Food chain effects: Negligible
Habitat effects: Negligible
Social Effects In 2009 there was 32 authorisation holders in this fishery with around 9 licences recording consistent activity, the number of people employed regularly in the fishery (licensees plus crew/ dive buddies) is likely to be around 12.
The performance measures for the fishery relate to the maintenance of breeding stocks, as indicated by catch levels and catch rates. In 2009, the catch level of approximately 8,644 shells and catch rate of 8 shells/day were both only slightly lower than the ranges set, i.e. 10,000 – 25,000 shells and 10 – 40 shells/day.
STATEWIDE

STATEWIDE
There was also around 19 people (licensees plus crew/dive buddies) that operated occasionally in this fishery. With many of the licences there might be the additional employment of people to prepare the shells for collection, pack and distribute the shells and also, some licensees might have shop fronts, therefore, employing shop assistants. The number employed in this area is unknown.
Economic Effects Estimated annual value (to fishers)
for year 2009: Not assessed
Fishery Governance Target catch range: 10,000 – 25,000 shells
A preliminary performance measure has been developed of a total annual catch range from 10,000 to 25,000 shells, which encompasses the range of catches taken from 2000 to 2003. This performance measure has been developed to ensure that any major change in the patterns of fishing is noticed and investigated. If it is triggered, this may not necessarily
indicate any problem with the stocks, but rather fluctuations in the natural environment or market dynamics.
New management initiatives (2009/10)
A recent amendment to the Specimen Shell Management Plan strengthened the clause pertaining to the taking and selling of specimen shells to improve the ability of the Department of Fisheries to successfully prosecute cases of black market sale, purchase and dealing of shell.
A Ministerial Exemption was granted on 26 March 2009, which permits the use of up to 2 fishing boats of any size (provided that the boats are not used simultaneously), the use of up to 2 nominated divers who are not nominated on the Managed Fishery Licence (provided no more than 2 people are in the water at any one time), collection of dead shells of non-commercial abalone species and specimen shells of the genus Pecten. This Exemption is in place while management plan amendments are progressed.
An Exemption has been granted for one licensee to trial the use of a remote operated vehicle to collect shells in water depths of 60 to 300 metres.
286 DEPARTMENT OF FISHERIES

STATE OF THE FISHERIES AND AQUATIC RESOURCES REPORT 2009/10 287
APPENDICES APPENDIX 1 288APPENDIX 2 291APPENDIX 3 300APPENDIX 4 308APPENDIX 5 318GLOSSARY OF ACRONYMS 319
APPENDICES
APPENDIX 1 Fisheries Research Division staff publications 2009/10
Scientific Papers
Bearham, D., Spiers, Z., Raidal, S., Jones, J.B., Nicholls, P.K 2009. Detection of Minchinia occulta in samples of pearl oysters Pinctada maxima (Jameson, 1901) infected by Haplosporidium hinei. Australian Veterinary Journal 87: 430-437.
Bellchambers, L.M., Evans, S. and Meeuwig, J. 2010. Abundance and size of western rock lobster (Panulirus cygnus) as a function of benthic habitat: implications for ecosystem-based fisheries management. Marine and Freshwater Research. 61:279-287
Caputi, N., Mellville-Smith, R., de Lestang, S., Feng, M., Pearce, A. 2010. The effect of climate change on the western rock lobster fishery. Canadian Journal of Fisheries and Aquatic Sciences 67: 85-96
Evans, R.D., van Herwerden, L, Russ, G.R. and Frisch, A.J. 2010. Strong genetic but not spatial subdivision of two reef fish species on the Great Barrier Reef. Fisheries Research.102: 16-25. doi:10.1016/j fishres.2009.10.002.
Hassan, M., Jones, B., Lymbery, A.J. 2009. A new species of Dermoergasilus Ho & Do, 1982 (Copepoda: Ergasilidae) from freshwater fishes in the south-west of Western Australia. Systematic Parasitology 74: 143-148.
Jackson, G., Norriss, J.V., Mackie, M.C. and Hall N.G. 2010. Spatial variation in life history characteristics of snapper (Pagrus auratus) within Shark Bay, Western Australia. New Zealand Journal of Marine and Freshwater Research 44(1): 1-15.
Lenanton, R.C., Caputi, N., Kangas, M. & Craine, M. 2009 The ongoing influence of the Leeuwin Current on economically important fish and invertebrates off temperate Western Australia – has it changed? Journal of the Royal Society of Western Australia. 92:111-127
Marriott R.J., Jarvis N.D.C., Adams D.J., Gallash A.E., Norriss J. & Newman S.J. 2010. Maturation and sexual ontogeny in the spangled emperor, Lethrinus nebulosus. Journal of Fish Biology 76, 1396-1414.
Newman, S.J. 2009. First record of the rare Randall’s snapper, Randallichthys filamentosus, (Perciformes: Lujanidae) from the eastern Indian Ocean (north-western Australia). Journal of Fish Biology 75 (6): 1513-1517.
Newman, S.J., Buckworth, R.C., Mackie, M., Lewis, P.D., Wright, I.W., Williamson, P.C., Bastow, P.D. and Ovenden, J.R. 2009. Spatial subdivision among assemblages of Spanish mackerel, Scomberomorus commerson (Pisces: Scombridae) across northern Australia: implications for fisheries management. Global Ecology and Biogeography 18 (6): 711-723.
Newman, S.J., Skepper, C.L. and Wakefield, C.B. 2010. Age estimation and otolith characteristics of an unusually old red emperor snapper (Lutjanus sebae) captured off the Kimberley coast of north-western Australia. Journal of Applied Ichthyology 26: 120-122.
Pearce, A.F. & Hutchins, J.B. 2009. Oceanic processes and the recruitment of tropical fish at Rottnest Island (Western Australia). Journal of the Royal Society of Western Australia 92: 179-195.
van Herwerden, L., Aspden, W.J., Newman, S.J., Pegg, G.G., Briskey, L. and Sinclair, W. 2009. A comparison of the population genetics of Lethrinus miniatus and Lutjanus sebae from the east and west coasts of Australia: evidence for panmixia and isolation. Fisheries Research 100 (2): 148-155.
van Herwerden, L., Choat, J.H., Newman, S.J., Lerray, M. and Hillesroy, G. 2009. Complex patterns of population structure and recruitment of Plectropomus leopardus (Pisces: Epinephelidae) in the Indo-West Pacific: implications for fisheries management. Marine Biology 156 (8): 1595-1607.
Wakefield, C.B., Newman, S.J. and Molony, B.W. 2010. Age-based demography and reproduction of hapuku, Polyprion oxygeneios, from the south coast of Western Australia: implications for management. ICES Journal of Marine Science 67: 1164-1174.
Reports
Bellchambers, L., Bridgwood, S., How, J., Lewis, P., de Lestang, S., Mackie, M and Coutts, T. 2009 Development of a long-term program to monitor coastal communities within the Swan region. Fisheries Research Report No. 183. Department of Fisheries, Western Australia. 144p.
Bellchambers, L. 2010. The effects of western rock lobster fishing on the deepwater ecosystems off the west coast of Western Australia Fisheries Research Report No. 199. Department of Fisheries Western Australia. 90p.
288 DEPARTMENT OF FISHERIES
APPENDICES
STATE OF THE FISHERIES AND AQUATIC RESOURCES REPORT 2009/10 289
Bridgwood, S.D. 2010. Hull Camera: Preliminary Design and Testing of its use for Assessing Biofouling on Small (<12 m) Recreational Vessels. Fisheries Research Report No. 200. Department of Fisheries, Western Australia. 16p.
Bridgwood, S.D. 2010. A Community-Based Monitoring Program for Introduced Marine Pests. Fisheries Research Report No. 201. Department of Fisheries, Western Australia. 48p.
Bridgwood, S.D. 2010. Codium fragile ssp. fragile (Suringar) Hariot Summary Document. Fisheries Research Report No. 202. Department of Fisheries, Western Australia. 12p.
Broderick, D., Ovenden, J.R., Buckworth, R.C., Newman, S.J., Lester, R.J.G. and Welch, D.J. 2009. Genetic population structure of grey mackerel (Scomberomorus semifasciatus) in northern Australia. pp. 83-105. In: Welch, D.J., Buckworth, R.C., Ovenden, J.R., Newman, S.J., Broderick, D., Lester, R.J.G., Ballagh, A.C., Stapley, J., Charters, R.A. and Gribble, N.A. 2009. Determination of management units for grey mackerel fisheries in northern Australia. Final Report, Fisheries Research and Development Corporation Project 2005/010, Fishing and Fisheries Research Centre Technical Report No. 4, Fishing and Fisheries Research Centre, James Cook University, Townsville, Australia. 158p.
Charters, R.A., Lester, R.J.G., Buckworth, R.C., Newman, S.J., Ovenden, J.R., Broderick, D., Kravchuk, O. and Welch, D.J. 2009. The stock structure of grey mackerel Scomberomorus semifasciatus in Australia as inferred from its parasite fauna. pp. 117-130. In: Welch, D.J., Buckworth, R.C., Ovenden, J.R., Newman, S.J., Broderick, D., Lester, R.J.G., Ballagh, A.C., Stapley, J., Charters, R.A. and Gribble, N.A. 2009. Determination of management units for grey mackerel fisheries in northern Australia. Final Report, Fisheries Research and Development Corporation Project 2005/010, Fishing and Fisheries Research Centre Technical Report No. 4, Fishing and Fisheries Research Centre, James Cook University, Townsville, Australia. 158p.
Daume, S., Fromont. J., Hart, A.M. 2009. Management of bioeroding sponges in wild stocks of Pinctada maxima in Western Australia. Fisheries Research Report No 196, Department of Fisheries, Western Australia, 44 p
Green, T.J. and McKinlay, J.P. 2009 Compliance Program Evaluation and Optimisation in Commercial and Recreational Western Australian Fisheries, Final Report, Fisheries Research and Development Corporation Project 2001/069, Fisheries Research Report No. 195. Department of Fisheries, Western Australia. 81p.
Jackson, G., Hall, N. and Andreini, E. 2010. Assessment of lagoon and off-lagoon fish stocks of Mauritius and Rodrigues. Report to Government of Mauritius, 36 p.
Lawrence, C., Hugh, C., Larsen, R., Ledger, J. and Vercoe, P. 2010. Aquatic Fauna – Biological Survey. Ten Mile Brook Dam Margaret River. Fisheries Research Contract Report No. 22. Department of Fisheries, Western Australia. 16p.
Melville-Smith, R., Larsen, R., de Graaf, M. and Lawrence, C. 2010. WA Native Fish Strategy: Freshwater fish distribution database and website. Prepared for: Natural Resource Management (NRM) office. NRM Project No. 063059. Project funded by: The Australian Government and the Government of Western Australia - Natural Resource Management (NRM) Office. Department of Fisheries, Western Australia. 40p.
Newman, S.J., Wright, I., Rome, B.M., Mackie, M.C., Lewis, P., Buckworth, R.C., Ballagh, A.C., Garrett, R.N., Stapley, J., Broderick, D., Ovenden, J.R., Lester, R.J.G. and Welch, D.J. 2009. Stock structure of grey mackerel, Scomberomorus semifasciatus, across northern Australia based on otolith isotope chemistry. pp. 107-116. In: Welch, D.J., Buckworth, R.C., Ovenden, J.R., Newman, S.J., Broderick, D., Lester, R.J.G., Ballagh, A.C., Stapley, J., Charters, R.A. and Gribble, N.A. 2009. Determination of management units for grey mackerel fisheries in northern Australia. Final Report, Fisheries Research and Development Corporation Project 2005/010, Fishing and Fisheries Research Centre Technical Report No. 4, Fishing and Fisheries Research Centre, James Cook University, Townsville, Australia. 158p.
Penn, J.W. and Fletcher, W.J. 2010. The efficacy of sanctuary areas for the management of fish stocks and biodiversity in WA waters. Fisheries Research Report No. 169. Department of Fisheries, Western Australia. 44p.
Smallwood, C.B., Thomson, A., Harris, D. & Johnston, D. 2010 The Volunteer Fisheries Liaison Officer (VFLO) program: an analysis of recreational fishing data from 1995 – 2007. Fisheries Research Report No.203. Department of Fisheries, Western Australia. 46 pg.
Welch, D.J., Buckworth, R.C., Ovenden, J.R., Newman, S.J., Broderick, D., Lester, R.J.G., Ballagh, A.C., Stapley, J., Charters, R.A. and Gribble, N.A. 2009. Determination of management units for grey mackerel fisheries in northern Australia. Final Report, Fisheries Research and Development Corporation Project 2005/010, Fishing and Fisheries Research Centre Technical Report No. 4, Fishing and Fisheries Research Centre, James Cook University, Townsville, Australia. 158p.

APPENDICES
Welch, D.J., Buckworth, R.C., Ovenden, J.R., Newman, S.J., Broderick, D., Lester, R.J.G., Gribble, N.A., Ballagh, A.C., Street, R., Charters, R.A., Stapley, J., Garrett, R.N. and Begg, G.A. 2009. Integration of results: Definition of grey mackerel spatial management units. pp. 131-141. In: Welch, D.J., Buckworth, R.C., Ovenden, J.R., Newman, S.J., Broderick, D., Lester, R.J.G., Ballagh, A.C., Stapley, J., Charters, R.A. and Gribble, N.A. 2009. Determination of management units for grey mackerel fisheries in northern Australia. Final Report, Fisheries Research and Development Corporation Project 2005/010, Fishing and Fisheries Research Centre Technical Report No. 4, Fishing and Fisheries Research Centre, James Cook University, Townsville, Australia. 158p.
Conference/Workshop Papers
Jackson, G., Marriott, R,. Fairclough, D. and Wise, B. 2009. Recent initiatives in otolith-based ageing for assessments of demersal indicator species in the West Coast and Gascoyne Coast bioregions of Western Australia. 4th International Otolith Symposium, Monterey, California, USA, August 24-28.
Jackson, G., Norriss, J., Mackie, M.C. and Hall, N.G. 2009. Spatial variation in life history characteristics of snapper (Pagrus auratus) in Shark Bay, Western Australia. IPFC-ASFB Conference, Fremantle, Western Australia, June 1-5.
Wakefield, C. and Jackson, G. 2009. An application of the daily egg production method to assess trends in biomass, levels of exploitation and the effectiveness of management of snapper (Pagrus auratus) in Cockburn Sound, Western Australia. IPFC-ASFB Conference, Fremantle, Western Australia, June 1-5.
Whitten, A. and Jackson, G. 2009. Investigating density-dependent growth in snapper in the Eastern Gulf of Shark Bay. IPFC-ASFB Conference, Fremantle, Western Australia, June 1-5.
Whitten, A. and Jackson, G. 2009. Investigating density-dependent growth in snapper in the Eastern Gulf of Shark Bay. 4th International Otolith Symposium, Monterey, California, USA, August 24-28.
Popular Articles and Client Information
Chatfield, K. & Schenk, T. 2009 Public Information Leaflet: "Have you seen a fishkill?"
Moore, B., Newman, S.J., Pember, M., Allsop, A., Saunders, T., Ballagh, A., Stapley, J., Gribble, N., van Herwerden, L., Horne, J., Lester, B. and Welch, D.J. 2009. Threadfin fisheries across the north. Western Fisheries, WA’s Journal of Fishing and the Aquatic Environment, September 2009, pp. 50-51.
Newman, S.J. 2009. WA’s coral and coronation trouts. Western Fisheries, WA’s Journal of Fishing and the Aquatic Environment, June 2009, pp. 42-45.
Newman, S. and Welch, D. 2009. Do you know your threadfins? Fishing and Fisheries News, Edition 40 March 2009, Fishing and Fisheries Research Centre, School of Earth and Environmental Science, James Cook University
Newman, S.J., Pember, M., Allsop, A., Grace, B., Ballagh, A., Moore, B., Stapley, J., Gribble, N., van Herwerden, L., Horne, J. and Welch, D.J. 2009. Threadfins – telling them apart. Western Fisheries, WA’s Journal of Fishing and the Aquatic Environment, March 2009, pp. 38-39.
Newman, S.J., Pember, M., Allsop, A., Grace, B., Ballagh, A., Moore, B., Stapley, J., Gribble, N., van Herwerden, L., Horne, J. and Welch, D.J. 2009. Threadfins – what are they, what are the main species and how do you tell them apart? Fish and Boat, January 2009, p. 47.
Newman, S.J., van Herwerden, L. and Choat, J.H. 2009. Coral trout study points the way. Western Fisheries, WA’s Journal of Fishing and the Aquatic Environment, September 2009, pp. 46-47.
Pearce, A. 2009. Still drifting on... and on...and on! Western Fisheries, September 2009, p.49
290 DEPARTMENT OF FISHERIES

APPENDICES
APPENDIX 2 Table of catches from fishers’ statutory monthly returns for 2008/09
This table contains the landed1 and estimated live weight2 of species recorded in the compulsory catch and fishing effort returns provided by commercial fishers each month. These data include the catch taken as by-product as well as the targeted catch.
These catch data may differ slightly from some of the catch estimates presented for specific fisheries as the latter may include additional data from other sources, such as research log books and processors. The figures may also differ slightly from previously reported figures, as additional data may have been received by the Department of Fisheries. The table represents the latest year for which a complete set of data is available.
While scientific names have been included wherever possible, it should be noted that many fish recorded under a common name cannot be identified as belonging to a particular single species and therefore must be reported as being part of a commercial grouping of several species. For example, the common name ‘jobfish’ may be used for several species of the genus Pristipomoides.
Data for species with live weight catches of less than 500 kg have been combined into the general or ‘other’ category within each class.
Common Name Scientific Name Landed weight
(kg) Live weight
(kg)
FISH
Amberjack Seriola dumerili 17,483 17,483
Australian sardine (Pilchard) Sardinops sagax ocellatus 2,108,604 2,108,604
Barracuda (northern pike) Sphyraena spp 808 808
Barramundi (giant perch) Lates calcarifer 36,612 55,130
Bass grouper Polyprion americanus 1,162 1,162
Bigeye (not tuna) Priacanthidae 11,096 11,096
Boarfish Pentacerotidae 5,356 5,995
Bonito Sarda australis 857 857
Bream, black Acanthopagrus butcheri 43,018 43,040
Bream, monocle Scolopsis spp. 10,540 10,540
Bream, Mozambique Wattsia mossambica 1,112 1,112
Bream, Robinson's Gymnocranius grandoculis 32,453 32,453
Bream, silver (tarwhine) Rhabdosargus sarba 4,770 4,795
Bream, western yellowfin Acanthopagrus latus 7,945 7,945
Catfish, sea (golden cobbler) Ariidae 7,981 7,981
Chinaman fish (not cod) Symphorus nematophorus 7,799 7,799
Cobbler Cnidoglanis macrocephalus 66,925 93,506
Cobbler, silver Arius midgleyi 46,200 76,493
Cod Serranidae 46,742 46,830
Cod, bar (grey-banded, eight-bar) Epinephelus octofasciatus 12,498 12,498
Cod, breaksea Epinephelides armatus 5,089 5,103
Cod, chinaman Epinephelus rivulatus 1,019 1,019
Cod, Rankin Epinephelus multinotatus 119,348 119,348
STATE OF THE FISHERIES AND AQUATIC RESOURCES REPORT 2009/10 291

APPENDICES
Common Name Scientific Name Landed weight
(kg) Live weight
(kg)
FISH (continued)
Cod, spotted Epinephelus microdon, E.areolatus, E. bilobatus
57,596 57,596
Dhufish, West Australian (jewfish) Glaucosoma hebraicum 82,130 85,652
Emperor, blue-lined (grass; black snapper) Lethrinus laticaudis 2,183 2,183
Emperor, blue-spot Lethrinus hutchinsi 215,089 215,089
Emperor, red Lutjanus sebae 333,408 333,408
Emperor, red-spot (snapper) Lethrinus lentjan 33,901 33,901
Emperor, spangled Lethrinus nebulosus 53,494 53,494
Emperor, sweetlip Lethrinus miniatus 57,804 57,828
Emperor, yellow-tailed Lethrinus atkinsoni 672 672
Flagfish (Spanish flag) Lutjanus vitta, L.quinquelineatus, L.carponotatus, L.lutjanus
67,974 67,974
Flathead Platycephalidae 7,458 7,615
Flounder Bothidae 857 899
Garfish, sea Hyporhamphus melanochir 28,904 28,904
Groper (wrasses) Labridae 1,034 1,125
Groper, baldchin Choerodon rubescens 12,975 13,089
Groper, blue Achoerodus gouldii 45,550 55,782
Halibut Psettodes erumei 1,481 1,481
Hapuku Polyprion oxygeneios 21,184 21,184
Herring, Australian Arripis georgianus 181,557 181,568
Herring, Perth Nematalosa vlaminghi 1,011 1,011
Javelin fish Pomadasys spp. 39,185 39,185
Jobfish (goldband snapper) –see Snapper, goldband
Jobfish, rosy –see Snapper, rosy
Jobfish (sharptooth snapper) –see Snapper, sharptooth
Kingfish, black (cobia) Rachycentron canadum 10,634 10,634
Kingfish, yellowtail Seriola lalandi 671 684
Knifejaw Oplegnathus woodwardi 1,383 1,417
Leather jacket Monacanthidae 15,053 25,784
Mackerel, grey (broad-barred) Scomberomorus semifasciatus 20,088 20,301
Mackerel, scaly Sardinella lemuru 59,312 59,312
292 DEPARTMENT OF FISHERIES

APPENDICES
STATE OF THE FISHERIES AND AQUATIC RESOURCES REPORT 2009/10 293
Common Name Scientific Name Landed weight
(kg) Live weight
(kg)
FISH (continued)
Mackerel, shark Grammatorcynus bicarinatus 543 544
Mackerel, Spanish Scomberomorus commerson 226,031 319,711
Mangrove jack Lutjanus argentimaculatus 12,927 12,927
Morwong Cheilodactylidae 521 521
Mullet, red Mullidae 17,054 17,054
Mullet, sea Mugil cephalus 243,570 243,586
Mullet, yellow-eye Aldrichetta forsteri 24,245 24,245
Mulloway Argyrosomus hololepidotus 11,923 12,449
Mulloway, northern (black jew) Protonibea diacanthus 2,374 3,057
Parrot fish Scaridae 6,558 6,558
Perch, darktail sea (maroon sea) -see Snapper, marron
Perch, Moses –see Snapper, Moses
Perch, pearl Glaucosoma buergeri 39,048 39,048
Perch, red, maroon sea perch Lutjanus spp (large) 26,542 26,542
Perch, yellowtail Amniataba caudavittatus 1,562 1,562
Perches, other Lutjanidae 3,580 3,580
Pike, sea Sphyraena novaehollandiae 3,176 3,176
Pomfret, black Parastromateus niger 2,005 2,053
Queenfish Scomberoides commersonnianus 576 1353
Redfish, bight Centroberyx gerrardi 47,998 49,371
Redfish, yelloweye Centroberyx australis 31,928 34,710
Rockcod, blackspotted Epinephelus malabaricus 18,885 18,885
Rockcod, goldspotted Epinephelus coioides 15,380 15,380
Salmon, Western Australian Arripis truttaceus 979,068 986,759
Samson fish (sea kingfish) Seriola hippos 38,908 40,118
Scad, yellowtail Trachurus novaezelandiae 6,077 6,077
Shark, blacktip Carcharhinus spp. 23,722 61,061
Shark, bronze whaler (dusky whaler) Carcharhinus obscurus 111,186 176,658
Shark, common saw Pristiphorus cirratus 4,692 10,931
Shark, eastern school Galeorhinus galeus 3,773 5,999
Shark, golden (copper whaler) Carcharhinus brachyurus 30,237 48,074
Shark, gummy Mustelus antarcticus 374,605 595,613

APPENDICES
Common Name Scientific Name Landed weight
(kg) Live weight
(kg)
FISH (continued)
Shark, hammerhead Sphyrnidae 53,502 96,302
Shark, mako (shortfin) Isurus oxyrinchus 1,668 2,652
Shark, pencil Hypogaleus hyugaensis 999 1,589
Shark, spinner (long-nose grey) Carcharhinus brevipinna 18,324 29,084
Shark, thickskin (sandbar) Carcharhinus plumbeus 79,906 172,096
Shark, tiger Galeocerdo cuvier 20,886 58,611
Shark, whiskery Furgaleus macki 93,559 140,329
Shark, wobbegong Orectolobidae 30,554 48,561
Shark, other 1,480 2,468
Shovelnose (fiddler rays) Rhinobatidae & Rhynchobatidae 935 3,114
Skates and rays, other 8,167 21,467
Snapper, bullnose (variegated emperor) Lethrinus ravus 3,536 3,536
Snapper, crimson (formerly red snapper) Lutjanus erythropterus 203,698 203,698
Snapper, frypan Argyrops spinifer 46,961 46,965
Snapper, goldband Pristipomoides multidens 699,184 699,184
Snapper, long nose Lethrinus olivaceus 10,410 10,410
Snapper, maroon (formerly maroon sea perch) Lutjanus lemniscatus 9,385 9,385
Snapper, Moses (formerly Moses Perch) Lutjanus russelli 37,593 37,593
Snapper, nor-west Lethrinidae 3,074 3,074
Snapper, pink Pagrus auratus 416,334 420,229
Snapper, queen Nemadactylus valenciennesi 59,418 67,503
Snapper, red (swallowtail) –see Snapper, crimson
Snapper, rosy (formerly Rosy jobfish) Pristipomoides filamentosus 40,098 40,098
Snapper, ruby Etelis spp. 29,473 29,473
Snapper, saddletail sea (formerly scarlet sea perch)
Lutjanus malabaricus 179,887 179,887
Snapper, sharptooth Pristipomoides typus 5,215 5,215
Sprat, blue Spratelloides robustus 17,760 17,760
Sweep Scorpis aequipinnis 1,626 1,702
Sweetlip Haemulidae 52,855 52,855
Tailor Pomatomus saltatrix 22,625 22,625
Threadfin Polynemidae 19,147 22,754
Threadfin bream (butterfish) Nemipteridae 148,280 148,280
Threadfin, giant (king salmon) Eleutheronema tetradactylum 65,289 71,404
294 DEPARTMENT OF FISHERIES

APPENDICES
Common Name Scientific Name Landed weight
(kg) Live weight
(kg)
FISH (continued)
Trevalla, deepsea Hyperoglyphe antarctica 5,901 5,901
Trevally, golden Gnathanodon speciosus 1,047 1,047
Trevally, other (skippy) Carangidae 116,058 116,059
Trevally, skipjack Pseudocaranx dentex 9,059 9,157
Tripletail Lobotes surinamensis 6,026 6,159
Trout, coral Plectropomus maculatus 14,698 14,698
Trout, spotted (duskytail grouper) Epinephelus bleekeri 3,961 3,961
Trumpeters Terapontidae 1,041 1,041
Tuna, other Scombridae 1,154 1,200
Tuskfish, bluebone Choerodon spp. 9,110 9,110
Whitebait Hyperlophus vittatus 99,775 99,775
Whiting, King George Sillaginodes punctata 14,438 14,571
Whiting, western sand Sillago schomburgkii 159,638 159,842
Other fish 141,568 221,160
TOTAL FISH 9,222,001 10,150,555
CRABS
Crab, blue swimmer (blue manna, sand) Portunus pelagicus 833,423 833,423
Crab, champagne (spiny) Hypothalassia acerba 9,945 9,945
Crab, crystal (snow) Chaceon bicolor 153,673 153,673
Crab, giant (king) Pseudocarcinus gigas 4,826 4,826
Crab, mud Scylla spp. 4,495 4,495
Crabs, other 306 306
TOTAL CRABS 1,006,668 1,006,668
PRAWNS
Prawn, banana Fenneropenaeus merguiensis 206,113 206,113
Prawn, brown tiger Penaeus esculentus 897,754 897,754
Prawn, coral Metapenaeopsis spp 108,807 108,807
Prawn, endeavour Metapenaeus spp. 207,184 207,184
Prawn, western king Melicertus latisulcatus 1,191,496 1,191,496
Prawns, other Penaeidae 429 429
TOTAL PRAWNS 2,611,783 2,611,783
STATE OF THE FISHERIES AND AQUATIC RESOURCES REPORT 2009/10 295
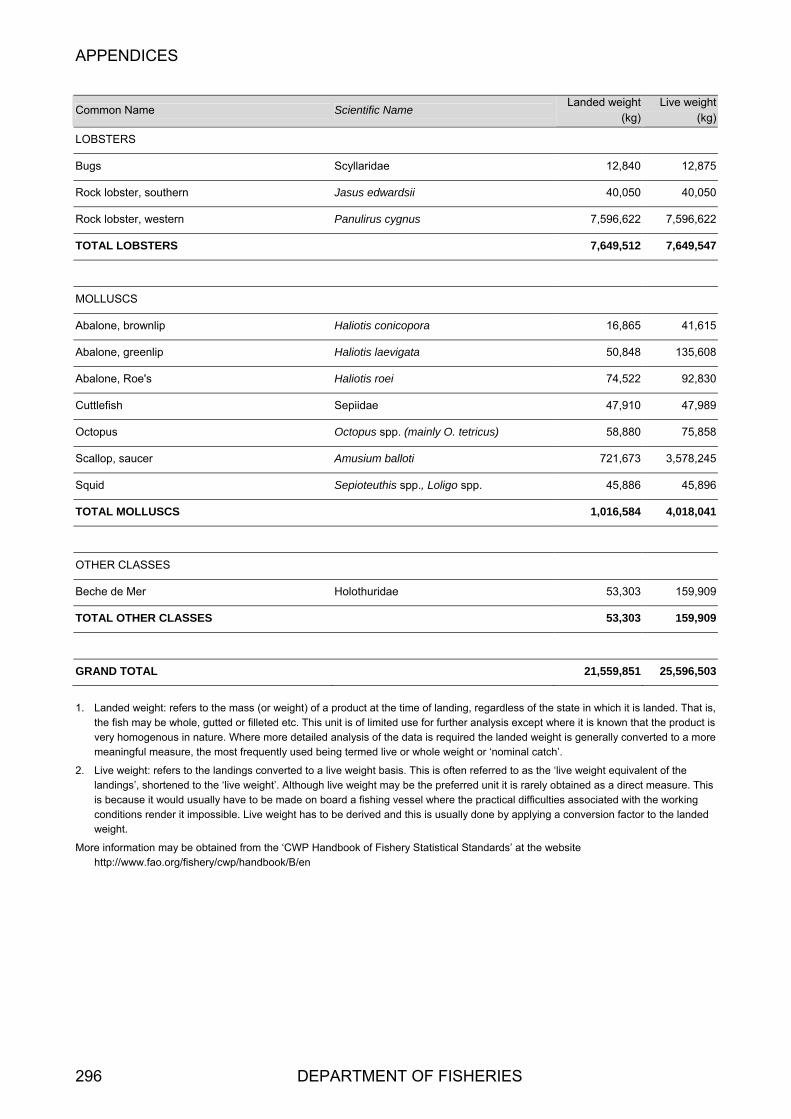
APPENDICES
296 DEPARTMENT OF FISHERIES
Common Name Scientific Name Landed weight
(kg) Live weight
(kg)
LOBSTERS
Bugs Scyllaridae 12,840 12,875
Rock lobster, southern Jasus edwardsii 40,050 40,050
Rock lobster, western Panulirus cygnus 7,596,622 7,596,622
TOTAL LOBSTERS 7,649,512 7,649,547
MOLLUSCS
Abalone, brownlip Haliotis conicopora 16,865 41,615
Abalone, greenlip Haliotis laevigata 50,848 135,608
Abalone, Roe's Haliotis roei 74,522 92,830
Cuttlefish Sepiidae 47,910 47,989
Octopus Octopus spp. (mainly O. tetricus) 58,880 75,858
Scallop, saucer Amusium balloti 721,673 3,578,245
Squid Sepioteuthis spp., Loligo spp. 45,886 45,896
TOTAL MOLLUSCS 1,016,584 4,018,041
OTHER CLASSES
Beche de Mer Holothuridae 53,303 159,909
TOTAL OTHER CLASSES 53,303 159,909
GRAND TOTAL 21,559,851 25,596,503
1. Landed weight: refers to the mass (or weight) of a product at the time of landing, regardless of the state in which it is landed. That is,
the fish may be whole, gutted or filleted etc. This unit is of limited use for further analysis except where it is known that the product is very homogenous in nature. Where more detailed analysis of the data is required the landed weight is generally converted to a more meaningful measure, the most frequently used being termed live or whole weight or ‘nominal catch’.
2. Live weight: refers to the landings converted to a live weight basis. This is often referred to as the ‘live weight equivalent of the landings’, shortened to the ‘live weight’. Although live weight may be the preferred unit it is rarely obtained as a direct measure. This is because it would usually have to be made on board a fishing vessel where the practical difficulties associated with the working conditions render it impossible. Live weight has to be derived and this is usually done by applying a conversion factor to the landed weight.
More information may be obtained from the ‘CWP Handbook of Fishery Statistical Standards’ at the website http://www.fao.org/fishery/cwp/handbook/B/en

APPENDICES
Estimated Western Australian Aquaculture Production for 2008/09
Taken from Aqua Info Number 28 2008/09
Introduction
The statistics contained in this document represent the reported production and estimated value of the aquaculture industry in Western Australia for the financial year 2008/09. Comparisons to the previous four years have also been presented. The following summaries were produced from information held within the Aquaculture Production Returns Database at the Department of Fisheries, Research Division, Hillarys.
Quarterly records received from industry are summarised by the Department of Fisheries and reported to Parliament by the Minister for Fisheries. They are also used in the yearly Department of Fisheries State of the Fisheries report, the annual report provided by Australian Bureau of Agricultural and Resource Economics (ABARE) and other publications.
Producers’ returns constitute the official production and value figures for the aquaculture industry and these are dependent on the accuracy of licensees’ returns. The data presented are based on the Aquaculture Production Returns Database, as of the 9th March 2010.
Note that all production reported in tonnes throughout this document refers to whole weight and the farm gate value refers to the value of product at the first point of recorded sale.
The Industry in 2008/09 A total of 476 aquaculture licence holders were required to submit quarterly returns for one or more quarters in the 2008/09 financial year. Of the 476 licences, 245 i.e. 51% recorded production on their returns. Marron had the largest number of producers with 179 licences recording production (Table 1).
Estimated aquaculture production increased by four per cent to 1121 tonnes in 2008/09 from the 1083 tonnes produced in 2007/08 (excludes algae, pearl oysters, and ornamental species) (Table 2). Finfish and ornamental production increased while freshwater crustacean and mussel production decreased.
The estimated value of Western Australian aquaculture (excluding algae and pearl oysters) increased by 12 per cent from $10.2 million to over $11.3 million in 2008/09 (Table 3). Finfish aquaculture made up nearly half the earnings for 2008/09.
Highlights for 2008/09
There were 476 licensed aquaculture producers
The farm gate value of aquaculture production in WA (excluding marine algae and pearl oysters) was over $11.3 million
The most valuable industry sector was barramundi ($4.8 million), followed by mussels ($1.6 million), marron ($1.4 million) and yabbies ($0.8 million)
The industry sector with the most participants was marron with 179 productive licences.
STATE OF THE FISHERIES AND AQUATIC RESOURCES REPORT 2009/10 297
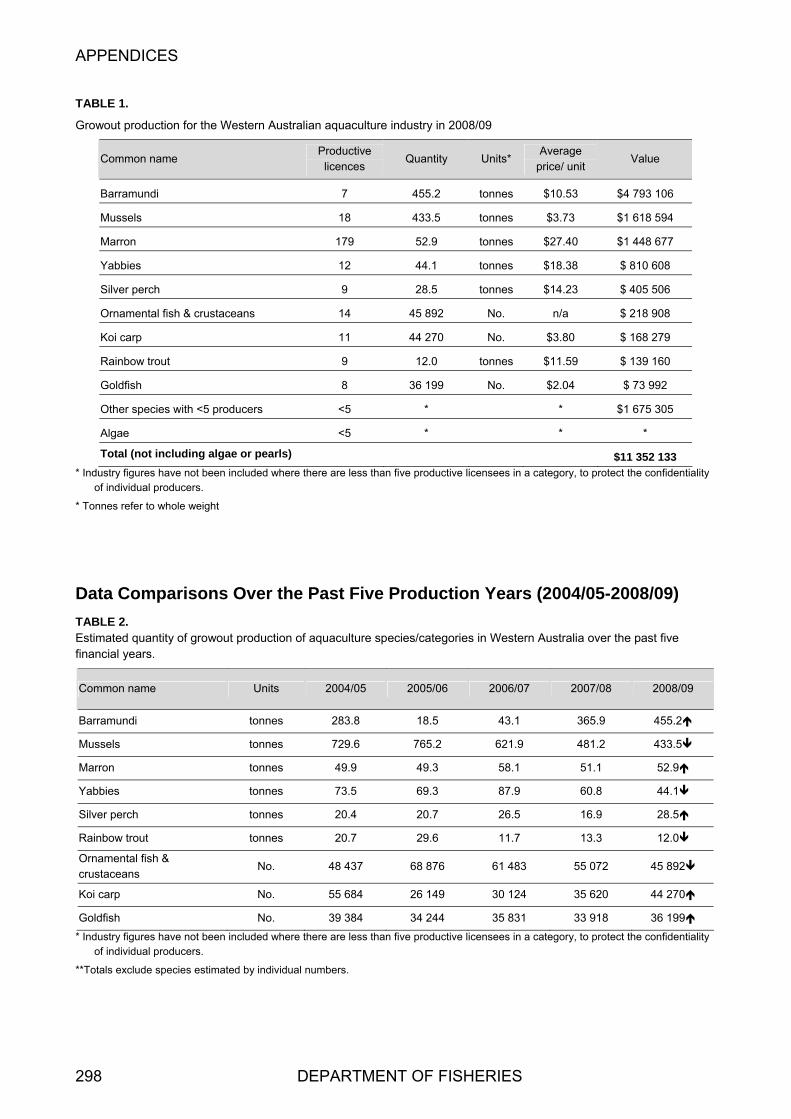
APPENDICES
TABLE 1.
Growout production for the Western Australian aquaculture industry in 2008/09
Common name Productive licences
Quantity Units* Average
Value price/ unit
Barramundi 7 455.2 tonnes $10.53 $4 793 106
Mussels 18 433.5 tonnes $3.73 $1 618 594
Marron 179 52.9 tonnes $27.40 $1 448 677
Yabbies 12 44.1 tonnes $18.38 $ 810 608
Silver perch 9 28.5 tonnes $14.23 $ 405 506
Ornamental fish & crustaceans 14 45 892 No. n/a $ 218 908
Koi carp 11 44 270 No. $3.80 $ 168 279
Rainbow trout 9 12.0 tonnes $11.59 $ 139 160
Goldfish 8 36 199 No. $2.04 $ 73 992
Other species with <5 producers <5 * * $1 675 305
Algae <5 * * *
Total (not including algae or pearls) $11 352 133 * Industry figures have not been included where there are less than five productive licensees in a category, to protect the confidentiality
of individual producers.
* Tonnes refer to whole weight
Data Comparisons Over the Past Five Production Years (2004/05-2008/09)
TABLE 2. Estimated quantity of growout production of aquaculture species/categories in Western Australia over the past five financial years.
Common name Units 2004/05 2005/06 2006/07 2007/08 2008/09
Barramundi tonnes 283.8 18.5 43.1 365.9 455.2
Mussels tonnes 729.6 765.2 621.9 481.2 433.5
Marron tonnes 49.9 49.3 58.1 51.1 52.9
Yabbies tonnes 73.5 69.3 87.9 60.8 44.1
Silver perch tonnes 20.4 20.7 26.5 16.9 28.5
Rainbow trout tonnes 20.7 29.6 11.7 13.3 12.0
Ornamental fish & crustaceans
No. 48 437 68 876 61 483 55 072 45 892
Koi carp No. 55 684 26 149 30 124 35 620 44 270
Goldfish No. 39 384 34 244 35 831 33 918 36 199
* Industry figures have not been included where there are less than five productive licensees in a category, to protect the confidentiality of individual producers.
**Totals exclude species estimated by individual numbers.
298 DEPARTMENT OF FISHERIES

APPENDICES
TABLE 3. Estimated farm gate value ($) of growout aquaculture species/categories in Western Australia over the past five financial years.
Common name/ Category 2004/05 2005/06 2006/07 2007/08 2008/09
Barramundi $1 525 947 $ 162 733 $ 467 280 $3 870 070 $4 793 106
Mussels $2 088 691 $2 159 056 $1 811 798 $1 531 849 $1 618 594
Marron $1 172 066 $1 160 834 $1 387 386 $1 298 701 $1 448 677
Yabbies $1 119 524 $1 036 980 $1 381 214 $1 059 532 $ 810 608
Silver perch $ 225 974 $ 258 949 $ 317 321 $ 245 128 $ 405 506
Ornamental fish & crustaceans $ 196 800 $ 161 412 $ 294 330 $ 237 258 $ 218 908
Koi carp $ 237 887 $ 248 098 $ 137 193 $ 160 596 $ 168 279
Rainbow trout $ 148 410 $ 172 459 $ 110 125 $ 135 005 $ 139 160
Goldfish $ 58 002 $ 55 797 $ 65 442 $ 80 724 $ 73 992
Other $ 312 395 $ 624 347 $ 883 064 $1 554 289 $1 675 305
Total (not including algae & pearls) $7 085 696 $6 040 665 $6 855 152 $10 173 151 $11 352 133
STATE OF THE FISHERIES AND AQUATIC RESOURCES REPORT 2009/10 299

APPENDICES
300 DEPARTMENT OF FISHERIES
APPENDIX 3 Research Division – Other Activities
Pemberton Freshwater Research Centre activities 2009/10
The Pemberton Freshwater Research Centre (PFRC) is the largest freshwater hatchery and research facility in Western Australia. Located on the Lefroy Brook in Pemberton it consists of two neighbouring sites, the original PFRC hatchery and the Dr Noel Morrissy Research Ponds located on Thomson’s Flat. The original PFRC hatchery site contains 10 earthen ponds, 22 concrete ponds, trout hatching and larval rearing troughs, 48 tank trout nutrition facility, and a training centre. The nearby Dr Noel Morrissy Research Ponds feature 25 earthen ponds, ranging in size from 150m2 breeding ponds to 1000m2 commercial grow-scale ponds, 28 tanks and a post-harvest handling facility. This site on Thomsons Flat also includes an area that is leased to the Pemberton Aquaculture Producers (PAP) for marron processing and marketing.
PFRC staff are responsible for the maintenance and production of trout, native fish and crayfish at the facility. They are also responsible for stocking trout into public waters and packing trout and marron for sale to commercial farmers. Efficient management and operation of a large production and research facility for fish and crayfish such as PFRC requires a high level of expertise. As a result PFRC staff provide a key regional extension service to aquaculture, recreational fishing and conservation client groups.
PFRC provides facilities, expertise and stock to support research and industry development in four key areas of conservation, recreational fishing, aquaculture and freshwater fisheries.
Key PFRC projects in 2009/10 are briefly discussed below:
Trout production for recreational fishing, aquaculture and research
Trout production at PFRC provides fingerlings and yearlings for recreational fishing, aquaculture and research. Two species of trout are produced at PFRC Brown trout (Salmo trutta) for recreational fishing and Rainbow trout (Oncorhynchus mykiss) for both aquaculture and recreational fishing.
In 2009/10 the PFRC produced 688,000 fry. These consisted of 658,000 Rainbow trout fry and 30,000 Brown trout fry, representing a decrease in production of 6% and 500% respectively, compared with 2008/09. The majority of production (81%) consisting of 532,000 Rainbow trout fry and 28,000 Brown trout fry were stocked into public waterways to support recreational fishing. A further 96,000 Rainbow trout (14%) were sold to individuals and clubs for stocking private farm dams for recreational fishing and tourism, included in the 96,000 trout fry sold to the recreational groups were 28,000 rainbow triploid fry. All the triploids were sold to private waters for recreational fishing.
The remaining 5% of trout produced 32,000 were retained for future brood stock for PFRC, yearling stocking, research and sales for private waters.
In 2009/10 during the Winter-Spring months some 23,000 Rainbow yearlings as well as 2,680 Rainbow and 400 Brown trout ex brood stock, were released to public waters for recreational fishing.
Trout research for recreational fishing and aquaculture
In late 2006 the Department commenced a review of trout production at PFRC to consider two key factors: Brown trout embryo survival and Rainbow trout brood stock selection strategies. In 2007 the Department commenced research to evaluate hatchery production techniques for producing sterile triploid trout and develop improved protocols using hydrostatic pressure and tetraploids.
Brown trout embryo survival In 2005 Brown trout embryo survival was sub-optimal, however prior to disposing of this valuable line, that is highly regarded by recreational fishers, Research Division staff commenced a study to confirm the extent of this problem and determine the contributing factors. Factors being investigated include poor sperm motility, water quality or climate change.
Investigations by the department into brown trout sperm motility showed that some trout were not producing motile sperm. This resulted in modifications to hatchery protocols to include assessment of sperm quality prior to egg fertilisation. In 2009/10 sperm motility assessment using basic visual evaluation of sperm quality resulted in a 500% improvement in brown trout fertilisation rates. However, visual assessment of sperm motility is labour intensive. Consequently sperm motility assessment has been postponed until the purchase of computing equipment and software.
Rainbow trout brood stock selection The current breeding strategy for both Rainbow and Brown trout at PFRC focuses upon random selection of brood stock. However, trout production at PFRC has two key client groups with different objectives, recreational fishing and aquaculture. Therefore, it is likely that breeding objectives for these two groups may be different. Accordingly Research division staff commenced discussions with both major client groups to establish and prioritise breeding objectives. This will ensure that in coming years, brood stock selection strategies at PFRC can be implemented to produce trout with traits that specifically meet the needs of key client groups.
The genetic line of rainbow trout at PFRC is unique. In 2008/09 staff completed a series of temperature tolerance

APPENDICES
experiments that demonstrated that the PFRC rainbow trout genetic line can withstand water temperatures of up to 28oC
without any mortalities. This temperature tolerance is superior to most domesticated lines elsewhere and is significant in regards to adapting to global warming.
Sterile triploid trout production Triploids are valuable for stocking as they cannot reproduce and continue to grow after reaching sexual maturity. The PFRC hatchery has produced triploids for many years using temperature shock to retain the first polar body of fertilised eggs. However, temperature shocking is known to have considerable variability in triploidy rates. To address this in 2006 PFRC obtained a hydrostatic pressure chamber for manipulating chromosome numbers to produce triploids and tetraploids.
Protocols for the production of triploids and tetraploids using hydrostatic pressure were developed. Juveniles were produced, however resource limitations prevented the percentage of triploids and tetraploids being analysed in either 2008/09 or 2009/10. These samples have been frozen and will be analysed when finances permit.
Native fish and crayfish conservation and biodiversity research
In response to a declining prevalence of native fish in the southwest PFRC established brood stock populations of two endemic species Pygmy Perch (Edelia vittata) and Western Minnows (Galaxias occidentalis). The aim of this research project is to develop large-scale pond production techniques for these species to enable stocking of public and private water bodies. It is thought that the decline in prevalence of native fish is related to the increased spread of introduced Gambusia (Gambusia affinis), but research at PFRC indicates that other factors may also be responsible. Although Gambusia were originally introduced to control mosquito populations, it has been shown that the native Pygmy perch consume more mosquito larvae. Therefore, while production and stocking of Pygmy perch has direct conservation and biodiversity benefits, it is also likely to result in human health benefits through a reduction in mosquito numbers and Ross River virus.
Broodstock populations of two other freshwater native fish species that have been listed as critically endangered, the Trout Minnow (G. truttaceus) and Balson’s Pygmy Perch (N. Balstoni), are also being established at PFRC in an effort to close their lifecycles, develop large scale production techniques and restock waterbodies within their original distribution.
In 2005/06 a captive breeding program to conserve marron
biodiversity was established at PFRC. The key focus of this program was to establish a breeding population of the Margaret River marron, which has been listed as critically endangered. The South West Catchments Council (SWCC) provided funding to develop a molecular genetic test (RAPID’s) to identify “pure” marron from hybrids in collaboration with UWA. This resulted in the establishment of the only “pure” brood stock population of the rare Margaret River marron at PFRC. These broodstock produced over 1200 juveniles in the first year of this project. These juveniles have been reared to sexual maturity at PFRC. In July 2009 these marron bred in the ponds at PFRC and 2500 progeny were tagged and restocked in the Margaret River.
In addition, captive breeding populations from three other river systems were established at PFRC. These broodstock represent the genetic biodiversity of the northern, central and eastern marron populations found in Western Australia. Their progeny will be available for 1) marron farmers wishing to increase the genetic diversity of their stocks, 2) wild fisheries research involving the release and recapture of tagged juveniles in the recreational marron fishery, and 3) restocking both catchments and farm dams in each of the three regions.
Marron aquaculture research and development
In 2006 the FRDC project 2000/215 “Improved performance of marron using genetic and pond management strategies” was completed. Working with industry on commercial marron farms Research Division staff validated and established current best practice farming techniques. This showed that correctly constructed and professionally managed marron farms can achieve production levels that are twice that of those which do not follow best practice.
The project also showed that poor brood stock selection, where farmers sell their largest marron and breed from the remaining slower growing animals had reduced the growth rate of marron on commercial farms. To address this, the Research Division staff initiated a selective breeding program that resulted in a 100% improvement in growth rate. In 2007 PFRC produced around 25,000 juveniles for sale to industry. A repository population of the better performing genetic lines was retained at PFRC for future selective breeding and sale of progeny to industry. Increased demand for these juveniles has necessitated re-establishing the breeding program at PFRC.
STATE OF THE FISHERIES AND AQUATIC RESOURCES REPORT 2009/10 301

APPENDICES
Activities of the Fish Health Unit during 2009/10
The Fish Health Unit of the Department of Fisheries was formed in 1988 and is based at South Perth within the Animal Health Laboratories of the Department of Agriculture. The unit is staffed by 1 full-time and 2 part-time fish pathologists, one research scientist, one laboratory manager and one technical officer. During the year, the unit operated at reduced capacity since one part-time pathologist left in December 2009 and was not replaced.
The unit is accredited to ISO 17025 and provides a diagnostic service to the fishing and aquaculture industry in Western Australia, investigates ‘fish kills’, contributes to policy advice developed by the Department, carries out research on diseases of aquatic organisms, and has a minor extension role. Greater emphasis has been placed on staff visiting aquaculture farms to encourage sustainable farming practices.
Key activities and achievements of the unit during 2009/10 were as follows:
The fish health laboratory received a total of 107 diagnostic cases during the 2009/10 – a decrease on the previous period. This reflects the general downturn in aquaculture and pearling activity.
The provision of export health certificates for yabbies and marron has continued its downward trend since 2002, when 55 certificates were issued, to none in this reporting period. This decline in export activity is due to the continuing drought and to changes in export destinations within the industry.
The provision of pearling translocation certificates also showed a decline to 6 cases, reflecting the downturn in the economy, changes within the industry and also the adoption of a new translocation protocol requiring much less testing.
Staff spent time assisting a number of sea-cage culture farms in WA coastal waters. This is a growing area of activity in Western Australia.
There were seven cases of notifiable diseases reported in 2009/10, a large increase on the previous year when none were reported. The diseases were mostly records
of iridovirus in ornamental fish, but there were three submissions of the fungus disease “Epizootic Ulcerative Syndrome” from the Canning River and Hardy Inlet in October, and one case in an imported Siamese fighting fish in November.
Investigation of disease in pearl oysters (Pinctada maxima) through two Fisheries Research and Development Corporation (FRDC) funded projects; FRDC 2008/30 to develop methods to detect stress in oysters and FRDC 2008/31 to investigate novel Chlamydia-like bodies in pearl oysters has continued. The resignation and non-replacement of one of the contract research officers involved has resulted in a considerable extra workload for the remaining Fish Health staff. The cause of the mortalities since 2006 has not yet been determined.
Under the WA Government’s Natural Resource Management (NRM) strategy $235 000 was obtained to purchase of a real-time PCR machine and a laser microdissection microscope.
In collaboration with staff from the Department of Water and the Water and Rivers Commission, 10 reports of ‘fish kills’ throughout the State were investigated. This was about half the number investigated last year. Most ‘fish kills’ were due either to poor water quality or toxic algal blooms.
A range of national committees including the national Aquatic Animal Health Committee, the National Animal Health Strategy Advisory Group and Biosecurity Australia frequently seek the expertise of the Fish Health Unit. This reflects the greater emphasis on national coordination and consultation on aquatic animal health issues under the national AQUAPLAN 2005-2010 biosecurity strategy.
The laboratory continued in its role as one of 6 regional resource centres for aquatic animal health within the Network of Aquaculture Centres (NACA) in the Asia-Pacific.
302 DEPARTMENT OF FISHERIES

APPENDICES
Indian Ocean Territories Fishery Status Report S.J. Newman, M. Pember, C. Skepper and L. Bellchambers
Management input from R. Green
Main Features
Status
Stock level Some species at risk
Fishing Level Not Assessed
Current Landings
Total Not assessed
Main Commercial Fishery Not reportable
Fishery Description
Commercial In November 2002, the territorial seas (out to 12 nautical miles) of the Cocos (Keeling) Islands and Christmas Island were declared as ‘excepted waters’ from the Fisheries Management Act 1991. Management responsibilities for these waters were transferred from the Australian Fisheries Management Authority (AFMA) to the Department of Transport and Regional Services. The Government of Western Australia’s Department of Fisheries (the Department) has now taken on management responsibilities for the marine waters of the Indian Ocean Territories out to 12 nm, under a Service Delivery Arrangement with the Commonwealth Attorney General’s Department (AGD), and AFMA continues to manage the waters from 12nm to 40 nm. The location of the Indian Ocean Territories and their proximity to the Western Australian coast are illustrated in Indian Ocean Territories Figure 1.
Under the Service Delivery Arrangement with the AGD, the Department now manages commercial, recreational, charter and aquaculture activities at the Cocos (Keeling) Islands and Christmas Island, in addition to providing fish health diagnostic services, biosecurity, fish habitat protection advice, fish pathology and licensing services. The Commonwealth Minister for Home Affairs currently holds responsibility for these excepted waters under the Fish Resources Management Act 1994 (WA) (CI/CKI) (the ‘Applied Act’).
The commercial Christmas Island Line Fishery (CILF) primarily targets pelagic species, mainly wahoo (Acanthocybium solandri) and yellowfin tuna (Thunnus albacares). In addition, limited demersal fishing activities are also undertaken targeting deepwater snappers and groupers.
The Cocos (Keeling) Islands Marine Aquarium Fish Fishery (CKIMAFF) primarily targets the endemic Cocos Angelfish or Yellowheaded Angelfish (Centropyge joculator), and to a lesser extent the lemonpeel angelfish (Centropyge flavissima).
Recreational Large amounts of recreational fishing are undertaken around the Cocos (Keeling) Islands and Christmas Island targeting both finfish and invertebrate species. The Cocos (Keeling) Islands consist of a diverse range of fishable habitats that include a sheltered lagoon, fringing reefs and offshore ‘blue water’ environments that support a range of demersal and
pelagic fish species, as well as various crustaceans (e.g. crabs) and molluscs (e.g. gong gong), which are highly sought after by fishers for both individual and community purposes. Christmas Island has a limited amount of habitat available for fishing with no lagoon present, fringing reef surrounding the island and offshore ‘blue water’ environments that support a limited range of demersal and pelagic fish species, as well as some invertebrates in comparison to the Cocos (Keeling) Islands.
Governing legislation/fishing authority
Commercial Fish Resources Management Act 1994 (WA) (CI/CKI) (the
‘Applied Act’)
Fish Resources Management Regulations 1995(WA) (CKI/CI) and subsidiary legislation
Fishing Boat Licenses with conditions
Cocos (Keeling) Islands Marine Aquarium Fish Fishery – Commonwealth Government Environment Protection and Biodiversity Conservation Act 1999 (Export Exemption).
Recreational Fish Resources Management Act 1994 (WA) (CI/CKI) (the
‘Applied Act’)
Fish Resources Management Regulations 1995 (WA) (CKI/CI) and subsidiary legislation.
Consultation processes
Commercial Department–industry/community consultation – Christmas
Island and Cocos (Keeling) Islands.
Recreational Community Consultation - Cocos (Keeling) Islands and
Christmas Island.
Boundaries
Commercial The territorial seas from the shoreline out to a distance of 12 nautical miles around the Cocos (Keeling) Islands and Christmas Island (Indian Ocean Territories Figure 1).
STATE OF THE FISHERIES AND AQUATIC RESOURCES REPORT 2009/10 303

APPENDICES
Recreational The territorial seas from the shoreline out to a distance of 12 nautical miles around the Cocos (Keeling) Islands and Christmas Island.
Management arrangements
Commercial The Christmas Island Line Fishery (CILF) is managed primarily through input controls in the form of limited entry to the fishery and gear restrictions. There are 3 licenses in the fishery. In 2009, all 3 licenses operated in the fishery. The CILF also has output controls in the form of quota limits on both demersal and pelagic species to be harvested.
The commercial Cocos (Keeling) Islands Marine Aquarium Fish Fishery (CKIMAFF) is managed through input controls in the form of a limited entry fishery (there is only 1 licence in the fishery) and gear restrictions. The fishery also has a number of output controls in the form of limits on the species permitted to be harvested, limits on the total number of individuals of all species combined that can be harvested in a year and limits of the number of individuals within a Family that can be harvested within a year.
Recreational Island-specific fisheries management arrangements for the Indian Ocean Territories are currently being developed. This will include assigning species to a number of risk categories and the development of species-specific or species group specific bag and size limits.
Research summary
Risk assessment workshops were undertaken in 2006, 2007 and 2009, to identify and refine fisheries research and management priorities at the Indian Ocean Territories. Following these workshops finfish fisheries research has focused on collecting biological material to assess the wahoo stocks and on collecting tissue samples from a suite of species at the Cocos (Keeling) Islands and Christmas Island to examine their connectivity with other sites along the Western Australian coast and locations to the north. Invertebrate fisheries research has focused on surveys to assess the abundance and biology of gong gong (Lambis lambis) and also to understand the abundance and distribution of bêche-de-mer (Holothurians) and clams (Tridacna spp.). Biodiversity research has also established a reef-monitoring program to detect changes in reef health due to natural and anthropogenic impacts.
Retained Species Commercial landings
(season 2009) Not reportable
Wahoo (Acanthocybium solandri) is the main target species of the CILF. Other pelagic species are also targeted during the trolling operations and include yellowfin tuna (Thunnus albacares) and to a lesser extent mahi mahi (Coryphaena hippurus). Some commercial fishing activities are also undertaken for demersal fish species, mainly deep slope species such as ruby snapper (Etelis spp.). The commercial
catch for Christmas Island consists of catch data from only 3 vessels and thus the exact catch data is not reportable due to confidentiality provisions. However, it can be reported that the total catch was less than 6t. The catch in 2009 was slightly higher than that reported in 2008.
The CKIMAFF targets the endemic Cocos Angelfish or Yellowheaded Angelfish (Centropyge joculator), and to a lesser extent the lemonpeel angelfish (Centropyge flavissima). As there is only one license in the CKIMAFF the catch data is not reportable due to confidentiality provisions.
Recreational catch estimate
(season 2009) Not assessed
There are large recreational fishing fleets operating around the Cocos (Keeling) Islands and Christmas Island. The amount and magnitude of the recreational fishing catch and effort at these islands has not been assessed. Recreational bag limits, area closures, and gear restrictions have been proposed.
Fishing effort/access level
Commercia: Effort in the CILF has been relatively stable over the past two years. Effort in the Fishery is weather dependent and is limited by access to the water through the principal boat ramp at Flying Fish Cove, and to a lesser extent the Ethel Beach boat ramp.
Effort in the CKIMAFF has been similar over the last few years providing a similar level of catch.
Recreational Effort by recreational anglers at both Cocos (Keeling) and Christmas Island is weather dependent. At the Cocos (Keeling) Islands the prevailing weather conditions determine what part of the Island complex is subject to fishing activities. Access to the water at Christmas Island is limited to the principal boat ramp at Flying Fish Cove, and to a lesser extent the Ethel Beach boat ramp.
Stock Assessment Assessment complete: Yes
Assessment method: Risk Assessment
Breeding stock level: Some species at risk
Beche de Mer: In 2006 a large-scale assessment of the bêche-de-mer communities inhabiting the lagoon and outer reef at the Cocos (Keeling) Islands was undertaken to determine the status of key holothurian stocks and enable recommendations to be made regarding the feasibility of a commercial bêche-de-mer fishery being developed in the region. Analysis of abundance and distribution data found that the bêche-de-mer community is strongly influenced by habitat and although some species are wide-ranging and found in relatively high densities, they tend to be of low economic value. In contrast, species of moderate to high value were recorded at densities too low to support commercial fisheries and typically had very restricted
304 DEPARTMENT OF FISHERIES

APPENDICES
distributions. The bêche-de-mer community found at the Cocos (Keeling) Islands is near to pristine, due to a lack of historical fishing pressure. Bêche-de-mer stocks are very sensitive to fishing pressure and have been heavily overexploited in other areas of the Indian and Pacific Oceans.
Gong Gong: The common spider conch or gong gong (Lambis lambis) is a heavily recreationally targeted gastropod inhabiting shallow waters of the lagoon. This species is vulnerable to over-fishing as it is highly accessible and presumably shares biological traits with other exploited conch species, including slow growth and late maturity. Monitoring data collected in 2007, 2008 and 2009 indicate that the current abundance of gong gong is substantially lower than that recorded historically. While heavy fishing pressure has presumably contributed to the reduction in gong gong numbers, further monitoring is required to determine the role of recruitment variability in maintaining gong gong populations at the Cocos (Keeling) Islands and changes in the lagoon system.
Giant Clams: The sustainability of giant clam (Tridacna spp.) and coral species were identified as potential concerns during recent risk assessments undertaken for the marine resources of the Cocos (Keeling) Islands by the Department of Fisheries. To address these concerns, research has been expanded to assess the status of Tridacna clams at the islands. In addition, an on-going reef monitoring program has been established. The implementation of these initiatives will enable the Department of Fisheries to access the health of the coral reef ecosystems at the Cocos (Keeling) Islands and effectively detect change, both spatially and temporally, resulting in better management of the natural resources of the Atoll. Finfish: Data on the abundance of finfish species is being collated and collected to determine changes over time. A number of recent surveys have been undertaken at both localities (Hobbs, Choat pers. comm.). Some species appear to have exhibited marked declines in abundance. For example, Lincoln Smith et al. (1995) reported that the squaretail coral trout (Plectropomus areolatus) was abundant on shallow reefs (<10m) and was one of the species most commonly recorded on deep reefs (15-20m). Cocos Malay community members have advised that these species were targeted in the waters of the lagoon using lines. This species is now extremely low in abundance at the Cocos (Keeling) Islands (Choat pers. comm.), suggesting local depletion and/or overexploitation of the stock (we presently know very little about the stock structure of species in the Indian Ocean Territories, in particular gene flow and linkages with other populations elsewhere in the Indian Ocean).
The pelagic species that are targeted by the CILF (e.g. wahoo, yellowfin tuna) are likely to be part of a wider Indian Ocean stock. However, the demersal species are likely to be localized stocks that are reliant upon self-recruitment (a key research gap).
There is anecdotal evidence of localised depletion of some deep slope species like rosy snapper (Pristipomoides filamentosus) and ruby snapper (Etelis carbunculus) around Christmas Island. An increasing number of recreational fishers are using electric-powered lines to target deep-slope demersal finfish species at the Indian Ocean Territories,
thereby increasing the effective fishing effort for these species.
Aquarium Fish: The CKIMAFF targets Centropyge joculator and to a lesser extent Centropyge flavissima. Centropyge joculator is endemic to the Cocos and Christmas Islands and inhabits fringing reefs from 15 to 70 m. Little is known about the biology of C. joculator although Allen et al. (2007) describe this species as being abundant on Christmas Island.
Non-Retained Species Bycatch species impact: Negligible
Fishing in the CILF for pelagic species such as wahoo uses specialised trolling gear to target the fish and involves limited discarding. Species occasionally caught and sometimes retained but generally discarded include billfish, barracuda, shark, mackerel tuna and trevally. A high proportion of the above species are expected to survive capture and release by the fishery. Consequently, it is considered likely that the pelagic fishery has a negligible impact on stocks of discarded species. Fishing for demersal species in the CILF particularly those in the deep slope waters involves limited discarding as most species are retained for processing.
The fishing techniques used to capture fish in the CKIMAFF involve using hand or scoop nets, or a small seine net of specific dimensions (the seine net cannot exceed 16 metres in length, must have a mesh of less than or equal to 28mm and a drop of not more than 3 metres) and may use SCUBA equipment. Thus, the CKIMAFF has negligible bycatch due to the highly selective nature of fishing activities.
Protected species interaction: Negligible
The line fishing methods used in CILF are not known to catch any protected species. However, there is some potential for lines to inadvertently catch seabirds at Christmas Island.
No protected species interactions have been reported for the CKIMAFF.
Ecosystem Effects Food chain effects: Not assessed
Habitat effects: Negligible
The line fishing methods used in the CILF and the hand collection method used in the CKIMAFF are likely to have minimal impact on the habitat.
Social Effects Commercial At least 3 people were employed in the CILF around Christmas Island during 2009. This estimate is based on the number of vessels reporting catches and the average number of crew on each boat.
At least 2 people were employed in the CKIMAFF around Cocos (Keeling) Islands during 2009.
STATE OF THE FISHERIES AND AQUATIC RESOURCES REPORT 2009/10 305

APPENDICES
Recreational Due to their sport fishing and eating qualities, wahoo and other pelagic species are popular target species for recreational anglers and fishing charter operators at the Indian Ocean Territories, particularly at Christmas Island. They are usually captured from small boats, although shore-based fishing is also undertaken.
A large variety of demersal and lagoon finfish and invertebrate species are caught by recreational/customary fishers at Cocos (Keeling) Islands involving the use of a large number of small vessels. Similarly, recreational fishers at Christmas Island undertake fishing activities from a number of small vessels and also fishing from the shore and catch a large variety of demersal finfish species including a large number of deep slope species.
Economic Effects Estimated annual commercial value (to fishers)
for year 2009: Not assessed
The value of the CILF is not known. The value of the CKIMAFF is also unknown, although C. joculator commands a high price on the international market.
Fishery Governance Commercial Current Fishing (or Effort) Level Not assessed
Target commercial catch range Not assessed
The potential fishing effort for both pelagic and demersal fish species at both the Cocos (Keeling) Islands and at Christmas Island is high with a capacity to operate over the entire extent of the fishable area at each island group. Given the restricted amount of habitat and fishing area available it is expected that fishing pressure on some species at Cocos (Keeling) Islands or Christmas Island is above optimum levels.
The catch of the CKIMAFF has been small since its inception in 1993. There is little incentive for the single licensee to
increase catch or effort since market viability and high prices are maintained by only having small numbers of fish available for sale.
New management initiatives (2011)
Following initial community and stakeholder consultation, the Department released the Cocos (Keeling) Islands recreational fishing guidelines for public comment in December 2006 and the Christmas Island Fisheries Management Strategy for public comment in May 2007. The Cocos (Keeling) Islands guidelines were solely focused on the recreational fishing sector, while the Christmas Island fisheries management strategy included recreational guidelines, commercial fishing models and charter fishing concepts for community feedback.
Following extensive community consultation, initial research surveys and observation of fishing practices, the need for increased protection to ensure sustainability has been identified for a number of species.
Island-specific fisheries management arrangements for the Indian Ocean tErritories are currently being developd. This will includee assigning species to a number of risk categories and the development of species-specific or species group specific bag and iszr limits..
The Department is reviewing the management arrangements for the Christmas Island Line fishery and the Cocos (Keeling) Islands Marine Aquarium Fish Fishery.
The effective implementation of any future fisheries management legislation at the Indian Ocean Territories, will require the development of community education and compliance enforcement programs.
External Factors The demersal fish and invertebrate populations of Cocos (Keeling) Islands and Christmas Island are likely to consist of small, isolated populations that are expected to experience highly variable recruitment due to environmental fluctuations.
306 DEPARTMENT OF FISHERIES

APPENDICES
INDIAN OCEAN TERRITORIES FIGURE 1
Location of the Cocos (Keeling) Islands and Christmas Island comprising the Indian Ocean Territories within the Indian Ocean and illustrating their proximity to the Western Australian coast.
STATE OF THE FISHERIES AND AQUATIC RESOURCES REPORT 2009/10 307

APPENDICES
APPENDIX 4 Annual performance for commercial fisheries subject to export approval under the Australian Government’s Environment Protection and Biodiversity Conservation Act 1999
The following table provides a summary of the issues and performance measures for fisheries subject to the above Act and their annual performance. The period assessed in each case is the most recent season for which complete data are available. As a result of the duration required for data collection and analysis, the years being assessed in this volume are the 2008/09 season or the calendar year 2009.
In addition to this summary, more detailed information on the annual performance of each fishery is provided in the
relevant status reports presented throughout this volume. Within the individual status reports, each performance measure assessed is shown in a highlighted box to assist the reader.
It should also be noted that where naturally occurring fluctuations in fish stocks have required management adjustments or where improvements have been made to methods of analysis, these have in some cases (asterisked) required a revision of the performance measure this year.
Current performance Fishery details Issue/species Performance measure Comment
in 2008/09 or 2009
Greenlip/brownlip abalone Areas 2/3 (spawning stock)
Effort range 907–1,339 diver days; minimum meat weight 140 g greenlip, 160 g brownlip
Acceptable
Roe’s abalone Area 1 (spawning stock)
Effort range 14–43 diver days; total catch 9.9 t
Acceptable
Adverse weather conditions limited fishing A reduction to 5t recommended for 2009
Roe’s abalone Area 2 (spawning stock)
Effort range 80–106 diver days; total catch 19.8 t
Acceptable
Roe’s abalone Area 5 (spawning stock)
Effort range 100–140 diver days; total catch 20 t
Acceptable
Roe’s abalone Area 6 (spawning stock)
Effort range 80–127 diver days; total catch 12 t
Acceptable
85% of quota taken in Area 5 due to adverse weather.
Fishery: Abalone Date of certification: March 2008 Approval type: Accredited Export Exempt Fishery Expiry date: September 2014
Roe’s abalone Area 7 (spawning stock)
Effort range 175–215 diver days; total catch 36 t
Acceptable Effort was lower due to reduced TACC
308 DEPARTMENT OF FISHERIES

APPENDICES
Current performance Fishery details Issue/species Performance measure Comment
in 2008/09 or 2009
Roe’s abalone Area 8 (spawning stock)
Effort range 140–200 diver days; total catch 12t
Acceptable
Fishery: Abrolhos Islands and Mid West Trawl Date of certification: 17 March 2005 Approval type: Accredited Export Exempt Fishery Expiry date: March 2013
Scallops (spawning stock)
The residual stock index determines a predicted catch that sets the length of the next season
Acceptable
The recruit survey indicated low abundance and pre-season surveys indicated small meat size and poor quality so season did not open.
Fishery: Beche-de-mer Date of certification: December 2004 Approval type: Approved Wildlife Trade Operation Exemption Expiry date: December 2010
Beche-de-mer species (spawning stock)
The preliminary acceptable catch range is 50–150 t: catch rate above 80 kg/ crew-day fished
Acceptable
Total catch above range due to additional target species (deep water redfish. Target catch range will be revised as more Information becomes available
Western king prawn (spawning stock)
Annual exploitation rate of king prawns to not exceed 60% in any one year
Acceptable Very low level of effort this year.
Fishery: Broome Prawn Date of certification: August 2004, extended April 2010 Approval type: Accredited Export Exempt Fishery Expiry date: August 2010
Coral prawns (spawning stock)
Total catch within acceptable range of 20–90 t (7-year catch range)
Acceptable As above
Tiger prawn (spawning stock)
Catch rate above 25 kg/hr (6 fathom quad gear) revised from original 8–10 kg/hr (7.5 fathom twin gear)
Acceptable
King prawn (spawning stock)
Total catch within acceptable range of 350–500 t
Acceptable Below range due to conservative harvesting strategies
Endeavour prawn (spawning stock)
Total catch within acceptable range of 120–300 t
Acceptable
Fishery: Exmouth Gulf Prawn Date of certification: March 2003 Approval Type: Accredited Export Exempt Fishery Expiry date: February 2013
Banana prawn (spawning stock)
Total catch within acceptable range of 10–60 t for years with significant rainfall and 0–2 t for years with low rainfall
Acceptable Low recorded catch correlates to low rainfall
STATE OF THE FISHERIES AND AQUATIC RESOURCES REPORT 2009/10 309
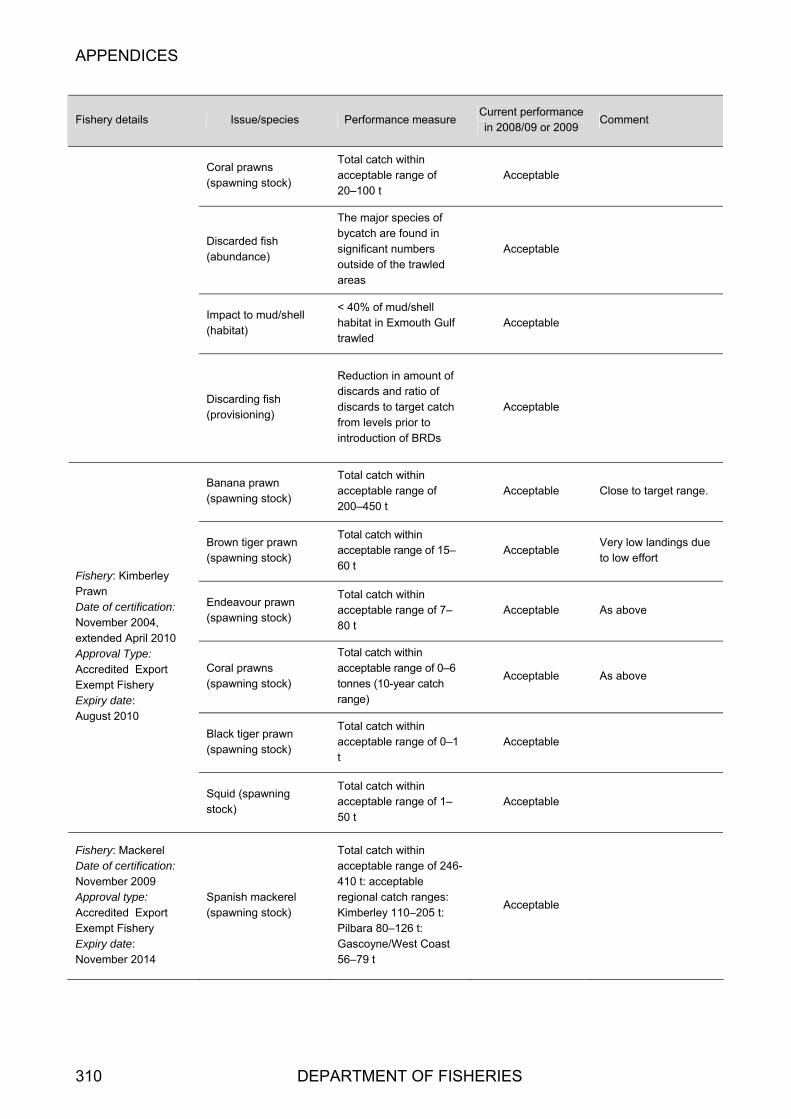
APPENDICES
Current performance Fishery details Issue/species Performance measure Comment
in 2008/09 or 2009
Coral prawns (spawning stock)
Total catch within acceptable range of 20–100 t
Acceptable
Discarded fish (abundance)
The major species of bycatch are found in significant numbers outside of the trawled areas
Acceptable
Impact to mud/shell (habitat)
< 40% of mud/shell habitat in Exmouth Gulf trawled
Acceptable
Discarding fish (provisioning)
Reduction in amount of discards and ratio of discards to target catch from levels prior to introduction of BRDs
Acceptable
Banana prawn (spawning stock)
Total catch within acceptable range of 200–450 t
Acceptable Close to target range.
Brown tiger prawn (spawning stock)
Total catch within acceptable range of 15–60 t
Acceptable Very low landings due to low effort
Endeavour prawn (spawning stock)
Total catch within acceptable range of 7–80 t
Acceptable As above
Coral prawns (spawning stock)
Total catch within acceptable range of 0–6 tonnes (10-year catch range)
Acceptable As above
Black tiger prawn (spawning stock)
Total catch within acceptable range of 0–1 t
Acceptable
Fishery: Kimberley Prawn Date of certification: November 2004, extended April 2010 Approval Type: Accredited Export Exempt Fishery Expiry date: August 2010
Squid (spawning stock)
Total catch within acceptable range of 1–50 t
Acceptable
Fishery: Mackerel Date of certification: November 2009 Approval type: Accredited Export Exempt Fishery Expiry date: November 2014
Spanish mackerel (spawning stock)
Total catch within acceptable range of 246-410 t: acceptable regional catch ranges: Kimberley 110–205 t: Pilbara 80–126 t: Gascoyne/West Coast 56–79 t
Acceptable
310 DEPARTMENT OF FISHERIES

APPENDICES
Current performance Fishery details Issue/species Performance measure Comment
in 2008/09 or 2009
Fishery: Marine Aquarium Managed Fishery Date of certification: October 2008 Approval type: Approved Wildlife Trade Operation Exemptions Expiry date: October 2011
Seahorses of hippocampus species
Number taken - 340 Acceptable
Red emperor and goldband snapper (spawning stock)
Spawning biomass > 40% of virgin spawning biomass with lower limit of 30%; total annual catches should not increase > 20% above average catches of previous 4 years; no decrease in annual trap catch rates in 2 consecutive years
Acceptable
Total catch was just above the upper limit, but catches of goldband were on target and red emperor was below.
Fishery: Northern Demersal Scalefish Date of certification: June 2010 Approval type: Accredited Export Exempt Fishery Expiry date: June 2015
Cods/groupers (spawning stock)
Total annual catch should not increase >20% above average catch of previous 4 years; no decrease in annual trap catch rates in 2 consecutive years.
Acceptable
Banana prawns (spawning stock)
Nickol Bay: total catch in high rainfall years within acceptable range of 40–220 t: in low rainfall years within acceptable range of 0–40 t.
Acceptable
Onslow: total catch within acceptable range of 2–90 t
Acceptable
Brown tiger prawn (spawning stock)*
Acceptable catch ranges of Nickol Bay 2–40 t and Onslow 10–120 t
Acceptable
Western king prawn (spawning stock)
Acceptable catch ranges of Nickol Bay 20–70 t and Onslow 10–55 t
Acceptable Below target due to low effort.
Fishery: Onslow and Nickol Bay Prawn Date of certification: November 2004, extended April 2010 Approval Type: Accredited Export Exempt Fishery Expiry date: August 2010
Endeavour prawn (spawning stock)
Total catch within acceptable ranges; Nickol Bay 1-10 t and Onslow 5-20 t.
Acceptable As above
STATE OF THE FISHERIES AND AQUATIC RESOURCES REPORT 2009/10 311

APPENDICES
Current performance Fishery details Issue/species Performance measure Comment
in 2008/09 or 2009
Coral prawns (spawning stock)
Total catch within acceptable range of Nickol Bay 1–15 t (10-year catch range) and Onslow 4–20 t
Acceptable As above
Black tiger prawn (spawning stock)
Total catch within acceptable range of 0–2 t
Acceptable
Fishery: Pearl Oyster Date of certification: September 2003, extended October 2008 Approval type: Accredited Export Exempt Fishery Expiry date: October 2013
Silver-lipped (gold-lipped) pearl oyster (spawning stock)
Fished area should be < 60% of species distribution; catch rates should not decrease by > 50% from historical averages of 29.5 oysters/hr (Zone 2) and 34.8 oysters/hr (Zone 3); > 30% of Zone 1 catch should be > 150 mm shell length
Acceptable
Catch rates in Zones 2 and 3 above performance levels due to very good stock levels.
Fishery: Pilbara Trap Date of certification: November 2004 Approval type:: Approved Wildlife Trade Operation Exemption Expiry date: December 2007 Under review by DEWHA
Long-lived target species (spawning stock) – includes Rankin cod, red emperor, scarlet perch, goldband snapper, red snapper, spangled emperor
Spawning biomass of Rankin cod and red emperor should remain above minimum limit of 40% of virgin spawning biomass Annual trap catch should not increase > 20% above average catch of previous 4 years No decrease in annual trap catch rates in > 2 consecutive years
Acceptable
Fishery: Pilbara Trawl Date of certification: November 2004 Approval type: :Approved Wildlife Trade Operation Exemption Expiry date: October 2009
Long-lived target species (spawning stock) – includes Rankin cod, red emperor, scarlet perch, goldband snapper, red snapper, spangled emperor
Spawning biomass of Rankin cod and red emperor should remain above minimum limit of 40% of virgin spawning biomass; annual trawl catch should not increase > 20% above average catch of previous 4 years; no decrease in annual trawl catch rates in > 2 consecutive years
Acceptable
312 DEPARTMENT OF FISHERIES

APPENDICES
Current performance Fishery details Issue/species Performance measure Comment
in 2008/09 or 2009
Short-lived target species (spawning stock)
Median spawning biomass of blue-spot emperor should be
40% of the 1993 spawning biomass in Area 1; annual catch of each short-lived target species should not increase > 20% above the average annual catch of the previous 4 years; annual catch rate of each short-lived target species should not decrease in two consecutive years
Acceptable
Bycatch of protected species – dolphins
Number of dolphins caught by the fishery should be < 75/yr, assuming 100% catch mortality; all skippers to maintain records of the time, date, shot duration and location of each incidental capture
Acceptable
Bycatch of protected species – turtles
Number of turtles caught should be reduced by 50% of 2002 level following implementation of mitigation devices; number of turtles released alive should be greater than or equal to 72% of total captures per year; all skippers to maintain records of the time, date, shot duration and location of each incidental capture
Acceptable
Bycatch of protected species – syngnathids
Number of pipefish caught and released alive should be < 500/yr; number of seahorses caught and released alive should be < 60/yr; all skippers to maintain records of the time, date, shot duration and location of each incidental capture
Acceptable
STATE OF THE FISHERIES AND AQUATIC RESOURCES REPORT 2009/10 313

APPENDICES
314 DEPARTMENT OF FISHERIES
Fishery details Issue/species Performance measure Current performance in 2008/09 or 2009
Comment
Bycatch of protected species – sawfish
Number of sawfish caught should be < 120/yr; number of sawfish released alive should be increased to 50% of captures by 2008; all skippers to maintain records of the time, date, shot duration and location of each incidental capture
Acceptable
General ecosystem – large epibenthos
The total area of the Pilbara demersal fish fishery (encompassing both trawl and trap fisheries) that is closed to trawling is 80%; the total area of the Pilbara demersal fish fishery between depths of 30 m and 120 m should remain at or below the current level of 60%
Acceptable
Fishery: Salmon Date of certification: November 2004, extended November 2009 Approval type: Accredited Export Exempt Fishery Expiry date: November 2014
Western Australian salmon (spawning stock)
Expected catch range under the current management regime is 1,200–2,800 t
Acceptable
Catch below target level due to limited targeting and low catchability along the South Coast. West Coast catch below historical level, so overall acceptable.
Fishery: Shark Bay Crab Interim Managed Fishery Date of certification: November 2004 Approval type: Approved Wildlife Trade Operation Exemption Expiry date: November 2010
Blue swimmer crab (breeding stock)
CPUE to remain above 1 kg/trap lift
Acceptable
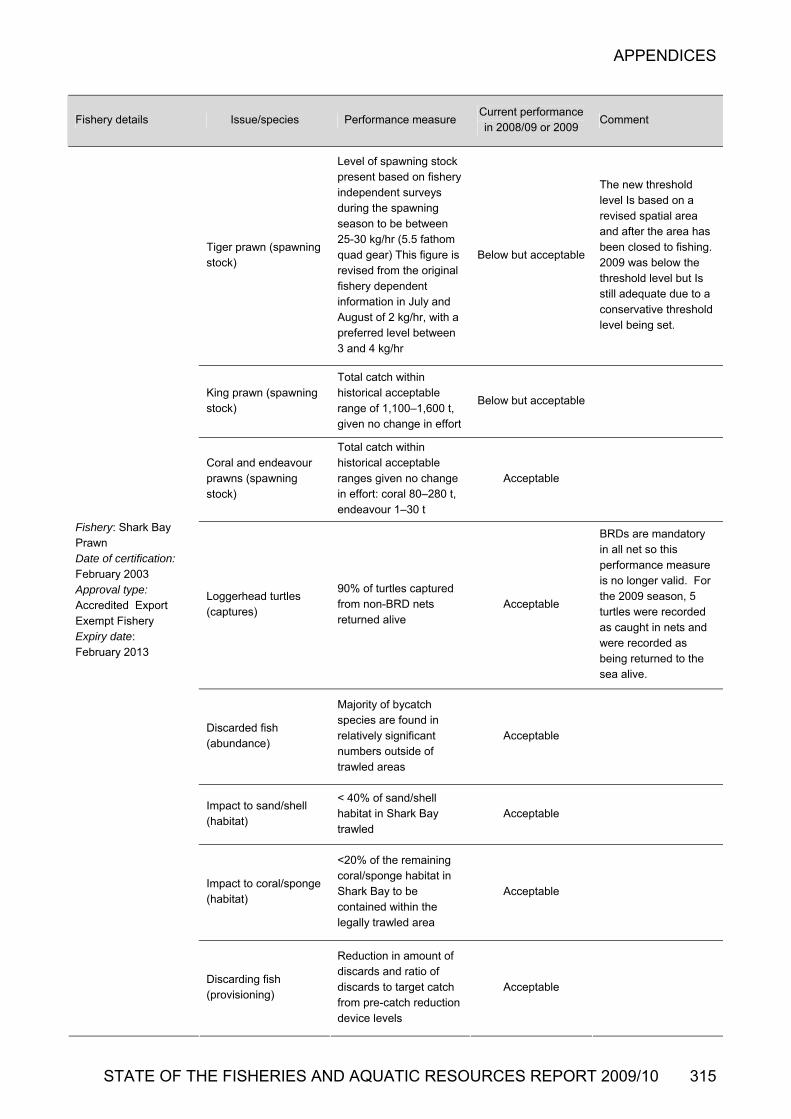
APPENDICES
STATE OF THE FISHERIES AND AQUATIC RESOURCES REPORT 2009/10 315
Fishery details Issue/species Performance measure Current performance in 2008/09 or 2009
Comment
Tiger prawn (spawning stock)
Level of spawning stock present based on fishery independent surveys during the spawning season to be between 25-30 kg/hr (5.5 fathom quad gear) This figure is revised from the original fishery dependent information in July and August of 2 kg/hr, with a preferred level between 3 and 4 kg/hr
Below but acceptable
The new threshold level Is based on a revised spatial area and after the area has been closed to fishing. 2009 was below the threshold level but Is still adequate due to a conservative threshold level being set.
King prawn (spawning stock)
Total catch within historical acceptable range of 1,100–1,600 t, given no change in effort
Below but acceptable
Coral and endeavour prawns (spawning stock)
Total catch within historical acceptable ranges given no change in effort: coral 80–280 t, endeavour 1–30 t
Acceptable
Loggerhead turtles (captures)
90% of turtles captured from non-BRD nets returned alive
Acceptable
BRDs are mandatory in all net so this performance measure is no longer valid. For the 2009 season, 5 turtles were recorded as caught in nets and were recorded as being returned to the sea alive.
Discarded fish (abundance)
Majority of bycatch species are found in relatively significant numbers outside of trawled areas
Acceptable
Impact to sand/shell (habitat)
< 40% of sand/shell habitat in Shark Bay trawled
Acceptable
Impact to coral/sponge (habitat)
<20% of the remaining coral/sponge habitat in Shark Bay to be contained within the legally trawled area
Acceptable
Fishery: Shark Bay Prawn Date of certification: February 2003 Approval type: Accredited Export Exempt Fishery Expiry date: February 2013
Discarding fish (provisioning)
Reduction in amount of discards and ratio of discards to target catch from pre-catch reduction device levels
Acceptable
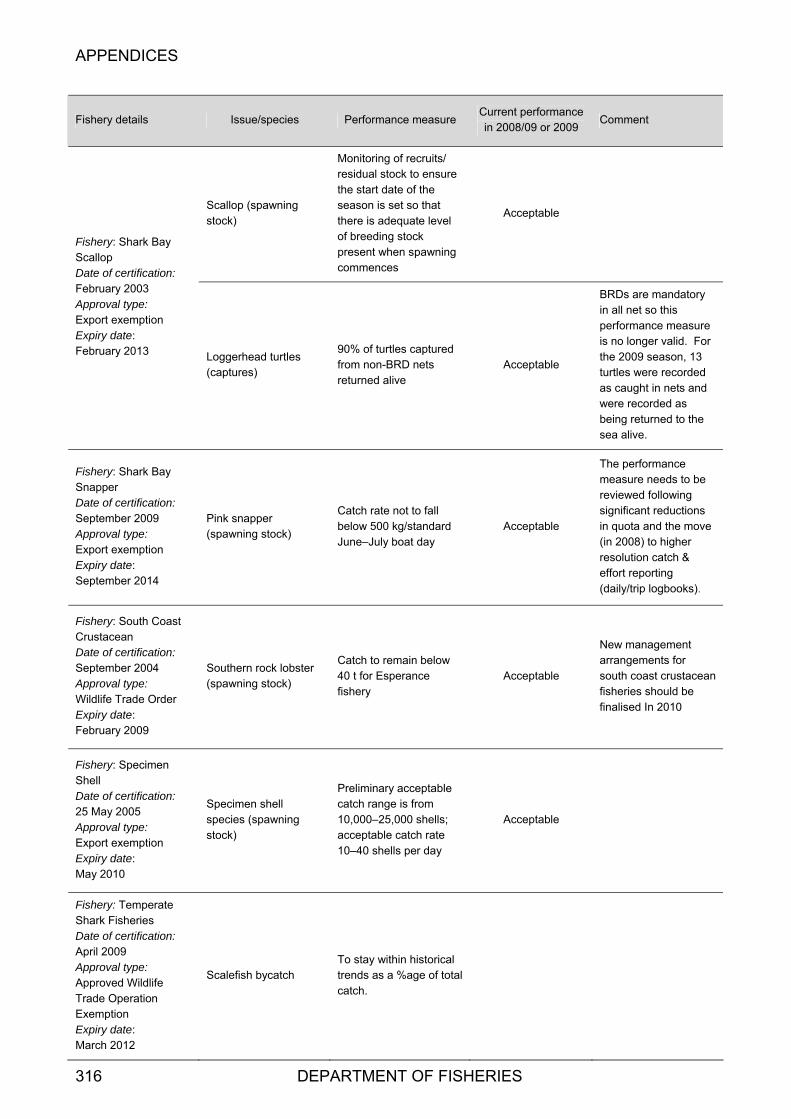
APPENDICES
316 DEPARTMENT OF FISHERIES
Fishery details Issue/species Performance measure Current performance in 2008/09 or 2009
Comment
Scallop (spawning stock)
Monitoring of recruits/ residual stock to ensure the start date of the season is set so that there is adequate level of breeding stock present when spawning commences
Acceptable
Fishery: Shark Bay Scallop Date of certification: February 2003 Approval type: Export exemption Expiry date: February 2013 Loggerhead turtles
(captures)
90% of turtles captured from non-BRD nets returned alive
Acceptable
BRDs are mandatory in all net so this performance measure is no longer valid. For the 2009 season, 13 turtles were recorded as caught in nets and were recorded as being returned to the sea alive.
Fishery: Shark Bay Snapper Date of certification: September 2009 Approval type: Export exemption Expiry date: September 2014
Pink snapper (spawning stock)
Catch rate not to fall below 500 kg/standard June–July boat day
Acceptable
The performance measure needs to be reviewed following significant reductions in quota and the move (in 2008) to higher resolution catch & effort reporting (daily/trip logbooks).
Fishery: South Coast Crustacean Date of certification: September 2004 Approval type: Wildlife Trade Order Expiry date: February 2009
Southern rock lobster (spawning stock)
Catch to remain below 40 t for Esperance fishery
Acceptable
New management arrangements for south coast crustacean fisheries should be finalised In 2010
Fishery: Specimen Shell Date of certification: 25 May 2005 Approval type: Export exemption Expiry date: May 2010
Specimen shell species (spawning stock)
Preliminary acceptable catch range is from 10,000–25,000 shells; acceptable catch rate 10–40 shells per day
Acceptable
Fishery: Temperate Shark Fisheries Date of certification: April 2009 Approval type: Approved Wildlife Trade Operation Exemption Expiry date: March 2012
Scalefish bycatch To stay within historical trends as a %age of total catch.
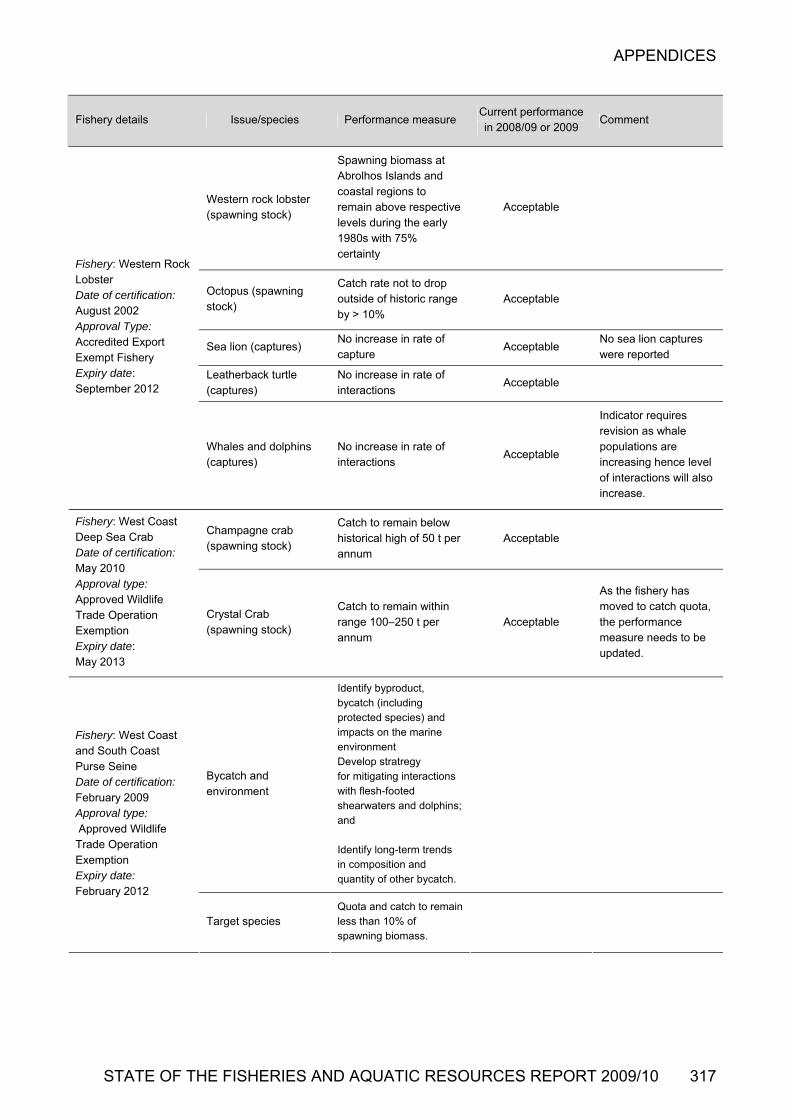
APPENDICES
STATE OF THE FISHERIES AND AQUATIC RESOURCES REPORT 2009/10 317
Fishery details Issue/species Performance measure Current performance in 2008/09 or 2009
Comment
Western rock lobster (spawning stock)
Spawning biomass at Abrolhos Islands and coastal regions to remain above respective levels during the early 1980s with 75% certainty
Acceptable
Octopus (spawning stock)
Catch rate not to drop outside of historic range by > 10%
Acceptable
Sea lion (captures) No increase in rate of capture
Acceptable No sea lion captures were reported
Leatherback turtle (captures)
No increase in rate of interactions
Acceptable
Fishery: Western Rock Lobster Date of certification: August 2002 Approval Type: Accredited Export Exempt Fishery Expiry date: September 2012
Whales and dolphins (captures)
No increase in rate of interactions
Acceptable
Indicator requires revision as whale populations are increasing hence level of interactions will also increase.
Champagne crab (spawning stock)
Catch to remain below historical high of 50 t per annum
Acceptable
Fishery: West Coast Deep Sea Crab Date of certification: May 2010 Approval type: Approved Wildlife Trade Operation Exemption Expiry date: May 2013
Crystal Crab (spawning stock)
Catch to remain within range 100–250 t per annum
Acceptable
As the fishery has moved to catch quota, the performance measure needs to be updated.
Bycatch and environment
Identify byproduct, bycatch (including protected species) and impacts on the marine environment Develop stratregy for mitigating interactions with flesh-footed shearwaters and dolphins; and Identify long-term trends in composition and quantity of other bycatch.
Fishery: West Coast and South Coast Purse Seine Date of certification: February 2009 Approval type: Approved Wildlife Trade Operation Exemption Expiry date: February 2012
Target species Quota and catch to remain less than 10% of spawning biomass.
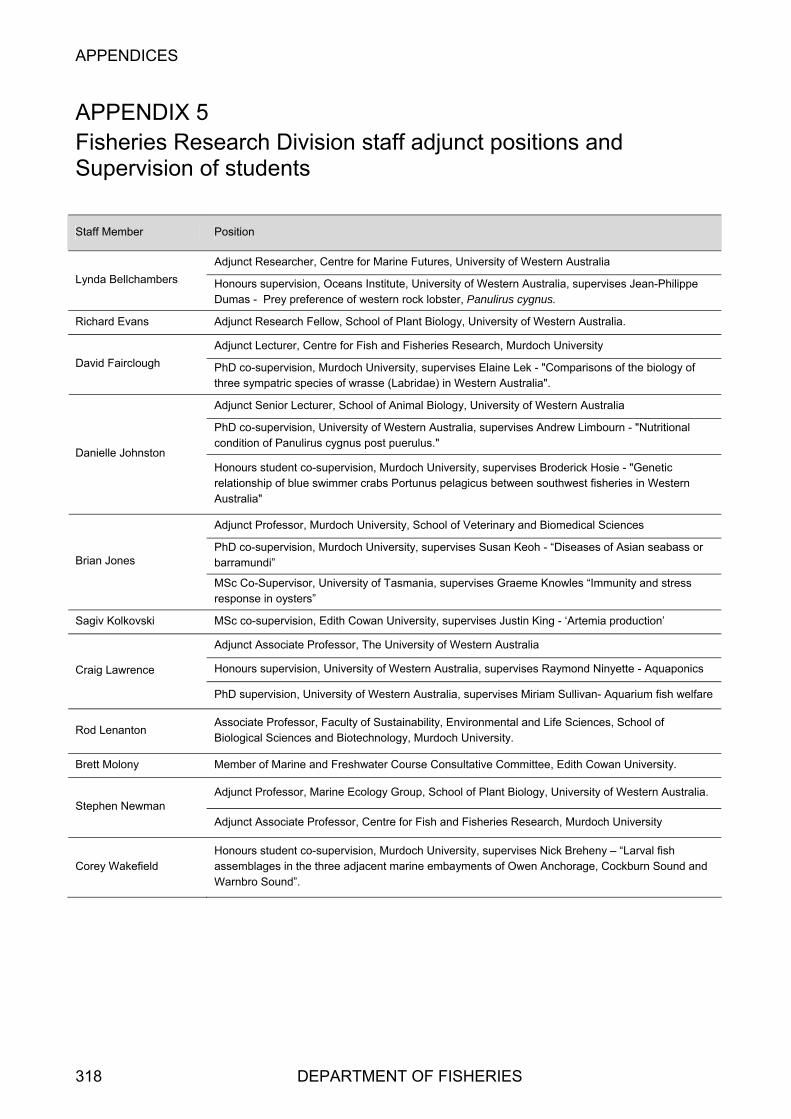
APPENDICES
318 DEPARTMENT OF FISHERIES
APPENDIX 5 Fisheries Research Division staff adjunct positions and Supervision of students
Staff Member Position
Adjunct Researcher, Centre for Marine Futures, University of Western Australia
Lynda Bellchambers Honours supervision, Oceans Institute, University of Western Australia, supervises Jean-Philippe Dumas - Prey preference of western rock lobster, Panulirus cygnus.
Richard Evans Adjunct Research Fellow, School of Plant Biology, University of Western Australia.
Adjunct Lecturer, Centre for Fish and Fisheries Research, Murdoch University
David Fairclough PhD co-supervision, Murdoch University, supervises Elaine Lek - "Comparisons of the biology of three sympatric species of wrasse (Labridae) in Western Australia".
Adjunct Senior Lecturer, School of Animal Biology, University of Western Australia
PhD co-supervision, University of Western Australia, supervises Andrew Limbourn - "Nutritional condition of Panulirus cygnus post puerulus."
Danielle Johnston Honours student co-supervision, Murdoch University, supervises Broderick Hosie - "Genetic relationship of blue swimmer crabs Portunus pelagicus between southwest fisheries in Western Australia"
Adjunct Professor, Murdoch University, School of Veterinary and Biomedical Sciences
PhD co-supervision, Murdoch University, supervises Susan Keoh - “Diseases of Asian seabass or barramundi” Brian Jones
MSc Co-Supervisor, University of Tasmania, supervises Graeme Knowles “Immunity and stress response in oysters”
Sagiv Kolkovski MSc co-supervision, Edith Cowan University, supervises Justin King - ‘Artemia production’
Adjunct Associate Professor, The University of Western Australia
Honours supervision, University of Western Australia, supervises Raymond Ninyette - Aquaponics Craig Lawrence
PhD supervision, University of Western Australia, supervises Miriam Sullivan- Aquarium fish welfare
Rod Lenanton Associate Professor, Faculty of Sustainability, Environmental and Life Sciences, School of Biological Sciences and Biotechnology, Murdoch University.
Brett Molony Member of Marine and Freshwater Course Consultative Committee, Edith Cowan University.
Adjunct Professor, Marine Ecology Group, School of Plant Biology, University of Western Australia. Stephen Newman
Adjunct Associate Professor, Centre for Fish and Fisheries Research, Murdoch University
Corey Wakefield Honours student co-supervision, Murdoch University, supervises Nick Breheny – “Larval fish assemblages in the three adjacent marine embayments of Owen Anchorage, Cockburn Sound and Warnbro Sound”.
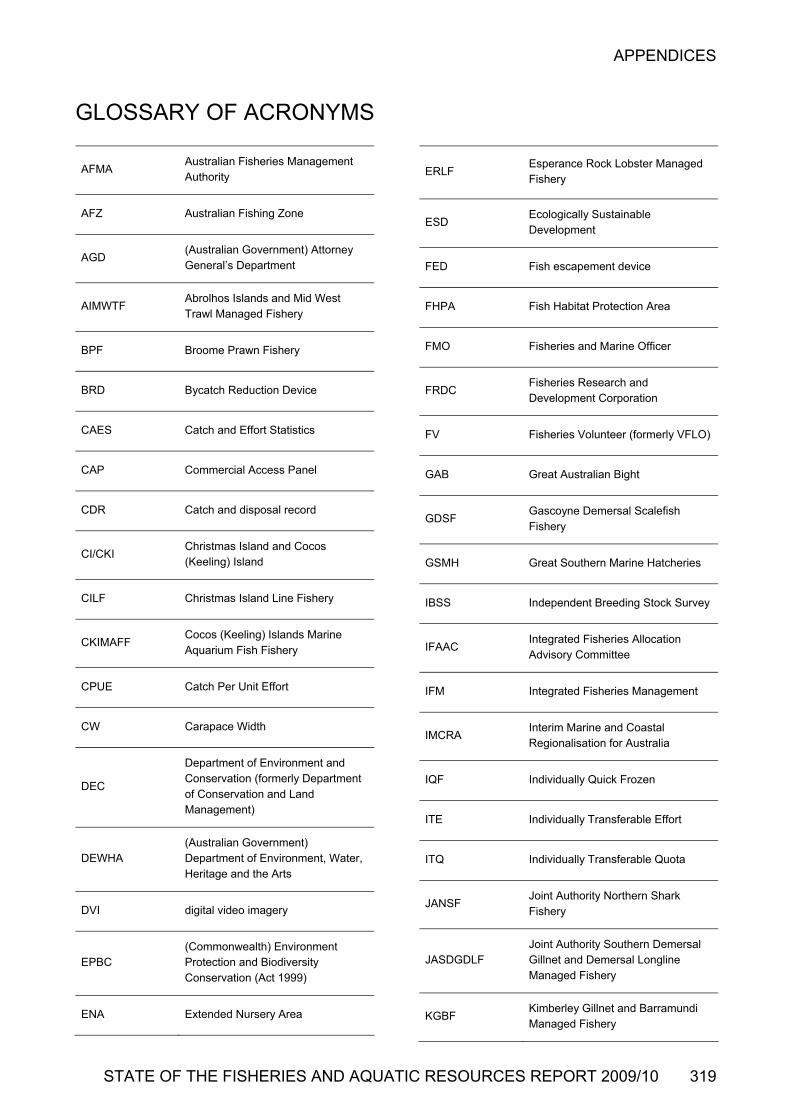
APPENDICES
STATE OF THE FISHERIES AND AQUATIC RESOURCES REPORT 2009/10 319
GLOSSARY OF ACRONYMS
AFMA Australian Fisheries Management Authority
AFZ Australian Fishing Zone
AGD (Australian Government) Attorney General’s Department
AIMWTF Abrolhos Islands and Mid West Trawl Managed Fishery
BPF Broome Prawn Fishery
BRD Bycatch Reduction Device
CAES Catch and Effort Statistics
CAP Commercial Access Panel
CDR Catch and disposal record
CI/CKI Christmas Island and Cocos (Keeling) Island
CILF Christmas Island Line Fishery
CKIMAFF Cocos (Keeling) Islands Marine Aquarium Fish Fishery
CPUE Catch Per Unit Effort
CW Carapace Width
DEC
Department of Environment and Conservation (formerly Department of Conservation and Land Management)
DEWHA (Australian Government) Department of Environment, Water, Heritage and the Arts
DVI digital video imagery
EPBC (Commonwealth) Environment Protection and Biodiversity Conservation (Act 1999)
ENA Extended Nursery Area
ERLF Esperance Rock Lobster Managed Fishery
ESD Ecologically Sustainable Development
FED Fish escapement device
FHPA Fish Habitat Protection Area
FMO Fisheries and Marine Officer
FRDC Fisheries Research and Development Corporation
FV Fisheries Volunteer (formerly VFLO)
GAB Great Australian Bight
GDSF Gascoyne Demersal Scalefish Fishery
GSMH Great Southern Marine Hatcheries
IBSS Independent Breeding Stock Survey
IFAAC Integrated Fisheries Allocation Advisory Committee
IFM Integrated Fisheries Management
IMCRA Interim Marine and Coastal Regionalisation for Australia
IQF Individually Quick Frozen
ITE Individually Transferable Effort
ITQ Individually Transferable Quota
JANSF Joint Authority Northern Shark Fishery
JASDGDLF Joint Authority Southern Demersal Gillnet and Demersal Longline Managed Fishery
KGBF Kimberley Gillnet and Barramundi Managed Fishery

APPENDICES
320 DEPARTMENT OF FISHERIES
KPF Kimberley Prawn Managed Fishery
LASCF Lake Argyle Silver Cobbler Fishery
LML Legal Minimum Length
MAF Marine Aquarium Fish Managed Fishery
MBP Marine Bioregional Plan
MOP Mother-of-Pearl
MOU Memorandum of Understanding
MPA Marine Protected Area
MPP Management Planning Panel
MSC Marine Stewardship Council
MSY Maximum Sustainable Yield
NBPF Nickol Bay Prawn Managed Fishery
NDSF Northern Demersal Scalefish Managed Fishery
NHT Natural Heritage Trust
NPF Northern Prawn Fishery
PER Public Environmental Review
PFRC Pemberton Freshwater Research Centre
PFTF Pilbara Fish Trawl (Interim) Managed Fishery
RAP Research Angler Program
RCL Rostrum Carapace Length
RFAC Recreational Fishing Advisory Committee
RFFSS Recreational Freshwater Fisheries Stakeholder Subcommittee
RLIAC Rock Lobster Industry Advisory Committee
ROA Reef Observation Area
SBBSMNF Shark Bay Beach Seine and Mesh Net Managed Fishery
SBSF Shark Bay Snapper Managed Fishery
SCEF South Coast Estuarine Managed Fishery
SFD Standard Fishing Day
SHL Sustainable Harvest Level
SLED Sea Lion Exclusion Device
SMFG Size Management Fish Ground
SRR Spawning Stock–Recruitment Relationship
SSF Specimen Shell Managed Fishery
SWBS South West Beach Seine Fishery
TAC Total Allowable Catch
TACC Total Allowable Commercial Catch
TAE Total Allowable Effort
TL Total Length
TPSA Tiger Prawn Spawning Area
VMS Vessel Monitoring System
WADNHFMAC WA Demersal Net and Hook Fisheries Management Advisory Committee
WAFIC WA Fishing Industry Council
WAFMRL WA Fisheries and Marine Research Laboratories
WAMSI WA Marine Science Institute

APPENDICES
STATE OF THE FISHERIES AND AQUATIC RESOURCES REPORT 2009/10 321
WANCSF WA North Coast Shark Fishery
WCBBF West Coast Beach Bait Managed Fishery
WCDGDLF West Coast Demersal Gillnet and Demersal Longline (Interim) Managed Fishery
WCDSF West Coast Demersal Scalefish Fishery
WCEF West Coast Estuarine Managed Fishery
WCRLF West Coast Rock Lobster Managed Fishery
WDWTF Western Deepwater Trawl Fishery
WTO Wildlife Trade Operation