Embed Size (px)
Citation preview
East Ayrshire Council Chapter 4 – Air Quality State of the Environment Report Page 1
IronsideFarrar / Institute of Occupational Medicine July 2016
EAST AYRSHIRE COUNCIL STATE OF THE ENVIRONMENT REPORT CHAPTER 4 – AIR QUALITY SUMMARY Key Messages Air Pollution The air pollutants of most concern in Scotland are NO2, precursor emissions of nitrogen
oxides (NOx), and PM10 (particles approximately less than 10 µm in size that can penetrate to the lung). These are the pollutants emitted in the largest quantities and those that are of most significance for human health.
PM2.5 is a finer subfraction of PM10 that is of particular health concern but there are currently no measurement data available for PM2.5 in East Ayrshire. The coarser fractions of PM are associated with dust deposition and associated nuisance.
Sulphur dioxide (SO2) is emitted in much smaller quantities than PM or NOx but is also of concern because it reacts in the atmosphere to form secondary particles of PM10 and contributes to acid deposition which adversely affects vegetation and aquatic life.
Air Quality in East Ayrshire Background concentrations of NO2 and PM10 in East Ayrshire easily meet the relevant
regulatory objectives. Background concentrations of NO2 are highest in the more heavily populated northern
parts of East Ayrshire including Kilmarnock and along the major roads. Measurements of NO2 and PM10 at roadside locations in Kilmarnock in the recent past
have not consistently met the regulatory objectives due to high emissions of these pollutants in heavily trafficked streets.
East Ayrshire has not declared any Local Air Quality Management Areas. Sources of Emissions in East Ayrshire There are relatively few industrial sources of emissions to air within East Ayrshire and
the main sources of emissions are road transport and agriculture. The most heavily trafficked road is the M77/A77 but this route bypasses all major centres
of population and built up areas. Concentrations of both NO2 and PM10 have locally exceeded relevant annual mean objectives in recent years beside heavily trafficked congested roads in Kilmarnock.
Local emissions of NOx and PM10 in East Ayrshire are relatively small compared with more heavily trafficked or industrialised areas of the UK.
Surface coaling has been a relatively important source of airborne particulate matter in the recent past but this is against the background of generally low emissions of PM10.
The only industrial source in East Ayrshire that emits more than the reporting threshold of 100 tonnes of NOx per year is the Egger Barony chipboard plant in Auchinleck.
Background annual mean concentrations of NO2 and PM10 across East Ayrshire are low in comparison with the relevant objectives.
Across Scotland as a whole emissions of NOx, PM10 and SO2 have reduced substantially since 1990 but the rate of reduction has slowed markedly in recent years. Concentrations of these pollutants are predicted to continue to fall in coming years as a result in improvements in vehicle technology.
The expected reduction in NO2 since 2010, however, has not materialised and there has been no consistent trend in PM10 concentrations since 2000.
At national level there was no significant reduction in emissions between 2009 and 2012. Trends within East Ayrshire would be anticipated to be similar to those for Scotland as a whole.
East Ayrshire Council Chapter 4 – Air Quality State of the Environment Report Page 2
IronsideFarrar / Institute of Occupational Medicine July 2016
Concentrations of sulphur and nitrogen oxides at designated ecologically sensitive sites are low in comparison to the relevant objectives. Rates of nitrate and acid deposition, however, currently exceed the critical load at multiple sites and are only reducing very slowly in response to the substantial reduction in precursor emissions over the last two decades.
Mineral Extraction and Unconventional Gas Emissions from surface coaling or quarrying are likely to adversely affect air quality in the
immediate vicinity of operations. Measurable increases in annual mean concentrations of PM10 might arise within about
20 m of the site boundary and smaller effects on PM10 might arise at distances of ≤1000 m.
Background levels of PM10 in areas of East Ayrshire affected by surface coaling are extremely low.
There may also be a small increase in NO2 concentrations in the immediate vicinity of surface coal operations arising from plant emissions.
There is no evidence that surface coaling or quarrying activities in East Ayrshire are leading to or would lead to any failure to achieve air quality objectives.
On rare occasions, activities at Opencast Coal Sites (OCCSs) have led to local complaints of dust nuisance but there is no evidence of a substantial ongoing problem. Current emissions from surface operations are likely to have a negligible impact on population mean exposure to PM10 and NO2.
The air quality impacts of unconventional gas exploitation are hard to predict and will depend on both geological and operational factors. Suitable technologies exist to control emissions from flaring, plant and the transport and storage of gas such that air quality impacts should be very small. The potential for the unintended release of gas during exploration and extraction and the associated air quality impacts that might arise is highly uncertain.
The combination of appropriate planning policies, conditions on consents, PPC permitting and effective enforcement should ensure that the air quality impact of any future minerals operations including coaling or unconventional gas will be negligible.
Acid Deposition Current levels of nitrogen and acid deposition at most designated ecologically sensitive
sites in East Ayrshire exceed critical load levels. Local emissions of SOx, NOx and NH3, however, will only make a small contribution to
local nitrogen and acid deposition compared with the contribution of sources elsewhere in the UK and Europe.
Overall Trend – Air Quality Air quality in East Ayrshire is generally good with low concentrations of PM10, NO2 and
other pollutants that are subject to local air quality management. The highest concentrations of PM10 and NO2 arise at heavily trafficked locations in the
more urban northern parts of the area, particularly within congested areas within Kilmarnock.
Road traffic and undefined “rural” sources are important sources of NO2 in East Ayrshire whereas PM10 is predominantly derived from outside the local authority area.
There is no evidence that surface coaling or quarrying activities in East Ayrshire have led to or would lead to any failure to achieve air quality objectives.
It is anticipated that background concentrations of PM10 and NO2 will decline slightly over coming years as a result of reduced transport emissions due to technological improvements and a continued decline in the use of coal for power generation within the UK.
Rates of nitrogen and acid deposition are likely to reduce slightly in future years as emissions from coal fired power station across Europe, including the UK reduce as a result of tighter emissions control and the increased use of renewable energy sources.

East Ayrshire Council Chapter 4 – Air Quality State of the Environment Report Page 3
IronsideFarrar / Institute of Occupational Medicine July 2016
State and Trend
East Ayrshire Council Chapter 4 – Air Quality State of the Environment Report Page 4
IronsideFarrar / Institute of Occupational Medicine July 2016
OVERVIEW 1.1 Air pollution The air pollutants of most concern in Scotland are NO2, precursor emissions of nitrogen oxides (NOx), and PM10 (particles approximately less than 10 µm in size that can penetrate to the lung). These are the pollutants emitted in the largest quantities and those that are of most significance for human health. PM2.5 is a finer subfraction of PM10 that is of particular health concern but there are currently no measurement data available for PM2.5 in East Ayrshire. The coarser fractions of PM are associated with dust deposition and associated nuisance. Sulphur dioxide (SO2) is emitted in much smaller quantities than PM or NOx but is also of concern because it reacts in the atmosphere to form secondary particles of PM10 and contributes to acid deposition which adversely affects vegetation and aquatic life. There are relatively few industrial sources of emissions to air within East Ayrshire and the main sources of NOx and PM10 with East Ayrshire are road transport and agriculture. A large proportion of PM10 originates from outside of East Ayrshire including particles formed by the reaction of gaseous pollutants during residence in the atmosphere. Local emissions of NOx and PM10 in East Ayrshire are relatively small compared with more heavily trafficked or industrialised areas of the UK. The most heavily trafficked road is the M77/A77 but this route bypasses all major centres of population and built up areas. Surface coaling has been a relatively important source of airborne particulate matter in the recent past but this is against the background of generally low emissions of PM10. The only industrial source in East Ayrshire that emits more than 100 tonnes of NOx per year is the Egger Barony chipboard plant in Auchinleck. 1.2 Regulatory background
Legislation on air quality is driven by European Union Directives that are enacted in UK and Scottish law. Part IV of the Environment Act 1999 established the process known as Local Air Quality Management (LAQM). Local authorities are required to review local air quality within their area and assess whether health-based air quality objectives will be achieved. This has been ongoing since December 1997. Where a local authority determines an exceedance or likely exceedences and an objective in Table 1 it is required to designate an Air Quality Management Area (AQMA) and to develop an Action Plan to target the causes of the exceedences(s) and seek to improve air quality within the AQMA area. The Air Quality (Scotland) Regulations 2010 set out objectives based on the 4th Air Quality Daughter Directive 2008/0/EC of the European Parliament and of the Council of 21 May 2008 (Table 1). The objectives take account of the effects of each pollutant on human health and the costs, benefits and technical feasibility of achieving the objectives. The 2010 Regulations also set targets for arsenic, cadmium, nickel and benzo(a)pyrene of 6 ngm-3, 5 ngm-3, 20 ngm-
3 and 1 ngm-3 respectively. Concentrations of these pollutants in Scotland are much lower than the targets set by the 4th Directive and are not specifically considered in this chapter.
East Ayrshire Council Chapter 4 – Air Quality State of the Environment Report Page 5
IronsideFarrar / Institute of Occupational Medicine July 2016
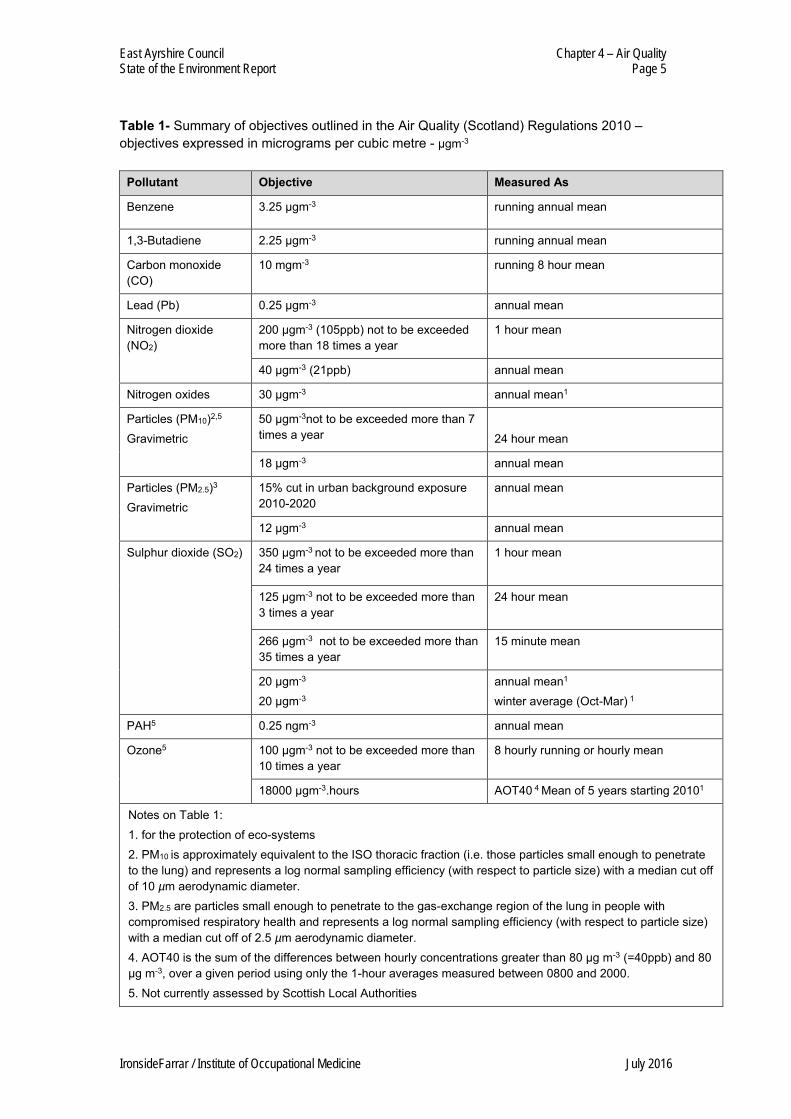
Table 1- Summary of objectives outlined in the Air Quality (Scotland) Regulations 2010 – objectives expressed in micrograms per cubic metre - µgm-3
Pollutant Objective Measured As
Benzene 3.25 µgm-3 running annual mean
1,3-Butadiene 2.25 µgm-3 running annual mean
Carbon monoxide (CO)
10 mgm-3 running 8 hour mean
Lead (Pb) 0.25 µgm-3 annual mean
Nitrogen dioxide (NO2)
200 µgm-3 (105ppb) not to be exceeded more than 18 times a year
1 hour mean
40 µgm-3 (21ppb) annual mean
Nitrogen oxides 30 µgm-3 annual mean1
Particles (PM10)2,5 Gravimetric
50 µgm-3not to be exceeded more than 7 times a year
24 hour mean
18 µgm-3 annual mean
Particles (PM2.5)3 Gravimetric
15% cut in urban background exposure 2010-2020
annual mean
12 µgm-3 annual mean
Sulphur dioxide (SO2) 350 µgm-3 not to be exceeded more than 24 times a year
1 hour mean
125 µgm-3 not to be exceeded more than 3 times a year
24 hour mean
266 µgm-3 not to be exceeded more than 35 times a year
15 minute mean
20 µgm-3 20 µgm-3
annual mean1 winter average (Oct-Mar) 1
PAH5 0.25 ngm-3 annual mean
Ozone5 100 µgm-3 not to be exceeded more than 10 times a year
8 hourly running or hourly mean
18000 µgm-3.hours AOT40 4 Mean of 5 years starting 20101
Notes on Table 1: 1. for the protection of eco-systems 2. PM10 is approximately equivalent to the ISO thoracic fraction (i.e. those particles small enough to penetrate to the lung) and represents a log normal sampling efficiency (with respect to particle size) with a median cut off of 10 µm aerodynamic diameter. 3. PM2.5 are particles small enough to penetrate to the gas-exchange region of the lung in people with compromised respiratory health and represents a log normal sampling efficiency (with respect to particle size) with a median cut off of 2.5 µm aerodynamic diameter. 4. AOT40 is the sum of the differences between hourly concentrations greater than 80 µg m-3 (=40ppb) and 80 µg m-3, over a given period using only the 1-hour averages measured between 0800 and 2000. 5. Not currently assessed by Scottish Local Authorities
East Ayrshire Council Chapter 4 – Air Quality State of the Environment Report Page 6
IronsideFarrar / Institute of Occupational Medicine July 2016
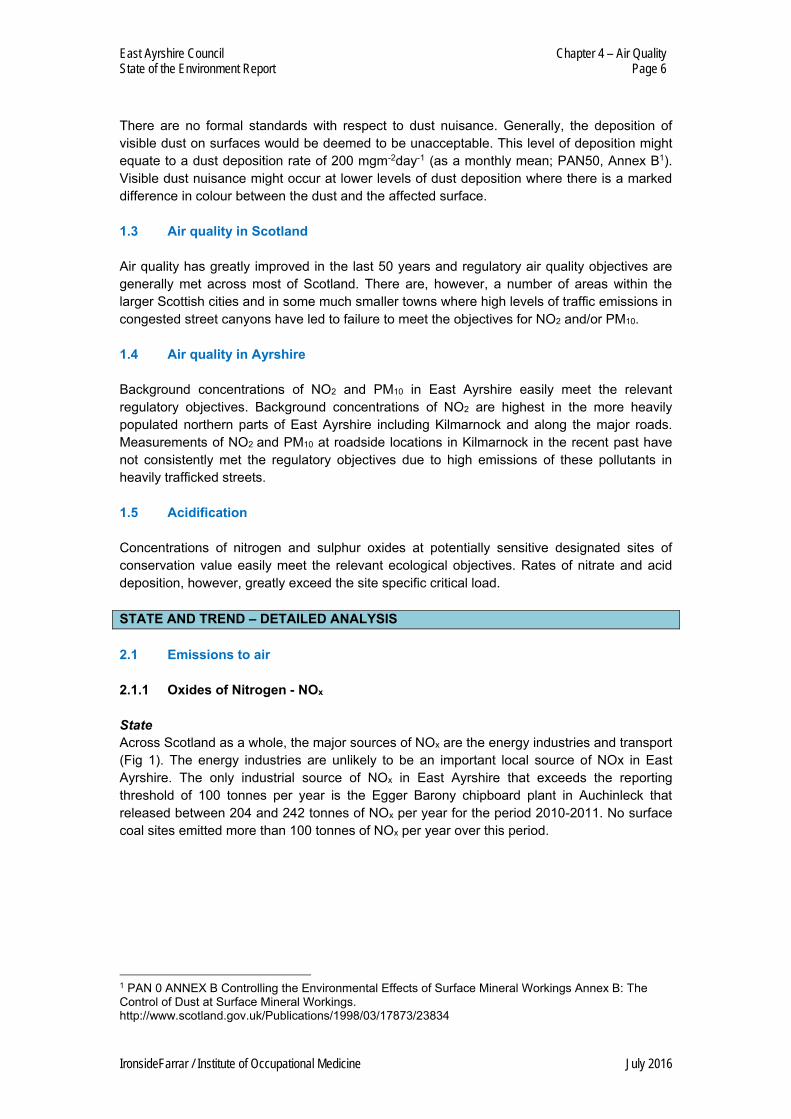
There are no formal standards with respect to dust nuisance. Generally, the deposition of visible dust on surfaces would be deemed to be unacceptable. This level of deposition might equate to a dust deposition rate of 200 mgm-2day-1 (as a monthly mean; PAN50, Annex B1). Visible dust nuisance might occur at lower levels of dust deposition where there is a marked difference in colour between the dust and the affected surface. 1.3 Air quality in Scotland Air quality has greatly improved in the last 50 years and regulatory air quality objectives are generally met across most of Scotland. There are, however, a number of areas within the larger Scottish cities and in some much smaller towns where high levels of traffic emissions in congested street canyons have led to failure to meet the objectives for NO2 and/or PM10. 1.4 Air quality in Ayrshire Background concentrations of NO2 and PM10 in East Ayrshire easily meet the relevant regulatory objectives. Background concentrations of NO2 are highest in the more heavily populated northern parts of East Ayrshire including Kilmarnock and along the major roads. Measurements of NO2 and PM10 at roadside locations in Kilmarnock in the recent past have not consistently met the regulatory objectives due to high emissions of these pollutants in heavily trafficked streets. 1.5 Acidification Concentrations of nitrogen and sulphur oxides at potentially sensitive designated sites of conservation value easily meet the relevant ecological objectives. Rates of nitrate and acid deposition, however, greatly exceed the site specific critical load. STATE AND TREND – DETAILED ANALYSIS 2.1 Emissions to air 2.1.1 Oxides of Nitrogen - NOx State Across Scotland as a whole, the major sources of NOx are the energy industries and transport (Fig 1). The energy industries are unlikely to be an important local source of NOx in East Ayrshire. The only industrial source of NOx in East Ayrshire that exceeds the reporting threshold of 100 tonnes per year is the Egger Barony chipboard plant in Auchinleck that released between 204 and 242 tonnes of NOx per year for the period 2010-2011. No surface coal sites emitted more than 100 tonnes of NOx per year over this period. 1 PAN 0 ANNEX B Controlling the Environmental Effects of Surface Mineral Workings Annex B: The Control of Dust at Surface Mineral Workings. http://www.scotland.gov.uk/Publications/1998/03/17873/23834
East Ayrshire Council Chapter 4 – Air Quality State of the Environment Report Page 7
IronsideFarrar / Institute of Occupational Medicine July 2016
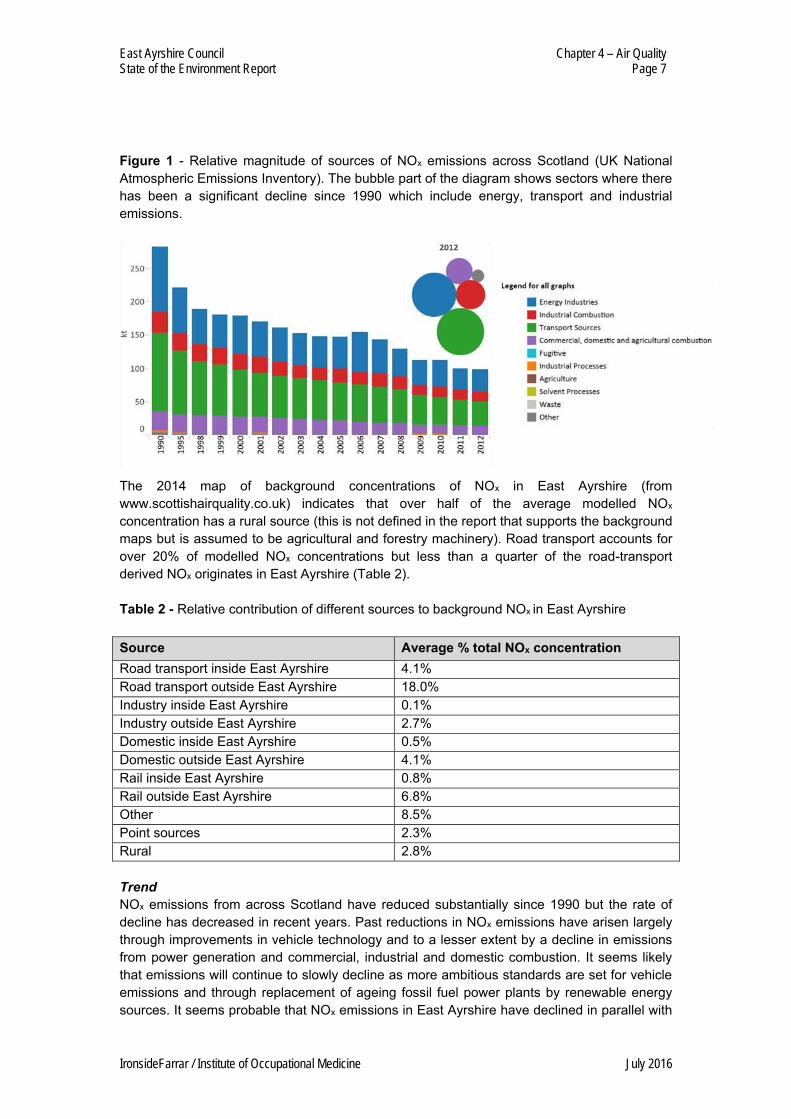
Figure 1 - Relative magnitude of sources of NOx emissions across Scotland (UK National Atmospheric Emissions Inventory). The bubble part of the diagram shows sectors where there has been a significant decline since 1990 which include energy, transport and industrial emissions.
The 2014 map of background concentrations of NOx in East Ayrshire (from www.scottishairquality.co.uk) indicates that over half of the average modelled NOx concentration has a rural source (this is not defined in the report that supports the background maps but is assumed to be agricultural and forestry machinery). Road transport accounts for over 20% of modelled NOx concentrations but less than a quarter of the road-transport derived NOx originates in East Ayrshire (Table 2). Table 2 - Relative contribution of different sources to background NOx in East Ayrshire Source Average % total NOx concentration Road transport inside East Ayrshire 4.1% Road transport outside East Ayrshire 18.0% Industry inside East Ayrshire 0.1% Industry outside East Ayrshire 2.7% Domestic inside East Ayrshire 0.5% Domestic outside East Ayrshire 4.1% Rail inside East Ayrshire 0.8% Rail outside East Ayrshire 6.8% Other 8.5% Point sources 2.3% Rural 2.8% Trend NOx emissions from across Scotland have reduced substantially since 1990 but the rate of decline has decreased in recent years. Past reductions in NOx emissions have arisen largely through improvements in vehicle technology and to a lesser extent by a decline in emissions from power generation and commercial, industrial and domestic combustion. It seems likely that emissions will continue to slowly decline as more ambitious standards are set for vehicle emissions and through replacement of ageing fossil fuel power plants by renewable energy sources. It seems probable that NOx emissions in East Ayrshire have declined in parallel with
East Ayrshire Council Chapter 4 – Air Quality State of the Environment Report Page 8
IronsideFarrar / Institute of Occupational Medicine July 2016
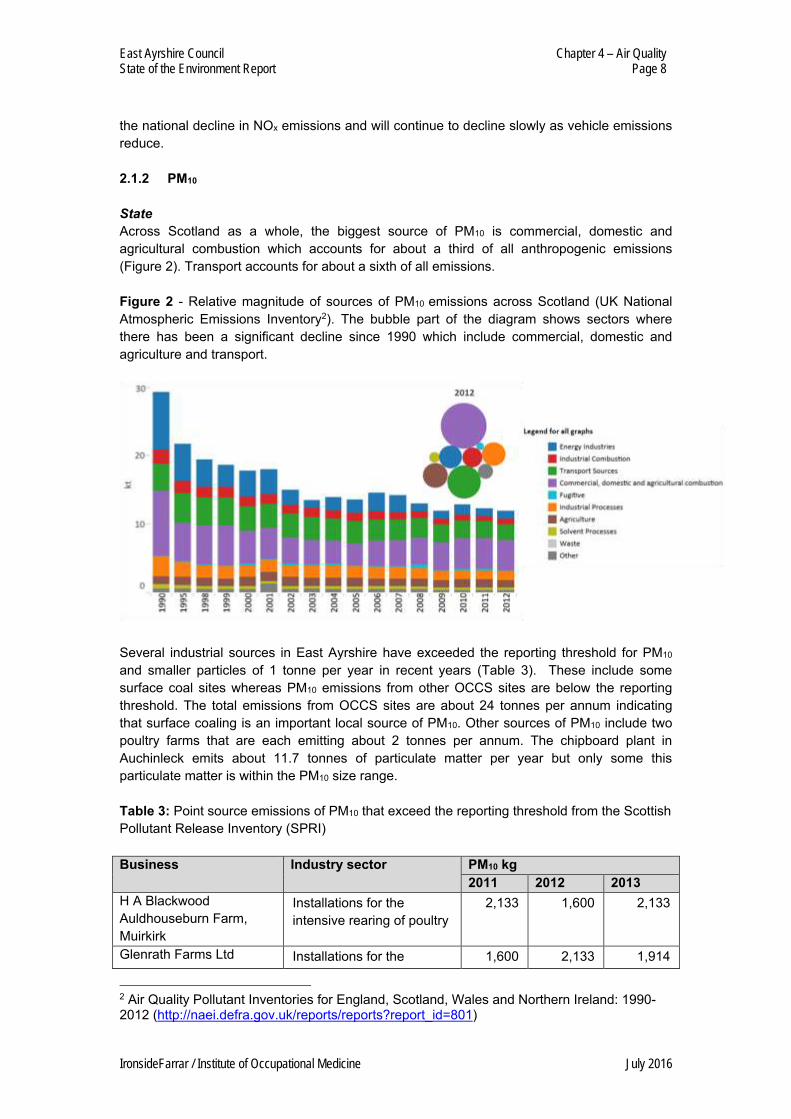
the national decline in NOx emissions and will continue to decline slowly as vehicle emissions reduce. 2.1.2 PM10 State Across Scotland as a whole, the biggest source of PM10 is commercial, domestic and agricultural combustion which accounts for about a third of all anthropogenic emissions (Figure 2). Transport accounts for about a sixth of all emissions. Figure 2 - Relative magnitude of sources of PM10 emissions across Scotland (UK National Atmospheric Emissions Inventory2). The bubble part of the diagram shows sectors where there has been a significant decline since 1990 which include commercial, domestic and agriculture and transport.
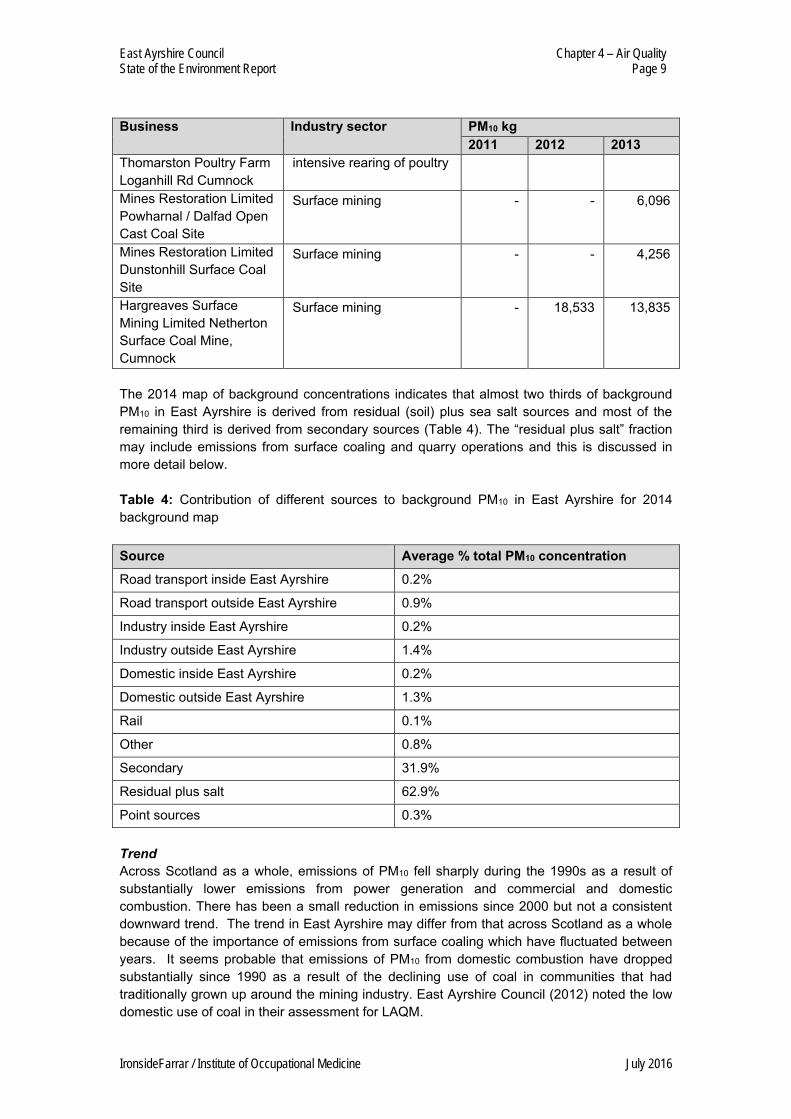
Several industrial sources in East Ayrshire have exceeded the reporting threshold for PM10 and smaller particles of 1 tonne per year in recent years (Table 3). These include some surface coal sites whereas PM10 emissions from other OCCS sites are below the reporting threshold. The total emissions from OCCS sites are about 24 tonnes per annum indicating that surface coaling is an important local source of PM10. Other sources of PM10 include two poultry farms that are each emitting about 2 tonnes per annum. The chipboard plant in Auchinleck emits about 11.7 tonnes of particulate matter per year but only some this particulate matter is within the PM10 size range. Table 3: Point source emissions of PM10 that exceed the reporting threshold from the Scottish Pollutant Release Inventory (SPRI) Business Industry sector PM10 kg
2011 2012 2013 H A Blackwood Auldhouseburn Farm, Muirkirk
Installations for the intensive rearing of poultry
2,133 1,600 2,133
Glenrath Farms Ltd Installations for the 1,600 2,133 1,914
2 Air Quality Pollutant Inventories for England, Scotland, Wales and Northern Ireland: 1990-2012 (http://naei.defra.gov.uk/reports/reports?report_id=801)
East Ayrshire Council Chapter 4 – Air Quality State of the Environment Report Page 9
IronsideFarrar / Institute of Occupational Medicine July 2016
Business Industry sector PM10 kg 2011 2012 2013
Thomarston Poultry Farm Loganhill Rd Cumnock
intensive rearing of poultry
Mines Restoration Limited Powharnal / Dalfad Open Cast Coal Site
Surface mining - - 6,096
Mines Restoration Limited Dunstonhill Surface Coal Site
Surface mining - - 4,256
Hargreaves Surface Mining Limited Netherton Surface Coal Mine, Cumnock
Surface mining - 18,533 13,835
The 2014 map of background concentrations indicates that almost two thirds of background PM10 in East Ayrshire is derived from residual (soil) plus sea salt sources and most of the remaining third is derived from secondary sources (Table 4). The “residual plus salt” fraction may include emissions from surface coaling and quarry operations and this is discussed in more detail below. Table 4: Contribution of different sources to background PM10 in East Ayrshire for 2014 background map Source Average % total PM10 concentration Road transport inside East Ayrshire 0.2%
Road transport outside East Ayrshire 0.9%
Industry inside East Ayrshire 0.2%
Industry outside East Ayrshire 1.4%
Domestic inside East Ayrshire 0.2%
Domestic outside East Ayrshire 1.3%
Rail 0.1%
Other 0.8%
Secondary 31.9%
Residual plus salt 62.9%
Point sources 0.3% Trend Across Scotland as a whole, emissions of PM10 fell sharply during the 1990s as a result of substantially lower emissions from power generation and commercial and domestic combustion. There has been a small reduction in emissions since 2000 but not a consistent downward trend. The trend in East Ayrshire may differ from that across Scotland as a whole because of the importance of emissions from surface coaling which have fluctuated between years. It seems probable that emissions of PM10 from domestic combustion have dropped substantially since 1990 as a result of the declining use of coal in communities that had traditionally grown up around the mining industry. East Ayrshire Council (2012) noted the low domestic use of coal in their assessment for LAQM.
East Ayrshire Council Chapter 4 – Air Quality State of the Environment Report Page 10
IronsideFarrar / Institute of Occupational Medicine July 2016
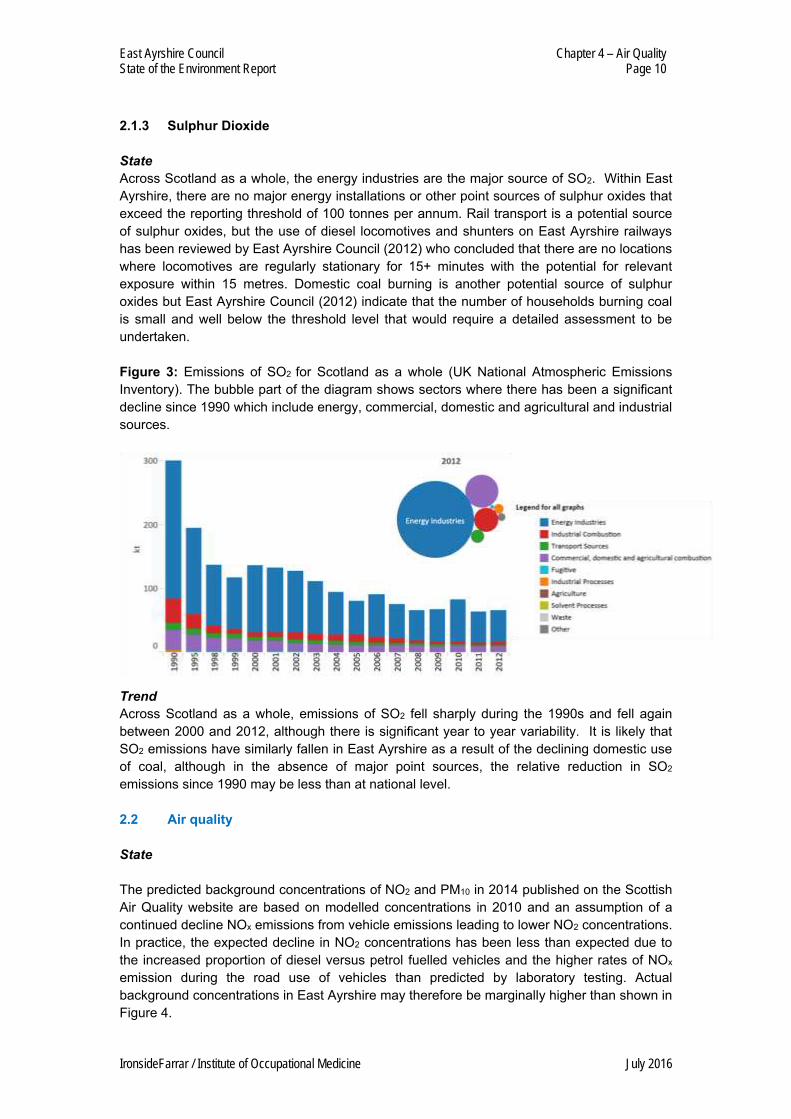
2.1.3 Sulphur Dioxide State Across Scotland as a whole, the energy industries are the major source of SO2. Within East Ayrshire, there are no major energy installations or other point sources of sulphur oxides that exceed the reporting threshold of 100 tonnes per annum. Rail transport is a potential source of sulphur oxides, but the use of diesel locomotives and shunters on East Ayrshire railways has been reviewed by East Ayrshire Council (2012) who concluded that there are no locations where locomotives are regularly stationary for 15+ minutes with the potential for relevant exposure within 15 metres. Domestic coal burning is another potential source of sulphur oxides but East Ayrshire Council (2012) indicate that the number of households burning coal is small and well below the threshold level that would require a detailed assessment to be undertaken. Figure 3: Emissions of SO2 for Scotland as a whole (UK National Atmospheric Emissions Inventory). The bubble part of the diagram shows sectors where there has been a significant decline since 1990 which include energy, commercial, domestic and agricultural and industrial sources.
Trend Across Scotland as a whole, emissions of SO2 fell sharply during the 1990s and fell again between 2000 and 2012, although there is significant year to year variability. It is likely that SO2 emissions have similarly fallen in East Ayrshire as a result of the declining domestic use of coal, although in the absence of major point sources, the relative reduction in SO2 emissions since 1990 may be less than at national level. 2.2 Air quality State The predicted background concentrations of NO2 and PM10 in 2014 published on the Scottish Air Quality website are based on modelled concentrations in 2010 and an assumption of a continued decline NOx emissions from vehicle emissions leading to lower NO2 concentrations. In practice, the expected decline in NO2 concentrations has been less than expected due to the increased proportion of diesel versus petrol fuelled vehicles and the higher rates of NOx emission during the road use of vehicles than predicted by laboratory testing. Actual background concentrations in East Ayrshire may therefore be marginally higher than shown in Figure 4.
East Ayrshire Council Chapter 4 – Air Quality State of the Environment Report Page 11
IronsideFarrar / Institute of Occupational Medicine July 2016
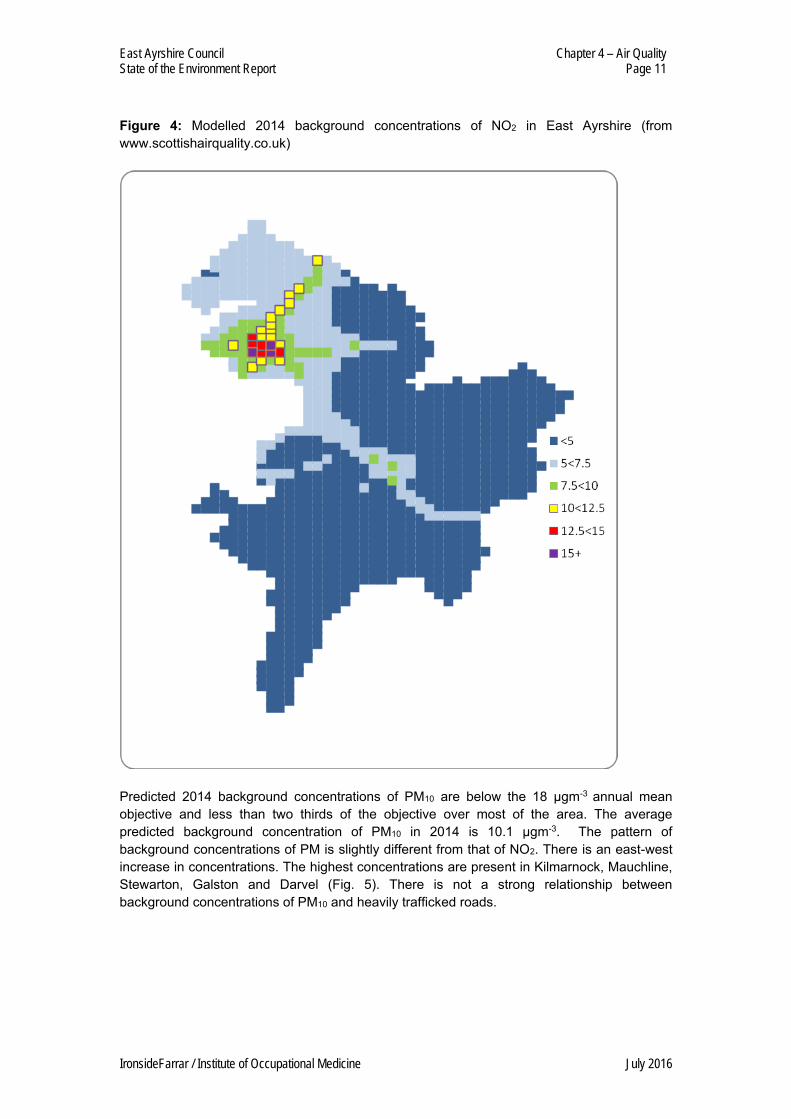
Figure 4: Modelled 2014 background concentrations of NO2 in East Ayrshire (from www.scottishairquality.co.uk)
Predicted 2014 background concentrations of PM10 are below the 18 µgm-3 annual mean objective and less than two thirds of the objective over most of the area. The average predicted background concentration of PM10 in 2014 is 10.1 µgm-3. The pattern of background concentrations of PM is slightly different from that of NO2. There is an east-west increase in concentrations. The highest concentrations are present in Kilmarnock, Mauchline, Stewarton, Galston and Darvel (Fig. 5). There is not a strong relationship between background concentrations of PM10 and heavily trafficked roads.
East Ayrshire Council Chapter 4 – Air Quality State of the Environment Report Page 12
IronsideFarrar / Institute of Occupational Medicine July 2016
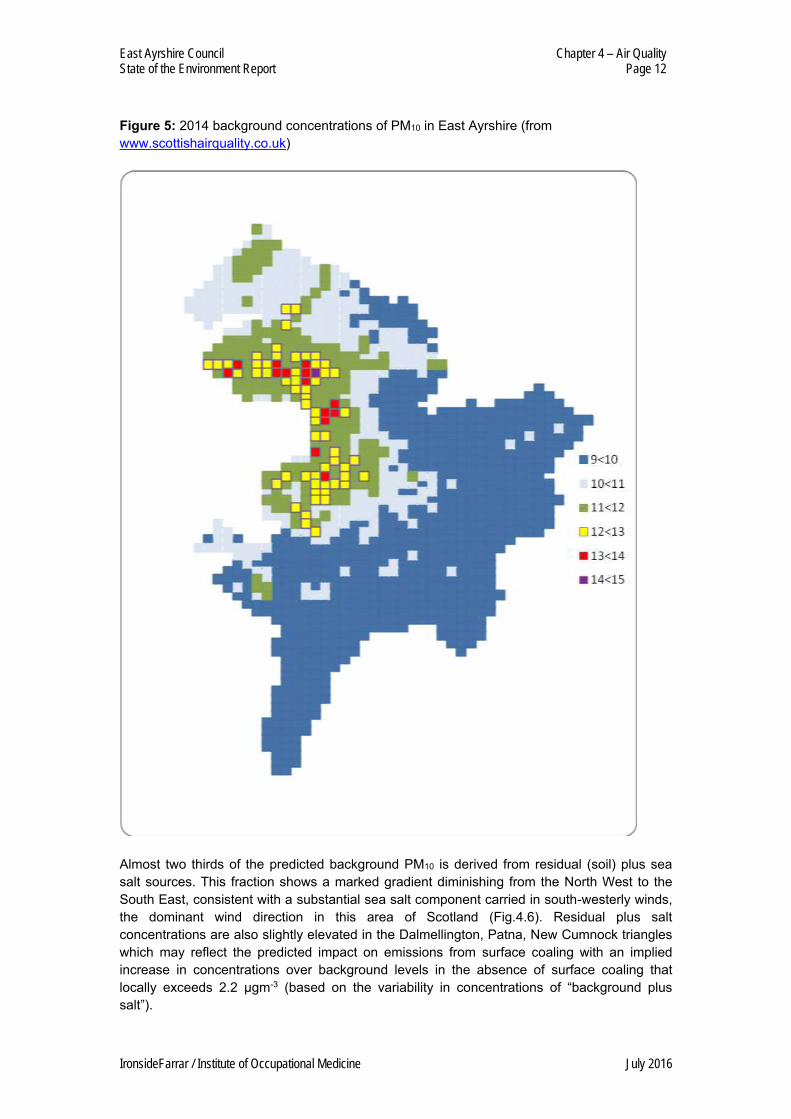
Figure 5: 2014 background concentrations of PM10 in East Ayrshire (from www.scottishairquality.co.uk)
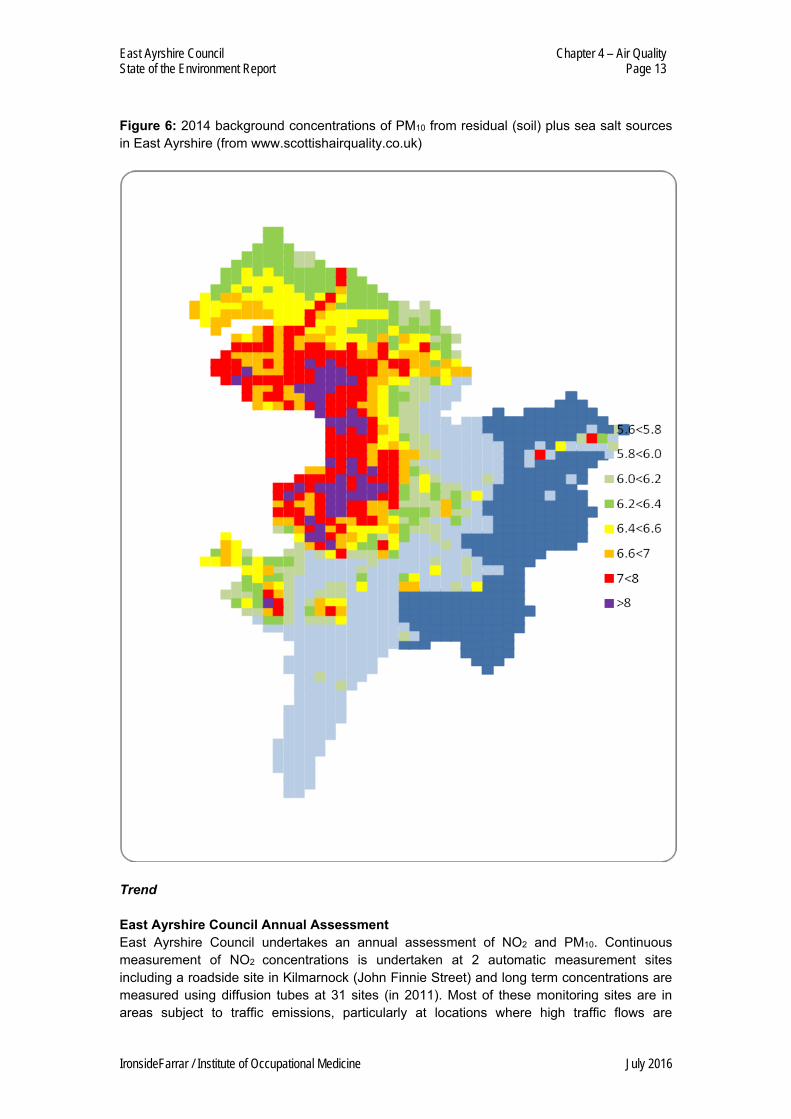
Almost two thirds of the predicted background PM10 is derived from residual (soil) plus sea salt sources. This fraction shows a marked gradient diminishing from the North West to the South East, consistent with a substantial sea salt component carried in south-westerly winds, the dominant wind direction in this area of Scotland (Fig.4.6). Residual plus salt concentrations are also slightly elevated in the Dalmellington, Patna, New Cumnock triangles which may reflect the predicted impact on emissions from surface coaling with an implied increase in concentrations over background levels in the absence of surface coaling that locally exceeds 2.2 µgm-3 (based on the variability in concentrations of “background plus salt”).
East Ayrshire Council Chapter 4 – Air Quality State of the Environment Report Page 13
IronsideFarrar / Institute of Occupational Medicine July 2016
Figure 6: 2014 background concentrations of PM10 from residual (soil) plus sea salt sources in East Ayrshire (from www.scottishairquality.co.uk)
Trend East Ayrshire Council Annual Assessment East Ayrshire Council undertakes an annual assessment of NO2 and PM10. Continuous measurement of NO2 concentrations is undertaken at 2 automatic measurement sites including a roadside site in Kilmarnock (John Finnie Street) and long term concentrations are measured using diffusion tubes at 31 sites (in 2011). Most of these monitoring sites are in areas subject to traffic emissions, particularly at locations where high traffic flows are
East Ayrshire Council Chapter 4 – Air Quality State of the Environment Report Page 14
IronsideFarrar / Institute of Occupational Medicine July 2016
combined with relatively narrow streets including Kilmarnock town centre, particularly John Finnie Street, the A71 in Newmilns and the A76 in Mauchline. The number of monitoring locations has grown substantially in the last few years to address known congestion ‘hotspots’. In addition, continuous monitoring for both NO2 and PM10 has been undertaken within a residential area in New Cumnock which lies within an extensive area of surface coaling. In 2011 (the most recent year that has been reviewed), there were no exceedences of the 40 µgm-3 annual mean objective for NO2, although in 2010, an annual mean concentration of 43 µgm-3 was measured at the John Finnie Street site in Kilmarnock. Measured annual mean concentrations in New Cumnock between 2009 and 2011 ranged from 7 and 11 µgm-3, well within the annual mean Air Quality Objective. No exceedences of the hourly mean Air Quality Objective were found between 2009 and 2011. The results of diffusion tube monitoring at road side and kerbside locations elsewhere in East Ayrshire indicate that mean concentrations of NO2 in 2011 at the chosen localities were typically <30 µgm-3 with a maximum measured concentration of 3.8 µgm-3 at West George Street in Kilmarnock. Automatic Monitoring of PM10 within John Finnie Street, Kilmarnock indicated that levels of PM10 exceeded the Annual Mean Air Quality Objective (18 µgm-3) during both 2010 and 2011 and a Detailed Assessment for PM10 is to be undertaken within Kilmarnock. Oxides of Nitrogen - NOx, NO2 For sites where measurements of NO2 have been made for more than 3 years, the data does not show a consistent trend through time. Concentrations were generally lower in 2011 than in earlier years but concentrations in
2010 were generally slightly higher than in 2009; Measurements made elsewhere at automatic monitoring stations elsewhere in Scotland
show a small decline in urban background concentrations of NO2 between 2003 and 20123 whereas measurements made at roadside and kerbside sites show inconsistent trends over the same time period: small increases at sites in Glasgow and Inverness and small reductions at sites in Dumfries and Perth;
Measurements made at 4 roadside sites in Dundee show a mix of increasing and reducing NO2 concentrations over this time period; and
It is not currently possible to predict whether concentrations of NO2 in East Ayrshire are likely to show a consistent downward trend in future years.
Air quality assessment should be undertaken for proposed developments where there is the potential to generate significant emissions e.g. major developments, biomass developments etc.
3 http://www.scottishairquality.co.uk/assets/images/NO2_UBtrends_2003-12.png
East Ayrshire Council Chapter 4 – Air Quality State of the Environment Report Page 15
IronsideFarrar / Institute of Occupational Medicine July 2016
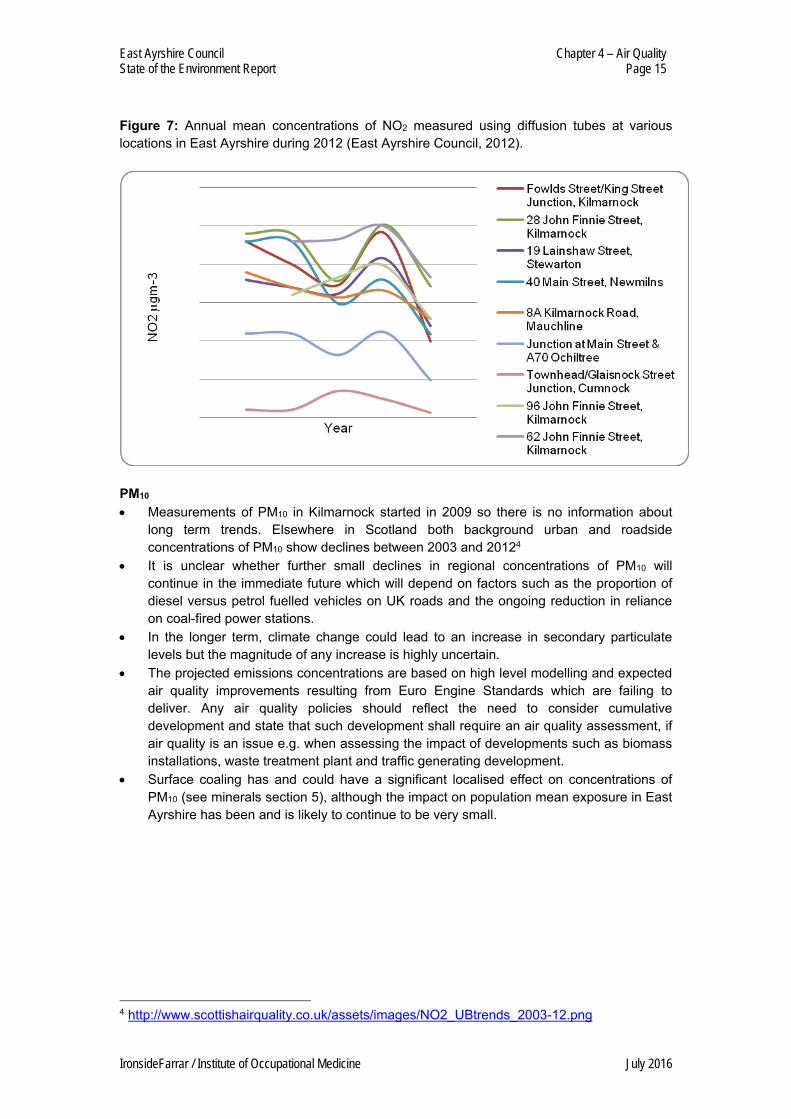
Figure 7: Annual mean concentrations of NO2 measured using diffusion tubes at various locations in East Ayrshire during 2012 (East Ayrshire Council, 2012).
PM10 Measurements of PM10 in Kilmarnock started in 2009 so there is no information about
long term trends. Elsewhere in Scotland both background urban and roadside concentrations of PM10 show declines between 2003 and 20124
It is unclear whether further small declines in regional concentrations of PM10 will continue in the immediate future which will depend on factors such as the proportion of diesel versus petrol fuelled vehicles on UK roads and the ongoing reduction in reliance on coal-fired power stations.
In the longer term, climate change could lead to an increase in secondary particulate levels but the magnitude of any increase is highly uncertain.
The projected emissions concentrations are based on high level modelling and expected air quality improvements resulting from Euro Engine Standards which are failing to deliver. Any air quality policies should reflect the need to consider cumulative development and state that such development shall require an air quality assessment, if air quality is an issue e.g. when assessing the impact of developments such as biomass installations, waste treatment plant and traffic generating development.
Surface coaling has and could have a significant localised effect on concentrations of PM10 (see minerals section 5), although the impact on population mean exposure in East Ayrshire has been and is likely to continue to be very small.
4 http://www.scottishairquality.co.uk/assets/images/NO2_UBtrends_2003-12.png
East Ayrshire Council Chapter 4 – Air Quality State of the Environment Report Page 16
IronsideFarrar / Institute of Occupational Medicine July 2016
2.3 Acidification State There are a number of Sites of Special Scientific Interest (SSSIs) and Special Areas of
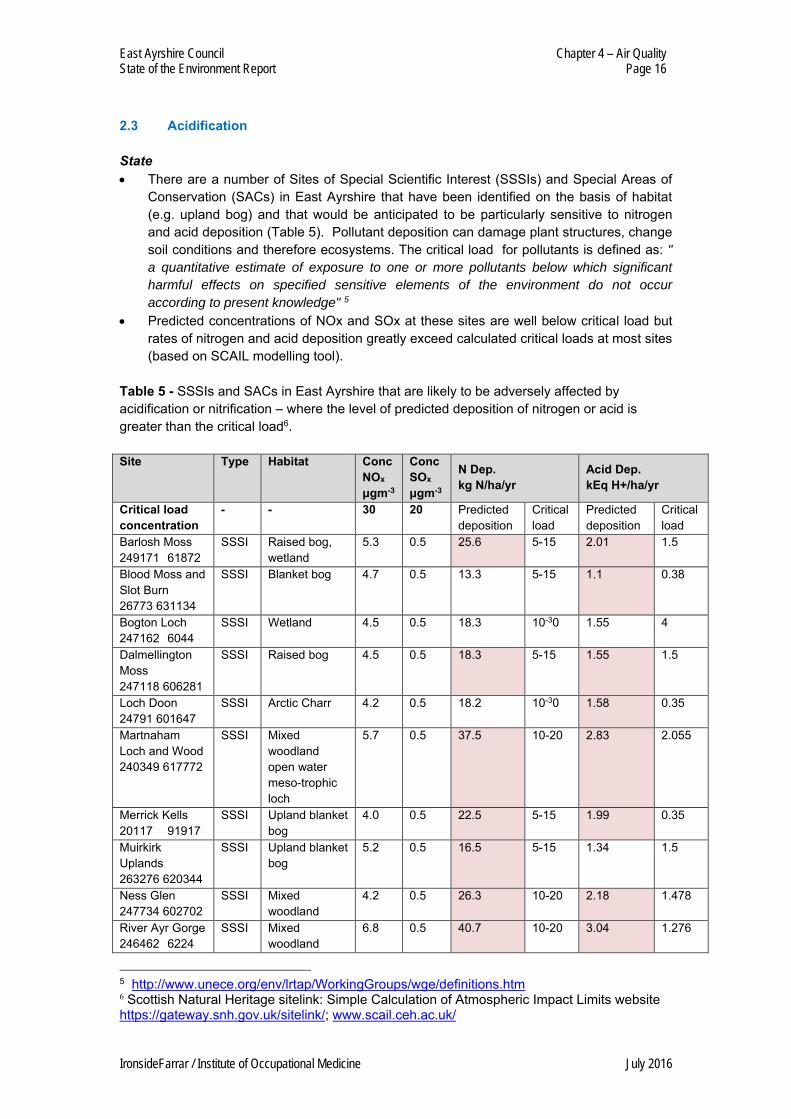
Conservation (SACs) in East Ayrshire that have been identified on the basis of habitat (e.g. upland bog) and that would be anticipated to be particularly sensitive to nitrogen and acid deposition (Table 5). Pollutant deposition can damage plant structures, change soil conditions and therefore ecosystems. The critical load for pollutants is defined as: " a quantitative estimate of exposure to one or more pollutants below which significant
harmful effects on specified sensitive elements of the environment do not occur
according to present knowledge" 5 Predicted concentrations of NOx and SOx at these sites are well below critical load but
rates of nitrogen and acid deposition greatly exceed calculated critical loads at most sites (based on SCAIL modelling tool).
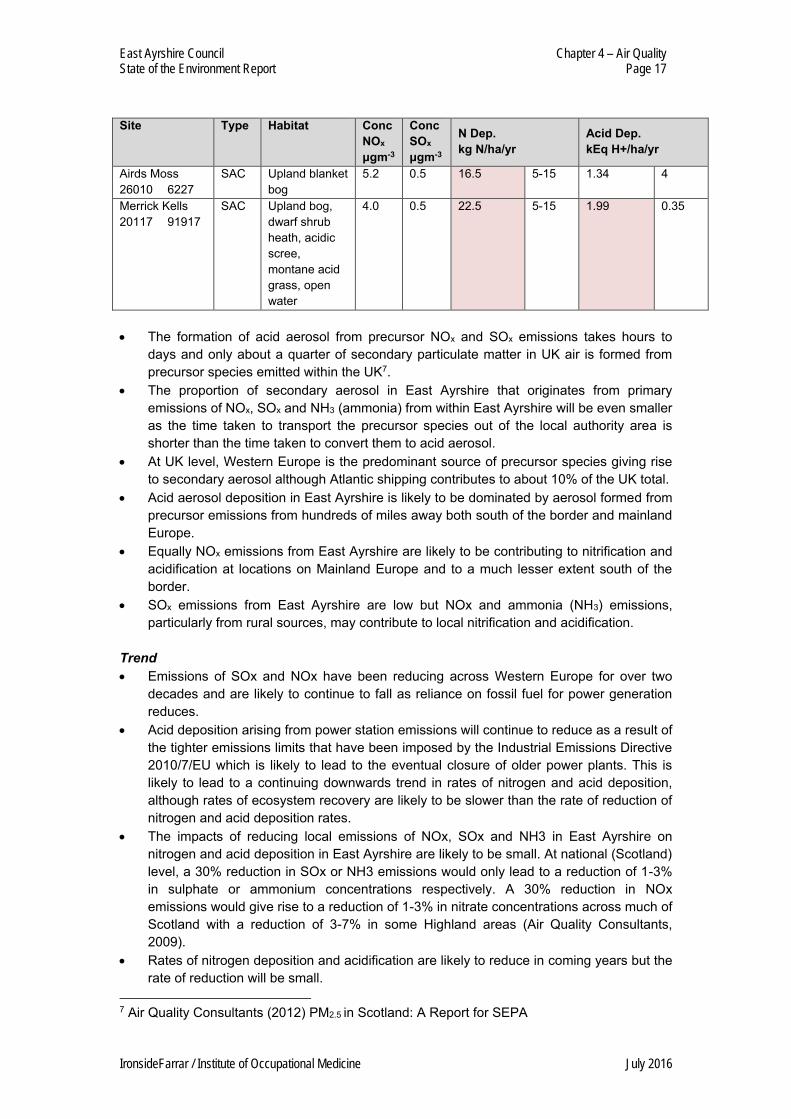
Table 5 - SSSIs and SACs in East Ayrshire that are likely to be adversely affected by acidification or nitrification – where the level of predicted deposition of nitrogen or acid is greater than the critical load6. Site Type Habitat Conc
NOx μgm-3
Conc SOx μgm-3
N Dep. kg N/ha/yr
Acid Dep. kEq H+/ha/yr
Critical load concentration
- - 30 20 Predicted deposition
Critical load
Predicted deposition
Critical load
Barlosh Moss 249171 61872
SSSI Raised bog, wetland
5.3 0.5 25.6 5-15 2.01 1.5
Blood Moss and Slot Burn 26773 631134
SSSI Blanket bog 4.7 0.5 13.3 5-15 1.1 0.38
Bogton Loch 247162 6044
SSSI Wetland 4.5 0.5 18.3 10-30 1.55 4
Dalmellington Moss 247118 606281
SSSI Raised bog 4.5 0.5 18.3 5-15 1.55 1.5
Loch Doon 24791 601647
SSSI Arctic Charr 4.2 0.5 18.2 10-30 1.58 0.35
Martnaham Loch and Wood 240349 617772
SSSI Mixed woodland open water meso-trophic loch
5.7 0.5 37.5 10-20 2.83 2.055
Merrick Kells 20117 91917
SSSI Upland blanket bog
4.0 0.5 22.5 5-15 1.99 0.35
Muirkirk Uplands 263276 620344
SSSI Upland blanket bog
5.2 0.5 16.5 5-15 1.34 1.5
Ness Glen 247734 602702
SSSI Mixed woodland
4.2 0.5 26.3 10-20 2.18 1.478
River Ayr Gorge 246462 6224
SSSI Mixed woodland
6.8 0.5 40.7 10-20 3.04 1.276
5 http://www.unece.org/env/lrtap/WorkingGroups/wge/definitions.htm 6 Scottish Natural Heritage sitelink: Simple Calculation of Atmospheric Impact Limits website https://gateway.snh.gov.uk/sitelink/; www.scail.ceh.ac.uk/
East Ayrshire Council Chapter 4 – Air Quality State of the Environment Report Page 17
IronsideFarrar / Institute of Occupational Medicine July 2016
Site Type Habitat Conc NOx μgm-3
Conc SOx μgm-3
N Dep. kg N/ha/yr
Acid Dep. kEq H+/ha/yr
Airds Moss 26010 6227
SAC Upland blanket bog
5.2 0.5 16.5 5-15 1.34 4
Merrick Kells 20117 91917
SAC Upland bog, dwarf shrub heath, acidic scree, montane acid grass, open water
4.0 0.5 22.5 5-15 1.99 0.35
The formation of acid aerosol from precursor NOx and SOx emissions takes hours to
days and only about a quarter of secondary particulate matter in UK air is formed from precursor species emitted within the UK7.
The proportion of secondary aerosol in East Ayrshire that originates from primary emissions of NOx, SOx and NH3 (ammonia) from within East Ayrshire will be even smaller as the time taken to transport the precursor species out of the local authority area is shorter than the time taken to convert them to acid aerosol.
At UK level, Western Europe is the predominant source of precursor species giving rise to secondary aerosol although Atlantic shipping contributes to about 10% of the UK total.
Acid aerosol deposition in East Ayrshire is likely to be dominated by aerosol formed from precursor emissions from hundreds of miles away both south of the border and mainland Europe.
Equally NOx emissions from East Ayrshire are likely to be contributing to nitrification and acidification at locations on Mainland Europe and to a much lesser extent south of the border.
SOx emissions from East Ayrshire are low but NOx and ammonia (NH3) emissions, particularly from rural sources, may contribute to local nitrification and acidification.
Trend Emissions of SOx and NOx have been reducing across Western Europe for over two
decades and are likely to continue to fall as reliance on fossil fuel for power generation reduces.
Acid deposition arising from power station emissions will continue to reduce as a result of the tighter emissions limits that have been imposed by the Industrial Emissions Directive 2010/7/EU which is likely to lead to the eventual closure of older power plants. This is likely to lead to a continuing downwards trend in rates of nitrogen and acid deposition, although rates of ecosystem recovery are likely to be slower than the rate of reduction of nitrogen and acid deposition rates.
The impacts of reducing local emissions of NOx, SOx and NH3 in East Ayrshire on nitrogen and acid deposition in East Ayrshire are likely to be small. At national (Scotland) level, a 30% reduction in SOx or NH3 emissions would only lead to a reduction of 1-3% in sulphate or ammonium concentrations respectively. A 30% reduction in NOx emissions would give rise to a reduction of 1-3% in nitrate concentrations across much of Scotland with a reduction of 3-7% in some Highland areas (Air Quality Consultants, 2009).
Rates of nitrogen deposition and acidification are likely to reduce in coming years but the rate of reduction will be small.
7 Air Quality Consultants (2012) PM2.5 in Scotland: A Report for SEPA
East Ayrshire Council Chapter 4 – Air Quality State of the Environment Report Page 18
IronsideFarrar / Institute of Occupational Medicine July 2016
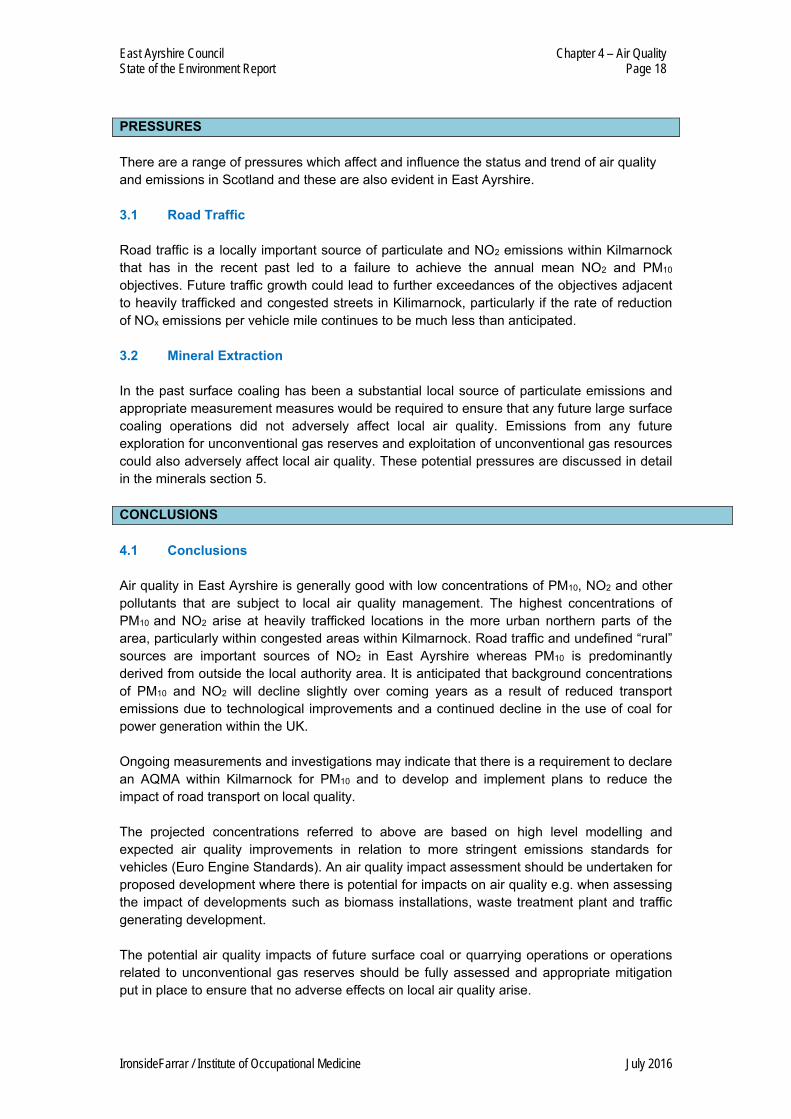
PRESSURES There are a range of pressures which affect and influence the status and trend of air quality and emissions in Scotland and these are also evident in East Ayrshire. 3.1 Road Traffic Road traffic is a locally important source of particulate and NO2 emissions within Kilmarnock that has in the recent past led to a failure to achieve the annual mean NO2 and PM10 objectives. Future traffic growth could lead to further exceedances of the objectives adjacent to heavily trafficked and congested streets in Kilimarnock, particularly if the rate of reduction of NOx emissions per vehicle mile continues to be much less than anticipated. 3.2 Mineral Extraction In the past surface coaling has been a substantial local source of particulate emissions and appropriate measurement measures would be required to ensure that any future large surface coaling operations did not adversely affect local air quality. Emissions from any future exploration for unconventional gas reserves and exploitation of unconventional gas resources could also adversely affect local air quality. These potential pressures are discussed in detail in the minerals section 5. CONCLUSIONS 4.1 Conclusions Air quality in East Ayrshire is generally good with low concentrations of PM10, NO2 and other pollutants that are subject to local air quality management. The highest concentrations of PM10 and NO2 arise at heavily trafficked locations in the more urban northern parts of the area, particularly within congested areas within Kilmarnock. Road traffic and undefined “rural” sources are important sources of NO2 in East Ayrshire whereas PM10 is predominantly derived from outside the local authority area. It is anticipated that background concentrations of PM10 and NO2 will decline slightly over coming years as a result of reduced transport emissions due to technological improvements and a continued decline in the use of coal for power generation within the UK. Ongoing measurements and investigations may indicate that there is a requirement to declare an AQMA within Kilmarnock for PM10 and to develop and implement plans to reduce the impact of road transport on local quality. The projected concentrations referred to above are based on high level modelling and expected air quality improvements in relation to more stringent emissions standards for vehicles (Euro Engine Standards). An air quality impact assessment should be undertaken for proposed development where there is potential for impacts on air quality e.g. when assessing the impact of developments such as biomass installations, waste treatment plant and traffic generating development. The potential air quality impacts of future surface coal or quarrying operations or operations related to unconventional gas reserves should be fully assessed and appropriate mitigation put in place to ensure that no adverse effects on local air quality arise.
East Ayrshire Council Chapter 4 – Air Quality State of the Environment Report Page 19
IronsideFarrar / Institute of Occupational Medicine July 2016
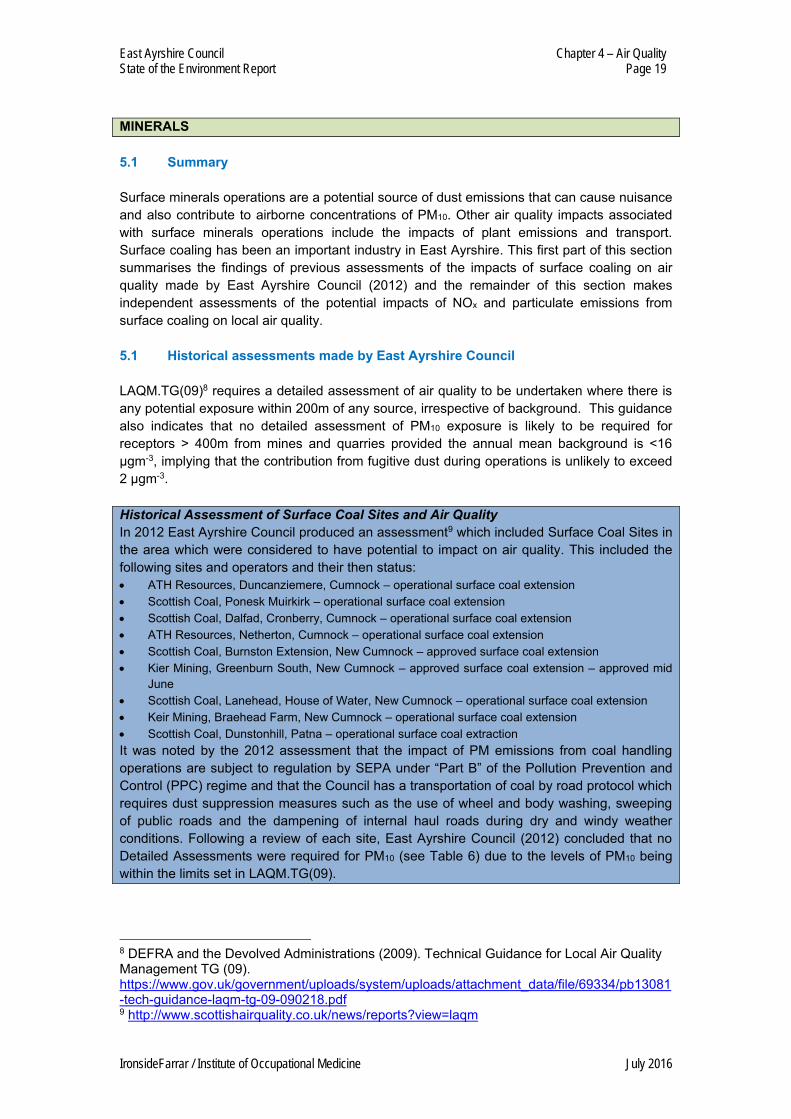
MINERALS 5.1 Summary Surface minerals operations are a potential source of dust emissions that can cause nuisance and also contribute to airborne concentrations of PM10. Other air quality impacts associated with surface minerals operations include the impacts of plant emissions and transport. Surface coaling has been an important industry in East Ayrshire. This first part of this section summarises the findings of previous assessments of the impacts of surface coaling on air quality made by East Ayrshire Council (2012) and the remainder of this section makes independent assessments of the potential impacts of NOx and particulate emissions from surface coaling on local air quality. 5.1 Historical assessments made by East Ayrshire Council LAQM.TG(09)8 requires a detailed assessment of air quality to be undertaken where there is any potential exposure within 200m of any source, irrespective of background. This guidance also indicates that no detailed assessment of PM10 exposure is likely to be required for receptors > 400m from mines and quarries provided the annual mean background is <16 µgm-3, implying that the contribution from fugitive dust during operations is unlikely to exceed 2 µgm-3. Historical Assessment of Surface Coal Sites and Air Quality In 2012 East Ayrshire Council produced an assessment9 which included Surface Coal Sites in the area which were considered to have potential to impact on air quality. This included the following sites and operators and their then status: ATH Resources, Duncanziemere, Cumnock – operational surface coal extension Scottish Coal, Ponesk Muirkirk – operational surface coal extension Scottish Coal, Dalfad, Cronberry, Cumnock – operational surface coal extension ATH Resources, Netherton, Cumnock – operational surface coal extension Scottish Coal, Burnston Extension, New Cumnock – approved surface coal extension Kier Mining, Greenburn South, New Cumnock – approved surface coal extension – approved mid
June Scottish Coal, Lanehead, House of Water, New Cumnock – operational surface coal extension Keir Mining, Braehead Farm, New Cumnock – operational surface coal extension Scottish Coal, Dunstonhill, Patna – operational surface coal extraction It was noted by the 2012 assessment that the impact of PM emissions from coal handling operations are subject to regulation by SEPA under “Part B” of the Pollution Prevention and Control (PPC) regime and that the Council has a transportation of coal by road protocol which requires dust suppression measures such as the use of wheel and body washing, sweeping of public roads and the dampening of internal haul roads during dry and windy weather conditions. Following a review of each site, East Ayrshire Council (2012) concluded that no Detailed Assessments were required for PM10 (see Table 6) due to the levels of PM10 being within the limits set in LAQM.TG(09).
8 DEFRA and the Devolved Administrations (2009). Technical Guidance for Local Air Quality Management TG (09). https://www.gov.uk/government/uploads/system/uploads/attachment_data/file/69334/pb13081-tech-guidance-laqm-tg-09-090218.pdf 9 http://www.scottishairquality.co.uk/news/reports?view=laqm
East Ayrshire Council Chapter 4 – Air Quality State of the Environment Report Page 20
IronsideFarrar / Institute of Occupational Medicine July 2016
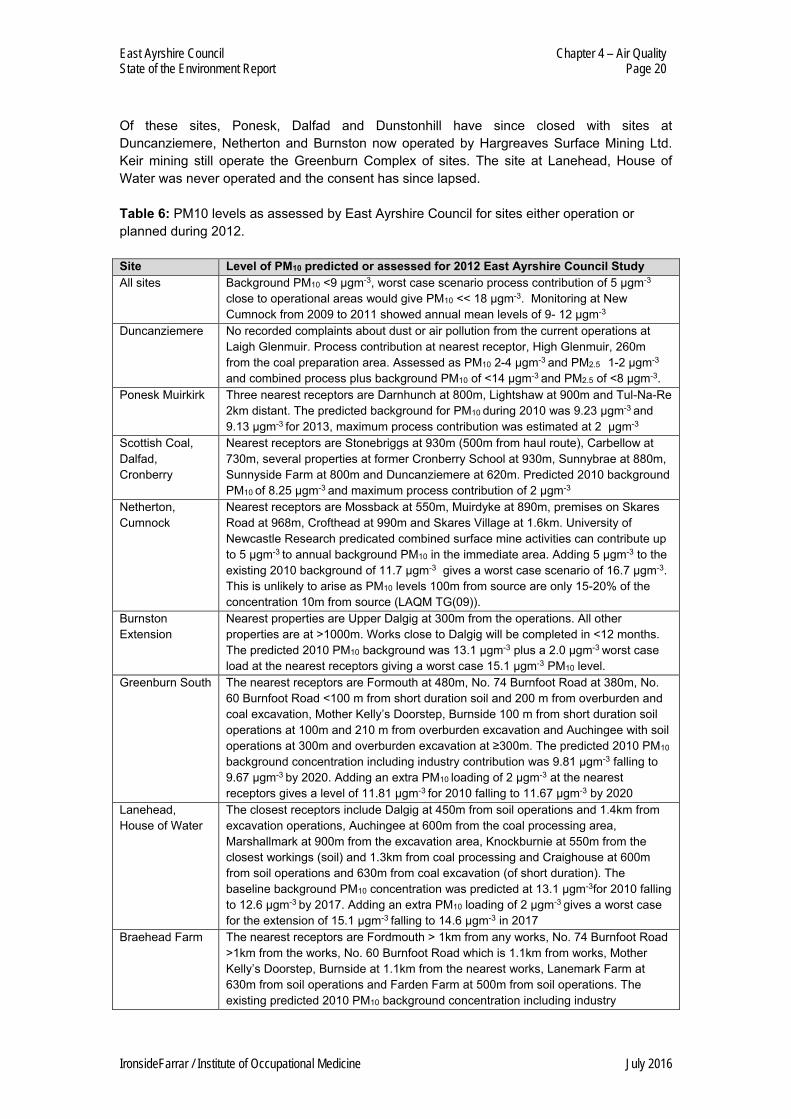
Of these sites, Ponesk, Dalfad and Dunstonhill have since closed with sites at Duncanziemere, Netherton and Burnston now operated by Hargreaves Surface Mining Ltd. Keir mining still operate the Greenburn Complex of sites. The site at Lanehead, House of Water was never operated and the consent has since lapsed. Table 6: PM10 levels as assessed by East Ayrshire Council for sites either operation or planned during 2012. Site Level of PM10 predicted or assessed for 2012 East Ayrshire Council Study All sites Background PM10 <9 µgm-3, worst case scenario process contribution of 5 µgm-3
close to operational areas would give PM10 << 18 µgm-3. Monitoring at New Cumnock from 2009 to 2011 showed annual mean levels of 9- 12 µgm-3
Duncanziemere No recorded complaints about dust or air pollution from the current operations at Laigh Glenmuir. Process contribution at nearest receptor, High Glenmuir, 260m from the coal preparation area. Assessed as PM10 2-4 µgm-3 and PM2.5 1-2 µgm-3
and combined process plus background PM10 of <14 µgm-3 and PM2.5 of <8 µgm-3. Ponesk Muirkirk Three nearest receptors are Darnhunch at 800m, Lightshaw at 900m and Tul-Na-Re
2km distant. The predicted background for PM10 during 2010 was 9.23 µgm-3 and 9.13 µgm-3 for 2013, maximum process contribution was estimated at 2 µgm-3
Scottish Coal, Dalfad, Cronberry
Nearest receptors are Stonebriggs at 930m (500m from haul route), Carbellow at 730m, several properties at former Cronberry School at 930m, Sunnybrae at 880m, Sunnyside Farm at 800m and Duncanziemere at 620m. Predicted 2010 background PM10 of 8.25 µgm-3 and maximum process contribution of 2 µgm-3
Netherton, Cumnock
Nearest receptors are Mossback at 550m, Muirdyke at 890m, premises on Skares Road at 968m, Crofthead at 990m and Skares Village at 1.6km. University of Newcastle Research predicated combined surface mine activities can contribute up to 5 µgm-3 to annual background PM10 in the immediate area. Adding 5 µgm-3 to the existing 2010 background of 11.7 µgm-3 gives a worst case scenario of 16.7 µgm-3. This is unlikely to arise as PM10 levels 100m from source are only 15-20% of the concentration 10m from source (LAQM TG(09)).
Burnston Extension
Nearest properties are Upper Dalgig at 300m from the operations. All other properties are at >1000m. Works close to Dalgig will be completed in <12 months. The predicted 2010 PM10 background was 13.1 µgm-3 plus a 2.0 µgm-3 worst case load at the nearest receptors giving a worst case 15.1 µgm-3 PM10 level.
Greenburn South The nearest receptors are Formouth at 480m, No. 74 Burnfoot Road at 380m, No. 60 Burnfoot Road <100 m from short duration soil and 200 m from overburden and coal excavation, Mother Kelly’s Doorstep, Burnside 100 m from short duration soil operations at 100m and 210 m from overburden excavation and Auchingee with soil operations at 300m and overburden excavation at ≥300m. The predicted 2010 PM10 background concentration including industry contribution was 9.81 µgm-3 falling to 9.67 µgm-3 by 2020. Adding an extra PM10 loading of 2 µgm-3 at the nearest receptors gives a level of 11.81 µgm-3 for 2010 falling to 11.67 µgm-3 by 2020
Lanehead, House of Water
The closest receptors include Dalgig at 450m from soil operations and 1.4km from excavation operations, Auchingee at 600m from the coal processing area, Marshallmark at 900m from the excavation area, Knockburnie at 550m from the closest workings (soil) and 1.3km from coal processing and Craighouse at 600m from soil operations and 630m from coal excavation (of short duration). The baseline background PM10 concentration was predicted at 13.1 µgm-3for 2010 falling to 12.6 µgm-3 by 2017. Adding an extra PM10 loading of 2 µgm-3 gives a worst case for the extension of 15.1 µgm-3 falling to 14.6 µgm-3 in 2017
Braehead Farm The nearest receptors are Fordmouth > 1km from any works, No. 74 Burnfoot Road >1km from the works, No. 60 Burnfoot Road which is 1.1km from works, Mother Kelly’s Doorstep, Burnside at 1.1km from the nearest works, Lanemark Farm at 630m from soil operations and Farden Farm at 500m from soil operations. The existing predicted 2010 PM10 background concentration including industry
East Ayrshire Council Chapter 4 – Air Quality State of the Environment Report Page 21
IronsideFarrar / Institute of Occupational Medicine July 2016
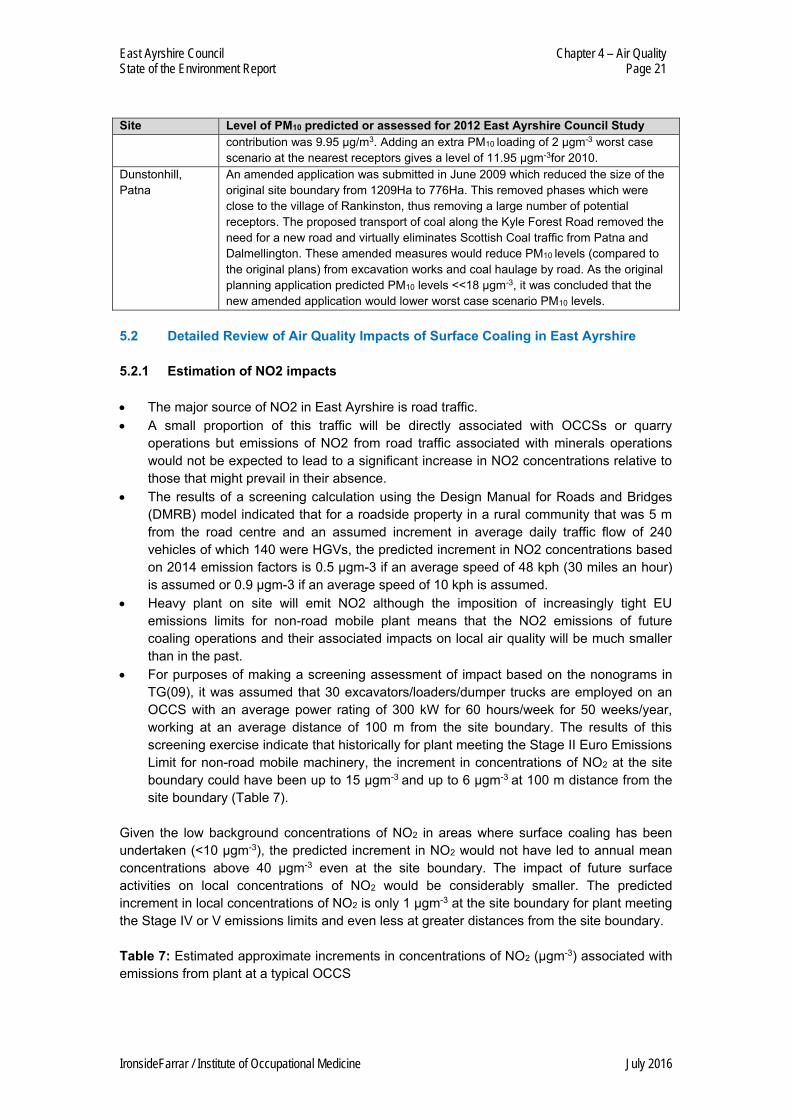
Site Level of PM10 predicted or assessed for 2012 East Ayrshire Council Study contribution was 9.95 µg/m3. Adding an extra PM10 loading of 2 µgm-3 worst case scenario at the nearest receptors gives a level of 11.95 µgm-3for 2010.
Dunstonhill, Patna
An amended application was submitted in June 2009 which reduced the size of the original site boundary from 1209Ha to 776Ha. This removed phases which were close to the village of Rankinston, thus removing a large number of potential receptors. The proposed transport of coal along the Kyle Forest Road removed the need for a new road and virtually eliminates Scottish Coal traffic from Patna and Dalmellington. These amended measures would reduce PM10 levels (compared to the original plans) from excavation works and coal haulage by road. As the original planning application predicted PM10 levels <<18 µgm-3, it was concluded that the new amended application would lower worst case scenario PM10 levels.
5.2 Detailed Review of Air Quality Impacts of Surface Coaling in East Ayrshire 5.2.1 Estimation of NO2 impacts
The major source of NO2 in East Ayrshire is road traffic. A small proportion of this traffic will be directly associated with OCCSs or quarry
operations but emissions of NO2 from road traffic associated with minerals operations would not be expected to lead to a significant increase in NO2 concentrations relative to those that might prevail in their absence.
The results of a screening calculation using the Design Manual for Roads and Bridges (DMRB) model indicated that for a roadside property in a rural community that was 5 m from the road centre and an assumed increment in average daily traffic flow of 240 vehicles of which 140 were HGVs, the predicted increment in NO2 concentrations based on 2014 emission factors is 0.5 µgm-3 if an average speed of 48 kph (30 miles an hour) is assumed or 0.9 µgm-3 if an average speed of 10 kph is assumed.
Heavy plant on site will emit NO2 although the imposition of increasingly tight EU emissions limits for non-road mobile plant means that the NO2 emissions of future coaling operations and their associated impacts on local air quality will be much smaller than in the past.
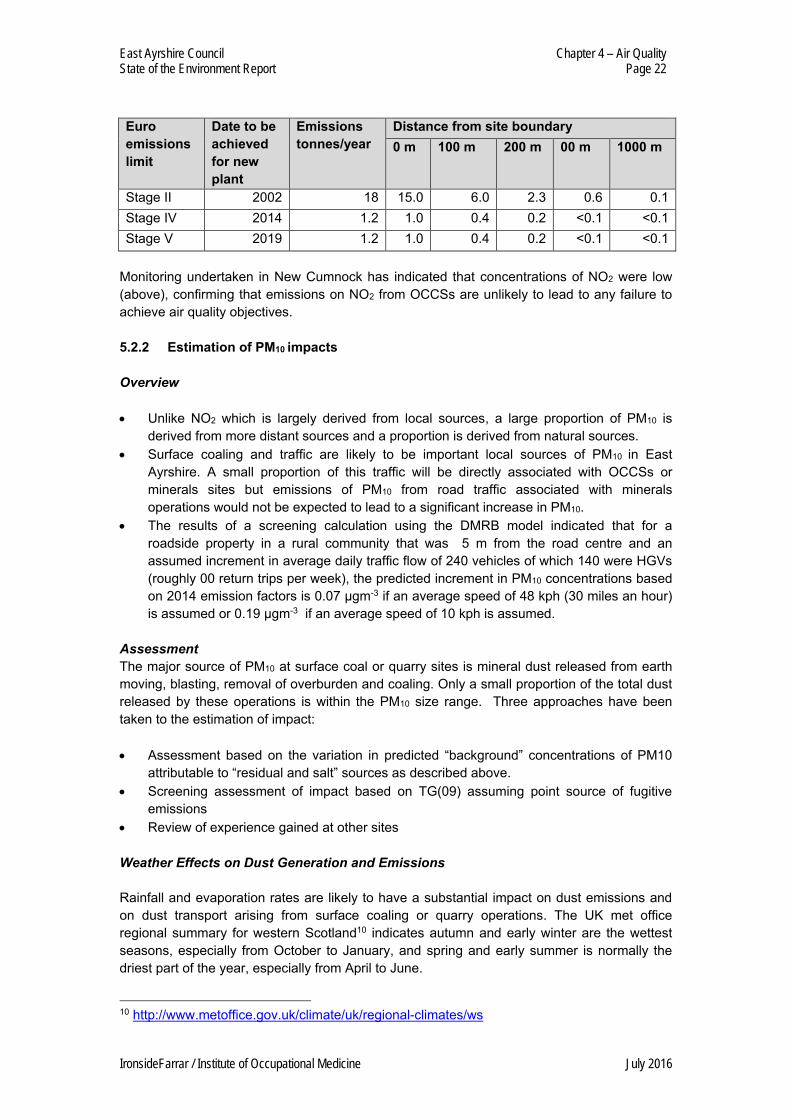
For purposes of making a screening assessment of impact based on the nonograms in TG(09), it was assumed that 30 excavators/loaders/dumper trucks are employed on an OCCS with an average power rating of 300 kW for 60 hours/week for 50 weeks/year, working at an average distance of 100 m from the site boundary. The results of this screening exercise indicate that historically for plant meeting the Stage II Euro Emissions Limit for non-road mobile machinery, the increment in concentrations of NO2 at the site boundary could have been up to 15 µgm-3 and up to 6 µgm-3 at 100 m distance from the site boundary (Table 7).
Given the low background concentrations of NO2 in areas where surface coaling has been undertaken (<10 µgm-3), the predicted increment in NO2 would not have led to annual mean concentrations above 40 µgm-3 even at the site boundary. The impact of future surface activities on local concentrations of NO2 would be considerably smaller. The predicted increment in local concentrations of NO2 is only 1 µgm-3 at the site boundary for plant meeting the Stage IV or V emissions limits and even less at greater distances from the site boundary. Table 7: Estimated approximate increments in concentrations of NO2 (µgm-3) associated with emissions from plant at a typical OCCS
East Ayrshire Council Chapter 4 – Air Quality State of the Environment Report Page 22
IronsideFarrar / Institute of Occupational Medicine July 2016
Euro emissions limit
Date to be achieved for new plant
Emissions tonnes/year
Distance from site boundary 0 m 100 m 200 m 00 m 1000 m
Stage II 2002 18 15.0 6.0 2.3 0.6 0.1 Stage IV 2014 1.2 1.0 0.4 0.2 <0.1 <0.1 Stage V 2019 1.2 1.0 0.4 0.2 <0.1 <0.1
Monitoring undertaken in New Cumnock has indicated that concentrations of NO2 were low (above), confirming that emissions on NO2 from OCCSs are unlikely to lead to any failure to achieve air quality objectives.
5.2.2 Estimation of PM10 impacts
Overview Unlike NO2 which is largely derived from local sources, a large proportion of PM10 is
derived from more distant sources and a proportion is derived from natural sources. Surface coaling and traffic are likely to be important local sources of PM10 in East
Ayrshire. A small proportion of this traffic will be directly associated with OCCSs or minerals sites but emissions of PM10 from road traffic associated with minerals operations would not be expected to lead to a significant increase in PM10.
The results of a screening calculation using the DMRB model indicated that for a roadside property in a rural community that was 5 m from the road centre and an assumed increment in average daily traffic flow of 240 vehicles of which 140 were HGVs (roughly 00 return trips per week), the predicted increment in PM10 concentrations based on 2014 emission factors is 0.07 µgm-3 if an average speed of 48 kph (30 miles an hour) is assumed or 0.19 µgm-3 if an average speed of 10 kph is assumed.
Assessment The major source of PM10 at surface coal or quarry sites is mineral dust released from earth moving, blasting, removal of overburden and coaling. Only a small proportion of the total dust released by these operations is within the PM10 size range. Three approaches have been taken to the estimation of impact: Assessment based on the variation in predicted “background” concentrations of PM10
attributable to “residual and salt” sources as described above. Screening assessment of impact based on TG(09) assuming point source of fugitive
emissions Review of experience gained at other sites Weather Effects on Dust Generation and Emissions Rainfall and evaporation rates are likely to have a substantial impact on dust emissions and on dust transport arising from surface coaling or quarry operations. The UK met office regional summary for western Scotland10 indicates autumn and early winter are the wettest seasons, especially from October to January, and spring and early summer is normally the driest part of the year, especially from April to June.
10 http://www.metoffice.gov.uk/climate/uk/regional-climates/ws
East Ayrshire Council Chapter 4 – Air Quality State of the Environment Report Page 23
IronsideFarrar / Institute of Occupational Medicine July 2016
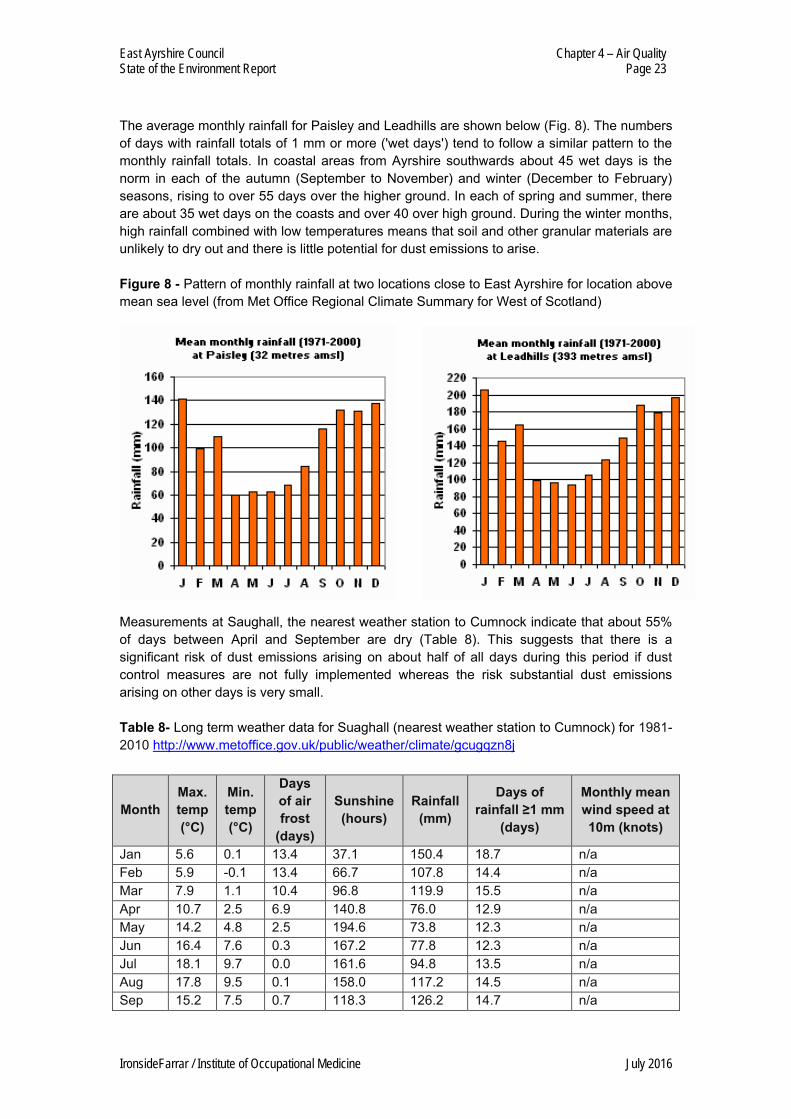
The average monthly rainfall for Paisley and Leadhills are shown below (Fig. 8). The numbers of days with rainfall totals of 1 mm or more ('wet days') tend to follow a similar pattern to the monthly rainfall totals. In coastal areas from Ayrshire southwards about 45 wet days is the norm in each of the autumn (September to November) and winter (December to February) seasons, rising to over 55 days over the higher ground. In each of spring and summer, there are about 35 wet days on the coasts and over 40 over high ground. During the winter months, high rainfall combined with low temperatures means that soil and other granular materials are unlikely to dry out and there is little potential for dust emissions to arise. Figure 8 - Pattern of monthly rainfall at two locations close to East Ayrshire for location above mean sea level (from Met Office Regional Climate Summary for West of Scotland)
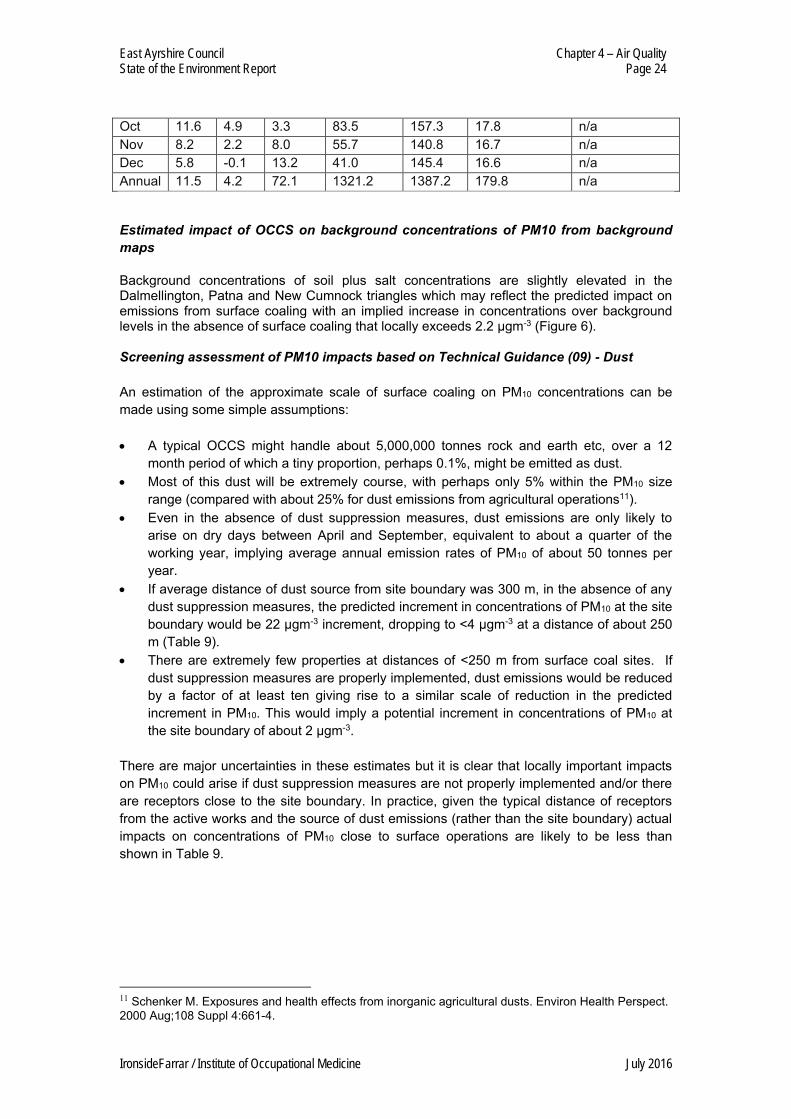
Measurements at Saughall, the nearest weather station to Cumnock indicate that about 55% of days between April and September are dry (Table 8). This suggests that there is a significant risk of dust emissions arising on about half of all days during this period if dust control measures are not fully implemented whereas the risk substantial dust emissions arising on other days is very small. Table 8- Long term weather data for Suaghall (nearest weather station to Cumnock) for 1981-2010 http://www.metoffice.gov.uk/public/weather/climate/gcugqzn8j
Month Max. temp (°C)
Min. temp (°C)
Days of air frost
(days)
Sunshine (hours)
Rainfall (mm)
Days of rainfall ≥1 mm
(days)
Monthly mean wind speed at 10m (knots)
Jan 5.6 0.1 13.4 37.1 150.4 18.7 n/a Feb 5.9 -0.1 13.4 66.7 107.8 14.4 n/a Mar 7.9 1.1 10.4 96.8 119.9 15.5 n/a Apr 10.7 2.5 6.9 140.8 76.0 12.9 n/a May 14.2 4.8 2.5 194.6 73.8 12.3 n/a Jun 16.4 7.6 0.3 167.2 77.8 12.3 n/a Jul 18.1 9.7 0.0 161.6 94.8 13.5 n/a Aug 17.8 9.5 0.1 158.0 117.2 14.5 n/a Sep 15.2 7.5 0.7 118.3 126.2 14.7 n/a
East Ayrshire Council Chapter 4 – Air Quality State of the Environment Report Page 24
IronsideFarrar / Institute of Occupational Medicine July 2016
Oct 11.6 4.9 3.3 83.5 157.3 17.8 n/a Nov 8.2 2.2 8.0 55.7 140.8 16.7 n/a Dec 5.8 -0.1 13.2 41.0 145.4 16.6 n/a Annual 11.5 4.2 72.1 1321.2 1387.2 179.8 n/a Estimated impact of OCCS on background concentrations of PM10 from background maps Background concentrations of soil plus salt concentrations are slightly elevated in the Dalmellington, Patna and New Cumnock triangles which may reflect the predicted impact on emissions from surface coaling with an implied increase in concentrations over background levels in the absence of surface coaling that locally exceeds 2.2 µgm-3 (Figure 6). Screening assessment of PM10 impacts based on Technical Guidance (09) - Dust An estimation of the approximate scale of surface coaling on PM10 concentrations can be made using some simple assumptions: A typical OCCS might handle about 5,000,000 tonnes rock and earth etc, over a 12
month period of which a tiny proportion, perhaps 0.1%, might be emitted as dust. Most of this dust will be extremely course, with perhaps only 5% within the PM10 size
range (compared with about 25% for dust emissions from agricultural operations11). Even in the absence of dust suppression measures, dust emissions are only likely to
arise on dry days between April and September, equivalent to about a quarter of the working year, implying average annual emission rates of PM10 of about 50 tonnes per year.
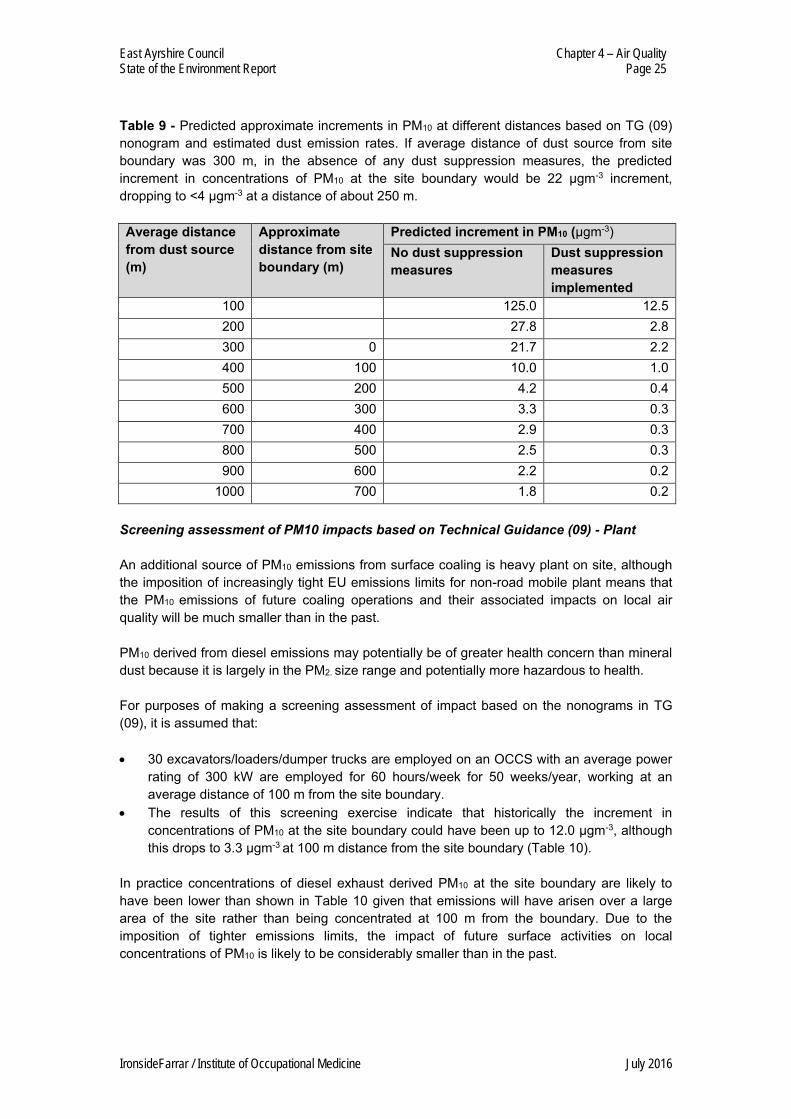
If average distance of dust source from site boundary was 300 m, in the absence of any dust suppression measures, the predicted increment in concentrations of PM10 at the site boundary would be 22 µgm-3 increment, dropping to <4 µgm-3 at a distance of about 250 m (Table 9).
There are extremely few properties at distances of <250 m from surface coal sites. If dust suppression measures are properly implemented, dust emissions would be reduced by a factor of at least ten giving rise to a similar scale of reduction in the predicted increment in PM10. This would imply a potential increment in concentrations of PM10 at the site boundary of about 2 µgm-3.
There are major uncertainties in these estimates but it is clear that locally important impacts on PM10 could arise if dust suppression measures are not properly implemented and/or there are receptors close to the site boundary. In practice, given the typical distance of receptors from the active works and the source of dust emissions (rather than the site boundary) actual impacts on concentrations of PM10 close to surface operations are likely to be less than shown in Table 9.
11 Schenker M. Exposures and health effects from inorganic agricultural dusts. Environ Health Perspect. 2000 Aug;108 Suppl 4:661-4.
East Ayrshire Council Chapter 4 – Air Quality State of the Environment Report Page 25
IronsideFarrar / Institute of Occupational Medicine July 2016
Table 9 - Predicted approximate increments in PM10 at different distances based on TG (09) nonogram and estimated dust emission rates. If average distance of dust source from site boundary was 300 m, in the absence of any dust suppression measures, the predicted increment in concentrations of PM10 at the site boundary would be 22 µgm-3 increment, dropping to <4 µgm-3 at a distance of about 250 m. Average distance from dust source (m)
Approximate distance from site boundary (m)
Predicted increment in PM10 (µgm-3) No dust suppression measures
Dust suppression measures implemented
100 125.0 12.5 200 27.8 2.8 300 0 21.7 2.2 400 100 10.0 1.0 500 200 4.2 0.4 600 300 3.3 0.3 700 400 2.9 0.3 800 500 2.5 0.3 900 600 2.2 0.2
1000 700 1.8 0.2 Screening assessment of PM10 impacts based on Technical Guidance (09) - Plant An additional source of PM10 emissions from surface coaling is heavy plant on site, although the imposition of increasingly tight EU emissions limits for non-road mobile plant means that the PM10 emissions of future coaling operations and their associated impacts on local air quality will be much smaller than in the past. PM10 derived from diesel emissions may potentially be of greater health concern than mineral dust because it is largely in the PM2. size range and potentially more hazardous to health. For purposes of making a screening assessment of impact based on the nonograms in TG (09), it is assumed that: 30 excavators/loaders/dumper trucks are employed on an OCCS with an average power
rating of 300 kW are employed for 60 hours/week for 50 weeks/year, working at an average distance of 100 m from the site boundary.
The results of this screening exercise indicate that historically the increment in concentrations of PM10 at the site boundary could have been up to 12.0 µgm-3, although this drops to 3.3 µgm-3 at 100 m distance from the site boundary (Table 10).
In practice concentrations of diesel exhaust derived PM10 at the site boundary are likely to have been lower than shown in Table 10 given that emissions will have arisen over a large area of the site rather than being concentrated at 100 m from the boundary. Due to the imposition of tighter emissions limits, the impact of future surface activities on local concentrations of PM10 is likely to be considerably smaller than in the past.
East Ayrshire Council Chapter 4 – Air Quality State of the Environment Report Page 26
IronsideFarrar / Institute of Occupational Medicine July 2016
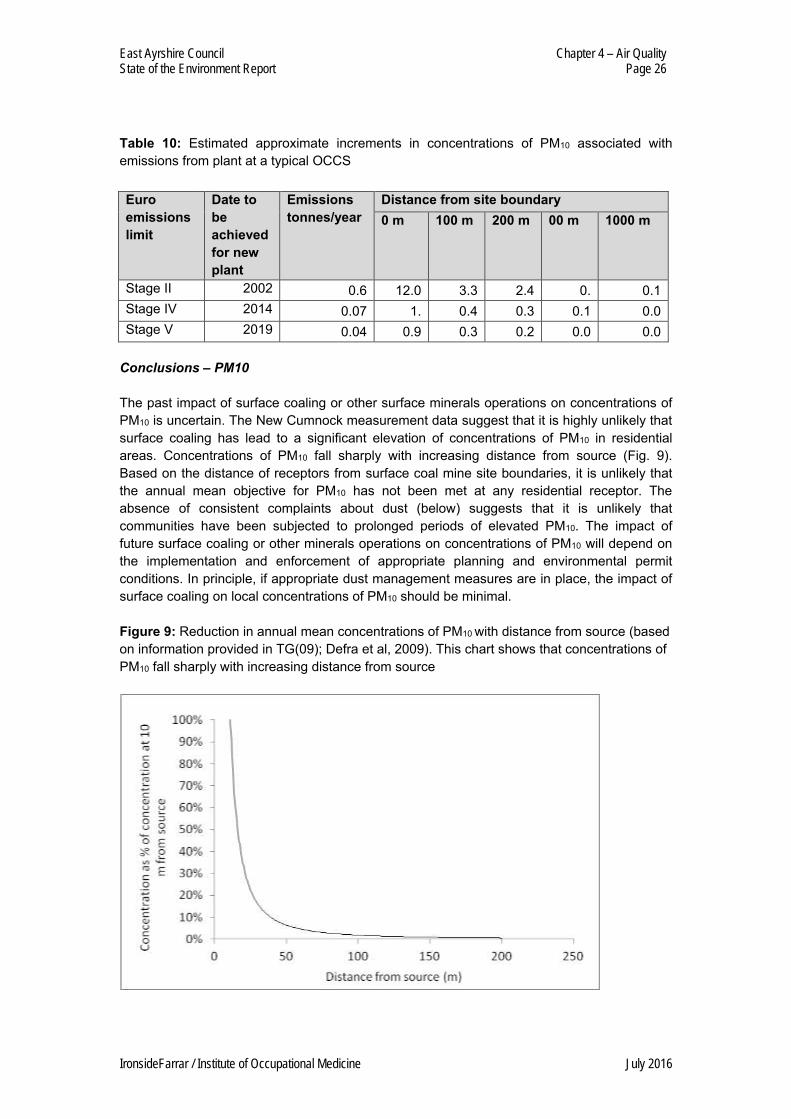
Table 10: Estimated approximate increments in concentrations of PM10 associated with emissions from plant at a typical OCCS
Euro emissions limit
Date to be achieved for new plant
Emissions tonnes/year
Distance from site boundary 0 m 100 m 200 m 00 m 1000 m
Stage II 2002 0.6 12.0 3.3 2.4 0. 0.1 Stage IV 2014 0.07 1. 0.4 0.3 0.1 0.0 Stage V 2019 0.04 0.9 0.3 0.2 0.0 0.0
Conclusions – PM10 The past impact of surface coaling or other surface minerals operations on concentrations of PM10 is uncertain. The New Cumnock measurement data suggest that it is highly unlikely that surface coaling has lead to a significant elevation of concentrations of PM10 in residential areas. Concentrations of PM10 fall sharply with increasing distance from source (Fig. 9). Based on the distance of receptors from surface coal mine site boundaries, it is unlikely that the annual mean objective for PM10 has not been met at any residential receptor. The absence of consistent complaints about dust (below) suggests that it is unlikely that communities have been subjected to prolonged periods of elevated PM10. The impact of future surface coaling or other minerals operations on concentrations of PM10 will depend on the implementation and enforcement of appropriate planning and environmental permit conditions. In principle, if appropriate dust management measures are in place, the impact of surface coaling on local concentrations of PM10 should be minimal. Figure 9: Reduction in annual mean concentrations of PM10 with distance from source (based on information provided in TG(09); Defra et al, 2009). This chart shows that concentrations of PM10 fall sharply with increasing distance from source
East Ayrshire Council Chapter 4 – Air Quality State of the Environment Report Page 27
IronsideFarrar / Institute of Occupational Medicine July 2016
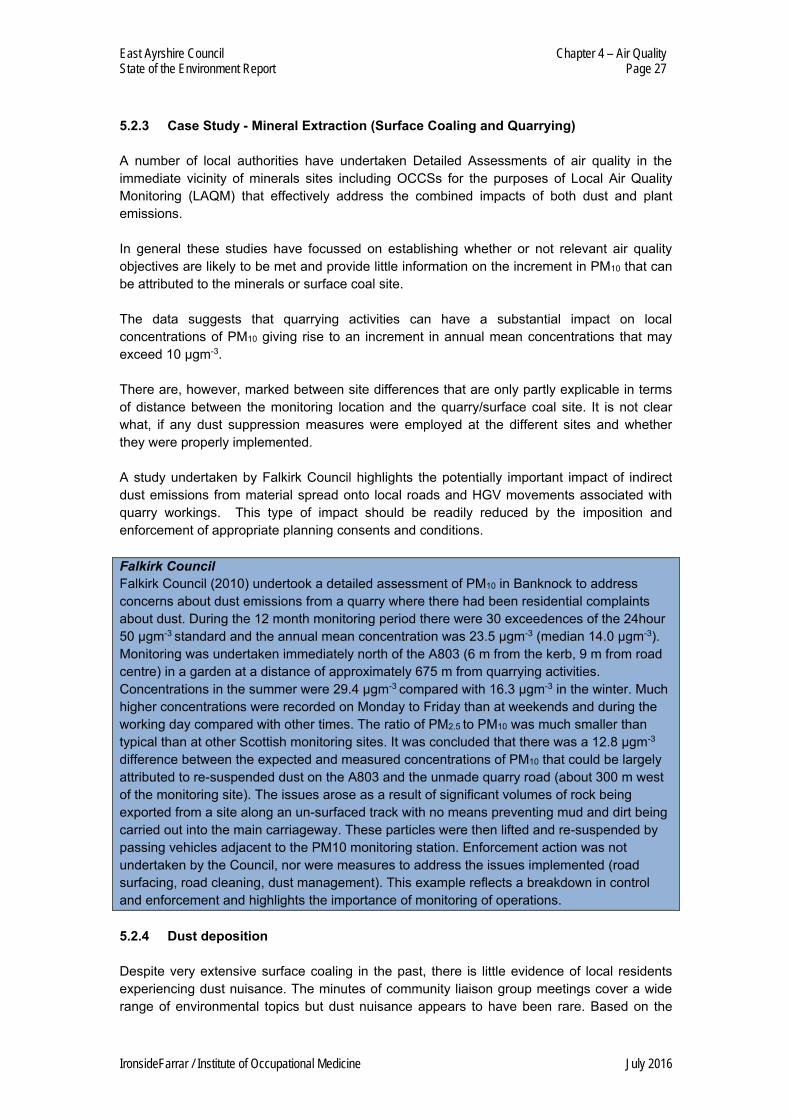
5.2.3 Case Study - Mineral Extraction (Surface Coaling and Quarrying) A number of local authorities have undertaken Detailed Assessments of air quality in the immediate vicinity of minerals sites including OCCSs for the purposes of Local Air Quality Monitoring (LAQM) that effectively address the combined impacts of both dust and plant emissions. In general these studies have focussed on establishing whether or not relevant air quality objectives are likely to be met and provide little information on the increment in PM10 that can be attributed to the minerals or surface coal site. The data suggests that quarrying activities can have a substantial impact on local concentrations of PM10 giving rise to an increment in annual mean concentrations that may exceed 10 µgm-3. There are, however, marked between site differences that are only partly explicable in terms of distance between the monitoring location and the quarry/surface coal site. It is not clear what, if any dust suppression measures were employed at the different sites and whether they were properly implemented. A study undertaken by Falkirk Council highlights the potentially important impact of indirect dust emissions from material spread onto local roads and HGV movements associated with quarry workings. This type of impact should be readily reduced by the imposition and enforcement of appropriate planning consents and conditions. Falkirk Council Falkirk Council (2010) undertook a detailed assessment of PM10 in Banknock to address concerns about dust emissions from a quarry where there had been residential complaints about dust. During the 12 month monitoring period there were 30 exceedences of the 24hour 50 µgm-3 standard and the annual mean concentration was 23.5 µgm-3 (median 14.0 µgm-3). Monitoring was undertaken immediately north of the A803 (6 m from the kerb, 9 m from road centre) in a garden at a distance of approximately 675 m from quarrying activities. Concentrations in the summer were 29.4 µgm-3 compared with 16.3 µgm-3 in the winter. Much higher concentrations were recorded on Monday to Friday than at weekends and during the working day compared with other times. The ratio of PM2.5 to PM10 was much smaller than typical than at other Scottish monitoring sites. It was concluded that there was a 12.8 µgm-3 difference between the expected and measured concentrations of PM10 that could be largely attributed to re-suspended dust on the A803 and the unmade quarry road (about 300 m west of the monitoring site). The issues arose as a result of significant volumes of rock being exported from a site along an un-surfaced track with no means preventing mud and dirt being carried out into the main carriageway. These particles were then lifted and re-suspended by passing vehicles adjacent to the PM10 monitoring station. Enforcement action was not undertaken by the Council, nor were measures to address the issues implemented (road surfacing, road cleaning, dust management). This example reflects a breakdown in control and enforcement and highlights the importance of monitoring of operations. 5.2.4 Dust deposition Despite very extensive surface coaling in the past, there is little evidence of local residents experiencing dust nuisance. The minutes of community liaison group meetings cover a wide range of environmental topics but dust nuisance appears to have been rare. Based on the
East Ayrshire Council Chapter 4 – Air Quality State of the Environment Report Page 28
IronsideFarrar / Institute of Occupational Medicine July 2016
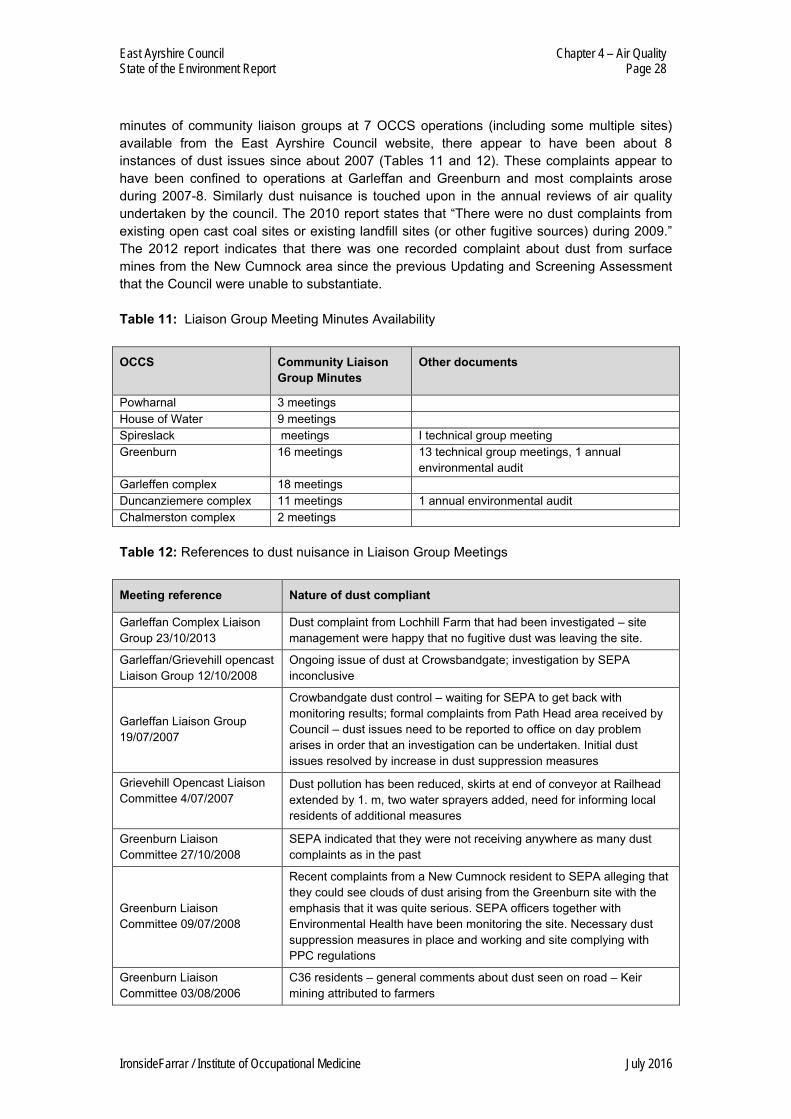
minutes of community liaison groups at 7 OCCS operations (including some multiple sites) available from the East Ayrshire Council website, there appear to have been about 8 instances of dust issues since about 2007 (Tables 11 and 12). These complaints appear to have been confined to operations at Garleffan and Greenburn and most complaints arose during 2007-8. Similarly dust nuisance is touched upon in the annual reviews of air quality undertaken by the council. The 2010 report states that “There were no dust complaints from existing open cast coal sites or existing landfill sites (or other fugitive sources) during 2009.” The 2012 report indicates that there was one recorded complaint about dust from surface mines from the New Cumnock area since the previous Updating and Screening Assessment that the Council were unable to substantiate. Table 11: Liaison Group Meeting Minutes Availability
OCCS Community Liaison Group Minutes
Other documents
Powharnal 3 meetings House of Water 9 meetings Spireslack meetings I technical group meeting Greenburn 16 meetings 13 technical group meetings, 1 annual
environmental audit Garleffen complex 18 meetings Duncanziemere complex 11 meetings 1 annual environmental audit Chalmerston complex 2 meetings Table 12: References to dust nuisance in Liaison Group Meetings
Meeting reference Nature of dust compliant
Garleffan Complex Liaison Group 23/10/2013
Dust complaint from Lochhill Farm that had been investigated – site management were happy that no fugitive dust was leaving the site.
Garleffan/Grievehill opencast Liaison Group 12/10/2008
Ongoing issue of dust at Crowsbandgate; investigation by SEPA inconclusive
Garleffan Liaison Group 19/07/2007
Crowbandgate dust control – waiting for SEPA to get back with monitoring results; formal complaints from Path Head area received by Council – dust issues need to be reported to office on day problem arises in order that an investigation can be undertaken. Initial dust issues resolved by increase in dust suppression measures
Grievehill Opencast Liaison Committee 4/07/2007
Dust pollution has been reduced, skirts at end of conveyor at Railhead extended by 1. m, two water sprayers added, need for informing local residents of additional measures
Greenburn Liaison Committee 27/10/2008
SEPA indicated that they were not receiving anywhere as many dust complaints as in the past
Greenburn Liaison Committee 09/07/2008
Recent complaints from a New Cumnock resident to SEPA alleging that they could see clouds of dust arising from the Greenburn site with the emphasis that it was quite serious. SEPA officers together with Environmental Health have been monitoring the site. Necessary dust suppression measures in place and working and site complying with PPC regulations
Greenburn Liaison Committee 03/08/2006
C36 residents – general comments about dust seen on road – Keir mining attributed to farmers
East Ayrshire Council Chapter 4 – Air Quality State of the Environment Report Page 29
IronsideFarrar / Institute of Occupational Medicine July 2016
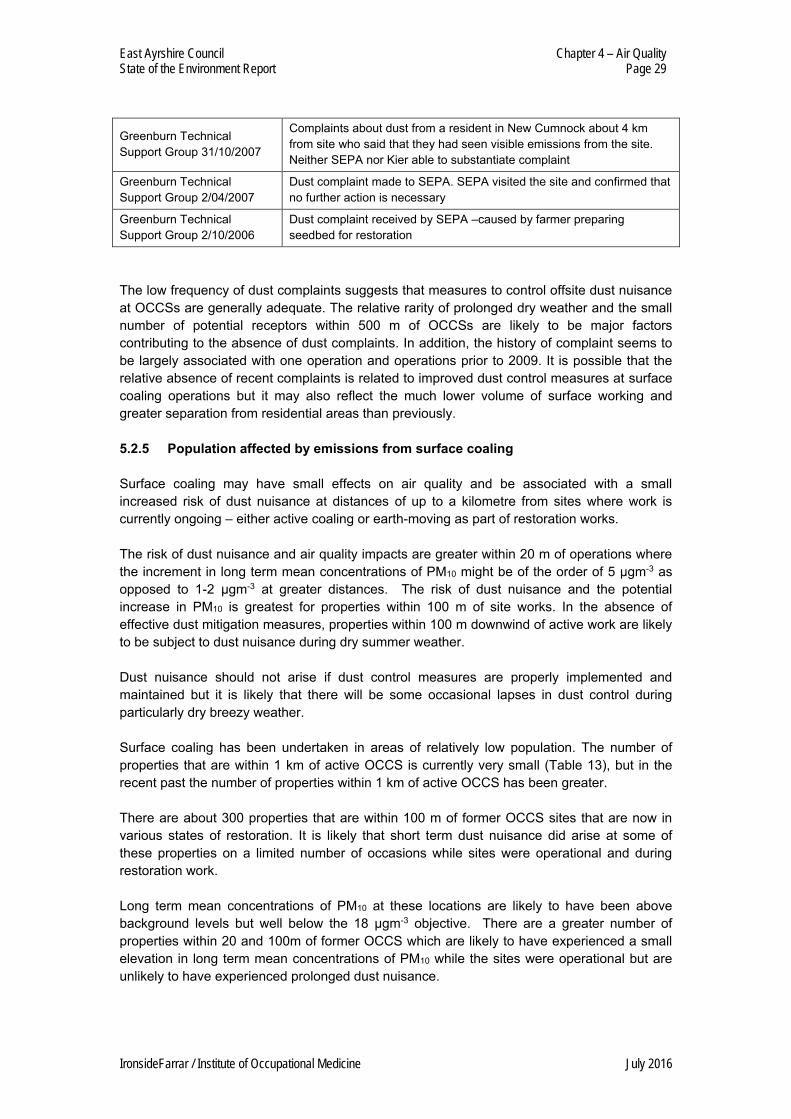
Greenburn Technical Support Group 31/10/2007
Complaints about dust from a resident in New Cumnock about 4 km from site who said that they had seen visible emissions from the site. Neither SEPA nor Kier able to substantiate complaint
Greenburn Technical Support Group 2/04/2007
Dust complaint made to SEPA. SEPA visited the site and confirmed that no further action is necessary
Greenburn Technical Support Group 2/10/2006
Dust complaint received by SEPA –caused by farmer preparing seedbed for restoration
The low frequency of dust complaints suggests that measures to control offsite dust nuisance at OCCSs are generally adequate. The relative rarity of prolonged dry weather and the small number of potential receptors within 500 m of OCCSs are likely to be major factors contributing to the absence of dust complaints. In addition, the history of complaint seems to be largely associated with one operation and operations prior to 2009. It is possible that the relative absence of recent complaints is related to improved dust control measures at surface coaling operations but it may also reflect the much lower volume of surface working and greater separation from residential areas than previously. 5.2.5 Population affected by emissions from surface coaling Surface coaling may have small effects on air quality and be associated with a small increased risk of dust nuisance at distances of up to a kilometre from sites where work is currently ongoing – either active coaling or earth-moving as part of restoration works. The risk of dust nuisance and air quality impacts are greater within 20 m of operations where the increment in long term mean concentrations of PM10 might be of the order of 5 µgm-3 as opposed to 1-2 µgm-3 at greater distances. The risk of dust nuisance and the potential increase in PM10 is greatest for properties within 100 m of site works. In the absence of effective dust mitigation measures, properties within 100 m downwind of active work are likely to be subject to dust nuisance during dry summer weather. Dust nuisance should not arise if dust control measures are properly implemented and maintained but it is likely that there will be some occasional lapses in dust control during particularly dry breezy weather. Surface coaling has been undertaken in areas of relatively low population. The number of properties that are within 1 km of active OCCS is currently very small (Table 13), but in the recent past the number of properties within 1 km of active OCCS has been greater. There are about 300 properties that are within 100 m of former OCCS sites that are now in various states of restoration. It is likely that short term dust nuisance did arise at some of these properties on a limited number of occasions while sites were operational and during restoration work. Long term mean concentrations of PM10 at these locations are likely to have been above background levels but well below the 18 µgm-3 objective. There are a greater number of properties within 20 and 100m of former OCCS which are likely to have experienced a small elevation in long term mean concentrations of PM10 while the sites were operational but are unlikely to have experienced prolonged dust nuisance.
East Ayrshire Council Chapter 4 – Air Quality State of the Environment Report Page 30
IronsideFarrar / Institute of Occupational Medicine July 2016
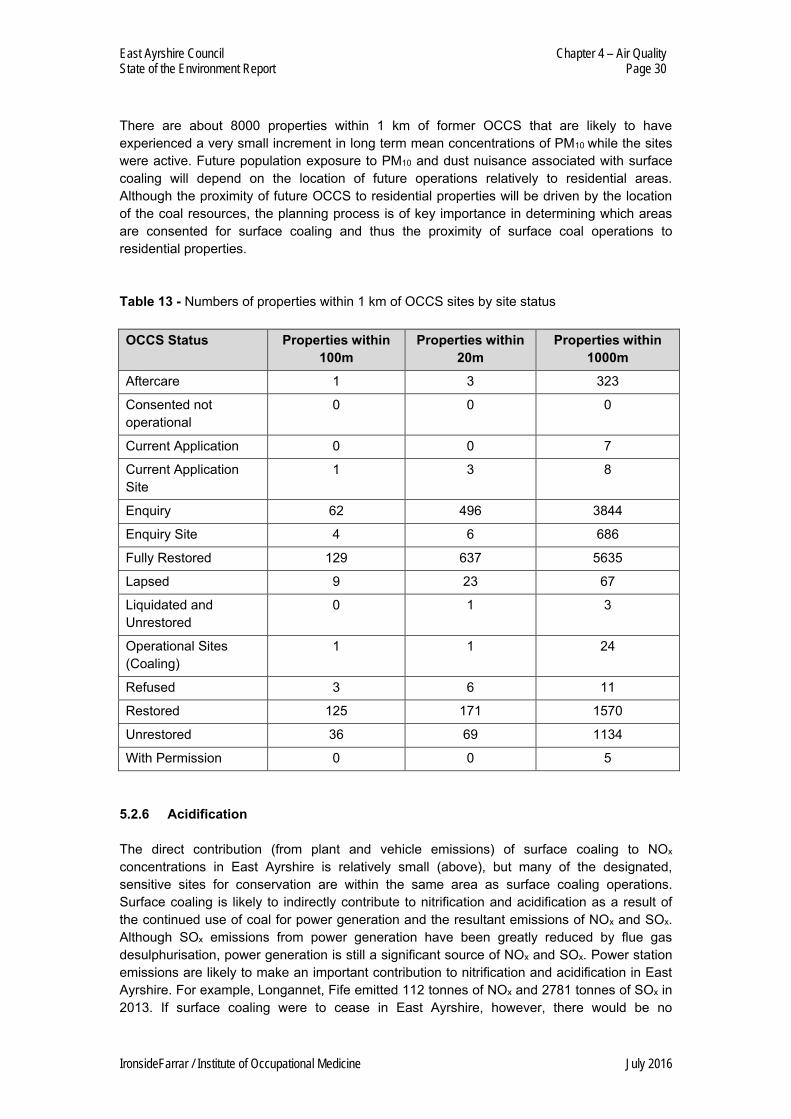
There are about 8000 properties within 1 km of former OCCS that are likely to have experienced a very small increment in long term mean concentrations of PM10 while the sites were active. Future population exposure to PM10 and dust nuisance associated with surface coaling will depend on the location of future operations relatively to residential areas. Although the proximity of future OCCS to residential properties will be driven by the location of the coal resources, the planning process is of key importance in determining which areas are consented for surface coaling and thus the proximity of surface coal operations to residential properties. Table 13 - Numbers of properties within 1 km of OCCS sites by site status OCCS Status Properties within
100m Properties within
20m Properties within
1000m Aftercare 1 3 323
Consented not operational
0 0 0
Current Application 0 0 7
Current Application Site
1 3 8
Enquiry 62 496 3844
Enquiry Site 4 6 686
Fully Restored 129 637 5635
Lapsed 9 23 67
Liquidated and Unrestored
0 1 3
Operational Sites (Coaling)
1 1 24
Refused 3 6 11
Restored 125 171 1570
Unrestored 36 69 1134
With Permission 0 0 5 5.2.6 Acidification The direct contribution (from plant and vehicle emissions) of surface coaling to NOx concentrations in East Ayrshire is relatively small (above), but many of the designated, sensitive sites for conservation are within the same area as surface coaling operations. Surface coaling is likely to indirectly contribute to nitrification and acidification as a result of the continued use of coal for power generation and the resultant emissions of NOx and SOx. Although SOx emissions from power generation have been greatly reduced by flue gas desulphurisation, power generation is still a significant source of NOx and SOx. Power station emissions are likely to make an important contribution to nitrification and acidification in East Ayrshire. For example, Longannet, Fife emitted 112 tonnes of NOx and 2781 tonnes of SOx in 2013. If surface coaling were to cease in East Ayrshire, however, there would be no
East Ayrshire Council Chapter 4 – Air Quality State of the Environment Report Page 31
IronsideFarrar / Institute of Occupational Medicine July 2016
consequent reduction in power station emissions as they would simply source coal from elsewhere. In conclusion, emissions directly associated with surface coaling in East Ayrshire are likely to make only a small direct contribution to local rates of nitrification and acidification in comparison to more distant sources. The use of surface coal derived from East Ayrshire will contribute to secondary aerosol formation across Western Europe. The cessation of coaling in East Ayrshire would only lead to a reduction of the precursor emissions leading to acid aerosol formation, if its use for power generation was replaced by the use of cleaner energy sources rather than coal from another source. Tightening emissions limits across Europe are likely to lead to lower rates of nitrification and acidification in East Ayrshire in coming years, regardless of whether surface coaling continues. 5.2.7 Conclusions – Surface Coal and Air Quality Emissions from surface coaling would be expected to adversely affect air quality in the immediate vicinity of operations. Measurable increases in annual mean concentrations of PM10 (≤ 5 µgm-3) might arise within about 20 m of the site boundary and smaller effects on PM10 (≤ 2 µgm-3) might arise at distances of ≤1000 m. There may also be a small increase in NO2 concentrations in the immediate vicinity of surface coal operations arising from plant emissions. Background levels of PM10 and NO2 in areas of East Ayrshire affected by surface coaling are extremely low and there is no evidence that air quality objectives have not been met. On rare occasions, activities at OCCSs have led to local complaints of dust nuisance but there is no evidence of a substantial ongoing problem. The small number of residents living within 1 km of currently operational OCCSs means that the impact of current surface coaling operations on population mean exposure to PM10 and NO2 is negligible. A much greater number of individuals lived within 1 km of active surface sites in the recent past, although the impact on population mean exposure to PM10 and NO2 in East Ayrshire would still have been small. Providing East Ayrshire impose suitable constraints on the siting of future surface operations in relation to residential areas and surface coal sites are properly regulated in order to ensure best practice in relation to dust management, emissions from future surface coaling operations will have a negligible impact on population mean exposure to PM10 and NO2 and dust nuisance should not arise. In recent years, the scale of quarrying operations in East Ayrshire has been much less than that of surface coaling and, unlike surface coaling, there are no quarries where emissions of PM10 or NO2 have exceeded the reporting thresholds. As with surface coaling, emissions from quarrying would be expected to adversely affect air quality in the immediate vicinity of operations. Measurable increases in annual mean concentrations of PM10 (≤ 5 µgm-3) might arise within about 20 m of the site boundary and smaller effects on PM10 (≤ 2 µgm-3) might arise at distances of ≤1000 m. There may also be a small increase in NO2 concentrations in the immediate vicinity of quarry operations arising from plant emissions. There is no evidence that air quality objectives have not been met as a result of quarrying or that any quarry site in East Ayrshire is associated with persistent complaints of dust nuisance. Providing East Ayrshire impose suitable constraints on the siting of future quarry operations in relation to residential areas and surface sites are properly regulated in order to ensure best practice in relation to dust management, emissions from future quarry operations will have a negligible impact on population mean exposure to PM10 and NO2 and dust nuisance should not arise.
East Ayrshire Council Chapter 4 – Air Quality State of the Environment Report Page 32
IronsideFarrar / Institute of Occupational Medicine July 2016
5.3 Review of Potential Air Quality Impacts of Unconventional Gas 5.3.1 Overview Both the exploration for and exploitation of unconventional gas could lead to fugitive emissions of methane, other short chain alkanes and other hydrocarbons released from gas reservoir rocks. The risk of fugitive emissions may be greatest during exploration because of the uncertainty as to when and where gas may be encountered and the quantities that may be present. Geological inhomogeneity may lead to further emissions during extraction if gas flow rates are unpredictable and/or gas finds its way to the surface by unexpected routes. The nature of emissions will depend on the chemistry of the hydrocarbon reserves that are present and exploited. In addition, the exploration for and exploitation of unconventional gas will give rise to emissions from the associated plant used in drilling holes, fluid injection and related operations, emissions from increased road and/or rail transport, emissions from flaring and fugitive emissions from gas pipelines and storage facilities. There is little published information about the impact of emissions from unconventional gas operations on air quality and little on-shore experience of unconventional gas exploration and exploitation in the UK on which to base any predictions of potential air quality impacts. The published information that is available from US studies may be of limited relevance to the prediction of the air quality impacts from the specific hydrocarbon resources present in East Ayrshire. The composition of the gas being exploited and any geological features influencing the likelihood of emission will be unique to East Ayrshire. Similarly the emissions from flaring, plant and transport will depend on the choice of infrastructure used for exploration and extraction. Published evidence from the US and other countries suggests a potentially wide variety of different sources of air pollutants from shale gas extraction and related activities. Sources can include: Direct emissions from engines powering the drilling and hydraulic fracturing operations
and compressors used to capture and transport the gas on-site. Pollutants can include particulate matter (PM), carbon monoxide (CO), and NOx, including nitrogen dioxide (NO2)
Emissions from the venting of condensate and oil tanks on site. Pollutants can include a range of volatile organic compounds (VOCs)
Emissions from gas capture and flaring. Pollutants can include methane, NOx and other gases associated with the flaring of the gas as well as PM
Fugitive emissions associated with leaks from pumps, flanges, valves, pipe connectors, etc. Pollutants can include methane and other gases
5.3.2 Emissions from unconventional gas operations and associated impacts The impacts of unconventional gas operations on local air quality will depend on a large number of factors including: volumes of gas that escape as fugitive emissions; gas composition; emissions from flaring, plant and transport; proximity of residential receptors to emissions sources; and number of wells and scale of operation. The likelihood of air quality objectives being met will also be dependent on background concentration of strategy pollutants. Concentrations of strategy pollutants are low across most of East Ayrshire and even if there was a substantial increase in pollutant levels (as a
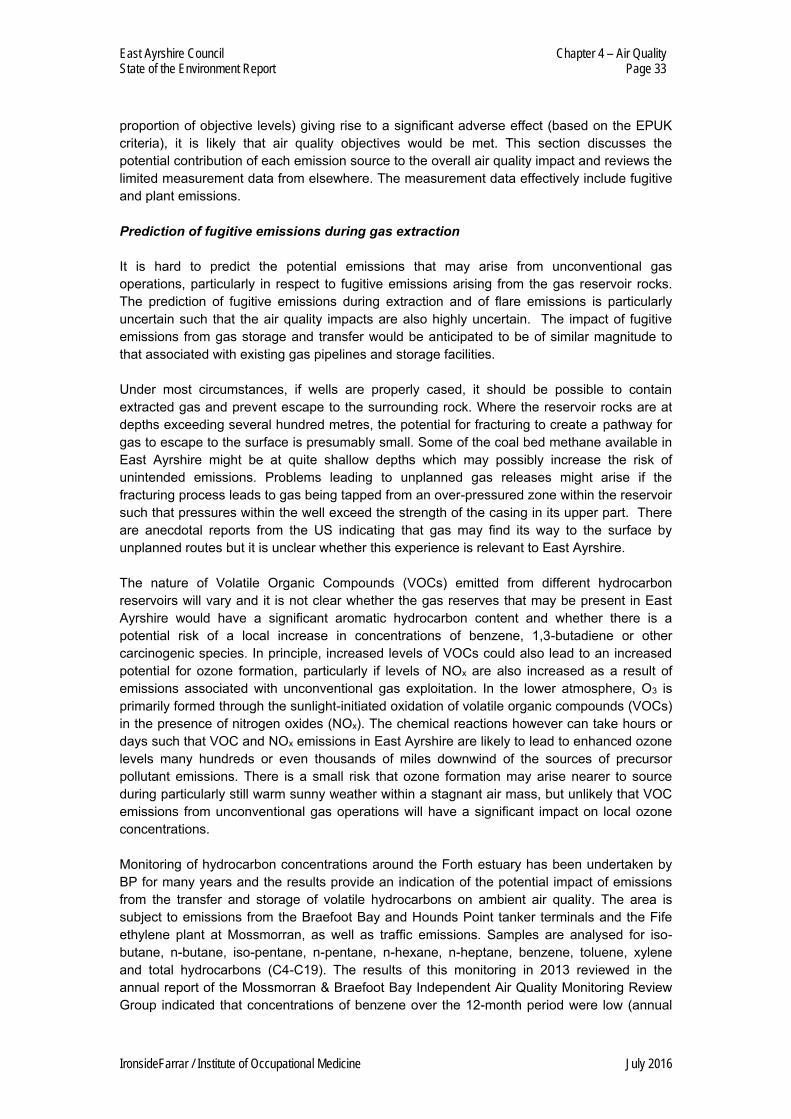
East Ayrshire Council Chapter 4 – Air Quality State of the Environment Report Page 33
IronsideFarrar / Institute of Occupational Medicine July 2016
proportion of objective levels) giving rise to a significant adverse effect (based on the EPUK criteria), it is likely that air quality objectives would be met. This section discusses the potential contribution of each emission source to the overall air quality impact and reviews the limited measurement data from elsewhere. The measurement data effectively include fugitive and plant emissions. Prediction of fugitive emissions during gas extraction It is hard to predict the potential emissions that may arise from unconventional gas operations, particularly in respect to fugitive emissions arising from the gas reservoir rocks. The prediction of fugitive emissions during extraction and of flare emissions is particularly uncertain such that the air quality impacts are also highly uncertain. The impact of fugitive emissions from gas storage and transfer would be anticipated to be of similar magnitude to that associated with existing gas pipelines and storage facilities. Under most circumstances, if wells are properly cased, it should be possible to contain extracted gas and prevent escape to the surrounding rock. Where the reservoir rocks are at depths exceeding several hundred metres, the potential for fracturing to create a pathway for gas to escape to the surface is presumably small. Some of the coal bed methane available in East Ayrshire might be at quite shallow depths which may possibly increase the risk of unintended emissions. Problems leading to unplanned gas releases might arise if the fracturing process leads to gas being tapped from an over-pressured zone within the reservoir such that pressures within the well exceed the strength of the casing in its upper part. There are anecdotal reports from the US indicating that gas may find its way to the surface by unplanned routes but it is unclear whether this experience is relevant to East Ayrshire. The nature of Volatile Organic Compounds (VOCs) emitted from different hydrocarbon reservoirs will vary and it is not clear whether the gas reserves that may be present in East Ayrshire would have a significant aromatic hydrocarbon content and whether there is a potential risk of a local increase in concentrations of benzene, 1,3-butadiene or other carcinogenic species. In principle, increased levels of VOCs could also lead to an increased potential for ozone formation, particularly if levels of NOx are also increased as a result of emissions associated with unconventional gas exploitation. In the lower atmosphere, O3 is primarily formed through the sunlight-initiated oxidation of volatile organic compounds (VOCs) in the presence of nitrogen oxides (NOx). The chemical reactions however can take hours or days such that VOC and NOx emissions in East Ayrshire are likely to lead to enhanced ozone levels many hundreds or even thousands of miles downwind of the sources of precursor pollutant emissions. There is a small risk that ozone formation may arise nearer to source during particularly still warm sunny weather within a stagnant air mass, but unlikely that VOC emissions from unconventional gas operations will have a significant impact on local ozone concentrations. Monitoring of hydrocarbon concentrations around the Forth estuary has been undertaken by BP for many years and the results provide an indication of the potential impact of emissions from the transfer and storage of volatile hydrocarbons on ambient air quality. The area is subject to emissions from the Braefoot Bay and Hounds Point tanker terminals and the Fife ethylene plant at Mossmorran, as well as traffic emissions. Samples are analysed for iso-butane, n-butane, iso-pentane, n-pentane, n-hexane, n-heptane, benzene, toluene, xylene and total hydrocarbons (C4-C19). The results of this monitoring in 2013 reviewed in the annual report of the Mossmorran & Braefoot Bay Independent Air Quality Monitoring Review Group indicated that concentrations of benzene over the 12-month period were low (annual
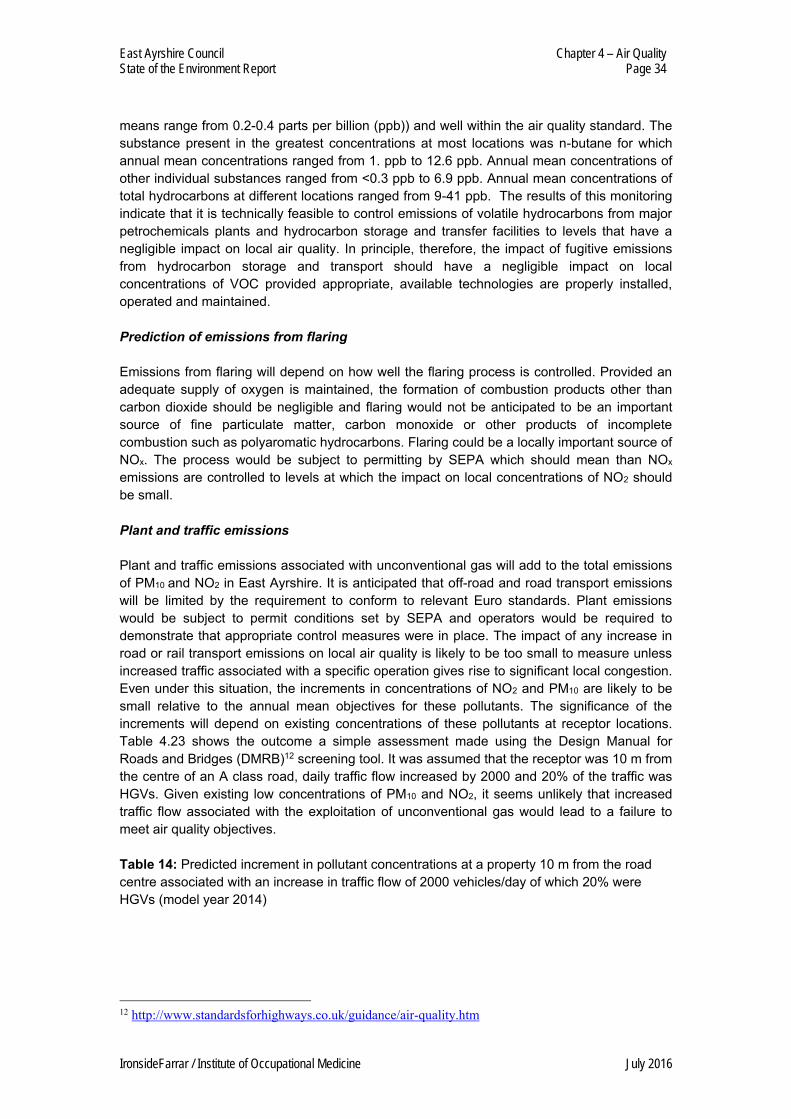
East Ayrshire Council Chapter 4 – Air Quality State of the Environment Report Page 34
IronsideFarrar / Institute of Occupational Medicine July 2016
means range from 0.2-0.4 parts per billion (ppb)) and well within the air quality standard. The substance present in the greatest concentrations at most locations was n-butane for which annual mean concentrations ranged from 1. ppb to 12.6 ppb. Annual mean concentrations of other individual substances ranged from <0.3 ppb to 6.9 ppb. Annual mean concentrations of total hydrocarbons at different locations ranged from 9-41 ppb. The results of this monitoring indicate that it is technically feasible to control emissions of volatile hydrocarbons from major petrochemicals plants and hydrocarbon storage and transfer facilities to levels that have a negligible impact on local air quality. In principle, therefore, the impact of fugitive emissions from hydrocarbon storage and transport should have a negligible impact on local concentrations of VOC provided appropriate, available technologies are properly installed, operated and maintained. Prediction of emissions from flaring Emissions from flaring will depend on how well the flaring process is controlled. Provided an adequate supply of oxygen is maintained, the formation of combustion products other than carbon dioxide should be negligible and flaring would not be anticipated to be an important source of fine particulate matter, carbon monoxide or other products of incomplete combustion such as polyaromatic hydrocarbons. Flaring could be a locally important source of NOx. The process would be subject to permitting by SEPA which should mean than NOx emissions are controlled to levels at which the impact on local concentrations of NO2 should be small. Plant and traffic emissions Plant and traffic emissions associated with unconventional gas will add to the total emissions of PM10 and NO2 in East Ayrshire. It is anticipated that off-road and road transport emissions will be limited by the requirement to conform to relevant Euro standards. Plant emissions would be subject to permit conditions set by SEPA and operators would be required to demonstrate that appropriate control measures were in place. The impact of any increase in road or rail transport emissions on local air quality is likely to be too small to measure unless increased traffic associated with a specific operation gives rise to significant local congestion. Even under this situation, the increments in concentrations of NO2 and PM10 are likely to be small relative to the annual mean objectives for these pollutants. The significance of the increments will depend on existing concentrations of these pollutants at receptor locations. Table 4.23 shows the outcome a simple assessment made using the Design Manual for Roads and Bridges (DMRB)12 screening tool. It was assumed that the receptor was 10 m from the centre of an A class road, daily traffic flow increased by 2000 and 20% of the traffic was HGVs. Given existing low concentrations of PM10 and NO2, it seems unlikely that increased traffic flow associated with the exploitation of unconventional gas would lead to a failure to meet air quality objectives. Table 14: Predicted increment in pollutant concentrations at a property 10 m from the road centre associated with an increase in traffic flow of 2000 vehicles/day of which 20% were HGVs (model year 2014)
12 http://www.standardsforhighways.co.uk/guidance/air-quality.htm
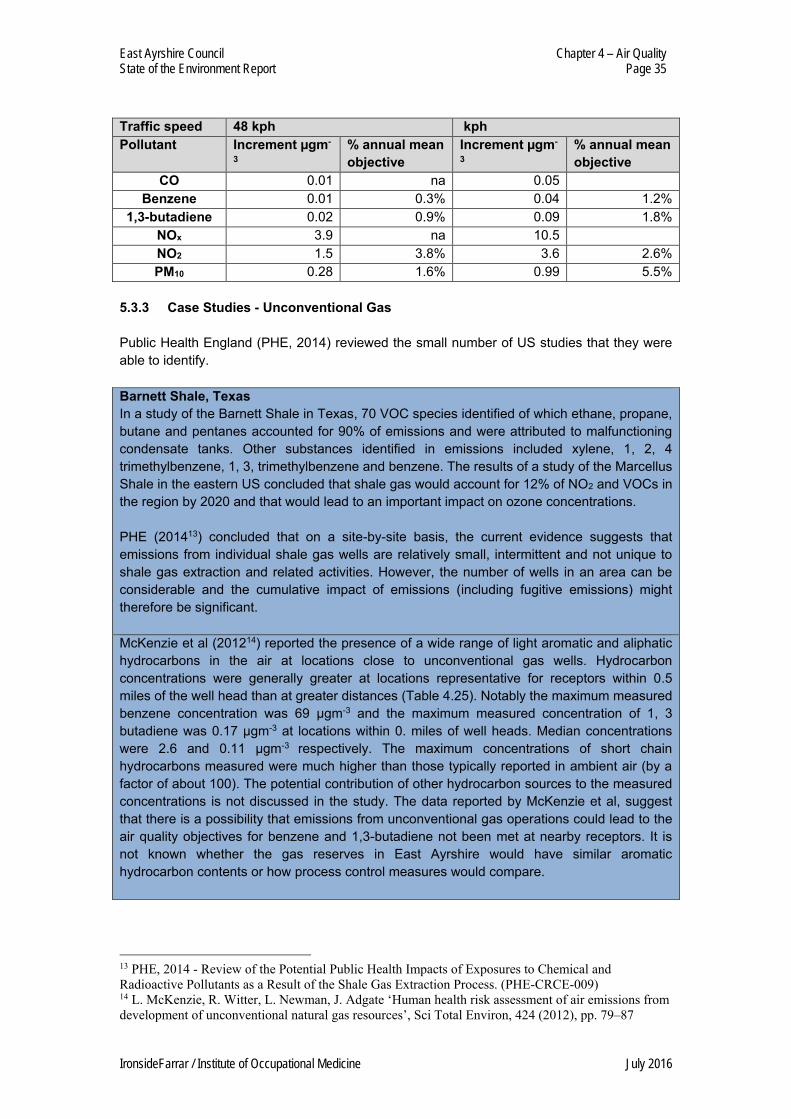
East Ayrshire Council Chapter 4 – Air Quality State of the Environment Report Page 35
IronsideFarrar / Institute of Occupational Medicine July 2016
Traffic speed 48 kph kph Pollutant Increment µgm-
3 % annual mean objective
Increment µgm-
3 % annual mean objective
CO 0.01 na 0.05 Benzene 0.01 0.3% 0.04 1.2%
1,3-butadiene 0.02 0.9% 0.09 1.8% NOx 3.9 na 10.5 NO2 1.5 3.8% 3.6 2.6% PM10 0.28 1.6% 0.99 5.5%
5.3.3 Case Studies - Unconventional Gas Public Health England (PHE, 2014) reviewed the small number of US studies that they were able to identify. Barnett Shale, Texas In a study of the Barnett Shale in Texas, 70 VOC species identified of which ethane, propane, butane and pentanes accounted for 90% of emissions and were attributed to malfunctioning condensate tanks. Other substances identified in emissions included xylene, 1, 2, 4 trimethylbenzene, 1, 3, trimethylbenzene and benzene. The results of a study of the Marcellus Shale in the eastern US concluded that shale gas would account for 12% of NO2 and VOCs in the region by 2020 and that would lead to an important impact on ozone concentrations. PHE (201413) concluded that on a site-by-site basis, the current evidence suggests that emissions from individual shale gas wells are relatively small, intermittent and not unique to shale gas extraction and related activities. However, the number of wells in an area can be considerable and the cumulative impact of emissions (including fugitive emissions) might therefore be significant. McKenzie et al (201214) reported the presence of a wide range of light aromatic and aliphatic hydrocarbons in the air at locations close to unconventional gas wells. Hydrocarbon concentrations were generally greater at locations representative for receptors within 0.5 miles of the well head than at greater distances (Table 4.25). Notably the maximum measured benzene concentration was 69 µgm-3 and the maximum measured concentration of 1, 3 butadiene was 0.17 µgm-3 at locations within 0. miles of well heads. Median concentrations were 2.6 and 0.11 µgm-3 respectively. The maximum concentrations of short chain hydrocarbons measured were much higher than those typically reported in ambient air (by a factor of about 100). The potential contribution of other hydrocarbon sources to the measured concentrations is not discussed in the study. The data reported by McKenzie et al, suggest that there is a possibility that emissions from unconventional gas operations could lead to the air quality objectives for benzene and 1,3-butadiene not been met at nearby receptors. It is not known whether the gas reserves in East Ayrshire would have similar aromatic hydrocarbon contents or how process control measures would compare.
13 PHE, 2014 - Review of the Potential Public Health Impacts of Exposures to Chemical and
Radioactive Pollutants as a Result of the Shale Gas Extraction Process. (PHE-CRCE-009) 14 L. McKenzie, R. Witter, L. Newman, J. Adgate ‘Human health risk assessment of air emissions from
development of unconventional natural gas resources’, Sci Total Environ, 424 (2012), pp. 79–87
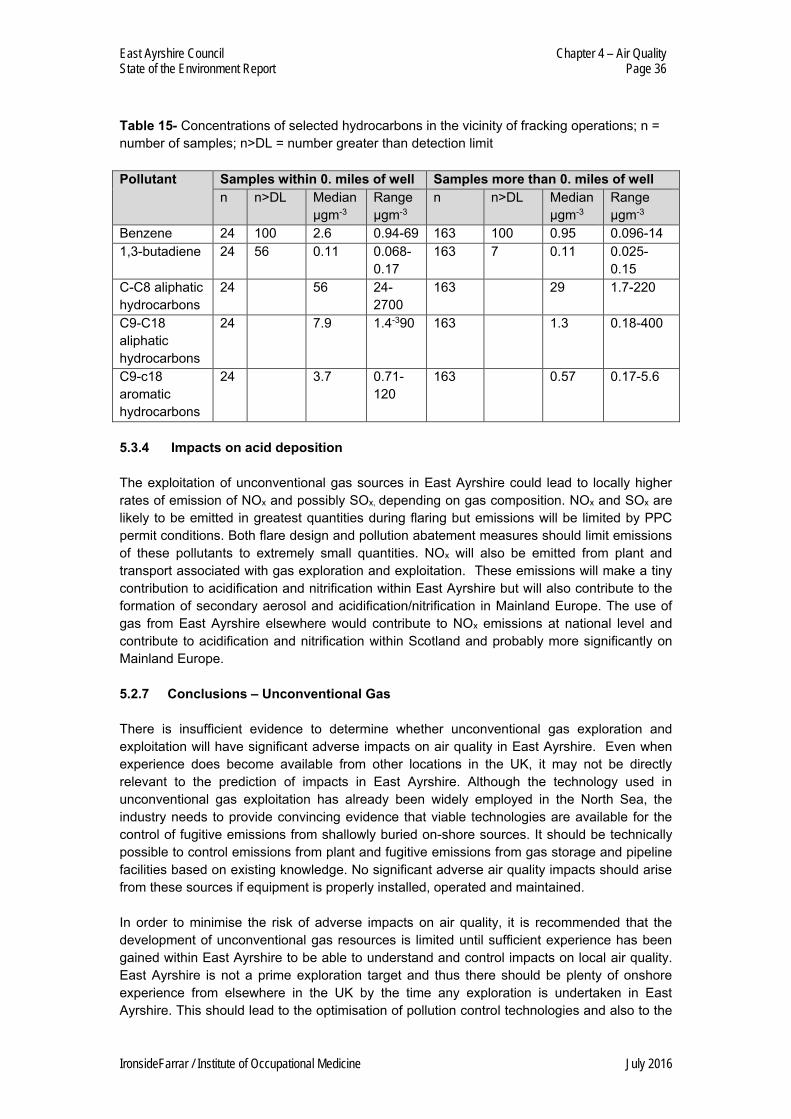
East Ayrshire Council Chapter 4 – Air Quality State of the Environment Report Page 36
IronsideFarrar / Institute of Occupational Medicine July 2016
Table 15- Concentrations of selected hydrocarbons in the vicinity of fracking operations; n = number of samples; n>DL = number greater than detection limit Pollutant Samples within 0. miles of well Samples more than 0. miles of well
n n>DL Median µgm-3
Range µgm-3
n n>DL Median µgm-3
Range µgm-3
Benzene 24 100 2.6 0.94-69 163 100 0.95 0.096-14 1,3-butadiene 24 56 0.11 0.068-
0.17 163 7 0.11 0.025-
0.15 C-C8 aliphatic hydrocarbons
24 56 24-2700
163 29 1.7-220
C9-C18 aliphatic hydrocarbons
24 7.9 1.4-390 163 1.3 0.18-400
C9-c18 aromatic hydrocarbons
24 3.7 0.71-120
163 0.57 0.17-5.6
5.3.4 Impacts on acid deposition The exploitation of unconventional gas sources in East Ayrshire could lead to locally higher rates of emission of NOx and possibly SOx, depending on gas composition. NOx and SOx are likely to be emitted in greatest quantities during flaring but emissions will be limited by PPC permit conditions. Both flare design and pollution abatement measures should limit emissions of these pollutants to extremely small quantities. NOx will also be emitted from plant and transport associated with gas exploration and exploitation. These emissions will make a tiny contribution to acidification and nitrification within East Ayrshire but will also contribute to the formation of secondary aerosol and acidification/nitrification in Mainland Europe. The use of gas from East Ayrshire elsewhere would contribute to NOx emissions at national level and contribute to acidification and nitrification within Scotland and probably more significantly on Mainland Europe. 5.2.7 Conclusions – Unconventional Gas There is insufficient evidence to determine whether unconventional gas exploration and exploitation will have significant adverse impacts on air quality in East Ayrshire. Even when experience does become available from other locations in the UK, it may not be directly relevant to the prediction of impacts in East Ayrshire. Although the technology used in unconventional gas exploitation has already been widely employed in the North Sea, the industry needs to provide convincing evidence that viable technologies are available for the control of fugitive emissions from shallowly buried on-shore sources. It should be technically possible to control emissions from plant and fugitive emissions from gas storage and pipeline facilities based on existing knowledge. No significant adverse air quality impacts should arise from these sources if equipment is properly installed, operated and maintained. In order to minimise the risk of adverse impacts on air quality, it is recommended that the development of unconventional gas resources is limited until sufficient experience has been gained within East Ayrshire to be able to understand and control impacts on local air quality. East Ayrshire is not a prime exploration target and thus there should be plenty of onshore experience from elsewhere in the UK by the time any exploration is undertaken in East Ayrshire. This should lead to the optimisation of pollution control technologies and also to the
East Ayrshire Council Chapter 4 – Air Quality State of the Environment Report Page 37
IronsideFarrar / Institute of Occupational Medicine July 2016
availability of real monitoring data that can be used to inform decision making and equipment/process design. If unconventional gas exploration and exploitation is undertaken in East Ayrshire, it is recommended that operators are required to undertake monitoring and make their findings public. In principle, it should be possible to develop appropriate local good practice based on experience from a limited number of exploration wells. In the absence of any quantitative information about air quality impacts, it is desirable that unconventional gas operations are sited well away from centres of population (at distances > 1km) and not in the immediate vicinity of any residential receptor (minimum distance 0.5 km). East Ayrshire may become a target for unconventional gas exploration in the future as energy economics change. Provided operators build on their experience from elsewhere in the UK and employ the best available technologies and methods, the associated air quality impact is likely to be smaller than if unconventional gas exploration is undertaken in the near future. Planning policies and the conditions attached to planning consents have an important role in ensuring that the future exploitation of coal, gas or other mineral resources in East Ayrshire does not lead to any significant local deterioration in air quality. 5.4 Conclusions Emissions from surface coaling or quarrying are likely to adversely affect air quality in the immediate vicinity of operations. Measurable increases in annual mean concentrations of PM10 (≤ µgm-3) might arise within about 20 m of the site boundary and smaller effects on PM10 (≤ 2 µgm-3) might arise at distances of ≤1000 m. Background levels of PM10 in areas of East Ayrshire affected by surface coaling are extremely low. There may also be a small increase in NO2 concentrations in the immediate vicinity of surface coal operations arising from plant emissions. There is no evidence that surface coaling or quarrying activities in East Ayrshire are leading to or would lead to any failure to achieve air quality objectives. On rare occasions, activities at OCCSs have led to local complaints of dust nuisance but there is no evidence of a substantial ongoing problem. Current emissions from surface operations are likely to have a negligible impact on population mean exposure to PM10 and NO2. Current levels of nitrogen and acid deposition at most designated ecologically sensitive sites in East Ayrshire exceed critical load levels. Local emissions of SOx, NOx and NH3, however, will only make a small contribution to local nitrogen and acid deposition compared with the contribution of sources elsewhere in the UK and Europe. The use of coal for power generation contributes to nitrogen and acid deposition across Scotland and further afield. Rates of nitrogen and acid deposition are likely to reduce slightly in future years as emissions from coal fired power station across Europe reduce as a result of tighter emissions control and the increased use of renewable energy sources. The air quality impacts of unconventional gas exploitation are hard to predict and will depend on both geological and operational factors. Suitable technologies exist to control emissions from flaring, plant and the transport and storage of gas such that air quality impacts should be very small. The potential for the unintended release of gas during exploration and extraction and the associated air quality impacts that might arise is highly uncertain.

East Ayrshire Council Chapter 4 – Air Quality State of the Environment Report Page 38
IronsideFarrar / Institute of Occupational Medicine July 2016
The combination of appropriate planning policies, conditions on consents, PPC permitting and effective enforcement should ensure that the air quality impact of any future minerals operations including coaling or unconventional gas will be negligible.
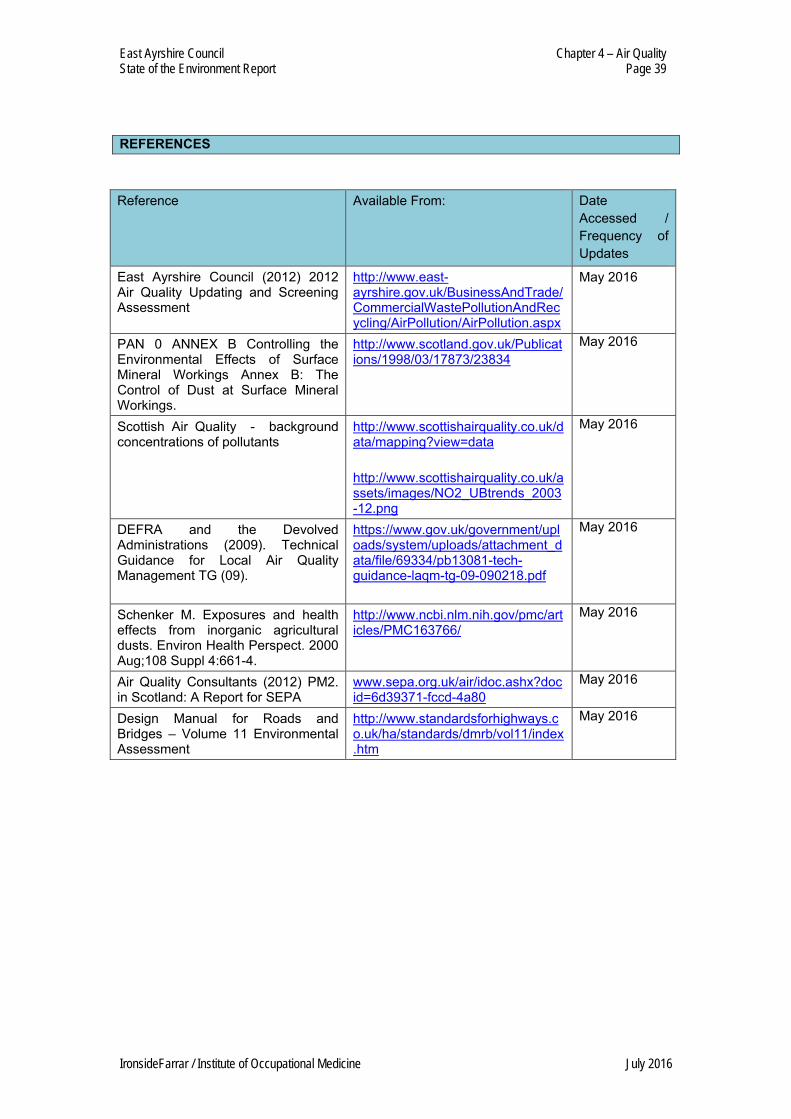
East Ayrshire Council Chapter 4 – Air Quality State of the Environment Report Page 39
IronsideFarrar / Institute of Occupational Medicine July 2016
REFERENCES Reference Available From: Date
Accessed / Frequency of Updates
East Ayrshire Council (2012) 2012 Air Quality Updating and Screening Assessment
http://www.east-ayrshire.gov.uk/BusinessAndTrade/CommercialWastePollutionAndRecycling/AirPollution/AirPollution.aspx
May 2016
PAN 0 ANNEX B Controlling the Environmental Effects of Surface Mineral Workings Annex B: The Control of Dust at Surface Mineral Workings.
http://www.scotland.gov.uk/Publications/1998/03/17873/23834
May 2016
Scottish Air Quality - background concentrations of pollutants
http://www.scottishairquality.co.uk/data/mapping?view=data http://www.scottishairquality.co.uk/assets/images/NO2_UBtrends_2003-12.png
May 2016
DEFRA and the Devolved Administrations (2009). Technical Guidance for Local Air Quality Management TG (09).
https://www.gov.uk/government/uploads/system/uploads/attachment_data/file/69334/pb13081-tech-guidance-laqm-tg-09-090218.pdf
May 2016
Schenker M. Exposures and health effects from inorganic agricultural dusts. Environ Health Perspect. 2000 Aug;108 Suppl 4:661-4.
http://www.ncbi.nlm.nih.gov/pmc/articles/PMC163766/
May 2016
Air Quality Consultants (2012) PM2. in Scotland: A Report for SEPA
www.sepa.org.uk/air/idoc.ashx?docid=6d39371-fccd-4a80
May 2016
Design Manual for Roads and Bridges – Volume 11 Environmental Assessment
http://www.standardsforhighways.co.uk/ha/standards/dmrb/vol11/index.htm
May 2016
East Ayrshire Council Chapter 4 – Air Quality State of the Environment Report Page 40
IronsideFarrar / Institute of Occupational Medicine July 2016
GLOSSARY OF KEY TERMS AQMA – Under section 83(1) of the Environment Act 1995, Local Authorities have a duty to designate any relevant areas where the air quality objectives are not (or are unlikely to be) being met as Air Quality Management Areas (AQMAs) Local Air Quality Management (LAQM) – Monitoring and reporting of air quality by Scottish local authorities as prescribed under Part IV of the Environment Act 1995 NO2 – Nitrogen dioxide is a brown gas. The concentration of NO2 is measured in micrograms in each cubic metre of air (μg m-3). A microgram (μg) is one millionth of a gram. A concentration of 1 μg m-3 means that one cubic metre of air contains one microgram of pollutant (https://uk-air.defra.gov.uk/assets/documents/reports/aqeg/nd-summary.pdf) NO – Nitrogen Oxide is a nitric oxide (nitrogen monoxide), a colourless gas. NOX - Together, NO and NO2 are known as NOX or Nitrogen Oxides. NOX is released into the atmosphere when fuels are burned OCCS – Opencast Coal Site PM10 – Particulate matter less than 10 µm in size that can penetrate to the lungs PM2.5 - Particulate matter which are a sub-fraction of PM10 which are less than 25 µm in size PAH - Polycyclic aromatic hydrocarbons Sulphur Dioxide (SO2) – pollutant which together with particulate matter forms smog. Formed through fuel combustion. Coal has a high sulphur content, relative to other fuels. µm - A micron is a unit of length equivalent to a millionth of a meter µmgm-3 – micrograms per cubic metre Unconventional gas - The term unconventional gas refers to natural gas held in rocks that cannot be exploited using traditional methods. Shale and coal are source rocks for unconventional gas.