Embed Size (px)
Citation preview
STATE-OF-THE-ART REPORT ON SYSTEMS ANALYSIS METHODS FOR RESOLUTION OF CONFLICTS IN WATER RESOURCES MANAGEMENT
A Report Prepared for Division of Water Sciences UNESCO
Edited by
K. D. W. Nandalal
University of Peradeniya, Peradeniya, Sri Lanka
Slobodan P. Simonovic
University of Western Ontario, London, Ontario, Canada
SC-2003/WS/60

Contributors
Dr M. Bender with Prof. S. P. Simonovic, authors of Sections 3.5.5, 3.5.6, 4.1 and 5.6 Prof. V. Dukhovny Prof. K. W. Hipel with Prof. D. M. Kilgour, Prof. F. Liping and Mr. K. W. Li, authors of Section 4.3 Dr T. Le-Huu Prof. D. P. Loucks Prof. S. P. Simonovic, author of Sections 6.2, 6.3 and 6.4 Dr S. N. Sreenath, with Dr A. M. Vali and Dr G. Susiarjo, authors of Section 4.4.5

The designations employed and the presentation of material throughout this publication do not imply the expression of any opinion whatsoever on the part of UNESCO concerning the legal status of any country, territory, city or area or of its authorities, or concerning the delimitation of its frontiers or boundaries.
The authors are responsible for the choice and the presentation of the facts contained in this book and for the opinions expressed therein, which are not necessarily those of UNESCO and do not commit the Organization.

ACKNOWLEDGEMENTS
This report is a contribution from UNESCO’s International Hydrological Programme to the World Water Assessment Programme. It was prepared within the framework of the joint UNESCO–Green Cross International project entitled “From Potential Conflict to Cooperation Potential (PCCP): Water for Peace,” and was made possible by the generous financial assistance of the Japanese government. In addition to the contributors we would like to acknowledge the assistance of IJC (Dr M. Clamen). Help of research associates and graduate students of the Facility for Intelligent Decision Support at the University of Western Ontario during the visit of the first author is also recognized.
CONTENTS
Summary 1 1. Introduction 2 1.1. General 2 1.2. Nature of Conflicts Over Water 3 1.3. Causes of Water Conflicts 3 1.4. Conflict Resolution/Corporation Potential 4 2. Definition and Purpose of Systems Analysis 6 2.1. Systems Approach: General Comments 6 2.2. Systems Analysis: Definitions 7 2.3. Systems Analysis Tools 10 2.3.1. Simulation 10 2.3.2. Optimization 11 2.3.3. Multi-objective Analysis 12 2.4. A Systemic Approach to Conflict Resolution 15 3. Types of Water Resources Management Conflicts and Models 17 3.1. General 17 3.2. Disciplines and Worldviews 18 3.3. Nature of Conflicts Over Water 19 3.4. Conflict Resolution 20 3.5. Types of Problems vs. Types of Models 21 3.5.1. Conflict Negotiation 21 3.5.2. The Role of Computer-Based Support in Conflict Resolution 22 3.5.2.1. Decision Support Systems 22 3.5.3. Negotiation Support Systems (NSS) 23 3.5.4. Negotiation Process Systems (NPS)/Negotiation Process
Support Systems 25 3.5.5. Collaborative Planning Approach 26 3.5.6. Consensus Approach 29 3.5.7. Scenario Analysis 30 3.6. Scales Issue in Conflicts 32 3.6.1. Global Scale of Water Conflicts 32 3.6.1.1. Lack of Accessible Water 33 3.6.1.2. Increasing Environmental Concerns 33 3.6.1.3. Economic Value of Water 33 3.6.2. Regional Scale of Water Conflicts 33 3.6.3. Upstream and Downstream Relationship 34 3.6.4. Conflicts Between Purposes and Users 34 3.6.5. Conflicts in Time 34 3.7. Integrated Water Management: Multisectoral 35 3.7.1. Water Conflicts in the Integrated Water Resources
Management Process 36 3.7.1.1. Social Conflicts of Water Use: Equitability and Ecosystem
Efficiency 36 3.7.1.2. Economic Conflicts in Water Use: Market Efficiency 36 3.7.1.3. Legal Conflicts: Rules in Water Utilization and Principles
for Water Allocation 37 3.8. Stakeholder Participation: Shared Vision Approaches 37 3.8.1. International Joint Commission in Water Resource Conflict
Resolution 39 3.8.1.1. The Canada–United States Boundary Region 39 3.8.1.2. The IJC and the 1909 Boundary Waters Treaty 39 3.8.1.3. Case Study: Great Lakes–St Lawrence River 40
3.8.1.4. International Watershed Boards 41 3.8.1.5. Conflict Resolution 42 3.8.1.6. Summary 43 4. Case Studies Illustrating Applicability, Success, and
Limitations of Systems Analysis 44 4.1. Collaborative Approach in Conflict Resolution: Manitoba
Hydropower Example (Manitoba, Canada) 44 4.1.1. Introduction 44 4.1.2. Case Study: Manitoba 45 4.1.3. Development Proponent 46 4.1.4. Identification of Stakeholders 47 4.1.5. Project Licensing 48 4.1.6. Integration of GIS Tools 48 4.1.7. GIS Database 49 4.1.8. Flood Inundation Visualization 49 4.1.9. Development of Alternatives 50 4.1.10. Application of Expert Systems 51 4.1.10.1. Expert Systems 51 4.1.10.2. Prototype Expert System for Choosing the Design of a
Hydroelectric Generating Station 52 4.1.10.3. Knowledge Base 52 4.1.11. Summary 54 4.2. International Water Conflicts: Danube River Application 54 4.2.1. Identification of Goals for the Section of the Danube
Studied in this Work 55 4.2.1.1. Hydropower 56 4.2.1.2. Navigation 56 4.2.1.3. Drinking Water Supply 56 4.2.1.4. Environmental Preservation 56 4.2.1.5. Social Objective 56 4.2.2. Definition of Criteria 57 4.2.3. Multicriteria Approach for Group Decision Making 59 4.2.4. Conflict Resolution Among the Countries 60 4.2.5. Referee's Viewpoint 61 4.3. Resolution of Water Conflicts between Canada and the
United States 62 4.3.1. Introduction 62 4.3.2. The Graph Model for Conflict Resolution and GMCR II 62 4.3.3. Case Study: Flathead River Conflict 64 4.3.4. Modeling: Putting the Problem into Perspective 64 4.3.4.1. Decision Makers and Options 65 4.3.4.2. Feasible States 66 4.3.4.3. Allowable State Transitions 67 4.3.4.4. Relative Preference Ranking 67 4.3.5. Analysis and Results: Deciding What to Do 68 4.3.6. Conclusions 70 4.4. Aral Sea Basin: Conflicts 75 4.4.1. Aral Sea Basin 75 4.4.1.1. Hydrological Characteristics 75 4.4.1.2. Water Resources 76 4.4.1.3. Land Use 77 4.4.1.4. Ecosystem Dynamics 77 4.4.1.5. Social and Economic Characteristics 78 4.4.1.6. Ethnicity, Languages, Religion 78
4.4.2. Water-related Conflicts 78 4.4.2.1. Social Conflicts 78 4.4.2.2. Economic Conflicts 79 4.4.2.3. Legal Conflicts 80 4.4.3 Conflict Resolution 81 4.4.3.1. Water Conflicts in Perspective 81 4.4.3.2. Institutional Aspects 81 4.4.3.3. Legal Basis 82 4.4.3.4. Financing 84 4.4.3.5. Technical Issues 84 4.4.4. Future Work 85 4.4.4.1. Proposal for Integrated Water Resources Management 85 4.4.5. Scenario Analysis in Future Development of the
Aral Sea Basin Countries 86 4.4.5.1. Signs and Symptoms 86 4.4.5.2. Formulation of Vision and Scenario Analysis 88 4.4.5.3. Implementation 89 4.5.4.4. Scenario Analysis 92 4.5.4.5. Conclusions 94 5. Treatment of Uncertainty in Negotiation and Agreements 96 5.1. Modeling Uncertainty 96 5.2. Fuzzy Decision Making 97 5.3. Displaced Ideals 97 5.4. Existing Applications Using Fuzzy Ideals 98 5.5. Fuzzy Arithmetic Operations 99 5.6. Fuzzy Compromise Approach 100 5.6.1. Fuzzy Distance Metrics 100 5.6.2. Selecting Acceptable Alternatives 101 5.6.3. Weighted Center of Gravity Measure 102 5.6.4. Fuzzy Acceptability Measure 102 5.6.5. Comparison of Ranking Methods 103 5.7. Application of the Fuzzy Compromise Programming 104 5.7.1. Collaborative Decision Making 107 6. Future Outlook 108 6.1. General 108 6.2. Tools for Future Water Management 108 6.2.1. Complexity Paradigm 108 6.2.2. Uncertainty Paradigm 111 6.3. Future Tools for Water Management 112 6.3.1. Object-Oriented Simulation 112 6.3.2. Evolutionary Optimization Using Powerful Computers 112 6.3.3. Integration of Fuzzy Analysis with Simulation and
Optimization Tools 113 6.3.4. Integration of Spatial Analysis with Simulation and
Optimization 113 6.4. Use of Virtual Databases 114 6.4.1. Evaluation of User Data Needs 115 6.4.2. Virtual Database Architecture 115 6.5. Decision Support Systems 116 6.6. Web Interaction 116 Bibliography 118
STATE-OF-THE-ART REPORT ON SYSTEMS ANALYSIS METHODS FOR RESOLUTION OF CONFLICTS IN WATER RESOURCES MANAGEMENT
Water is an important factor in conflicts among stakeholders at the local, regional, and even international level. Water conflicts have taken many forms, but they almost always arise from the fact that the freshwater resources of the world are not partitioned to match the political borders, nor are they evenly distributed in space and time. The watersheds of 261 major rivers are shared by two or more countries and nearly half of the land area of the world is in international river basins. Water has been used as a military and political goal. Water has been a weapon of war. Water systems have been targets during war. The role of a systems approach is investigated in this report as a method for the resolution of conflicts over water. A review of the systems approach provides some basic knowledge of tools and techniques as they apply to water management and conflict resolution. This report provides a classification and description of water conflicts by addressing issues of scale, integrated water management, and the role of stakeholders. Four large-scale examples are selected to illustrate the application of systems approach to such conflicts:
1. Hydropower development in Canada. 2. Multipurpose use of the Danube River in Europe. 3. International water conflict between the United States and Canada. 4. The Aral Sea in Asia.
The water conflict resolution process involves various sources of uncertainty. Section 5 of the report provides some examples of systems tools that can be used to address objective and subjective uncertainties with special emphasis on the utility of the fuzzy set theory. Systems analysis is driven by the development of computer technology. The final section provides one view of the future and systems tools that will be used for water resources management. The role of virtual databases and computer and communication networks is investigated in the context of water conflicts and their resolution.
1
1. INTRODUCTION
1.1. General
Water is vital for the sustenance of life. Agriculture requires vast amounts of it and many industries require substantial amounts as well. Besides these direct or consumptive demands, the indirect or non-consumptive uses of water are also important. For example, water is crucial for energy production whether it is hydro, nuclear, or thermal. Water continues to be an important means of transportation. Water is used for recreation, for cleaning, for maintaining ecological habitats, and numerous other economic, environmental, and social uses. There is no substitute for this essential resource. Without water, life on earth would not be possible. Water is the most abundant substance on the Earth. Moreover, it is a renewable natural resource, cleansing and redistributing itself through natural cycles. However, its global quantity is finite. Freshwater is only a fraction of this resource. While water covers some 70 percent of the planet’s surface, less than 3 percent of this consists of freshwater. Much of the world’s freshwater resources are frozen in polar ice caps or deep underground and less than 0.3 percent of global water resources consist of accessible freshwater. When population densities were low, there was plenty of water for all. However, with the rapid population and economic growth experienced since the early 1980s many regions of the world are facing serious water problems and related stress is likely to grow considerably in the foreseeable future. Freshwater is a very unevenly distributed natural resource both temporally and spatially. Frequent and regular rainfall in some regions contrasts sharply with prolonged drought in others. Some regions are blessed with an abundance of freshwater while others face scarcity. Growing conflicts over increasingly scarce freshwater resources loom ahead. The distribution and use of this limited or scarce water resource can create conflicts within a country. For example, conflicts can exist between different regions of a country, with regions that are more arid or have already exhausted their own supplies wishing to obtain water from more amply endowed areas. Laws existing in that country may resolve these conflicts. However, much of the world’s freshwater supplies are located within basins and aquifers that cross international borders. There are some 260 international river basins, covering a little less than a half of the land surface of the globe and affecting about 40 percent of the world’s population (Wolf, 1998). Since water is vital for basic survival, industry, energy production, and other fundamental components of a nation, sharing these transboundary waters between and among border nations can result in a myriad of conflicts. The type and severity of conflict between the various states involved may vary depending on the region. In non-arid regions of the world conflicts or disputes are often based on environmental concerns resulting from development activities such as dam construction or transboundary pollution. On the other hand, in arid and semi-arid regions disputes and conflicts, although also possibly involving similar issues relating to development activities, usually center on the problem of water scarcity. The 280 or more treaties that have been signed between countries on water issues (Wolf, 2002) give evidence of the tensions that divided or shared basins engender. In spite of past negotiating efforts, conflicts linked to freshwater still exist at various international levels, and the risk for more grows as population and degradation pressures accelerate.
2
1.2. Nature of Conflicts Over Water
Conflict is a natural disagreement resulting from individuals or groups differing in attitudes, beliefs, values, or needs. Conflicts in water management often involve interactions between various factors, water subsectors, and stakeholders in the water resources management process. Contemporary water resources management is a combined process of sharing water and resolving conflicts among stakeholders. A stakeholder in this context refers to an individual, organization, or institution that has a stake in the outcome of decision related to water sharing, beings either directly affected by the decision or having the power to influence or block the decision. Water resources management involves numerous uncertainties associated with the physical processes, available data, and level of our knowledge. Its availability in a particular locality and point of time usually cannot be accurately predicted in advance. Therefore, uncertainties as well as scarcity are typically the reasons why conflicting scenarios arise among stakeholders, in sharing water and protecting their interests. When a river basin traverses across multiple legal, political, and international boundaries, the number of potential stakeholders and their specific interests increases, making the conflict resolution process increasingly complicated (Wolf, 1998).
1.3. Causes of Water Conflicts
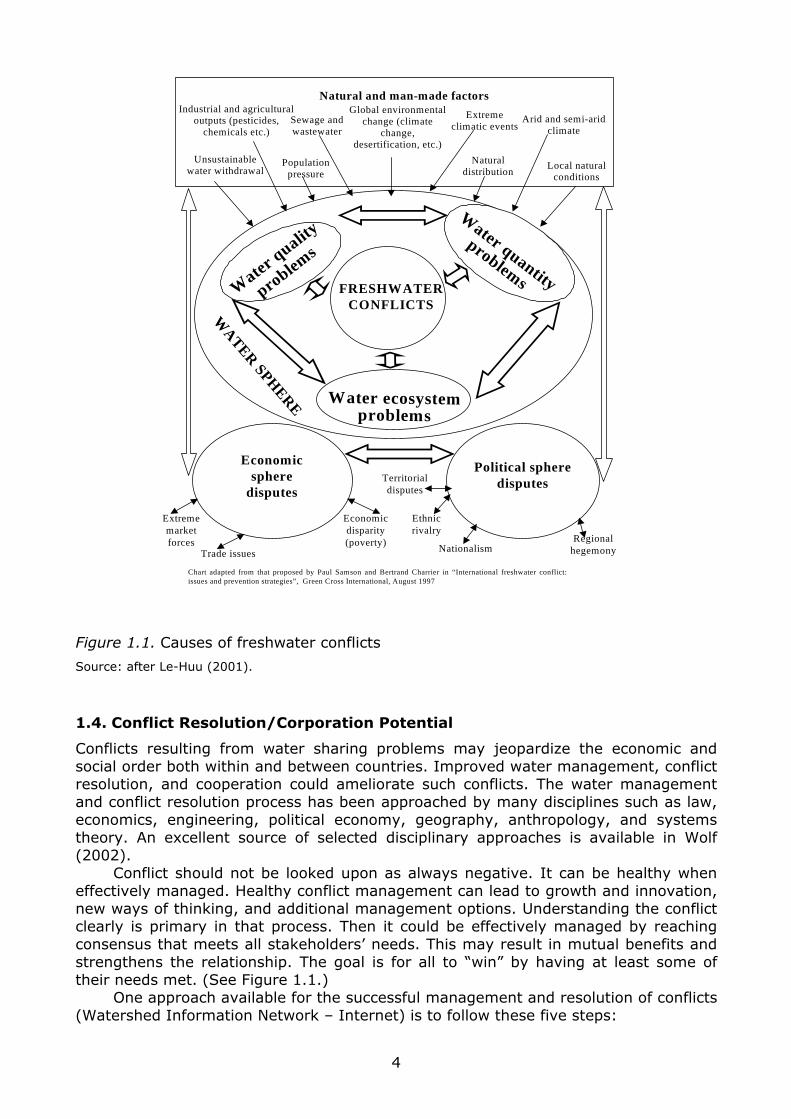
Conflicts over water could be looked upon as consisting of three key spheres: water, economic, and political (Le-Huu, 2001). Conflicts over water are often affected by problems in the economic and political spheres as much as those generated within the water sphere itself. Similarly, problems in the water sphere may lead to conflicts or disputes in the other two spheres. Problems in the water sphere are mainly caused by various human and natural factors. These problems can normally be grouped into three major kinds in the water sphere: water quality, quantity, and ecosystem problems. Increasing populations impose increasing demands for water supplies, often leading to unsustainable withdrawals. Activities of humans, industry, and agriculture generate wastes that are usually discharged into water bodies. Finally the environment and supporting ecosystems require water, and meeting those requirements often conflicts with meeting other demands. Natural factors include erratic natural distribution, extreme climatic events (such as floods, droughts and cyclones), arid and semi-arid climate, and local natural conditions. While human intervention may minimize the impact of these natural factors, lack of consideration and ignorance of the important roles of ecosystem functions, together with lack of consultation with stakeholders, may aggravate water conflicts. Global environmental change is also identified as a potential driver for water conflict. While there is insufficient evidence to support attributing recent trends of climate change and extreme events in water-related natural disasters (such as the more severe impacts of El Niño, the more frequent occurrence of extreme floods which affect many regions of the world) to global environmental change, these trends towards climate change and extreme events are on a global scale and need to be properly handled so as to prevent them from escalating into water conflicts. Economic and political factors are treated as separate driving forces. Although these factors have a strong interaction with the key factors affecting the water sphere directly, they may originate independently from the water sphere. Often, the problems in the economic and political spheres are caused by the lack of detailed information on good management of water resources or by differences in the perception of a fair and equitable share of the water resources. Possible drivers for disputes in the economic and political spheres are identified in Figure 1.1.
3
Industrial and agriculturaloutputs (pesticides,
chemicals etc.)
Natural and man-made factors
Unsustainablewater withdrawal
Populationpressure
Sewage andwastewater
Global environmentalchange (climate
change,desertification, etc.)
Extremeclimatic events
Local naturalconditions
Naturaldistribution
Arid and semi-aridclimate
FRESHWATERCONFLICTS
Economicsphere
disputes
Political spheredisputesTerritorial
disputes
Economicdisparity(poverty)
Extrememarketforces
Trade issues
Ethnicrivalry
RegionalhegemonyNationalism
Chart adapted from that proposed by Paul Samson and Bertrand Charrier in “International freshwater conflict:issues and prevention strategies”, Green Cross International, August 1997
WATER SPH
ERE
Water
quality
problem
s
Water quantity
problems
Water ecosystemproblems
Figure 1.1. Causes of freshwater conflicts
Source: after Le-Huu (2001).
1.4. Conflict Resolution/Corporation Potential
Conflicts resulting from water sharing problems may jeopardize the economic and social order both within and between countries. Improved water management, conflict resolution, and cooperation could ameliorate such conflicts. The water management and conflict resolution process has been approached by many disciplines such as law, economics, engineering, political economy, geography, anthropology, and systems theory. An excellent source of selected disciplinary approaches is available in Wolf (2002). Conflict should not be looked upon as always negative. It can be healthy when effectively managed. Healthy conflict management can lead to growth and innovation, new ways of thinking, and additional management options. Understanding the conflict clearly is primary in that process. Then it could be effectively managed by reaching consensus that meets all stakeholders’ needs. This may result in mutual benefits and strengthens the relationship. The goal is for all to “win” by having at least some of their needs met. (See Figure 1.1.) One approach available for the successful management and resolution of conflicts (Watershed Information Network – Internet) is to follow these five steps:
4
1. Analysis of the conflict. 2. Determination of the management strategy. 3. Pre-negotiation. 4. Negotiation. 5. Post-negotiation.
The first step, that is, the analysis of the nature and type of the conflict provides the stakeholders and mediator (if any involved) with all the necessary details to proceed with the conflict resolution processes. Once a general understanding of the conflict is gained through that step, the group involved needs to analyze and select the most appropriate strategy. The available conflict management strategies include collaboration, compromise, competition, accommodation, and avoidance. In collaboration, compromise, and competition a stakeholder has a high concern for his/her own group while concern over the other party declines from high to medium and finally to low concern. In accommodation, the stakeholder has low concern for his/her own interest and gives a high status to the interests of other partners. Avoidance results from a low concern for his/her own interest coupled with a low concern for the interests of others. The third step, pre-negotiation, sets the stage for effective negotiation or does the groundwork required. The following are carried out at step three: initiation of the negotiation process, assessment of the resources and issues to be negotiated, agreement on rules for communication, negotiation, and decision making, and collection of the required technical and social information. At the negotiation stage, options that are of interest to stakeholders to resolve conflicts are developed and evaluated. Use of objective criteria for ranking ideas, making trade-offs among different issues, and combining different options to form acceptable agreements are encountered in the process of evaluation. Once the negotiation is complete, the group will need to implement the decisions made. At this post-negotiation stage, the partners in the conflict must get support from the organizations that have a role to play. Communication and collaboration should continue as the agreement is carried out. The partners will need to have a plan to monitor progress, document success, resolve problems, renegotiate terms, and celebrate success. Not all water resources disputes end up in violent conflict. Most of the time negotiations and discussions lead to non-violent resolutions. However, every water resource dispute is unique and requires an individualized approach. The successful resolution of national as well as international water conflicts requires understanding of the nature of the conflict and then modeling and analyzing the inherent problems in it as discussed above. To reach a final agreement concerning how much of the shared water resource is allocated to each party or nation, the assistance of procedures or methodologies acceptable to all the parties concerned is very much needed. Systematic study of the nature and conduct of conflict and cooperation between the parties involved based on new technologies and practices could assist the efficient management of water resources, and thereby reduce tension among parties in dispute over water. As explained in an overview paper by Hipel (2001) and in articles contained within theme 1.40 on “Conflict Resolution” in the 2002 Encyclopedia of Life Support Systems (EOLSS), a wide range of psychological, sociological, operational research, game theory, systems engineering, and other kinds of models have been developed for systematically studying conflict and its resolution. Articles on conflict resolution published under theme 1.40 include a number of systems engineering approaches to conflict resolution, such as the “Graph Model for Conflict Resolution” (Fang et al., 1993; Hipel et al., 1997b) and “Drama Theory” (Howard, 1999) with application to water resources and environmental conflicts.
5
2. DEFINITION AND PURPOSE OF SYSTEMS ANALYSIS
2.1. Systems Approach: General Comments
The art and science of systems analysis has evolved through developments in the separate disciplines of engineering, economics, and mathematics. Rapid developments have taken place in this science and the availability of high-speed efficient and economical computers has contributed to its development. As the science of systems analysis had advanced over the last several decades and as the scale of modern water resource projects has grown, systems analysis has found extensive applications in water resources planning. The origin of the activity may be said to be in the 1950s in the United States, and the pioneering work was done by a group of engineers, economists, and political scientists at Harvard University as reported in Maass et al. (1962). Since then, the importance of systems planning has been increasingly recognized and continuous advances are being made (Fiering et al., 1971; Buras, 1972; Loucks et al., 1981). A physical water resources system is a collection of various elements that interact in a logical manner and are designed in response to various social needs in the development and improvement of existing water resources for the benefit of human use. Haimes et al. (1987) saw water resources systems analysis as an approach by which the components of such a system and their interactions are described by means of mathematical or logical functions. In general, systems analysis is the study of all the interactions of the components. Very often systems analysis is concerned with finding that combination of components that generates an optimum: in other words, a system, which consists of the best possible combination of elements for satisfying the desired objective. Therefore, it involves defining and evaluating numerous water resources development and management alternatives. This could be done in a very detailed manner representing various possible compromises among conflicting groups, values, and management objectives. Systems analysis may be used to find a “best acceptable” solution. But this is not its only purpose. Often it is applied for “structuring” a water resources project. By “structuring” it is meant that the systems elements are drawn into a block diagram and connected by means of logical statements. When a system is represented in the form of such a diagram, it is easier to “see” how different components must interact for the system to perform properly, or how the system interacts with its environment. By isolating subsystems of the water resources system, their performance can be tested and analyzed separately. In this manner, the systems approach gives transparency to the planning process and simplifies the discussion on all levels of the decision-making process; and it easily permits addition or deletion of different components or interactions. The systems approach is especially useful when a project becomes so large that it cannot be considered as a unit, necessitating its decomposition. However, systems analysis is not an approach that can be used automatically and without thinking. Usually, the greatest effort of the analyst is to reduce the system to a manageable representation without destroying its essential features and relationships. Analysts may overlook important relationships because they may lack access to all necessary data, and usually time is not sufficient in an actual planning environment to develop the ideal model and test it to its fullest extent or to subject it to the scrutiny of several experts. A prerequisite for a systems analysis is that all the elements of the system can be modeled either analytically or conceptually. It is important to distinguish between system and model. A model is the mathematical and/or physical representation of the system and of the relations between the elements of the system. It is an abstraction of the real world, and, in any particular application, the quality of the model and thus
6
of systems analysis depends on how well the model builder perceives the actual relationship and how well he/she is able to describe its functional form. Since models are abstractions of reality, they do not usually describe all features that are encompassed by a real world situation. A prerequisite for the systems analysis of a water resources system is the description of the system in terms of component models, which permit solutions to be obtained at reasonable cost and within a prescribed time frame. Therefore, the model builder should not attempt to model the reality of individual components as closely as possible, but only as closely as necessary to meet the overall accuracy requirements for his/her system.
2.2. Systems Analysis: Definitions
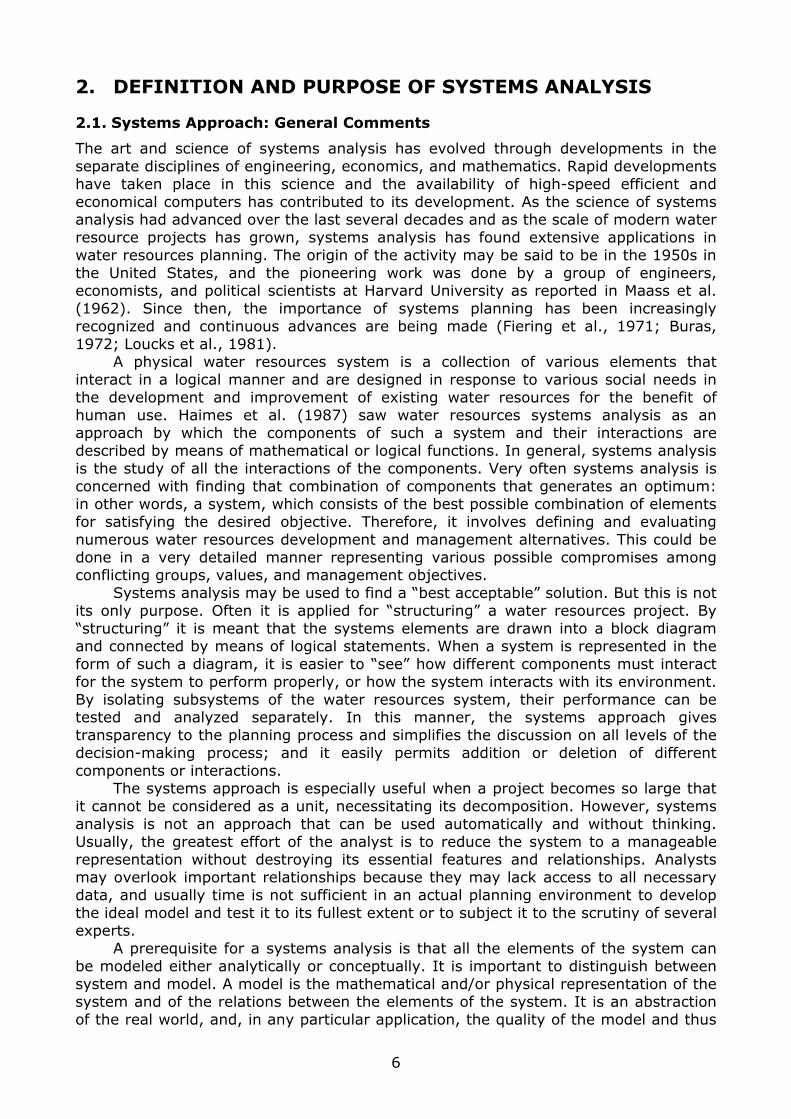
Conventional engineering approaches following sectoral problem definitions and solutions appeared to be inadequate tools to tackle complex problems inherent in water resources management. Since the early 1960s (Maass et al., 1962) serious attempts have been made to redefine the water resources development problems within the framework of systems analytical concepts. The analysis of the problems in this context implies the introduction of new terms and terminology as well as requiring the formulation of goals and aspirations to fit the new approach. The following description and definitions of system analysis related terminology is mostly adopted from Bogardi (1994). In the broadest sense “system” can be identified as the models of reality, consisting of a finite number of elements interrelated and interacting with each other in a regular interdependent way. While a system is not related to any specific size, purpose, or context, there are obvious limitations applied to identify a system. By using descriptions such as social, natural, environmental, legal, or production, the essence of the system considered becomes evident. Moreover, these systems are not only limited by their scope but also by our ability to grasp, identify, and also to characterize the interrelationships among the elements involved. By focusing only on the most essential or readily quantifiable interactions the system derived becomes itself a model of reality. A system, following the above definition is displayed in Figure 2.1. As shown, a system is carved out of its environment. Inputs and outputs substitute the severed interactions between elements of the defined system and elements left outside while feedback indicates a possible external interaction between outputs and inputs, which still can insert an impact on the system and its behavior. It is obvious that this setup implies the factor “time” in order to accommodate the time lag necessary for the feedback and corresponding adaptation, thus indicating the very dynamic nature of the system. (See Figure 2.1.) From the point of view of the system analyst both inputs and outputs can be classified into different subsets. While the controlled and partially controlled inputs are described by decision variables, the uncontrolled inputs influence the state of the system without being subject to any direct influence. The set of feasible realizations of decision variables constitutes the decision space. On the output side desirable and undesirable outputs are of particular interest. It is aimed to maximize the desirable and/or minimize undesirable output while selecting the course of decision. The transformation of the system because of both decision variables and uncontrolled input are described by a set of variables called state variables, while the system response behavior (rate of change of the state variables due to variable inputs) is characterized by system parameters.
7
Inputs Environment Outputs Controlled Desirable
Partially controlled Undesirable
Uncontrolled Neutral
Feedback
System
Figure 2.1. Model of the system
Source: Hall and Dracup (1970).
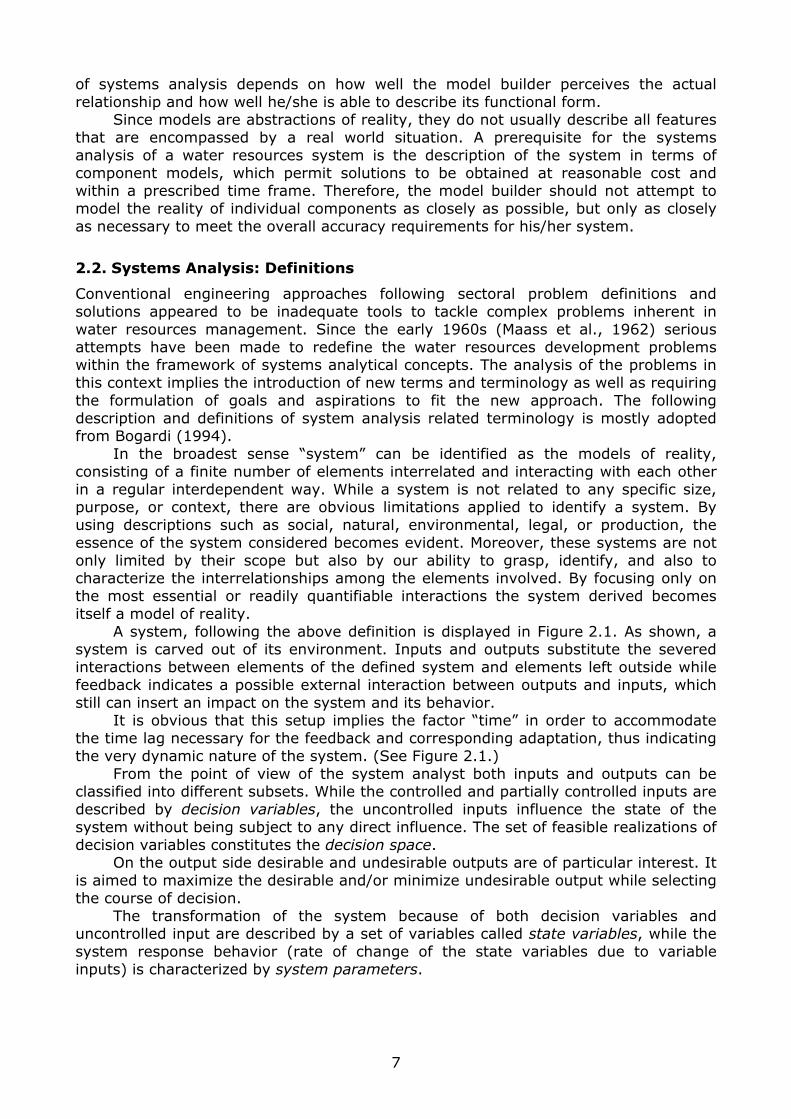
Any expert involved in the task of water resources management would consider his/her system as the central one since the professional background biases the personal perception. It is appropriate to call those systems, subsystems by realizing their intricately woven interrelationships. Figure 2.2 presents several subsystems in a system. Also, the system concept does not prevent the further division of a subsystem to subsystems for the sake of convenient analysis.
(SUB) SYSTEMS
OUTPUTS INPUTS
political administrative legal economic social environmental financial atmospheric surface water groundwater
Figure 2.2. Subsystems composing a water resources system
Source: Bogardi (1994).
Systems analysis (SA) in a very broad sense is concerned with the identification and description of models of reality and the study of system behavior on these models under different aspects and conditions. Furthermore, it can, but does not necessarily include the selection of a preferred course of actions to influence system behavior. Consequently, SA might include the field known as operations research. Systems engineering by its own virtue should include technical elements in this analysis. Clearly, the major tasks involved in systems engineering are the identification of the interrelationships, which should or/and can be controlled in order to influence system performance into a desirable direction, and to select the
8
appropriate (technical) options to achieve the aimed goals. Thus in this context systems engineering implies a decision-making process with respect to the controllable aspects of the system involved. Along with this definition, systems engineering is both an art and a science. Sage and Rouse (1999) edited an excellent handbook on systems engineering containing thirty articles written by well-known engineers and scientists covering virtually all aspects of the field. In Chapter 27, Hipel et al. (1999) present an overview of operational research techniques, including conflict resolution and multiple criteria decision analysis, and the role they play in systems engineering. Knowing how to define the system and to separate it from its environment and how to distinguish between essential and negligible aspects and interrelationships is an art. Knowing how to describe (mathematically or otherwise) the interrelationships and how to select an optimal course of decisions out of the (often) vast array of possible course of actions is a science. The interconnections of the subsystems of Figure 2.2, either severed or being considered as part of the subsystems simultaneously implied in the model, impose constraints upon each other thus limiting the range within which the individual inputs (decision variables) can assume numerical values. This results in the confinement of the decision space to a feasible region. Any set of decision variables situated within the feasible part of the decision space represents a feasible policy that induces, under consideration of the actual values of the state variables and system parameters, certain system outputs that are desirable or/and undesirable. Both type of outputs are associated with certain goals to be attained. In order to gauge the impact of any feasible input policy upon the attainment of the present goals, the degree of goal attainments is expressed by objective criteria, which are preferably numerically quantifiable. Even by succeeding on this issue it can happen that several objectives cannot be measured on the same scale and therefore cannot be expressed in the same units thereby leading to noncommensurable objectives and resulting in a multi-objective (multicriteria) decision-making problem. However, the following presentation assumes that a single unit can express all the objectives. Then, the remaining crucial part of the systems analysis is to define the relationships (or mathematical functions) by which the consequences or system output can be determined in the selected unit of objectives, given the feasible decision policy, a certain constellation of state variables, and system parameters. This function is called the “objective function” and is expressed in general form as: Min. or max. O.F. = f(x, s, p) (1) f = {fn} n….N – objective function Where, x = {Xi} i….I – decision variables s = {Sj} j….J – state variables p = {Pk} k….K – system parameters
Subjected to a set of constraints, expressed here in general form as less or equal relationships:
gm (x, s, p) ≤ 0 m…..M (2)
The remaining problem, that is, to select the optimal feasible decision policy, is to find the set of Xi (i….I) values to maximize (for benefits) or minimize (for losses) the objective function. While this remains a formidable task to be solved, it is even more fundamental to emphasize that the objectives and objective function, like the whole system, are more of a model rather than the expression of the real preference structure of the decision maker(s). Therefore any optimal decision policy derived by maximizing (or minimizing) the objective function can only be considered optimal
9
within the context of the given mathematical model. For the “real world” decision it might be regarded only as a guideline that is the conclusion of a mathematical analysis intended solely to enhance the perception of the problem, rather than to surrender decision sovereignty to the model and to consider it as a substitute decision maker. The mathematical engineering core of the problem, that is, the assessment of the system behavior and the selection procedure of the most preferred course of action (policy) appear to be unnamed. While it can be regarded as part of the systems analysis there is a distinct difference in the scope of the problems to be solved. This very fact, along with the mathematical approach involved, warrants it being distinguished with a separate name: “operations research” (OR). While OR is an “independent” science originated from the mathematical analysis of military operations in the Second World War, its definition is still quite vague. Even Hillier and Lieberman (1980) were unable to formulate a definition. Some others try to use it as a synonym for systems analysis, yet this approach disguises the difference and hierarchical relationship between SA and OR. OR might be described as the science of applied mathematics (or algorithms) developed to facilitate optimal planning, operation, and so on, or briefly as the management of resources, institutions, factories, and so on.
2.3. Systems Analysis Tools
The tools of a systems analyst are many and varied in their usefulness. The type of solution procedure (or algorithm) most appropriate for any particular constrained optimization (or mathematical programming) model depends on the particular mathematical form of the objective function and of the constraint equations. There is no universal solution procedure that will efficiently solve all problems. However, available approaches fall into two categories: simulation and optimization. An extremely large number of simulation and optimization models providing a broad range of analysis capabilities for evaluating reservoir operations have been developed over the past several decades (Wurbs, 1993).
2.3.1. Simulation
Simulation is perhaps the most widely used method in water resources systems analysis because of its mathematical simplicity and versatility. Simulation is not an optimization procedure, so it does not identify optimal decisions. It only evaluates performance of a system under a given set of inputs and operating conditions. Simulation models permit very detailed and realistic representation of the complex physical, economic, and social characteristics of a water resources system. The concepts inherent in the simulation approach are easier to understand and communicate than other modeling concepts. Simulation methods are able to solve water resources systems planning models with highly nonlinear relationships and constraints that cannot be handled by constrained optimization procedures. A simulation may be deterministic or stochastic. If the system is subject to random input events, or generates them internally, the model is said to be at least partially stochastic. If no random components are involved, the model is deterministic. A simulation may deal with steady state or transient conditions. The study of a water resources system during its initial years (perhaps involving one strategy for filling the reservoirs and one for diverting damaging floods that occur before the structures are ready to receive them) lies in the area of transient analysis. The study of the operation of a water resources system over a relatively long period of time during which no major changes in the system occur would be undertaken with a steady-state analysis.
10
Simulation models have been routinely applied for many years by water resources development agencies in the planning, construction, and management of water resources projects. Many site-specific models have been developed. The Colorado Reservoir Simulation System (CRSS) and Potomac River Interactive Simulation Model (PRISM) are two notable simulation models developed for particular water resource systems. Water resource system simulation models can be developed using readily available general-purpose commercial software such as Lotus 1-2-3, Quattro Pro, and Excel. Ford (1990) describes a reservoir simulation model called “ResQ,” designed for use in combination with the user’s choice of spreadsheet program. An object-oriented-simulation modeling environment such as the commercially available System Thinking Experimental Learning Laboratory with Animation (STELLA), a model designed to simulate dynamic systems, can also be used to simulate a water resource system. Generalized simulation models designed to be readily applicable in analyzing water resource systems are also available. Acres model (Sigvaldason, 1976), HEC5 simulation of Flood Control and Conservation System (Mays and Tang, 1992), and Interactive River System Simulation Model (IRIS) (Loucks, 1989, 1990) are a few examples. The difficulty with the simulation approach is that there is often a frustratingly large number of feasible solutions or plans. However, when an optimization procedure can be constructed to efficiently solve an adequate approximation to the real problem, it can greatly narrow down the search with simulation for a global optimum by identifying plans that may be close to the optimum.
2.3.2. Optimization
The second category, optimization models, includes a diverse set of techniques or algorithms. The type of solution procedure (or algorithm) most appropriate for any particular constrained optimization (or mathematical programming) model depends on the particular mathematical form of the objective function and of the constraint equations. There is no universal solution procedure that will efficiently solve all constrained optimization models. Application of optimization models in water resources systems analysis is extensive. Textbooks by Loucks et al. (1981) and Mays and Tung (1992) cover many such models or techniques applicable in water resource system analysis. Yeh (1985) presented a comprehensive in-depth state of the art review of reservoir operation models, with a strong emphasis on optimization techniques. Most applications to water resources systems analysis involve linear programming (LP) and dynamic programming (DP). Various other nonlinear programming methods, particularly search algorithms have also been used. Optimization models are formulated in terms of determining values for a set of decision variables that will maximize or minimize an objective function subject to constraints. The objective function and constraints are represented by mathematical expressions as a function of the decision variables. If the objective function, as well as the constraints, is linear, then a very efficient procedure called “linear programming,” (LP) may be used. LP has been one of the most widely used techniques in water resources. Unlike most other optimization techniques, LP software packages are available. Dantzig presented an algorithm for solution of the LP problem called the “simplex method” in 1947. Since that time a series of revised simplex algorithms has been developed and computer codes programmed. Shane and Gilbert (1982) and Gilbert and Shane (1982) presented a model called HYDROSIM in which LP has been incorporated. Though there are some limitations to the use of LP in a deterministic environment, numerous water resources studies have utilized it along with additional techniques for a wide variety of problems (Houcks, 1982; Gryger and Stedinger, 1985; Simonovic and Burn, 1989; Reznicek and Simonovic, 1990). LP has been
11
extensively used in stochastic reservoir system modeling as a main technique within different approaches such as chance constrained LP, stochastic LP for Markov process, and stochastic programming with recourse and reliability programming. Dynamic programming (DP) is an optimization procedure or an approach applicable in the study of multistage (sequential) decision problems. The stage or sequential characteristics of the problem often are time periods, however, the stages can also be space regions or physical entities such as reservoir sites or irrigation fields. It is based on the principle of optimality, which implies a sequential decision process in which a problem involving several variables is broken down in to a sequence of simple problems, each involving a single variable. DP is not restricted to any particular problem structure and it can handle nonlinear objective functions and nonlinear constraints very easily. There are many applications of DP in water resources systems analysis (Young, 1967; Hall and Buras, 1961; Yeh, 1981; Allen and Bridgeman, 1986; Chung and Helweg, 1985; and others). Many changes have been applied to the basic concepts of DP to make the technique more efficient for certain specific problems: differential dynamic programming, constrained differential dynamic programming, reliability constrained dynamic programming, and stochastic dynamic programming. Nonlinear programming (NLP) has not been popular among water resources system analysts. The main reason is that NLP techniques are slow, iterative, and take up large amount of computer storage and time. On the other hand NLP offers a more general mathematical formulation of reservoir problems. NLP include search techniques, quadratic programming, geometric programming, and separable programming. They can be used in conjunction with simulation as well as other programming techniques. Hicks et al. (1974), Haimes (1977), Rosenthal (1980), Simonovic and Marino (1980), and others have reported the application of NLP. Genetic Algorithms (GAs), introduced by Holland (1975) and developed by Goldberg (1989), offer a powerful optimization approach that has a potential in water resources system analysis; its applications are quite recent. McKinney and Lin (1994) applied GAs in the management of groundwater models. Simpson et al. (1994) used GAs in optimization of pipe networks. Savic and Walters (1997) developed a computer model for least cost design of water distribution networks. However, GAs have very little application in reservoir system optimization. East and Hall (1994), Kumari (1995), and Oliveira and Loucks (1997) are a few applications of GA in reservoir operational problems reported in literature.
2.3.3. Multi-objective Analysis
Water resources management very often encounters complex decision problems involving multiple objectives that are addressed by multi-objective analysis approaches. Tecle and Duckstein (1994) presented the following terminology and notation found in the field of multi-objective decision making. The process of modeling and solving a problem with two or more noncommensurable and conflicting objectives is known as “multi-objective decision making” (MODM). Objectives are noncommensurable if their level of attainment with respect to given attributes cannot be measured in common units. Objectives are conflicting if an increase in the level of one objective can only be achieved by decreasing the attainment level of another objective. The characteristics, factors, qualities, performance indices, or parameters of alternative management schemes or other decision processes are referred to as “attributes.” An attribute provides a means for evaluating the levels of an objective. It can be defined as a measurable aspect of judgment by which a dimension of the various decision variables or alternative management schemes under consideration can be characterized. A decision analysis problem consisting of more than two attributes is known as a “multi-attribute decision problem” and may be solved using a
12
multi-attribute decision-making (MADM) procedure. The procedure involves the selection of the “best” alternative course of action from a given number of alternatives described in terms of their attributes. In decision-making theory, a criterion may represent either an attribute or an objective. In this sense, “multicriterion decision making” (MCDM) means either a multi-attribute or a multi-objective decision problem or both. Multicriterion decision making is, therefore, used to indicate the general field of study which includes decision making in the presence of two or more conflicting objectives and/or decision analysis processes involving two or more attributes. “Decision variables” are the vehicles used to specify decisions made by a decision maker. In mathematical programming, they represent the numerical variables (nonnegative), whose values are to be determined. During the problem formulation stage of a decision process, quantities to be treated as decision variables and fixed have to be decided. The quantities whose values are fixed are called “parameters.” There are restrictions on attributes and decision variables, which may or may not be expressed mathematically. “Constraints” describe restrictions or dependencies between decision variables and parameters and may be stated in the form of equalities, inequalities, or probabilistic statements. A multicriterion problem can be represented in vectorial notation as: “Satisfice” f(x) = {f1(x), f2(x), ………., fI(x) (3) Subject to gk(x) ≤ 0, k = 1, 2, ………, K (4) xj ≥ 0, j = 1, 2, ……..., J
There are I objective functions fi(x), each of which is to be satisficed subject to the constraint sets. The region defined by this constraint set is referred to as the “feasible region” in the J dimensional decision space. It is important to note that the word “optimum,” which includes both the maximization of desired outcomes and minimization of adverse criteria is replaced by the word “satisfactum” and optimize is replaced by “satisfice” because when dealing with two or more conflicting objectives optimizing all objectives simultaneously is not possible as an increase in one objective usually results in a decrease of the others. In such circumstances “trade-offs” between the objectives are made in order to reach solutions that are not simultaneously optimum but still acceptable to the decision maker with respect to each objective. To find a final satisficing solution, an interaction between the analyst and decision maker is required. A decision maker (DM) is an individual or a group of individuals whose desires are supposed to be satisfied by the outcome of the multicriterion decision process. The DM identifies the decision problem and specifies the objectives. An analyst is responsible for defining the decision model, conducting a multicriterion decision process, and presenting results to the DM. An important component of a MCDM process concerns the priorities often attached to each one of the various criteria under consideration. These priorities may be represented as quantitative numbers usually referred to as “weights” or by means of ordinal expressions, which are denoted by priorities. The weights and priorities in the decision makers’ view represent the relative importance of the objectives or utilities of a problem to one another. Goals, aspiration levels, and ideal points also reflect different aspects of the DM’s desire in dealing with a multicriterion problem. Goals, known as “targets,” are conditions desired by the DM and expressed in terms of a specific state in space and time. Aspiration levels are special cases of goals. The levels specified for goal points must be such that they cannot be achieved simultaneously for all objectives: the goal point is thus not in the feasible region. But when the goal point is in the feasible objective space, it is considered to be an aspiration level. If optimal values to a
13
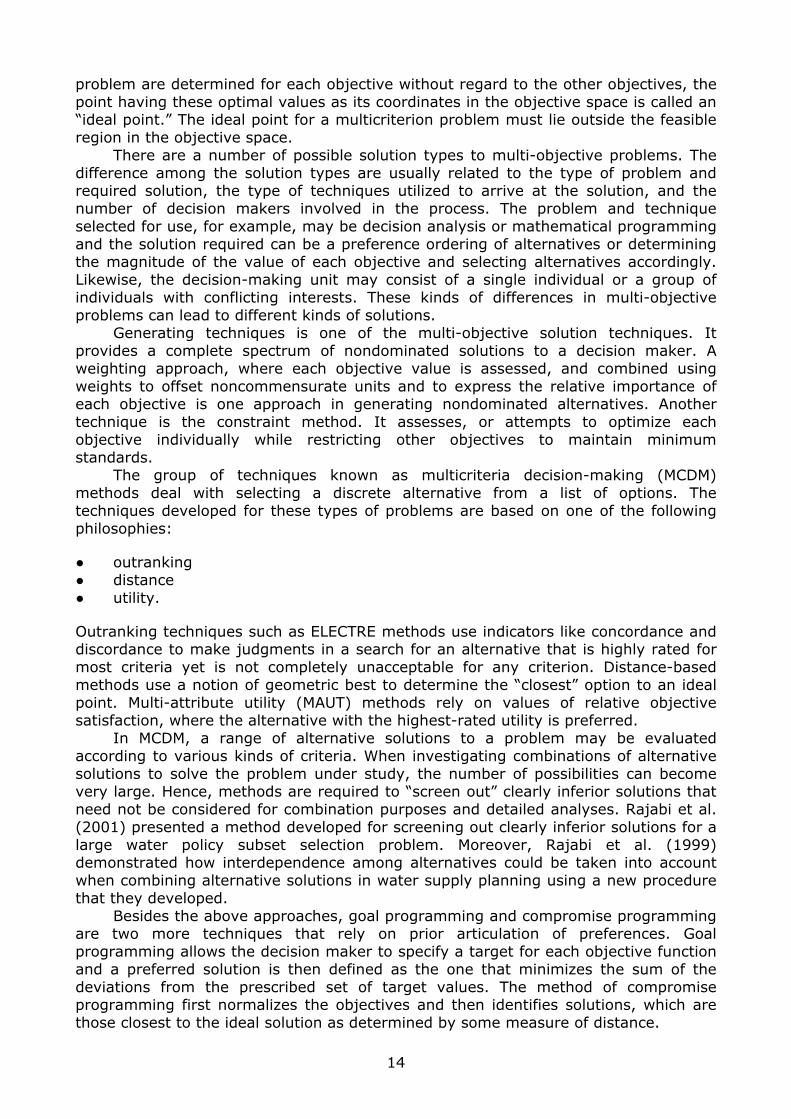
problem are determined for each objective without regard to the other objectives, the point having these optimal values as its coordinates in the objective space is called an “ideal point.” The ideal point for a multicriterion problem must lie outside the feasible region in the objective space. There are a number of possible solution types to multi-objective problems. The difference among the solution types are usually related to the type of problem and required solution, the type of techniques utilized to arrive at the solution, and the number of decision makers involved in the process. The problem and technique selected for use, for example, may be decision analysis or mathematical programming and the solution required can be a preference ordering of alternatives or determining the magnitude of the value of each objective and selecting alternatives accordingly. Likewise, the decision-making unit may consist of a single individual or a group of individuals with conflicting interests. These kinds of differences in multi-objective problems can lead to different kinds of solutions. Generating techniques is one of the multi-objective solution techniques. It provides a complete spectrum of nondominated solutions to a decision maker. A weighting approach, where each objective value is assessed, and combined using weights to offset noncommensurate units and to express the relative importance of each objective is one approach in generating nondominated alternatives. Another technique is the constraint method. It assesses, or attempts to optimize each objective individually while restricting other objectives to maintain minimum standards. The group of techniques known as multicriteria decision-making (MCDM) methods deal with selecting a discrete alternative from a list of options. The techniques developed for these types of problems are based on one of the following philosophies:
● outranking ● distance ● utility.
Outranking techniques such as ELECTRE methods use indicators like concordance and discordance to make judgments in a search for an alternative that is highly rated for most criteria yet is not completely unacceptable for any criterion. Distance-based methods use a notion of geometric best to determine the “closest” option to an ideal point. Multi-attribute utility (MAUT) methods rely on values of relative objective satisfaction, where the alternative with the highest-rated utility is preferred. In MCDM, a range of alternative solutions to a problem may be evaluated according to various kinds of criteria. When investigating combinations of alternative solutions to solve the problem under study, the number of possibilities can become very large. Hence, methods are required to “screen out” clearly inferior solutions that need not be considered for combination purposes and detailed analyses. Rajabi et al. (2001) presented a method developed for screening out clearly inferior solutions for a large water policy subset selection problem. Moreover, Rajabi et al. (1999) demonstrated how interdependence among alternatives could be taken into account when combining alternative solutions in water supply planning using a new procedure that they developed. Besides the above approaches, goal programming and compromise programming are two more techniques that rely on prior articulation of preferences. Goal programming allows the decision maker to specify a target for each objective function and a preferred solution is then defined as the one that minimizes the sum of the deviations from the prescribed set of target values. The method of compromise programming first normalizes the objectives and then identifies solutions, which are those closest to the ideal solution as determined by some measure of distance.
14
Exceptions to prior articulation are methods that employ progressive articulation of preferences. These are the true interactive conflict-capable multi-objective methods. Step method and sequential multi-objective problem solving (SEMOPS) are two techniques under this category. When progressive articulation methods are included within a comparison of techniques, they are not usually rated highly because of the amount of information and time that is required by decision makers. They are based on algorithmic approaches such as:
1. Find a noninferior (nondominated) solution. 2. Modify the solution according to reactions of the decision makers. 3. Repeat until satisfaction or termination.
Multi-objective techniques have been extensively explored in water resource planning and management (Keeney and Wood, 1977; Loucks et al., 1981; Gershon and Duckstein, 1983; Kindler, 1988; Simonovic, 1989; Hipel, 1992; Ko et al., 1992; Thiessen and Loucks, 1992; Bogardi and Nachtnebel, 1994; Hobbs and Meier, 2000).
2.4. A Systemic Approach to Conflict Resolution
A human action disturbs a water system so that the interactions between physical, biological, and/or social components are altered. This provokes some impact in the related systems. Usually, after trading off all impacts, those affected make an explicit or implicit judgment so that the net effect is either advantageous or disadvantageous to them. If those having rights in the area feel that they may be damaged then the conflict takes shape (White, 1986). Modification of the interaction among above components in the system motivates the application of a systematic approach to conflict resolution. A systemic approach has at least three roles in illuminating grounds on which conflict resolution may proceed. First, scientific investigation defines the systems that are affected and their structure (components), indicating where there is an established or assumed relationship among the various components. Definition of the system structure is fundamental because often conflicts arise where it has been assumed that the impacts were not as far-reaching as demonstrated in practice. Second, a systemic approach helps to describe the characteristics of the various components, including the physical systems, the ecosystems, and affected social groups and organizations with their preferences and modes of action. To identify the components is to deal with their interactions as they are established. Third, a systemic approach offers the means of estimating the significance of impacts not only in terms
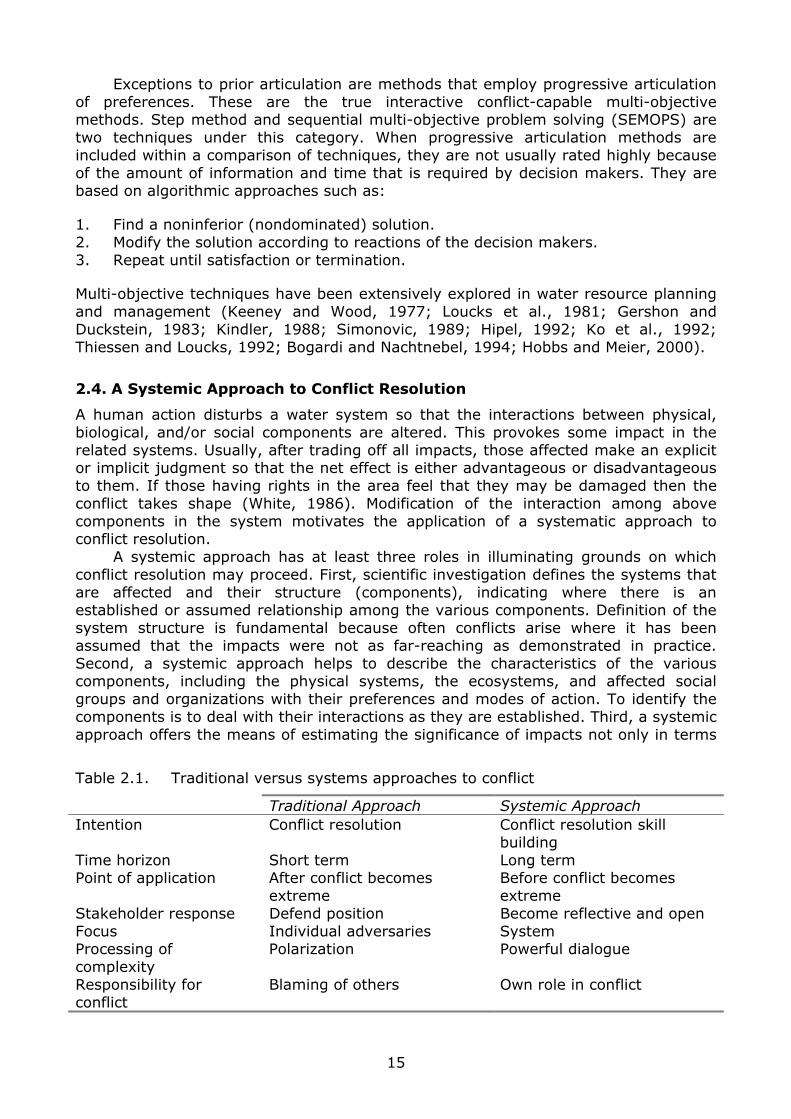
Table 2.1. Traditional versus systems approaches to conflict
Traditional Approach Systemic Approach Intention Conflict resolution Conflict resolution skill
building Time horizon Short term Long term Point of application After conflict becomes
extreme Before conflict becomes extreme
Stakeholder response Defend position Become reflective and open Focus Individual adversaries System Processing of complexity
Polarization Powerful dialogue
Responsibility for conflict
Blaming of others Own role in conflict
15

of physical quantities but also in terms of the way in which they are perceived by the people and organizations affected. Table 2.1 presents some differences between traditional and systemic approaches in conflict resolution. A systemic approach is proposed as a powerful tool for deep inquiry and development of dialogues among stakeholders. Active participation of stakeholders and development of their skills to deal with conflicting situations is the driving force of a systemic approach.
16
3. TYPES OF WATER RESOURCES MANAGEMENT CONFLICTS AND MODELS
3.1. General
Water is essential to sustain life in both human systems and ecosystems. In almost every region of the world, supply of water is becoming more difficult because of increasing demands associated with industrialization, increasing urbanization, and growing population. Climatic conditions such as global warming may worsen an already critical condition in years to come. Pollution from industrial, agricultural and urban wastes, and groundwater quality degradation from over-pumping also limit the availability of water. Disputes resulting from water problems may jeopardize economic and social order both within and between countries. To ameliorate such conflicts, improved water management, conflict resolution, and cooperation are essential. In water resource systems, water stress lends itself to conflict or to cooperation. Postel (1999) described the roots of the problem at the sub-national level. Water, unlike other scarce resources, is used to fuel all facets of society, from biology to economy to aesthetics and religious practice. As such, there is no such thing as managing water for a single purpose – all water management is multi-objective and is therefore, by definition, based on conflicting interests. Within a nation these interests include domestic users, agriculturists, hydropower generators, reactors, and environmentalists – any two of whom are regularly at odds and the chances of finding mutually acceptable solutions drop exponentially as more actors are involved. As described conceptually and with case studies by Trolldalen (1992), these conflicting interests within a nation represent both a microcosm of the international setting, and a direct influence upon it. He sidesteps the common trap of treating nations as homogeneous, rational entities, and explicitly links internal with external interests. Bangladesh is not just the national government of Bangladesh when it negotiates a treaty with India over Ganges flow, but it is its coastal population, inundated with saltwater intrusion; its farmers, dealing with decreasing quantities and increasing fluctuations; and its fishing communities competing for dwindling stocks. This link between the internal and the external is critical when we look at violent international conflicts. Gleick (1993) is widely cited as providing what appears to be a history rich with violence over water resources. However, Wolf (1998) argues that what Gleick and others have actually provided is a history rich with tensions, exacerbated relations, and conflicting interests over water, but not violence, at least not between nations or over water as a scarce resource. He further states that there was one true water war in history, 4,500 years ago, and seven cases of acute water-related violence – with a much richer record of explicit legal cooperation (3,600 water-related treaties). A scan of the most vociferous enmities around the world reveals that almost all the sets of nations with the greatest degree of animosity between them, whether Arabs and Israelis, Indians and Pakistanis, or Kyrgis and Uzbeks, either have a water-related agreement in place, or are in the process of negotiating one. The lessons of history turn out to be that, while water can act as an irritant, making good relations bad and bad relations worse, it rarely induces acute violence and often acts as a catalyst to cooperation, even between bitter enemies. Moreover those institutions that are created as a result turn out to be extremely resilient over time, even as conflicts rage over other issues (Wolf, 1998). Preventive diplomacy is a concept based on the premise that it is easier and cheaper to prevent disputes before they begin, than it is to resolve them after the fact (Spector, 2001). While seemingly self-evident, preventive diplomacy has proven difficult in practice, primarily because of the barriers within the international community of mobilizing crisis-level interest and resources before a crisis actually
17
occurs. As Spector describes it, though, the concept is gaining momentum, particularly within the western defense establishment, and he offers cases for how it has been used effectively, as well as the processes of preventive negotiations for problem-solving. Painter (1995) and Clark et al. (1991) describe how the tools used by alternative dispute resolution (ADR) – mediation, facilitation, and arbitration – can be effective in resolving environmental disputes, an application termed environmental dispute resolution (EDR). The rationale for ADR and EDR are similar to those of preventive diplomacy: it is cheaper and the solutions are more robust when issues are resolved through dialog rather than litigation (or combat), and Clark et al. (1991) offer settings and cases to back the argument up. Painter offers a brief history of EDR from its roots in labor negotiations, suggests some problems with the approach, and concludes with “poststructural alternatives.”
3.2. Disciplines and Worldviews
Though water is a unifying resource, water education management and discourse is very much fragmented. To truly learn about water in its most holistic sense, it is necessary to understand the many aspects of the hydrologic cycle, from meteorology to surface hydrology, to soil science to groundwater to limnology to aquatic ecosystems. Also, an integral sense of the human dimensions, from economics to laws, to ethics to aesthetics to sociology and anthropology is needed. Universities and management institutions are simply not organized along these lines; often they are fragmented to so that even surface water and groundwater, quality and quantity, are separated out as if they were not inextricably interrelated. However, each of these disciplines offers its particular perspective regarding conflict prevention and resolution (Wolf, 2002). Though each of these disciplines is rooted in their own topologies and terminologies, there are surprising similarities among them. Each discipline strives to provide a more structured framework for the often chaotic processes of conflict resolution: law (Bennett and Howe, 1998; Wescoat, 1996; McCaffrey, 1998) through its clear delineation of the terms, boundaries, and solutions; economics and game theory (Howe et al., 1986; Rogers, 1993) through the unifying concepts of rationality and efficiency; engineering (Lancaster, 1990; Bleed, 1990) by its description of present and future states, and how to get from one to the other; and political economy (Just et al., 1998; Allan, 1998) through its role between political and economic decision making. Each of the above disciplines brings its unique set of tools to help the parties prevent disputes, resolve disputes, or understand the problem in new ways to facilitate either prevention or resolution. Howe et al. (1986) show how market mechanisms can help with the problem of water allocations. Benefits might be equitably allocated across international boundaries through game theory (Rogers, 1993). Allan (1998) describes the concept of “virtual water” (which is the water that moves between consumers and across nations embedded within the products it was used to produce) as an argument against the limiting concept of water security. White (1986) shows the capabilities of geography in inter-disciplinary analysis. Further, he discusses the coming information age and its effects on systems analysis, risk assessment, and societal responses. Simonovic (1996) brings the technology of the twenty-first century to bear on the issues, describing how new modeling tools, visualization techniques, and information technologies can be packaged as decision support systems to aid parties in dispute in their decision making.
18
3.3. Nature of Conflicts Over Water
Most environmental conflicts, including water-related ones, spring from three sources (White, 1986). The first source is an actual or prospective human intervention in the environment that provokes changes in natural and societal systems. The conflict arises when one or more of the stakeholder groups see the activity as disturbing the complex interaction between physical, biological, and social processes. The second source is disagreement over the management of water supply at one location as it affects the use of it elsewhere. The third source is where climatic variability and change independent of any human activity places new stresses on the water resources and generates fresh adaptations to available resources. In a river basin that traverses an international border, a political regional boundary, or a general boundary of different jurisdiction, the basis of a conflict is the implementation of developments by a stakeholder concerned within its territory. Such implementation impacts at least one of its neighbors during water shortage conditions, and usually leads to a number of water conflicts. The key indicators or the water conflicts are related to a number of issues including water quantity, water quality, management of multiple use, political divisions, geopolitical setting, level of national development, the hydro-political issue at stake, and institutional control of water resources (Wolf, 1998). Water quantity becomes an issue of conflict when the demand and supply curves approach each other. Greater upstream use and long-run changes in supply or demand could be the causes for water quantity related conflicts. Increasing water scarcity because of a rise in population could lead to conflicts. On the other hand, quality related conflicts might erupt because of a new source of pollution resulting from extensive agriculture development in the upstream. Return flows from agricultural, industrial, and urban activities may also cause dissatisfaction among the downstream users and may result in a conflict. In a large river basin, water is generally managed for multiple uses such as power generation, food production, industrial development, municipal water supply, recreation, or a combination of these. Different user groups with different objectives may have conflicts in arriving at a common schedule of quantity and time of water distribution (Yoffe and Ward, 1999). The human elements such as vulnerability of water quality and aquatic ecosystems to human activities, the failure to treat water as an economic resource, the desire for food security, and the importance of water to public health and economic development also create conflicts over water. Past history in different regions of the world indicates that shifting of political boundaries, which demarcate new riparian areas in the international river basins, has induced water conflicts. Wolf (1998) cites examples of conflicts in water bodies that became international when the British Empire disappeared in many countries. Geopolitical setting is another issue where the relative power and riparian position of a group play an important role. A group occupying the upstream area of a basin or having more political power has more control over the others in implementing development projects (Lowi, 1993). The level of national development may be an indictor of potential water conflict in an international river basin. The more developed nation may have better options for alternate sources of water, and may be less demanding over a conflict with a neighboring less developed nation. Mandel (1992) relates the intensity of a water conflict with the hydro-political issue at stake. Water conflicts resulting from human-initiated developments, such as dams and diversions, are found to be more severe than those resulting from natural events such as floods and droughts.
19
3.4. Conflict Resolution
Traditional conflict resolution approaches such as the judicial systems, state legislatures, commissions, and similar governmental systems provide resolutions in which one party gains at the expense of the other. This is referred to as the “zero-sum” or “distributive” solution. In water and environmental conflict resolution, a negotiation process referred to as the “alternative dispute resolution” (ADR) is adopted. ADR refers to “a wide variety of consensual approaches with which parties in conflict voluntarily seek a mutually acceptable settlement.” ADR generally seeks to move parties from “zero-sum” solutions towards those in which all the parties gain, and these are referred to as “positive-sum” or “integrative” solutions (Bingham et al., 1994). Negotiation, collaboration, and consensus building are the key issues that facilitate ADR. Prior to the negotiation, the pre-negotiation process in initiated by a person (the convener) who has sufficient authority and stature to capture the attention of stakeholders. The convener may contract a third party to conduct a preliminary review of the conflict. A review of this type reveals the background information on the conflict as well as identifying the stakeholders (Carpenter and Kennedy, 1988). If the preliminary review indicates that the negotiation process holds potential promise for improving the situation, the third party will conduct a conflict analysis (Moore, 1986; Schwarz, 1994). This activity consists of a combination of data and personal interviews with parties concerned. The third party then designs an appropriate intervention strategy for bringing the stakeholders involved to the negotiation table. At this stage, the third party is referred to as mediator or facilitator. During the negotiation process, the parties must exchange information and share technical details. They should listen to other parties and the mediator. Above all, they should agree on creative options to seek mutually beneficial outcomes (Moore, 1986; Rothman, 1997). The successful resolution of national as well as international water conflicts requires an understanding of the nature of the conflict and then modeling and analyzing the inherent problems in it. To reach a final agreement concerning how much of the shared water resource is allocated to each party or nation, the assistance of procedures or methodologies acceptable to all the parties concerned is very much needed. The systematic study of the nature and conduct of conflict and cooperation between involved parties based on new technologies and practices could assist the efficient management of water resources, and thereby reduce tension among parties in dispute over water. A systemic approach to conflict resolution is a new approach for water resources conflicts. It uses the disciplines of systems thinking and mental models to provide a powerful alternative to traditional approaches to conflict resolution, which often rely too much on outside mediation. By helping stakeholders explore and resolve the underlying structural causes of conflict, a systemic approach can transform problems into significant opportunities for all parties involved. A systemic approach to conflict resolution has been explored in the management science (Cobble and Huffman, 1999). Some elements of the systemic approach have been present in the work of Bender and Simonovic (1996) and Simonovic and Bender (1996), which proposes collaboration and collaborative process with active involvement of stakeholders that agree to work together to identify problems, share information, and where possible, develop mutually acceptable solutions. Consensus building processes constitute a form of collaboration that explicitly includes the goal of reaching a consensus agreement on water conflicts. The indigenous approaches to water conflict reduction (Wolf, 2000) are also related to a systemic approach. Such methods include:
● allocating time, not water ● prioritizing different demand sectors
20
● protecting downstream and minority rights ● ADR ● practicing a ritual ceremony of forgiveness.
3.5. Types of Problems vs. Types of Models
3.5.1. Conflict Negotiation
Negotiation is a process where two or more parties with conflicting objectives attempt to reach an agreement. This process includes not only the presentation and exchange of proposals for addressing particular issues, but also the attempts by each party to discover the preferences, strengths, and weaknesses of their opponents, and the use of that knowledge to help reach a satisfactory resolution. Negotiating parties may be individuals or teams representing their own interests or the interests of their organizations. Negotiation can be a constructive alternative to other means (for example, physical violence, litigation, and stalemate) of settling disputes (Holznagel, 1986; McDonald, 1988; Delli-Priscoli, 1988). The main purpose of a negotiator is to try to identify alternatives that all parties in conflict will find acceptable. Negotiators must identify and explore the impacts of various decisions, and begin to understand the trade-offs among these impacts. Various optimization and simulation models of water resource systems serve as “context” models for gaining such an understanding. Negotiators must also determine, for each proposed solution to the conflict, what they, or whomever they represent, will gain, and what they will lose, and whether or not what they gain will be worth more than what they will lose. A third-party mediator or facilitator may be included in a negotiation process to help manage the interactions and make suggestions for negotiating parties to consider. Alternatively, an arbitrator may be involved with the power to draft and perhaps dictate settlements for the parties (Anson et al., 1987). It is commonly recognized (for instance, Gulliver, 1979; Mastenbroek, 1989) that such disinterested parties can significantly help negotiators in their quest for an agreement. Recent development in modeling negotiation processes is motivating work in the use of computer-based analyses of negotiation problems (Raiffa, 1982). The complexity of many negotiation problems involving regional water resources development and use conflicts poses a challenge. This complexity motivates the development of computer models that today are beginning to be able to address many of these complexities with increasing effectiveness. These models and their supporting programs require that the issues of the stakeholders (those who are in conflict or who will be affected by any agreement) are adequately defined. But these issues can change. Hence, any analysis of negotiation problems must permit the updating of issues, preferences, and interested stakeholders as the negotiation process proceeds. This analysis must be sufficiently flexible to not constrain or limit the options and thinking of those negotiating, yet not overload them with information that may divert or distract them from reaching some mutually satisfactory agreement (Poole et al., 1991). To resolve water resources disputes in the Washington metropolitan area, Las Vegas, and the Kansas River basin a conflict negotiation model called “computer assisted negotiation” (CAN) has been used (WRMI, Internet) successfully. The experience with the application of this model suggests that in multi-objective disputes with numerous parties a neutral outsider may have the broader perspective necessary to integrate the operations and actions of all parties. Often this allows the development of more acceptable, or even win–win alternatives.
21
3.5.2. The Role of Computer-Based Support in Conflict Resolution
At certain stages of conflict resolution, alternatives and proposals specific to stakeholders in conflict are analyzed for their technical feasibility and economic viability. Such analyses in water-based conflicts include processing of vast amount of hydrological and geophysical data, describing system structure, identifying system states by routing of natural and scheduled flows, mapping and graphing system operational strategies, and optimization and multicriteria analyses of system components and operations. Therefore, a decision support tool that could assist the stakeholders with different technical aspects is vital for the success of a water conflict resolution process. Quite often, the stakeholders have little or no technical knowledge relevant to water resources management. As a result, in a conflicting situation they generally stand firm behind their positions irrespective of the technical difficulties associated with satisfying their criteria. It has been shown in the literature that in complex situations of this nature, the availability of computer-based support systems that could convey the technical information to stakeholders in an understandable form is one of the preconditions for finding mutually acceptable and sustainable resource management solutions (Simonovic, 1996).
3.5.2.1. Decision Support Systems
Use of computer-based support systems is a recent development in water conflict resolution (Raiffa, 1982). Handling the complex nature of water conflict on the regional or international scale is often a challenge for everyone involved. Such complexity led researchers around the world to develop computer-based decision support systems (DSS) that can provide considerable assistance in determining temporal and spatial distribution of water quantity and quality. DSS are a specific class of computerized information system that supports decision-making activities. DSS are interactive computer-based systems and subsystems intended to help decision makers use data, documents, knowledge, and/or models to identify and solve problems and make decisions. Progress in computer software development and its implementation in water resources (Antrim, 1986; Fraser and Hipel, 1984; Anson et al., 1987; Jones, 1988; Kersten, 1988; Anson and Jelassi, 1990; Foroughi and Jelassi, 1990; Meister and Fraser, 1992; Fang et al., 1993; Bender and Simonovic, 1996) provides a different kind of negotiation assistance medium. Such tools are also referred to as “negotiation support systems.” The basis for all these systems is a group decision-making process (Lewis, 1993) that assists in solving disagreements among various stakeholders. Other water resources related decision support systems (Davis et al., 1991; Fredericks et al., 1998; Andreu et al., 1996; Reitsma, 1996; Dunn et al., 1996; Jamieson and Fedra, 1996; Arumugam and Mohan, 1997; Ford and Killen, 1995; Ito et al., 2001) with one or more tools for the analysis of water quantity and quality distribution, and flood and environmental management, are also helpful in water conflict resolution. Simonovic (1996a) defines a computerized decision support system as “a tool that allows decision makers to combine personal judgment with computer output, in a user–machine interface, to produce meaningful information for support in a decision-making process.” Such systems are capable of assisting in the solution of all problems using all information available on request. They use quantitative models and database elements for problem solving. They are an integral part of the decision maker’s approach to problem identification and solution. A decision support system for application in water resources management has the following characteristics: accessibility, flexibility, facilitation, learning, interaction, and ease of use. Water resources problems are generally ill structured, lack data, associated with uncertainties, and include non-quantifiable variables (Landry et al., 1985).
22
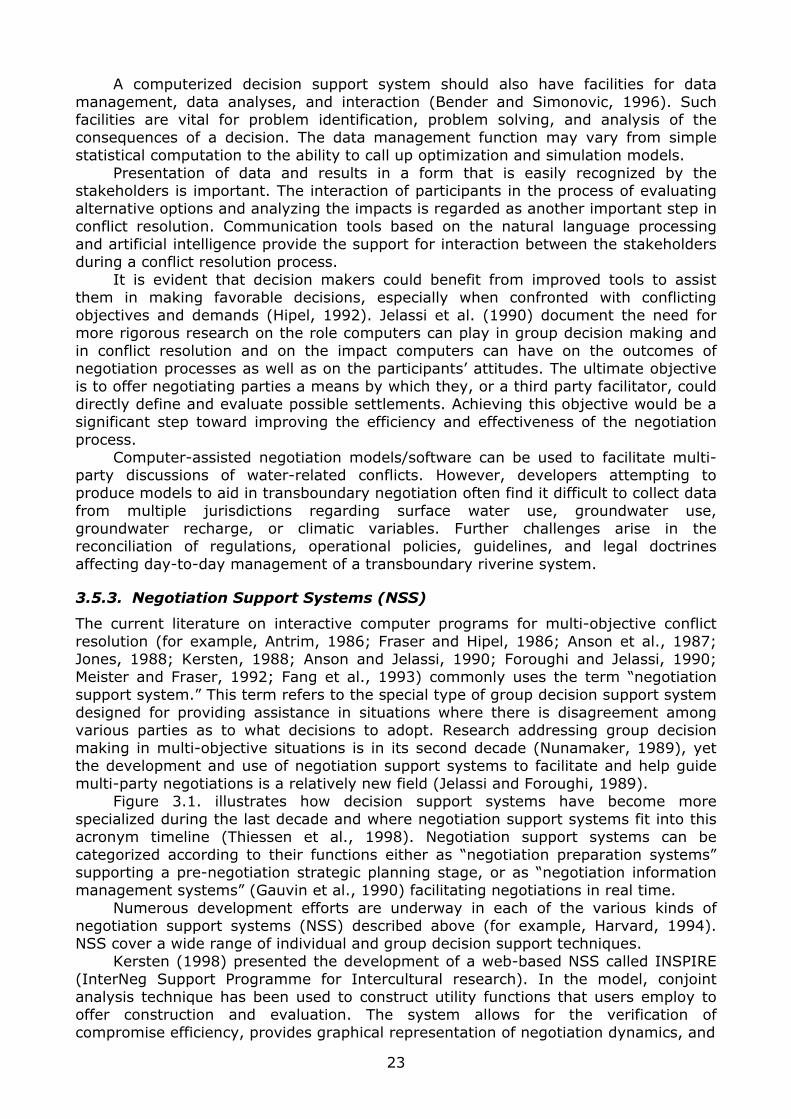
A computerized decision support system should also have facilities for data management, data analyses, and interaction (Bender and Simonovic, 1996). Such facilities are vital for problem identification, problem solving, and analysis of the consequences of a decision. The data management function may vary from simple statistical computation to the ability to call up optimization and simulation models. Presentation of data and results in a form that is easily recognized by the stakeholders is important. The interaction of participants in the process of evaluating alternative options and analyzing the impacts is regarded as another important step in conflict resolution. Communication tools based on the natural language processing and artificial intelligence provide the support for interaction between the stakeholders during a conflict resolution process. It is evident that decision makers could benefit from improved tools to assist them in making favorable decisions, especially when confronted with conflicting objectives and demands (Hipel, 1992). Jelassi et al. (1990) document the need for more rigorous research on the role computers can play in group decision making and in conflict resolution and on the impact computers can have on the outcomes of negotiation processes as well as on the participants’ attitudes. The ultimate objective is to offer negotiating parties a means by which they, or a third party facilitator, could directly define and evaluate possible settlements. Achieving this objective would be a significant step toward improving the efficiency and effectiveness of the negotiation process. Computer-assisted negotiation models/software can be used to facilitate multi-party discussions of water-related conflicts. However, developers attempting to produce models to aid in transboundary negotiation often find it difficult to collect data from multiple jurisdictions regarding surface water use, groundwater use, groundwater recharge, or climatic variables. Further challenges arise in the reconciliation of regulations, operational policies, guidelines, and legal doctrines affecting day-to-day management of a transboundary riverine system.
3.5.3. Negotiation Support Systems (NSS)
The current literature on interactive computer programs for multi-objective conflict resolution (for example, Antrim, 1986; Fraser and Hipel, 1986; Anson et al., 1987; Jones, 1988; Kersten, 1988; Anson and Jelassi, 1990; Foroughi and Jelassi, 1990; Meister and Fraser, 1992; Fang et al., 1993) commonly uses the term “negotiation support system.” This term refers to the special type of group decision support system designed for providing assistance in situations where there is disagreement among various parties as to what decisions to adopt. Research addressing group decision making in multi-objective situations is in its second decade (Nunamaker, 1989), yet the development and use of negotiation support systems to facilitate and help guide multi-party negotiations is a relatively new field (Jelassi and Foroughi, 1989). Figure 3.1. illustrates how decision support systems have become more specialized during the last decade and where negotiation support systems fit into this acronym timeline (Thiessen et al., 1998). Negotiation support systems can be categorized according to their functions either as “negotiation preparation systems” supporting a pre-negotiation strategic planning stage, or as “negotiation information management systems” (Gauvin et al., 1990) facilitating negotiations in real time. Numerous development efforts are underway in each of the various kinds of negotiation support systems (NSS) described above (for example, Harvard, 1994). NSS cover a wide range of individual and group decision support techniques. Kersten (1998) presented the development of a web-based NSS called INSPIRE (InterNeg Support Programme for Intercultural research). In the model, conjoint analysis technique has been used to construct utility functions that users employ to offer construction and evaluation. The system allows for the verification of compromise efficiency, provides graphical representation of negotiation dynamics, and
23
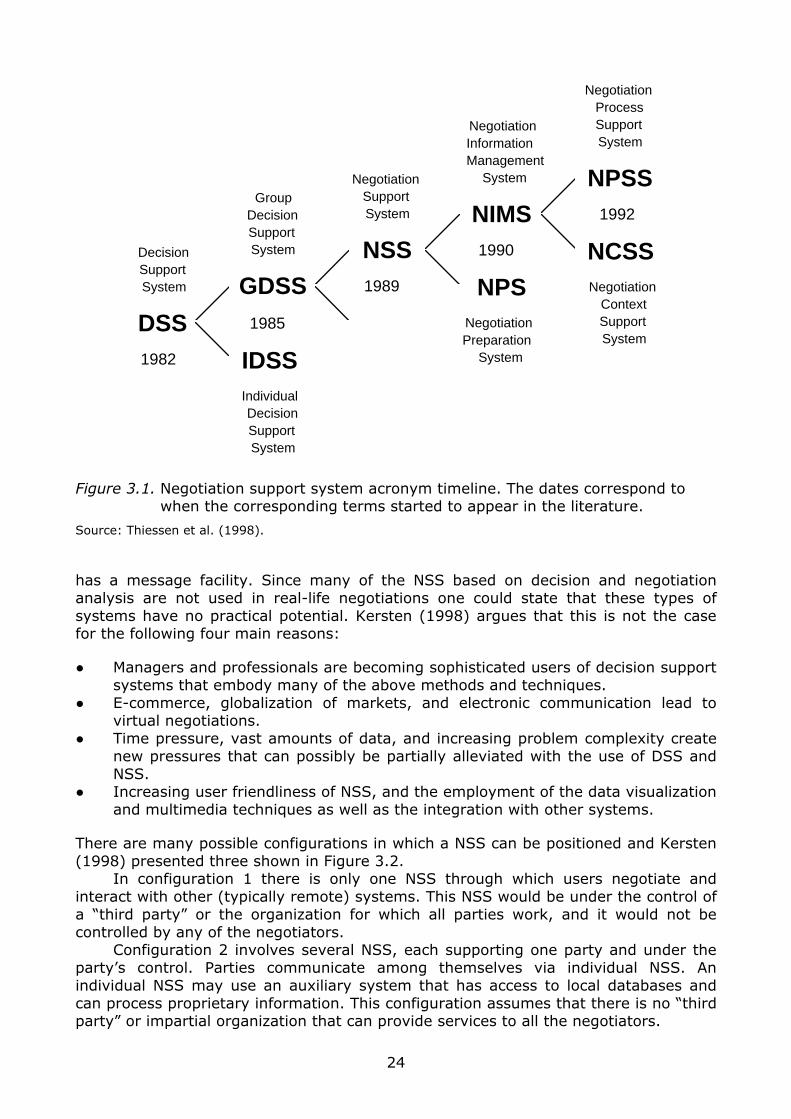
DSS
IDSS
GDSS
NSS NCSS
NPSS
1982
1985
1989
1990
NPS
NIMSDecision Support System
Individual Decision Support System
Group Decision Support System
Negotiation Support System
Negotiation Preparation
System
Negotiation Context Support System
Negotiation Process Support System
1992
Negotiation Information Management
System
Figure 3.1. Negotiation support system acronym timeline. The dates correspond to when the corresponding terms started to appear in the literature.
Source: Thiessen et al. (1998).
has a message facility. Since many of the NSS based on decision and negotiation analysis are not used in real-life negotiations one could state that these types of systems have no practical potential. Kersten (1998) argues that this is not the case for the following four main reasons:
● Managers and professionals are becoming sophisticated users of decision support systems that embody many of the above methods and techniques.
● E-commerce, globalization of markets, and electronic communication lead to virtual negotiations.
● Time pressure, vast amounts of data, and increasing problem complexity create new pressures that can possibly be partially alleviated with the use of DSS and NSS.
● Increasing user friendliness of NSS, and the employment of the data visualization and multimedia techniques as well as the integration with other systems.
There are many possible configurations in which a NSS can be positioned and Kersten (1998) presented three shown in Figure 3.2. In configuration 1 there is only one NSS through which users negotiate and interact with other (typically remote) systems. This NSS would be under the control of a “third party” or the organization for which all parties work, and it would not be controlled by any of the negotiators. Configuration 2 involves several NSS, each supporting one party and under the party’s control. Parties communicate among themselves via individual NSS. An individual NSS may use an auxiliary system that has access to local databases and can process proprietary information. This configuration assumes that there is no “third party” or impartial organization that can provide services to all the negotiators.
24
Auxiliary system
Domain system
Negotiator NSS
Figure 3.2. Three NSS configurations
Source: After Kersten (1998).
Configuration 3 also involves several NSS. One of them, however, supports the overall negotiation process: it may be used for the purpose of communication and common repository of messages and offers. INSS (InterNeg Negotiation Support System) is a web-based negotiation support system. It contains a facility for specification and assessment of preferences, an internal messaging system, and graphical displays of the negotiation progress (Kersten and Noronha, 1997). INSS can also act as an NSS and support and facilitate real-life negotiations. The system is designed so that two parties who can agree on the issues and the possible options for those issues can negotiate over the web. This is an obvious advantage when the parties are widely separated and may have difficulty arranging meetings. Using INSS is also helpful when post-settlement improvement is likely.
3.5.4. Negotiation Process Systems (NPS)/Negotiation Process Support Systems
As shown in Figure 3.1, negotiation information management systems can be classified as either “context support systems” or “process support systems” (Thiessen et al., 1998). Context models focus on the behavior of the system being designed, managed, or operated. Such models are used to answer questions about the performance of, or impacts resulting from, the system given any particular decision regarding its design, management, or operation. Programs developed by the US Army Corps of Engineers’ Hydraulic Engineering Center such as HEC-HMS, HEC-RAS, and HEC-5 are used to model runoff, create backwater profiles and analyze flood flows, and understand behavior in reservoirs. These models address the context of a water resources design, management, or operations problem: the system itself. They provide support necessary for understanding the physical system and evaluating proposed on-the-ground changes, and it was in this capacity that they were first incorporated into problem-solving strategies. Generally, context support models are developed by experts and must be run by experts to provide output to the process. RiverWare and IRAS are examples of context support modeling systems. Process models are concerned with the dynamics or procedure of the negotiation process rather than with the performance or impacts resulting from the water resource system itself (Thiessen et al., 1998). Their goal is to identify solutions that are mutually acceptable, and possibly better than would have been found without their use. Process support can be designed for individual use, supporting either a
25
mediator/facilitator, or a party in the negotiation. It is also possible for a process support system to assist all parties in a dispute, with the computer acting as a neutral facilitator of exchange among the interests. ICANS is an example of a process support system with application to water resource conflicts. These systems are designed to assist the process of negotiation by increasing the likelihood of identifying one or more mutually acceptable proposals when a potential region of agreement exists. Sometimes they can help identify better solutions than would have been found without their use (Antrim, 1986). The majority of current process support systems reported in the literature are still in the conceptual stage or are, at best, “backroom processors” playing a relatively passive role in the negotiation process (Foroughi and Jelassi, 1990; Anson and Jelassi, 1990; Jelassi et al., 1990). Nunamaker (1989) reports that most working systems are single workstations that support a professional mediator rather than the negotiating parties directly. Further work is needed before these models can substantially aid negotiating parties in a complex real-world setting (Jelassi et al., 1990; Teich et al., 1995). A system designed to address a water resource conflict can contain elements of both context and process support. This combination produces a wide spectrum, ranging from dispute resolution systems that use context models as analysis tools, to modeling techniques with elements of both context and process and a supporting dispute system design. Examples of integrated systems include shared vision modeling using STELLA®II as practiced by the University of Washington, USA, and flexible process design involving OASIS with OCL™, a product of Water Resource Management, Inc., USA. ICANS, an interactive computer-assisted negotiation support system, was developed specifically for use by professional mediators or facilitators to directly define and evaluate possible settlements in multi-issue, multi-party negotiations (Thiessen et al., 1998). It can be used on a shared computer or on a network, and identifies and evaluates alternatives based on confidential information on interests and values provided by each party.
3.5.5. Collaborative Planning Approach
A collaborative planning approach would help to alleviate conflicts over water resources if adopted in time. Bender and Simonovic (1996) presented a “decision support system” (DSS) for collaborative group planning of hydroelectric development projects. The approach considers systems analysis on a higher level as a driving principle of collaborative public decision making, which benefits from the conceptualization of stakeholder participation. This work illustrates the important conceptual role of formal systems analysis in public decision making. Systems involving human frailties will always be complex and that complexity will always be intimidating from a systems perspective. However, systems thinking is evolving into concepts that may help in understanding how to approach complex technical problems that affect or involve people. Bender and Simonovic (1996) discussed two types of dynamic modeling paradigms understood by systems analysis. One is negative feedback, which forces system transformation toward an external goal. The second paradigm is the concept of positive feedback. Positive feedback behaves in a similar manner to many natural growth processes in which the system feedback instigates growth away from an external goal or reference point. A positive feedback systems approach initiates changes to a proposal away from an external goal, reference point of conflict, or disjoint value systems. Its direction and pace are flexible, which may have desirable properties for group behavior. A framework for planning hydroelectric water management policy is demonstrated as a positive system feedback approach. The decision support system is
26
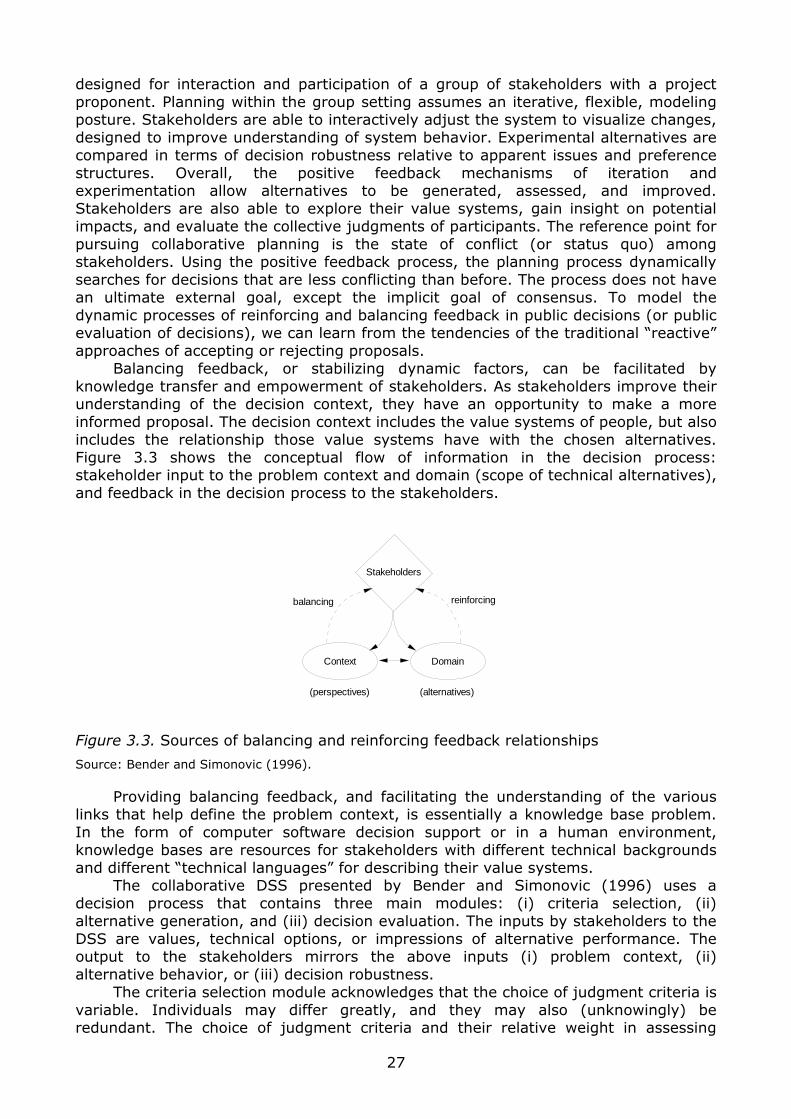
designed for interaction and participation of a group of stakeholders with a project proponent. Planning within the group setting assumes an iterative, flexible, modeling posture. Stakeholders are able to interactively adjust the system to visualize changes, designed to improve understanding of system behavior. Experimental alternatives are compared in terms of decision robustness relative to apparent issues and preference structures. Overall, the positive feedback mechanisms of iteration and experimentation allow alternatives to be generated, assessed, and improved. Stakeholders are also able to explore their value systems, gain insight on potential impacts, and evaluate the collective judgments of participants. The reference point for pursuing collaborative planning is the state of conflict (or status quo) among stakeholders. Using the positive feedback process, the planning process dynamically searches for decisions that are less conflicting than before. The process does not have an ultimate external goal, except the implicit goal of consensus. To model the dynamic processes of reinforcing and balancing feedback in public decisions (or public evaluation of decisions), we can learn from the tendencies of the traditional “reactive” approaches of accepting or rejecting proposals. Balancing feedback, or stabilizing dynamic factors, can be facilitated by knowledge transfer and empowerment of stakeholders. As stakeholders improve their understanding of the decision context, they have an opportunity to make a more informed proposal. The decision context includes the value systems of people, but also includes the relationship those value systems have with the chosen alternatives. Figure 3.3 shows the conceptual flow of information in the decision process: stakeholder input to the problem context and domain (scope of technical alternatives), and feedback in the decision process to the stakeholders.
reinforcingbalancing
Stakeholders
Context Domain
(perspectives) (alternatives)
Figure 3.3. Sources of balancing and reinforcing feedback relationships
Source: Bender and Simonovic (1996).
Providing balancing feedback, and facilitating the understanding of the various links that help define the problem context, is essentially a knowledge base problem. In the form of computer software decision support or in a human environment, knowledge bases are resources for stakeholders with different technical backgrounds and different “technical languages” for describing their value systems. The collaborative DSS presented by Bender and Simonovic (1996) uses a decision process that contains three main modules: (i) criteria selection, (ii) alternative generation, and (iii) decision evaluation. The inputs by stakeholders to the DSS are values, technical options, or impressions of alternative performance. The output to the stakeholders mirrors the above inputs (i) problem context, (ii) alternative behavior, or (iii) decision robustness. The criteria selection module acknowledges that the choice of judgment criteria is variable. Individuals may differ greatly, and they may also (unknowingly) be redundant. The choice of judgment criteria and their relative weight in assessing
27
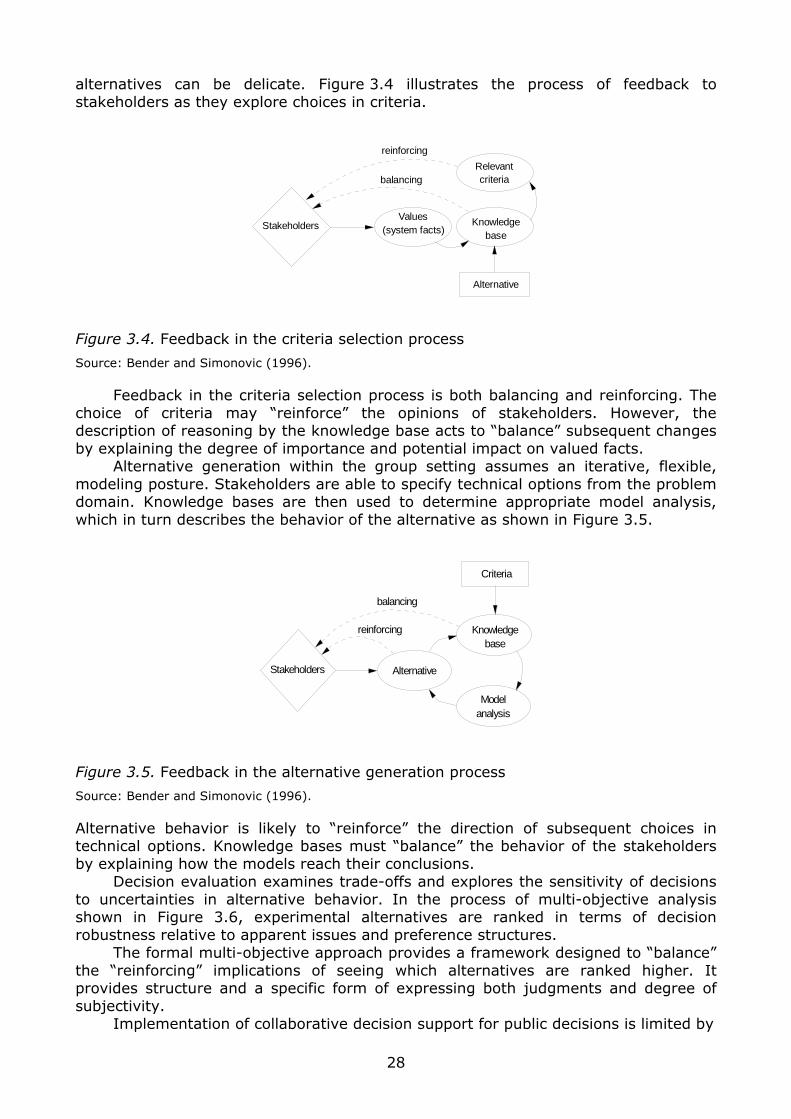
alternatives can be delicate. Figure 3.4 illustrates the process of feedback to stakeholders as they explore choices in criteria.
reinforcing
balancing
StakeholdersValues
(system facts)Knowledge
base
Relevantcriteria
Alternative
Figure 3.4. Feedback in the criteria selection process
Source: Bender and Simonovic (1996).
Feedback in the criteria selection process is both balancing and reinforcing. The choice of criteria may “reinforce” the opinions of stakeholders. However, the description of reasoning by the knowledge base acts to “balance” subsequent changes by explaining the degree of importance and potential impact on valued facts. Alternative generation within the group setting assumes an iterative, flexible, modeling posture. Stakeholders are able to specify technical options from the problem domain. Knowledge bases are then used to determine appropriate model analysis, which in turn describes the behavior of the alternative as shown in Figure 3.5.
reinforcing
balancing
Stakeholders Alternative
Knowledgebase
Modelanalysis
Criteria
Figure 3.5. Feedback in the alternative generation process
Source: Bender and Simonovic (1996).
Alternative behavior is likely to “reinforce” the direction of subsequent choices in technical options. Knowledge bases must “balance” the behavior of the stakeholders by explaining how the models reach their conclusions. Decision evaluation examines trade-offs and explores the sensitivity of decisions to uncertainties in alternative behavior. In the process of multi-objective analysis shown in Figure 3.6, experimental alternatives are ranked in terms of decision robustness relative to apparent issues and preference structures. The formal multi-objective approach provides a framework designed to “balance” the “reinforcing” implications of seeing which alternatives are ranked higher. It provides structure and a specific form of expressing both judgments and degree of subjectivity. Implementation of collaborative decision support for public decisions is limited by
28
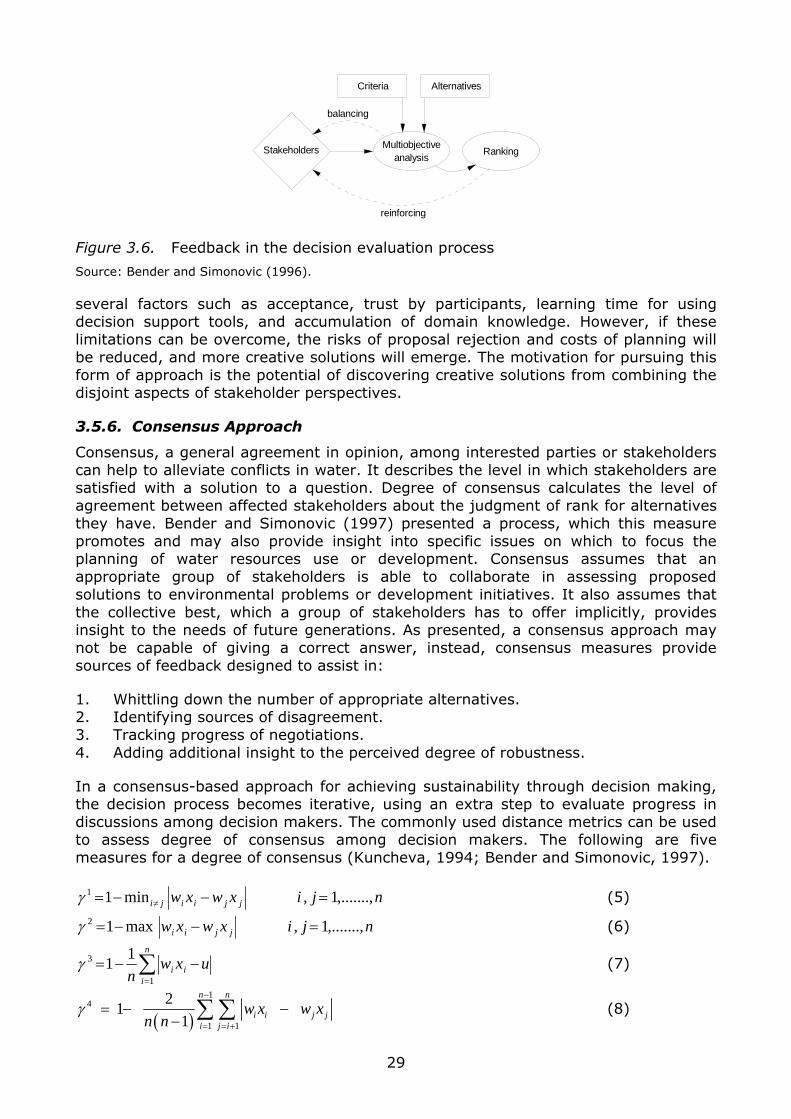
reinforcing
balancing
Stakeholders Multiobjectiveanalysis
Ranking
Criteria Alternatives
Figure 3.6. Feedback in the decision evaluation process
Source: Bender and Simonovic (1996).
several factors such as acceptance, trust by participants, learning time for using decision support tools, and accumulation of domain knowledge. However, if these limitations can be overcome, the risks of proposal rejection and costs of planning will be reduced, and more creative solutions will emerge. The motivation for pursuing this form of approach is the potential of discovering creative solutions from combining the disjoint aspects of stakeholder perspectives.
3.5.6. Consensus Approach
Consensus, a general agreement in opinion, among interested parties or stakeholders can help to alleviate conflicts in water. It describes the level in which stakeholders are satisfied with a solution to a question. Degree of consensus calculates the level of agreement between affected stakeholders about the judgment of rank for alternatives they have. Bender and Simonovic (1997) presented a process, which this measure promotes and may also provide insight into specific issues on which to focus the planning of water resources use or development. Consensus assumes that an appropriate group of stakeholders is able to collaborate in assessing proposed solutions to environmental problems or development initiatives. It also assumes that the collective best, which a group of stakeholders has to offer implicitly, provides insight to the needs of future generations. As presented, a consensus approach may not be capable of giving a correct answer, instead, consensus measures provide sources of feedback designed to assist in:
1. Whittling down the number of appropriate alternatives. 2. Identifying sources of disagreement. 3. Tracking progress of negotiations. 4. Adding additional insight to the perceived degree of robustness.
In a consensus-based approach for achieving sustainability through decision making, the decision process becomes iterative, using an extra step to evaluate progress in discussions among decision makers. The commonly used distance metrics can be used to assess degree of consensus among decision makers. The following are five measures for a degree of consensus (Kuncheva, 1994; Bender and Simonovic, 1997).
njixwxw jjiiji ,.......,1,min11 =−−= ≠γ (5)
njixwxw jjii ,.......,1,max12 =−−=γ (6)
∑=
−−=n
iii uxw
n 1
3 11γ (7)
( )1
4
1 1
21
1
n n
i i j ji j i
w x w xn n
γ−
= = +
= − −− ∑ ∑ (8)
29
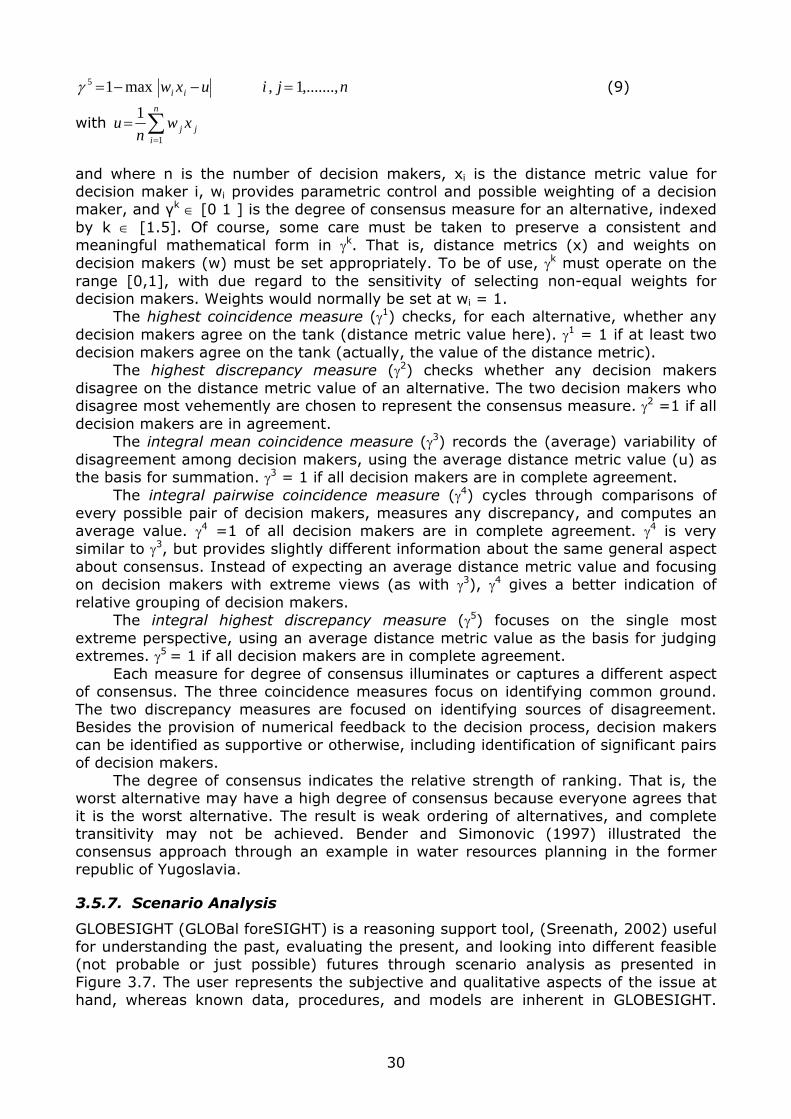
njiuxw ii ,.......,1,max15 =−−=γ (9)
with j
n
ij xw
nu ∑
=
=1
1
and where n is the number of decision makers, xi is the distance metric value for decision maker i, wi provides parametric control and possible weighting of a decision maker, and γk ∈ [0 1 ] is the degree of consensus measure for an alternative, indexed by k ∈ [1.5]. Of course, some care must be taken to preserve a consistent and meaningful mathematical form in γk. That is, distance metrics (x) and weights on decision makers (w) must be set appropriately. To be of use, γk must operate on the range [0,1], with due regard to the sensitivity of selecting non-equal weights for decision makers. Weights would normally be set at wi = 1. The highest coincidence measure (γ1) checks, for each alternative, whether any decision makers agree on the tank (distance metric value here). γ1 = 1 if at least two decision makers agree on the tank (actually, the value of the distance metric). The highest discrepancy measure (γ2) checks whether any decision makers disagree on the distance metric value of an alternative. The two decision makers who disagree most vehemently are chosen to represent the consensus measure. γ2 =1 if all decision makers are in agreement. The integral mean coincidence measure (γ3) records the (average) variability of disagreement among decision makers, using the average distance metric value (u) as the basis for summation. γ3 = 1 if all decision makers are in complete agreement. The integral pairwise coincidence measure (γ4) cycles through comparisons of every possible pair of decision makers, measures any discrepancy, and computes an average value. γ4 =1 of all decision makers are in complete agreement. γ4 is very similar to γ3, but provides slightly different information about the same general aspect about consensus. Instead of expecting an average distance metric value and focusing on decision makers with extreme views (as with γ3), γ4 gives a better indication of relative grouping of decision makers. The integral highest discrepancy measure (γ5) focuses on the single most extreme perspective, using an average distance metric value as the basis for judging extremes. γ5 = 1 if all decision makers are in complete agreement. Each measure for degree of consensus illuminates or captures a different aspect of consensus. The three coincidence measures focus on identifying common ground. The two discrepancy measures are focused on identifying sources of disagreement. Besides the provision of numerical feedback to the decision process, decision makers can be identified as supportive or otherwise, including identification of significant pairs of decision makers. The degree of consensus indicates the relative strength of ranking. That is, the worst alternative may have a high degree of consensus because everyone agrees that it is the worst alternative. The result is weak ordering of alternatives, and complete transitivity may not be achieved. Bender and Simonovic (1997) illustrated the consensus approach through an example in water resources planning in the former republic of Yugoslavia.
3.5.7. Scenario Analysis
GLOBESIGHT (GLOBal foreSIGHT) is a reasoning support tool, (Sreenath, 2002) useful for understanding the past, evaluating the present, and looking into different feasible (not probable or just possible) futures through scenario analysis as presented in Figure 3.7. The user represents the subjective and qualitative aspects of the issue at hand, whereas known data, procedures, and models are inherent in GLOBESIGHT.
30
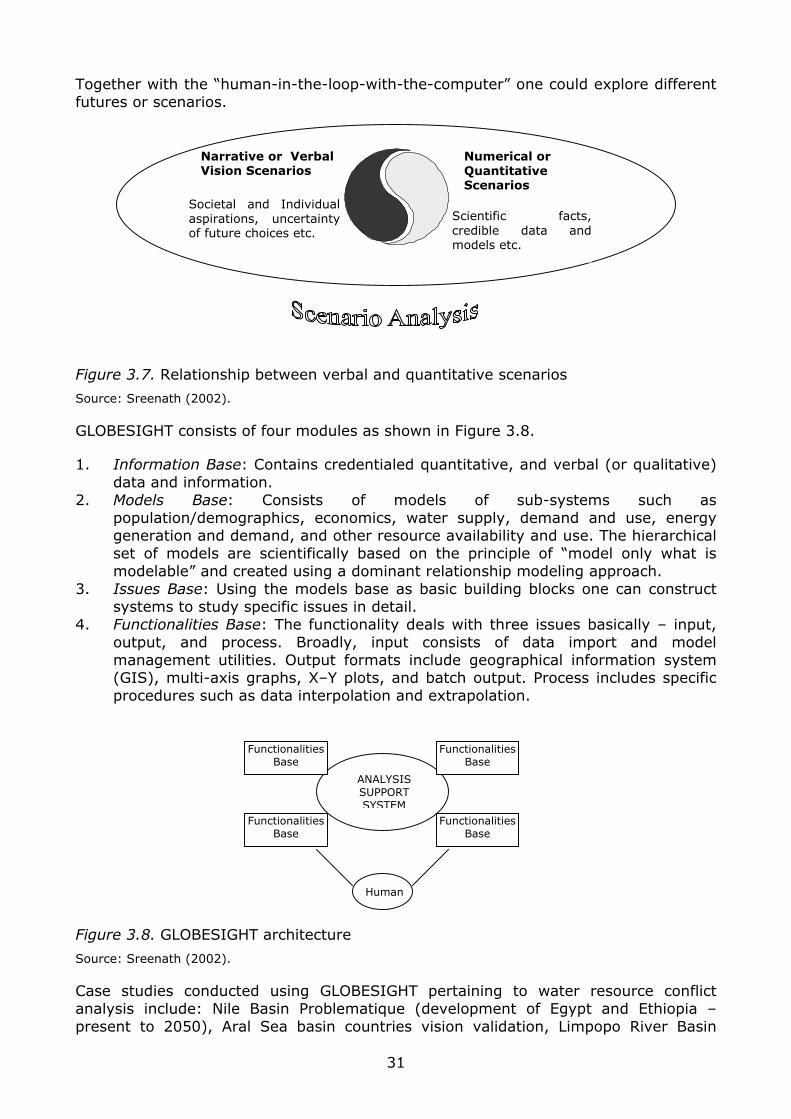
Together with the “human-in-the-loop-with-the-computer” one could explore different futures or scenarios.
Scientific facts,credible data andmodels etc.
Societal and Individualaspirations, uncertaintyof future choices etc.
Numerical or Quantitative Scenarios
Narrative or Verbal Vision Scenarios
Figure 3.7. Relationship between verbal and quantitative scenarios
Source: Sreenath (2002).
GLOBESIGHT consists of four modules as shown in Figure 3.8.
1. Information Base: Contains credentialed quantitative, and verbal (or qualitative) data and information.
2. Models Base: Consists of models of sub-systems such as population/demographics, economics, water supply, demand and use, energy generation and demand, and other resource availability and use. The hierarchical set of models are scientifically based on the principle of “model only what is modelable” and created using a dominant relationship modeling approach.
3. Issues Base: Using the models base as basic building blocks one can construct systems to study specific issues in detail.
4. Functionalities Base: The functionality deals with three issues basically – input, output, and process. Broadly, input consists of data import and model management utilities. Output formats include geographical information system (GIS), multi-axis graphs, X–Y plots, and batch output. Process includes specific procedures such as data interpolation and extrapolation.
FunctionalitiesBase
ANALYSIS SUPPORT SYSTEM
Human
FunctionalitiesBase
FunctionalitiesBase
FunctionalitiesBase
Figure 3.8. GLOBESIGHT architecture
Source: Sreenath (2002).
Case studies conducted using GLOBESIGHT pertaining to water resource conflict analysis include: Nile Basin Problematique (development of Egypt and Ethiopia – present to 2050), Aral Sea basin countries vision validation, Limpopo River Basin
31
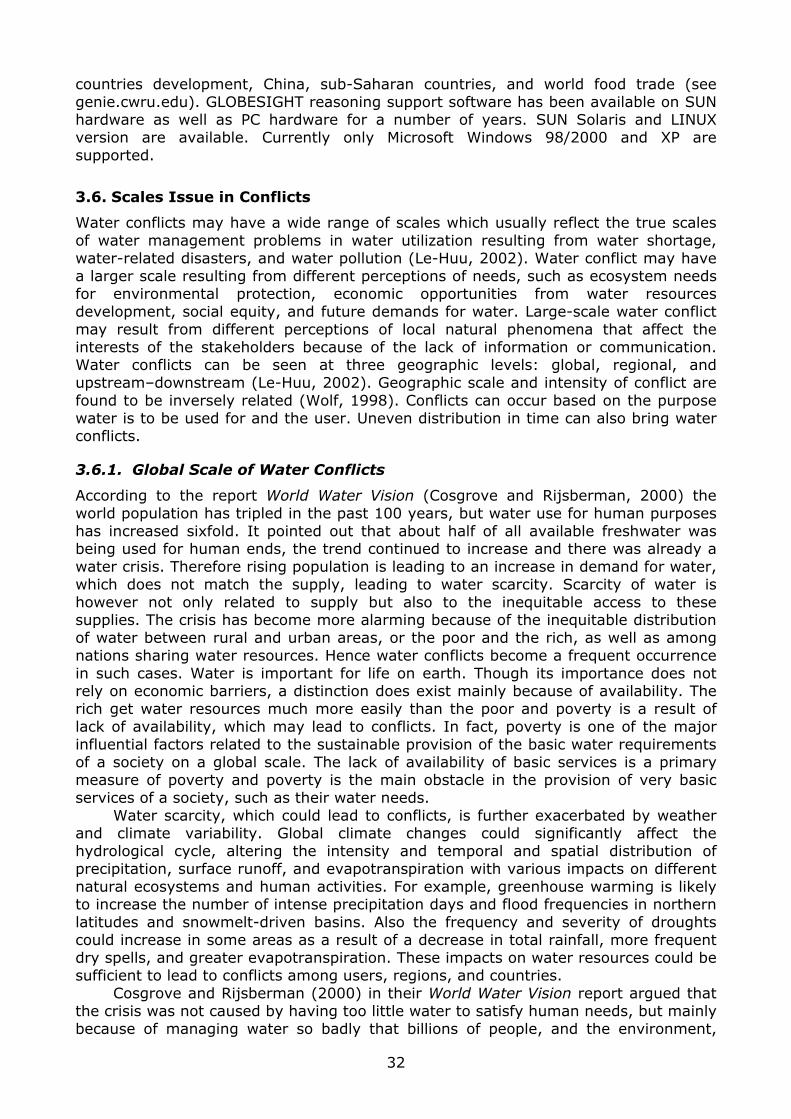
countries development, China, sub-Saharan countries, and world food trade (see genie.cwru.edu). GLOBESIGHT reasoning support software has been available on SUN hardware as well as PC hardware for a number of years. SUN Solaris and LINUX version are available. Currently only Microsoft Windows 98/2000 and XP are supported.
3.6. Scales Issue in Conflicts
Water conflicts may have a wide range of scales which usually reflect the true scales of water management problems in water utilization resulting from water shortage, water-related disasters, and water pollution (Le-Huu, 2002). Water conflict may have a larger scale resulting from different perceptions of needs, such as ecosystem needs for environmental protection, economic opportunities from water resources development, social equity, and future demands for water. Large-scale water conflict may result from different perceptions of local natural phenomena that affect the interests of the stakeholders because of the lack of information or communication. Water conflicts can be seen at three geographic levels: global, regional, and upstream–downstream (Le-Huu, 2002). Geographic scale and intensity of conflict are found to be inversely related (Wolf, 1998). Conflicts can occur based on the purpose water is to be used for and the user. Uneven distribution in time can also bring water conflicts.
3.6.1. Global Scale of Water Conflicts
According to the report World Water Vision (Cosgrove and Rijsberman, 2000) the world population has tripled in the past 100 years, but water use for human purposes has increased sixfold. It pointed out that about half of all available freshwater was being used for human ends, the trend continued to increase and there was already a water crisis. Therefore rising population is leading to an increase in demand for water, which does not match the supply, leading to water scarcity. Scarcity of water is however not only related to supply but also to the inequitable access to these supplies. The crisis has become more alarming because of the inequitable distribution of water between rural and urban areas, or the poor and the rich, as well as among nations sharing water resources. Hence water conflicts become a frequent occurrence in such cases. Water is important for life on earth. Though its importance does not rely on economic barriers, a distinction does exist mainly because of availability. The rich get water resources much more easily than the poor and poverty is a result of lack of availability, which may lead to conflicts. In fact, poverty is one of the major influential factors related to the sustainable provision of the basic water requirements of a society on a global scale. The lack of availability of basic services is a primary measure of poverty and poverty is the main obstacle in the provision of very basic services of a society, such as their water needs. Water scarcity, which could lead to conflicts, is further exacerbated by weather and climate variability. Global climate changes could significantly affect the hydrological cycle, altering the intensity and temporal and spatial distribution of precipitation, surface runoff, and evapotranspiration with various impacts on different natural ecosystems and human activities. For example, greenhouse warming is likely to increase the number of intense precipitation days and flood frequencies in northern latitudes and snowmelt-driven basins. Also the frequency and severity of droughts could increase in some areas as a result of a decrease in total rainfall, more frequent dry spells, and greater evapotranspiration. These impacts on water resources could be sufficient to lead to conflicts among users, regions, and countries. Cosgrove and Rijsberman (2000) in their World Water Vision report argued that the crisis was not caused by having too little water to satisfy human needs, but mainly because of managing water so badly that billions of people, and the environment,
32
suffered greatly. The root cause of the global scale of water conflicts is because of the poor management of water resources and the increasing disparity in the economic and social conditions between areas, countries, and regions. There were three major groups of global-scale water conflicts resulting from the following three issues: (1) lack of accessible water, (2) increasing environmental concern, and (3) the economic value of water.
3.6.1.1. Lack of Accessible Water
According to recent WMO/UNESCO estimates, the total volume of accessible water is less than 0.3 percent of the global water resources. The lack of accessible water is caused by the shortage of water in terms of both quantity and quality. This is largely as a result of poor water allocation, wasteful use of the resource, and lack of adequate management action.
3.6.1.2. Increasing Environmental Concerns
Water resources ecosystems are increasingly recognized for the environmental goods and services they provide through healthy catchments. This trend has built up into global concerns for water quality protection and biodiversity conservation through a series of conservation programs, including the establishment of natural reserves and protected areas. In many countries, especially in developing countries, these movements have often been seen as obstacles to the economic development of river basins. The tension tends to increase when opportunities for development are severely constrained by these environmental concerns.
3.6.1.3. Economic Value of Water
The scarcity of freshwater in the global system has been recognized as a major worldwide concern with respect to food security and, therefore, to the well being of humankind. Water is therefore seen not only as a social good but is increasingly recognized as having economic value. It is the scarcity of water and not merely its importance for existence that gives it its value. Where water is not scarce, it is not valuable (Fisher, 2001). However, water is a basic commodity and therefore, obtaining it through markets is one way of tackling the scarcity (Howe et al., 1986) though it possesses both desirable and undesirable attributes. Besides, more emphasis should be given for the allocation of existing water supplies more efficiently to minimize the burden to the poor.
3.6.2. Regional Scale of Water Conflicts
Water conflicts on a regional scale may come from three main categories: differences in water resources endowment, transboundary pollution, and disputes in the management of international river basins. While water conflicts in the first two categories are less common, those in the third category are more frequent. The different levels of water resources endowment have always been the main reason for the disparity in the distribution of population among areas of a country or in a region. People tend to settle in areas with rich water resources where urban settlements continue to grow. Within a country, various measures, including economic incentives and development action, can be taken to minimize the impact of the differences in water resources endowment on the social and economic conditions between regions, although such measures may lead to other issues in water management. For an international region, options are usually limited and the discrepancy in resources can easily be conceived as better opportunities for development. This perception could lead, on the one hand, to explosive political issues, such as illegal activities to make use of the rich water resources, including the
33
diversion of water resources or illegal fishing, and, on the other, to undue pressure to share those resources by using different control measures based on monopolistic market opportunities or transit control. Transboundary pollution is becoming more and more frequent with higher levels of development intensity. Among the prominent issues of transboundary pollution are those related to acid rain caused by industrial development or the construction of major coal-fired thermal power plants. Intensive agricultural development and different industrial waste disposal schemes may lead to severe pollution of groundwater aquifers that extend beyond national boundaries. In most cases, transboundary pollution also affects the country of the source and this leads to better opportunities to find suitable solutions to control and resolve the problems. With respect to the third category of conflicts, on the regional scale, there are about 260 major river basins and a number of the major groundwater aquifers cross national boundaries. These river basins comprise about 40 percent of the total land area of the world, which includes more than 60 per cent of the area on the continents of Africa, Asia, and South America. Most of these river basins are areas of potential conflict, especially in the large river basins and those shared by several countries. Examples of conflicts on a regional scale of varied intensity can easily be found among these international river basins.
3.6.3. Upstream and Downstream Relationship
The relationship between upstream and downstream states is usually the principal root cause of water conflicts in the management of international river basins. While water is a resource flowing from one place to another, it carries the impact of human intervention between places. Furthermore, the variability in time of water quantity and quality adds complexity in the management of international water resources and confusion to the perception of changes from human intervention. This is especially true when a river flows between areas of different climate conditions, such as dry and wet regions of a river basin. Depending on the relative importance of the impact of the changes on the economic and social conditions, water conflicts may develop from a bilateral issue into a river basin problem. While it may be difficult to forecast the flow conditions with accuracy and to achieve good understanding on the part of the public about the river regime under different conditions, it is necessary to ensure accessibility to accurate information to all and to provide the public with a complete picture of the river system; only on the basis of equal access to information can mutual understanding and trust be developed to form the basis for conflict prevention.
3.6.4. Conflicts Between Purposes and Users
Water is a vital resource for human survival and economic development. Multi-interests of water resources include its utilization in water supply and sanitation, agriculture, industry, urban development, hydropower generation, fisheries, transportation, recreation, and low and flatlands management. As populations and economies grow, water demand for diverse interests increases while the availability of the resource remains constant, which may engender water use conflicts. In particular, when water is used from a common source for conflicting interests, such as water supply for irrigation purposes and industrial requirements, dispute can erupt among users.
3.6.5. Conflicts in Time
Freshwater availability, both in the forms of precipitation and runoff, is very unevenly distributed throughout the year in almost all regions of the world. About 60 to 70 percent of runoff is generated during flood periods and therefore values for renewable
34
water resources vary noticeably during a year. Unevenness in the distribution of river runoff during a year may result in crisis situations. Further, year-to-year water variability within the regions can be quite significant. This is especially so in the arid and semi-arid regions where the actual values are small. Here, water availability for individual years can be 1.5 to 2 times less than the averages over a long period, whereas for wet regions this difference is in general, within 15 to 25 percent. This temporal variation of water availability may be overcome by creating reservoirs. Thus water could be stored when available in excess during high flow periods and used when it is needed during droughts. Besides, reservoirs facilitate reducing damages due to floods, by temporarily storing the high flood flows.
3.7. Integrated Water Management: Multisectoral
Integrated water resources management has been too often ignored in the past, and solutions to water management related problems have been sought through largely technical means. “Integrated” means socio-technical; not merely taking into consideration socioeconomic factors or technical factors individually, but integrating both aspects in the process of the management of water resources in a basin. Equally, we must take into account not only human water needs in setting our goals, but also the maintenance of the required ecosystem balance. Integrated water management takes into account all inputs, all forms of utilization, and all protection needs as well as political, legal, institutional, economic, social, and cultural aspects associated with water resources development. The term “integrated” most commonly refers to integration across use sectors, such as agriculture and urban water supply. However, it can also encompass a number of other divisions, including the following:
● administrative jurisdictions ● ground and surface water ● upstream and downstream reaches ● environmental and human uses ● supply and demand management ● water quantity and quality ● land and water use ● transboundary uses.
The approach seeks a solution to the water management problem by promoting integration across all the relevant sectors given above. It provides a framework to manage competition for limited water resources and the potential conflicts and inefficiencies. Further, it recognizes a more participatory approach to development and management of water resources and the economic value of water. In addition, integrated water resources management guarantees the maintenance of essential forms of water utilization over long periods of time, or sustainable use of water. Conflicts in the water management of international river basins can be perceived as interaction of management issues in the following interdependent processes: integrated water resources management, international cooperation, and conflict management processes. Conflicts may appear in many forms as part of the integrated water resources management process, at different scales in the context of international cooperation, and in varying intensity in terms of conflict management. Conflict management requires partnerships among all the stakeholders involved in a water resources development activity. The multisectoral partnerships ensure the essential understanding of the multiple dimensions of a specific conflict and ensure adequate capacity building required. It will create lasting forms of conflict prevention. Included in multisectoral partnerships are governments, international organizations,
35
NGOs, local and tribal groups, business and industry, academia, and other actors. It is doubtful that sustainable solutions can be built upon anything but a multisectoral foundation.
3.7.1. Water Conflicts in the Integrated Water Resources Management Process
Water management is becoming more and more complex along with the increasing complexity of the economic and social development process. As integrated water resources management is itself a process, conflicts in water management evolve with the scope and intensity of the interaction between human beings and nature, among individuals, and between communities. Conflicts in the integrated water resources management process can therefore be seen from different perspectives: environmental, economic and social, or political. The effectiveness and efficiency of the integration of water resources management into the economic and social development process of the countries can be measured through the following four aspects: social context, economic aspects, legal and institutional framework, and development perspectives.
3.7.1.1. Social Conflicts of Water Use: Equitability and Ecosystem Efficiency
Water has long been perceived as a social good, and interaction between human beings and nature has, until recently, been based mostly on the sectoral perception of water resources ecosystems. This has resulted in various forms of water conflicts, which reflect different perceptions from the sectoral needs for water or from different concepts of water-use priority in the process of social and economic development. In terms of an integrated water resources management process, these social conflicts of water management form the most important obstacle to the achievement of water-use efficiency in a water resources ecosystem. The social perception of water and water rights varies from one country to another and even from one community to another. These human factors have contributed to the inefficient division of a natural hydrological unit and to the complexity of the integrated water resources management of these natural hydrological units. Integrated management requires the adoption of integrated river basin management, for which water resources must be considered an integral part of a given river basin, aquifer, or watershed as a unitary resource. In the management of this unitary resource, the tendency towards unilateral exploitation of water among neighbors would need to be avoided so as to provide a cost-effective way to increase freshwater supplies. These human factors, together with cultural perceptions of water use, have aggravated institutional obstacles to integrated water resources management. Social and institutional obstacles to integrated water resources management will be greater for international river basins when different cultures, and even countries with historical animosities, are involved. In such a context, it will be necessary to prevent social conflicts through the prioritization of the social and ecosystem needs for water by the formalization of historic patterns of use among all parties, as part of short-term goals, and through the establishment of a shared vision for integrated river basin management as part of long-term goals for ecosystem efficiency.
3.7.1.2. Economic Conflicts in Water Use: Market Efficiency
Apart from satisfying basic human needs and health, water resources are essential for food production, energy, the restoration and maintenance of ecosystems, and for social and economic development in general. While agriculture accounts for a major part of global freshwater use and is necessary to ensure food security, the high economic growth expected in the developing countries calls for better value-added utilization of water resources. It is imperative that freshwater resources development,
36
use, management, and protection be planned in an integrated manner, taking into account both the short- and long-term needs of the social dimension and the stability and sustainability of the social and economic development process. Competition for limited water resources increasingly occurs among agricultural, rural, urban, industrial, and environmental users. At the same time, disparity in the economic conditions between the urban and rural areas in a country and among countries continues to increase. Questions of economic efficiency in water use will eventually grow and assume greater significance in conflict management in water resources development. Effective use of the market mechanism could contribute to conflict prevention in water management by making use of increased opportunities and incentives to develop, transfer, and use a resource in ways that would benefit all parties. On the other hand, the inability to integrate water resources management into the economic and social development process will lead to the aggravation of conflicts in water management. These conflicts are known as “economic conflicts of water management.” In order to avoid them, it is necessary to create conditions for an efficient environment for the economic use of water, including a well-defined legal and institutional framework for water utilization and conditions for a fair and equitable sharing of the beneficial use of the water resources.
3.7.1.3. Legal Conflicts: Rules in Water Utilization and Principles for Water Allocation
Application of the integrated water resources management concept to international river basins usually faces the most difficult obstacle: the legal context of water use. From an ecosystem point of view, the legal aspect of international river basins is the main source of inefficiency and conflicts in water management. These conflicts reflect the multitude of problems in the legal aspects of water resources management that may come from issues related to the allocation of water resources within a country or the management or sharing of water among the riparian countries of an international river basin. The lack of a universal system of water rights in the management of international river basins continues to be a major obstacle to the efficient and optimum utilization of shared water resources and to the resolution of water conflicts.
3.8. Stakeholder Participation: Shared Vision Approaches
Shared vision modeling is a disciplined approach to developing water resources models for conflict resolution. Shared vision modeling requires both the use of time-tested planning procedures and the active participation of those likely to be affected by a water resources plan. In simple terms, shared vision models are computer models developed by stakeholders, water managers, and water planners that incorporate planning objectives and performance measures into a framework allowing the generation and evaluation of alternatives in a manner that facilitates conflict resolution. These models typically contain social, economic, and environmental impacts as well as hydrologic and hydraulic analysis. Implementing integrated water resources management (IWRM) and resolving conflicts through stakeholder participation is not an easy task. It requires the active support of all stakeholders and especially a will to implement on the part of governments. Commonwealth Knowledge Network reports a successful application of stakeholder participation in water conflict resolution in Barbados. Users and suppliers of water in Barbados came together to discuss water-related conflicts and recommended ways to integrate stakeholder concerns into the existing water management strategy. A decision support system was used to assist decision makers in testing different policies and scenarios, conducting sensitivity analysis and making optimal choices, and was found very useful.
37
Water resources planning and management involves numerous stakeholders (Loucks, speech at Valencia). Each stakeholder or interest group has its own objectives, interests, and agendas. The decision-making process is one of negotiation and compromise, but from it come the decisions that have the best chance of being the most effective: that is, the right decisions. So, the model should meet the information needs of all these different stakeholders to get them to believe in and accept these models and their results to reach a common shared vision. Involving stakeholders in model building accomplishes a number of things. It gives them a feeling of ownership and a much better understanding of what their model can and cannot do. If they are involved in model building, they will know the assumptions built into their model. While there may be no agreement on the best of various assumptions to make, stakeholders can learn which of those assumptions matter and which do not. In addition, just the process of model development by numerous stakeholders will create discussions that will lead toward a better understanding of everyone’s interests and concerns. Through such a model building exercise, it is just possible those involved will reach not only a better understanding of everyone’s concerns, but also a common or shared vision of at least how their environmental system (as represented by their model) works. Experience in stakeholder involvement in model building suggests such model building exercises can also help multiple stakeholders reach a consensus on how their real system should be developed and managed. Shared vision modeling/conflict resolution appears to be more promising when applied to relatively new or low intensity conflicts before legal or political alternatives have been considered or for higher-intensity conflicts where agreements have been made or incentives have been imposed to maintain broad dedication to the process (Lund and Palmer, 1997). In the United States, one of the major advocates of shared vision modeling is the US Army Corps of Engineers. They have applied an interactive general-purpose model-building platform called Stella IITM in a number of exercises where conflicts existed over the design and operation of water systems. Each of these model-building “shared-vision” exercises included numerous stakeholders together with experts in the use of Stella II. Palmer et al. (1993) reported the development and application of a “shared vision model” in the national study of water management during drought that was applied extensively in the ACT-ACF basin-wide study. The model uses graphically based computer simulation to develop easily understood analyses of the systems under study and facilitates the testing and collaborative use of the model by all those involved in the process. The advantage of these “shared vision models,” as the name implies, is that consensus in the model and in the computer results can be reached, since all parties participated in the development of the model. Understanding the stakeholders of a certain water conflict is fundamental to successful resolution of it. However, in most cases getting the less affected stakeholders to participate in the negotiations processes has been difficult. In general, only the most affected parties are interested in being involved in discussions and negotiation procedures. Shared vision modeling, like other consensus building processes, requires that there be a strong motivation among the stakeholders to develop a consensus. This usually occurs only when the parties believe they can achieve a desirable goal through consensus building that cannot otherwise be achieved. In some conflicts the number of stakeholders involved in a conflict may be high, and therefore participation of all of them in resolution processes such as public hearings would be difficult. In such cases different techniques may be required to obtain their views, such as questionnaires.
38
3.8.1. International Joint Commission in Water Resource Conflict Resolution
Many rivers and lakes lie along, or flow across, the border between Canada and the United States. The development and continued use of these water resources by both countries has given, and continues to give, rise to disputes as well as problems of mutual concern for those who live along the common frontier. The International Joint Commission (IJC), a unique international organization established by Canada and the United States under the “Boundary Waters Treaty of 1909,” has played an important role in preventing and resolving disputes in the transboundary region of these two countries (Clamen, 2002). The history of the IJC is rich in experiences derived from almost 100 years of operation dealing with over 120 issues.
3.8.1.1. The Canada–United States Boundary Region
The Canada–United States boundary extends from the Gulf of Maine westward across the continent to the straits of Juan de Fuca off the coast of British Columbia and then northward to the Beaufort Sea. This expansive region is extremely diverse in climate and ecology. Throughout most of its length, the boundary crosses or bisects natural drainage basins. Boundary waters or waters which are followed by the boundary make up almost 43 percent of the total length of the boundary.
3.8.1.2. The IJC and the 1909 Boundary Waters Treaty
Clamen (2002) presented a detailed description of the IJC and the role it played in water resource conflict assessment and resolution. The IJC was established pursuant to Article VII of the 1909 Boundary Waters Treaty between Great Britain and the United States. In 1909 Canada had not yet fully acquired an international personality and Great Britain still acted for Canada in its formal relations with other countries. Today, as a fully independent country, Canada has succeeded to Great Britain’s rights and obligations under the Treaty, which remains a cornerstone of the relationship between Canada and the United States with respect to transboundary water and environmental issues. From the beginning, the Commission’s fundamental role has been to prevent and resolve transboundary environmental and water-related disputes between the United States and Canada through processes that seek the common interest of both countries. It not only offers the two countries a flexible set of mechanisms to help them manage their relationship in the transboundary region, but also provides them with the assurance that it will reflect the shared system of principles and values recognized in the Treaty. The Commission has two primary responsibilities under the Treaty. First, the IJC acts as a quasi-judicial body to consider applications for approval to build and operate certain works in boundary waters and rivers that flow across the boundary. Second, at the request of the governments, the Commission examines and provides non-binding recommendations on transboundary issues with a view to preventing and resolving transboundary conflicts. The IJC’s Rules of Procedure allow Commissioners to appoint a Board composed of an equal number of qualified persons from each country to conduct necessary studies and to report. When a Board submits a final report, the Commission typically makes it available to governments and interested persons prior to holding public hearings. The Commission’s Boards have proven to be highly effective mechanisms for impartial, joint fact-finding and their reports have provided the basis for Commission decisions and recommendations. Examples of projects falling under IJC jurisdiction include hydropower structures at the outlets of Lakes Superior and Ontario, water control facilities on the Niagara River, and dams on the Kootenay, Columbia, Pend d’Oreille, Okanagan, Rainy, St Croix, and St John Rivers. The IJC also advises the United States and Canadian
39
governments on other environmental and natural resource matters and administers the apportionment of the waters of the St Mary and Milk Rivers (which flow through Saskatchewan, Alberta, and Montana), and the Souris River (which flows through Saskatchewan, Manitoba, and North Dakota). All these ongoing projects are vast potential sources of conflict, and have been essentially transformed by the Commission into models of bi-national environmental cooperation. The IJC also has critical duties under the revised 1978 Great Lakes Water Quality Agreement to monitor progress and coordinate activities associated with this Agreement. The Commission evaluates programs and measures designed to improve water quality in the Great Lakes and reports biennially to the federal, state, and provincial governments and the public on achievements and shortfalls under the Agreement. The emphasis of the IJC on direct access for, and contributions from, citizens of both nations has not only helped shape policy recommendations, but also enhanced the governments’ efforts to restore the Great Lakes ecosystem. Other, separate treaties and conventions permit the IJC to deal with emergency water level conditions in the Rainy Lake and Lake of the Woods watershed (Minnesota, Manitoba, and Ontario); approve diversions of water from the Lake of the Woods (Minnesota, Manitoba, and Ontario); oversee the operation of control works that distribute water over the crest of the Niagara Falls (New York and Ontario); and resolve disputes regarding the use of the Columbia River (Washington and British Columbia). The Treaty provides for six commissioners, three from each country, who serve in their personal and professional capacities and do not receive instructions from their governments. The IJC acts as a unitary body and acts to achieve the best long-term interests of the two countries.
3.8.1.3. Case Study: Great Lakes–St Lawrence River
The following case study is a representative account of occasions in which the Commission’s contribution has been or is currently evident, and illustrates how transboundary reservoir management conflicts are managed by the IJC. The Great Lakes–St Lawrence River basin is the largest system of fresh surface water on the globe, stretching 3,840 km from the middle of the North American continent to the Atlantic Ocean. The five interconnected lakes – Superior, Michigan, Huron, Erie, and Ontario – contain approximately 20 percent of the world’s freshwater with about 16,000 km of shoreline. A large number of Americans and Canadians live within the boundaries of the Great Lakes basin. Fluctuating water levels adversely affect most inhabitants either directly or indirectly. In its Great Lakes regulatory role the IJC has issued Orders of Approval for control works at two locations (Lakes Superior and Ontario) and remedial works at one location (Niagara River). Although the outflows of Lakes Superior and Ontario are regulated by the IJC the inflows are not, and hence the levels of the lakes vary seasonally and also with long-term climatological trends and instantaneous hydro-meteorological events. Many studies have indicated that these, and other human interventions, have relatively minor impacts on water level fluctuations in comparison with natural forces, and that storms can induce some of the most dramatic changes in local levels. In its advisory role the IJC has been asked to conduct studies of Great Lakes water levels and flows on numerous occasions. During record-breaking high levels in 1985 and 1986 riparian communities petitioned governments to reduce the effects of high levels throughout the system. Governments in turn referred the matter to the Commission. In 1993, the Commission completed a comprehensive study of fluctuating water levels in the Great Lakes–St Lawrence River basin that produced a series of recommendations on which both governments and the Commission itself are still acting.
40
Lake Ontario. In 1952 the IJC approved the construction of hydropower facilities in the international reach of the St Lawrence River, which extends from Lake Ontario to Cornwall (Ontario) and Massena (New York State). Changes in water levels and flows on Lake Ontario and in the St Lawrence River often create conflicts among several interests. These interests fall into five categories:
● riparian ● hydropower ● commercial navigation ● recreational boaters ● the environment.
Overall, Lake Ontario regulation has resulted in substantial benefits to interests around the Lake and along the St Lawrence River. With an agreed set of criteria and a flexible regulation plan, the Commission and its Board represent a model of cooperation for regulation of a complex system and for investigating improved conditions for the interests sharing that system. Nevertheless, even successful water management regimes need review and adjustments from time to time. In December 2000 the Commission began a review through a bi-national Study Board to take into account developments that have occurred since the 1950s. To get the public to participate in it the Commission formed a 24-member Public Interest Advisory Group made up of interested citizens in both countries, thereby illustrating the Commission’s commitment to public participation in its studies.
Lake Superior. Lake Superior has been regulated since 1921 when construction and operation of the compensating works structure just above the head of the StMarys Rapids was approved by the IJC. The approval included several conditions recognizing interests on Lake Superior. Later, in 1979, following a ten-year Commission study of Great Lakes water levels, the IJC recognized the need to broaden the scope of interests and issued a Supplementary Order to take into account downstream interests in the St Marys River and Lakes Michigan and Huron. The present plan for regulating Lake Superior is Plan 1977-A, which came into effect following the 1979 Order. The plan considers conditions on Lakes Superior, Michigan, and Huron when specifying outflows. It specifies minimum allowable flows in the St Marys River to prevent excessively low levels downstream, ensures water for power production, maintains adequate flows in the Rapids for fish habitat, and limits winter flows to a specified maximum to prevent ice jams. Plan flows are set monthly. Conflicts between users, when they arise, are typically resolved through the forum of this international board and the use of an agreed-upon regulation plan based on the Commission’s Order. Currently, because of continued low levels in the upper Great Lakes and growing grassroots support for re-evaluating Regulation Plan 1977-A (largely from citizens on Lake Michigan who believe that a more equitable regulation plan is possible and desirable) the Commission is considering initiating a review of its Orders of Approval for the regulation of Lake Superior, similar to that just started for Lake Ontario and the St Lawrence River. If undertaken, this project would represent another opportunity to review whether a long-standing means of resolving conflicts is in need of amendments in the light of changed circumstances in the watershed.
3.8.1.4. International Watershed Boards
In 1997, in response to a request from governments on providing greater assistance in meeting future transboundary environmental challenges, the Commission developed several proposals, the most important one being the establishment of international watershed boards in major transboundary watersheds that extend across
41
the Canada–United States boundary, or some regional combination of these watersheds. In the past, transboundary water issues were often seen as localized but, experience with the Great Lakes Water Quality Agreement and the ecosystem approach changed that perspective and the Commission recognized that transboundary water issues must be addressed in an integrative manner, including both biophysical and human aspects. The Commission found that demographics, climate change, and technologies are combining to increase the potential for conflict over water resources and other environmental concerns. Resolution of these issues is often made more difficult by changing governmental responsibilities at all levels and by demands from many interests to be involved in decisions that affect them. The IJC boards could deal with changes in jurisdiction and governance, which are not always the same on both sides of the border, in an integrative and non-adversarial way. IJC boards would provide a mechanism for avoiding and resolving transboundary disputes by building a capacity at the watershed level to anticipate and respond to the range of water-related and other environmental challenges that can be foreseen for the twenty-first century. This mechanism includes effective coordination of government institutions at various levels, acquisition and fostering of expertise, knowledge, and information about the ecosystem of the watershed, consultation with and involvement of the full range of interests concerned (including the public), and above all the flexibility to identify and deal with unforeseen developments. Finally, this improved mechanism could be implemented without substantially affecting existing institutions. Governments have approved the watershed boards proposal in principle and the Commission is now pursuing its implementation by, as a first step, amalgamating existing IJC boards in watersheds where such amalgamation is most easily accomplished, and revising the mandates of the boards to reflect an ecosystem approach to their work. The Commission believes that the introduction of a system of permanent IJC international watershed boards from coast to coast will increase the Commission’s capacity to provide the governments with an even stronger and more flexible mechanism for dealing with transboundary water issues.
3.8.1.5. Conflict Resolution
IJC has been successful in preventing and resolving transboundary water resource conflicts. The Boundary Waters Treaty established a framework, within which IJC developed a process that has provided the basis for much of the success of the bilateral environmental relationship. This process can be characterized by six main elements.
1. Consultation and Consensus Building. The Treaty provides that a majority of the Commissioners can reach a decision but the Commission’s Rules of Procedure call for the concurrence of at least four Commissioners to ensure that at least one Commissioner from each country agrees. In practice, most Commission decisions are taken by consensus and the Commission requires some “key” boards to refer matters to the Commission for decision if board members are unable to achieve consensus. Thus the Commission and its network of advisory and regulatory boards strive for consensus as a means of reflecting the common interest.
2. Providing a Forum for Public Participation. Article XII of the Boundary Waters Treaty requires the Commission, in any proceeding, inquiry, or matter within its jurisdiction, to assure that “all parties interested therein shall be given convenient opportunity to be heard.” In practice, the Commission has always emphasized the importance of public participation and advice.
3. Engagement of Local Governments. The Commission invites and facilitates the engagement of state, provincial, and municipal governments and other
42

authorities in transboundary environmental issues. At the same time, the IJC brings bi-national and national resources and considerations to bear on the resolution of local and regional matters.
4. Joint Fact-finding. This is a foundation of Commission practice. The Commission recognizes that bi-national joint fact-finding builds an important and often essential foundation for the achievement of consensus on appropriate actions.
5. Objectivity and Independence. The authors of the Treaty built into the IJC an expectation that its members would seek to find solutions in the common interest of the two nations. They are expected to serve the Commission in their personal and professional capacities. This allows board members to explore all options, which helps promote the development of novel solutions and consensus.
6. Flexibility. One of the most important features of the Commission’s work has been the flexibility inherent in its mandate and process to be able to adapt to the circumstances of particular transboundary issues or conditions.
All the above elements have become a fundamental part of the relationship between the parties in boundary areas. They have kept difficult issues from the diplomatic agenda of the parties and helped to ensure the continued health of the environmental relationship. The Commission believes these practices will increase in importance as the basis for a successful transboundary relationship in future.
3.8.1.6. Summary
The United States and Canada have demonstrated the possibility for two sovereign nations to effectively cooperate in managing the waters they share. The keys to successfully resolving issues include establishing a forum for jointly determining the facts, building trust and giving both parties an equal voice, and focusing on the best interests of the watershed as a whole. The IJC provides an example of how neighboring countries can structure such a forum. The Commission’s fundamental role of preventing and resolving disputes has contributed to a successful transboundary environmental relationship between Canada and the United States throughout most of the twentieth century. The 1909 Boundary Waters Treaty established a framework for the Commission’s role and the flexibility of the Treaty and of the Commission itself has enabled the IJC to respond to changing times. Within this framework, the IJC has developed a process that has provided the basis for much of the success of the bilateral environmental relationship. This process is characterized by six main elements:
● consultation and consensus building ● providing a forum for public participation ● engagement of local governments ● joint fact-finding ● objectivity and independence ● flexibility.
The Commission sees its most recent proposal, the creation of international watershed boards, as a refinement that can assist the parties greatly in addressing new challenges.
43
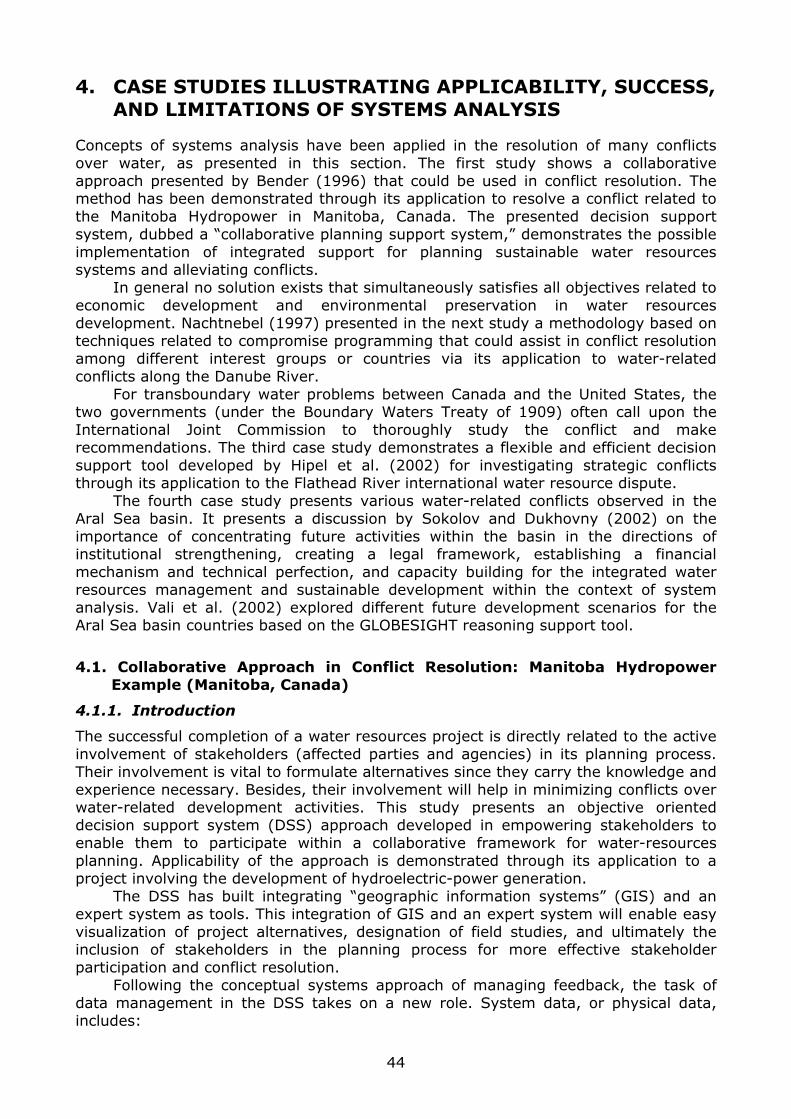
4. CASE STUDIES ILLUSTRATING APPLICABILITY, SUCCESS, AND LIMITATIONS OF SYSTEMS ANALYSIS
Concepts of systems analysis have been applied in the resolution of many conflicts over water, as presented in this section. The first study shows a collaborative approach presented by Bender (1996) that could be used in conflict resolution. The method has been demonstrated through its application to resolve a conflict related to the Manitoba Hydropower in Manitoba, Canada. The presented decision support system, dubbed a “collaborative planning support system,” demonstrates the possible implementation of integrated support for planning sustainable water resources systems and alleviating conflicts. In general no solution exists that simultaneously satisfies all objectives related to economic development and environmental preservation in water resources development. Nachtnebel (1997) presented in the next study a methodology based on techniques related to compromise programming that could assist in conflict resolution among different interest groups or countries via its application to water-related conflicts along the Danube River. For transboundary water problems between Canada and the United States, the two governments (under the Boundary Waters Treaty of 1909) often call upon the International Joint Commission to thoroughly study the conflict and make recommendations. The third case study demonstrates a flexible and efficient decision support tool developed by Hipel et al. (2002) for investigating strategic conflicts through its application to the Flathead River international water resource dispute. The fourth case study presents various water-related conflicts observed in the Aral Sea basin. It presents a discussion by Sokolov and Dukhovny (2002) on the importance of concentrating future activities within the basin in the directions of institutional strengthening, creating a legal framework, establishing a financial mechanism and technical perfection, and capacity building for the integrated water resources management and sustainable development within the context of system analysis. Vali et al. (2002) explored different future development scenarios for the Aral Sea basin countries based on the GLOBESIGHT reasoning support tool.
4.1. Collaborative Approach in Conflict Resolution: Manitoba Hydropower Example (Manitoba, Canada)
4.1.1. Introduction
The successful completion of a water resources project is directly related to the active involvement of stakeholders (affected parties and agencies) in its planning process. Their involvement is vital to formulate alternatives since they carry the knowledge and experience necessary. Besides, their involvement will help in minimizing conflicts over water-related development activities. This study presents an objective oriented decision support system (DSS) approach developed in empowering stakeholders to enable them to participate within a collaborative framework for water-resources planning. Applicability of the approach is demonstrated through its application to a project involving the development of hydroelectric-power generation. The DSS has built integrating “geographic information systems” (GIS) and an expert system as tools. This integration of GIS and an expert system will enable easy visualization of project alternatives, designation of field studies, and ultimately the inclusion of stakeholders in the planning process for more effective stakeholder participation and conflict resolution. Following the conceptual systems approach of managing feedback, the task of data management in the DSS takes on a new role. System data, or physical data, includes:
44
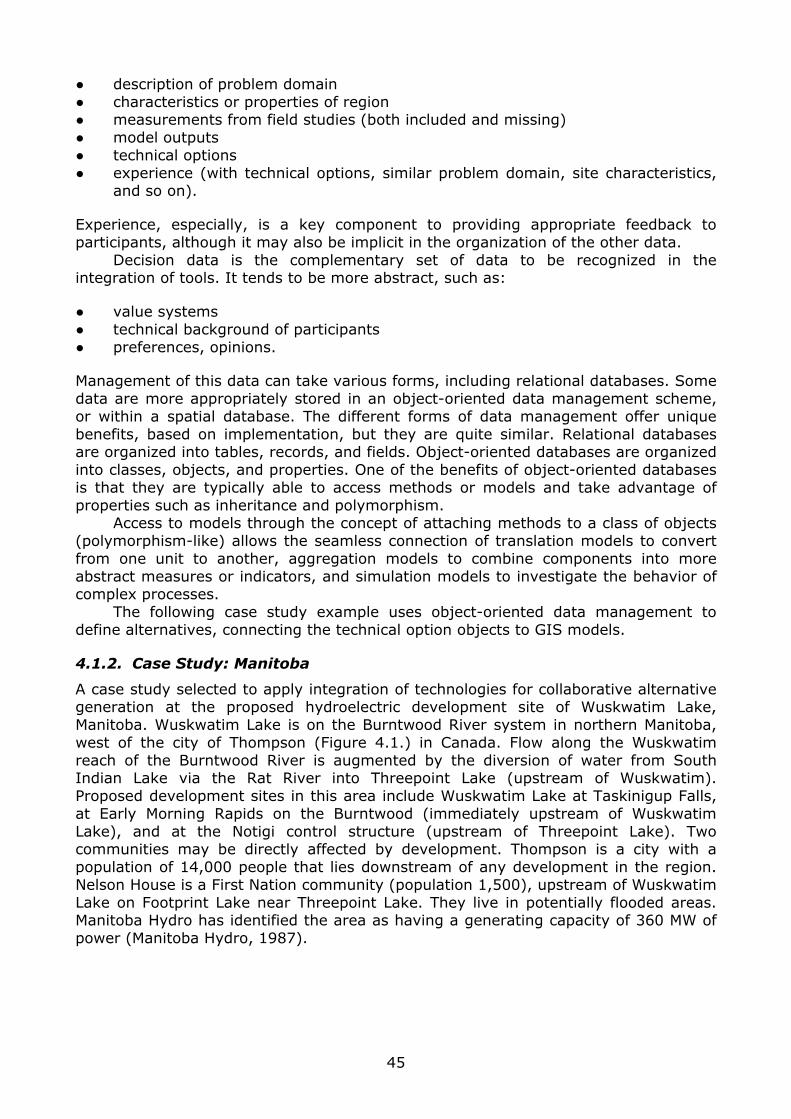
● description of problem domain ● characteristics or properties of region ● measurements from field studies (both included and missing) ● model outputs ● technical options ● experience (with technical options, similar problem domain, site characteristics,
and so on).
Experience, especially, is a key component to providing appropriate feedback to participants, although it may also be implicit in the organization of the other data. Decision data is the complementary set of data to be recognized in the integration of tools. It tends to be more abstract, such as:
● value systems ● technical background of participants ● preferences, opinions.
Management of this data can take various forms, including relational databases. Some data are more appropriately stored in an object-oriented data management scheme, or within a spatial database. The different forms of data management offer unique benefits, based on implementation, but they are quite similar. Relational databases are organized into tables, records, and fields. Object-oriented databases are organized into classes, objects, and properties. One of the benefits of object-oriented databases is that they are typically able to access methods or models and take advantage of properties such as inheritance and polymorphism. Access to models through the concept of attaching methods to a class of objects (polymorphism-like) allows the seamless connection of translation models to convert from one unit to another, aggregation models to combine components into more abstract measures or indicators, and simulation models to investigate the behavior of complex processes. The following case study example uses object-oriented data management to define alternatives, connecting the technical option objects to GIS models.
4.1.2. Case Study: Manitoba
A case study selected to apply integration of technologies for collaborative alternative generation at the proposed hydroelectric development site of Wuskwatim Lake, Manitoba. Wuskwatim Lake is on the Burntwood River system in northern Manitoba, west of the city of Thompson (Figure 4.1.) in Canada. Flow along the Wuskwatim reach of the Burntwood River is augmented by the diversion of water from South Indian Lake via the Rat River into Threepoint Lake (upstream of Wuskwatim). Proposed development sites in this area include Wuskwatim Lake at Taskinigup Falls, at Early Morning Rapids on the Burntwood (immediately upstream of Wuskwatim Lake), and at the Notigi control structure (upstream of Threepoint Lake). Two communities may be directly affected by development. Thompson is a city with a population of 14,000 people that lies downstream of any development in the region. Nelson House is a First Nation community (population 1,500), upstream of Wuskwatim Lake on Footprint Lake near Threepoint Lake. They live in potentially flooded areas. Manitoba Hydro has identified the area as having a generating capacity of 360 MW of power (Manitoba Hydro, 1987).
45
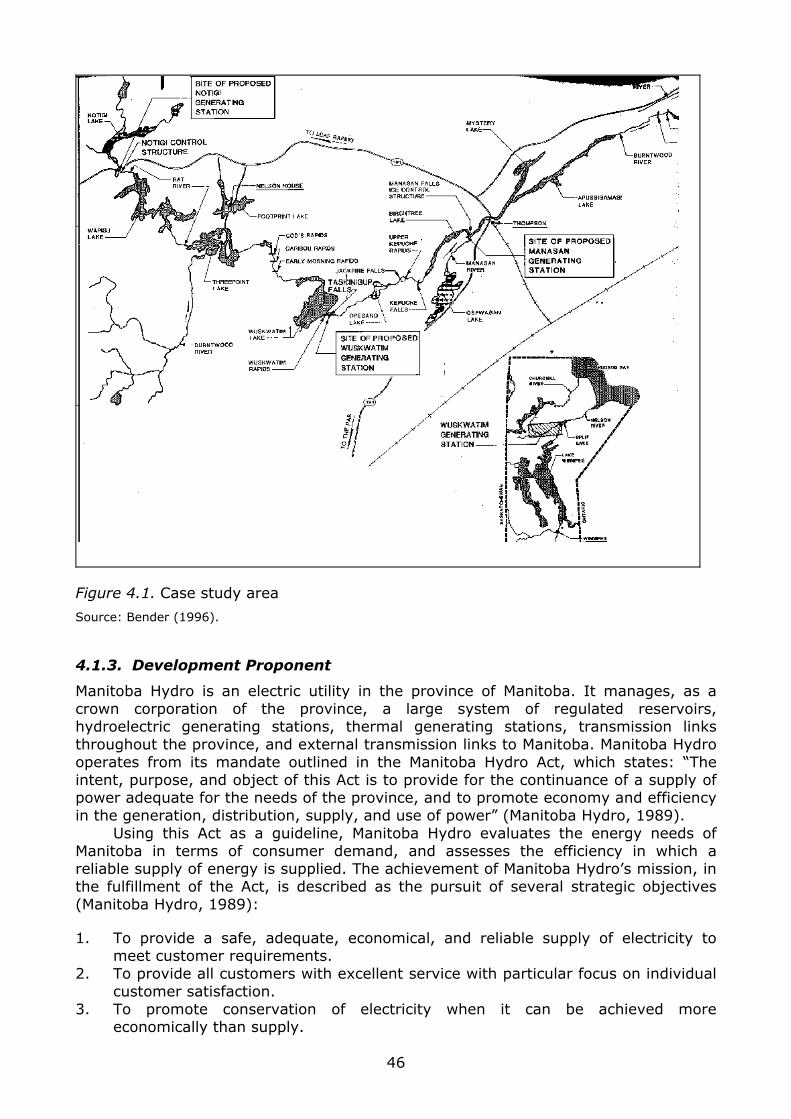
Figure 4.1. Case study area
Source: Bender (1996).
4.1.3. Development Proponent
Manitoba Hydro is an electric utility in the province of Manitoba. It manages, as a crown corporation of the province, a large system of regulated reservoirs, hydroelectric generating stations, thermal generating stations, transmission links throughout the province, and external transmission links to Manitoba. Manitoba Hydro operates from its mandate outlined in the Manitoba Hydro Act, which states: “The intent, purpose, and object of this Act is to provide for the continuance of a supply of power adequate for the needs of the province, and to promote economy and efficiency in the generation, distribution, supply, and use of power” (Manitoba Hydro, 1989). Using this Act as a guideline, Manitoba Hydro evaluates the energy needs of Manitoba in terms of consumer demand, and assesses the efficiency in which a reliable supply of energy is supplied. The achievement of Manitoba Hydro’s mission, in the fulfillment of the Act, is described as the pursuit of several strategic objectives (Manitoba Hydro, 1989):
1. To provide a safe, adequate, economical, and reliable supply of electricity to meet customer requirements.
2. To provide all customers with excellent service with particular focus on individual customer satisfaction.
3. To promote conservation of electricity when it can be achieved more economically than supply.
46
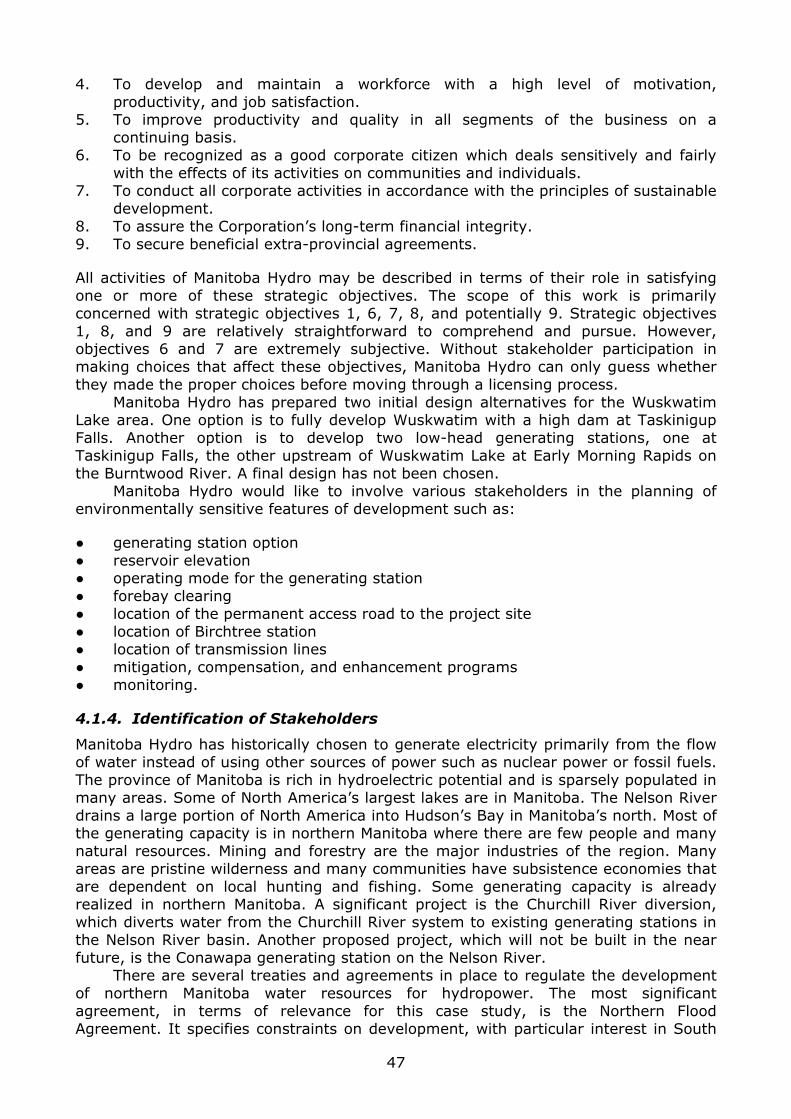
4. To develop and maintain a workforce with a high level of motivation, productivity, and job satisfaction.
5. To improve productivity and quality in all segments of the business on a continuing basis.
6. To be recognized as a good corporate citizen which deals sensitively and fairly with the effects of its activities on communities and individuals.
7. To conduct all corporate activities in accordance with the principles of sustainable development.
8. To assure the Corporation’s long-term financial integrity. 9. To secure beneficial extra-provincial agreements.
All activities of Manitoba Hydro may be described in terms of their role in satisfying one or more of these strategic objectives. The scope of this work is primarily concerned with strategic objectives 1, 6, 7, 8, and potentially 9. Strategic objectives 1, 8, and 9 are relatively straightforward to comprehend and pursue. However, objectives 6 and 7 are extremely subjective. Without stakeholder participation in making choices that affect these objectives, Manitoba Hydro can only guess whether they made the proper choices before moving through a licensing process. Manitoba Hydro has prepared two initial design alternatives for the Wuskwatim Lake area. One option is to fully develop Wuskwatim with a high dam at Taskinigup Falls. Another option is to develop two low-head generating stations, one at Taskinigup Falls, the other upstream of Wuskwatim Lake at Early Morning Rapids on the Burntwood River. A final design has not been chosen. Manitoba Hydro would like to involve various stakeholders in the planning of environmentally sensitive features of development such as:
● generating station option ● reservoir elevation ● operating mode for the generating station ● forebay clearing ● location of the permanent access road to the project site ● location of Birchtree station ● location of transmission lines ● mitigation, compensation, and enhancement programs ● monitoring.
4.1.4. Identification of Stakeholders
Manitoba Hydro has historically chosen to generate electricity primarily from the flow of water instead of using other sources of power such as nuclear power or fossil fuels. The province of Manitoba is rich in hydroelectric potential and is sparsely populated in many areas. Some of North America’s largest lakes are in Manitoba. The Nelson River drains a large portion of North America into Hudson’s Bay in Manitoba’s north. Most of the generating capacity is in northern Manitoba where there are few people and many natural resources. Mining and forestry are the major industries of the region. Many areas are pristine wilderness and many communities have subsistence economies that are dependent on local hunting and fishing. Some generating capacity is already realized in northern Manitoba. A significant project is the Churchill River diversion, which diverts water from the Churchill River system to existing generating stations in the Nelson River basin. Another proposed project, which will not be built in the near future, is the Conawapa generating station on the Nelson River. There are several treaties and agreements in place to regulate the development of northern Manitoba water resources for hydropower. The most significant agreement, in terms of relevance for this case study, is the Northern Flood Agreement. It specifies constraints on development, with particular interest in South
47
Indian Lake and the Churchill River diversion through the Rat River and Burntwood River systems to the Nelson River. The Northern Flood Agreement is a contract between the Government of Manitoba, Manitoba Hydro, and First Nations communities in the north. It includes Wuskwatim Lake and areas upstream and downstream of proposed hydro development in the area. There are many potential planning participants identified as stakeholders for development near Wuskwatim Lake. They include the city of Thompson (downstream of Wuskwatim Lake), Nelson House First Nation (upstream of Wuskwatim Lake), and the Department of Fisheries and Oceans as a regulatory agency for fisheries interests. Any development near Wuskwatim Lake may impact the flow regime, water quality, and many geomorphological characteristics near Thompson. Nelson House may be subject to either direct flooding or increased water levels from backwater effects. Impacts associated with flooding, such as erosion and water quality problems, may also affect Nelson House. The Department of Fisheries and Oceans, in an effort to address fisheries concerns, may consider impacts in terms of reservoir habitat, riverine habitat, and fish passage. Reservoir habitat may be altered from previous reservoir habitat and/or created from traditionally riverine habitat. Riverine habitat both upstream and downstream may be impacted. Most changes are assumed to occur downstream of the development site, but altered flow characteristics upstream of the site are caused by backwater effects. Obstruction to fish migrations, either upstream or downstream, may alter local populations of fish. Some species may disappear, while others may dominate. Changes or disruptions in species composition may alter ecosystem links. Changes in fish population may also impact local commercial and recreational fisheries at Nelson House or Thompson.
4.1.5. Project Licensing
There are also outstanding issues to be resolved between Manitoba Hydro and Nelson House First Nation, related to the Churchill diversion project, which augments flow past Wuskwatim Lake. This complicates an already complicated procedure for project licensing. Presently, the federal environmental assessment and review process of pursuing development of a hydroelectric generating station can be described in nine steps (FEARO, 1986):
1. Submission of a proposal, listing potential environmental issues and stakeholders (a priori environmental assessment investigations are encouraged and quickly becoming mandatory).
2. Screening of proposals to determine the need to mitigate environmental impacts or to modify the proposal.
3. Further investigation. Projects that pass screening may need further clarification of impacts before public hearings.
4. Referral to the Minister of the Environment for panel review. 5. Preparation of an environmental impact statement. 6. Public hearings on the environmental impact statement. 7. Report on proposal impacts and recommendations to address impacts. 8. Publication of report. 9. Licensing decision by the Minister of the Environment.
4.1.6. Integration of GIS Tools
In an attempt to avoid conflicts with stakeholders through the project licensing process, a collaborative planning process can be implemented to include relevant participants in the conceptual design stage. When experimenting with different
48
technical options, decision support tools can be powerful in visualization and knowledge transfer. GIS, as a viable and popular spatial analysis tool, is well suited to be integrated with hydraulic and hydrologic processes.
4.1.7. GIS Database
Two digital NTS maps were selected for use in GIS applications (they are 63o09, and 63o10). They are 1:50,000 scale UTM grid maps, in zone 14, using the GRS80 ellipsoid. The maps are adjacent to each other. Each map is approximately 30 km × 30 km. Map 63o10 contains areas upstream of Wuskwatim Lake, but not Notigi control structure or the Nelson House community. It also contains the majority of Wuskwatim Lake and the Rat River release point. Map 63o09 contains a portion of Wuskwatim Lake, and downstream areas of the Rat River, although not as far as Thompson. A digital elevation model (DEM) has been developed from contour lines, a small set of available point elevation values, and known lake levels for some of the larger lakes. The accuracy of the DEM is not questioned at this point. It is discretized at 1m (vertical scale) intervals for 30m by 30m cell sizes, and is meant to be representative overall. Other data in the database includes boundaries between land and surface water areas, wetlands, streams, rapids, and roads. A number of structures have also been digitized for possible inclusion in flooding experiments, including both the proposed Wuskwatim and Early Morning generating stations.
4.1.8. Flood Inundation Visualization
GIS exploration of flooding scenarios is one aspect of visual demonstration that may contribute to improved participation and understanding between various stakeholders. The task of flood inundation is a complex one if hydraulic behavior such as backwater effects is taken into account. Unfortunately, the determination of backwater demands a substantial amount of data. Backwaters are usually generated by the standard step method, using cross-section data for each reach. A typical procedure calculates the effect with external models, and simply displays the results using GIS. That procedure works fine for a river basin where the flooding is mainly on the flood plain of the river. For cases where a flood will inundate a variety of areas and land types, the cross-section data requirements become expensive and unmanageable. For the purpose of visualizing a flooding scenario, especially for a large case study region (over 1,000 km2 in this case), it is relatively simple and straightforward to generate a flood without backwater. The results will not be completely accurate, but will be representative. To generate a flood, the following procedure is used:
1. Combine the selected hydraulic structures (dams) as bitmap images with the digital elevation model (DEM). Hydraulic structures are treated as an area with a specified elevation.
2. Identify the upstream side of the hydraulic structure. 3. Specify an elevation for flooding. 4. Generate clumps of areas below the flood level. 5. Choose the appropriate clump as the reservoir. 6. Change the DEM and topographic maps appropriately.
A graphical interface has been developed in OpenWindows using SmartElements from Neuron Data to allow experimentation with different flooding scenarios. Structures
49
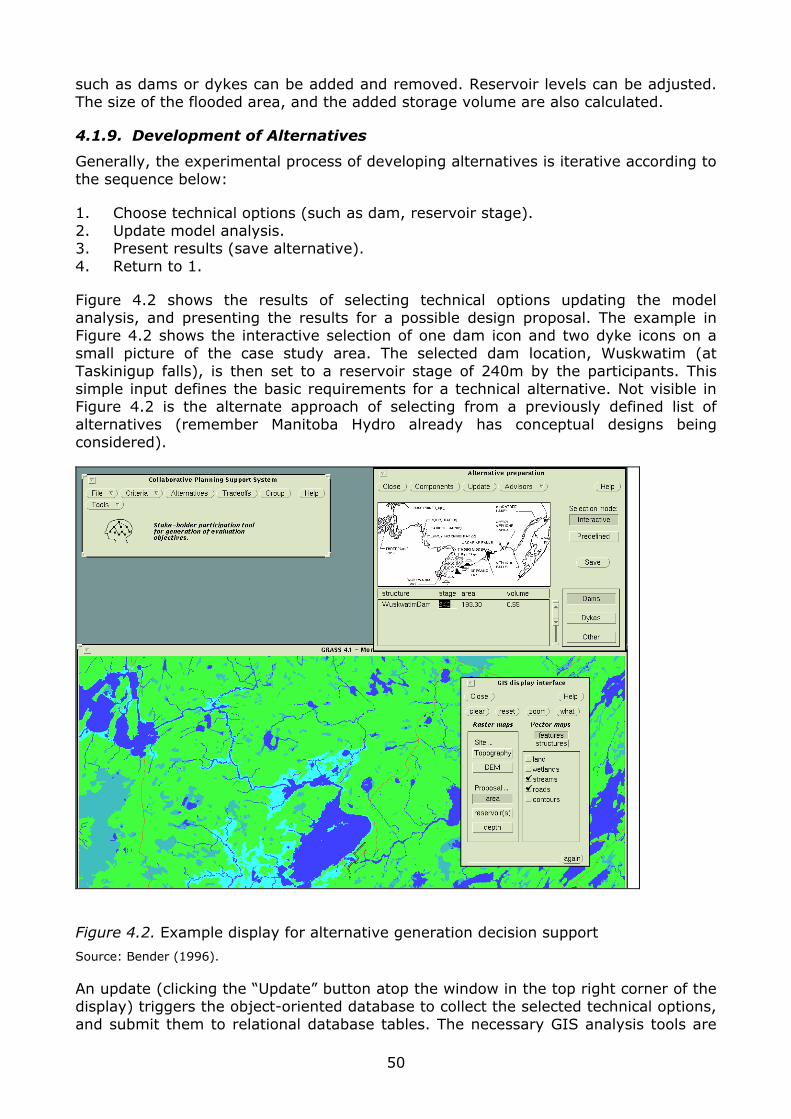
such as dams or dykes can be added and removed. Reservoir levels can be adjusted. The size of the flooded area, and the added storage volume are also calculated.
4.1.9. Development of Alternatives
Generally, the experimental process of developing alternatives is iterative according to the sequence below:
1. Choose technical options (such as dam, reservoir stage). 2. Update model analysis. 3. Present results (save alternative). 4. Return to 1.
Figure 4.2 shows the results of selecting technical options updating the model analysis, and presenting the results for a possible design proposal. The example in Figure 4.2 shows the interactive selection of one dam icon and two dyke icons on a small picture of the case study area. The selected dam location, Wuskwatim (at Taskinigup falls), is then set to a reservoir stage of 240m by the participants. This simple input defines the basic requirements for a technical alternative. Not visible in Figure 4.2 is the alternate approach of selecting from a previously defined list of alternatives (remember Manitoba Hydro already has conceptual designs being considered).
Figure 4.2. Example display for alternative generation decision support
Source: Bender (1996).
An update (clicking the “Update” button atop the window in the top right corner of the display) triggers the object-oriented database to collect the selected technical options, and submit them to relational database tables. The necessary GIS analysis tools are
50
invoked, providing updates in the form of GIS maps of the flooded region. Other properties are also calculated, such as reservoir area (193.3 km2) and reservoir volume (0.55 km3). The GIS display has also been automated with a custom interface. Original topography or the DEM can be displayed at any time to compare with the current flooded scenario. The new topographic area, the reservoir area, and reservoir depth can be shown. Other vector features and structures are also made available. For instance, streams are stored in vector format. In this way, participants are able to interactively experiment with technical options, and view output of model analysis. The motivation is for participants with diverse backgrounds to understand the implications of different choices. The learning process is augmented by the visualization tools, and also by the interactive nature of experimentation. A new alternative can be updated within a couple of minutes. Participants are then able to see, in (near) real time, how different technical options behave. The form of decision support is very specific to stakeholder participation. It is also possible to generate a large number of scenarios to cover the likely range of alternatives to consider. From that database of generated alternatives, trade-offs can be assessed and a selection made. However, in an automated generation of alternatives, there is typically one element missing. Facilitating creativity from the participants is the primary motivation of using an experimental learning process. In fact, it is the ultimate goal of any decision support system. The selection of technical options shown in this example in no way reflects the position of Manitoba Hydro. Manitoba Hydro is interested in the creative contribution of stakeholders. Predefined alternatives may be under consideration, but they have not been presented in any detail in this description.
4.1.10. Application of Expert Systems
4.1.10.1. Expert Systems
Expert systems are a branch of the artificial intelligence community that specializes in the mundane task of encoding experience and processes for making decisions. Knowledge is encoded in Boolean logic and accessed by searching mechanisms called “inference engines.” Five phases in expert system design are: identification, conceptualization, formalization, implementation, and testing. Describing expert systems this way tends to cloud the essence of expert system application. Most computer programs can handle the IF-THEN-ELSE architecture that expert systems use to encode knowledge. The unique advantage is derived by the inferencing capabilities of expert systems. Two types are used: backward and forward chaining. Backward chaining searches for information if it is required while forward chaining is directed to the relevant information. In general, backward chaining uses IF statements as search mechanisms, and forward chaining acts on THEN statements. The unique power that backward chaining brings to expert systems is the modularity in knowledge dissemination. Each rule in a knowledge base may be given a very specific scope and aspect of a knowledge domain, and does not need to address its place in the broader problem scope. Consistency in language is necessary for the expert system to function. The use of expert systems in describing operating policies for reservoirs and other water management problems is an approach that easily adapts to system simulation and experimentation of decision rules. Simonovic (1991) outlines general areas of application relevant to expert system technologies. One example is the use of interest satisfaction relationships, defined within an expert system, to describe regulatory decision making on Lake Ontario (Eberhardt, 1994). An expert system
51
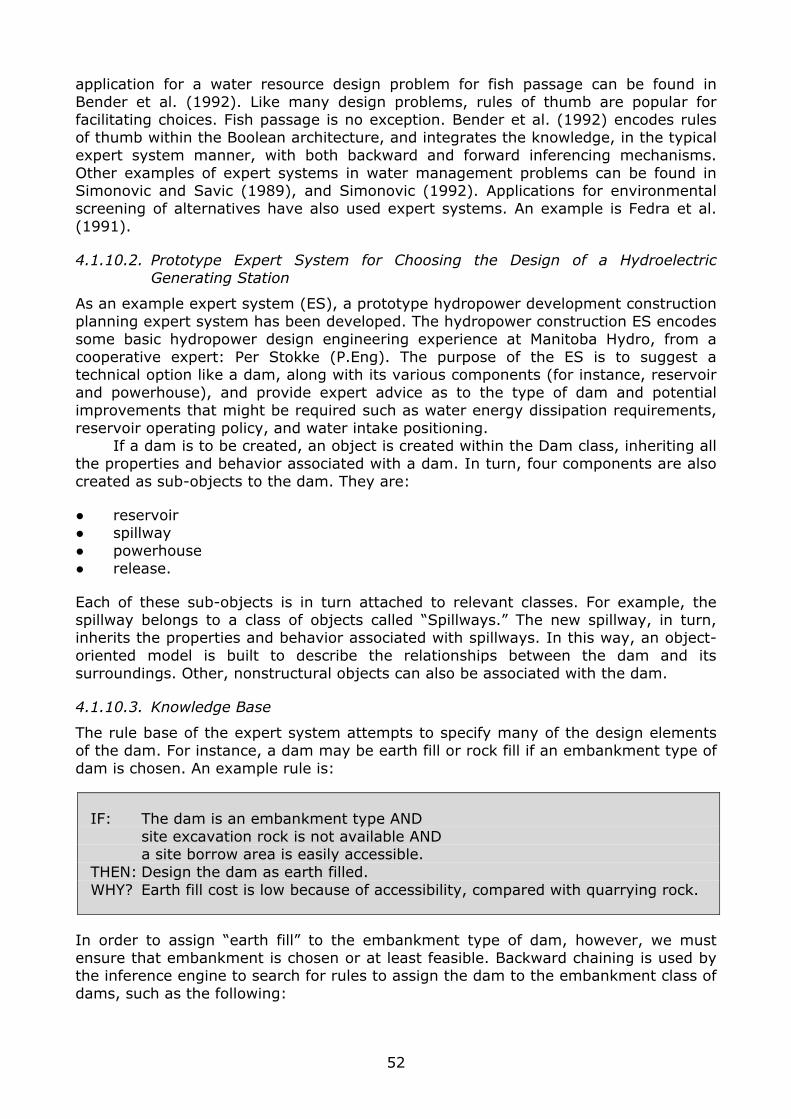
application for a water resource design problem for fish passage can be found in Bender et al. (1992). Like many design problems, rules of thumb are popular for facilitating choices. Fish passage is no exception. Bender et al. (1992) encodes rules of thumb within the Boolean architecture, and integrates the knowledge, in the typical expert system manner, with both backward and forward inferencing mechanisms. Other examples of expert systems in water management problems can be found in Simonovic and Savic (1989), and Simonovic (1992). Applications for environmental screening of alternatives have also used expert systems. An example is Fedra et al. (1991).
4.1.10.2. Prototype Expert System for Choosing the Design of a Hydroelectric Generating Station
As an example expert system (ES), a prototype hydropower development construction planning expert system has been developed. The hydropower construction ES encodes some basic hydropower design engineering experience at Manitoba Hydro, from a cooperative expert: Per Stokke (P.Eng). The purpose of the ES is to suggest a technical option like a dam, along with its various components (for instance, reservoir and powerhouse), and provide expert advice as to the type of dam and potential improvements that might be required such as water energy dissipation requirements, reservoir operating policy, and water intake positioning. If a dam is to be created, an object is created within the Dam class, inheriting all the properties and behavior associated with a dam. In turn, four components are also created as sub-objects to the dam. They are:
● reservoir ● spillway ● powerhouse ● release.
Each of these sub-objects is in turn attached to relevant classes. For example, the spillway belongs to a class of objects called “Spillways.” The new spillway, in turn, inherits the properties and behavior associated with spillways. In this way, an object-oriented model is built to describe the relationships between the dam and its surroundings. Other, nonstructural objects can also be associated with the dam.
4.1.10.3. Knowledge Base
The rule base of the expert system attempts to specify many of the design elements of the dam. For instance, a dam may be earth fill or rock fill if an embankment type of dam is chosen. An example rule is:
IF: The dam is an embankment type AND site excavation rock is not available AND a site borrow area is easily accessible. THEN: Design the dam as earth filled. WHY? Earth fill cost is low because of accessibility, compared with quarrying rock.
In order to assign “earth fill” to the embankment type of dam, however, we must ensure that embankment is chosen or at least feasible. Backward chaining is used by the inference engine to search for rules to assign the dam to the embankment class of dams, such as the following:
52
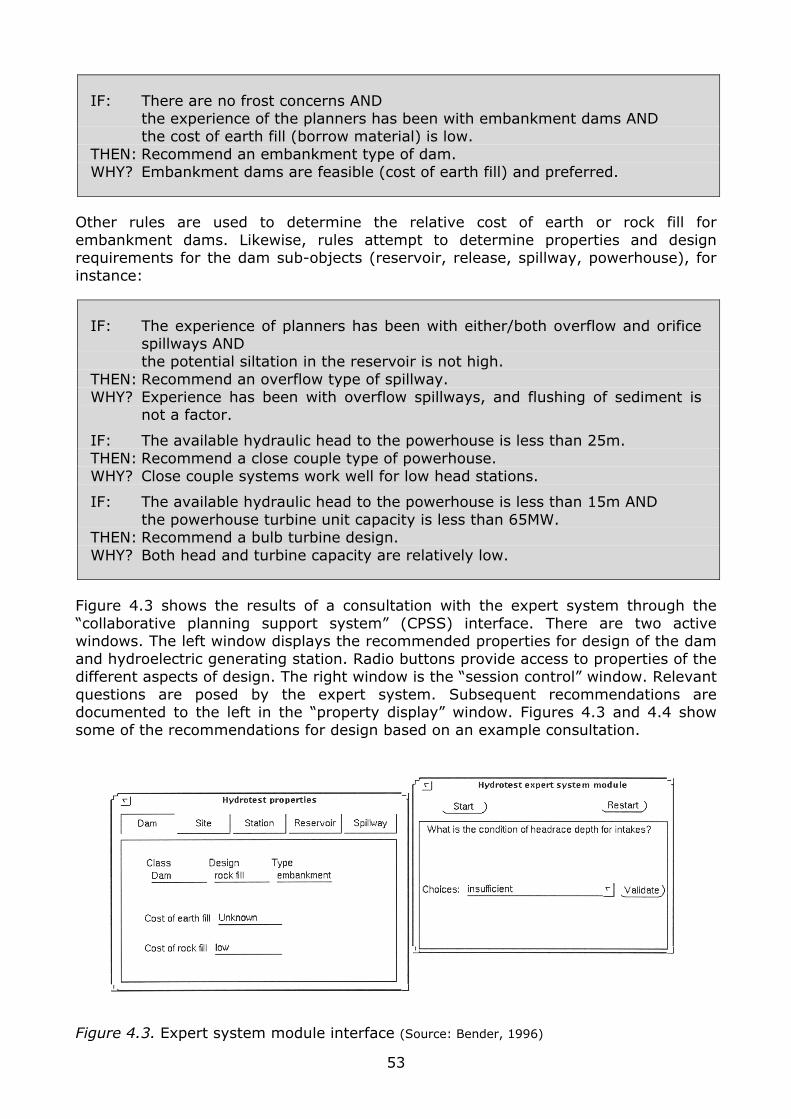
IF: There are no frost concerns AND the experience of the planners has been with embankment dams AND the cost of earth fill (borrow material) is low. THEN: Recommend an embankment type of dam. WHY? Embankment dams are feasible (cost of earth fill) and preferred.
Other rules are used to determine the relative cost of earth or rock fill for embankment dams. Likewise, rules attempt to determine properties and design requirements for the dam sub-objects (reservoir, release, spillway, powerhouse), for instance:
IF: The experience of planners has been with either/both overflow and orifice spillways AND
the potential siltation in the reservoir is not high. THEN: Recommend an overflow type of spillway. WHY? Experience has been with overflow spillways, and flushing of sediment is
not a factor.
IF: The available hydraulic head to the powerhouse is less than 25m. THEN: Recommend a close couple type of powerhouse. WHY? Close couple systems work well for low head stations.
IF: The available hydraulic head to the powerhouse is less than 15m AND the powerhouse turbine unit capacity is less than 65MW. THEN: Recommend a bulb turbine design. WHY? Both head and turbine capacity are relatively low.
Figure 4.3 shows the results of a consultation with the expert system through the “collaborative planning support system” (CPSS) interface. There are two active windows. The left window displays the recommended properties for design of the dam and hydroelectric generating station. Radio buttons provide access to properties of the different aspects of design. The right window is the “session control” window. Relevant questions are posed by the expert system. Subsequent recommendations are documented to the left in the “property display” window. Figures 4.3 and 4.4 show some of the recommendations for design based on an example consultation.
Figure 4.3. Expert system module interface (Source: Bender, 1996)
53
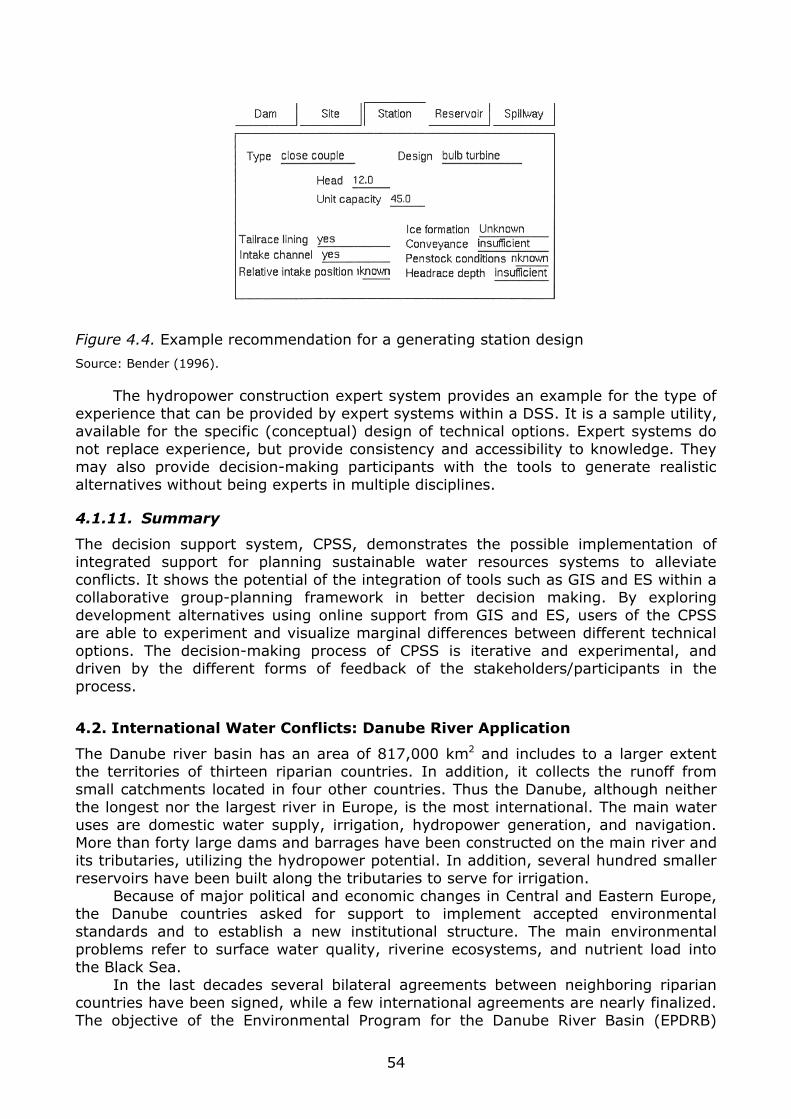
Figure 4.4. Example recommendation for a generating station design
Source: Bender (1996).
The hydropower construction expert system provides an example for the type of experience that can be provided by expert systems within a DSS. It is a sample utility, available for the specific (conceptual) design of technical options. Expert systems do not replace experience, but provide consistency and accessibility to knowledge. They may also provide decision-making participants with the tools to generate realistic alternatives without being experts in multiple disciplines.
4.1.11. Summary
The decision support system, CPSS, demonstrates the possible implementation of integrated support for planning sustainable water resources systems to alleviate conflicts. It shows the potential of the integration of tools such as GIS and ES within a collaborative group-planning framework in better decision making. By exploring development alternatives using online support from GIS and ES, users of the CPSS are able to experiment and visualize marginal differences between different technical options. The decision-making process of CPSS is iterative and experimental, and driven by the different forms of feedback of the stakeholders/participants in the process.
4.2. International Water Conflicts: Danube River Application
The Danube river basin has an area of 817,000 km2 and includes to a larger extent the territories of thirteen riparian countries. In addition, it collects the runoff from small catchments located in four other countries. Thus the Danube, although neither the longest nor the largest river in Europe, is the most international. The main water uses are domestic water supply, irrigation, hydropower generation, and navigation. More than forty large dams and barrages have been constructed on the main river and its tributaries, utilizing the hydropower potential. In addition, several hundred smaller reservoirs have been built along the tributaries to serve for irrigation. Because of major political and economic changes in Central and Eastern Europe, the Danube countries asked for support to implement accepted environmental standards and to establish a new institutional structure. The main environmental problems refer to surface water quality, riverine ecosystems, and nutrient load into the Black Sea. In the last decades several bilateral agreements between neighboring riparian countries have been signed, while a few international agreements are nearly finalized. The objective of the Environmental Program for the Danube River Basin (EPDRB)
54
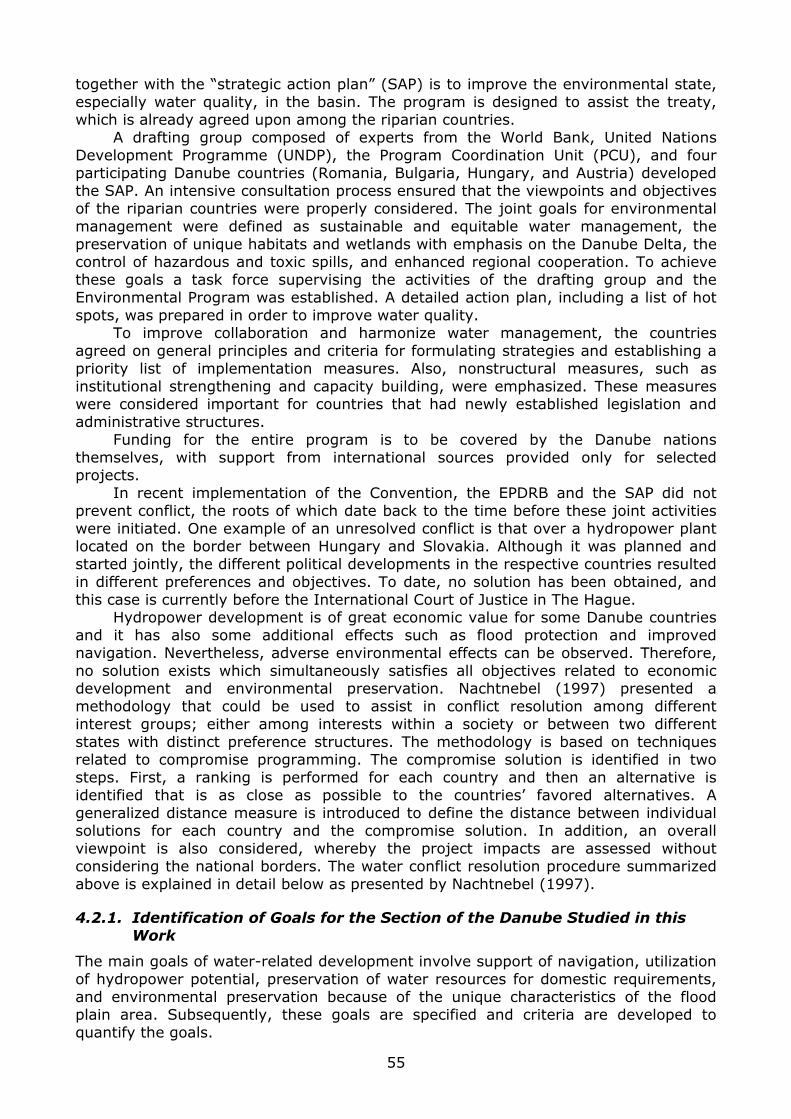
together with the “strategic action plan” (SAP) is to improve the environmental state, especially water quality, in the basin. The program is designed to assist the treaty, which is already agreed upon among the riparian countries. A drafting group composed of experts from the World Bank, United Nations Development Programme (UNDP), the Program Coordination Unit (PCU), and four participating Danube countries (Romania, Bulgaria, Hungary, and Austria) developed the SAP. An intensive consultation process ensured that the viewpoints and objectives of the riparian countries were properly considered. The joint goals for environmental management were defined as sustainable and equitable water management, the preservation of unique habitats and wetlands with emphasis on the Danube Delta, the control of hazardous and toxic spills, and enhanced regional cooperation. To achieve these goals a task force supervising the activities of the drafting group and the Environmental Program was established. A detailed action plan, including a list of hot spots, was prepared in order to improve water quality. To improve collaboration and harmonize water management, the countries agreed on general principles and criteria for formulating strategies and establishing a priority list of implementation measures. Also, nonstructural measures, such as institutional strengthening and capacity building, were emphasized. These measures were considered important for countries that had newly established legislation and administrative structures. Funding for the entire program is to be covered by the Danube nations themselves, with support from international sources provided only for selected projects. In recent implementation of the Convention, the EPDRB and the SAP did not prevent conflict, the roots of which date back to the time before these joint activities were initiated. One example of an unresolved conflict is that over a hydropower plant located on the border between Hungary and Slovakia. Although it was planned and started jointly, the different political developments in the respective countries resulted in different preferences and objectives. To date, no solution has been obtained, and this case is currently before the International Court of Justice in The Hague. Hydropower development is of great economic value for some Danube countries and it has also some additional effects such as flood protection and improved navigation. Nevertheless, adverse environmental effects can be observed. Therefore, no solution exists which simultaneously satisfies all objectives related to economic development and environmental preservation. Nachtnebel (1997) presented a methodology that could be used to assist in conflict resolution among different interest groups; either among interests within a society or between two different states with distinct preference structures. The methodology is based on techniques related to compromise programming. The compromise solution is identified in two steps. First, a ranking is performed for each country and then an alternative is identified that is as close as possible to the countries’ favored alternatives. A generalized distance measure is introduced to define the distance between individual solutions for each country and the compromise solution. In addition, an overall viewpoint is also considered, whereby the project impacts are assessed without considering the national borders. The water conflict resolution procedure summarized above is explained in detail below as presented by Nachtnebel (1997).
4.2.1. Identification of Goals for the Section of the Danube Studied in this Work
The main goals of water-related development involve support of navigation, utilization of hydropower potential, preservation of water resources for domestic requirements, and environmental preservation because of the unique characteristics of the flood plain area. Subsequently, these goals are specified and criteria are developed to quantify the goals.
55
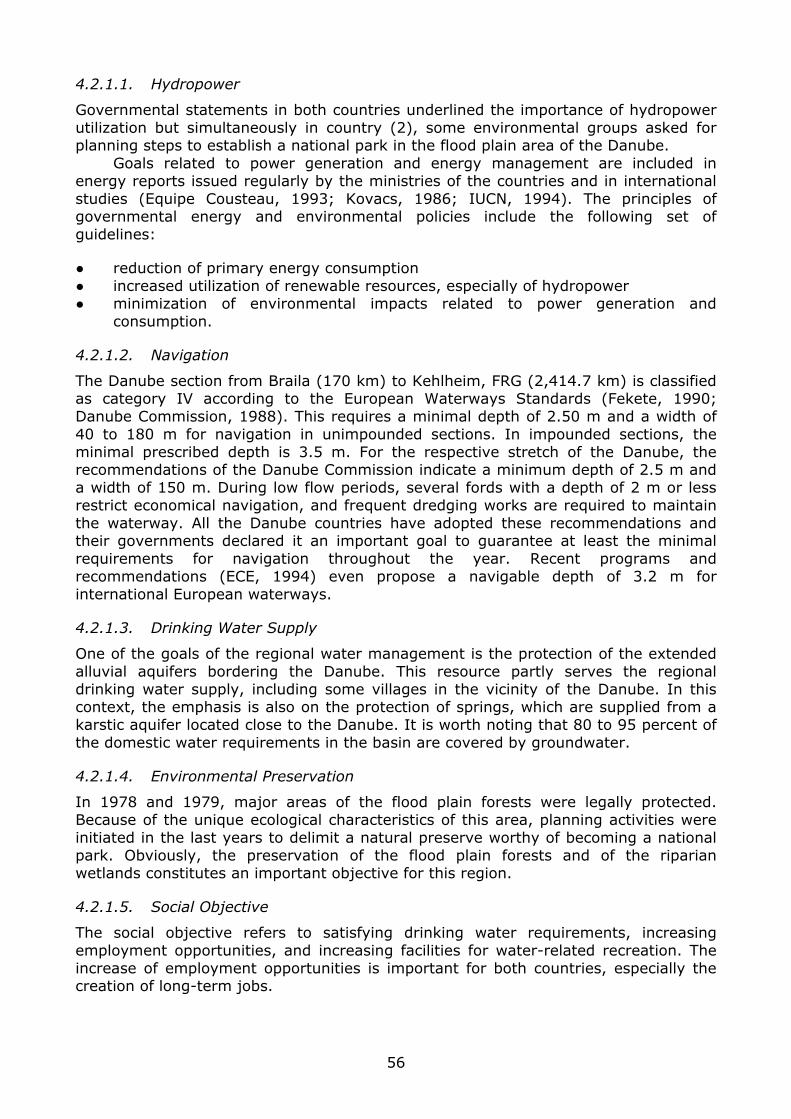
4.2.1.1. Hydropower
Governmental statements in both countries underlined the importance of hydropower utilization but simultaneously in country (2), some environmental groups asked for planning steps to establish a national park in the flood plain area of the Danube. Goals related to power generation and energy management are included in energy reports issued regularly by the ministries of the countries and in international studies (Equipe Cousteau, 1993; Kovacs, 1986; IUCN, 1994). The principles of governmental energy and environmental policies include the following set of guidelines:
● reduction of primary energy consumption ● increased utilization of renewable resources, especially of hydropower ● minimization of environmental impacts related to power generation and
consumption.
4.2.1.2. Navigation
The Danube section from Braila (170 km) to Kehlheim, FRG (2,414.7 km) is classified as category IV according to the European Waterways Standards (Fekete, 1990; Danube Commission, 1988). This requires a minimal depth of 2.50 m and a width of 40 to 180 m for navigation in unimpounded sections. In impounded sections, the minimal prescribed depth is 3.5 m. For the respective stretch of the Danube, the recommendations of the Danube Commission indicate a minimum depth of 2.5 m and a width of 150 m. During low flow periods, several fords with a depth of 2 m or less restrict economical navigation, and frequent dredging works are required to maintain the waterway. All the Danube countries have adopted these recommendations and their governments declared it an important goal to guarantee at least the minimal requirements for navigation throughout the year. Recent programs and recommendations (ECE, 1994) even propose a navigable depth of 3.2 m for international European waterways.
4.2.1.3. Drinking Water Supply
One of the goals of the regional water management is the protection of the extended alluvial aquifers bordering the Danube. This resource partly serves the regional drinking water supply, including some villages in the vicinity of the Danube. In this context, the emphasis is also on the protection of springs, which are supplied from a karstic aquifer located close to the Danube. It is worth noting that 80 to 95 percent of the domestic water requirements in the basin are covered by groundwater.
4.2.1.4. Environmental Preservation
In 1978 and 1979, major areas of the flood plain forests were legally protected. Because of the unique ecological characteristics of this area, planning activities were initiated in the last years to delimit a natural preserve worthy of becoming a national park. Obviously, the preservation of the flood plain forests and of the riparian wetlands constitutes an important objective for this region.
4.2.1.5. Social Objective
The social objective refers to satisfying drinking water requirements, increasing employment opportunities, and increasing facilities for water-related recreation. The increase of employment opportunities is important for both countries, especially the creation of long-term jobs.
56
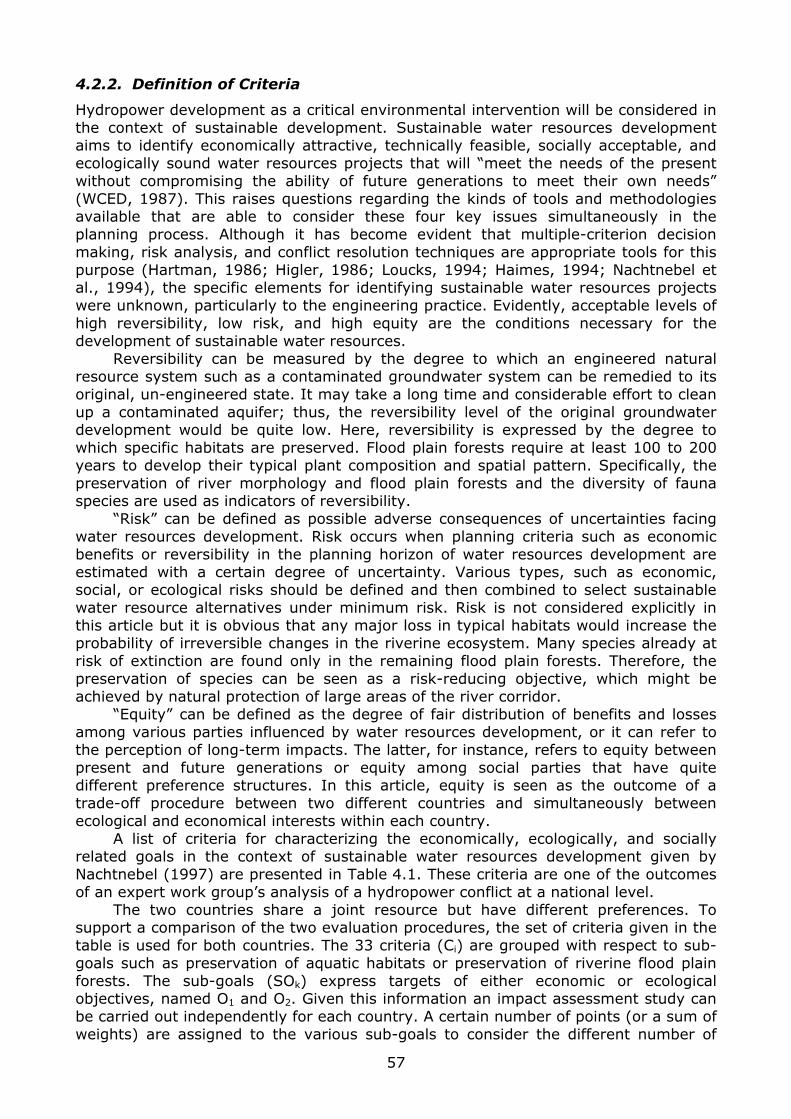
4.2.2. Definition of Criteria
Hydropower development as a critical environmental intervention will be considered in the context of sustainable development. Sustainable water resources development aims to identify economically attractive, technically feasible, socially acceptable, and ecologically sound water resources projects that will “meet the needs of the present without compromising the ability of future generations to meet their own needs” (WCED, 1987). This raises questions regarding the kinds of tools and methodologies available that are able to consider these four key issues simultaneously in the planning process. Although it has become evident that multiple-criterion decision making, risk analysis, and conflict resolution techniques are appropriate tools for this purpose (Hartman, 1986; Higler, 1986; Loucks, 1994; Haimes, 1994; Nachtnebel et al., 1994), the specific elements for identifying sustainable water resources projects were unknown, particularly to the engineering practice. Evidently, acceptable levels of high reversibility, low risk, and high equity are the conditions necessary for the development of sustainable water resources. Reversibility can be measured by the degree to which an engineered natural resource system such as a contaminated groundwater system can be remedied to its original, un-engineered state. It may take a long time and considerable effort to clean up a contaminated aquifer; thus, the reversibility level of the original groundwater development would be quite low. Here, reversibility is expressed by the degree to which specific habitats are preserved. Flood plain forests require at least 100 to 200 years to develop their typical plant composition and spatial pattern. Specifically, the preservation of river morphology and flood plain forests and the diversity of fauna species are used as indicators of reversibility. “Risk” can be defined as possible adverse consequences of uncertainties facing water resources development. Risk occurs when planning criteria such as economic benefits or reversibility in the planning horizon of water resources development are estimated with a certain degree of uncertainty. Various types, such as economic, social, or ecological risks should be defined and then combined to select sustainable water resource alternatives under minimum risk. Risk is not considered explicitly in this article but it is obvious that any major loss in typical habitats would increase the probability of irreversible changes in the riverine ecosystem. Many species already at risk of extinction are found only in the remaining flood plain forests. Therefore, the preservation of species can be seen as a risk-reducing objective, which might be achieved by natural protection of large areas of the river corridor. “Equity” can be defined as the degree of fair distribution of benefits and losses among various parties influenced by water resources development, or it can refer to the perception of long-term impacts. The latter, for instance, refers to equity between present and future generations or equity among social parties that have quite different preference structures. In this article, equity is seen as the outcome of a trade-off procedure between two different countries and simultaneously between ecological and economical interests within each country. A list of criteria for characterizing the economically, ecologically, and socially related goals in the context of sustainable water resources development given by Nachtnebel (1997) are presented in Table 4.1. These criteria are one of the outcomes of an expert work group’s analysis of a hydropower conflict at a national level. The two countries share a joint resource but have different preferences. To support a comparison of the two evaluation procedures, the set of criteria given in the table is used for both countries. The 33 criteria (Ci) are grouped with respect to sub-goals such as preservation of aquatic habitats or preservation of riverine flood plain forests. The sub-goals (SOk) express targets of either economic or ecological objectives, named O1 and O2. Given this information an impact assessment study can be carried out independently for each country. A certain number of points (or a sum of weights) are assigned to the various sub-goals to consider the different number of
57
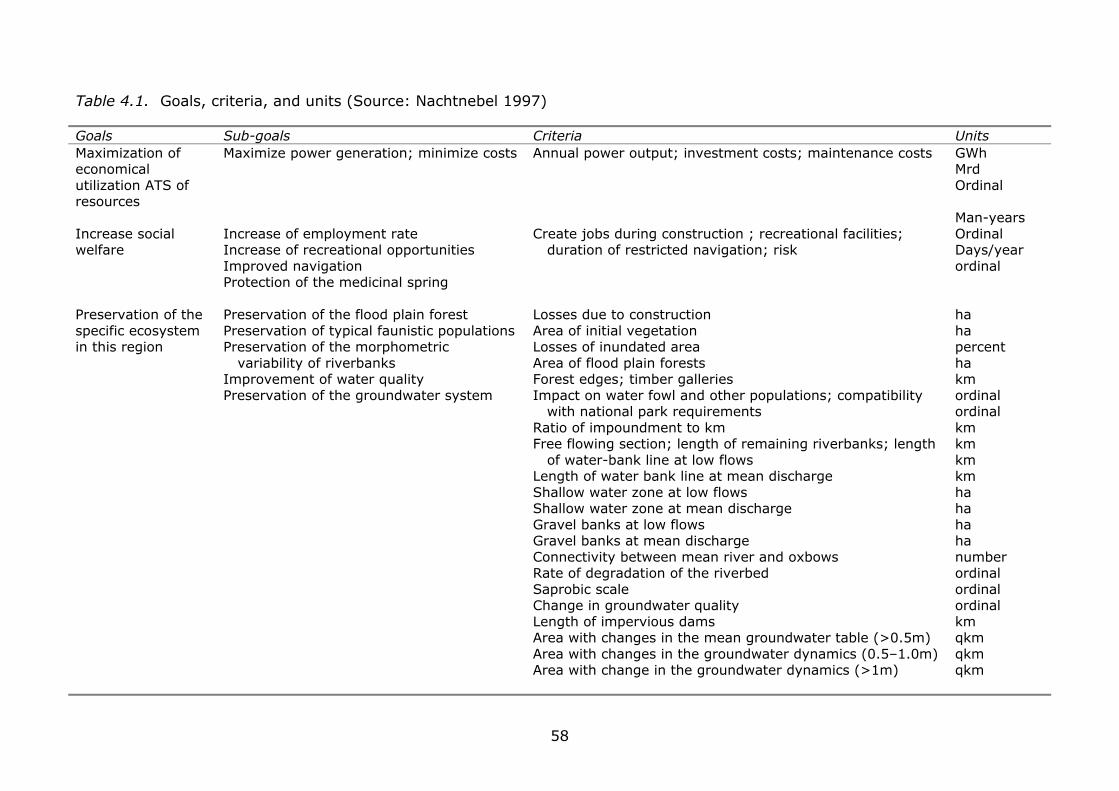
Table 4.1. Goals, criteria, and units (Source: Nachtnebel 1997)
Goals Sub-goals Criteria UnitsMaximization of economical utilization ATS of resources
Maximize power generation; minimize costs Annual power output; investment costs; maintenance costs GWh Mrd Ordinal
Increase social welfare
Increase of employment rate Increase of recreational opportunities Improved navigation Protection of the medicinal spring
Create jobs during construction ; recreational facilities; duration of restricted navigation; risk
Man-years Ordinal Days/year ordinal
Preservation of the specific ecosystem in this region
Preservation of the flood plain forest Preservation of typical faunistic populations Preservation of the morphometric variability of riverbanks Improvement of water quality Preservation of the groundwater system
Losses due to construction Area of initial vegetation Losses of inundated area Area of flood plain forests Forest edges; timber galleries Impact on water fowl and other populations; compatibility with national park requirements Ratio of impoundment to km Free flowing section; length of remaining riverbanks; length of water-bank line at low flows Length of water bank line at mean discharge Shallow water zone at low flows Shallow water zone at mean discharge Gravel banks at low flows Gravel banks at mean discharge Connectivity between mean river and oxbows Rate of degradation of the riverbed Saprobic scale Change in groundwater quality Length of impervious dams Area with changes in the mean groundwater table (>0.5m) Area with changes in the groundwater dynamics (0.5–1.0m) Area with change in the groundwater dynamics (>1m)
ha ha percent ha km ordinal ordinal km km km km ha ha ha ha number ordinal ordinal ordinal km qkm qkm qkm
58
criteria for the goals and to avoid any artificially introduced bias in the preferences. A balanced preference structure would be reflected by the allocation of an identical number of points or weights to different objectives, for example, economical development and ecological preservation. The aggregated weights are given in Table 4.2, reflecting the different preference structure of the two involved countries, and someone in an independent position, such as a referee, completes the table.
Table 4.2. Countries’ preferences expressed by the weights of the main objectives
Participant Economy Ecology Country 1 Country 2 Referee
140 80 100
60 120 100
Source: Nachtnebel (1997)
4.2.3. Multicriteria Approach for Group Decision making
Here, a sequential evaluation procedure based on composite programming (Bardossy and Duckstein, 1992) is applied to rank the alternatives. First, each country assesses and evaluates the impacts with respect to its preference structure, elaborates a plan evaluation table, and achieves a ranking of alternatives. If both countries would rank the same alternative as the best one then there would be no conflict among countries. Otherwise, in a second step, the alternatives that are as close as possible to both favored alternatives can be seen as compromise solutions for the parties in conflict. These identified alternatives need not be non-dominated solutions. The multicriterion approach, which is applied for each country, tries to identify compromise solutions by a simultaneous trade-off at several levels. At the beginning, as in many other multicriterion techniques, the elements of plan impact matrix (Cij), which express the output of alternative Aj with respect to criterion ci, are scaled to obtain the plan evaluation matrix (xij).
( ) ( )worstibestiijbestiij ccccx ,,, −−= (10)
The performance indicators xij are allocated to sub-goals SOk, which reflect for instance the preservation of aquatic habitats, which are in turn allocated to economy and ecology related objectives O1 and O2. Compromise programming identifies solutions by a simultaneous trade-off at the level of performance indicators, sub-goals and main objectives, expressed by a distance measure or Lp-norm. Considering alternatives j the outputs are obtained for each level by,
( ) ( ) { k
p
i
kp
ijjjkkj GIkxwSOPL ∈
== ∑
1
} (11)
∑∑ == 1ii
k wwithww (12)
( ) ( ) { m
qi
k
qijkkj HkSOwOQL ∈
== ∑
1
111 } (13)
∑=k
kww1 (14)
( ) ( ) r
i
rjjj OwOrL
12
111
= ∑
== (15)
59
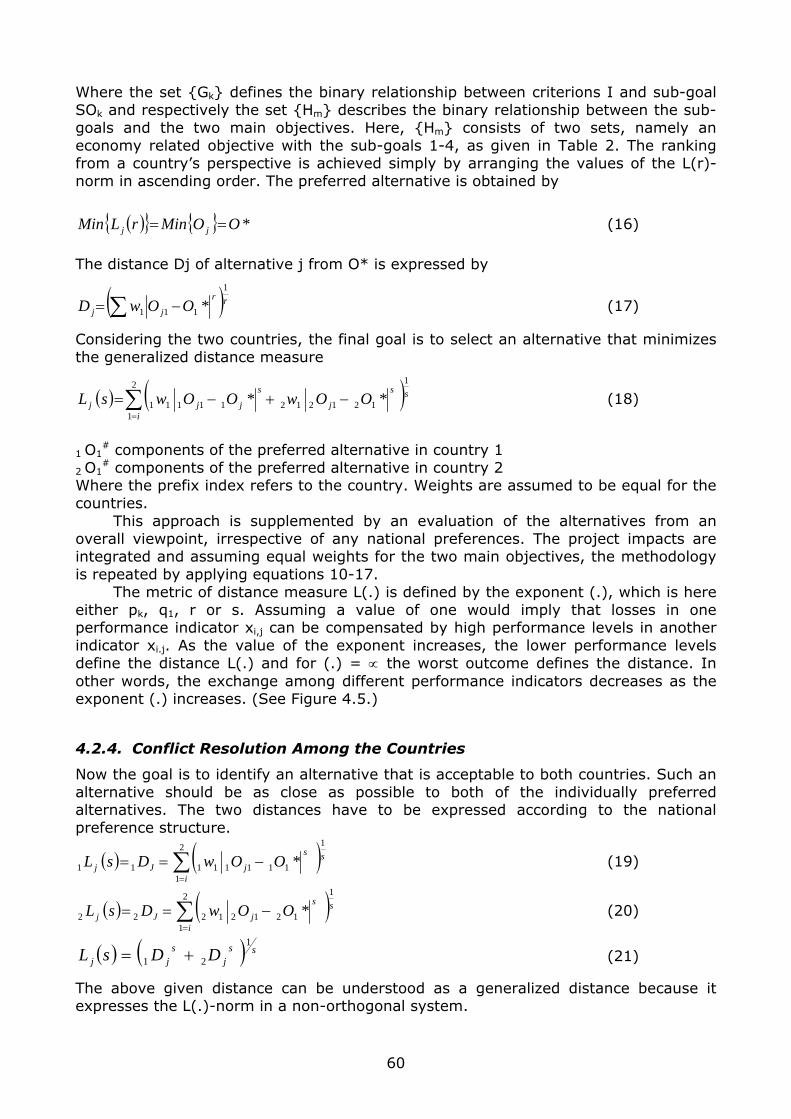
Where the set {Gk} defines the binary relationship between criterions I and sub-goal SOk and respectively the set {Hm} describes the binary relationship between the sub-goals and the two main objectives. Here, {Hm} consists of two sets, namely an economy related objective with the sub-goals 1-4, as given in Table 2. The ranking from a country’s perspective is achieved simply by arranging the values of the L(r)-norm in ascending order. The preferred alternative is obtained by
( ){ } { } *OOMinrLMin jj == (16)
The distance Dj of alternative j from O* is expressed by
( )rr
jj OOwD1
111 *∑ −= (17)
Considering the two countries, the final goal is to select an alternative that minimizes the generalized distance measure
( ) ( )∑=
−+−=2
1
1
12121211111 **i
ss
j
s
jjj OOwOOwsL (18)
1 O1
# components of the preferred alternative in country 1 2 O1
# components of the preferred alternative in country 2 Where the prefix index refers to the country. Weights are assumed to be equal for the countries. This approach is supplemented by an evaluation of the alternatives from an overall viewpoint, irrespective of any national preferences. The project impacts are integrated and assuming equal weights for the two main objectives, the methodology is repeated by applying equations 10-17. The metric of distance measure L(.) is defined by the exponent (.), which is here either pk, q1, r or s. Assuming a value of one would imply that losses in one performance indicator xi,j can be compensated by high performance levels in another indicator xi.j. As the value of the exponent increases, the lower performance levels define the distance L(.) and for (.) = ∝ the worst outcome defines the distance. In other words, the exchange among different performance indicators decreases as the exponent (.) increases. (See Figure 4.5.)
4.2.4. Conflict Resolution Among the Countries
Now the goal is to identify an alternative that is acceptable to both countries. Such an alternative should be as close as possible to both of the individually preferred alternatives. The two distances have to be expressed according to the national preference structure.
( ) ( )∑=
−==2
1
1
11111111 *i
ss
jJj OOwDsL (19)
( ) ( )∑=
−==2
1
1
12121222 *i
ss
jJj OOwDsL (20)
( ) ( ) ssj
sjj DDsL
1
21 += (21)
The above given distance can be understood as a generalized distance because it expresses the L(.)-norm in a non-orthogonal system.
60
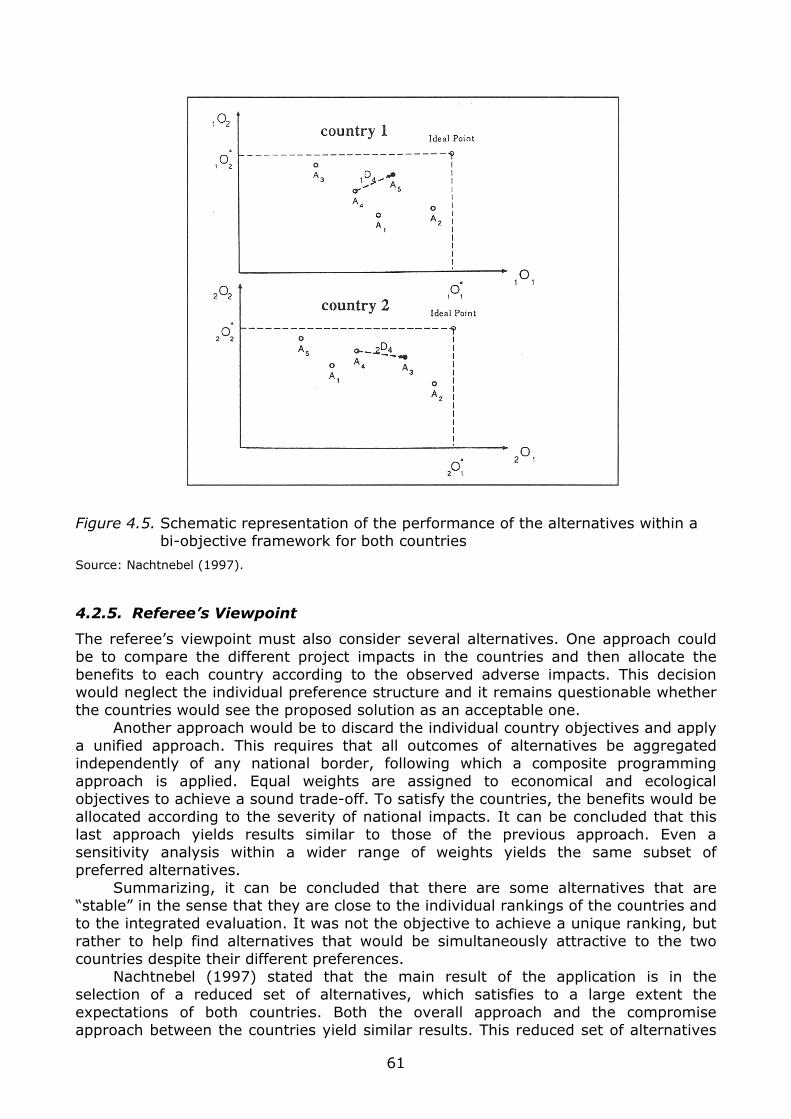
Figure 4.5. Schematic representation of the performance of the alternatives within a bi-objective framework for both countries
Source: Nachtnebel (1997).
4.2.5. Referee’s Viewpoint
The referee’s viewpoint must also consider several alternatives. One approach could be to compare the different project impacts in the countries and then allocate the benefits to each country according to the observed adverse impacts. This decision would neglect the individual preference structure and it remains questionable whether the countries would see the proposed solution as an acceptable one. Another approach would be to discard the individual country objectives and apply a unified approach. This requires that all outcomes of alternatives be aggregated independently of any national border, following which a composite programming approach is applied. Equal weights are assigned to economical and ecological objectives to achieve a sound trade-off. To satisfy the countries, the benefits would be allocated according to the severity of national impacts. It can be concluded that this last approach yields results similar to those of the previous approach. Even a sensitivity analysis within a wider range of weights yields the same subset of preferred alternatives. Summarizing, it can be concluded that there are some alternatives that are “stable” in the sense that they are close to the individual rankings of the countries and to the integrated evaluation. It was not the objective to achieve a unique ranking, but rather to help find alternatives that would be simultaneously attractive to the two countries despite their different preferences. Nachtnebel (1997) stated that the main result of the application is in the selection of a reduced set of alternatives, which satisfies to a large extent the expectations of both countries. Both the overall approach and the compromise approach between the countries yield similar results. This reduced set of alternatives
61
would provide a basis for a more focused discussion and negotiation process. The disadvantage is in the somewhat arbitrary definition of distance and in the possibility that dominated solutions might be obtained.
4.3. Resolution of Water Conflicts between Canada and the United States
4.3.1. Introduction
There have been no wars between Canada and the United States of America since the War of 1812–14, when invading forces failed to wrest control of Upper and Lower Canada from Great Britain. For more than a century, citizens of these two friendly neighbors have been proud to proclaim that they share the world’s longest unguarded border, stretching almost 5,000 km across the middle of North America from the Atlantic to the Pacific. The peaceful status of this border is in part a result of certain well-conceived treaties that encourage cooperation and minimize frictions. For example, Canada, the United States, and Mexico have formed the North American Free Trade Association (NAFTA), to regulate trade among the three countries and resolve trade disputes. Among the agreements between Canada and the United States, the greatest jewel may well be the Boundary Waters Treaty of 1909. Under this treaty, the International Joint Commission (IJC) was established to study and recommend on water allocation, water quality, and other environmental problems that cross the Canada–United States border. The numerous recommendations by the IJC on the solution of complex water and environmental problems have been remarkably free from bias. The Boundary Waters Treaty constitutes an excellent model for other countries considering international agreements about shared water resources. Hipel et al. (2002) used the graph model for conflict resolution, a comprehensive approach to conflict analysis, to illustrate the strategic aspects of international water conflicts. The decision support system GMCR II facilitates the application. The conflict to be analyzed is a multi-party water dispute that concerned development along the Flathead River, which crosses from British Columbia into Montana. The elements of the graph model, and the design of GMCR II, are outlined. Subsequently, the Flathead River conflict is described and then systematically modeled and analyzed using GMCR II. As demonstrated using this example, water disputes can be resolved fairly and equitably within the purview of the Boundary Waters Treaty.
4.3.2. The Graph Model for Conflict Resolution and GMCR II
In a graph model of a conflict (Fang et al., 1993), the decision makers (DMs) and the possible states of the conflict are specified, along with the state transitions controlled by each DM. A graph model also includes each DM’s ordinal ranking of all possible states as resolutions of the conflict. When a graph model is analyzed, each state is assessed for stability from the point of view of each DM. A state is stable for a DM if that DM would choose not to depart from it, should it arise. Solution concepts are models of the DM’s thinking processes in deciding what would be the likely outcome of a move away from a given state. Note that a state may be stable under some solution concepts but not others. Of course, different DMs may have different solution concepts. A state that all DMs find stable is equilibrium, and constitutes a possible resolution of the conflict model. Kilgour et al. (1995, 1996) demonstrated the value of the graph model as an analysis tool for negotiation problems. In Table 4.3, different solution concepts imply different levels of foresight, or measure a DM’s ability to consider possible moves that could take place in the future. A DM with high foresight thinks further ahead. Nash stability (R) has low foresight, and the level of the foresight increases from low at the top to high at the bottom.
62
Nonmyopic stability (NM) has the highest foresight and limited-move stability (Lh) has variable foresight level given by the parameter h. Some solution concepts, such as Lh and NM, allow strategic disimprovements, which occur when a DM (temporarily) moves to a worse state in order to reach a more preferred state eventually; other solution concepts, such as R and sequential stability (SEQ), never allow disimprovements; still others, general metarationality (GMR) and symmetric metarationality (GMR) permit strategic disimprovements by opponents only. Different solution concepts also imply different levels of preference knowledge. Under R, GMR, and SMR, a DM need only know its own preferences, while a DM must know the preference information for all DMs for solution concepts SEQ, Lh and NM.
Table 4.3. Solution concepts and human behavior
Solution Concepts Stability Description
Nash stability (R) DM cannot unilaterally move to a more preferred state.
General metarationality (GMR)
All DM’s unilateral improvements are sanctioned by subsequent unilateral moves by others.
Symmetric metarationality (SMR)
All DM’s unilateral improvements are still sanctioned even after a possible response by the original DM.
Sequential stability (SEQ)
All of the DM’s unilateral improvements are sanctioned by subsequent unilateral improvements by others.
Limit-move stability (Lh)
All DMs are assumed to act optimally and (h) a fixed numbers of state transitions are specified.
Nonmyopic stability (NM) Limiting case of limited-move stability as the number of state transitions increases to infinity.
Source: Hipel et al. (2002).
The decision support system GMCR II implements the Graph Model for Conflict Resolution within a Windows environment (GMCR II, 2000; Hipel et al., 1997b). The structure of GMCR II is shown in Figure 4.6. The modeling subsystem of GMCR II allows users to enter conflict models conveniently and expeditiously. Users input DMs and options, patterns of infeasible states, allowable transitions and preference information. Then GMCR II will generate the required input for stability analysis, including:
● feasible states ● allowable state transitions ● ranking of states from most to least preferred, allowing ties, for each DM.
Based on the information generated at the modeling stage, the analysis engine performs a thorough stability analysis on the conflict model. The analysis engine can produce a large amount of output data, including the stability results for every state, and for each DM, under the wide variety of solution concepts listed in Table 4.3. The output interpretation subsystem presents the results from the analysis engine in a user-friendly manner. Information about individual stability, equilibria, and coalition stability is easily identified and compared.
63
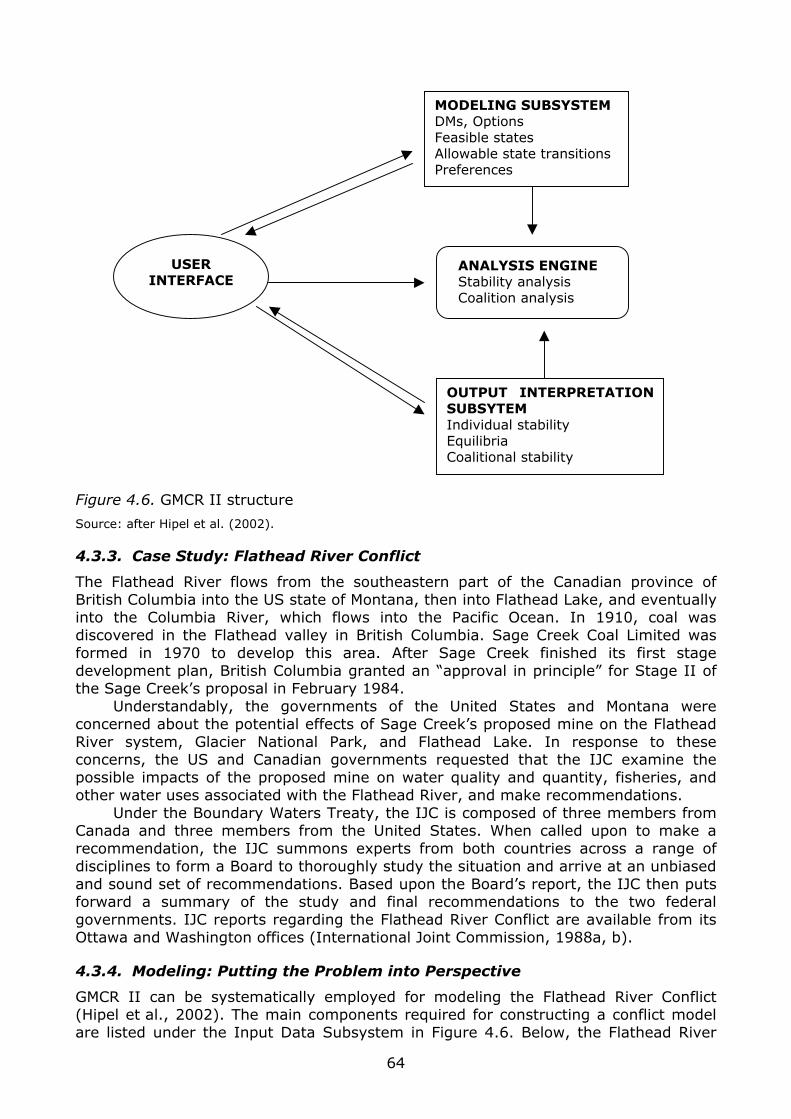
OUTPUT INTERPRETATIONSUBSYTEM Individual stability Equilibria Coalitional stability
ANALYSIS ENGINE Stability analysis Coalition analysis
MODELING SUBSYSTEM DMs, Options Feasible states Allowable state transitions Preferences
USER INTERFACE
Figure 4.6. GMCR II structure
Source: after Hipel et al. (2002).
4.3.3. Case Study: Flathead River Conflict
The Flathead River flows from the southeastern part of the Canadian province of British Columbia into the US state of Montana, then into Flathead Lake, and eventually into the Columbia River, which flows into the Pacific Ocean. In 1910, coal was discovered in the Flathead valley in British Columbia. Sage Creek Coal Limited was formed in 1970 to develop this area. After Sage Creek finished its first stage development plan, British Columbia granted an “approval in principle” for Stage II of the Sage Creek’s proposal in February 1984. Understandably, the governments of the United States and Montana were concerned about the potential effects of Sage Creek’s proposed mine on the Flathead River system, Glacier National Park, and Flathead Lake. In response to these concerns, the US and Canadian governments requested that the IJC examine the possible impacts of the proposed mine on water quality and quantity, fisheries, and other water uses associated with the Flathead River, and make recommendations. Under the Boundary Waters Treaty, the IJC is composed of three members from Canada and three members from the United States. When called upon to make a recommendation, the IJC summons experts from both countries across a range of disciplines to form a Board to thoroughly study the situation and arrive at an unbiased and sound set of recommendations. Based upon the Board’s report, the IJC then puts forward a summary of the study and final recommendations to the two federal governments. IJC reports regarding the Flathead River Conflict are available from its Ottawa and Washington offices (International Joint Commission, 1988a, b).
4.3.4. Modeling: Putting the Problem into Perspective
GMCR II can be systematically employed for modeling the Flathead River Conflict (Hipel et al., 2002). The main components required for constructing a conflict model are listed under the Input Data Subsystem in Figure 4.6. Below, the Flathead River
64
Conflict is modeled for the point in time just before the IJC made its recommendations in December 1988. The Flathead River conflict was studied using an earlier version of GMCR by Hipel et al. (1997a). Here, a somewhat different model of the conflict is developed and more detailed modeling and analytical results are presented and explained.
4.3.4.1. Decision Makers and Options
● Sage Creek Coal Limited (Sage Creek). Sage Creek Coal Limited was the developer of the proposed mine. As of 1988, Sage Creek already had substantial financial and other commitments to the Flathead River Development project. Therefore, Sage Creek hoped that the IJC could recommend the continuation of the development proposal, which would encourage the provincial government of British Columbia to issue a full Stage II license.
● Province of British Columbia (BC). The provincial government could issue the license for the mining on its own but it had to consider the potential environmental impact assessment. In addition, pressure from the federal government of Canada and from the United States also had to be taken into account.
● State of Montana (Montana). The Montana government worried about the potential pollution and environmental degradation that might be caused by the proposed mining development. Environmental groups and the US Department of the Interior agreed fully with the Montana State government on this issue.
● International Joint Commission (IJC). The IJC appointed the Flathead River International Study Board to examine the Flathead problem (IJC, 1988a), and based upon the Board’s findings made its recommendations to the governments of Canada and the USA (IJC, 1988b).
Other DMs, such as the federal governments of Canada and the United States, were not considered in this model because they were not directly involved in the dispute at this stage. In addition, environmental groups from both the United States and Canada were included with Montana as a single DM because they had similar viewpoints. The DMs and their options are displayed in Table 4.4. As of December 1988, Sage Creek could continue the original project, modify it to reduce environmental impacts, or stop it by not selecting either the option to continue or to modify. The provincial government of British Columbia (BC) could issue a license to support the original development, or a project with suitable modification, or it could force Sage Creek to stop its development by not granting any license. Montana could continue to oppose any development or withdraw its opposition by not opposing. The IJC could recommend either the original, or a modification, or no project at all. In Table 4.4, a “Y” opposite to an option indicates “Yes” the option is selected by the DM controlling it, whereas an “N” corresponds to “No”, the option is not taken. A strategy for a given DM is any feasible combination of its options. For example, in the state shown in Table 4.4, BC is selecting the option “Original” and rejecting the option “Modification”. Similar explanations can be applied to the other three DMs shown. A state is formed when each DM selects a strategy. As an example, Table 4.4 shows the status quo state existing in 1988. Written horizontally in text, the status quo state (YN YN Y NNN) is created by Sage Creek, BC, Montana, and the IJC following strategies (YN), (YN), (Y), and (NNN), respectively. In GMCR II, users go to the main menu “Conflict” to enter the description of the conflict model. Under this menu, users can input the title of the conflict, the date of analysis for the model, and a brief introduction of the conflict. Then they input information about DMs and their options by going to “Modeling -> States -> Generate
65
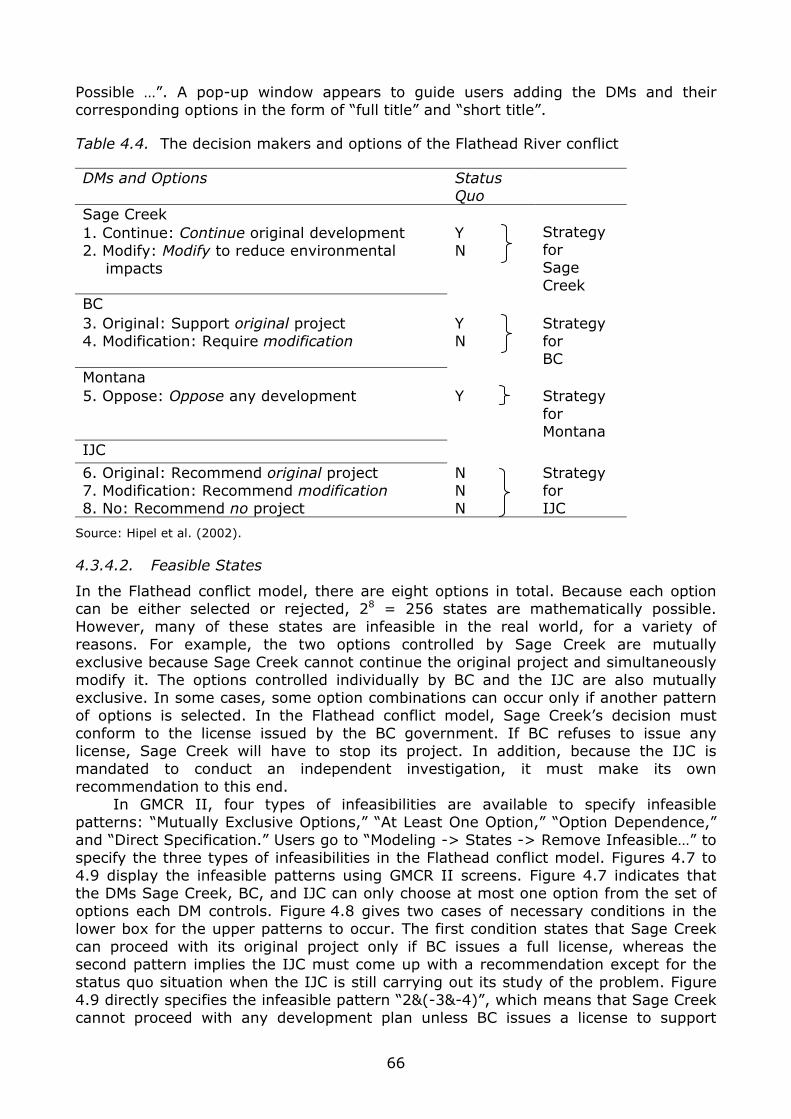
Possible …”. A pop-up window appears to guide users adding the DMs and their corresponding options in the form of “full title” and “short title”.
Table 4.4. The decision makers and options of the Flathead River conflict
DMs and Options Status Quo
Sage Creek 1. Continue: Continue original development 2. Modify: Modify to reduce environmental
impacts
Y N
Strategy for Sage Creek
BC 3. Original: Support original project 4. Modification: Require modification
Y N
Strategy for BC
Montana 5. Oppose: Oppose any development Y Strategy
for Montana
IJC
6. Original: Recommend original project 7. Modification: Recommend modification 8. No: Recommend no project
N N N
Strategy for IJC
Source: Hipel et al. (2002).
4.3.4.2. Feasible States
In the Flathead conflict model, there are eight options in total. Because each option can be either selected or rejected, 28 = 256 states are mathematically possible. However, many of these states are infeasible in the real world, for a variety of reasons. For example, the two options controlled by Sage Creek are mutually exclusive because Sage Creek cannot continue the original project and simultaneously modify it. The options controlled individually by BC and the IJC are also mutually exclusive. In some cases, some option combinations can occur only if another pattern of options is selected. In the Flathead conflict model, Sage Creek’s decision must conform to the license issued by the BC government. If BC refuses to issue any license, Sage Creek will have to stop its project. In addition, because the IJC is mandated to conduct an independent investigation, it must make its own recommendation to this end. In GMCR II, four types of infeasibilities are available to specify infeasible patterns: “Mutually Exclusive Options,” “At Least One Option,” “Option Dependence,” and “Direct Specification.” Users go to “Modeling -> States -> Remove Infeasible…” to specify the three types of infeasibilities in the Flathead conflict model. Figures 4.7 to 4.9 display the infeasible patterns using GMCR II screens. Figure 4.7 indicates that the DMs Sage Creek, BC, and IJC can only choose at most one option from the set of options each DM controls. Figure 4.8 gives two cases of necessary conditions in the lower box for the upper patterns to occur. The first condition states that Sage Creek can proceed with its original project only if BC issues a full license, whereas the second pattern implies the IJC must come up with a recommendation except for the status quo situation when the IJC is still carrying out its study of the problem. Figure 4.9 directly specifies the infeasible pattern “2&(-3&-4)”, which means that Sage Creek cannot proceed with any development plan unless BC issues a license to support
66
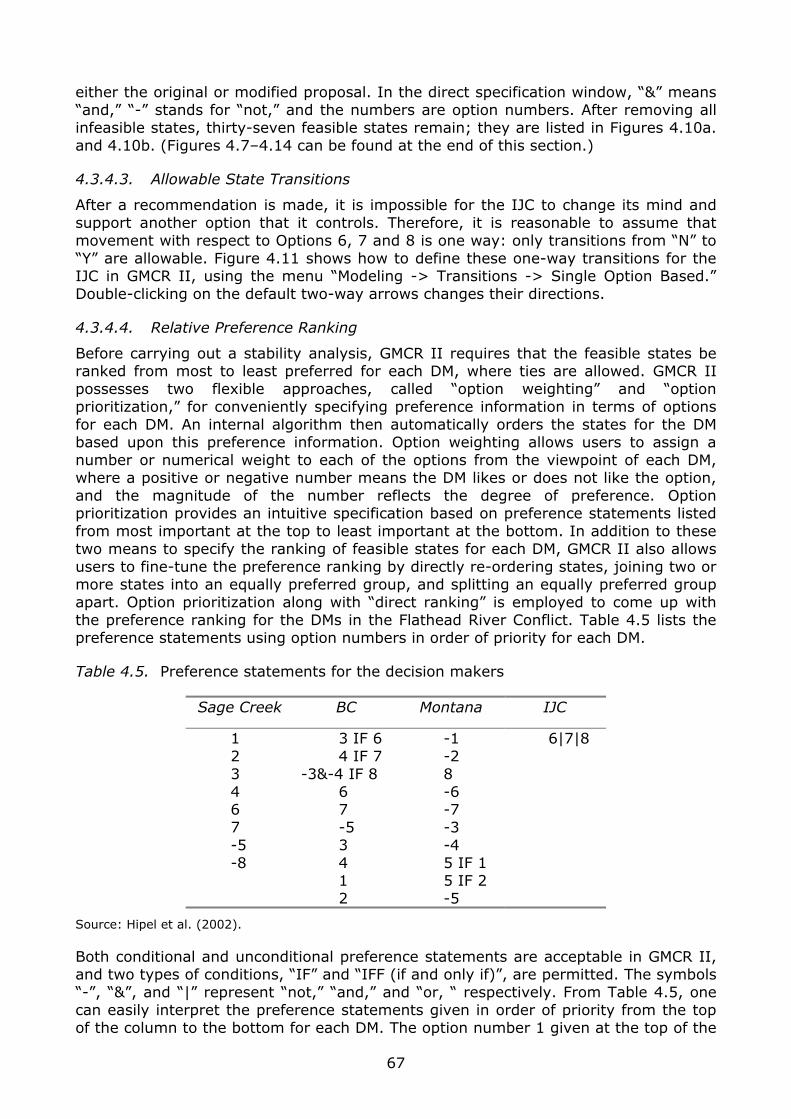
either the original or modified proposal. In the direct specification window, “&” means “and,” “-” stands for “not,” and the numbers are option numbers. After removing all infeasible states, thirty-seven feasible states remain; they are listed in Figures 4.10a. and 4.10b. (Figures 4.7–4.14 can be found at the end of this section.)
4.3.4.3. Allowable State Transitions
After a recommendation is made, it is impossible for the IJC to change its mind and support another option that it controls. Therefore, it is reasonable to assume that movement with respect to Options 6, 7 and 8 is one way: only transitions from “N” to “Y” are allowable. Figure 4.11 shows how to define these one-way transitions for the IJC in GMCR II, using the menu “Modeling -> Transitions -> Single Option Based.” Double-clicking on the default two-way arrows changes their directions.
4.3.4.4. Relative Preference Ranking
Before carrying out a stability analysis, GMCR II requires that the feasible states be ranked from most to least preferred for each DM, where ties are allowed. GMCR II possesses two flexible approaches, called “option weighting” and “option prioritization,” for conveniently specifying preference information in terms of options for each DM. An internal algorithm then automatically orders the states for the DM based upon this preference information. Option weighting allows users to assign a number or numerical weight to each of the options from the viewpoint of each DM, where a positive or negative number means the DM likes or does not like the option, and the magnitude of the number reflects the degree of preference. Option prioritization provides an intuitive specification based on preference statements listed from most important at the top to least important at the bottom. In addition to these two means to specify the ranking of feasible states for each DM, GMCR II also allows users to fine-tune the preference ranking by directly re-ordering states, joining two or more states into an equally preferred group, and splitting an equally preferred group apart. Option prioritization along with “direct ranking” is employed to come up with the preference ranking for the DMs in the Flathead River Conflict. Table 4.5 lists the preference statements using option numbers in order of priority for each DM.
Table 4.5. Preference statements for the decision makers
Sage Creek BC Montana IJC
1 2 3 4 6 7 -5 -8
3 IF 6 4 IF 7 -3&-4 IF 8 6 7 -5 3 4 1 2
-1 -2 8 -6 -7 -3 -4 5 IF 1 5 IF 2 -5
6|7|8
Source: Hipel et al. (2002).
Both conditional and unconditional preference statements are acceptable in GMCR II, and two types of conditions, “IF” and “IFF (if and only if)”, are permitted. The symbols “-”, “&”, and “|” represent “not,” “and,” and “or, “ respectively. From Table 4.5, one can easily interpret the preference statements given in order of priority from the top of the column to the bottom for each DM. The option number 1 given at the top of the
67
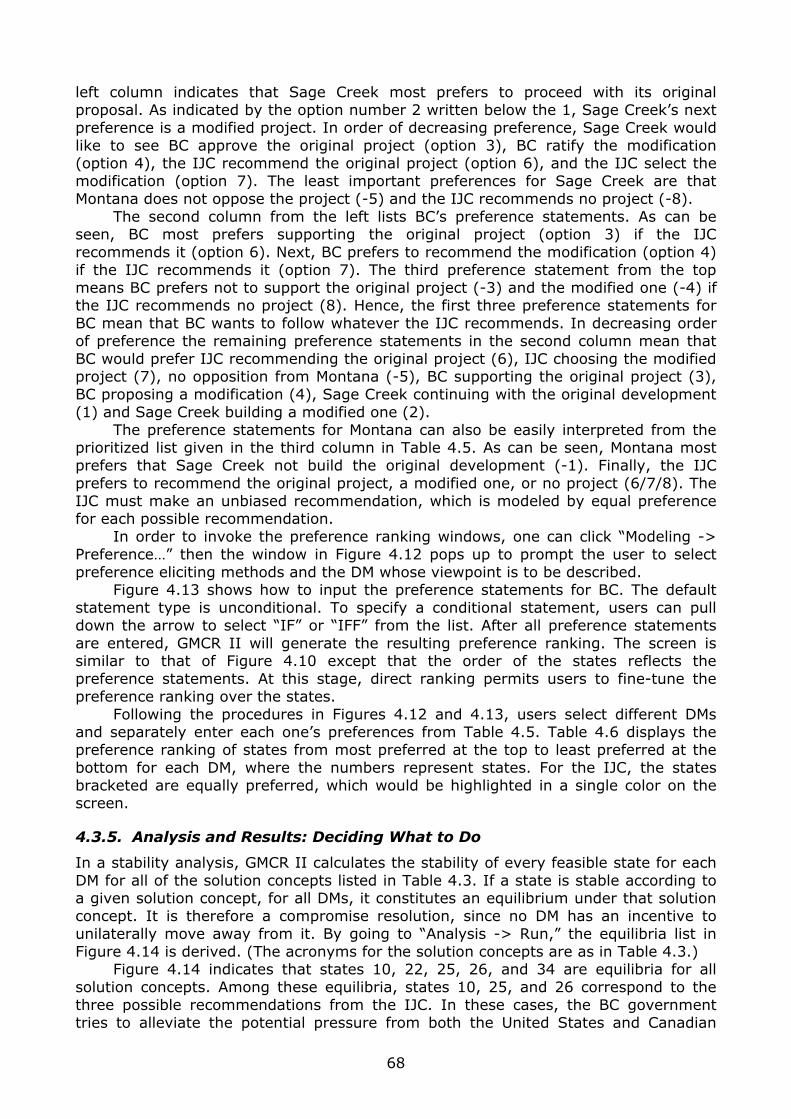
left column indicates that Sage Creek most prefers to proceed with its original proposal. As indicated by the option number 2 written below the 1, Sage Creek’s next preference is a modified project. In order of decreasing preference, Sage Creek would like to see BC approve the original project (option 3), BC ratify the modification (option 4), the IJC recommend the original project (option 6), and the IJC select the modification (option 7). The least important preferences for Sage Creek are that Montana does not oppose the project (-5) and the IJC recommends no project (-8). The second column from the left lists BC’s preference statements. As can be seen, BC most prefers supporting the original project (option 3) if the IJC recommends it (option 6). Next, BC prefers to recommend the modification (option 4) if the IJC recommends it (option 7). The third preference statement from the top means BC prefers not to support the original project (-3) and the modified one (-4) if the IJC recommends no project (8). Hence, the first three preference statements for BC mean that BC wants to follow whatever the IJC recommends. In decreasing order of preference the remaining preference statements in the second column mean that BC would prefer IJC recommending the original project (6), IJC choosing the modified project (7), no opposition from Montana (-5), BC supporting the original project (3), BC proposing a modification (4), Sage Creek continuing with the original development (1) and Sage Creek building a modified one (2). The preference statements for Montana can also be easily interpreted from the prioritized list given in the third column in Table 4.5. As can be seen, Montana most prefers that Sage Creek not build the original development (-1). Finally, the IJC prefers to recommend the original project, a modified one, or no project (6/7/8). The IJC must make an unbiased recommendation, which is modeled by equal preference for each possible recommendation. In order to invoke the preference ranking windows, one can click “Modeling -> Preference…” then the window in Figure 4.12 pops up to prompt the user to select preference eliciting methods and the DM whose viewpoint is to be described. Figure 4.13 shows how to input the preference statements for BC. The default statement type is unconditional. To specify a conditional statement, users can pull down the arrow to select “IF” or “IFF” from the list. After all preference statements are entered, GMCR II will generate the resulting preference ranking. The screen is similar to that of Figure 4.10 except that the order of the states reflects the preference statements. At this stage, direct ranking permits users to fine-tune the preference ranking over the states. Following the procedures in Figures 4.12 and 4.13, users select different DMs and separately enter each one’s preferences from Table 4.5. Table 4.6 displays the preference ranking of states from most preferred at the top to least preferred at the bottom for each DM, where the numbers represent states. For the IJC, the states bracketed are equally preferred, which would be highlighted in a single color on the screen.
4.3.5. Analysis and Results: Deciding What to Do
In a stability analysis, GMCR II calculates the stability of every feasible state for each DM for all of the solution concepts listed in Table 4.3. If a state is stable according to a given solution concept, for all DMs, it constitutes an equilibrium under that solution concept. It is therefore a compromise resolution, since no DM has an incentive to unilaterally move away from it. By going to “Analysis -> Run,” the equilibria list in Figure 4.14 is derived. (The acronyms for the solution concepts are as in Table 4.3.) Figure 4.14 indicates that states 10, 22, 25, 26, and 34 are equilibria for all solution concepts. Among these equilibria, states 10, 25, and 26 correspond to the three possible recommendations from the IJC. In these cases, the BC government tries to alleviate the potential pressure from both the United States and Canadian
68
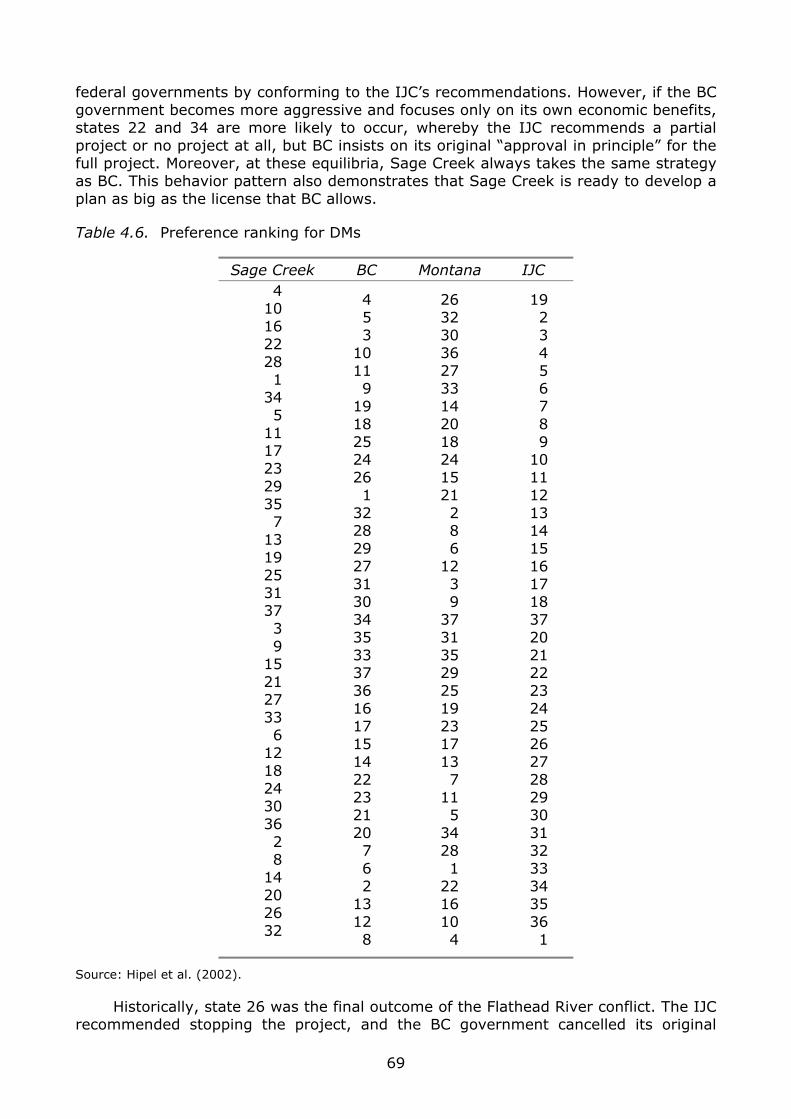
federal governments by conforming to the IJC’s recommendations. However, if the BC government becomes more aggressive and focuses only on its own economic benefits, states 22 and 34 are more likely to occur, whereby the IJC recommends a partial project or no project at all, but BC insists on its original “approval in principle” for the full project. Moreover, at these equilibria, Sage Creek always takes the same strategy as BC. This behavior pattern also demonstrates that Sage Creek is ready to develop a plan as big as the license that BC allows.
Table 4.6. Preference ranking for DMs
Sage Creek BC Montana IJC 4 10 16 22 28 1 34 5 11 17 23 29 35 7 13 19 25 31 37 3 9 15 21 27 33 6 12 18 24 30 36 2 8 14 20 26 32
4 5 3 10 11 9 19 18 25 24 26 1 32 28 29 27 31 30 34 35 33 37 36 16 17 15 14 22 23 21 20 7 6 2 13 12 8
26 32 30 36 27 33 14 20 18 24 15 21 2 8 6 12 3 9 37 31 35 29 25 19 23 17 13 7 11 5 34 28 1 22 16 10 4
19 2 3 4 5 6 7 8 9 10 11 12 13 14 15 16 17 18 37 20 21 22 23 24 25 26 27 28 29 30 31 32 33 34 35 36 1
Source: Hipel et al. (2002).
Historically, state 26 was the final outcome of the Flathead River conflict. The IJC recommended stopping the project, and the BC government cancelled its original
69
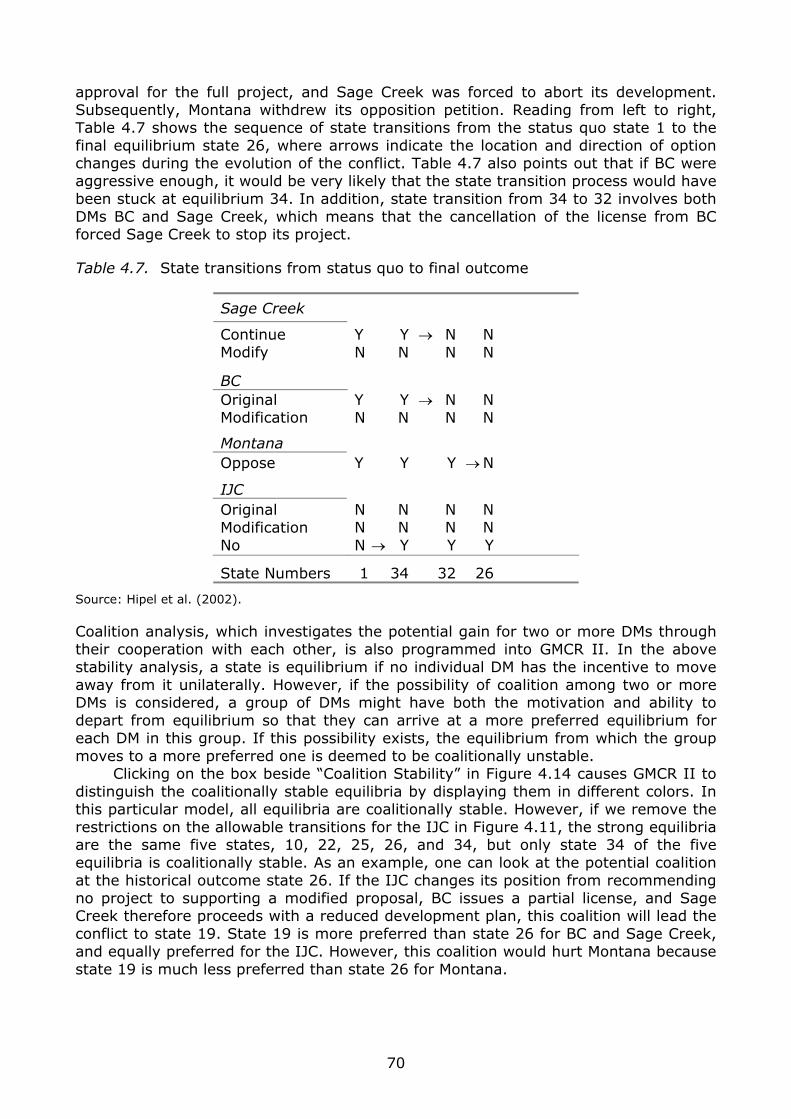
approval for the full project, and Sage Creek was forced to abort its development. Subsequently, Montana withdrew its opposition petition. Reading from left to right, Table 4.7 shows the sequence of state transitions from the status quo state 1 to the final equilibrium state 26, where arrows indicate the location and direction of option changes during the evolution of the conflict. Table 4.7 also points out that if BC were aggressive enough, it would be very likely that the state transition process would have been stuck at equilibrium 34. In addition, state transition from 34 to 32 involves both DMs BC and Sage Creek, which means that the cancellation of the license from BC forced Sage Creek to stop its project.
Table 4.7. State transitions from status quo to final outcome
Sage Creek
Continue Modify
Y Y → N N N N N N
BC Original Modification
Y Y → N N N N N N
Montana Oppose Y Y Y → N
IJC Original Modification No
N N N N N N N N N → Y Y Y
State Numbers 1 34 32 26
Source: Hipel et al. (2002).
Coalition analysis, which investigates the potential gain for two or more DMs through their cooperation with each other, is also programmed into GMCR II. In the above stability analysis, a state is equilibrium if no individual DM has the incentive to move away from it unilaterally. However, if the possibility of coalition among two or more DMs is considered, a group of DMs might have both the motivation and ability to depart from equilibrium so that they can arrive at a more preferred equilibrium for each DM in this group. If this possibility exists, the equilibrium from which the group moves to a more preferred one is deemed to be coalitionally unstable. Clicking on the box beside “Coalition Stability” in Figure 4.14 causes GMCR II to distinguish the coalitionally stable equilibria by displaying them in different colors. In this particular model, all equilibria are coalitionally stable. However, if we remove the restrictions on the allowable transitions for the IJC in Figure 4.11, the strong equilibria are the same five states, 10, 22, 25, 26, and 34, but only state 34 of the five equilibria is coalitionally stable. As an example, one can look at the potential coalition at the historical outcome state 26. If the IJC changes its position from recommending no project to supporting a modified proposal, BC issues a partial license, and Sage Creek therefore proceeds with a reduced development plan, this coalition will lead the conflict to state 19. State 19 is more preferred than state 26 for BC and Sage Creek, and equally preferred for the IJC. However, this coalition would hurt Montana because state 19 is much less preferred than state 26 for Montana.
70
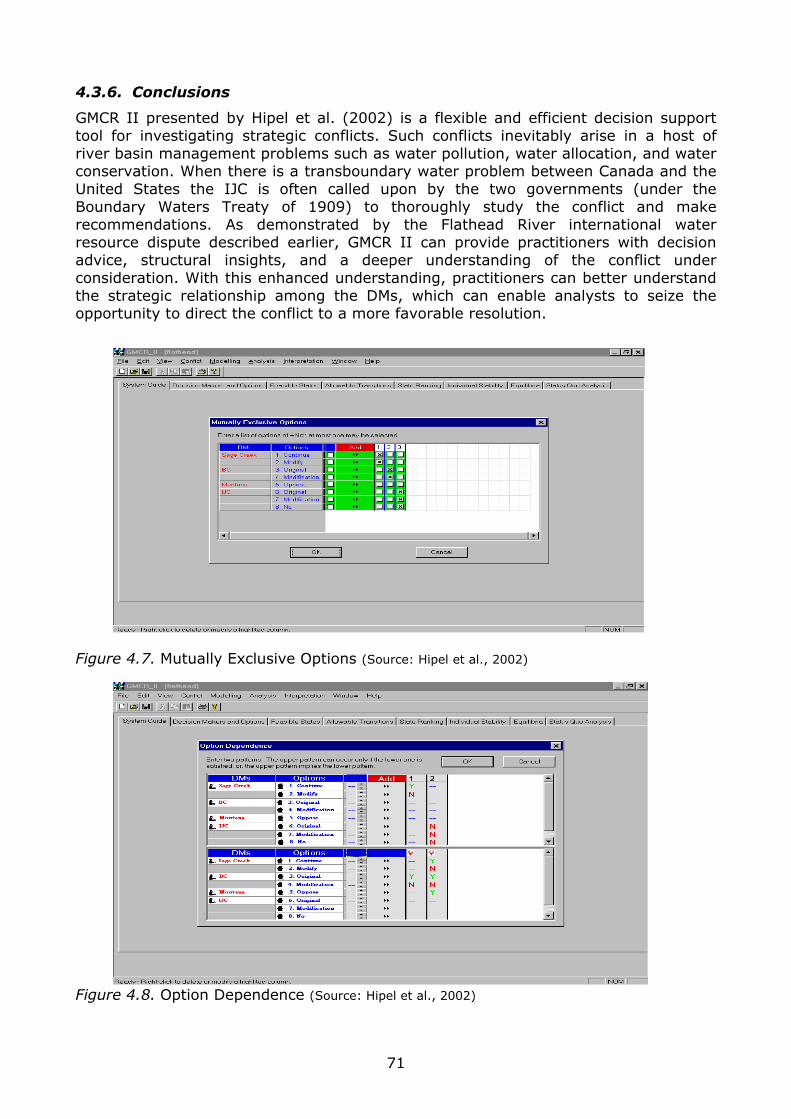
4.3.6. Conclusions
GMCR II presented by Hipel et al. (2002) is a flexible and efficient decision support tool for investigating strategic conflicts. Such conflicts inevitably arise in a host of river basin management problems such as water pollution, water allocation, and water conservation. When there is a transboundary water problem between Canada and the United States the IJC is often called upon by the two governments (under the Boundary Waters Treaty of 1909) to thoroughly study the conflict and make recommendations. As demonstrated by the Flathead River international water resource dispute described earlier, GMCR II can provide practitioners with decision advice, structural insights, and a deeper understanding of the conflict under consideration. With this enhanced understanding, practitioners can better understand the strategic relationship among the DMs, which can enable analysts to seize the opportunity to direct the conflict to a more favorable resolution.
Figure 4.7. Mutually Exclusive Options (Source: Hipel et al., 2002)
Figure 4.8. Option Dependence (Source: Hipel et al., 2002)
71
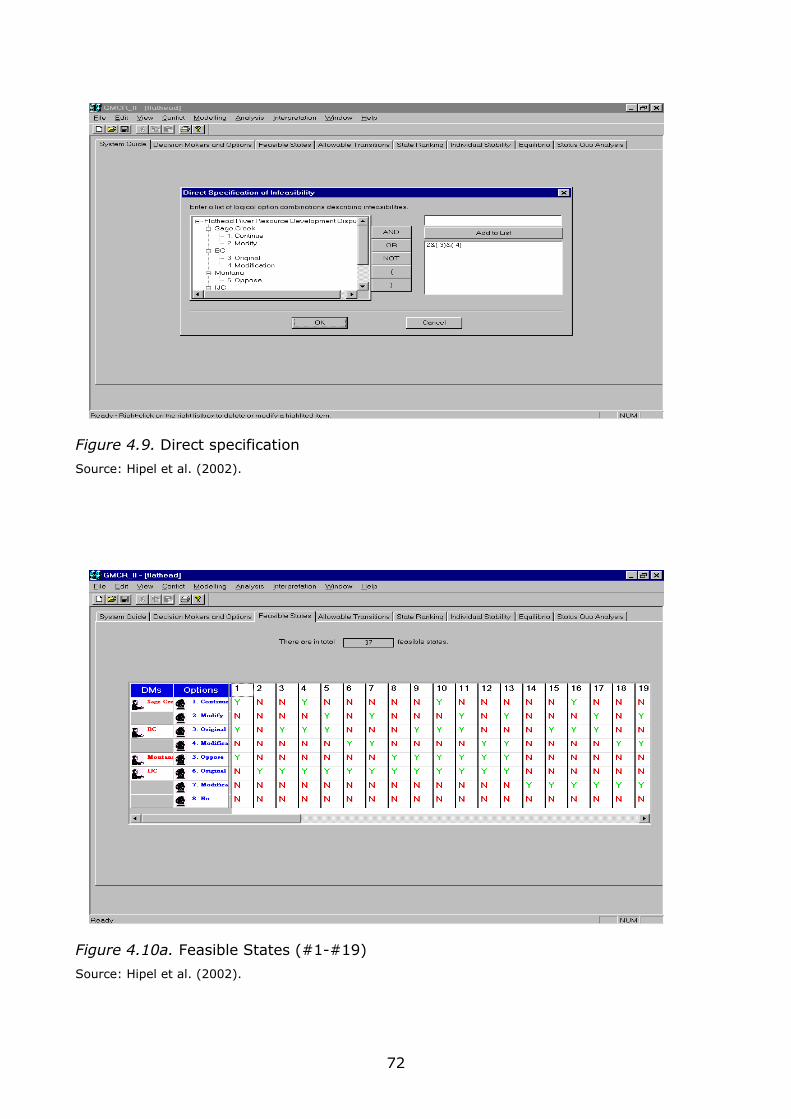
Figure 4.9. Direct specification
Source: Hipel et al. (2002).
Figure 4.10a. Feasible States (#1-#19)
Source: Hipel et al. (2002).
72
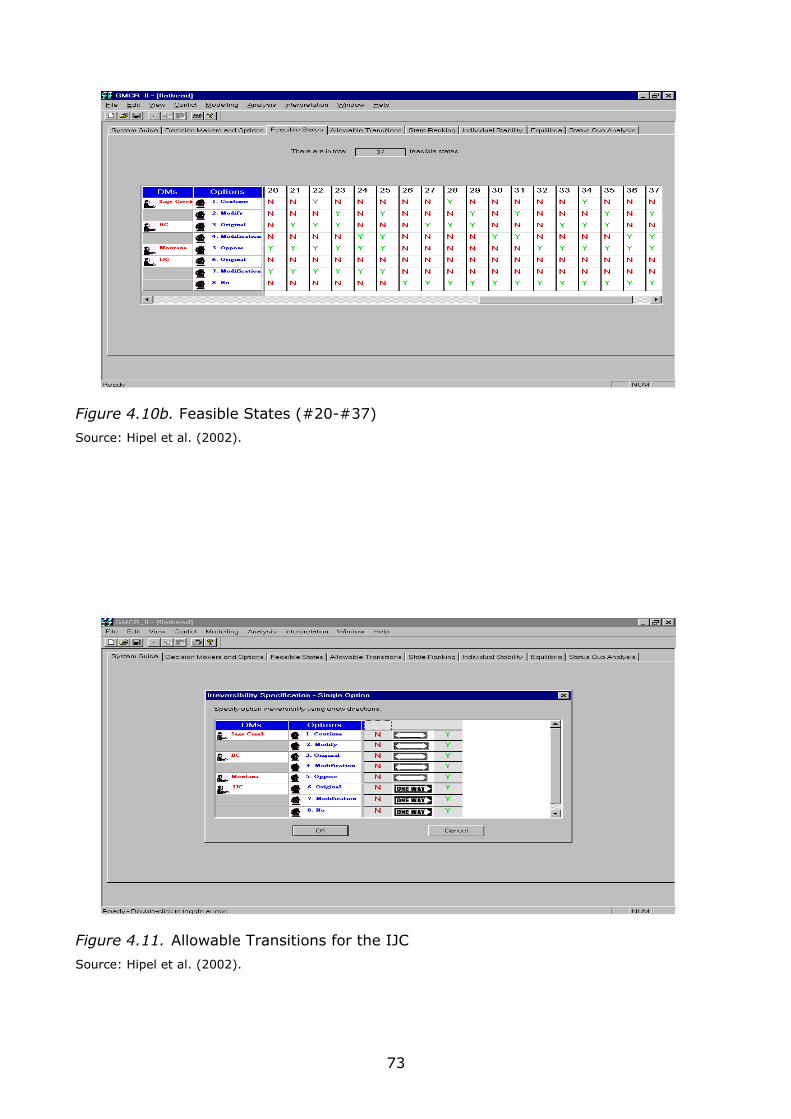
Figure 4.10b. Feasible States (#20-#37)
Source: Hipel et al. (2002).
Figure 4.11. Allowable Transitions for the IJC
Source: Hipel et al. (2002).
73
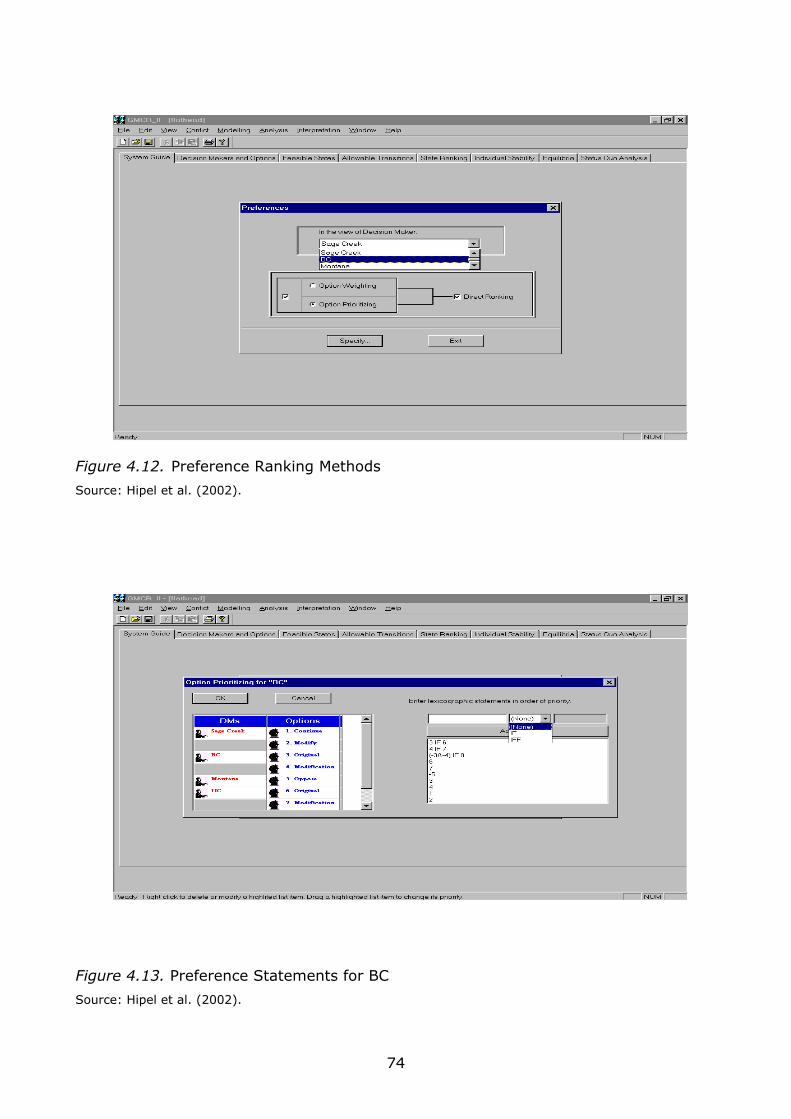
Figure 4.12. Preference Ranking Methods
Source: Hipel et al. (2002).
Figure 4.13. Preference Statements for BC
Source: Hipel et al. (2002).
74
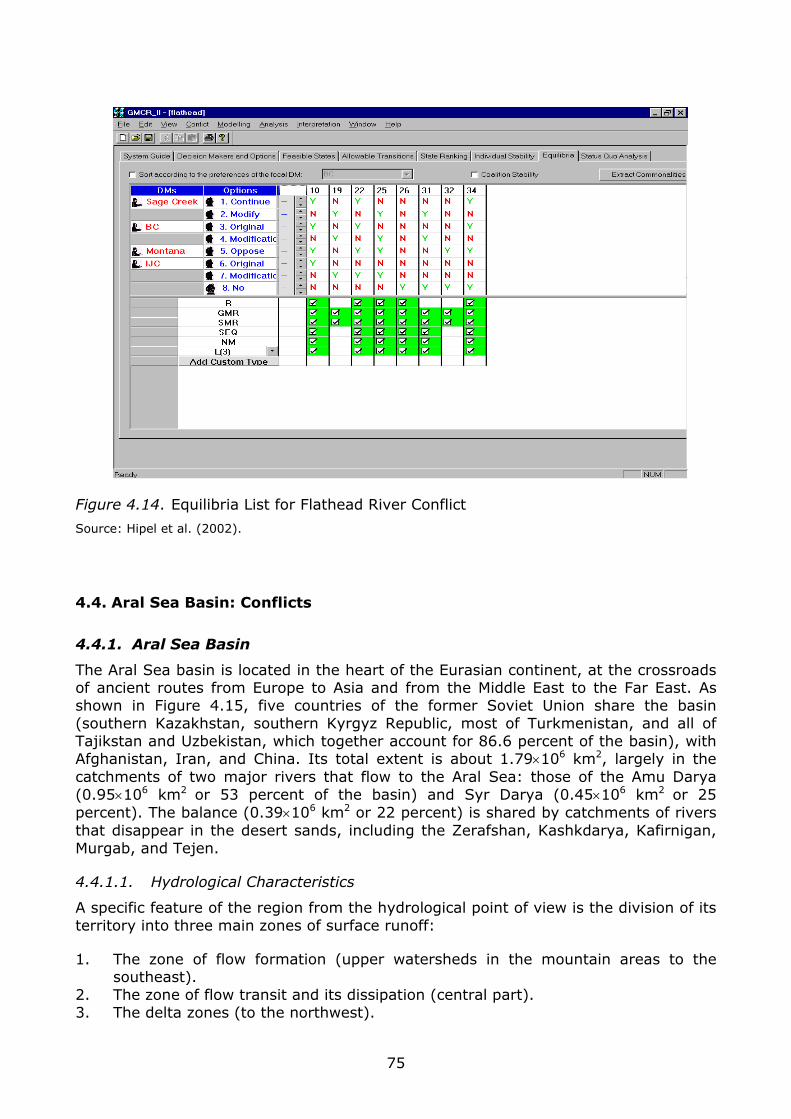
Figure 4.14. Equilibria List for Flathead River Conflict
Source: Hipel et al. (2002).
4.4. Aral Sea Basin: Conflicts
4.4.1. Aral Sea Basin
The Aral Sea basin is located in the heart of the Eurasian continent, at the crossroads of ancient routes from Europe to Asia and from the Middle East to the Far East. As shown in Figure 4.15, five countries of the former Soviet Union share the basin (southern Kazakhstan, southern Kyrgyz Republic, most of Turkmenistan, and all of Tajikstan and Uzbekistan, which together account for 86.6 percent of the basin), with Afghanistan, Iran, and China. Its total extent is about 1.79×10⁶ km2, largely in the catchments of two major rivers that flow to the Aral Sea: those of the Amu Darya (0.95×10⁶ km2 or 53 percent of the basin) and Syr Darya (0.45×10⁶ km2 or 25 percent). The balance (0.39×10⁶ km2 or 22 percent) is shared by catchments of rivers that disappear in the desert sands, including the Zerafshan, Kashkdarya, Kafirnigan, Murgab, and Tejen.
4.4.1.1. Hydrological Characteristics
A specific feature of the region from the hydrological point of view is the division of its territory into three main zones of surface runoff:
1. The zone of flow formation (upper watersheds in the mountain areas to the southeast).
2. The zone of flow transit and its dissipation (central part). 3. The delta zones (to the northwest).
75
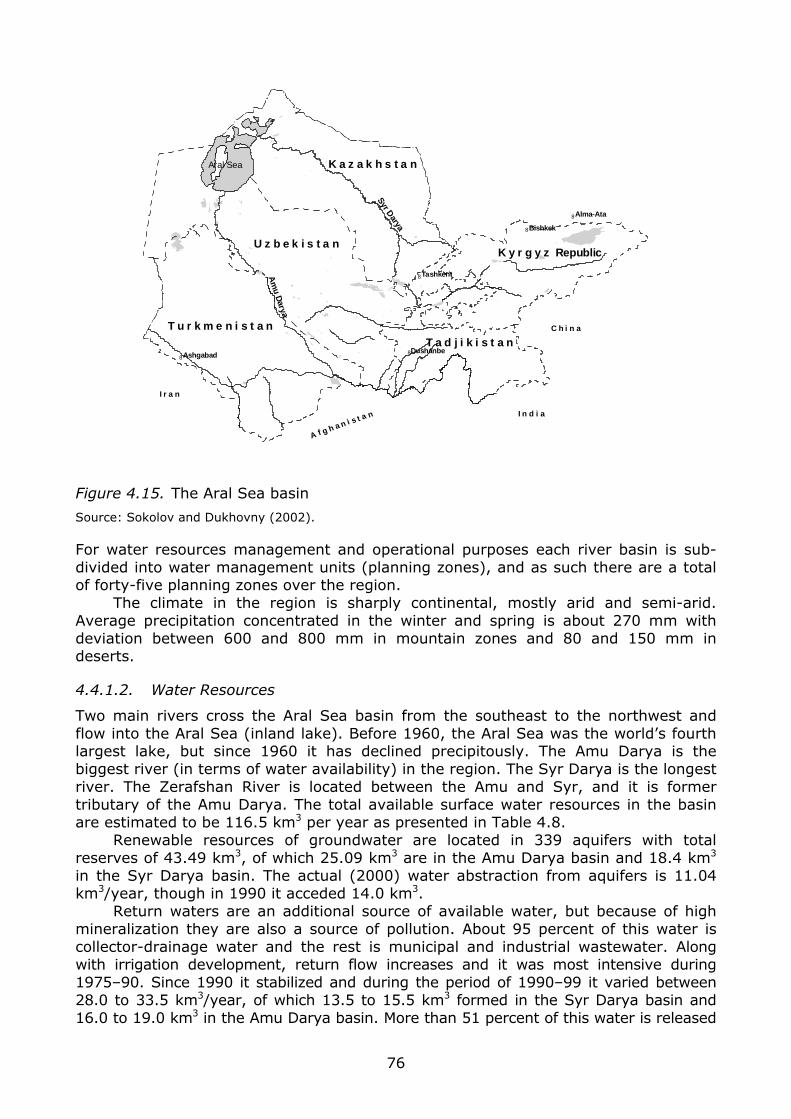
"8
"8
"8
"8"8Ashgabad
Dushanbe
Tashkent
Bishkek
Alma-Ata
Aral Sea
K y r g y z Republic
T a d j i k i s t a n
K a z a k h s t a n
U z b e k i s t a n
T u r k m e n i s t a n
I r a n
A f g h a n i s t a n I n d i a
C h i n a
Am
u Darya
Syr Darya
Figure 4.15. The Aral Sea basin
Source: Sokolov and Dukhovny (2002).
For water resources management and operational purposes each river basin is sub-divided into water management units (planning zones), and as such there are a total of forty-five planning zones over the region. The climate in the region is sharply continental, mostly arid and semi-arid. Average precipitation concentrated in the winter and spring is about 270 mm with deviation between 600 and 800 mm in mountain zones and 80 and 150 mm in deserts.
4.4.1.2. Water Resources
Two main rivers cross the Aral Sea basin from the southeast to the northwest and flow into the Aral Sea (inland lake). Before 1960, the Aral Sea was the world’s fourth largest lake, but since 1960 it has declined precipitously. The Amu Darya is the biggest river (in terms of water availability) in the region. The Syr Darya is the longest river. The Zerafshan River is located between the Amu and Syr, and it is former tributary of the Amu Darya. The total available surface water resources in the basin are estimated to be 116.5 km3 per year as presented in Table 4.8. Renewable resources of groundwater are located in 339 aquifers with total reserves of 43.49 km3, of which 25.09 km3 are in the Amu Darya basin and 18.4 km3 in the Syr Darya basin. The actual (2000) water abstraction from aquifers is 11.04 km3/year, though in 1990 it acceded 14.0 km3. Return waters are an additional source of available water, but because of high mineralization they are also a source of pollution. About 95 percent of this water is collector-drainage water and the rest is municipal and industrial wastewater. Along with irrigation development, return flow increases and it was most intensive during 1975–90. Since 1990 it stabilized and during the period of 1990–99 it varied between 28.0 to 33.5 km3/year, of which 13.5 to 15.5 km3 formed in the Syr Darya basin and 16.0 to 19.0 km3 in the Amu Darya basin. More than 51 percent of this water is released
76
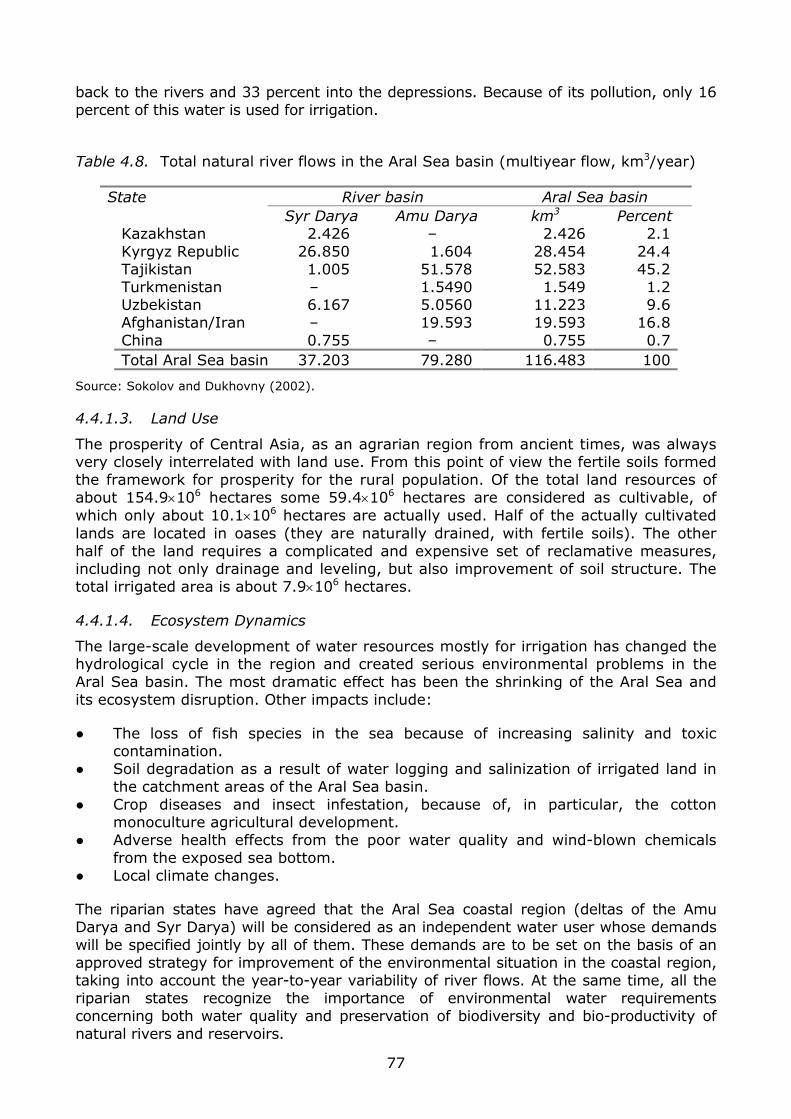
back to the rivers and 33 percent into the depressions. Because of its pollution, only 16 percent of this water is used for irrigation.
Table 4.8. Total natural river flows in the Aral Sea basin (multiyear flow, km3/year)
River basin Aral Sea basin State Syr Darya Amu Darya km3 Percent
Kazakhstan 2.426 – 2.426 2.1 Kyrgyz Republic 26.850 1.604 28.454 24.4 Tajikistan 1.005 51.578 52.583 45.2 Turkmenistan – 1.5490 1.549 1.2 Uzbekistan 6.167 5.0560 11.223 9.6 Afghanistan/Iran – 19.593 19.593 16.8 China 0.755 – 0.755 0.7 Total Aral Sea basin 37.203 79.280 116.483 100
Source: Sokolov and Dukhovny (2002).
4.4.1.3. Land Use
The prosperity of Central Asia, as an agrarian region from ancient times, was always very closely interrelated with land use. From this point of view the fertile soils formed the framework for prosperity for the rural population. Of the total land resources of about 154.9×10⁶ hectares some 59.4×10⁶ hectares are considered as cultivable, of which only about 10.1×10⁶ hectares are actually used. Half of the actually cultivated lands are located in oases (they are naturally drained, with fertile soils). The other half of the land requires a complicated and expensive set of reclamative measures, including not only drainage and leveling, but also improvement of soil structure. The total irrigated area is about 7.9×10⁶ hectares.
4.4.1.4. Ecosystem Dynamics
The large-scale development of water resources mostly for irrigation has changed the hydrological cycle in the region and created serious environmental problems in the Aral Sea basin. The most dramatic effect has been the shrinking of the Aral Sea and its ecosystem disruption. Other impacts include:
● The loss of fish species in the sea because of increasing salinity and toxic contamination.
● Soil degradation as a result of water logging and salinization of irrigated land in the catchment areas of the Aral Sea basin.
● Crop diseases and insect infestation, because of, in particular, the cotton monoculture agricultural development.
● Adverse health effects from the poor water quality and wind-blown chemicals from the exposed sea bottom.
● Local climate changes.
The riparian states have agreed that the Aral Sea coastal region (deltas of the Amu Darya and Syr Darya) will be considered as an independent water user whose demands will be specified jointly by all of them. These demands are to be set on the basis of an approved strategy for improvement of the environmental situation in the coastal region, taking into account the year-to-year variability of river flows. At the same time, all the riparian states recognize the importance of environmental water requirements concerning both water quality and preservation of biodiversity and bio-productivity of natural rivers and reservoirs.
77
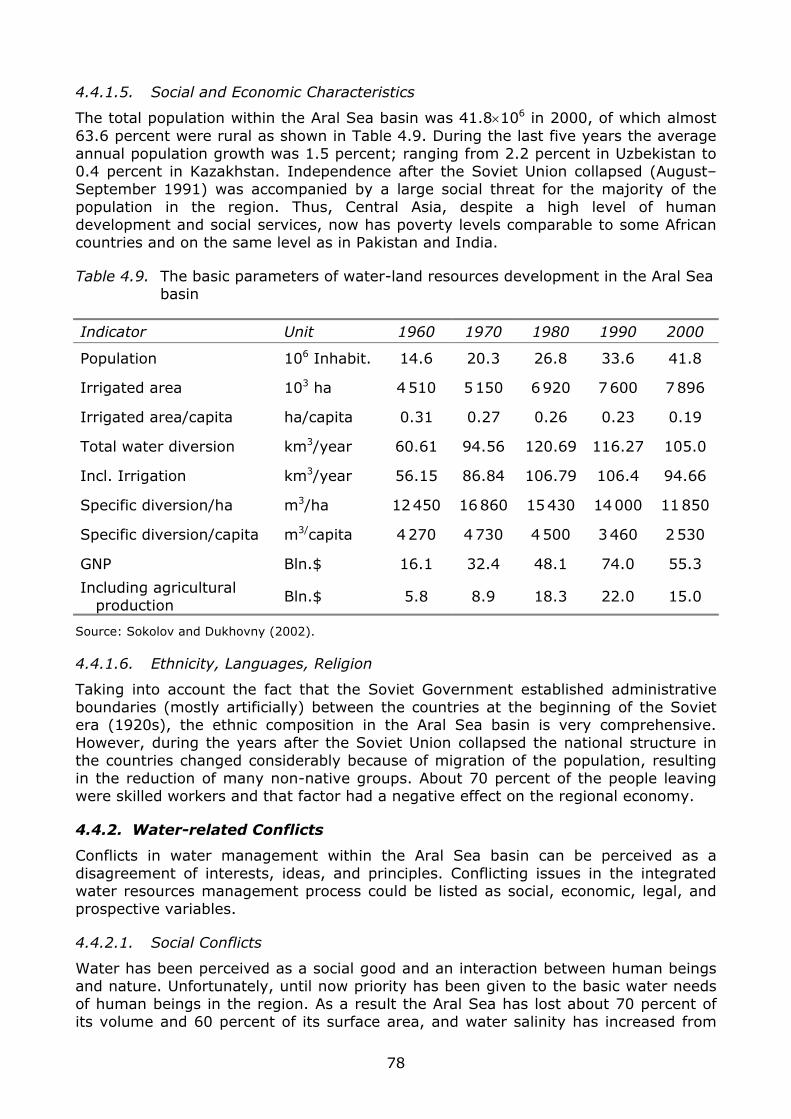
4.4.1.5. Social and Economic Characteristics
The total population within the Aral Sea basin was 41.8×10⁶ in 2000, of which almost 63.6 percent were rural as shown in Table 4.9. During the last five years the average annual population growth was 1.5 percent; ranging from 2.2 percent in Uzbekistan to 0.4 percent in Kazakhstan. Independence after the Soviet Union collapsed (August–September 1991) was accompanied by a large social threat for the majority of the population in the region. Thus, Central Asia, despite a high level of human development and social services, now has poverty levels comparable to some African countries and on the same level as in Pakistan and India.
Table 4.9. The basic parameters of water-land resources development in the Aral Sea basin
Indicator Unit 1960 1970 1980 1990 2000
Population 106 Inhabit. 14.6 20.3 26.8 33.6 41.8
Irrigated area 103 ha 4 510 5 150 6 920 7 600 7 896
Irrigated area/capita ha/capita 0.31 0.27 0.26 0.23 0.19
Total water diversion km3/year 60.61 94.56 120.69 116.27 105.0
Incl. Irrigation km3/year 56.15 86.84 106.79 106.4 94.66
Specific diversion/ha m3/ha 12 450 16 860 15 430 14 000 11 850
Specific diversion/capita m3/capita 4 270 4 730 4 500 3 460 2 530
GNP Bln.$ 16.1 32.4 48.1 74.0 55.3
Including agricultural production
Bln.$ 5.8 8.9 18.3 22.0 15.0
Source: Sokolov and Dukhovny (2002).
4.4.1.6. Ethnicity, Languages, Religion
Taking into account the fact that the Soviet Government established administrative boundaries (mostly artificially) between the countries at the beginning of the Soviet era (1920s), the ethnic composition in the Aral Sea basin is very comprehensive. However, during the years after the Soviet Union collapsed the national structure in the countries changed considerably because of migration of the population, resulting in the reduction of many non-native groups. About 70 percent of the people leaving were skilled workers and that factor had a negative effect on the regional economy.
4.4.2. Water-related Conflicts
Conflicts in water management within the Aral Sea basin can be perceived as a disagreement of interests, ideas, and principles. Conflicting issues in the integrated water resources management process could be listed as social, economic, legal, and prospective variables.
4.4.2.1. Social Conflicts
Water has been perceived as a social good and an interaction between human beings and nature. Unfortunately, until now priority has been given to the basic water needs of human beings in the region. As a result the Aral Sea has lost about 70 percent of its volume and 60 percent of its surface area, and water salinity has increased from
78
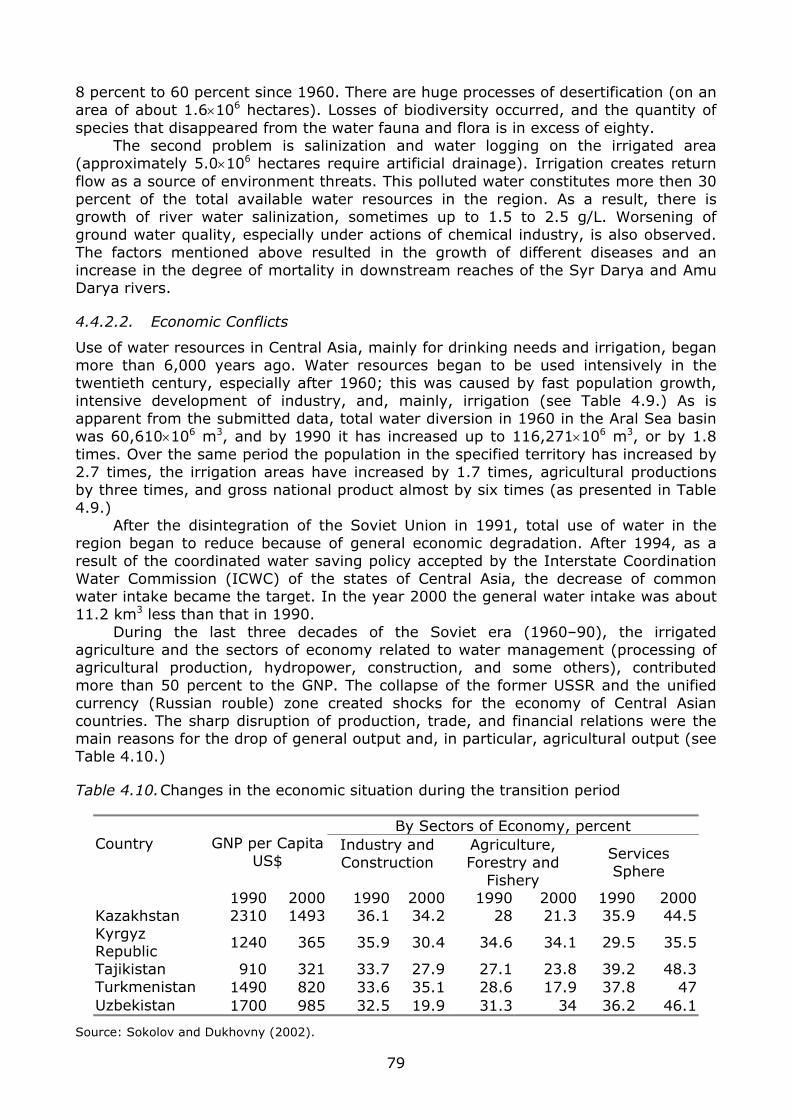
8 percent to 60 percent since 1960. There are huge processes of desertification (on an area of about 1.6×10⁶ hectares). Losses of biodiversity occurred, and the quantity of species that disappeared from the water fauna and flora is in excess of eighty. The second problem is salinization and water logging on the irrigated area (approximately 5.0×10⁶ hectares require artificial drainage). Irrigation creates return flow as a source of environment threats. This polluted water constitutes more then 30 percent of the total available water resources in the region. As a result, there is growth of river water salinization, sometimes up to 1.5 to 2.5 g/L. Worsening of ground water quality, especially under actions of chemical industry, is also observed. The factors mentioned above resulted in the growth of different diseases and an increase in the degree of mortality in downstream reaches of the Syr Darya and Amu Darya rivers.
4.4.2.2. Economic Conflicts
Use of water resources in Central Asia, mainly for drinking needs and irrigation, began more than 6,000 years ago. Water resources began to be used intensively in the twentieth century, especially after 1960; this was caused by fast population growth, intensive development of industry, and, mainly, irrigation (see Table 4.9.) As is apparent from the submitted data, total water diversion in 1960 in the Aral Sea basin was 60,610×106 m3, and by 1990 it has increased up to 116,271×106 m3, or by 1.8 times. Over the same period the population in the specified territory has increased by 2.7 times, the irrigation areas have increased by 1.7 times, agricultural productions by three times, and gross national product almost by six times (as presented in Table 4.9.) After the disintegration of the Soviet Union in 1991, total use of water in the region began to reduce because of general economic degradation. After 1994, as a result of the coordinated water saving policy accepted by the Interstate Coordination Water Commission (ICWC) of the states of Central Asia, the decrease of common water intake became the target. In the year 2000 the general water intake was about 11.2 km3 less than that in 1990. During the last three decades of the Soviet era (1960–90), the irrigated agriculture and the sectors of economy related to water management (processing of agricultural production, hydropower, construction, and some others), contributed more than 50 percent to the GNP. The collapse of the former USSR and the unified currency (Russian rouble) zone created shocks for the economy of Central Asian countries. The sharp disruption of production, trade, and financial relations were the main reasons for the drop of general output and, in particular, agricultural output (see Table 4.10.)
Table 4.10. Changes in the economic situation during the transition period
By Sectors of Economy, percent GNP per Capita
US$ Industry and Construction
Agriculture, Forestry and
Fishery
Services Sphere
Country
1990 2000 1990 2000 1990 2000 1990 2000Kazakhstan 2310 1493 36.1 34.2 28 21.3 35.9 44.5Kyrgyz Republic
1240 365 35.9 30.4 34.6 34.1 29.5 35.5
Tajikistan 910 321 33.7 27.9 27.1 23.8 39.2 48.3Turkmenistan 1490 820 33.6 35.1 28.6 17.9 37.8 47Uzbekistan 1700 985 32.5 19.9 31.3 34 36.2 46.1
Source: Sokolov and Dukhovny (2002).
79
It is necessary to emphasize that in all countries agricultural output fell less than GDP and much less than industrial output (except Kazakhstan and it does not apply for Uzbekistan). As a whole, in Central Asia, changes in agricultural production related to an increased share of food crops output (again except Kazakhstan). Further development of reforms with more price incentives to the farmers, and a better legal framework for land and water use are important to promote labor productivity and the living standards of farmers and the rural population in general (that is, the majority of the population (63 percent) of all countries within the Aral Sea basin). Despite the relative decline of agriculture’s share, it still plays a significant role in the Aral Sea basin, especially in Kyrgyz Republic, Tajikistan and Uzbekistan. It is also important in Turkmenistan (cotton and wheat) and Kazakhstan (grain) as well. There are sixty reservoirs with a useful volume of water of more than 10 million m3 each in the Aral Sea basin. Total complete capacity of reservoirs is 64.8 km3, of which the useful volume is about 46.8 km3 (20.2 km3 in the Amu Darya basin and 26.6 km3 in the Syr Darya basin). On the basis of these reservoirs forty-five hydroelectric power stations with capacity 34.5 GW have been constructed. The largest hydroelectric power stations are Nurek (in Tajikistan on the Vakhsh river), with a capacity of 2,700 MW, and Токtogul (in Kyrgyz Republic on the Naryn river) with 1,200 MW. Hydraulic power makes 27.3 percent of the total general consumption of energy in the Aral Sea basin. Tajikistan is the biggest producer of hydropower (about 98 percent of total national electric agriculture generation) and Kyrgyz Republic (about 75 percent). The least hydropower is generated in Turkmenistan (1 percent of total national electric generation). The region can satisfy more than 71 percent (150 GW) of needs in energy through hydropower. Competition for limited water resources occurs among agricultural, rural, urban, industrial, and environmental uses in the region. Irrigated agriculture is a major source for food security and the biggest water consumer (about 90 percent of total water resources is used for irrigation). Also, there is growth of ecological, industrial, and municipal needs. From this point of view there are a number of conflicts of water management in the region:
● Among countries in water sharing: for quantity, delivery schedule, and shares of expenses to cover water management costs within basin.
● Upstream and downstream relations concerning water allocation, schedule of water release from reservoirs, and quality of water.
● Among sectors (irrigation, power generation and environment): for water allocation, use of water reservoirs, and water sharing for the Aral Sea coastal zone, rivers (sanitary and ecological flows).
To resolve these conflicts, it is necessary to create an efficient framework for use of water, including a legal and institutional basis for a fair and equitable sharing of the beneficial water use.
4.4.2.3. Legal Conflicts
There is no universal system of water rights and legal instruments in the management of transboundary river basins in the region. The main reason for this is the lack of trust among riparian countries, because the doctrine of absolute territorial sovereignty dominates within the Aral Sea basin. The water specialists recognized the necessity to adopt the integrated water resources management concept into actual water management and use. Already some steps have been made towards implementation of the new doctrine: absolute territorial integrity.
80
4.4.3 Conflict Resolution
4.4.3.1. Water Conflicts in Perspective
Water is already a limiting factor (both quantitatively and qualitatively) for some zones in the Aral Sea basin. Therefore, future sustainable development is under some stress. Besides, the impact of global climate change on availability of water resources in the region is unclear. In this context, conflicts in water management could appear as a result of different national approaches to the planning of national development scenarios. It is desirable to establish proper interstate cooperation to promote a universal conduct of the planning process. There are some limiting factors to conducting conflict resolution in the region. Among them is the lack of information transparency and the lack of a proper communication system between different levels of water-related players:
● on the intersector level in each country and in region ● on the interstate level between water specialists and water users ● between water organizations and NGOs.
To establish a proper mechanism for the above-mentioned conflict prevention and resolution it is necessary to concentrate future activities in the following directions:
● institutional straightening at the national and regional levels ● creation of a legal framework ● establishment of the proper financial mechanism ● technical perfection and capacity building.
4.4.3.2. Institutional Aspects
The need to achieve the integration of water resources management at the basin level was fully understood in the period before independence. Understanding the importance of having a single water management organization for the whole basin, two Basin Water Organizations were established in 1986: BWO “AmuDarya” and BWO “SyrDarya.” Such a basin-wide organization could manage water in the rivers in accordance with the rules and schedule agreed among the republics. The Ministry of Water Resources provided the financing of BWOs from the federal budget for operations, maintenance, rehabilitation, and development. Concerns to create a mechanism for regional collaboration in organization and financing of water resources management arose after independence. Based on the principles of equal rights and responsibility for rational water use agreed since 1992, a number of interstate agreements, documents, and decisions have been signed, which regulate collaboration in the sphere of joint water resources management, conservation, and use. The first interstate agreement (1992) was related to the establishment of the Interstate Commission for Water Coordination (ICWC), which became responsible for joint water resources management. ICWC took on responsibilities for water management in both basins directly from the former Soviet Ministry of Water Resources. Later, in 1993, with the Aral Sea Basin Program extension, two new organizations were established. Those were: The Interstate Council for the Aral Sea (ICAS) with the purpose of the Program coordination, and the International Fund for Saving the Aral Sea (IFAS) with the purpose of accumulating and controlling finances. In 1997, ICAS and IFAS were combined and re-established into a new IFAS. The existing structure of the interstate organizations responsible for water resources management was created during the period 1991–99, and the distribution
81
of their obligations was confirmed by the Head of States in an Agreement dated April 9 1999 signed in Ashgabad (Turkmenistan). The structure is presented in Figure 4.16. The International Fund for Aral Sea Saving (IFAS) is the highest political level of decision making before approval by the Heads of State (if appropriate); the IFAS Executive Committee is a permanent body that implements the IFAS Board decisions through the IFAS National Branches. In addition, the EC IFAS on behalf of the Board could establish agencies for various regional projects and programs implementation. The Interstate Water Coordination Commission (ICWC) is a collective body managing transboundary rivers and responsible for water allocation among countries, monitoring, and preparing preliminary assessment of proposals on institutional, ecological, technical, and financial approaches based on mutually agreed decisions by all sides. The two Basin Water Organizations (BWOs) (Amu Darya and Syr Darya), the Scientific Information Center (SIC), and ICWC Secretariat are executive bodies of this Commission. The Commission was established in accordance with the “Agreement on collaboration in sphere of joint water resources management within interstate water sources” of February 18 1992, and approved by the Head of States on March 23 1993. The 1992 agreement provided that water allocations should be based on “existing uses of water resources” and that the two river basin agencies (BWOs) should continue to perform basin management functions subject to control by the ICWC. Subsequently, the ICWC agreed that the 1992 agreement should remain in force until a Regional Water Management Strategy had been formulated which responded to new realities and which outlined more objective mechanisms and principles for water allocation and rational use. In January 1994, the Presidents of the five Central Asian countries met in Nukus (Karakalpakstan) and approved a “Program of Concrete Actions” for the improvement of the environmental situation in the Aral Sea basin and for its social and economic development. The Aral Sea Basin Program (ASBP) included eight thematic sub-programs, the first of which addressed the formulation of a general strategy of water distribution, rational use, and protection of water resources. The first stage of this work was finished in 1997 by presentation of the fundamental provisions of the water resources management strategy. As a further step, in 1998 a new GEF Project consisting of five components was started. A comprehensive description of the objectives and mandates of IFAS and BWOs along with their advantages and disadvantages are included in the report by Sokolov and Dukhovny (2002). It further gives institutional management at the national levels in detail.
4.4.3.3. Legal Basis
Water relations needed a new legal basis, because the rivers in the region became transboundary. This requires new approaches to interstate negotiations in the sphere of water allocation and water use. In 1991 the Central Asian states, responding quickly to the need for a new legal basis for water allocation and management, declared the establishment of a joint water resources management on the basis of equity and mutual benefit. To overcome the inherited inter-regional water problems and minimize ethnic tensions, the five Central Asian countries signed an interstate water agreement on February 18 1992. The agreement was that water allocation should be based on the existing uses of water resources, and the two river basin authorities should continue to perform basin management under the control of the Interstate Commission for Water Coordination (ICWC). Existing documents do not ensure proper water use and control. Water flows to the Aral Sea are not ensured, emergency conditions are created, and water use is still inefficient. Therefore, legal documents must be developed to improve joint water use
82
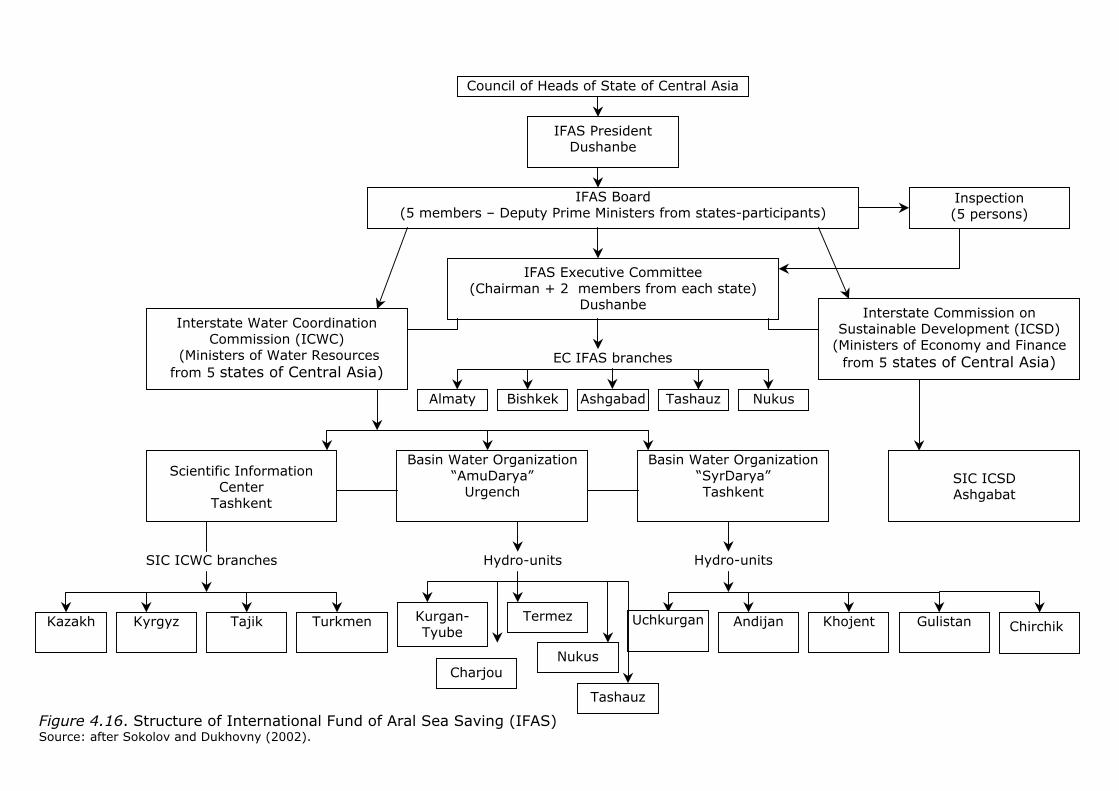
83
Chirchik Gulistan Khojent Andijan
Charjou
Termez
Nukus
Uchkurgan Kurgan-Tyube
Council of Heads of State of Central Asia
IFAS President Dushanbe
IFAS Board (5 members – Deputy Prime Ministers from states-participants)
Inspection (5 persons)
IFAS Executive Committee (Chairman + 2 members from each state)
Dushanbe Interstate Water Coordination
Commission (ICWC) (Ministers of Water Resources from 5 states of Central Asia)
Interstate Commission on Sustainable Development (ICSD)
(Ministers of Economy and Finance from 5 states of Central Asia) EC IFAS branches
Ashgabad Nukus Almaty Tashauz Bishkek
Scientific Information Center
Tashkent
Basin Water Organization “AmuDarya”
Urgench
Basin Water Organization “SyrDarya” Tashkent
SIC ICSD Ashgabat
SIC ICWC branches
Kazakh Turkmen Tajik Kyrgyz
Hydro-units Hydro-units
Tashauz
Figure 4.16. Structure of International Fund of Aral Sea Saving (IFAS)Source: after Sokolov and Dukhovny (2002).
in the Aral Sea basin. In 1996, the establishment of the legal basis began the process of joint management, use, development, and conservation of transboundary water resources in the region. Achievement of a consensus between states in the creation of a strong regional legal framework is a long-term process and work on this is being carried out (Sokolov and Dukhovny, 2002).
4.4.3.4. Financing
Water management activity in the Central Asian states is financed by state budgets as well as payments for water services. The amount of the charge is different in different countries, depending on state policy and its participation in water management sector support and development, water resources conservation, pricing policy for agricultural production, and so on. The payment for water as a resource exists for all kinds of water users except agricultural ones. Water users who pay for water include industrial enterprises, power stations, and material enterprises. Water services for irrigation water are payable in Kazakhstan, Kyrgyz Republic, and Tajikistan. Paid water use not only eases the economic problems of water organizations, but also facilitates the perfection of management, rational water use, and water saving in all branches of the economy. Trade rights should be provided to water-related organizations promoting their investments in water saving measures and additional water resources involvement. Measures that should be implemented include: the gradual reduction of state subsidies for agricultural producers and other users for water delivery; the transfer of all categories of water users from a stable tariff to a tariff with respect for water used; and the introduction of a volume and competition system for water saving. Incentives should be created for all states and water users to conserve water and to free it for environmental needs.
4.4.3.5. Technical Issues
The most important issue is the rehabilitation and modernization of irrigation and drainage systems in the region through: (a) improvement of the state of irrigated lands and (b) improvement of irrigation technique. The SIC ICWC, and BWOs “Syr Darya” and “Amu Darya” with the assistance of CIDA prepared a feasibility study “Water Resources Management and Control Systems for the Amu Darya and Syr Darya Basins” to provide the countries of the region with water in accordance with quotas established by ICWC, develop plans for water reservoirs and water intakes operation, and develop systems of management, communication, and information. SIC ICWC elaborated the program for development of a models system. This program consists of a set of models including: (a) river basin models; and (b) models for national water policy which satisfy the water demands of each state, depending on their socioeconomic development. These models will support future development at the regional and national levels as tools in the preparation of regional and national water strategies. They will further support multiyear flow regulation by ICWC and BWO multiyear planning, for annual planning of water allocation and correction of this planning in the interests of the BWO, and for operational tasks of water management by each BWO. The elaboration of basin modeling for future development at the regional level, and modeling of planning zone and operation work for BWO, was begun by SIC ICWC together with the Water Management Authorities of all states. Also, it is necessary to develop a training system for water specialists with NGO involvement.
84
4.4.4. Future Work
Sokolov and Dukhovny (2002) suggested that the existing shortcomings in water management can be eliminated and water use effectiveness can be achieved via real regional partnership and integration of efforts by following six directions, including:
● The integration of the countries’ efforts in water basin management and conservation through the partnership at interstate (regional) level.
● Integration of water management system hierarchic levels through vertical partnership in the chain: “state–water system–territorial water and administrative bodies–water users and water consumers.”
● Integration of water users and water management organizations through water users involvement at all levels to water management hierarchy as well as partnership between governmental and non-governmental bodies.
● The integration of knowledge and practice through partnership of science with water users and water organizations (using such tools as base of knowledge, training, consultation, and extension service).
Preparation of water partnership in the region is suggested in the effort of integration. Taking into account existing regional problems, Sokolov and Dukhovny suggest creating four thematic groups relevant to ICWC working groups:
● technical aspects ● legal questions ● institutional issues ● financial aspects.
Successful development and coordination of the regional and national water strategy and its monitoring can be realized using existing scientific potential.
4.4.4.1. Proposal for Integrated Water Resources Management
Dukhovny (2002) proposed the use of a set of models for the Aral Sea basin as a tool for integrated water resources management and sustainable development within the context of system analysis. Since the Aral Sea basin system is a very complex one, development of a decision support system is not simple. The following is needed: a large number of models to adequately describe processes of water use, water development and water funds, a database, a knowledge base and a forecast system, and a set of criteria, constraints, and links. Such a system is absolutely necessary for conflict-free management of water resources within this basin, integrating the different administrative and political entities, various sectors of economy, and so on. Systems analysis and modeling as a whole can be of help to all societies because along with their utilization by water specialists as tools and mechanisms of planning and control, they can serve as a proof for politicians to find the most rational decision and create a political and socioeconomic climate for the rational use of water resources and the winning of public confidence. The interlinked set of models fall into two categories: hydrologic and socioeconomic. The different models include: a hydrologic model of annual planning, perspective planning hydrological model, multiyear regulation model, socioeconomic sub-model, and national planning model. Dukhovny (2002) presented the detailed description of the models development, their linkages, and so on.
85
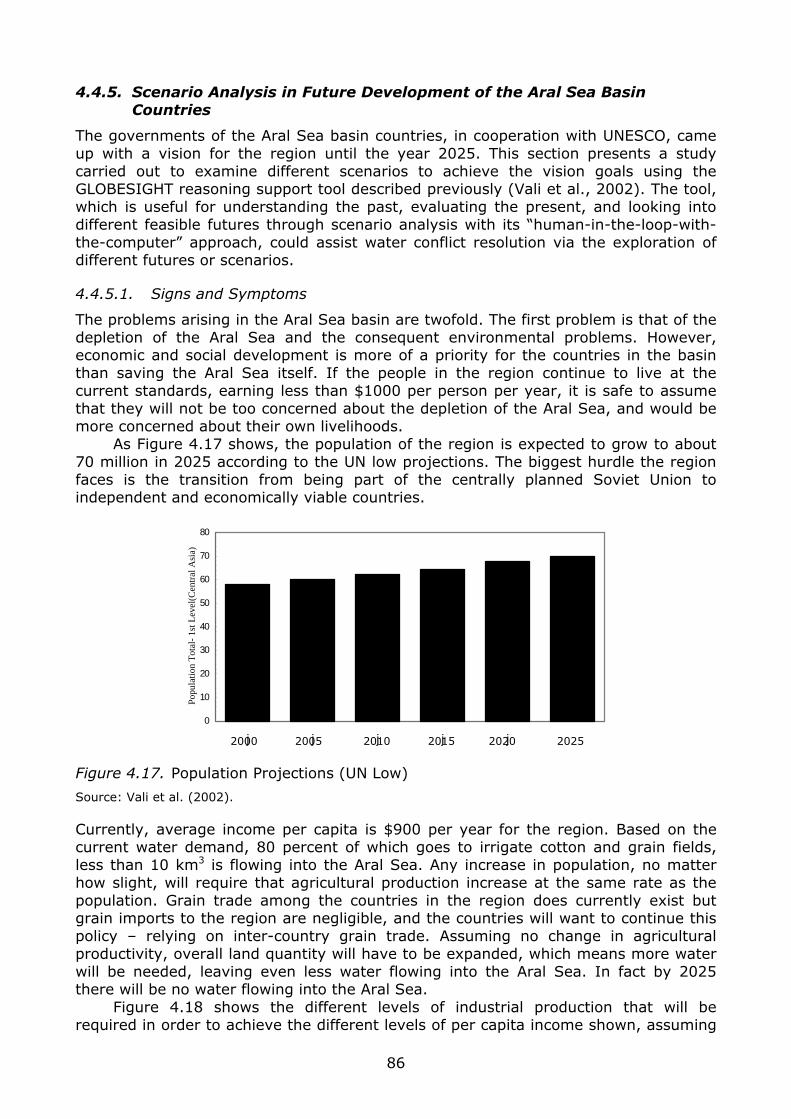
4.4.5. Scenario Analysis in Future Development of the Aral Sea Basin Countries
The governments of the Aral Sea basin countries, in cooperation with UNESCO, came up with a vision for the region until the year 2025. This section presents a study carried out to examine different scenarios to achieve the vision goals using the GLOBESIGHT reasoning support tool described previously (Vali et al., 2002). The tool, which is useful for understanding the past, evaluating the present, and looking into different feasible futures through scenario analysis with its “human-in-the-loop-with-the-computer” approach, could assist water conflict resolution via the exploration of different futures or scenarios.
4.4.5.1. Signs and Symptoms
The problems arising in the Aral Sea basin are twofold. The first problem is that of the depletion of the Aral Sea and the consequent environmental problems. However, economic and social development is more of a priority for the countries in the basin than saving the Aral Sea itself. If the people in the region continue to live at the current standards, earning less than $1000 per person per year, it is safe to assume that they will not be too concerned about the depletion of the Aral Sea, and would be more concerned about their own livelihoods. As Figure 4.17 shows, the population of the region is expected to grow to about 70 million in 2025 according to the UN low projections. The biggest hurdle the region faces is the transition from being part of the centrally planned Soviet Union to independent and economically viable countries.
0
10
20
30
40
50
60
70
80
j
Popu
latio
n T
otal
- 1s
t Lev
el(C
entr
al A
sia)
j j j j j2000 2005 2010 2015 2020 2025
Figure 4.17. Population Projections (UN Low)
Source: Vali et al. (2002).
Currently, average income per capita is $900 per year for the region. Based on the current water demand, 80 percent of which goes to irrigate cotton and grain fields, less than 10 km3 is flowing into the Aral Sea. Any increase in population, no matter how slight, will require that agricultural production increase at the same rate as the population. Grain trade among the countries in the region does currently exist but grain imports to the region are negligible, and the countries will want to continue this policy – relying on inter-country grain trade. Assuming no change in agricultural productivity, overall land quantity will have to be expanded, which means more water will be needed, leaving even less water flowing into the Aral Sea. In fact by 2025 there will be no water flowing into the Aral Sea. Figure 4.18 shows the different levels of industrial production that will be required in order to achieve the different levels of per capita income shown, assuming
86
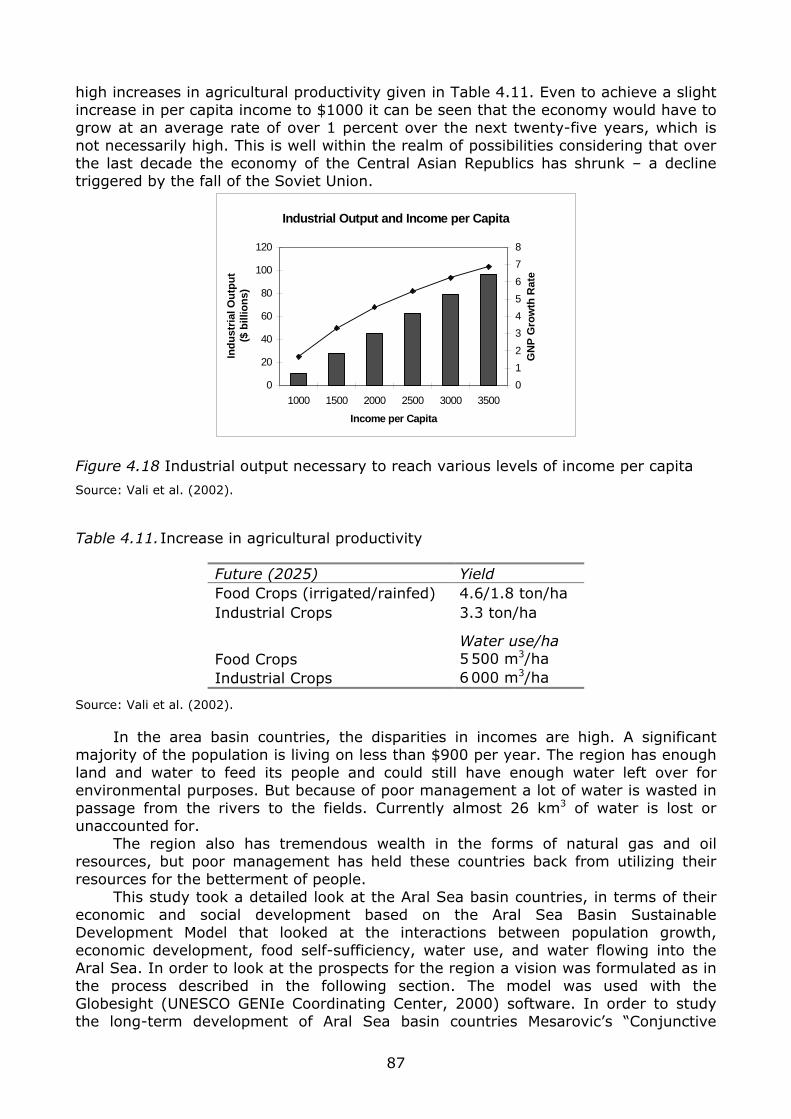
high increases in agricultural productivity given in Table 4.11. Even to achieve a slight increase in per capita income to $1000 it can be seen that the economy would have to grow at an average rate of over 1 percent over the next twenty-five years, which is not necessarily high. This is well within the realm of possibilities considering that over the last decade the economy of the Central Asian Republics has shrunk – a decline triggered by the fall of the Soviet Union.
Industrial Output and Income per Capita
0
20
40
60
80
100
120
1000 1500 2000 2500 3000 3500
Income per Capita
Ind
ust
rial
Ou
tpu
t($
bill
ion
s)
0
1
2
3
4
5
6
7
8
GN
P G
row
th R
ate
Figure 4.18 Industrial output necessary to reach various levels of income per capita
Source: Vali et al. (2002).
Table 4.11. Increase in agricultural productivity
Future (2025) Yield Food Crops (irrigated/rainfed) 4.6/1.8 ton/ha Industrial Crops 3.3 ton/ha
Water use/ha Food Crops 5 500 m3/ha Industrial Crops 6 000 m3/ha
Source: Vali et al. (2002).
In the area basin countries, the disparities in incomes are high. A significant majority of the population is living on less than $900 per year. The region has enough land and water to feed its people and could still have enough water left over for environmental purposes. But because of poor management a lot of water is wasted in passage from the rivers to the fields. Currently almost 26 km3 of water is lost or unaccounted for. The region also has tremendous wealth in the forms of natural gas and oil resources, but poor management has held these countries back from utilizing their resources for the betterment of people. This study took a detailed look at the Aral Sea basin countries, in terms of their economic and social development based on the Aral Sea Basin Sustainable Development Model that looked at the interactions between population growth, economic development, food self-sufficiency, water use, and water flowing into the Aral Sea. In order to look at the prospects for the region a vision was formulated as in the process described in the following section. The model was used with the Globesight (UNESCO GENIe Coordinating Center, 2000) software. In order to study the long-term development of Aral Sea basin countries Mesarovic’s “Conjunctive
87
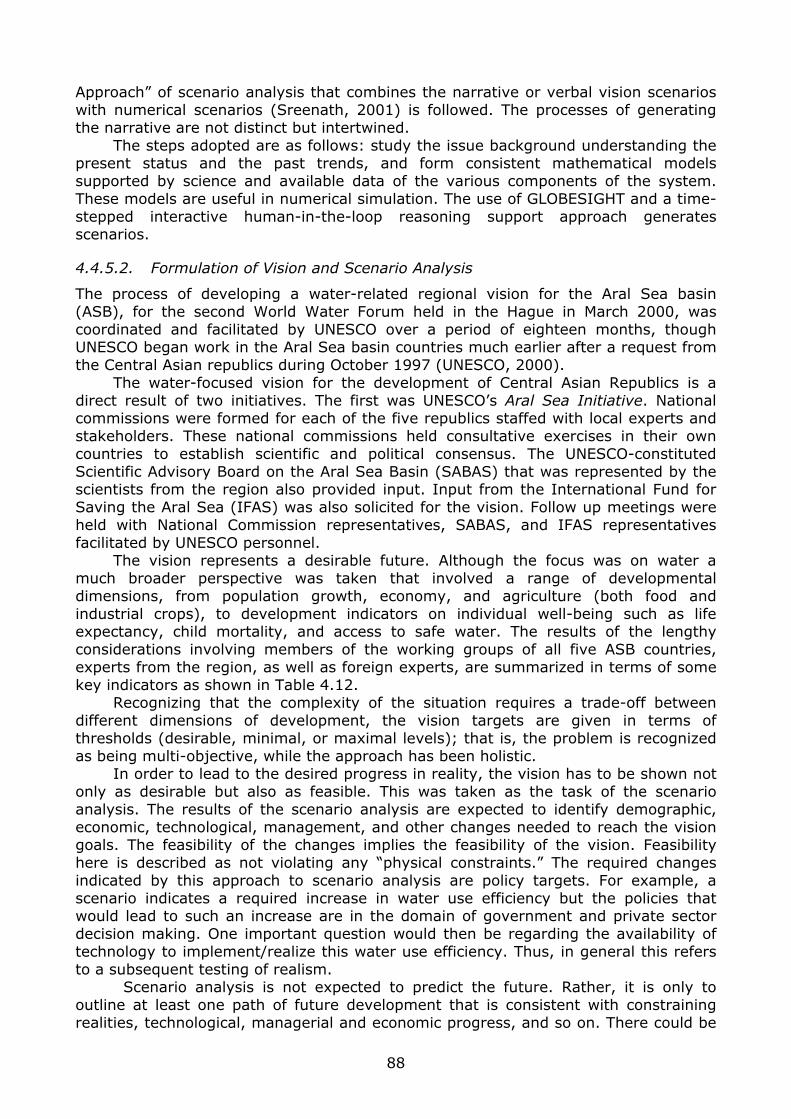
Approach” of scenario analysis that combines the narrative or verbal vision scenarios with numerical scenarios (Sreenath, 2001) is followed. The processes of generating the narrative are not distinct but intertwined. The steps adopted are as follows: study the issue background understanding the present status and the past trends, and form consistent mathematical models supported by science and available data of the various components of the system. These models are useful in numerical simulation. The use of GLOBESIGHT and a time-stepped interactive human-in-the-loop reasoning support approach generates scenarios.
4.4.5.2. Formulation of Vision and Scenario Analysis
The process of developing a water-related regional vision for the Aral Sea basin (ASB), for the second World Water Forum held in the Hague in March 2000, was coordinated and facilitated by UNESCO over a period of eighteen months, though UNESCO began work in the Aral Sea basin countries much earlier after a request from the Central Asian republics during October 1997 (UNESCO, 2000). The water-focused vision for the development of Central Asian Republics is a direct result of two initiatives. The first was UNESCO’s Aral Sea Initiative. National commissions were formed for each of the five republics staffed with local experts and stakeholders. These national commissions held consultative exercises in their own countries to establish scientific and political consensus. The UNESCO-constituted Scientific Advisory Board on the Aral Sea Basin (SABAS) that was represented by the scientists from the region also provided input. Input from the International Fund for Saving the Aral Sea (IFAS) was also solicited for the vision. Follow up meetings were held with National Commission representatives, SABAS, and IFAS representatives facilitated by UNESCO personnel. The vision represents a desirable future. Although the focus was on water a much broader perspective was taken that involved a range of developmental dimensions, from population growth, economy, and agriculture (both food and industrial crops), to development indicators on individual well-being such as life expectancy, child mortality, and access to safe water. The results of the lengthy considerations involving members of the working groups of all five ASB countries, experts from the region, as well as foreign experts, are summarized in terms of some key indicators as shown in Table 4.12. Recognizing that the complexity of the situation requires a trade-off between different dimensions of development, the vision targets are given in terms of thresholds (desirable, minimal, or maximal levels); that is, the problem is recognized as being multi-objective, while the approach has been holistic. In order to lead to the desired progress in reality, the vision has to be shown not only as desirable but also as feasible. This was taken as the task of the scenario analysis. The results of the scenario analysis are expected to identify demographic, economic, technological, management, and other changes needed to reach the vision goals. The feasibility of the changes implies the feasibility of the vision. Feasibility here is described as not violating any “physical constraints.” The required changes indicated by this approach to scenario analysis are policy targets. For example, a scenario indicates a required increase in water use efficiency but the policies that would lead to such an increase are in the domain of government and private sector decision making. One important question would then be regarding the availability of technology to implement/realize this water use efficiency. Thus, in general this refers to a subsequent testing of realism. Scenario analysis is not expected to predict the future. Rather, it is only to outline at least one path of future development that is consistent with constraining realities, technological, managerial and economic progress, and so on. There could be
88

many other paths leading to the vision goals. The role of government and private sector decision makers is to steer the development along a socially acceptable path.
Table 4.12. Possible goals for the water-related regional vision for the Aral Sea basin used in the testing of the feasibility of the vision
Possible goals in the water-related Vision for the Aral Sea basin Targeted
thresholds for 2025
Health Child mortality rate (children below 5 years of age per 1000 births)
<30
Life expectancy at birth in years >70 Nutrition Average availability of food calories per inhabitant per day
>3000
Environment Water available for the environment in km3 per year
>20
Wealth Increase of income per person in purchasing power in urban areas as a
factor since the year 2000
>2.5
Increase of income per person in purchasing power in rural areas as a factor since the year 2000
>3.5
Agriculture
Average water use in cubic meters per ton of wheat <1000 Average water use in cubic meters per ton of rice <3400 Average water use in cubic meters per ton of cotton <1900 Percent of irrigated area salinized (middle and highly salinized) <10
Drinking water supply Coverage of piped water supply in urban areas, in percent of people
>99
Coverage of piped water supply in rural areas, in percent of people >60 People served good quality water by biological standards, urban, in
percent >80
People served good quality water by biological standards, rural, in percent
>60
Source: UNESCO (2000).
4.4.5.3. Implementation
To test the feasibility of these goals and generate a set of policy targets necessary to realize the vision, the GLOBESIGHT reasoning support (decision-making) tool was used, custom-tailored by the GENIe team (Global-problematique Education Network Initiative) at Case Western Reserve University, Cleveland, USA, for the occasion as presented in Figure 4.19. Its main component is a multi-level model of sustainable development, Aralmod as shown in Figure 4.20. The model contains a number of sub-models, but some of its features are briefly indicated here. A description of each sub-model used in the overall Aral Sea Basin Sustainable Development Model follows.
89
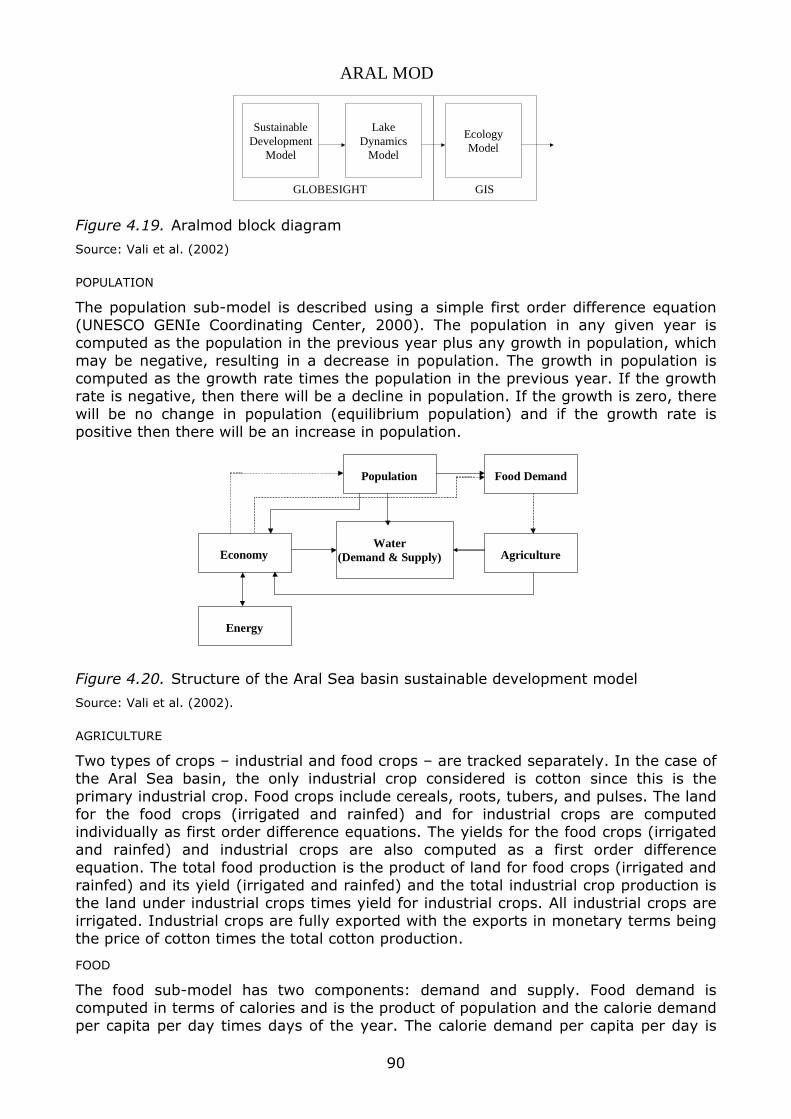
SustainableDevelopment
Model
ARAL MOD
LakeDynamics
Model
EcologyModel
GLOBESIGHT GIS
Figure 4.19. Aralmod block diagram
Source: Vali et al. (2002)
POPULATION
The population sub-model is described using a simple first order difference equation (UNESCO GENIe Coordinating Center, 2000). The population in any given year is computed as the population in the previous year plus any growth in population, which may be negative, resulting in a decrease in population. The growth in population is computed as the growth rate times the population in the previous year. If the growth rate is negative, then there will be a decline in population. If the growth is zero, there will be no change in population (equilibrium population) and if the growth rate is positive then there will be an increase in population.
Population Food Demand
Agriculture Economy
Energy
Water (Demand & Supply)
Figure 4.20. Structure of the Aral Sea basin sustainable development model
Source: Vali et al. (2002).
AGRICULTURE
Two types of crops – industrial and food crops – are tracked separately. In the case of the Aral Sea basin, the only industrial crop considered is cotton since this is the primary industrial crop. Food crops include cereals, roots, tubers, and pulses. The land for the food crops (irrigated and rainfed) and for industrial crops are computed individually as first order difference equations. The yields for the food crops (irrigated and rainfed) and industrial crops are also computed as a first order difference equation. The total food production is the product of land for food crops (irrigated and rainfed) and its yield (irrigated and rainfed) and the total industrial crop production is the land under industrial crops times yield for industrial crops. All industrial crops are irrigated. Industrial crops are fully exported with the exports in monetary terms being the price of cotton times the total cotton production.
FOOD
The food sub-model has two components: demand and supply. Food demand is computed in terms of calories and is the product of population and the calorie demand per capita per day times days of the year. The calorie demand per capita per day is
90
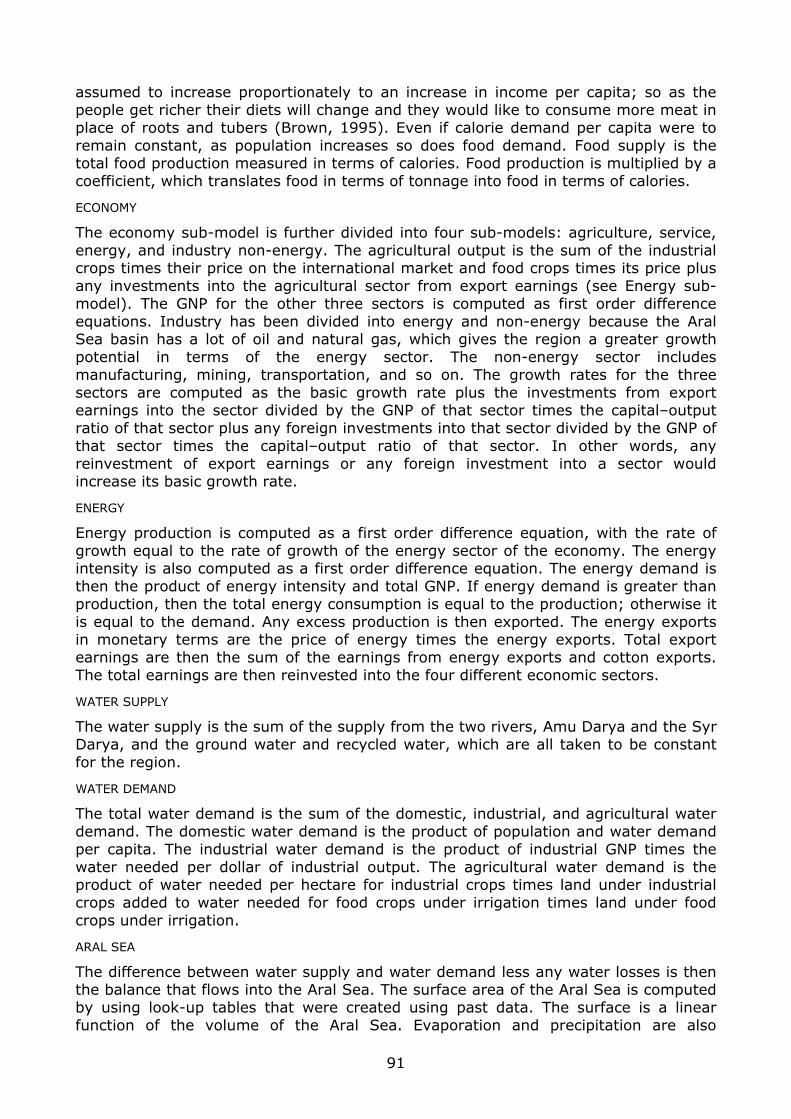
assumed to increase proportionately to an increase in income per capita; so as the people get richer their diets will change and they would like to consume more meat in place of roots and tubers (Brown, 1995). Even if calorie demand per capita were to remain constant, as population increases so does food demand. Food supply is the total food production measured in terms of calories. Food production is multiplied by a coefficient, which translates food in terms of tonnage into food in terms of calories.
ECONOMY
The economy sub-model is further divided into four sub-models: agriculture, service, energy, and industry non-energy. The agricultural output is the sum of the industrial crops times their price on the international market and food crops times its price plus any investments into the agricultural sector from export earnings (see Energy sub-model). The GNP for the other three sectors is computed as first order difference equations. Industry has been divided into energy and non-energy because the Aral Sea basin has a lot of oil and natural gas, which gives the region a greater growth potential in terms of the energy sector. The non-energy sector includes manufacturing, mining, transportation, and so on. The growth rates for the three sectors are computed as the basic growth rate plus the investments from export earnings into the sector divided by the GNP of that sector times the capital–output ratio of that sector plus any foreign investments into that sector divided by the GNP of that sector times the capital–output ratio of that sector. In other words, any reinvestment of export earnings or any foreign investment into a sector would increase its basic growth rate.
ENERGY
Energy production is computed as a first order difference equation, with the rate of growth equal to the rate of growth of the energy sector of the economy. The energy intensity is also computed as a first order difference equation. The energy demand is then the product of energy intensity and total GNP. If energy demand is greater than production, then the total energy consumption is equal to the production; otherwise it is equal to the demand. Any excess production is then exported. The energy exports in monetary terms are the price of energy times the energy exports. Total export earnings are then the sum of the earnings from energy exports and cotton exports. The total earnings are then reinvested into the four different economic sectors.
WATER SUPPLY
The water supply is the sum of the supply from the two rivers, Amu Darya and the Syr Darya, and the ground water and recycled water, which are all taken to be constant for the region.
WATER DEMAND
The total water demand is the sum of the domestic, industrial, and agricultural water demand. The domestic water demand is the product of population and water demand per capita. The industrial water demand is the product of industrial GNP times the water needed per dollar of industrial output. The agricultural water demand is the product of water needed per hectare for industrial crops times land under industrial crops added to water needed for food crops under irrigation times land under food crops under irrigation.
ARAL SEA
The difference between water supply and water demand less any water losses is then the balance that flows into the Aral Sea. The surface area of the Aral Sea is computed by using look-up tables that were created using past data. The surface is a linear function of the volume of the Aral Sea. Evaporation and precipitation are also
91
computed from look-up tables and they are both linear functions of the surface area. The current year’s volume is then the previous year’s volume plus the inflow into the Aral Sea plus precipitation less evaporation. The level is computed as a function of the volume and the surface area.
4.5.4.4. Scenario Analysis
First, a regional scenario is formulated to achieve the vision goals. This spells out the policy alternatives required to achieve the vision. The implications of these policy alternatives are discussed. Next, an optimistic but realistic scenario is formulated with the regional implications being the end result. The first vision goal studied is economic development. This calls for a threefold increase in per capita income for the region as shown in Figure 4.21.
0
500
1000
1500
2000
2500
101. GNP per Capita
gn
p_p
c(ce
ntr
al_a
sia)
Year 2000 2005 2010 2015 2020 2025
Figure 4.21. GNP per capita (vision goal)
Source: Vali et al. (2002).
The population currently is 58 million and the average annual income per person is approximately US$900. The population is projected to grow to about 70 million in 2025 (UN low projection). This means that the GNP of the region will have to grow approximately three and a half times in the next twenty-five years as shown in Figure 4.22. As there is not much scope for increasing agricultural land and as the price of cotton, which is the major industrial crop produced in the region, is highly unlikely to increase (World Cotton Outlook) most of the growth will have to be in the industrial sector (energy and non-energy) of the economy. Under these assumptions the energy sector will grow from $11.3 billion in 2000 to $61.4 billion in 2025 and the non-energy sector will grow from $3.8 billion in 2000 to $20.6 billion in 2025. Since the service sector is already almost 45 percent of the total economy, we assume service will continue to be 45 percent of the economy. Even though agricultural output doubles from $11.4 billion in 2000 to $22.7 billion in 2025, as a percentage of the economy it falls from 21.7 percent to 11.5 percent as shown in Figure 4.23. Industrialization, however, is not an overnight process so there will be a time lag between implementation of policies geared toward industrialization and realization of results. In the next five to ten years a lot of emphasis will still be on increasing agricultural efficiency and productivity, with a shift toward more aggressive industrialization after that. The study assumes that yields for industrial crops (mainly cotton) will increase from 2000 to 2010 and remain constant thereafter. After 2010, almost all of the increase in economic output will come from the industrial sector.
92
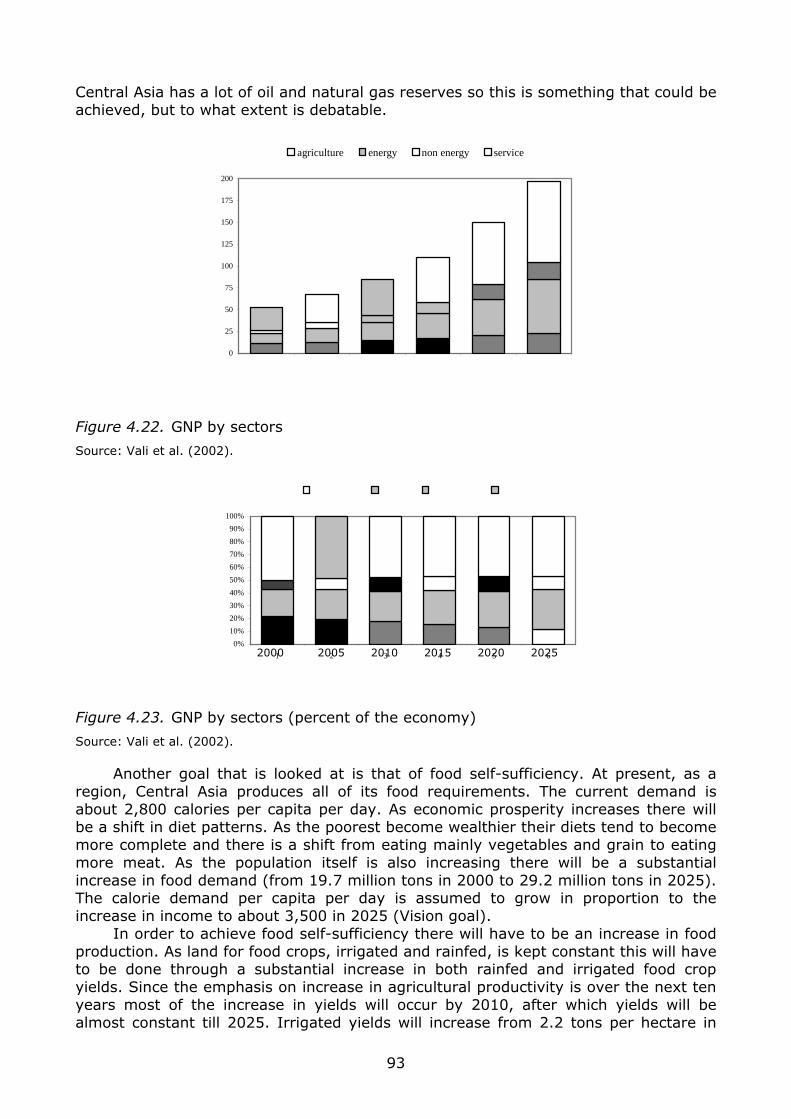
Central Asia has a lot of oil and natural gas reserves so this is something that could be achieved, but to what extent is debatable.
0
25
50
75
100
125
150
175
200
Year
1 2 3 4 5 62000 2005 2010 2015 2020 2025
agriculture energy non energy service
agriculture energy non energy service
Figure 4.22. GNP by sectors
Source: Vali et al. (2002).
0%
10%
20%
30%
40%
50%
60%
70%
80%
90%
100%
Year
1 2 3 4 5 62000 2005 2010 2015 2020 2025
Figure 4.23. GNP by sectors (percent of the economy)
Source: Vali et al. (2002).
Another goal that is looked at is that of food self-sufficiency. At present, as a region, Central Asia produces all of its food requirements. The current demand is about 2,800 calories per capita per day. As economic prosperity increases there will be a shift in diet patterns. As the poorest become wealthier their diets tend to become more complete and there is a shift from eating mainly vegetables and grain to eating more meat. As the population itself is also increasing there will be a substantial increase in food demand (from 19.7 million tons in 2000 to 29.2 million tons in 2025). The calorie demand per capita per day is assumed to grow in proportion to the increase in income to about 3,500 in 2025 (Vision goal). In order to achieve food self-sufficiency there will have to be an increase in food production. As land for food crops, irrigated and rainfed, is kept constant this will have to be done through a substantial increase in both rainfed and irrigated food crop yields. Since the emphasis on increase in agricultural productivity is over the next ten years most of the increase in yields will occur by 2010, after which yields will be almost constant till 2025. Irrigated yields will increase from 2.2 tons per hectare in
93
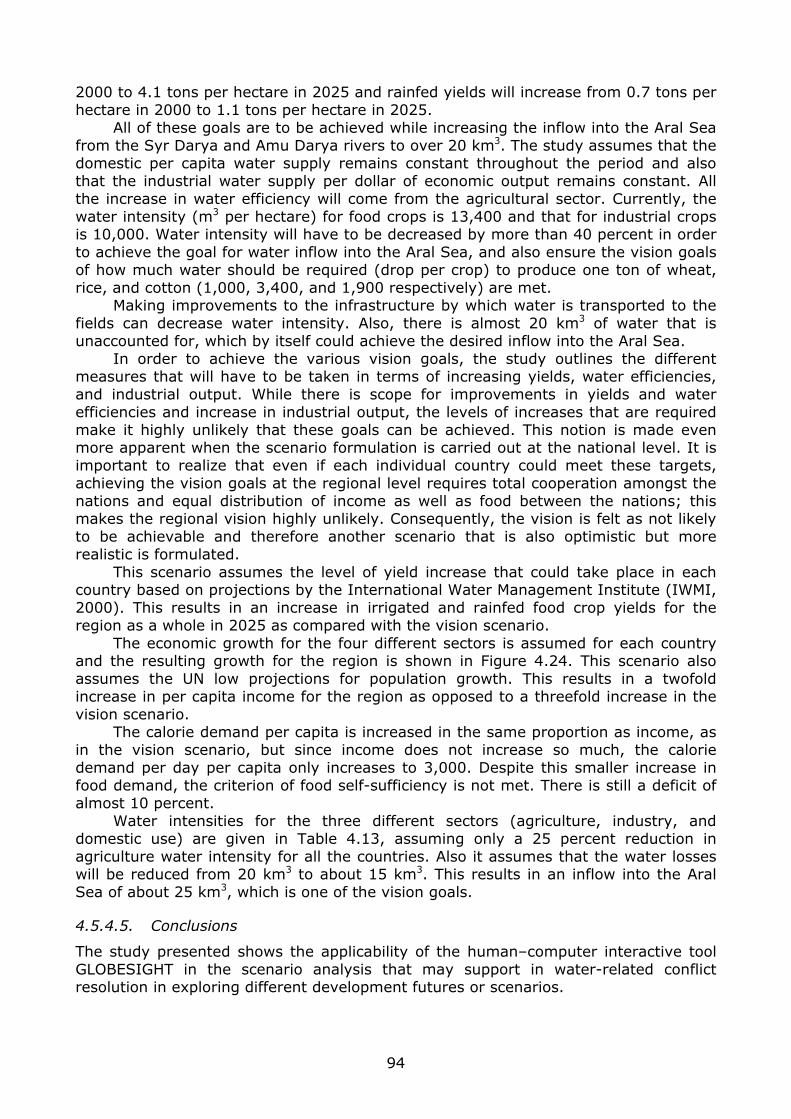
2000 to 4.1 tons per hectare in 2025 and rainfed yields will increase from 0.7 tons per hectare in 2000 to 1.1 tons per hectare in 2025. All of these goals are to be achieved while increasing the inflow into the Aral Sea from the Syr Darya and Amu Darya rivers to over 20 km3. The study assumes that the domestic per capita water supply remains constant throughout the period and also that the industrial water supply per dollar of economic output remains constant. All the increase in water efficiency will come from the agricultural sector. Currently, the water intensity (m3 per hectare) for food crops is 13,400 and that for industrial crops is 10,000. Water intensity will have to be decreased by more than 40 percent in order to achieve the goal for water inflow into the Aral Sea, and also ensure the vision goals of how much water should be required (drop per crop) to produce one ton of wheat, rice, and cotton (1,000, 3,400, and 1,900 respectively) are met. Making improvements to the infrastructure by which water is transported to the fields can decrease water intensity. Also, there is almost 20 km3 of water that is unaccounted for, which by itself could achieve the desired inflow into the Aral Sea. In order to achieve the various vision goals, the study outlines the different measures that will have to be taken in terms of increasing yields, water efficiencies, and industrial output. While there is scope for improvements in yields and water efficiencies and increase in industrial output, the levels of increases that are required make it highly unlikely that these goals can be achieved. This notion is made even more apparent when the scenario formulation is carried out at the national level. It is important to realize that even if each individual country could meet these targets, achieving the vision goals at the regional level requires total cooperation amongst the nations and equal distribution of income as well as food between the nations; this makes the regional vision highly unlikely. Consequently, the vision is felt as not likely to be achievable and therefore another scenario that is also optimistic but more realistic is formulated. This scenario assumes the level of yield increase that could take place in each country based on projections by the International Water Management Institute (IWMI, 2000). This results in an increase in irrigated and rainfed food crop yields for the region as a whole in 2025 as compared with the vision scenario. The economic growth for the four different sectors is assumed for each country and the resulting growth for the region is shown in Figure 4.24. This scenario also assumes the UN low projections for population growth. This results in a twofold increase in per capita income for the region as opposed to a threefold increase in the vision scenario. The calorie demand per capita is increased in the same proportion as income, as in the vision scenario, but since income does not increase so much, the calorie demand per day per capita only increases to 3,000. Despite this smaller increase in food demand, the criterion of food self-sufficiency is not met. There is still a deficit of almost 10 percent. Water intensities for the three different sectors (agriculture, industry, and domestic use) are given in Table 4.13, assuming only a 25 percent reduction in agriculture water intensity for all the countries. Also it assumes that the water losses will be reduced from 20 km3 to about 15 km3. This results in an inflow into the Aral Sea of about 25 km3, which is one of the vision goals.
4.5.4.5. Conclusions
The study presented shows the applicability of the human–computer interactive tool GLOBESIGHT in the scenario analysis that may support in water-related conflict resolution in exploring different development futures or scenarios.
94
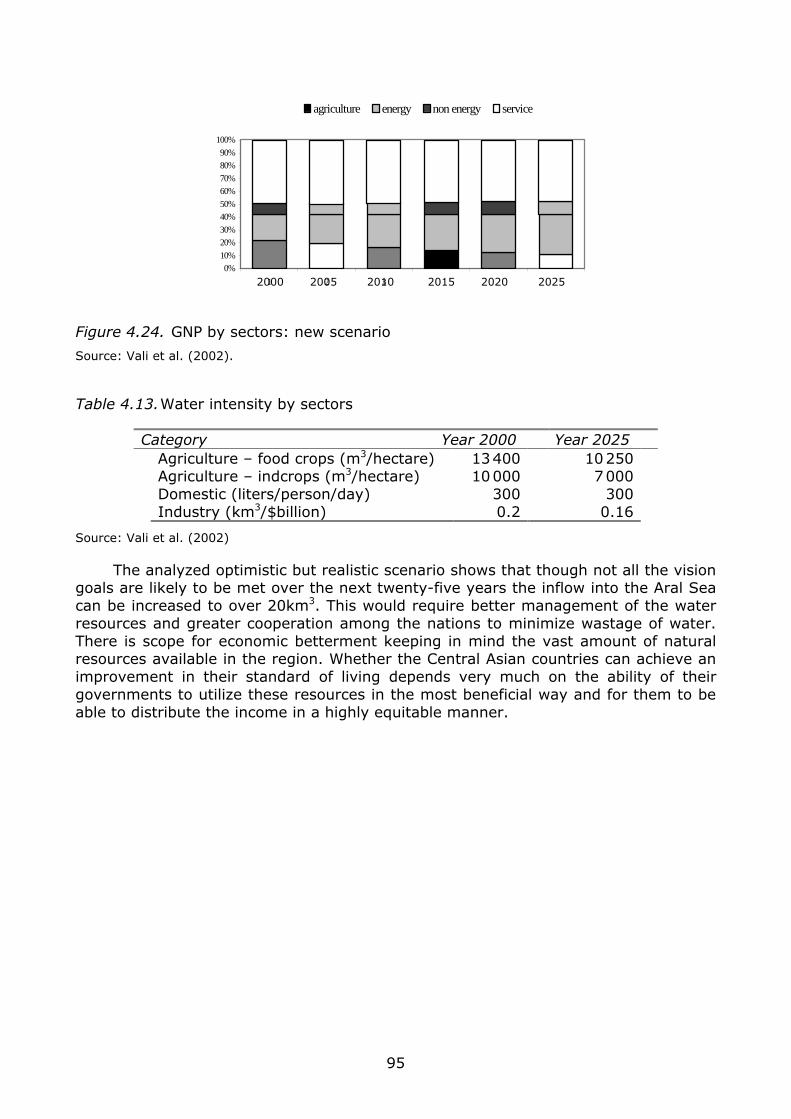
0%
10%
20%
30%
40%
50%
60%
70%
80%
90%
100%
4 5 6
Year
agriculture energy non energy service
1 2 32000 2005 2010 2015 2020 2025
Figure 4.24. GNP by sectors: new scenario
Source: Vali et al. (2002).
Table 4.13. Water intensity by sectors
Category Year 2000 Year 2025 Agriculture – food crops (m3/hectare) 13 400 10 250 Agriculture – indcrops (m3/hectare) 10 000 7 000 Domestic (liters/person/day) 300 300 Industry (km3/$billion) 0.2 0.16
Source: Vali et al. (2002)
The analyzed optimistic but realistic scenario shows that though not all the vision goals are likely to be met over the next twenty-five years the inflow into the Aral Sea can be increased to over 20km3. This would require better management of the water resources and greater cooperation among the nations to minimize wastage of water. There is scope for economic betterment keeping in mind the vast amount of natural resources available in the region. Whether the Central Asian countries can achieve an improvement in their standard of living depends very much on the ability of their governments to utilize these resources in the most beneficial way and for them to be able to distribute the income in a highly equitable manner.
95
5. TREATMENT OF UNCERTAINTY IN NEGOTIATION AND AGREEMENTS
There are many sources and types of uncertainty encountered in water resources management. Mays and Tuan (1992) defined uncertainty as “the occurrence of events that are beyond our control.” The uncertainty of water resource systems is an undeterminable characteristic and during the design and management of them, decisions are made under various kinds of uncertainty. Moral-Seytoux (1976) listed several uncertainties encountered when dealing with water projects. Some uncertainties are governed by laws of chance, for example, uncertainties such as hydrologic uncertainty, economic uncertainty, and population growth. There are uncertainties that are apparently not governed by laws of chance such as uncertainties of a social origin, including revolutions and wars. In water management, uncertainty can be caused by inherent hydrologic variability (data and observation), uncertainty because of a fundamental lack of knowledge of hydrologic processes, and uncertainty involved in the modeling process. However, in a water-related conflict resolution process, uncertainties can occur because of the decision makers involvement in the procedure. The decision makers and/or the stakeholders will have uncertainty regarding their preferences on diverse alternatives. There may be uncertainty in the weights given to various alternatives, too. While the uncertainties related to hydrology could be handled by probabilistic approaches, because of the ability to handle objective (hydrology related) as well as subjective (decision maker related) uncertainties, the use of theory of fuzzy sets is observed to be very suitable in handling uncertainty in conflict analysis. Naturally, conflicts over water take place among two or more stakeholders and each of them can have multiple objectives associated with an array of uncertainties. This chapter presents a multicriteria decision-making (MCDM) approach that would be useful in resolving multi-party, multi-objective conflicts over water when various kinds of uncertainties are involved in the decision-making processes. Complex decision problems involving multiple objectives encountered could very often be addressed by multi-objective analysis approaches, such as compromise programming, ELECTRE, and so on. Though many of these traditional multicriteria decision-making (MCDM) techniques are a very valuable strength for decision makers, extensive sensitivity analysis is necessary to propose any kind of recommendation with confidence. By combining fuzzy sets with a MCDM technique, the evaluation of the performance of discrete alternatives with uncertainties could be modeled as imprecise and vague. A model comprising concepts of fuzzy and compromise programming is presented in this chapter, which addresses many of the qualities lacking in many MCDM techniques where uncertainties and subjectivity are concerned.
5.1. Modeling Uncertainty
Uncertainty is a source of complexity in decision making and can be found in many forms. Typical types of uncertainty include uncertainty in model assumptions and uncertainty in data or parameter values. There may also be uncertainty in the interpretation of results. While some uncertainties can be modeled as stochastic variables in a simulation, other forms of uncertainty may simply be vague or imprecise. Traditional techniques for evaluating discrete alternatives such as ELECTRE (Benayoun et al., 1966), AHP (Saaty, 1980), compromise programming (Zeleny, 1973; Zeleny, 1982), and others do not normally consider uncertainties involved in procuring criteria values. AHP inherently includes linguistic subjectivity, and has been
96
applied to water resources problems (Palmer and Lund, 1985; Lund and Palmer, 1986). Sensitivity analysis can be used to express decision maker’s uncertainty (such as uncertain preferences and ignorance), but this form of sensitivity analysis can be inadequate at expressing both the probabilistic and imprecise forms of uncertainty. There have been efforts to extend traditional techniques, such as PROTRADE (Goicoechea et al., 1982), which could be described as a stochastic multi-objective technique. A remaining problem is that not all uncertainties easily fit the probabilistic classification. There are typically three main forms of imprecision identified in fuzzy decision making (Ribeiro et al., 1995). They are:
● incompleteness, such as insufficient data ● fuzziness, where precise concepts are difficult to define ● the illusion of validity, such as detection of erroneous outputs (Tversky and
Kahneman, 1990).
5.2. Fuzzy Decision Making
Fuzzy system descriptions have been applied in water resources planning decisions (Haimes, 1977; Slowinski, 1986). Fuzzy approaches attract a lot of attention in water resource management mainly because of uncertainties in discrete decisions that are affected by continuously variable inputs and also because of empirical and poorly defined goals for water supply, water quality, or other indirect measures such as recreational accessibility. Water supply problems entice fuzzy applications to be combined within multi-objective decisions for expert system decision support (Bardossy and Duckstein, 1992). Zimmerman (1987) presented frameworks and applications of decision making with expert systems in a fuzzy environment. Fuzzy decision-making techniques have addressed some uncertainties, such as the vagueness and conflict of preferences common in group decision making (Blin, 1974; Siskos, 1982; Seo and Sakawa, 1985; Felix, 1994; and others), and at least one effort has been made to combine decision problems with both stochastic and fuzzy components (Munda et al., 1995). Application, however, demands some level of intuitiveness for the decision makers, and encourages interaction or experimentation such as that found in Nishizaki and Seo (1994). Leung (1982) and many others have explored fuzzy decision-making environments. This is not always so intuitive to many people involved in practical decisions because the decision space may be some abstract measure of fuzziness, instead of a tangible measure of alternative performance. The alternatives to be evaluated are rarely fuzzy. However, their perceived performance may be fuzzy. An intuitive, and relatively interactive, decision tool for discrete alternative selection, under various forms of uncertainty, would be a valuable tool in decision making, especially for applications with groups of decision makers. This chapter presents the application of fuzzy sets in conjunction with a standard MCDM technique, compromise programming.
5.3. Displaced Ideals
Multicriteria decision analysis techniques can approach the analysis of multi-objective problems in a number of ways. They are generally based on: outranking relationships, distance metrics, and utility theory. The concept of the displaced ideal was used by Zeleny (1973, 1982) to form “compromise programming,” a multicriteria technique which resolves criteria into a commensurable, unitless, distance metric measured from an ideal point (for each alternative). The result is a direct ranking (strong ordering) of
97
alternatives, valid for the selected weights and the chosen form of distance measurement. The following can be used to calculate a discrete compromise programming distance metric (L), otherwise known as the “Minkowski distance”:
pp
ii
iipi
ff
ffwL
1
*
*
−−
=−
(22)
fi is the value for criteria i ; fi*, fi- are the positive and negative ideal values for criteria i, respectively; wi is a weight, indicates relative importance of a criteria; L is the distance from an ideal solution; and p is the distance metric exponent. It is assumed that . Typically, the Euclidean distance (p=2) is used to penalize
large deviations from the ideal. However, the exponent can also carry an economic interpretation. The Hamming distance (p=1) results in a case of perfect compensation between criteria. For the Chebychev distance (p=α), there is no compensation among criteria: the largest deviation from the ideal dominates the assessment.
∑ =1iw
Many of the traditional MCDM techniques, including compromise programming, attempt to preserve some level of transparency to problems. This is a valuable strength for decision makers. However, compromise programming (like most MCDM techniques) only makes use of a limited amount of information. Extensive sensitivity analysis is necessary to recommend any kind of recommendation with confidence. The marriage of a transparent technique such as compromise programming with fuzzy sets is an example of a hybrid decision-making tool available to future planners.
5.4. Existing Applications Using Fuzzy Ideals
Leung (1982) used the fuzzy ideal concept in multicriteria conflict resolution. Leung defines a fuzzy ideal solution, generates a membership function for each alternative (based on relative satisfaction or closeness to the ideal), and ranks alternatives based on the relative closeness to the ideal using distance metrics. In Leung’s method, no weights are used, and the decision space is not defined by the criteria values but by the fuzzy membership (relative satisfaction) values. For this to occur, fuzzy sets representing level of satisfaction must be used to translate the criteria values. In order to accommodate conflict resolution, the decision space is treated as continuous – connecting the discrete (fuzzy) alternatives and searching for a location with the shortest distance to the fuzzy ideal. Lai et al. (1994) used distance metrics and the concept of a displaced ideal to reduce a multi-objective problem to a two-objective problem. They are to first, very often minimize the distance to an ideal solution, and second, maximize the distance to the worst solution. Membership functions are assigned to the ideal and worst solutions to fuzzify the problem; weights are used to resolve the two remaining objectives. Decisions are reached by formulating the problem as a fuzzy linear programming problem, and solved in the standard Bellman and Zadeh (1970) approach. An example of fuzzy compromise decision making can be found in Bardossy and Duckstein (1992), where a MCDA problem is evaluated using a distance metric with one of the criteria being qualitative and subjective. A codebook (a set of membership functions used to describe categories of subjective information) is established which translates a cardinal scale selection of the subjective criteria into a fuzzy set. Application of the extension principle to combine the single fuzzy criteria with other, quantitative, criteria is demonstrated graphically. Bardossy and Duckstein (1992) and a similar paper by Lee et al. (1994), provide examples of using a fuzzy displaced ideal.
98
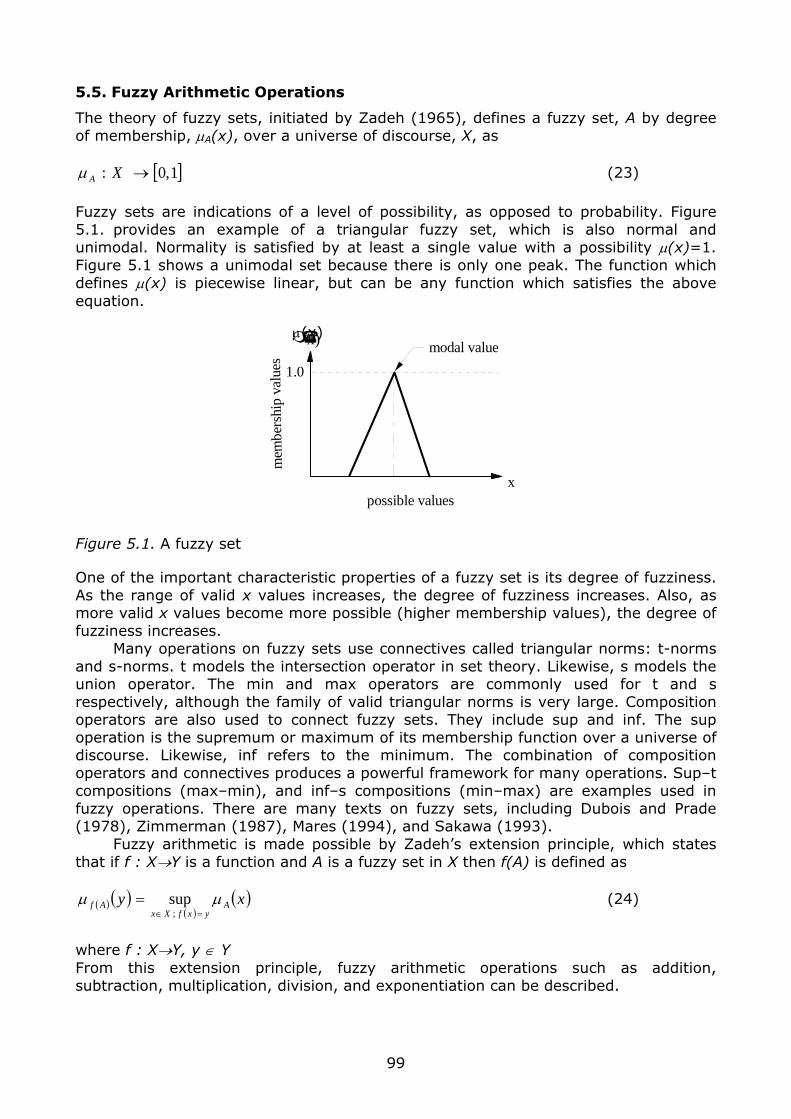
]
5.5. Fuzzy Arithmetic Operations
The theory of fuzzy sets, initiated by Zadeh (1965), defines a fuzzy set, A by degree of membership, µA(x), over a universe of discourse, X, as
[ 1,0: →XAµ (23) Fuzzy sets are indications of a level of possibility, as opposed to probability. Figure 5.1. provides an example of a triangular fuzzy set, which is also normal and unimodal. Normality is satisfied by at least a single value with a possibility µ(x)=1. Figure 5.1 shows a unimodal set because there is only one peak. The function which defines µ(x) is piecewise linear, but can be any function which satisfies the above equation.
1.0
xpossible values
modal value
mem
bers
hip
valu
es
x)µ(x)
Figure 5.1. A fuzzy set
One of the important characteristic properties of a fuzzy set is its degree of fuzziness. As the range of valid x values increases, the degree of fuzziness increases. Also, as more valid x values become more possible (higher membership values), the degree of fuzziness increases. Many operations on fuzzy sets use connectives called triangular norms: t-norms and s-norms. t models the intersection operator in set theory. Likewise, s models the union operator. The min and max operators are commonly used for t and s respectively, although the family of valid triangular norms is very large. Composition operators are also used to connect fuzzy sets. They include sup and inf. The sup operation is the supremum or maximum of its membership function over a universe of discourse. Likewise, inf refers to the minimum. The combination of composition operators and connectives produces a powerful framework for many operations. Sup–t compositions (max–min), and inf–s compositions (min–max) are examples used in fuzzy operations. There are many texts on fuzzy sets, including Dubois and Prade (1978), Zimmerman (1987), Mares (1994), and Sakawa (1993). Fuzzy arithmetic is made possible by Zadeh’s extension principle, which states that if f : X→Y is a function and A is a fuzzy set in X then f(A) is defined as
( ) ( )( )
( )xy AyxfXx
Af µµ=∈
=;sup (24)
where f : X→Y, y ∈ Y From this extension principle, fuzzy arithmetic operations such as addition, subtraction, multiplication, division, and exponentiation can be described.
99
5.6. Fuzzy Compromise Approach
5.6.1. Fuzzy Distance Metrics
Changing all inputs from crisp to fuzzy and applying the fuzzy extension principle can accomplish the transformation of a distance metric to a fuzzy set (Bender and Simonovic, 2000). Measurement of distance between an ideal solution and the perceived performance of an alternative can no longer be given a single value, because many distances are at least somewhat valid. Choosing the shortest distance to the ideal is no longer a straightforward ordering of distance metrics, because of overlaps and varying degrees of possibility. The resulting fuzzy distance metric, as the following approach will attempt to demonstrate, contains a great amount of additional information about the consequences of a decision and the effect of subjectivity. The process of generating input fuzzy sets is not trivial but there are many available techniques for encoding information and knowledge in a fuzzy set. The process of generating appropriate fuzzy sets, accommodating available data, heuristic knowledge, or conflicting opinions, should be capable of presenting information accurately. Appropriate techniques for fuzzy set generation should be considered to be specific to the type of problem being addressed, the availability of different types of information, and the presence of different decision makers. Fuzzification of criteria values is probably the most obvious use of fuzzy sets. There is a long history of published articles demonstrating decision problems with qualitative or subjective criteria. Fuzzy sets are able to capture many qualities of relative differences in perceived value of criteria among alternatives. Placement of model values, along with curvature and skew of membership functions, can allow decision makers to retain what they consider a degree of possibility for subjective criteria values. Selection of criteria weights is an aspect that is typically subjective, usually with a rating on an interval scale. As a subjective value, criteria weights may be more accurately represented by fuzzy sets. Generating these fuzzy sets is also a subjective element. It may be difficult to get honest opinions about the degree of fuzziness from a decision maker. It might actually be more straightforward to generate fuzzy sets for weights when multiple decision makers are involved. Then, at least, voting methods and other techniques are available for producing a composite, collective, opinion. Regardless, more information can be provided about valid weights from fuzzy sets than from crisp weights. Ideal values for criteria may also be very subjective. Certainly, the ideal solution may be significantly more subjective than the perceived performance of an alternative. For example, if profit is a criterion, what is the ideal amount of profit? The distance metric component, p, is probably the most imprecise or vague element of distance metric calculation. There is no single acceptable value of p for every problem and it can be easily misunderstood. Also, it is not related to problem information in any way except by providing parametric control over interpretation of distance. Fuzzification of the distance metric exponent, p, can take many forms but in a practical way it might be defined by a triangular fuzzy set with a mode of two. Larger or smaller (fuzzy) values of p may also be valid but fuzzy exponential operations for large exponents results in difficult interpretation of the distance metric because of a large degree of fuzziness (range of possible values). The benefits of adopting the general fuzzy approach compromise programming are many. Probably the most obvious is the incorporation of subjective uncertainty. Expressing possibility values with fuzzy inputs allows experience to play a significant role in the expression of input information. The shape of a fuzzy set expresses the experience or the interpretation of a decision maker. Conflicting data or preferences can also be easily expressed using multimodel fuzzy sets, making the fuzzy compromise approach a candidate for application to group decision making.
100
Nonfuzzy distance-based techniques measure the distance from an ideal point, where the ideal alternative would result in a distance metric, L : X → {0}. In a fuzzy compromise approach, the distance is fuzzy, such that it represents all of the possible valid evaluations indicated by the degree of possibility or membership value. Alternatives that tend to be closer to the ideal may be selected. This fuzzified distance metric is analogous to a sensitivity analysis for the nonfuzzy case.
5.6.2. Selecting Acceptable Alternatives
The fuzzy compromise approach is further able to support decision analysis exercises by ranking the alternatives according to perceived performance. As an attempt to standardize a procedure for judging which L is best among a set of alternatives, desirable properties can be defined. The most important properties are:
● Possibility values tend to be close to the ideal, x=0, distance. ● Possibility values have a relatively small degree of fuzziness.
Some other performance indicators might favor model values close to the ideal, or possibility values, which tend to be far from poor solutions. An aspect of comparing fuzzy distance metrics is the possible occurrence of points of indifference between fuzzy sets. If the rising limb of a fuzzy distance metric (the arc which is closest to the ideal distance of zero) were to intersect the rising limb of another fuzzy distance metric (that is, equal membership values for two or more alternatives at some distance from the ideal), a point of indifference would exist. The concept of indifference may vary. Interpretation of “best” depends upon which side of the indifference point is considered to be interesting in the evaluation of comparative best. In the special case where the modes are equal, while the rising and falling limbs vary drastically, selection of the mode as the point of interest in ranking the sets will result in equal ranking. Awareness of these indifference points may not be directly evident when ranking alternatives, but indifference points (depending on their location) cause ranking orders to change when different levels of risk tolerance are specified. The ability to express risk tolerance will be explored further. Relative performance of alternatives may be visually intuitive when looking at the fuzzy distance metrics, but in cases where many alternatives display similar characteristics it may be impractical or even undesirable to make a visual selection. A method for ranking alternatives can automate many of the visual interpretations and create reproducible results. A ranking measure may also be useful in supplying additional insight into decision-maker preferences, such as distinguishing relative risk tolerance levels. Selection of ranking method is subjective and specific to the form of problem and the fuzzy set characteristics that are desirable. A taxonomic examination of existing methods can be found in Bortolan and Degani (1985). An assortment of methods exists, ranging from horizontal and vertical evaluation of fuzzy sets to comparative methods. Some of these methods may independently evaluate fuzzy sets, while others use competition to choose among a selection list. Horizontal methods are related to the practice of defuzzifying a fuzzy set by testing for a range of validity at a threshold membership value. Vertical methods tend to use the area under a membership function as the basis for evaluation, such as center of gravity. The comparative methods introduce other artificial criteria for judging the performance of a fuzzy set, such as a fuzzy goal. The following methods are vertical and comparative, respectively. A discussion of their properties follows.
101
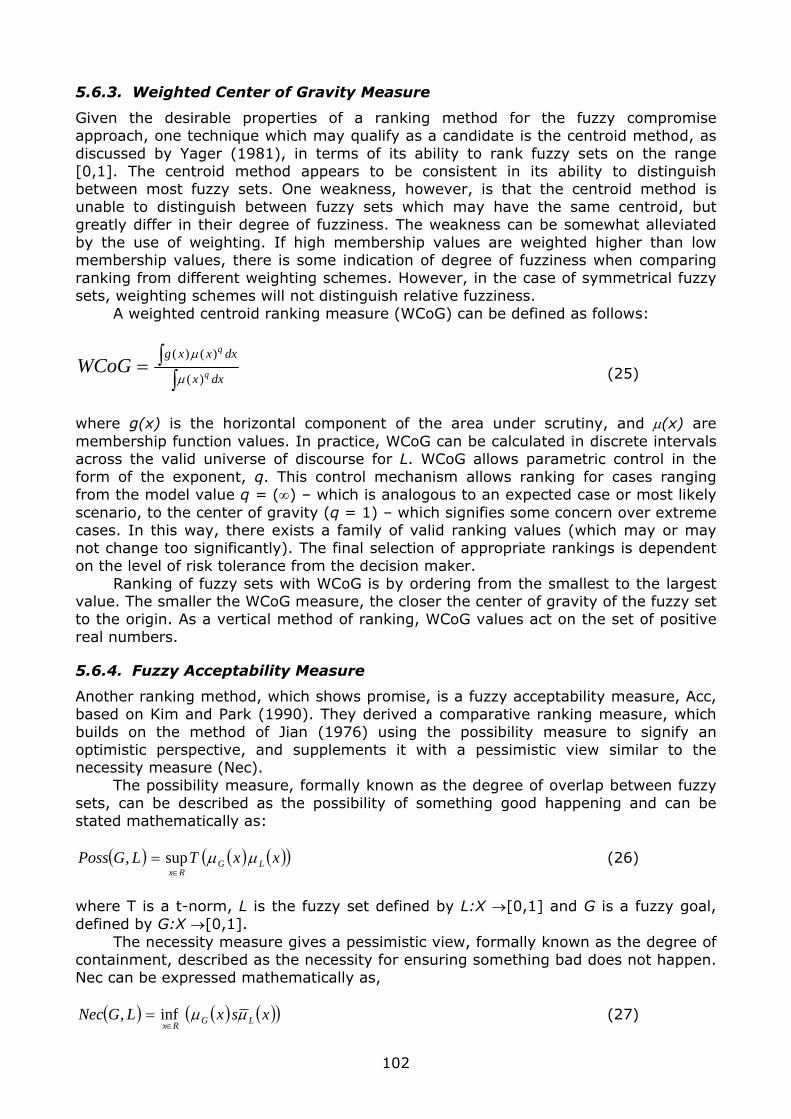
5.6.3. Weighted Center of Gravity Measure
Given the desirable properties of a ranking method for the fuzzy compromise approach, one technique which may qualify as a candidate is the centroid method, as discussed by Yager (1981), in terms of its ability to rank fuzzy sets on the range [0,1]. The centroid method appears to be consistent in its ability to distinguish between most fuzzy sets. One weakness, however, is that the centroid method is unable to distinguish between fuzzy sets which may have the same centroid, but greatly differ in their degree of fuzziness. The weakness can be somewhat alleviated by the use of weighting. If high membership values are weighted higher than low membership values, there is some indication of degree of fuzziness when comparing ranking from different weighting schemes. However, in the case of symmetrical fuzzy sets, weighting schemes will not distinguish relative fuzziness. A weighted centroid ranking measure (WCoG) can be defined as follows:
∫∫=
dxx
dxxxg
q
q
WCoG)(
)()(
µ
µ
(25)
where g(x) is the horizontal component of the area under scrutiny, and µ(x) are membership function values. In practice, WCoG can be calculated in discrete intervals across the valid universe of discourse for L. WCoG allows parametric control in the form of the exponent, q. This control mechanism allows ranking for cases ranging from the model value q = (∞) – which is analogous to an expected case or most likely scenario, to the center of gravity (q = 1) – which signifies some concern over extreme cases. In this way, there exists a family of valid ranking values (which may or may not change too significantly). The final selection of appropriate rankings is dependent on the level of risk tolerance from the decision maker. Ranking of fuzzy sets with WCoG is by ordering from the smallest to the largest value. The smaller the WCoG measure, the closer the center of gravity of the fuzzy set to the origin. As a vertical method of ranking, WCoG values act on the set of positive real numbers.
5.6.4. Fuzzy Acceptability Measure
Another ranking method, which shows promise, is a fuzzy acceptability measure, Acc, based on Kim and Park (1990). They derived a comparative ranking measure, which builds on the method of Jian (1976) using the possibility measure to signify an optimistic perspective, and supplements it with a pessimistic view similar to the necessity measure (Nec). The possibility measure, formally known as the degree of overlap between fuzzy sets, can be described as the possibility of something good happening and can be stated mathematically as:
( ) ( ) (( xxTLGPoss LGRx
))µµ∈
= sup, (26)
where T is a t-norm, L is the fuzzy set defined by L:X →[0,1] and G is a fuzzy goal, defined by G:X →[0,1]. The necessity measure gives a pessimistic view, formally known as the degree of containment, described as the necessity for ensuring something bad does not happen. Nec can be expressed mathematically as,
( ) ( ) ( )( xsxLGNec LGRx
)µµ∈
= inf, (27)
102
where, Lµ is the complement (1 - µL) membership value. These two measures, Poss and Nec, can be combined to form an acceptability measure (Acc): Acc = αPoss(G,L) + (1 - α) Nec (G,L) (28) Parametric control with the acceptability measure (Acc) is accomplished with the α weight and the choice of the fuzzy goal, G. The α weight controls the degree of optimism and degree of pessimism and indicates (an overall) level of risk tolerance. The choice of a fuzzy goal is not so intuitive. It should normally include the entire range of L, but it can be adjusted to a smaller range for the purpose of either exploring shape characteristics of L or to provide an indication of necessary stringency. By decreasing the range of G, the decision maker becomes more stringent in that the method rewards higher membership values closer to the ideal. At the extreme degree of stringency, G becomes a nonfuzzy number requiring the alternatives be ideal. As a function, G may be linear, but can also adapt to place more emphasis or less emphasis near the best value (x = 0 for distance metrics). Ranking of fuzzy sets using Acc is accomplished by ordering values from largest to smallest. That is, the fuzzy set with the greatest Acc is most acceptable. Acc values are restricted on the range (0,1) since both the Poss and Nec measures act on [0,1] and α reduces the range of possible values by a factor of 2.
5.6.5. Comparison of Ranking Methods
Comparison of ranking methods WCoG and Acc with those reviewed by Bortolan and Degani (1985), suggested both to be superior to the methods given in the review, given the desirable properties of L. The problem with many available methods is that, although most are able to correctly identify the best fuzzy set, they may not be capable of distinguishing both degree of dominance and providing an ordinal ranking for more than two fuzzy sets. Many methods supplied ranking values, for example as (1,0,0) for three fuzzy sets. Very little decision information is returned by those methods. Relative dominance among fuzzy sets is an important aspect for distinguishing between fuzzy distance metrics. Both WCoG and Acc provide information of this type. WCoG is conceptually simple and visually intuitive. Its weakness is in discerning between fuzzy sets with the same shape and model value, yet with different degrees of fuzziness is offset, somewhat, by the unlikely event of having distance metrics with those properties. Fuzzy distance metrics may have very similar shapes considering that all alternatives are evaluated for the same fuzzy definition of p. They may also have similar modes, depending on criteria values. Degree of fuzziness, or at least some discrepancy in shape, provides the means by which the weighting parameter q is able to distinguish indifference points. In general, though, interpretation of difference points is not usually very sensitive to the choice in q. Acc provides more comprehensive and possibly more relevant parametric control over the interpretation of results. Acc is able to explore the “surface” of fuzzy distance metrics with a meaningful interpretation of the variables used for parametric control (α, G). However, the parameters for the Acc measure are difficult to justify if some combination is used to recommend an alternative. The appropriate use of Acc is strictly to determine sensitivity, if any, of alternative rankings to different attitudes displayed by a decision maker. Regardless of the combination of characteristics for fuzzy distance metrics, both the WCoG and Acc methods produced similar results, which correspond with visual interpretation of fuzzy distance metrics. Both may prove to be useful in a decision-making problem with multiple alternatives. Choosing just one of these methods or a
103
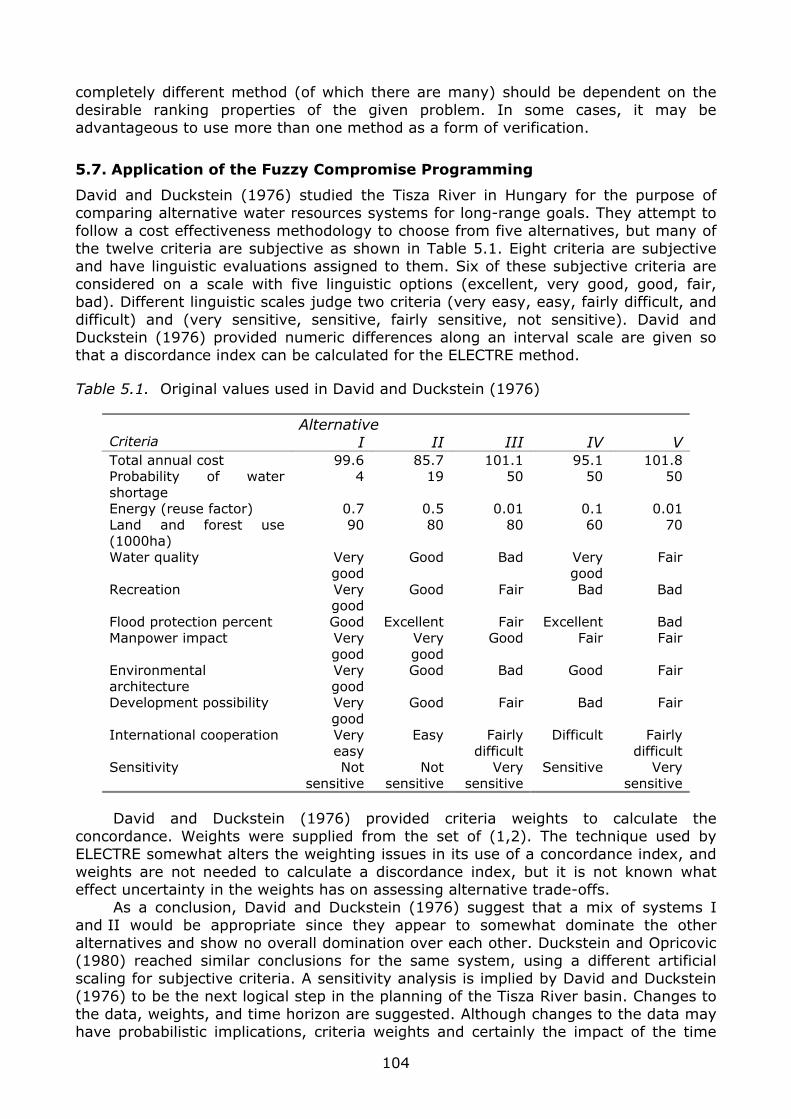
completely different method (of which there are many) should be dependent on the desirable ranking properties of the given problem. In some cases, it may be advantageous to use more than one method as a form of verification.
5.7. Application of the Fuzzy Compromise Programming
David and Duckstein (1976) studied the Tisza River in Hungary for the purpose of comparing alternative water resources systems for long-range goals. They attempt to follow a cost effectiveness methodology to choose from five alternatives, but many of the twelve criteria are subjective as shown in Table 5.1. Eight criteria are subjective and have linguistic evaluations assigned to them. Six of these subjective criteria are considered on a scale with five linguistic options (excellent, very good, good, fair, bad). Different linguistic scales judge two criteria (very easy, easy, fairly difficult, and difficult) and (very sensitive, sensitive, fairly sensitive, not sensitive). David and Duckstein (1976) provided numeric differences along an interval scale are given so that a discordance index can be calculated for the ELECTRE method.
Table 5.1. Original values used in David and Duckstein (1976)
Alternative Criteria I II III IV V Total annual cost 99.6 85.7 101.1 95.1 101.8 Probability of water shortage
4 19 50 50 50
Energy (reuse factor) 0.7 0.5 0.01 0.1 0.01 Land and forest use (1000ha)
90 80 80 60 70
Water quality Very good
Good Bad Very good
Fair
Recreation Very good
Good Fair Bad Bad
Flood protection percent Good Excellent Fair Excellent Bad Manpower impact Very
good Very good
Good Fair Fair
Environmental architecture
Very good
Good Bad Good Fair
Development possibility Very good
Good Fair Bad Fair
International cooperation Very easy
Easy Fairly difficult
Difficult Fairly difficult
Sensitivity Not sensitive
Not sensitive
Very sensitive
Sensitive Very sensitive
David and Duckstein (1976) provided criteria weights to calculate the concordance. Weights were supplied from the set of (1,2). The technique used by ELECTRE somewhat alters the weighting issues in its use of a concordance index, and weights are not needed to calculate a discordance index, but it is not known what effect uncertainty in the weights has on assessing alternative trade-offs. As a conclusion, David and Duckstein (1976) suggest that a mix of systems I and II would be appropriate since they appear to somewhat dominate the other alternatives and show no overall domination over each other. Duckstein and Opricovic (1980) reached similar conclusions for the same system, using a different artificial scaling for subjective criteria. A sensitivity analysis is implied by David and Duckstein (1976) to be the next logical step in the planning of the Tisza River basin. Changes to the data, weights, and time horizon are suggested. Although changes to the data may have probabilistic implications, criteria weights and certainly the impact of the time
104
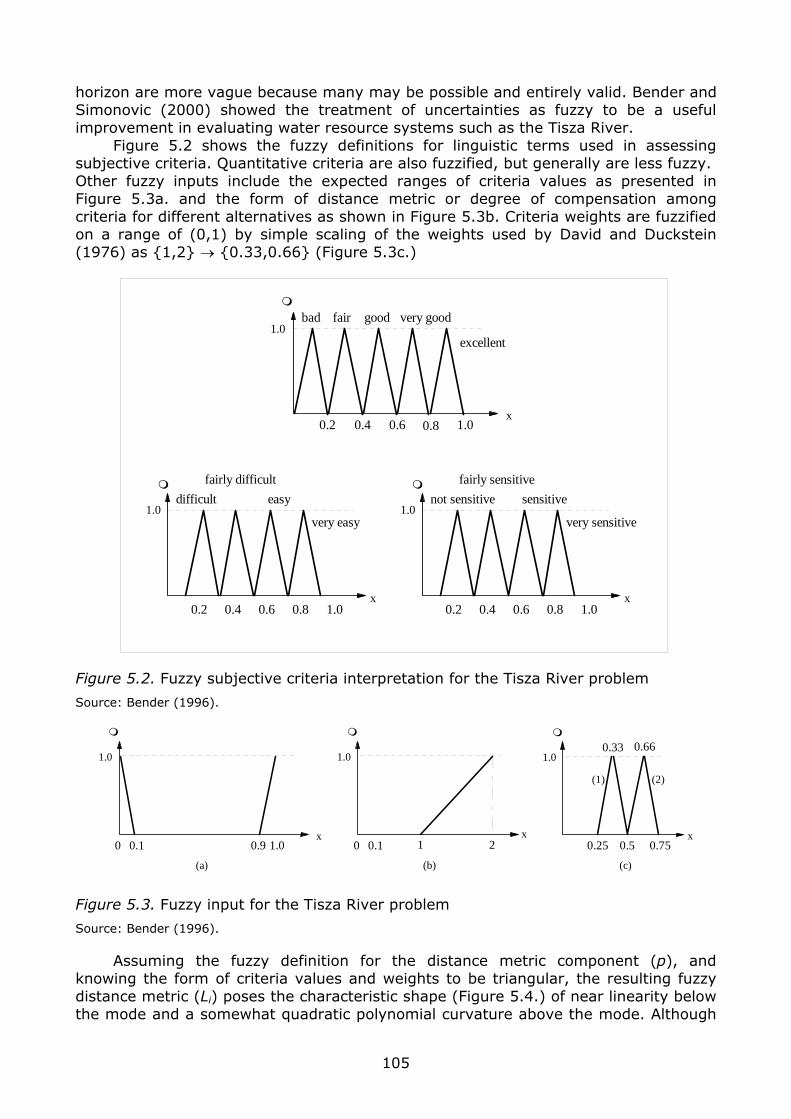
horizon are more vague because many may be possible and entirely valid. Bender and Simonovic (2000) showed the treatment of uncertainties as fuzzy to be a useful improvement in evaluating water resource systems such as the Tisza River. Figure 5.2 shows the fuzzy definitions for linguistic terms used in assessing subjective criteria. Quantitative criteria are also fuzzified, but generally are less fuzzy. Other fuzzy inputs include the expected ranges of criteria values as presented in Figure 5.3a. and the form of distance metric or degree of compensation among criteria for different alternatives as shown in Figure 5.3b. Criteria weights are fuzzified on a range of (0,1) by simple scaling of the weights used by David and Duckstein (1976) as {1,2} → {0.33,0.66} (Figure 5.3c.)
bad fair1.0
x0.2 0.4 0.6 0.8 1.0
good very good
excellent
difficult
fairly difficult
1.0
x0.2 0.4 0.6 0.8 1.0
easy
very easy
not sensitive
fairly sensitive
1.0
x0.2 0.4 0.6 0.8 1.0
sensitive
very sensitive
Figure 5.2. Fuzzy subjective criteria interpretation for the Tisza River problem
Source: Bender (1996).
1.0
x0.10 0.9 1.0
(a)
1.0
x0 1 20.1
1.0
x0.50.25
0.66
0.75
0.33
(1) (2)
(b) (c)
Figure 5.3. Fuzzy input for the Tisza River problem
Source: Bender (1996).
Assuming the fuzzy definition for the distance metric component (p), and knowing the form of criteria values and weights to be triangular, the resulting fuzzy distance metric (Li) poses the characteristic shape (Figure 5.4.) of near linearity below the mode and a somewhat quadratic polynomial curvature above the mode. Although
105
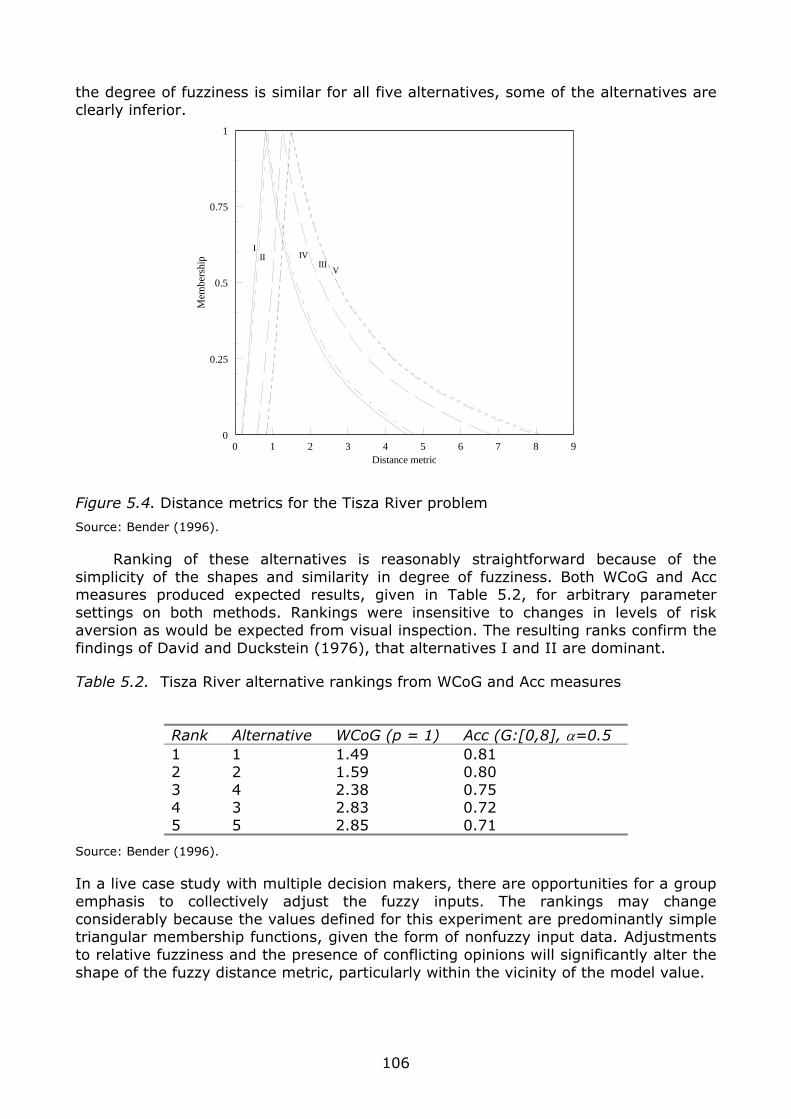
the degree of fuzziness is similar for all five alternatives, some of the alternatives are clearly inferior.
0 1 2 3 4 5 6 7 8 90
0.25
0.5
0.75
1
Distance metric
Mem
bers
hip
III
IIIIV
V
Figure 5.4. Distance metrics for the Tisza River problem
Source: Bender (1996).
Ranking of these alternatives is reasonably straightforward because of the simplicity of the shapes and similarity in degree of fuzziness. Both WCoG and Acc measures produced expected results, given in Table 5.2, for arbitrary parameter settings on both methods. Rankings were insensitive to changes in levels of risk aversion as would be expected from visual inspection. The resulting ranks confirm the findings of David and Duckstein (1976), that alternatives I and II are dominant.
Table 5.2. Tisza River alternative rankings from WCoG and Acc measures
Rank Alternative WCoG (p = 1) Acc (G:[0,8], α=0.5 1 1 1.49 0.81 2 2 1.59 0.80 3 4 2.38 0.75 4 3 2.83 0.72 5 5 2.85 0.71
Source: Bender (1996).
In a live case study with multiple decision makers, there are opportunities for a group emphasis to collectively adjust the fuzzy inputs. The rankings may change considerably because the values defined for this experiment are predominantly simple triangular membership functions, given the form of nonfuzzy input data. Adjustments to relative fuzziness and the presence of conflicting opinions will significantly alter the shape of the fuzzy distance metric, particularly within the vicinity of the model value.
106
5.7.1. Collaborative Decision Making
Group decision making involving stakeholders is important in conflict resolution processes. A fuzzy compromise approach facilitates more collaborative exploration of available alternatives and their associated risks. Increasing or decreasing the fuzziness of the inputs and locating ranges or multiple points of opinion incorporates collective opinions. Fuzzy sets are able to process this kind of information and are also able to present it effectively and intuitively. In this approach, by allowing direct control over the definitions of fuzzy sets, stakeholders are able to experiment with different fuzzy definitions for parameter uncertainties. This promotes a better understanding of consequences for changes in accuracy when viewing the resulting rankings. Each stakeholder brings a unique flavor to the planning process, in terms of his or her level of risk aversion and interpretation of uncertainties in alternative performance. The interactive feedback to stakeholders about potential changes in ranking from different perceptions of uncertainty (i.e., level of risk aversion) may explain many idiosyncrasies in the opinions of different stakeholders. Overall, the role of fuzzy evaluation of alternatives is to promote stakeholder understanding of the relative performance of alternatives, given multiple sources of uncertainty. The fuzzy compromise approach presented here is an example of a technique, which can be relatively transparent and intuitive and allows direct control by stakeholders.
107
6. FUTURE OUTLOOK
6.1. General
In many places in this world water is a stressed resource. Population and regulatory pressures, political and economic instabilities, and variation of climate can all contribute to further pressure to extract more out of existing sources and also to move further away from where the demand is to tap additional sources. This brings neighboring political entities into a situation of potential conflict. In dealing with these pressures up to the present, water resources experts have been using different tools ranging from speculative, observation-based, and experimental to theoretical (Helweg, 1985). In the past, many different tools have been used for simulation and optimization of complex water resources systems in order to provide an improved basis for decision making. To offset the pressure on water in the future, water management will rely more and more on sophisticated information management technology. The continuing evolution of information technology creates a good environment for the transition to new tools. Some current trends are indicating stronger future reliance on computer networking, easily accessible databases, decision support systems, and object-oriented programming and system dynamics simulation.
6.2. Tools for Future Water Management
Complexity and uncertainty are two paradigms that will shape the tools for future water management (Simonovic, 2000). The first focuses on the complexity of the water resources domain and the complexity of the modeling tools in an environment characterized by continuous rapid technological development. The second deals with water-related data availability and natural variability of domain variables in time and space affecting the uncertainty of water resources decision making.
6.2.1. Complexity Paradigm
Water-related problems in future are going to be more complex. Domain complexity is increasing, as shown in Figure 6.1. In the past, water resources development works were created to satisfy the quantity requirements of smaller communities. However, with population growth, large-scale water resource development projects were required over larger spatial scales. In addition, the concern over the environmental and social impacts of water resource management is also increasing. Along with the above factors, the climate variability and regulatory requirements are increasing the complexity of present water resources management problems and complexity will continue to rise in future. When several parties share a single water resource, satisfaction of the diverse interests of stakeholders involved may affect others, leading to conflicts. The complexity of the conflicts will naturally increase with the complex nature of future water management activities. The rapid increase in the processing power of computers is the second complexity paradigm as presented in Figure 6.1. Since 1950, use of computers in water resources management has steadily grown. Computers “the machines that changed the world” have moved out of data processing into information and knowledge processing. The computer has become a “silent partner” for more effective water resources decision making (Simonovic, 1996a, 1996b). The main factor responsible for involving computers in the decision-making process is the treatment of information as the sixth economic resource (the others are: people, machines, money, materials, and management).
108
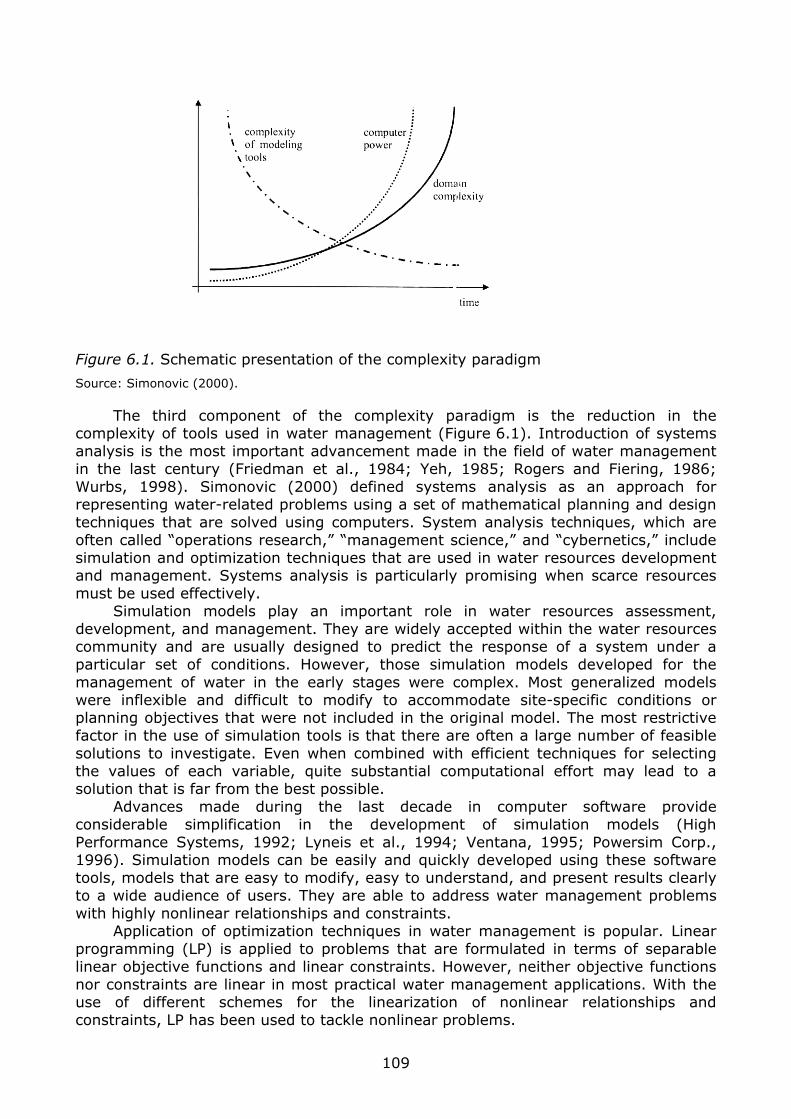
Figure 6.1. Schematic presentation of the complexity paradigm
Source: Simonovic (2000).
The third component of the complexity paradigm is the reduction in the complexity of tools used in water management (Figure 6.1). Introduction of systems analysis is the most important advancement made in the field of water management in the last century (Friedman et al., 1984; Yeh, 1985; Rogers and Fiering, 1986; Wurbs, 1998). Simonovic (2000) defined systems analysis as an approach for representing water-related problems using a set of mathematical planning and design techniques that are solved using computers. System analysis techniques, which are often called “operations research,” “management science,” and “cybernetics,” include simulation and optimization techniques that are used in water resources development and management. Systems analysis is particularly promising when scarce resources must be used effectively. Simulation models play an important role in water resources assessment, development, and management. They are widely accepted within the water resources community and are usually designed to predict the response of a system under a particular set of conditions. However, those simulation models developed for the management of water in the early stages were complex. Most generalized models were inflexible and difficult to modify to accommodate site-specific conditions or planning objectives that were not included in the original model. The most restrictive factor in the use of simulation tools is that there are often a large number of feasible solutions to investigate. Even when combined with efficient techniques for selecting the values of each variable, quite substantial computational effort may lead to a solution that is far from the best possible. Advances made during the last decade in computer software provide considerable simplification in the development of simulation models (High Performance Systems, 1992; Lyneis et al., 1994; Ventana, 1995; Powersim Corp., 1996). Simulation models can be easily and quickly developed using these software tools, models that are easy to modify, easy to understand, and present results clearly to a wide audience of users. They are able to address water management problems with highly nonlinear relationships and constraints. Application of optimization techniques in water management is popular. Linear programming (LP) is applied to problems that are formulated in terms of separable linear objective functions and linear constraints. However, neither objective functions nor constraints are linear in most practical water management applications. With the use of different schemes for the linearization of nonlinear relationships and constraints, LP has been used to tackle nonlinear problems.
109
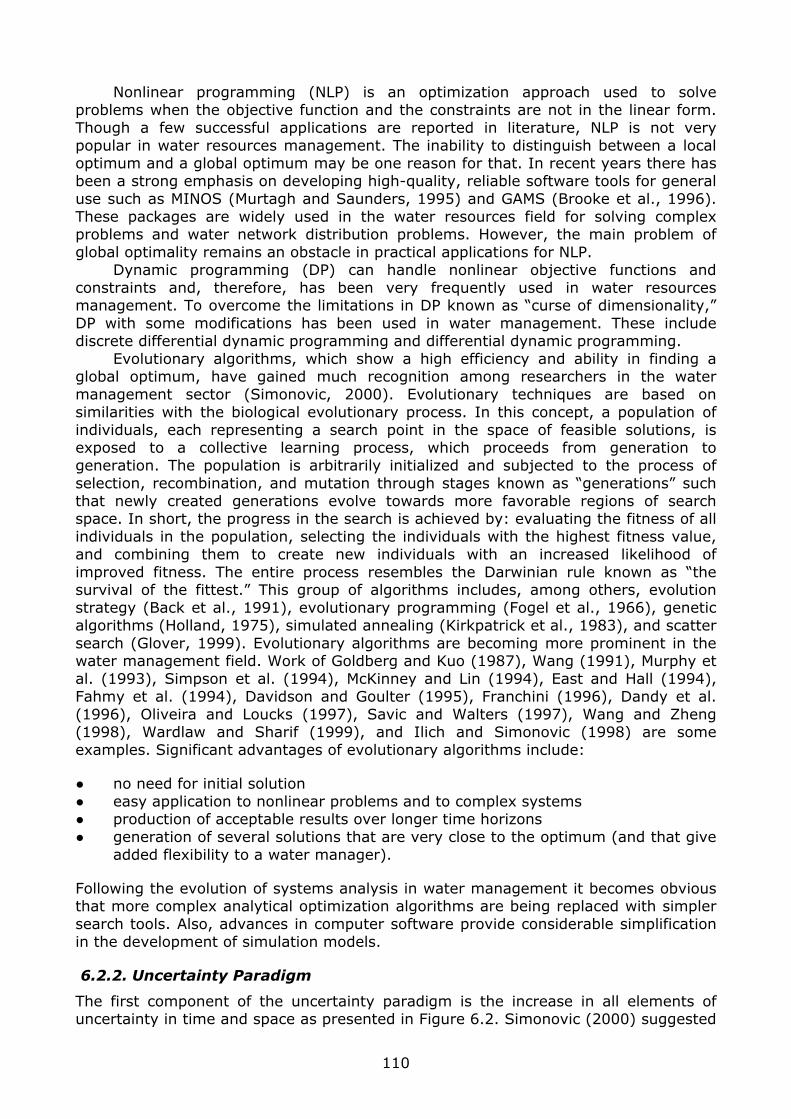
Nonlinear programming (NLP) is an optimization approach used to solve problems when the objective function and the constraints are not in the linear form. Though a few successful applications are reported in literature, NLP is not very popular in water resources management. The inability to distinguish between a local optimum and a global optimum may be one reason for that. In recent years there has been a strong emphasis on developing high-quality, reliable software tools for general use such as MINOS (Murtagh and Saunders, 1995) and GAMS (Brooke et al., 1996). These packages are widely used in the water resources field for solving complex problems and water network distribution problems. However, the main problem of global optimality remains an obstacle in practical applications for NLP. Dynamic programming (DP) can handle nonlinear objective functions and constraints and, therefore, has been very frequently used in water resources management. To overcome the limitations in DP known as “curse of dimensionality,” DP with some modifications has been used in water management. These include discrete differential dynamic programming and differential dynamic programming. Evolutionary algorithms, which show a high efficiency and ability in finding a global optimum, have gained much recognition among researchers in the water management sector (Simonovic, 2000). Evolutionary techniques are based on similarities with the biological evolutionary process. In this concept, a population of individuals, each representing a search point in the space of feasible solutions, is exposed to a collective learning process, which proceeds from generation to generation. The population is arbitrarily initialized and subjected to the process of selection, recombination, and mutation through stages known as “generations” such that newly created generations evolve towards more favorable regions of search space. In short, the progress in the search is achieved by: evaluating the fitness of all individuals in the population, selecting the individuals with the highest fitness value, and combining them to create new individuals with an increased likelihood of improved fitness. The entire process resembles the Darwinian rule known as “the survival of the fittest.” This group of algorithms includes, among others, evolution strategy (Back et al., 1991), evolutionary programming (Fogel et al., 1966), genetic algorithms (Holland, 1975), simulated annealing (Kirkpatrick et al., 1983), and scatter search (Glover, 1999). Evolutionary algorithms are becoming more prominent in the water management field. Work of Goldberg and Kuo (1987), Wang (1991), Murphy et al. (1993), Simpson et al. (1994), McKinney and Lin (1994), East and Hall (1994), Fahmy et al. (1994), Davidson and Goulter (1995), Franchini (1996), Dandy et al. (1996), Oliveira and Loucks (1997), Savic and Walters (1997), Wang and Zheng (1998), Wardlaw and Sharif (1999), and Ilich and Simonovic (1998) are some examples. Significant advantages of evolutionary algorithms include:
● no need for initial solution ● easy application to nonlinear problems and to complex systems ● production of acceptable results over longer time horizons ● generation of several solutions that are very close to the optimum (and that give
added flexibility to a water manager).
Following the evolution of systems analysis in water management it becomes obvious that more complex analytical optimization algorithms are being replaced with simpler search tools. Also, advances in computer software provide considerable simplification in the development of simulation models.
6.2.2. Uncertainty Paradigm
The first component of the uncertainty paradigm is the increase in all elements of uncertainty in time and space as presented in Figure 6.2. Simonovic (2000) suggested
110
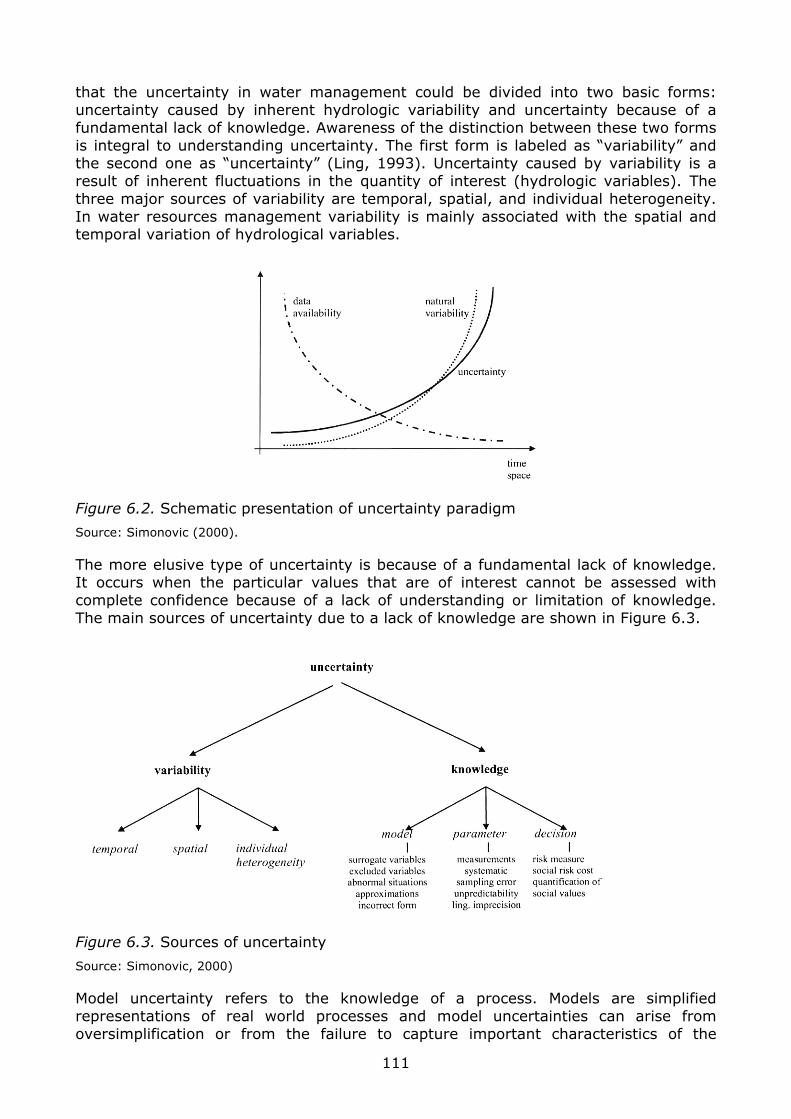
that the uncertainty in water management could be divided into two basic forms: uncertainty caused by inherent hydrologic variability and uncertainty because of a fundamental lack of knowledge. Awareness of the distinction between these two forms is integral to understanding uncertainty. The first form is labeled as “variability” and the second one as “uncertainty” (Ling, 1993). Uncertainty caused by variability is a result of inherent fluctuations in the quantity of interest (hydrologic variables). The three major sources of variability are temporal, spatial, and individual heterogeneity. In water resources management variability is mainly associated with the spatial and temporal variation of hydrological variables.
Figure 6.2. Schematic presentation of uncertainty paradigm
Source: Simonovic (2000).
The more elusive type of uncertainty is because of a fundamental lack of knowledge. It occurs when the particular values that are of interest cannot be assessed with complete confidence because of a lack of understanding or limitation of knowledge. The main sources of uncertainty due to a lack of knowledge are shown in Figure 6.3.
Figure 6.3. Sources of uncertainty
Source: Simonovic, 2000)
Model uncertainty refers to the knowledge of a process. Models are simplified representations of real world processes and model uncertainties can arise from oversimplification or from the failure to capture important characteristics of the
111
process under investigation. The major sources of this type of uncertainty are shown in Figure 6.3. The next general category of uncertainty is parameter uncertainty. This is the fine-tuning of a model and cannot cause the large variations found in model uncertainty. The third type of uncertainty is decision uncertainty that arises when there is controversy or ambiguity concerning how to compare and weigh social objectives. It influences decision making after parameter and model uncertainty have been considered. The decrease in water data availability is the second component of the uncertainty paradigm, as shown in Figure 6.2. Hydrological information is indispensable for water management. Though the number of hydrological stations in operation worldwide as reported by WMO (1995) is very impressive, their distribution is not uniform, being scarce over large areas. Further, financial constraints of governments have resulted in a reduction in data collection programs all over the world. The third component of the uncertainty paradigm is the increase in natural variability of water availability. Water flow exhibits considerable temporal and spatial variation. This variation is not detected if the selected time scale for water balance analyses is longer than the time for such fluctuation. Observed natural variability may be even further affected by the potential climate change.
6.3. Future Tools for Water Management
Based on the two paradigms described above Simonovic (2000) presented four main directions in which future water management tools will be developed. They are:
● object-oriented simulation ● evolutionary optimization ● integration of fuzzy set analysis with simulation and optimization tools ● integration of spatial analysis with simulation and optimization tools.
6.3.1. Object-Oriented Simulation
Object-oriented modeling, a new way of thinking about problems using models organized around real-world concepts (Rumbaugh et al., 1991), is being identified as a powerful approach for water management (Palmer et al., 1993; Simonovic and Bender, 1996; Simonovic et al, 1997; Simonovic and Fahmy, 1999). By separating policy questions from data, object-oriented modeling makes the model results functionally transparent to all parties involved in the water management. The proposed approach is flexible, transparent, and allows for easy involvement of stakeholders in the process of water decision analysis. There are numerous tools used for implementing the object-oriented modeling approach. This vision focuses on the system dynamics simulation that has been used in water resources management in the past. Object-oriented modeling is an appropriate approach for the implementation of systems thinking. Complex water resources planning problems rely heavily on systems thinking, which is defined as the ability to generate understanding through engaging in the mental model-based processes of construction, comparison, and resolution. Computer software tools like STELLA, DYNAMO, VENSIM, POWERSIM (High Performance Systems, 1992; Lyneis et al., 1994; Ventana, 1996; Powersim Corp., 1996), and others help the execution of these processes. “Systems thinking” is a paradigm concerned with systems (defined as sets of interrelated objects) and interrelationships used to perform mental simulations. System dynamics simulation tools are well suited for representing mental models that have been developed using the systems thinking paradigm.
112
The power and simplicity of use of objective oriented simulation applications is not comparable with those developed in functional algorithmic languages. In a very short period of time, the users of the water management tools developed by object-oriented simulation can experience the main advantages of this approach. The power of object-oriented simulation is the ease of constructing “what if” scenarios and tackling big, messy, real-world problems. In addition, general principles upon which the system dynamics simulation tools are developed apply equally to social, natural, and physical systems. Using these tools in water management allows enhancement of water models by adding social, economic, and ecological sectors into the model structure.
6.3.2. Evolutionary Optimization Using Powerful Computers
Use of a Darwinian “survival of the fittest” approach to solve difficult numerical optimization problems in various different forms such as genetic algorithms, evolutionary strategies, evolutionary programming, or simulated annealing will shape the future of optimization. The general characteristics of the evolutionary optimization approach include: generation of a population of initial solutions, evaluating them, selecting a small fraction of the best solutions, and applying the recombination and mutation operators to generate solutions with better fitness values. The progress is achieved as long as the best solutions that are selected as “parents” are capable of producing better “offspring.” A termination condition is met when there is no significant improvement in the objective function after a sufficient number of trials, or when a specified number of trials have been reached. Most evolutionary algorithms converge to an optimal point both from inside and outside the feasible region, which means that often more than 90 percent of the search effort is wasted on generating solutions that are infeasible. Future improvements will identify a way to search only through the feasible region.
6.3.3. Integration of Fuzzy Analysis with Simulation and Optimization Tools
Two basic forms of uncertainty are: uncertainty caused by inherent hydrologic (stochastic) variability and uncertainty due to a fundamental lack of knowledge. Intuitively, the second form appears to be readily modeled by fuzzy sets. However, Simonovic (2000) points out that it is not the type of uncertainty that determines the appropriate method of modeling, but rather data sufficiency and availability. If sufficient data are available to fit a probability density distribution, then use of stochastic variables will be the best way to quantify the uncertain values. On the other hand, if the requirements of sustainability are to be addressed, such as the needs of future generations, expanded spatial and temporal scales, and long-term consequences then the information available is scarce. In this case, the fuzzy set approach can successfully utilize the information that is available. Quantification of complex qualitative criteria, a process often encountered within water resources management, is a typical example where fuzzy systems modeling is favorable. Water quality, flood control, recreation, and many other qualitative criteria are still far from a precise analytical description. Intuitive linguistic formulations are worth considering since fuzzy set theory provides a successful way to operate them.
6.3.4. Integration of Spatial Analysis with Simulation and Optimization
Most of the simulation and optimization tools used in water management up to now do not consider spatial dynamics of water systems in an explicit manner. In most cases, the approach has been to summarize the spatially important features of the water system with one or two aggregate relationships. For example, in the case of a reservoir, the spatially important details are summarized by nonlinear functions
113
linking surface area and elevation to the volume of water in the lake. Our understanding of some systems may be improved by introducing spatial dimensions in an explicit manner. Spatial modeling can be implemented with any of the system dynamics simulation stock-and-flow software packages. The information in the dynamic model can be integrated with a geographic information system (GIS) to improve communication and interpretation. In this way, dynamic simulation models can deal with spatially explicit information while allowing fundamental laws to be expressed at one point in space (at the cellular level). The power of GIS is enhanced as well. When linked to a system dynamics simulation model, a GIS provides a dynamic perspective as well as a spatial perspective. Analytical optimization tools still have a great advantage over standard GIS in solving optimization problems. Therefore, an alternative approach to embedded optimization programs in GIS is to embed spatial interaction models within a procedure that optimizes locations. In either case, in the not-so-distant future we will definitely see more and more powerful GIS packages capable of optimizing a variety of water management problems with emphasis on spatial variability of decision variables, objectives, and constraints.
6.4. Use of Virtual Databases
Collection of data or information and sharing them among stakeholders are vital in the water conflict resolution process. The advancement of computer sciences and information technologies provides improved measures in handling data and information. The present Internet technology is mature enough to support the development of virtual databases for a complex domain such as water-related conflict resolution. This mode of support has many advantages when compared to more traditional centralized database models. The virtual database (VDB) is an Internet based data catalog that facilitates search by data type, custodian, location, and other attributes from a distributed confederation of data-holding organizations. The data required in water conflict management consists of a variety of data sets, each of which is used for specific purposes. The type of data related include:
● topographic data (elevations, land use, soils, vegetation, hydrography, and so on)
● imagery (satellite images, aerial photographs, and so on) ● administrative data (such as, political boundaries, jurisdictional boundaries) ● infrastructure data (such as, roads, levees, wells, utilities, bridges, hydraulic
structures) ● environmental data (threatened and endangered species, critical aquatic and
wildlife habitat, archeological sites, water quality, and so on) ● hydrometeorologic data (flood plain delineation, stream flows, precipitation,
temperature, wind, solar radiation, soil moisture, and so on) ● economic data (industries and so on) ● emergency management data (emergency plans, census data, organizational
charts, etc.)
There is a large amount of relevant data that is usually maintained by various agencies, each with different levels of complexity. In general, each data series may consist of several data sets. Each data set may contain several features. A database system is a combination of one or more databases and a database management system. A database is a collection of data, and a database management system is a collection of programs that enable users to create and maintain a database.
114
The Internet technology can be used to support data collection, processing, and dissemination. At present, the Internet can be accessed through the local area network (LAN), telephone line, cable, or wireless (mobile) technology. The faciilties that the Internet provides include information browsing, database access, and file transfers at any time and from nearly anywhere. Two approaches can be considered in building an internet-enabled database system. First, a centralized approach involves collecting data from different sources and storing them in a single dedicated database at one location. A web site connecting to this database is necessary to supply query interfaces to web clients. Second, a distributed approach does not require centralized data storage. Instead, the data can be stored in the database of data provider and accessed through the Internet. This type of database solution relies on more advanced Internet and computer science technology and is known as the “Virtual Database” (VDB).
6.4.1. Evaluation of User Data Needs
At the beginning of VDB development it is necessary to communicate with all the stakeholders involved in the conflict to capture all the relevant data and (numerical and descriptive) information, aspirations, proposals, modeling tools, and so on.
6.4.2. Virtual Database Architecture
An example of a conceptual architecture of a VDB, one developed for the Red River basin in Canada for a flood management study (Simonovic, 2002) is presented in Figure 6.4. It shows the general configuration in terms of communication and data accessibility across a distributed or remote network of sites. Data providers have several options for providing access to data sets. These include:
● Data Provider 1 stores its metadata on an external web server, but then retrieves information from within its firewall from internal operational systems. Data can be retrieved from this data provider online through a transactional system.
● Data Provider 2 stores its metadata on an external web server and replicates relevant public data also to the external web server. No access through the firewall is permitted. The replication is intended to synchronize internal data sources with the external data store. Data can be retrieved from this data provider online via an application of FTP service.
● Data Provider 3 stores its metadata on an external web server and posts static public data to an FTP site on the external server. Data can be retrieved from this data provider online via an FTP service.
● Data Provider 4 stores its metadata only on an external web server and provides no access to internal or external data sources. Data cannot be retrieved from this data provider on line. A formal request for required data may be fulfilled in an offline process.
Simonovic (2002) discussed architecture and technical requirements of a virtual database in detail based on the virtual database developed for the management of floods of the Red River in Canada.
115
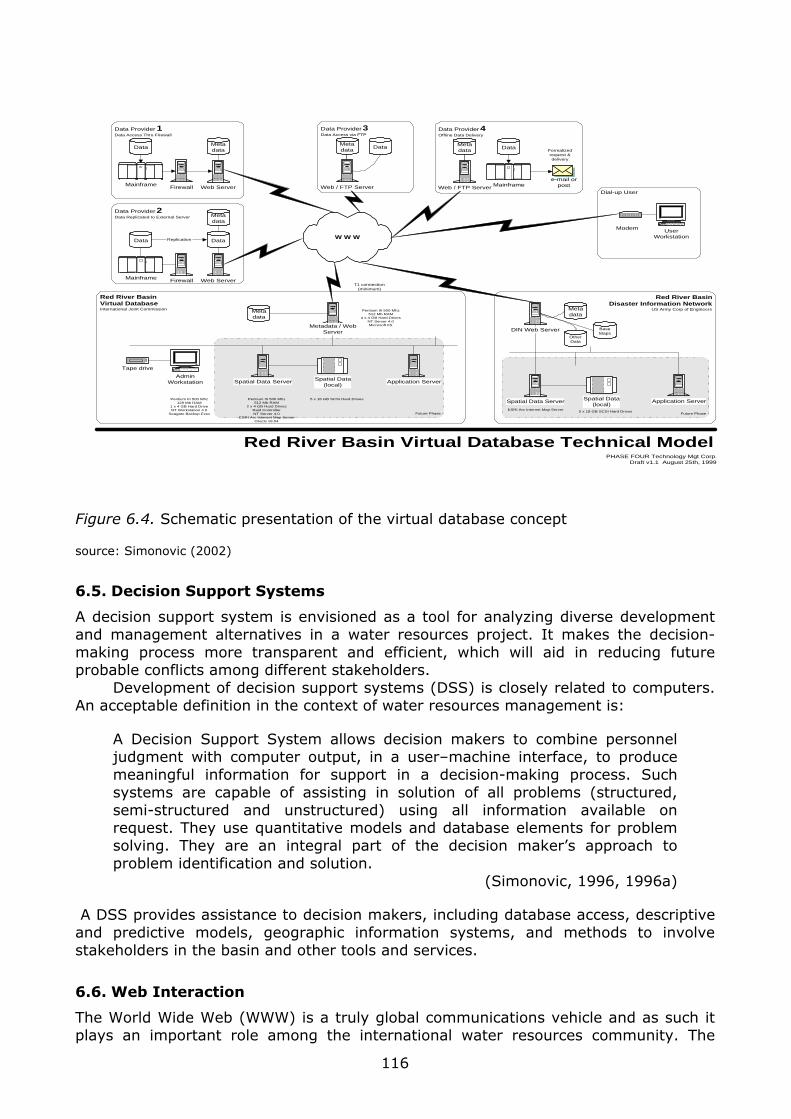
Future Phase
W W W
T1 connection(minimum)
Future Phase
Metadata / WebServer
Spatial Data ServerAdmin
Workstation Application ServerSpatial Data(local)
Metadata
Red River BasinVirtual DatabaseInternational Joint Commission Pentium III 500 Mhz
512 Mb RAM4 x 4 GB Hard Drives
NT Server 4.0Microsoft IIS
Pentium III 500 Mhz512 Mb RAM
2 x 4 GB Hard DrivesRaid ControllerNT Server 4.0
ESRI Arc Internet Map ServerOracle v8.04
5 x 18 GB SCSI Hard Drives
Tape drive
Pentium III 500 Mhz128 Mb RAM
1 x 4 GB Hard DriveNT Workstation 4.0
Seagate Backup Exec
DIN Web Server
Spatial Data Server Spatial Data(local)
Metadata
OtherData
Red River BasinDisaster Information Network
US Army Corp of Engineers
ESRI Arc Internet Map Server5 x 18 GB SCSI Hard Drives
Application Server
BaseMaps
Red River Basin Virtual Database Technical ModelPHASE FOUR Technology Mgt Corp.
Draft v1.1 August 25th, 1999
UserWorkstation
Modem
Dial-up User
Firewall
Metadata
Web ServerMainframe
Data Provider 2Data Replicated to External Server
Data DataReplication
Metadata
Web / FTP Server
Data Provider 3Data Access via FTP
Data
Firewall
Metadata
Web ServerMainframe
Data Provider 1Data Access Thru Firewall
DataMetadata
Web / FTP Server
Data Provider 4Offline Data Delivery
Mainframe
Data
e-mail orpost
Formalizedrequest &delivery
Figure 6.4. Schematic presentation of the virtual database concept
source: Simonovic (2002)
6.5. Decision Support Systems
A decision support system is envisioned as a tool for analyzing diverse development and management alternatives in a water resources project. It makes the decision-making process more transparent and efficient, which will aid in reducing future probable conflicts among different stakeholders. Development of decision support systems (DSS) is closely related to computers. An acceptable definition in the context of water resources management is:
A Decision Support System allows decision makers to combine personnel judgment with computer output, in a user–machine interface, to produce meaningful information for support in a decision-making process. Such systems are capable of assisting in solution of all problems (structured, semi-structured and unstructured) using all information available on request. They use quantitative models and database elements for problem solving. They are an integral part of the decision maker’s approach to problem identification and solution.
(Simonovic, 1996, 1996a)
A DSS provides assistance to decision makers, including database access, descriptive and predictive models, geographic information systems, and methods to involve stakeholders in the basin and other tools and services.
6.6. Web Interaction
The World Wide Web (WWW) is a truly global communications vehicle and as such it plays an important role among the international water resources community. The
116
Internet has exploded within the global development scenario as e-mail and the WWW are finding many practical applications (Anderson, 1999). Environmental related information and activity are quite abundant on-line and water resources related websites and information have experienced a dynamic evolution in a relatively short timeframe. In water resources management, especially in water-related conflict resolution, providing all the stakeholders involved in the conflict with access to data, analysis tools, and other relevant information is vital. It enables each interested party or stakeholder to investigate probable solutions to the conflict individually and then negotiate with a better understanding of the consequences of the alternative solutions. The web can provide this opportunity of giving all the stakeholders the access to the tools developed to analyze the conflict and a common database, which has data and information relevant to the water conflict. An online database common to all stakeholders provides easy access to the latest water resources information. The database should be easily accessible for both information retrieval and information updating. It allows the user community to update information themselves, distributing the maintenance workload and enhancing accuracy. The inclusion of relevant information from multiple subdisciplines under water resources (engineering, economic, social, environmental, and so on) would be vital in conflict analysis processes. Stakeholders should not only have access to the databases, but also should be able to use the decision support system developed to analyze the conflict from their own computer. In addition, they can use various web-based decision support systems applicable in analyzing their problem via the Internet. Web-based DSS (Internet) deliver decision support information or decision support tools to a manager or business analyst using a “thin-client” web browser like Netscape Navigator or Internet Explorer that accesses the Global Internet or a corporate intranet. The computer server that hosts the DSS application is linked to the user’s computer by a network with the TCP/IP protocol. web-based DSS can be communications-driven, data-driven, document-driven, knowledge-driven, model-driven, or a hybrid. web technologies can be used to implement any category or type of DSS. “Web-based” means the entire application is implemented using web technologies; “web-enabled” means key parts of an application like a database remain on a legacy system, but the application can be accessed from a web-based component and displayed in a browser.
117
BIBLIOGRAPHY
Allan, J. A. 1998. Virtual Water: An Essential Element in Stabilizing the Political Economics of the Middle East. In: J. Albert, M. Bernhardsson, and R. Kenna, Transformations of Middle Eastern Natural Environments: Legacies and Lessons, pp. 141–9. New Haven: Yale School of Forestry and Environmental Studies, Bulletin Series No. 103.
Allan, R. B. and Bridgeman, S. G. 1986. Dynamic Programming in Hydropower Scheduling. Journal of Water Resources Planning and Management, ASCE, Vol. 112, No. 3, pp. 339–53.
Anderson, F. 1999. A Wider World Wide Web: Global Usability and Water Websites. Symposium on Water Resources and the World Wide Web. Seattle, Washington.
http://www.awra.org/proceedings/www99/ Andreu, J.; Capilla, J.; and Sanchis, E. 1996. AQUATOOL: A Generalized Decision-support
System for Water-resources Planning and Operational Management. Journal of Hydrology, Vol. 177, pp. 269–91.
Anson, R. and Jelassi, M. T. 1990. A Development Framework for Computer-supported Conflict Resolution. European Journal of Operational Research, Vol. 46, pp. 181–99.
Anson, R.; Jelassi, M. T.; and Bostrom, R. P. 1987. Negotiation Support Systems: Computer Support to Mediated Conflict Resolution. IRMIS Working Paper Series # W712 (October). Bloomington, Ind., Institute for Research on the Management of Information Systems, Indiana University.
Antrim, L. N. 1986. Future Needs for Negotiation Support Systems: A Practitioner’s View. Paper presented at the annual meeting of the Operational Research Society of America. Miami, Fla.
Arumugam, N. and Mohan, S. 1997. Integrated Decision Support System for Tank Irrigation System Operation. Journal of Water Resources Planning and Management, ASCE, Vol. 123, No. 5, pp. 266–73.
Back, T.; Hoffmeister, F.; and Schewel, H. P. 1991. A Survey of Evolution Strategies. Proceedings, of the Fourth International Conference on Genetic Algorithms. San Mateo, Calif., Morgan Kaufmann.
Bardossy, A. and Duckstein, L. 1992. Analysis of a Karstic Aquifer Management Problem by Fuzzy Composite Programming. Water Resources Bulletin, Vol. 28, No. 1, pp. 63–73.
Bellman, R. and Zadeh, L. 1970. Decision Making in a Fuzzy Environment. Management Science, Vol. 17, pp. 141–64.
Benayoun, R.; Roy, B.; and Sussmann, B. 1966. ELECTRE: Une Methode pour Quider le Choix en Presence de Points de vue Multiples. Note Trav. 49, Paris, Dir.Sci., Soc.Econ.Math. Appl.
Bender, M. J. 1996. A Framework for Collaborative Planning and Investigations of Decision Support Tools for Hydro Development. PhD Thesis, Department of Civil and Geological Engineering, University of Manitoba, Canada.
Bender, M. J. and Simonovic, S. P. 1996. A Systems Approach for Collaborative Decision Support in Water Resources Planning. Proceedings. IEEE Society of Social Implications of Technology, ISTAS’96, Technical Expertise and Public Decision. Princeton.
––––. 1997. Consensus as the Measure of Sustainability. Journal of Hydrological Sciences, Vol. 42, No. 2, pp. 493–500.
––––. 2000. A Fuzzy Compromise Approach to Water Resource Systems Planning Under Uncertainty. Fuzzy Sets and Systems, Vol. 115, pp. 35–44.
Bender, M. J.; Katopodis, C.; and Simonovic, S. P. 1992. A Prototype Expert System for Fishway Design. Environmental Monitoring and Assessment, Vol. 23, pp. 115–27.
Bennett, L. L. and Howe, C. W. 1998. The Interstate River Compact: Incentives for Non–compliance. Water Resources Research, Vol. 34, No. 3, pp. 485–95.
Bingham, G.; Wolf, A; and Wohlgenant, T. 1994. Resolving Water Disputes: Conflict and Cooperation in the United States, Asia, and the Near East. Washington, D.C.: US Agency for International Development.
Bleed, A. S. 1990. Platte River Conflict Resolution, In: W. Viesmann Jr. and E. T. Smerdon, Managing Water-related Conflicts: The Engineer’s Role, pp. 131–40. New York: American Society of Civil Engineers.
Blin, J. 1974. Fuzzy Relations in Group Decision Theory. Journal of Cybernetics, Vol. 4, No. 2, pp. 17–22.
118
Bogardi, J. J. 1994. Introduction of Systems Analysis: Terminology, Concepts, Objective Function and Constrains. In: J. J. Bogardi and H. P. Nachtnebel (eds.), Multicriteria Decision Analysis in Water Resources Management, Report WS14, pp. 23–32. Paris, France, UNESCO International Hydrological Programme.
Bogardi, J. J. and Nachtnebel, H. P. 1994. Multicriteria Decision Analysis in Water Resources Management, Report WS14. Paris, France, UNESCO International Hydrological Programme.
Bortolan, G. and Degani, R. 1985. A Review of Some Methods for Ranking Fuzzy Subsets. Fuzzy Sets and Systems, Vol. 15, pp. 1–19.
Brooke, A.; Kendirk, D.; and Meeraus, A. 1996. GAMS: A User’s Guide. Redwood City, Calif., Scientific Press.
Brown, L. 1995. Who Will Feed China?: Wake-up Call for a Small Planet. The Worldwatch Environmental Alert. New York, W.W. Norton.
Buras, N. 1972. The Scientific Allocation of Water Resources. New York, Amsterdam, Elsevier. Carpenter, S. L. and Kennedy, W. J. D. 1988. Managing Public Disputes: A Practical Guide to
Handling Conflict and Reaching Agreements. San Francisco, Jossey-Bass. Chung, I. and Helweg, O. 1985. Modeling the California State Water Project. Journal of Water
Resources Planning and Management. ASCE, Vol. 111, No. 4, pp. 82–98. Clamen, M. 2002. Water Resource Conflict Assessment and Resolution: The IJC Experience.
Paper prepared for UNESCO conference to be held in Den Haag. Nov.2002. Clark, E. H.; Bingham, G.; and Orenstein, S. G. 1991. Resolving Water Disputes: Obstacles
and Opportunities. Resolve, Vol. 23, No. 1, pp. 1–7. Cobble, K. and Huffman, D. 1999. Learning from Everyday Conflict. The Systems Thinker,
Vol. 10, No. 2. Commonwealth Knowledge Network, http://www.commonwealthknowledge.net/ Cosgrove, W. J. and Rijsberman, F. R. 2000. World Water Vision: Making Water Everybody’s
Business. London, Earthscan. Dandy, G. C.; Simpson, A. R.; and Murphy, L. J. 1996. An Improved Genetic Algorithm for Pipe
Network Optimization. Water Resources Research, Vol. 32, No. 2, pp. 449–58. Danube Commission for Navigation. 1988. Recommendations for the Danube Water Way.
Budapest, Hungary. David, L. and Duckstein, L. 1976. Multi-criterion Ranking of Alternative Long-range Water
Resource Systems. Water Resources Bulletin, Vol. 12, No. 4, pp. 731–54. Davidson, J. W. and Goulter, I. C. 1995. Evolution Program for the Design of Rectilinear
Branched Distribution Systems. Journal of Computing in Civil Engineering, ASCE, Vol. 9, No. 2, pp. 112–21.
Davis, J. R.; Nanninga, P. M.; Bigin, J.; and Laut, P. 1991. Prototype Decision Support System for Analyzing Impact of Catchment Policies. Journal of Water Resources Planning and Management, ASCE, Vol. 117, No. 4, pp. 399–414.
Delli-Priscoli, J. 1988. Conflict Resolution in Water Resources: Two 404 General Permits. Journal of Water Resources Planning and Management, ASCE, Vol. 114, No. 1, pp.66–77.
Dubois, D. and Prade, H. 1978. Operations on Fuzzy Numbers. International Journal of Systems Science, Vol. 9, No. 6, pp. 613–26.
Duckstein, L. and Opricovic, S. 1980. Multi-objective Optimization in River Basin Development. Water Resources Research, Vol. 16, No. 1. pp. 14–20.
Dukhovny, V. 2002. Project Proposal: A Set of Models for the Aral Sea Basin as a Tool for Integrated Water Resources Management and Sustainable Development. Paper submitted for the PCCP Project report. UNESCO.
Dunn, S. M.; Mackay, R.: Adams, R.; and Oglethorpe, D. R. 1996. The Hydrological Component of the NELUP Decision-support System: An Appraisal. Journal of Hydrology, Vol. 177, pp. 213–35.
East, V. and Hall, M. J. 1994. Water Resources System Optimization Using Genetic Algorithms. Proceedings, Hydroinformatics ‘94, First International Conference on Hydroinformatics, pp. 225–31. Rotterdam, the Netherlands, Balkema.
Eberhardt, A. 1994. Lake Ontario Regulation Utilizing an Expert System Approach Constrained by Interest Satisfaction Relationships. Proceedings, ASCE Water Resources Planning and Management Division Conference.
ECE. 1994. Economic Commission for Europe. European Inland Water Ways. New York, Geneva, UN.
Encyclopedia of Life Support Systems (EOLSS). 2002. Oxford, UK, EOLSS.
119
http://www.eolss.co.uk and http://www.eolss.com Equipe Cousteau. 1993. The Danube: For Whom and for What? Report to the IBW, Paris,
France. Fahmy, H. S.; King, M. W.; Wentzel, M. W.; and Seton, J. A. 1994. Economic Optimization of
River Management Using Genetic Algorithms. Paper No. 943034, ASAE 1994 International Summer Meeting. St Joseph, Mich., USA.
Fang, L.; Hipel, K. W.; and Kilgour, D. M. 1993. Interactive Decision Making: The Graph Model for Conflict Resolution. New York, Wiley.
FEARO. 1986. Initial Assessment Guide. Federal Environmental Assessment Review Office, Canada Department of Supply and Services.
Fedra, K.; Winkelbauer, L.; and Pantulu, V. 1991. Expert Systems for Environmental Screening: An Application in the Lower Mekong Basin. Laxenburg, Austria, International Institute for Applied Systems Analysis.
Fekete, G. 1990. Die Donau im Rahmen der europnischen Schiffahrt. In: Schiffahrt und Storm. 36 Jg., Heft 4, 5.6-10, Vienna.
Felix, R. 1994. Relationships Between Goals in Multiple Attribute Decision Making. Fuzzy Sets and Systems, Vol. 67, pp. 47–52.
Fiering, M. B.; Harrington, J.J.; and deLucia, R. J. 1971. Water Resources Systems Analysis, Report, Policy Research and Coordination Branch. Ottawa, Canada, Department of Energy, Mines and Resources.
Fisher, F. M. 2001. The Economics of Water and the Resolution of Water Disputes. In: U. Shamir, Negotiation over Water. Paris, UNESCO, IHP-V, Technical Documents in Hydrology, No. 53.
Fogel, L. J.; Owens, A. J.; and Walsh, M. J. 1966. Artificial Intelligence Through Simulated Evolution. Chichester, UK, Wiley.
Ford, D. T. 1990. Reservoir Storages Reallocation Analysis with PC. Journal of Water Resources Planning and Management, ASCE, Vol. 116, No. 3, pp. 402–16.
Ford, D. T. and Killen, J. R. 1995. PC-based Decision Support System for Trinity, Texas. Journal of Water Resources Planning and Management, ASCE, Vol. 121, No. 5, pp. 375–81.
Foroughi, A. and Jelassi, M. T. 1990. NSS Solutions to Major Negotiation Stumbling Blocks. Proceedings, Twenty-third Annual Hawaii International Conference on Systems Science. Vol. 4, pp. 2–11.
Franchini, M. 1996. Use of Genetic Algorithm Combined with a Local Search Method for the Automatic Calibration of Conceptual Rainfall-runoff Models. Hydrological Sciences Journal, Vol. 41, No. 1, pp. 21–40.
Fraser, N. M. and Hipel, K. W. 1984. Conflict Analysis: Models and Resolutions. New York, North Holland.
––––. 1986. Conflict Analysis for Group Decision and Negotiation Support Systems. Presentation, TIMS/ORSA Joint National Meeting. Miami Beach, Fla.
Fredericks, J. W.; Labadie, J. W.; and Altenhofen, J. M. 1998. Decision Support System for Conjunctive Stream–Aquifer Management. Journal of Water Resources Planning and Management, ASCE, Vol. 124, No. 2, pp. 69–78.
Friedman, R.; Ansell, C.; Diamond, S.; and Haimes, Y. Y. 1984. The Use of Models for Water Resources Management, Planning and Policy. Water Resources Research, Vol. 20, No. 7, pp. 793–802.
Gauvin, S.; Lilien, G. L.; and Chatterjee, K. 1990. The Impact of Information and Computer Based Training on Negotiators’ Performance. Theory and Decision, Vol. 28, pp. 331–54.
General Decision Support System resource: http://dssresources.com/ Gershon, M. and Duckstein, L. 1983. Multi-objective Approaches to River Basin Planning.
Journal of Water resources Planning and Management, ASCE, Vol. 109, No. 1, pp. 13–28. Gilbert K. G. and Shane, R. M. 1982. TVA Hydro Scheduling Model: Theoretical Aspects.
Journal of Water Resources Planning and Management, ASCE, Vol. 108, No. 1, pp. 1–20. Gleick, P. H. 1993. Water and Conflict: Fresh Water Resources and International Security.
International Security, Vol. 18, No. 1, Summer, pp. 79–112. Glover, F. 1999. Scatter Search and Path Relinking. In: D. Corne, M. Dorigo, and F. Glover,
New Methods in Optimization, New York, McGraw-Hill. GMCR II. 2000. Copyright of this decision support system for the graph model for conflict
resolution owned by L. Fang; K. W. Hipel; D. M. Kilgour; X. Peng.
120
Goicoechea, A.; Hansen, D.; and Duckstein, L. 1982. Multi-objective Decision Analysis with Engineering and Business Applications. New York, Wiley.
Goldberg, D. E. 1989. Genetic Algorithms in Search, Optimization and Machine Learning. Reading, Mass., Addison-Wesley.
Goldberg, D. E. and Kuo, C. H. 1987. Genetic Algorithms in Pipeline Optimization. Journal of Computing in Civil Engineering, ASCE, Vol. 1, No. 2, pp. 128–41.
Grygier, T. C. and Stedinger, J. R. 1985. Algorithms for Optimizing Hydropower System Operation. Water Resources Research, Vol21, No. 2, pp. 114–22.
Gulliver, P. H. 1979. Disputes and Negotiation: A Cross-cultural Perspective. Studies on Law and Control. New York, Academic Press.
Haimes, Y. Y. 1977. Hierarchical Analysis of Water Resources Systems. New York, McGraw Hill. ––––. 1994. Risk Management: A Requisite for Sustainable Development. Proceedings,
International UNESCO Symposium “Water Resources Planning in a Changing World,” pp. II/3–II/16. Karlsruhe.
Haimes, Y. Y.; Kindler, J.; and Plate, E. J. 1987. The Process of Water Resources Project Planning: A Systems Approach. Studies and Reports in Hydrology, Report 44. UNESCO
Hall, W. A. and Buras, N. 1961. The Dynamic Programming Approach to Water Resources Development. Journal of Geophysical Research, Vol. 66, No. 2, pp. 517–20.
Hall, W. A. and Dracup, J. 1970. Water Resources Systems Engineering. New York, McGraw-Hill.
Hartman, L. 1986. Methodological Guidelines for Integrated Environmental Evaluation of Water Resources Development. The Impact of Large Water Projects, pp. 467–84.Paris, UNEP–UNESCO 1990.
Harvard Law School. 1994. Proceedings, Computer-assisted Negotiation and Mediation Symposium, Programme on Negotiation. Cambridge, Mass.
Helweg, O. 1985. Water Resources Planning and Management. New York, Wiley. Hicks, R. H.; Gaguor, C. R.; Jacoby, S. L.; and Kowalikn, J. S. 1974. Large Scale Nonlinear
Optimization of Energy Capability for the Pacific Northwest Hydroelectric System. Proceedings. New York, Institute of Electrical and Electronics Engineers.
High Performance Systems. 1992. Stella II: An Introduction to Systems Thinking. Nahover, N.H., High Performance Systems, Inc.
Higler, L. W. G. 1986. Classification of Water Systems for the Environmental Evaluation of Water Resources Development. The Impacts of Large Water Projects pp. 487–506. Paris, UNEP–UNESCO, 1990.
Hillier, F. S. and Lieberman, G. J. 1980. Introduction to Operations Research. 3rd edn. Oakland, Calif., Holden-Day.
Hipel, K. W. 1992. Multiple Objective Decision Making in Water Resources. Foreword of Water Resources Bulletin, Vol. 28, No. 1.
––––. 2001. Conflict Resolution. In: M. K. Tolba, Our Fragile World: Challenges and Opportunities for Sustainable Development: Forerunner to the Encyclopedia of Life Support Systems. Vol 1. pp. 935–52. Oxford, UK, EOLSS.
Hipel, K. W.; Kilgour, D. M.; Fang, L.; and Peng, X. 1997a. Applying the Decision Support System GMCR II to Negotiations Over Water: Negotiations over Water. In: U. Shamir (ed.), Proceedings of the Haifa Workshop. pp. 50–70 IHP Technical Documents in Hydrology, No. 53.
––––. 1997b. The Decision Support System GMCR in Environmental Conflict Management. Applied Mathematics and Computation, No. 83, pp. 117–52.
Hipel, K. W.; Kilgour, D. M.; and Rajabi, S. 1999. Chapter 27: Operations Research and Refinement of Courses of Action. In: A. P. Sage and W. B. Rouse, Handbook of Systems Engineering and Management, pp. 1077–118. New York, Wiley.
Hipel, K. W.; Kilgour, D. M.; Fang, L.; and Li, K. W. 2002. Resolution of Water Conflicts between Canada and the United States. Paper submitted for the PCCP Project report. UNESCO.
Hobbs, B. F. and Meier, P. 2000. Energy Decisions and the Environment: A Guide to the Use of Multicriteria Methods. Boston, Mass., Kluwer.
Holland, J. H. 1975. Adaptation in Natural and Artificial System. Cambridge, Mass., MIT Press. Holznagel, B. 1986. Negotiation and Mediation: The Newest Approach to Hazardous Waste
Facility Siting. Environmental Affairs, Vol. 13, pp. 329–78.
121
Houcks, M. H. 1982. Real-time Daily Reservoir Operation by Mathematical Programming. Water Resources Research, Vol. 16, No. 1, pp. 196–200.
Howard, N. 1999. Confrontation Analysis: How to Win Operations Other Than War. Washington, D.C., CCRP Publications Series, Department of Defense.
Howe, C. W.; Schurmeier, D. R.; and Shaw, W. D. Jr. 1986. Innovative Approaches to Water Allocation: The Potential for Water Markets. Water Resources Research, Vol. 22, No. 4, pp. 439–45.
Ilich, N. and Simonovic, S. P. 1998. An evolution Program for Pipeline Optimization. Journal of Computing in Civil Engineering, ASCE, Vol. 12, No. 4, pp. 232–40.
International Joint Commission. 1988a. Flathead River International Study Board Report. Ottawa, Ontario; Washington, D.C.
International Joint Commission. 1988b. Impacts of a Proposed Coal Mine in the Flathead River Basin. Ottawa, Ontario; Washington, D.C.
Ito, K.; Xu, Z. X.; Jinno, K.; Kojiri, T.; and Kawamura, A. 2001. Decision Support System for Surface Water Planning in River Basins. Journal of Water Resources Planning and Management, ASCE, Vol. 127, No. 4, pp. 272–6.
IUCN. 1994. Analysis and Synthesis of National Reviews for the Danube River Basin Environmental Programme. Gland, Switzerland, IUCN Headquarters.
IWMI. 2000. World Water Supply and Demand 1995 to 2025. Colombo, Sri Lanka, International Water Management Institute.
Jamieson, D. G. and Fedra, K. 1996. The “WaterWare” Decision Support System for River Basin Planning 1: Conceptual Design. Journal of Hydrology, Vol. 177, pp. 163–75.
Jain, R. 1976. Decision Making in the Presence of Fuzzy Variables. IEEE Trans. Systems, Man, and Cybernetics, Vol. 6, pp. 698–703.
Jelassi, M. T. and Foroughi, A. 1989. Negotiation Support Systems: An Overview of Design Issues and Existing Software. Decision Support Systems, Vol. 5, pp. 167–81.
Jelassi, M. T.; Kersten, G. E.; and Zionts, S. 1990. An Introduction to Group Decision and Negotiation Support. In: C. Bana e Costa, Readings in Multiple Criteria Decision Aid, pp. 537–68. Heidelberg, Springer Verlag.
Jones, E. H. 1988. Analytical Mediation: An Empirical Examination of the Effects of Computer Support for Different Levels of Conflict in Two-party Negotiation. Ph.D. Thesis. Indiana University.
Just, R. E.; Frisvold, G.; Harrison, V.; Oppenheimer, J.; and Zilberman, D. 1998. Using Bargaining Theory and Economic Analysis as an Aid to Trans-boundary Water Cooperation, In: R. E. Just and S. Netanyahu, Conflict and Cooperation on Trans-boundary Water Resources, pp. 411–26. Boston, Dordrecht, London, Kluwer Academic.
Keeney, R. L. and Wood, E. F. 1977. An Illustrative Example of the use of Multi-attribute Utility Theory for Water Resources Planning. Water Resources Research, Vol. 13, No. 4, pp. 705–12.
Kersten, G. E. 1988. A Procedure for Negotiating Efficient and Non-efficient Compromises. Decision Support Systems, Vol. 4, pp. 167–77.
––––. 1998. Negotiation Support Systems and Negotiating Agents. Colloque SMAGET: October 5–8 1998.
Kersten, G. E. and Noronha, S. J. 1997. Introduction to Negotiation Support: Issues, Processes and Methods. http://interneg.carleton.ca/interneg/training/presentations/nss_gdss_intro/
Kilgour, D. M.; Fang, L.; and Hipel, K. W. 1995. GMCR in Negotiations. Negotiation Journal, Vol. 11, No. 2, pp. 151–6.
––––. 1996. Negotiation Support Using the Decision Support System GMCR. Group Decision and Negotiation, Vol. 5, 4–6, pp. 371–84.
Kim, K. and Park, K. 1990. Ranking Fuzzy Numbers with Index of Optimism. Fuzzy Sets and Systems, Vol. 35, pp. 143–50.
Kindler, J. 1988. On the Multi-objective Framework of Environmentally Sound and Sustainable Water Resources Management. Water Resources Development, Vol. 4, No. 2, pp. 117–23.
Kirkpatrick, D.; Gelatt, C. D. Jr.; and Vecchi, M. P. 1983. Optimization by Simulated Annealing, Science, Vol. 220, No. 4598, pp. 671–80.
Kovacs, G. 1986. Decision Support System for Managing Large International Rivers. The Impact of Large Water Projects. Paris, UNEP-UNESCO, 1990, pp. 435–48.
Ko, S.; Fontane, D.; and Labadie, J. 1992. Multi-objective Optimization of Reservoir Systems Operation. Water Resources Bulletin, Vol. 28, No. 1, pp. 111–27.
122
Kumari, R. C. 1995. Optimal Operation for Reservoir Systems Using Genetic Algorithms. MTech. Thesis. Indian Institute of Technology, Madras, India.
Kuncheva, L. 1994. Pattern Recognition with a Model of Fuzzy Neuron Using Degree of Consensus. Fuzzy Sets and Systems, Vol. 66, pp. 241–50.
Lai, Y-J; Liu, T-Y; and Hwang, C-L. 1994. TOPSIS for MODM. European Journal of Operational Research, Vol. 76, pp. 486–500.
Lancaster, C. L. 1990. Dispute Resolution Experience: The Engineer’s Role. In: W. Viesmann Jr. and E. T. Smerdon, Managing Water-related Conflicts: The Engineer’s Role, pp. 194–207. New York, American Society of Civil Engineers.
Landry, M.; Pascot, D.; and Briolat, D. 1985. Can DSS Evolve Without Changing Our View of the Concept of “Problem”? Decision Support Systems, Vol. 1, No. 1, pp. 25–36.
Lee, Y. W.; Dahab, M.; and Bogardi, I. 1994. Fuzzy Decision Making in Groundwater Nitrate Risk Management. Water Resources Bulletin, Vol. 30, No. 1, pp. 135–48.
Le-Huu, T. 2001. Potential Water Conflicts And Sustainable Management of International Water Resources Systems. Water Resources Journal of United Nations Economic and Social Commission for Asia and the Pacific (UNESCAP), No.ST/ESCAP/SER.C/210, pp. 1–13.
Leung, Y. 1982. A Concept of a Fuzzy Ideal for Multicriteria Conflict Resolution. In: M. Gupta and E. Sanchez, Fuzzy Information and Decision Processes. New York, Elsevier.
Lewis, F. 1993. Decision-aiding Software for Group Decision Making. In: S. Nagel, Computer-aided Decision Analysis: Theory and Applications. Westport, Conn., Quorum.
Ling, C. W. 1993. Characterizing Uncertainty: A Taxonomy and an Analysis of Extreme Events. M.Sc. Thesis, School of Engineering and Applied Science, University of Virginia, USA.
Loucks, D. P. 1994. Sustainability: What Does This Mean For Us and What Can We Do About It. Proceedings, International UNESCO Symposium “Water Resources Planning in a Changing World.” Karlsruhe, pp. I/3–I/12.
––––. Speech at Valencia. Decision Support Systems for Shared Vision Modeling: Challenges and Future Directions.
Loucks, D. P.; Stedinger, J. R.; and Haith, D. A. 1981. Water Resources Systems Planning and Management. New Jersey, Prentice-Hall, pp. 320–32.
Loucks, D. P.; Salewicz, K. A.; and Taylor, M. R. 1989. IRIS: An Interactive River System Simulation Model, General Introduction and Description. Ithaca, N.Y., Cornell University.
––––. 1990. IRIS: An Interactive River System Simulation Model: User’s Manual. Ithaca, N.Y., Cornell University.
Lowi, M. 1993. Water and Power: The Politics of a Scarce Resource in the Jordan River Basin. Cambridge University Press.
Lund, J. and Palmer, R. 1986. Subjective Evaluation: Linguistic Scales in Pair-wise Comparison Methods. Civil Engineering Systems, Vol. 3, pp. 182–6.
––––. 1997. Water Resources System Modeling for Conflict Resolution. Water Resources Update, Vol. 3, No. 108, pp. 70–82.
Lyneis, J.; Kimberly, R.; and Todd, S. 1994. Professional Dynamo: Simulation Software to Facilitate Management Learning and Decision Making. In: J. Morecroft and J. U. Sterman, Modeling for Learning Organizations. Waltham, Mass., Pegasus Communications.
Maass, A.; Husschmidt, M. M.; Dorfman, R.; Thomas, H. A.; Marglin, S. A.; and Sair, G. M. 1962. Design of Water Resources Systems. Cambridge, Mass., Harvard University Press.
Mandel, R. 1992. Sources of International River Basin Disputes. Conflict Quarterly, Vol. 12, No. 4, pp. 25–56.
Manitoba Hydro. 1989. Perspective 2000. Winnipeg, Canada, Manitoba Hydro. Mares, M. 1994. Computation over Fuzzy Quantities. London, CRC. Mastenbroek, W. 1989. Negotiate. Oxford, UK, Blackwell. Mays, L. W. and Tang, Y. K. 1992. Hydrosystems Engineering and Management. New York,
McGraw-Hill. McCaffrey, S. 1998. The UN Convention on the Law of the Non-navigational Uses of
International Watercourses: Prospects and Pitfalls. In: S. M. A. Salman and L. B. de Chazournes, International Watercourses: Enhancing Cooperation and Managing Conflict, pp. 17–28. Washington DC, World Bank, Technical Paper No. 414.
McKinney, D. C. and Lin, M. D. 1994. Genetic Algorithm Solution of Groundwater Management Models. Water Resources Research, Vol. 30, No. 6, pp. 1897–1906.
McDonald, A. 1988. International River Basin Negotiations: Building a Database of Illustrative Successes. Working Paper, WP-88-096. Laxenburg, Austria, IIASA.
123
Meister, D. B. and Fraser, N. M. 1992. An Architecture for a Prescriptive Negotiation Support System. Support Systems for Decision and Negotiation Processes, Preprints of the IFAC/FORS/IIASA/TIMS Workshop. Systems Research Institute, Polish Academy of Sciences, Warsaw, Poland.
Modèles et Systèmes Multi-agents pour la Gestion de l’Environement et des Territoires Cemagref ENGREF, Clermont-Ferrand, France, 1998, pp. 307–16.
Moore, C. W. 1986. The Mediation Process: Practical Strategies for Resolving Conflict. San Francisco, Calif., Jossey-Bass.
Moral-Seytoux, H. J. 1976. Optimization and Uncertainty. In: H. W. Shen, Stochastic Approaches to Water Resources, Vol.I, Fort Collins, Colo.
Munda, G.; Nijkamp, P.; and Rietveld, P. 1995. Qualitative Multicriteria Methods for Fuzzy Evaluation Problems: An Illustration of Economic–Ecological Evaluation. European Journal of Operational Research, Vol. 82. pp. 79–97.
Murphy, L. J.; Simpson, A. R.; and Dandy, G. C. 1993. Design of a Network Using Genetic Algorithms. Water, Vol. 20, pp. 40–2.
Murtagh, B. A. and Saunders, M. A. 1995. MINOS 5.4 User’s Guide. Technical Report SOL 83-20R, Stanford, Calif., Systems Optimization Laboratory, Department of Operations Research, Stanford University.
Nachtnebel, H. P. 1997. Views on International Water Conflicts: The Referee’s Position and Bilateral Agreements. In: U. Shamir, Negotiation Over Water. Proceedings of the Haifa Workshop. IHP-V Technical Documents in Hydrology, No. 53, 2001, pp. 114–41.
Nachtnebel, H. P.; Eder, G.; and Bogardi, I. 1994. Evaluation of Criteria in Hydropower Utilization in the Context of Sustainable Development. Proceedings, International UNESCO Symposium “Water Resources Planning in a Changing World.” Karlsruhe, pp. IV/13–IV/24.
Nishizaki, I. and Seo, F. 1994. Interactive Support for Fuzzy Trade-off Evaluation in Group Decision Making. Fuzzy Sets and Systems, Vol. 68, pp. 309–25.
Nunamaker J. F. Jr. 1989. Experience with and Future Challenges in GDSS (Group Decision Support Systems). Preface of: Decision Support Systems, Vol. 5, pp. 115–18.
Oliveira, R. and Loucks, D. P. 1997. Operating Rules for Multireservoir Systems. Water Resources Research, Vol. 33, No. 4, pp. 839–52.
Painter, A. 1995. Resolving Environmental Conflicts through Mediation. In: A. Dinar and E. T. Loehman, Water Quantity/Quality Management and Conflict Resolution: Institutions, Processes and Economic Analyses. Westport, Conn., Praeger.
Palmer, R. and Lund, J. 1985. Multi-objective Analysis with Subjective Information. Journal of Water Resources Planning and Management, ASCE, Vol. 111, No. 4, pp. 399–416.
Palmer, R. N.; Keys, A. M.; and Fisher, S. 1993. Empowering Stakeholders Through Simulation in Water Resources Planning. Proceedings, Twentieth Annual National Conference on Water Resources Planning and Management Division, pp. 451–4. ASCE, Seattle, N.Y.
Poole, M. S.; Holmes, M.; and Desanctis, G. 1991. Conflict Management in a Computer Supported Meeting Environment. Management Science, Vol. 37, No. 8, pp. 926–53.
Postel, S. 1999. Water Wars I: Farms versus Cities and Nature. Pillar of Sand: Can the Irrigation Miracle Last? Chapter 6, pp. 110–32, 281–5. New York and London, W.W. Norton.
Powersim Corporation. 1996. Powersim 2.5 Reference Manual. Herndon, Va., Powersim Corporation Inc.
Raiffa, H. 1982. The Art and Science of Negotiation. Harvard University, Cambridge, Mass., Belknap.
Rajabi, S.; Hipel, K. W.; and Kilgour, D. M. 1999. Water Supply Planning under Inter-dependence of Actions: Theory and Application. Water Resources Research, Vol. 35, No. 7, pp. 2225–35.
––––. 2001. Multiple Criteria Screening of a Large Water Policy Subset Selection Problem. Journal of the American Water Resources Association, ASCE, Vol. 37, No. 3, pp. 533–46.
Rajabi, S.; Kilgour, D. M.; and Hipel, K. W. 1998. Modeling Action: Interdependence in Multiple Criteria Decision Making. European Journal of Operational Research, Vol. 110, No. 3, pp. 490–508.
Reitsma, R. F. 1996. Structure and Support of Water Resources Management and Decision Making. Journal of Hydrology, No. 177, pp. 253–68.
Reznicek, K. K. and Simonovic, S. P. 1990. An Improved Algorithm for Hydropower Optimization. Water Resources Research, Vol. 26, No. 20, pp. 189–98.
124
Ribeiro, R.; Powell, P.; and Baldwin, J. 1995. Uncertainty in Decision Making: An Abductive Perspective. Decision Support Systems, Vol. 13, pp. 183–93.
Rogers, P. 1993. The Value of Cooperation in Resolving International River Basin Disputes. National Resources Forum, May, pp. 117–31.
Rogers, P. P. and Fiering, M. B. 1986. Use of Systems Analysis in Water Management. Water Resources Research, Vol. 22, No. 9, pp. 146–58.
Rosenthal, R. E. 1980. The Status of Optimization Models for the Operation of Multi-reservoir Systems With Stochastic Inflows and Nonseparable Benefits. Chattanooga, Tenn., Research Report 75, Tennessee Water Resources Research Center.
Rothman, J. 1997. Resolving Identity-based Conflict in Nations, Organizations, and Communities. San Francisco, Calif., Jossey-Bass.
Rumbaugh, J.; Blaha, M.; Premerlani, W.; Eddy, F.; and Lorensen, W. 1991. Object-oriented Modeling and Design. New Jersey, USA, Prentice Hall.
Saaty, T. 1980. The Analytic Hierarchy Process. New York, McGraw-Hill. Sage, A. P. and Rouse, W. B. 1999. Handbook of Systems Engineering and Management. New
York, Wiley. Sakawa, M. 1993. Fuzzy Sets and Interactive Multi-objective Optimization. New York, Plenum. Samson, P. and Charrier, B. 1997. International Freshwater Conflict: Issues and Prevention
Strategies. Green Cross International, August. http://www.greencrossinternational.net/GreenCrossPrograms/waterres/gcwater/study.html. Savic, D. A. and Walters, G. A. 1997. Genetic Algorithms for Least Cost Design of Water
Distribution Networks. Journal of Water Resources Planning and Management, ASCE, Vol. 123, No. 2, pp. 67–77.
Schwarz, R. M. 1994. The Skilled Facilitator: Practical Wisdom for Developing Effective Groups. San Francisco, Calif., Jossey-Bass.
Seo, F. and Sakawa, M. 1985. Fuzzy Multi-attribute Utility Analysis for Collective Choice. IEEE Transactions on Systems, Man, and Cybernetics, Vol. 15, No. 1. pp. 45–53.
Shane, R. M. and Gilbert, K. G. 1982. TVA Hydro Scheduling Model: Practical Concepts. Journal of Water Resources Planning and Management, ASCE, Vol. 108, No. 1, pp. 21–36.
Sigvaldason, O. T. 1976. A Simulation Model for Operating a Multireservoir System. Water Resources Research, Vol. 12, No. 2, pp. 263–78.
Simonovic, S. P. 1989. Application of Water Resources Systems Concepts to the Formulation of a Water Master Plan. Water International, Vol. 14, No. 1, pp. 37–51.
––––. 1991. Knowledge-based Systems and Operational Hydrology. Canadian Journal of Civil Engineering, Vol. 18, No. 1, pp. 1–11.
––––. 1992. Reservoir Systems Analysis: Closing the Gap between Theory and Practice. Journal of Water Resources Planning and Management, ASCE, Vol. 118, No. 3, pp. 262–80.
––––. 1996a. Decision Support Systems for Sustainable Management of Water Resources: 1. General Principles. Water International, Vol. 21, No. 4, pp. 223–32.
––––. 1996b. Decision Support Systems for Sustainable Management of Water Resources: 2. Case Studies. Water International, Vol. 21, No. 4, pp. 233–44.
––––. 2000. Tools for Water Management: One View of the Future. Water International, Vol. 25, No. 1, pp. 76–88.
––––. 2002. Two New Non-structural Measures for Sustainable Management of Floods. Water International, Vol. 27, No. 1, pp. 38–47.
Simonovic, S. P. and Marino, M. A. 1980. Reliability Programming in Reservoir Management, 1. Single Multipurpose Reservoir. Water Resource Research, Vol. 16, No. 1, pp. 844–8.
Simonovic, S. P. and Burn, D. H. 1989. An Improved Methodology for Short-term Operation of a Single Multipurpose Reservoir. Water Resources Research, Vol. 25, No. 1, pp. 1–8.
Simonovic, P. P. and Savic, D. 1989. Intelligent Decision Support for Reservoir Management and Operations. Journal of Computing in Civil Engineering, ASCE, Vol. 3, No. 4, pp. 367–84.
Simonovic, S. P. and Bender, M. J. 1996. Collaborative Planning-support System: An Approach for Determining Evaluation Criteria. Journal of Hydrology, Vol. 177, pp. 237–51.
Simonovic, S. P. and Fahmy, H. 1999. A New Modeling Approach for Water Resources Policy Analysis. Water Resources Research, Vol. 35, No. 1, pp. 295–304.
Simonovic, S. P.; Fahmy, H.; and El-Shorbagy, A. 1997. The Use of Object-oriented Modeling for Water Resources Planning in Egypt. Water Resources Management, Vol. 11, pp. 243–61.
125
Simpson, A. R.; Dandy, G. C.; and Murphy, L. J. 1994. Genetic Algorithms Compared with Other Techniques for Pipe Optimization. Journal of Water Resources Planning and Management, ASCE, Vol. 120, No. 4, pp. 423–43.
Siskos, J. 1982. A Way to Deal with Fuzzy Preferences in Multicriteria Decision Problems. European Journal of Operations Research, Vol. 10, pp. 314–24.
Slowinski, R. 1986. A Multi-criteria Fuzzy Linear Programming Methods for Water Supply System Development Planning. Fuzzy Sets and Systems, Vol. 19, pp. 217–37.
Sokolov, V. and Dukhovny, V. 2002. Lessons On Cooperation Building To Manage Water Conflicts in The Aral Sea Basin. Paper submitted for the PCCP Project report: Case Studies, UNESCO.
Spector, B. 2001. Transboundary Disputes: Keeping Backyards Clean. In: W. Zartman, Preventive Negotiation: Avoiding Conflict Escalation. Lanham, Md., Rowman and Littlefield.
Sreenath, N. 2001. Global Modeling and Reasoning Support Tools, Oxford, UK, EOLSS. ––––. 2002. A Brief Description on GLOBESIGHT. Paper submitted for the PCCP Project report
on Systems Analysis Techniques, UNESCO. Tecle, A. and Duckstein, L. 1994. Concepts of Multicriterion Decision Making. In: J. J. Bogardi
and H. P. Nachtnebel, Multicriteria Decision Analysis in Water Resources Management. Report WS14, International Hydrological Programme, pp. 33–62. Paris, France, UNESCO.
Teich, J. E.; Wallenius, H.; Kuula, M.; and Zionts, S. 1995. A Decision Support Approach for Negotiation with an Application to Agricultural Income Policy Negotiations. European Journal of Operations Research, Vol. 81, pp. 76–87.
Thiessen E. and Loucks, D. P. 1992. Computer Assisted Negotiation of Multi-objective Water Resource Conflicts. Water Resources Bulletin, Vol. 28, No. 1, pp. 163–77.
Thiessen, E. M.; Loucks, D. P.; and Stedinger, J. R. 1998. Computer-assisted Negotiations of Water Resources Conflicts. Group Decision and Negotiation, Vol. 7, No. 2, pp. 109–29.
Trolldalen, J. M. 1992. International River Systems. International Environmental Conflict Resolution: The Role of the United Nations. Chapter 5, pp. 61–91. Oslo, Washington DC, World Foundation for Environment and Development.
Tversky, A. and Kahneman, D. 1990. Judgment Under Uncertainty: Heuristics and Biases. In: G. Shafer and J. Pearl, Readings in Uncertain Reasoning. San Matio, Calif., Morgan Kaufmann.
UN Convention on the Law of the Non-navigational Uses of International Watercourses, April 11 1997.
UNESCO. 2000. Water Related Vision of the Aral Sea Basin: for the Year 2025. With the cooperation of the Scientific Advisory Board for the Aral Sea Basin (SABAS).
UNESCO GENIE Coordinating Center. 2000. Globesight Tutorial Manual: Systems Program. Cleveland, Ohio, Case Western Reserve University.
Vali, A. M.; Susiarjo, G.; and Sreenath, S. N. 2002. Future Development of the Aral Sea Basin Countries. Paper submitted for the PCCP Project report. UNESCO.
Ventana Systems. 1995. Vensim User’s Guide. Belmont, Mass., Ventana Systems Inc. Wang, M. and Zheng, C. 1998. Groundwater Management Optimization Using Genetic
Algorithms and Simulated Annealing: Formulation and Comparison. Journal of American Water Resources Association, Vol. 23, No. 3, pp. 519–30.
Wang, Q. J. 1991. The Genetic Algorithm and its Application to Calibrating Conceptual Rainfall-runoff Models. Water Resources Research, Vol. 27, No. 9, pp. 2467–71.
Wardlaw, R. and Sharif, M. 1999. Evaluation of Genetic Algorithms for Optimal Reservoir System Operation. Journal of Water Resources Planning and Management, ASCE, Vol. 125, No. 1, pp. 25–33.
WRMI. Conflict Resolution. Water Resources Management Inc. http://www.wrmi.com/wrmi/webpage/tech.htm Watershed Information Network. Managing Conflict: A Guide for Watershed Partnerships. http://www.ctic.purdue.edu/KYW/Brochures/ManageConflict.html WCED. 1987. World Commission on Environment and Development. Our Common Future.
Oxford University Press. Wescot, J. L. Jr. 1996. Main Currents in Early Multilateral Water Treaties: A Historical–
Geographic Perspective, 1648–1948. Colorado Journal of International Environmental Law and Policy, Vol. 7, No. 1, pp. 39–74.
White, G. F. 1986. The Role of Scientific Information in Anticipation and Prevention of Environmental Disputes. In: R. W. Kates and I. Burton, Geography, Resources, and
126
Environment: Vol. I, Selected Writings of Gilbert F. White. pp. 377–92. Chicago, London, University of Chicago Press.
WMO. 1995. INFOHYDRO Manual: Hydrological Information Referral Service. Operational Hydrology Report No. 28, WMO-No. 683, Geneva, Switzerland.
Wolf, A. T. 1998. Conflict and Cooperation Along International Waterways. Water Policy, Vol. 1, No. 2, pp. 251–65
––––. 2000. Indigenous Approaches to Water Conflict Negotiations and Implications for International Waters. International Negotiation, Vol. 5, No. 2, pp. 357–73.
––––. 2002. Conflict Prevention and Resolution in Water Systems. Cheltenham, UK, Edward Elgar.
World Cotton Outlook. www.cotlook.com. Wurbs, R. A. 1993. Reservoir System Simulation and Optimization Models. Journal of Water
Resources and Management. ASCE, Vol. 119, No. 4, pp. 455–72. ––––. 1998. Dissemination of Generalized Water Resources Models in the United States. Water
International, Vol. 23, No. 3, pp.190–8. Yager, R. 1981. A Procedure for Ordering Fuzzy Subsets of the Unit Interval. Information
Science, Vol. 24, pp. 143–61. Yeh, W. W-G. 1981. Real-time Reservoir Operation: The California Central Valley Project Case
Study. In: G. H. Toebes and A. A. Sheppard, Proceedings, National Workshop on Reservoir System Operations. New York, ASCE.
––––. 1985. Reservoir Management and Operation Models: A State-of-the-art Review. Water Resources Research, Vol. 21, No. 12, pp. 1797–1818.
Yoffe, S. and Ward, B. 1999. Water Resources and Indicators of Conflict: A Proposed Spatial Analysis. Water International, Vol. 24, No. 4, pp. 377–84.
Young, Y. K. 1967. Finding Reservoir Operation Rules. Journal of Hydraulics Division, ASCE, Vol. 93, No. 6, pp. 297–321.
Zadeh, L. 1965. Fuzzy Sets. Information and Control, Vol. 8, pp. 338–53. Zeleny, M. 1973. Compromise Programming. In: J. Cochrane and M. Zeleny, Multiple Criteria
Decision Making. Columbia, S.C., University of South Carolina Press. ––––. 1982. Multiple Criteria Decision Making. New York, McGraw-Hill. Zimmerman, H. 1987. Fuzzy Sets, Decision Making, and Expert Systems. Dordrecht, Kluwer
Academic.
Index entries: conflict resolution; water resources; systems analysis; optimization; simulation; negotiations; game theory; fuzzy systems; consensus; sustainability; water distribution; water allocation; water quality; multi-objective analysis
127