Embed Size (px)
Citation preview
This is the pre-peer reviewed version of the following article: State-of-the-art of visualization in post-
mortem imaging, APMIS Volume 120, Issue 4, pages 316–326, April 2012, which has been published
in final form at http://onlinelibrary.wiley.com/doi/10.1111/j.1600-0463.2011.02857.x/full
State-of-the-art of Visualization
in Post-Mortem Imaging
CLAES LUNDSTRÖM1,2
, ANDERS PERSSON1, STEFFEN ROSS
1,3, PATRIC LJUNG
4,
STEFAN LINDHOLM4,5
, FRIDA GYLLENSVÄRD5, ANDERS YNNERMAN
5
1Center for Medical Image Science and Visualization, Linköping University, Sweden
2Sectra Imtec AB, Sweden
3Centre for Forensic Imaging and Virtopsy, Institute of Forensic Medicine, University of Bern,
Switzerland 4Siemens Corporate Research, Princeton, USA
5Scientific Visualization Group, Department of Science and Technology, Linköping University,
Sweden
Lundström C., Persson A., Ross S., Ljung P., Lindholm S., Gyllensvärd F, Ynnerman A. State-of-the-
art of Visualization in Post-Mortem Imaging. APMIS 2011.
Summary: Autopsies constitute a valuable feed-back to the healthcare chain in order to achieve
improvements in quality of care and cost effectiveness. This review describes post-mortem imaging,
which has emerged as an important part of the pathology toolbox. A broad range of visualization
aspects within post-mortem imaging are covered. General state-of-the-art overviews of the
components in the visualization pipeline are complemented by in-depth descriptions of methods
developed by the authors and our collaborators. The forensic field is represented and related to, as it is
spearheading much development in post-mortem imaging. Other topics are workflow, imaging data
acquisition, and visualization rendering technology. All in all, this review shows the mature state of
visual analysis for a non- or minimal-invasive investigation of the deceased patient.
Keywords: Post-mortem imaging, visualization, computed tomography, magnetic resonance imaging,
volume rendering.
Claes Lundström, Center for Medical Image Science and Visualization, Linköping University
Hospital, 581 85 Linköping. e-mail: [email protected]
INTRODUCTION
Autopsies have traditionally been a
cornerstone for improving the quality of health
care. Medical conclusions such as determining
cause of death, constitute an important feed-
back about the clinical workflow. The
increasing demands of quality of care and cost
effectiveness can be solved only by continuous
improvement process of the entire healthcare
chain. In medical imaging this stretches from
the acquisition of data until the point at which
the clinician receives the diagnostic
information, where new methods can be
validated. The deceased patient is often an
important part of this validation process. It can
in some cases be impossible to verify the
acquired diagnostic information while the
patient is alive. Autopsies can then fulfill the
This is the pre-peer reviewed version of the following article: State-of-the-art of visualization in post-
mortem imaging, APMIS Volume 120, Issue 4, pages 316–326, April 2012, which has been published
in final form at http://onlinelibrary.wiley.com/doi/10.1111/j.1600-0463.2011.02857.x/full
role of a real gold standard. This review
pertains to post-mortem imaging, which has
emerged as an increasingly valuable
complement to the pathology toolbox.
Outline of review
This review aims to describe a broad range of
visualization aspects within post-mortem
imaging. There will be general overviews of
different parts of the visualization pipeline,
paired with more detailed descriptions of state-
of-the-art methods developed by the authors
and our collaborators. First, an overview is
given of the prerequisites for pathological and
forensic autopsies, respectively. Then
workflow aspects of virtual autopsies will be
described, outlining the steps involved. Next
topic being covered is the acquisition of
imaging data. An overview of pertinent
rendering techniques is then presented,
followed by a section dedicated to
visualization methods developed specifically
toward post-mortem imaging needs.
Concluding remarks are presented in the last
section.
PREREQUISITES FOR CLINICAL
AND FORENSIC RADIOLOGICAL
AUTOPSIES
Traditional invasive autopsy is a central
procedure in pathological and forensic
investigation. State-of-the-art autopsy
procedures, however, also include modern
cross section imaging techniques that can assist
and supplement conventional autopsy
providing improvements for the general
workflow of post-mortem examinations.
The demands on radiological autopsy are
identical with those of traditional autopsy,
namely to address and explain the so-called
Atrium mortis (i.e., a pathophysiological
reconstruction and explanation of the cause of
death) with a depiction of relevant patho-
morphologic findings in bones, soft tissues and
organs. In medicolegal cases, a few more
points have to be addressed. 1: Vital reactions.
In forensic pathological investigations, the
question whether an injury was received before
or after death is often an important matter
because they give an explanation about the
sequence of injuries finally causing the death.
The answer to this question lies with findings
that only occur with intact circulation (e.g.,
fatal hemorrhage, air and fat embolism,
cutaneous emphysema) and respiration (e.g.,
aspiration). 2: The reconstruction of injuries
with regard to force, biomechanics, and
dynamics. 3: Identification of a person. It is
very important to identify a deceased rapidly
and accurately, both for juridical reasons and
for the relatives to be able to mourn. Post-
mortem imaging enables this by the possibility
to match singular individual findings like the
denture, nasal sinuses or metallic implants with
ante mortem radiological imaging.
Recent developments in post-mortem imaging
have led to an implementation of post-mortem
Computed Tomography (pmCT) and post-
mortem Magnetic Resonance Imaging
(pmMRI) for the benefit of forensic
investigations. Several studies published over
the past 10 years have demonstrated that a
combination of autopsy techniques and cross-
sectional imaging can augment the value of
postmortem examinations for the jurisdiction
(1-9). Contrary to the forensic field, the
autopsy numbers of clinical pathological
examinations suffer from a continuous decline.
Depending on the country, up to more than
90% of the deceased do not undergo a
comprehensive postmortem examination. The
resulting negative consequences for medical
education, quality assurance in medicine,
public health and mortality statistics are
substantial as discussed by numerous authors
(10-17). Ongoing research investigates if and
when pmCT and pmMRI can be used as the
primary tool to determine the cause of death in
non-forensic cases (18).
Post-mortem imaging has, largely due to
methods development in the forensic domain,
matured into a valuable examination method to
This is the pre-peer reviewed version of the following article: State-of-the-art of visualization in post-
mortem imaging, APMIS Volume 120, Issue 4, pages 316–326, April 2012, which has been published
in final form at http://onlinelibrary.wiley.com/doi/10.1111/j.1600-0463.2011.02857.x/full
acquire patho-anatomic details with a high
spatial resolution. An increasing number of
forensic institutes have started to install CT
and MRI systems to use the imaging
techniques for the purpose of quality
improvements in the forensic field. The
experiences obtained in forensics may provide
the scientific background necessary for an
increased clinical use of post-mortem imaging
to the end of improving the quality of care.
This review intends to raise awareness among
clinicians about the potential and recent
progress of visual analysis for a non- or
minimal-invasive investigation of the deceased
patient. One usage scenario is as a complement
to a traditional autopsy, to enhance the quality
of autopsy results. Another scenario is
whenever clinical autopsies are unwillingly
avoided due to cost or organization limitations,
or not agreed to by next of kin. In these
situations, post-mortem imaging could become
a substitute for clinical pathological
examinations that retains a significant part of
the medical value. On a larger scale the benefit
of post-mortem imaging could be the
reestablishment of a reliable base of data of
cause of death in our society.
Example of radiological autopsy procedure
In this section we will present key
characteristics of a routine, large-scale forensic
autopsy procedure running in Linköping,
Sweden (19). There are many components that
are relevant also for clinical autopsies, and
those will be further discussed in the following
section. The presented autopsy procedure has
been developed through collaboration between
the Center for Medical Image Science and
Visualization (CMIV) and the Swedish
National Board of Forensic Medicine has been
applied to over 380 cases so far.
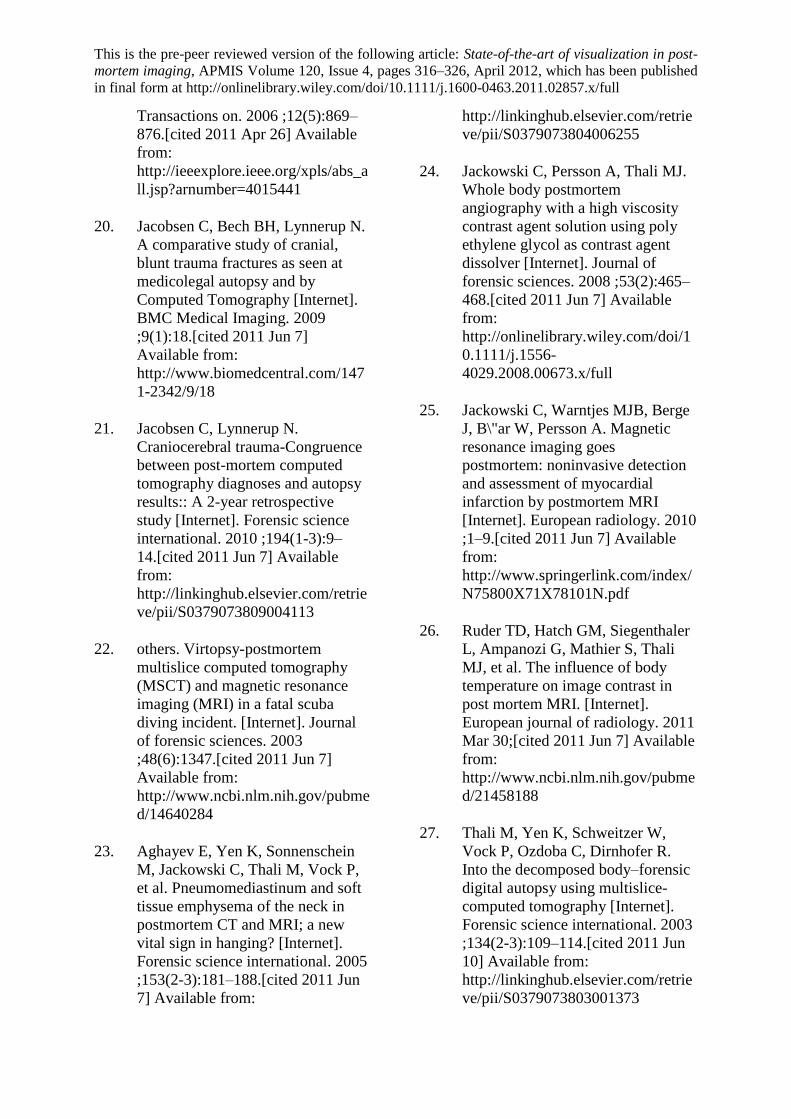
The workflow of the forensic procedure is
illustrated in Fig. 1. The post-mortem imaging
activities, extending the traditional invasive
autopsy, are shown in red. At the crime scene
the human cadaver is placed in a sealed body
bag before being transported to the forensic
department, and put in cold storage. The
following morning, a full body CT scan is
performed. A radiologist makes a first
assessment of the imaging data through a
number of visualizations. In preparation for the
physical autopsy a collaborative session
between the pathologist and the radiologist is
conducted. The meeting is either in person or
over the phone. The radiologist presents an
overview of the entire body and the forensic
pathologist can then selectively focus on
different types of findings, such as the skeleton
to localize fractures, the distribution of gas in
the body or foreign objects such as metal
fragments or bullets. This can provide essential
information in the early part of the police
investigation. If feasible, the radiologist
responsible should attend the autopsy. First, to
further contribute knowledge gained by
imaging and second, to obtain a better
correlation between the radiological findings
and the reality seen at autopsy. Only a direct
correlation between radiological imaging and
autopsy allows for a proper learning curve for
both the radiologist and the pathologist. An
important aspect is the high resolution of the
data, which allows for extraction of details
such as dental information for identification
purposes.
An important added value of introducing pot-
mortem imaging is that the captured CT data is
stored which gives the possibility to iterate the
procedure. Often findings during the physical
autopsy lead to new questions that an image
review can answer. Also, in crime scene
investigations new findings may require that
other hypotheses need to be scrutinized
through the use of the imaging data.
The introduced workflow overhead is minimal
as the time needed for the scan and assessment
sessions is short in comparison to the clinical
autopsy. Furthermore, the total investigation
time may, in fact, be reduced since the
pathologist has prior knowledge of the case
before conducting the clinical autopsy.
This is the pre-peer reviewed version of the following article: State-of-the-art of visualization in post-
mortem imaging, APMIS Volume 120, Issue 4, pages 316–326, April 2012, which has been published
in final form at http://onlinelibrary.wiley.com/doi/10.1111/j.1600-0463.2011.02857.x/full
Lessons learned from virtual forensic autopsies
There are significant differences in the
prerequisites and demands of clinical autopsies
compared to forensic autopsies. Nevertheless,
when investigating challenges for post-mortem
imaging in a clinical setting, experience gained
from forensic procedures can be useful. A first
challenge may be infrastructure. In the forensic
case there are often two sites, a forensic
institute and a radiological institute that have
to be connected by sufficient corpse logistics.
Furthermore, a sufficient data exchange has to
be set up to allow both parties using the
imaging data, which can be both a technical
and an organizational challenge. An alternative
solution would be to fully integrate imaging
equipment and radiology expertise into the
pathological institute.
A second challenge is to accomplish an
effective collaboration between radiologist and
pathologist. A large part of the added value
stems from the combined radiology/pathology
expertise when interpreting the image data.
Whereas the radiologist is used to assess the
images in order to establish the diagnoses that
can guide a future therapeutic strategy it is the
pathologist who searches the past within the
images. These different views have to be
combined to fulfill the potential of post-
mortem imaging. The need for unhindered
collaboration entails a strong need for tailored
visualization tools.
Apart from use during the investigation,
visualizations for presentation purposes are
very important in the forensic case. This is
particularly important when many medical
laymen are involved and need to understand
the findings. The result of a clinical autopsy
does not typically require the same type of
elaborate guiding through the imaging finding.
There is, however, reason to believe that easily
graspable visualizations such as 3D renderings
can enrich the feedback to clinicians from the
autopsy.
A final challenge is the data set sizes. The
imaging corresponds to whole body data sets
with slice stacks up to 30000 images. Post-
mortem imaging, not being limited by any
radiation dose restrictions or scanning time
limits, can make use of the maximal possible
spatial resolution which boosts the data volume
to be handled. The technical challenge to
create volumetric renderings of such data sets
is substantial.
IMAGE ACQUISITION
The first part of the visualization pipeline in
post-mortem imaging is the image acquisition.
In this section the most relevant types of
acquisition methods will be described.
Post-Mortem Computed Tomography
To be able to acquire sufficient Post-Mortem
Computed Tomography (pmCT) image quality
it is an advantage to have a scanner that can
conduct a full body scan with sub millimeter
slices in extended field of view. Furthermore, a
data set reconstructed in an extended CT scale
is useful when foreign objects such as
projectiles or fragments of knife blades are
present. Intra venous or arterial admission of
contrast can visualize the vessel lumina and
can in certain cases help to determine the cause
of death. Postmortem gas in the vascular
system can in certain cases also be used as a
“negative” contrast agent. The scan time is not
crucial since it is a negligible part of the total
workflow even with a slow scanner.
Dual energy CT (DECT) distinctively
improves soft tissue discrimination and
visualization (3), which can be of great benefit
in post-mortem imaging. DECT with two X-
ray sources running simultaneously at different
energies can acquire two datasets showing
different attenuation levels. Since X-ray
absorption is energy-dependent, scanning an
object with 80 kV results in a slightly different
attenuation than scanning it with 140 kV. This
physics phenomenon can help to discriminate
between materials that have the same
This is the pre-peer reviewed version of the following article: State-of-the-art of visualization in post-
mortem imaging, APMIS Volume 120, Issue 4, pages 316–326, April 2012, which has been published
in final form at http://onlinelibrary.wiley.com/doi/10.1111/j.1600-0463.2011.02857.x/full
attenuation at a certain energy level. In the
visualization, colors can then be mapped to the
difference between the two measurements,
effectively discriminating materials that cannot
be differentiated in a traditional CT scan. This
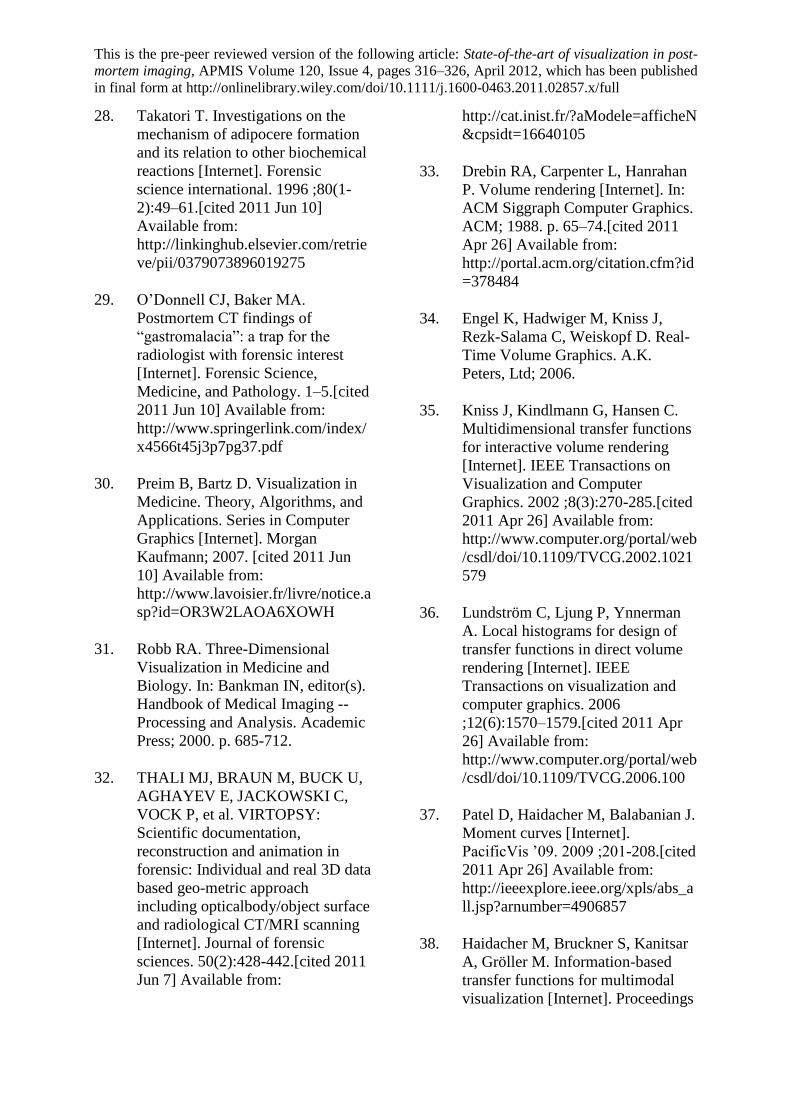
technique can be used to visualize post-mortem
blood clots in vessels, and possibly bleeding in
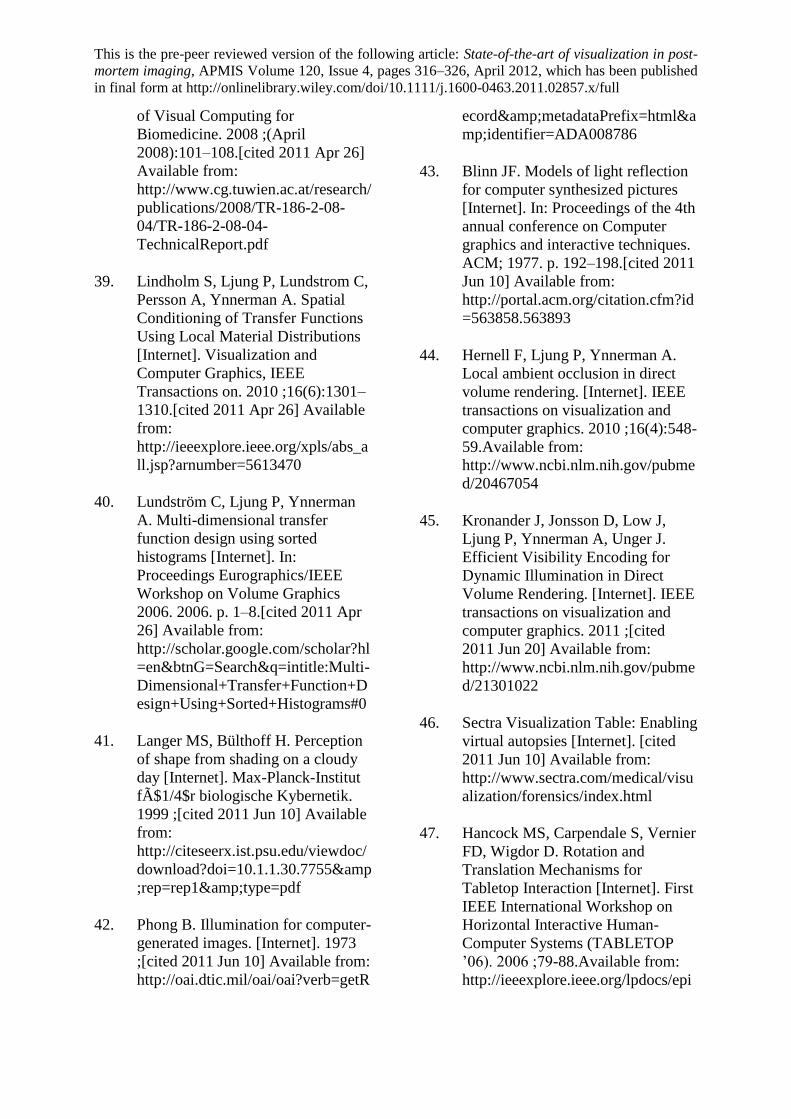
soft tissue (Fig. 2). Soft tissue discrimination is
much improved, for instance between blood,
soft tissue, tendons, and cartilage (Fig. 3). The
absence of any motion related artifacts in
combination with unlimited radiation exposure
possibilities allows the acquisition of highly
detailed data, sufficient for high-quality 3D
renderings.
PmCT has been proven to be especially
valuable in cases of skeletal alterations (20;
21), foreign materials, gaseous findings (Fig.
4) (6; 22; 23) and angiography (24), making it
a fast triaging tool for conventional autopsy in
traumatic cases. Post mortem CT-angiography
provides substantial added value when it
comes to the depiction of vascular pathologies
both in natural and traumatic causes of death.
Post-Mortem Magnetic Resonance Imaging
In selected cases, a post-mortem MRI
(pmMRI) examination can be of great value.
Whole body scans can be acquired for example
with T1 and T2 sequences. Used for
subsequent soft tissue visualizations the
clinical information is a substantial
complement to CT data. Compared to pmCT,
pmMRI offers superior visualization of brain,
thorax, gastro regions and other soft tissues.
For instance the exact localization of
hematomas in the subcutaneous fat is highly
appreciated when comes to the forensic
reconstruction of the sequence of traumatic
events.
A recently developed approach known as
Isotropic Quantified Post-Mortem Magnetic
Resonance (IQpmMR) (25) shows great
potential. One typical problem with pmMRI is
the temperature dependence when scanning
cold bodies (26). IQpmMR works equally well
for low temperatures due to its quantitative
approach. Furthermore, IQpmMR provides
high detail, which enables high-quality
reformatting and volume rendering. Each point
in the data set has three quantified values (T1
relaxation time, T2 relaxation time and proton
density) and this rich information can be used
for distinctive soft tissue discrimination.
Decomposition considerations
Decomposition of cadavers is less pertinent in
clinical autopsies than in forensic ones. As it
may, however, occur also when investigating
natural deaths, a brief discussion is provided.
With the post-mortem passage of time in a
non-chilled environment, the investigation of a
corpse becomes more and more complicated.
Putrefaction processes beginning 2–3 days
after death can destroy findings obtained at
autopsy as well as at post-mortem imaging.
Putrefaction can be recognized in post-mortem
imaging as massive gas accumulation within
the vascular system, body cavities, and soft
tissues (27-29). At detailed scale putrefaction
gases need to be considered when reviewing
the imaging data, since they are omnipresent as
gas micro bubbles assembled around fatty cells
and muscle fibers. This gas requires special
assessment of the pmCT findings and for
pmMRI the signal intensity can be decreased
due to changes in the chemical properties of
the soft tissue.
In advanced putrefaction, the texture of an
organ can be completely dissolved, leading to a
liquefaction of entire organs. If preexisting
anatomical boundaries such as collagenous are
intact, liquefied organs may be assessed to a
certain extent. A traditional autopsy will
destroy these boundaries whereas pmCT and
pmMRI will leave the organ boundaries intact.
Furthermore, the analysis of the distribution
pattern of gas in a corpse makes it possible to
do discrimination between the above
mentioned signs of decomposition and
potentially lethal pathologies like traumatic
This is the pre-peer reviewed version of the following article: State-of-the-art of visualization in post-
mortem imaging, APMIS Volume 120, Issue 4, pages 316–326, April 2012, which has been published
in final form at http://onlinelibrary.wiley.com/doi/10.1111/j.1600-0463.2011.02857.x/full
soft tissue emphysema or gas embolism into
the vascular system (6).
VISUALIZATION OF VOLUMETRIC
DATA
Once the imaging data has been acquired the
next step in the visualization pipeline is to
transform the measured data into a visual
appearance. In this section an introduction is
given to the basic types of visualization
relevant for pmCT and pmMRI data. Since
both acquisition methods are volumetric, the
description will be restricted to volumetric
data. For a thorough overview of medical
visualization methods, please refer to (30).
Slice visualization
The most straight-forward visualization
method is to explore the volumetric data by
browsing 2D slices in one of the major
orientations (axial, sagittal, coronal). The slices
are viewed using a grayscale mapping from
scanned value to screen pixel value. More
interaction is provided by Multiplanar
Reconstruction (MPR), where a slice through
the volume of arbitrary orientation is
displayed. The slicing plane can also be
curved. MPR is the dominating and most
important visualization method for post-
mortem imaging today. The risk of missing
important findings using only the major
orientations is substantial. MPR views of the
three main planes are often used as reference
views as a complement to other volume
visualizations.
Volumetric visualization
There are several techniques that visualize the
full volume rather than a slice of it. A
commonly used method is Maximum Intensity
Projection (MIP). In MIP renderings are
constructed from the entire volume or a slab.
The volume is projected onto the image plane
and the maximum intensity of all data points
projected onto it is retrieved. This maximum
value is then, as for the slice visualization,
transformed to a screen pixel value through a
grayscale mapping. The viewpoint can be
changed freely. MIP is particularly useful for
narrow, high-contrast objects which in post-
mortem imaging could be metal fragments and
calcifications.
Surface rendering (also known as Shaded
Surface Display, SSD) is a method where a
surface is extracted from the data and rendered
using a mosaic of connected polygons. Surface
rendering is fast, but it is not suitable as a
general data exploration tool in clinical use
(31). A special niche-application for SSD in
forensic radiology is the generation of polygon
mesh models of skeleton and body surface,
enabling the integration of radiological data
into a so-called virtual incident/crime scene
reconstruction including the matching of a
potentially injury causing instrument with
skeletal findings of the victim (32).
Direct Volume Rendering (DVR) (33; 34) is a
visualization technique that aims to convey an
entire 3D data set in a 2D image. The key to
making this work is to assign semi-transparent
colors to the data samples. In this way, objects
at all depths in the volume can be seen at once,
without obscuring each other. The term
“Direct” in DVR stems from the fact that the
rendered image is constructed directly from the
data, as opposed to techniques that create an
intermediate representation, for instance an
extracted surface model. DVR is a common
scientific tool, where visualization of medical
data sets is one of the main areas. A central
component of the exploration is that DVR
allows the user to navigate between highly
differing alternative depictions of every single
data set.
In an interactive exploration setting, the
success of any visualization application is
dependent on performance. The rendering must
promptly respond to the user’s actions,
otherwise the understanding of the
visualization will be hampered. Rotation of the
volume is a typical operation that needs a
perceived real-time performance of 20-30
This is the pre-peer reviewed version of the following article: State-of-the-art of visualization in post-
mortem imaging, APMIS Volume 120, Issue 4, pages 316–326, April 2012, which has been published
in final form at http://onlinelibrary.wiley.com/doi/10.1111/j.1600-0463.2011.02857.x/full
frames per second (fps). Below 5 fps the
response times are usually experienced as very
disturbing. Since DVR is a technique
essentially utilizing all data in the post-mortem
imaging volumes, the performance challenge is
highly pertinent even with the rapid progress
of computer hardware (19).
Sample classification
A central component of most visualization
methods is the visual mapping of a data value.
This mapping is known as a Transfer Function
(TF). In essence, this corresponds to a
classification, where different tissues should
preferably be given different visual
appearance. In DVR, the TF controls not only
the color but also the transparency of a sample,
which highly affects the resulting image
presented.
The most common situation is that a single
data value is input to the TF. Multi-
dimensional TFs are however needed when
there is more than one value in each data point,
such as for DECT or IQpmMR. The additional
values can also be attributes derived from the
original data, such as statistical properties of a
local neighborhood (35-38).
VISUALIZATION TECHNIQUES
TAILORED FOR POST-MORTEM
IMAGING
In this section a number of visualization
advances with particular bearing on post-
mortem imaging will be presented.
Feature enhancement
A limitation of traditional TFs is that no
information about spatial relations between
data points can be encoded. This type of
knowledge includes, however, very useful
information that could be exploited for
effective and informative visualizations. One
approach to exploit such knowledge is spatial
conditioning of the TF (39). In this method, the
user names a number of tissues and materials
and identifies their typical data range. The user
then uses the labels to express semantic
conditions on the rendering, for instance “Only
render air when close to blood”. The result of
the method is a reduction of clinically
redundant data which leads to increased image
clarity and relevance (Fig. 5)
In some cases, detection of foreign objects
such as metal fragments can be essential in
post-mortem imaging. For instance gunshot
cases, the foreign body may be a projectile,
which may not only lead to the identification
of the ammunition used, but often even the
individual weapon. Furthermore, fragments of
intermediate targets such as a window pane
may be found in the corpse, thus permitting a
reconstruction of the shooting and perhaps
even the crime scene. A problem is that minor
metal fragments can be overlooked since their
location may be unexpected. A method to
highlight minor features is to identify not only
those samples themselves, but also samples in
their vicinity (40). As illustrated in Fig. 6, the
visual localization and therefore also the
retrieval during classical autopsy becomes
easier.
A general challenge for volumetric
visualization is that important findings can be
obscured. In post-mortem imaging, this can be
highly relevant for minor findings of, for
instance, foreign objects or gas. A visualization
method to remedy this problem is to have a
dual TF, where the second TF only picks up a
prioritized material and makes sure it is visible
when blending the two renderings (19). The
benefit of this approach is illustrated for metal
objects in Fig. 7.
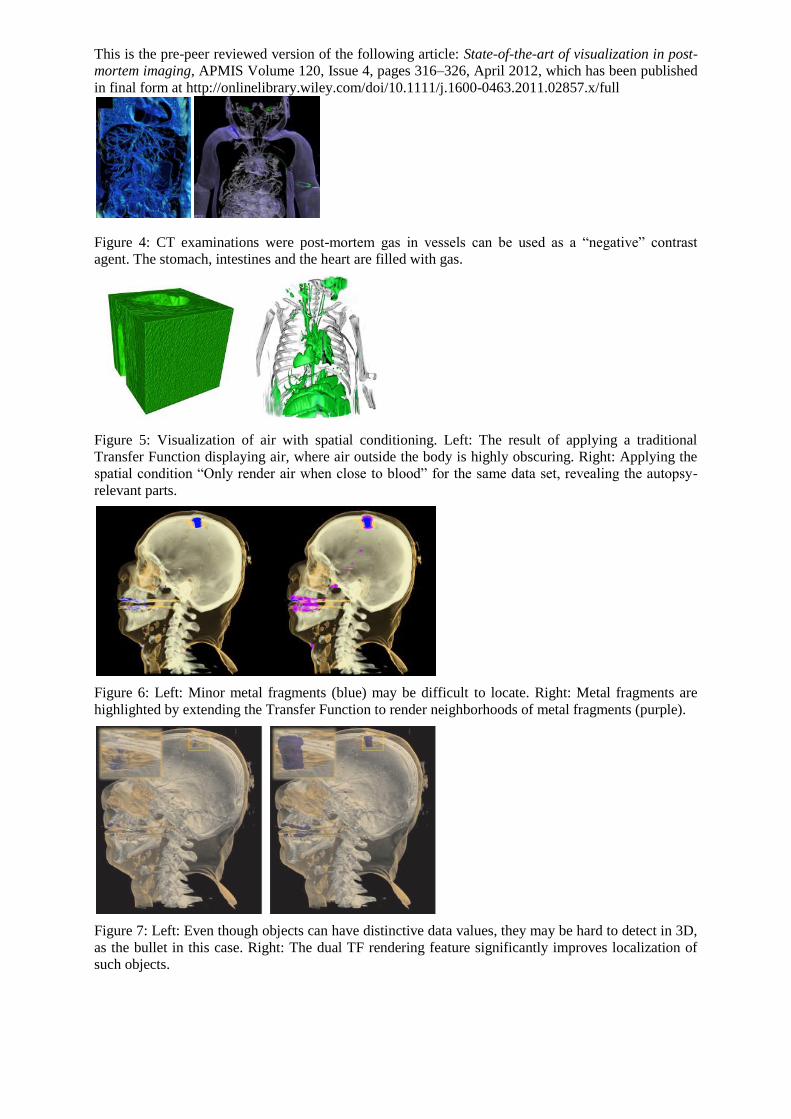
Illumination
The effectiveness of a rendered image is highly
dependent on whether it agrees with human
intuition. Representing volumetric data on a
2D screen is challenging and visual cues to
improve the perception of shapes and depth are
important. Techniques for virtual illumination
are known to significantly enhance the ability
This is the pre-peer reviewed version of the following article: State-of-the-art of visualization in post-
mortem imaging, APMIS Volume 120, Issue 4, pages 316–326, April 2012, which has been published
in final form at http://onlinelibrary.wiley.com/doi/10.1111/j.1600-0463.2011.02857.x/full
of humans to distinguish objects and their
properties (41).
A commonly used lighting approximation in
volume rendering applications is the Phong
(42) and Blinn-Phong (43) shading models.
This approach is fast but cannot well model
lighting for noisy data or homogeneous
regions. Global illumination is a type of more
advanced lighting model. It is, however, often
overly computationally expensive. Moreover,
in the context of medical visualization, regions
can be shadowed by dense objects occluding
the light. The skull, for example, can occlude
the light such that a tumor or other feature may
not be illuminated and so cannot be identified.
Local Ambient Occlusion (LAO) (44; 45) is a
shading model targeting some post-mortem
imaging challenges. LAO considers shadowing
by structures in the vicinity of each voxel. The
method computes the incident light for each
voxel by sampling a spherical neighborhood
around each voxel, capturing shadows and
light emissions locally, as seen in Fig. 8. The
method is less sensitive to noise and
homogeneous regions with poorly defined
gradients. As an integrated part of the LAO
approach, data points can be turned into virtual
light sources, which can add further valuable
discrimination effects.
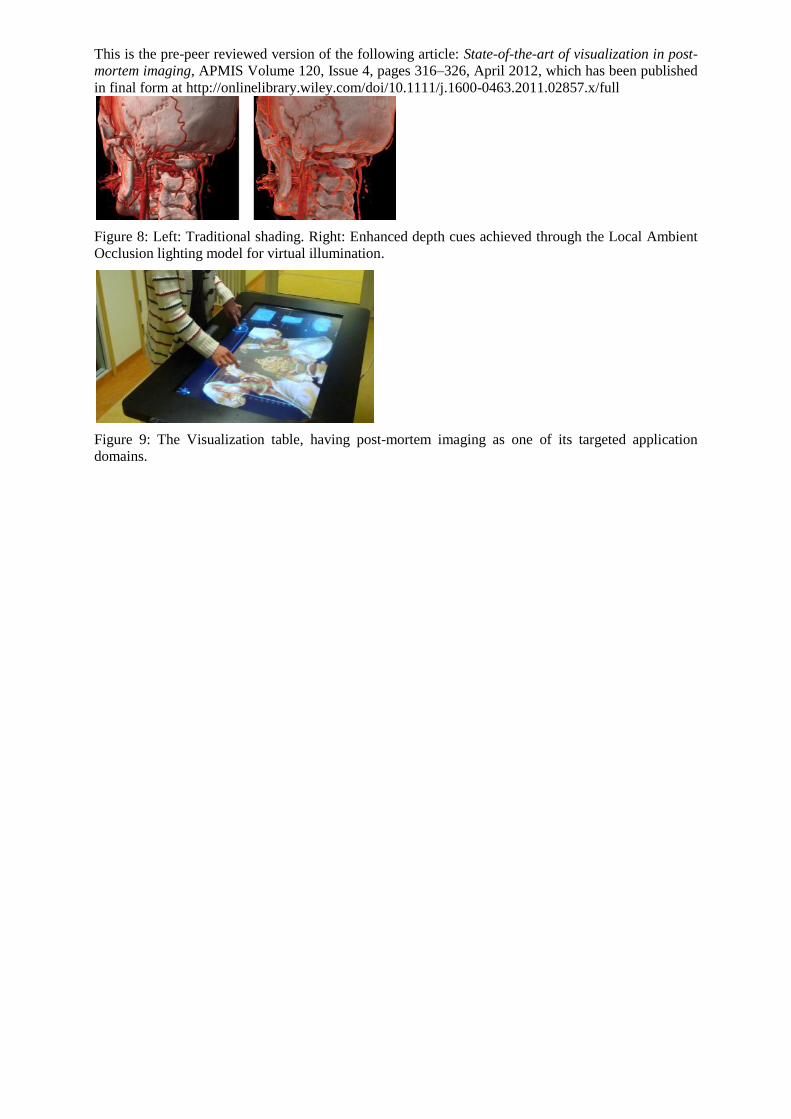
Visualization table
An area with high importance for the
effectiveness of the total visualization pipeline
is the display and interaction devices that are
the front-end for the user. Recently, a touch-
controlled visualization table was developed
for the virtual autopsy scenario (46) (even
though its application domain has subsequently
been extended to also include pre-operative
planning and teaching). A major design
objective was to target an experience of
virtually having the body on a table. Therefore,
a large (46’’) display was chosen where DVR
images in natural size cover a large part of the
body, see Fig. 9.
Another fundamental design objective was to
have a very low learning threshold and
therefore the touch–controlled user interface
was opted for. The table has a multi-touch
technology based on infrared sensors placed on
top of a regular screen. The touch gestures
used are based on the popular rotate-scale-
translate (RST) design (47), but extended to
control 3D interaction. A key characteristic,
known as “sticky fingers”, is that interacting
fingers always remain with the original virtual
contact point in the data set.
Another design decision targeting a low
learning threshold was let the medical image
heavily dominate the screen area. There are no
menus or toolbars visible and very few other
GUI elements. On demand, the user can launch
a set of browsable Multiplanar Reconstruction
(MPR) views showing the three main
orientations.
CONCLUSIONS
Visualization of post-mortem images has
matured significantly in recent years. The
state-of-the-art in autopsy workflow, image
acquisition and image rendering provide a
solid platform for employing virtual autopsies.
Thus, there are no significant technological
obstacles for introducing virtual autopsies on a
larger scale. Future evaluations of the
cost/benefit of autopsies need to consider that
post-mortem imaging as a complement or
alternative to traditional clinical autopsies.
REFERENCES
1. Levy AD, Harcke HT, Getz JM,
Mallak CT, Caruso JL, Pearse L, et
al. Virtual Autopsy: Two-and Three-
dimensional Multidetector CT
Findings in Drowning with Autopsy
Comparison1 [Internet]. Radiology.
2007 ;243(3):862.[cited 2011 Jun 7]
Available from:
This is the pre-peer reviewed version of the following article: State-of-the-art of visualization in post-
mortem imaging, APMIS Volume 120, Issue 4, pages 316–326, April 2012, which has been published
in final form at http://onlinelibrary.wiley.com/doi/10.1111/j.1600-0463.2011.02857.x/full
http://radiology.rsna.org/content/243
/3/862.short
2. Aghayev E, Yen K, Sonnenschein
M, Ozdoba C, Thali M, Jackowski
C, et al. Virtopsy post-mortem
multi-slice computed tomograhy
(MSCT) and magnetic resonance
imaging (MRI) demonstrating
descending tonsillar herniation:
comparison to clinical studies
[Internet]. Neuroradiology. 2004
;46(7):559–564.[cited 2011 Jun 7]
Available from:
http://www.springerlink.com/index/
EH4261YEB14TGDPN.pdf
3. Persson A, Jackowski C, Engstrom
E, Zachrisson H. Advances of dual
source, dual-energy imaging in
postmortem CT [Internet]. European
Journal of Radiology. 2008
;68(3):446–455.[cited 2011 Jun 7]
Available from:
http://linkinghub.elsevier.com/retrie
ve/pii/S0720048X08002507
4. Shiotani S, Kohno M, Ohashi N,
Yamazaki K, Nakayama H,
Watanabe K, et al. Non-traumatic
postmortem computed tomographic
(PMCT) findings of the lung
[Internet]. Forensic science
international. 2004 ;139(1):39–
48.[cited 2011 Jun 7] Available
from:
http://linkinghub.elsevier.com/retrie
ve/pii/S0379073803004110
5. Aghayev E, Sonnenschein M,
Jackowski C, Thali M, Buck U, Yen
K, et al. Postmortem radiology of
fatal hemorrhage: measurements of
cross-sectional areas of major blood
vessels and volumes of aorta and
spleen on MDCT and volumes of
heart chambers on MRI [Internet].
American Journal of
Roentgenology. 2006
;187(1):209.[cited 2011 Jun 7]
Available from:
http://www.ajronline.org/cgi/content
/abstract/187/1/209
6. Jackowski C, Thali M,
Sonnenschein M, Aghayev E, Yen
K, Dirnhofer R, et al. Visualization
and quantification of air embolism
structure by processing postmortem
MSCT data. [Internet]. Journal of
forensic sciences. 2004
;49(6):1339.[cited 2011 Jun 7]
Available from:
http://www.ncbi.nlm.nih.gov/pubme
d/15568710/
7. Dirnhofer R, Jackowski C, Vock P,
Potter K, Thali MJ. VIRTOPSY:
minimally invasive, imaging-guided
virtual autopsy [Internet].
Radiographics. 2006
;26(5):1305.[cited 2011 Jun 7]
Available from:
http://radiographics.rsna.org/content
/26/5/1305.short
8. Jackowski C, Thali MJ, Buck U,
Aghayev E, Sonnenschein M, Yen
K, et al. Noninvasive estimation of
organ weights by postmortem
magnetic resonance imaging and
multislice computed tomography
[Internet]. Investigative radiology.
2006 ;41(7):572.[cited 2011 Jun 7]
Available from:
http://journals.lww.com/investigativ
eradiology/Abstract/2006/07000/No
ninvasive_Estimation_of_Organ_W
eights_by.5.aspx
9. Jackowski C, Christe A,
Sonnenschein M, Aghayev E, Thali
MJ. Postmortem unenhanced
magnetic resonance imaging of
myocardial infarction in correlation
to histological infarction age
characterization [Internet]. European
heart journal. 2006
This is the pre-peer reviewed version of the following article: State-of-the-art of visualization in post-
mortem imaging, APMIS Volume 120, Issue 4, pages 316–326, April 2012, which has been published
in final form at http://onlinelibrary.wiley.com/doi/10.1111/j.1600-0463.2011.02857.x/full
;27(20):2459.[cited 2011 Jun 7]
Available from:
http://eurheartj.oxfordjournals.org/c
ontent/27/20/2459.short
10. Loughrey M, McCluggage W,
Toner P. The declining autopsy rate
and cliniciansʼ attitudes. [Internet].
The Ulster medical journal. 2000
;69(2):83.[cited 2011 Jun 7]
Available from:
http://www.ncbi.nlm.nih.gov/pmc/ar
ticles/PMC2449188/
11. Shojania KG, Burton EC. The
vanishing nonforensic autopsy
[Internet]. New England Journal of
Medicine. 2008 ;358(9):873–
875.[cited 2011 Jun 7] Available
from:
http://scholar.google.com/scholar?hl
=en&btnG=Search&q=intitle:The+v
anishing+nonforensic+autopsy#0
12. Shojania K, Burton E, McDonald K,
Goldman L. Overestimation of
clinical diagnostic performance
caused by low necropsy rates
[Internet]. Quality and Safety in
Health Care. 2005 ;14(6):408.[cited
2011 Jun 7] Available from:
http://qualitysafety.bmj.com/content
/14/6/408.short
13. Shojania KG, Burton EC. The
persistent value of the autopsy
[Internet]. American Family
Physician. 2004 ;69(11):2540–
2543.[cited 2011 Jun 7] Available
from:
http://www.aafp.org/afp/2004/0601/
p2540.html
14. Shojania K, Burton E. REVIEW-
Changes in Rates of Autopsy-
Detected Diagnostic Errors Over
Time: A Systematic Review
[Internet]. Journal of the. 2003
;[cited 2011 Jun 7] Available from:
http://scholar.google.com/scholar?hl
=en&btnG=Search&q=intitle:Chang
es+in+rates+of+autopsy-
detected+diagnostic+errors+over+ti
me:+a+systematic+review#2
15. Ward HE, Clarke BE, Zimmerman
PV, Cleary MI. The decline in
hospital autopsy rates in 2001.
[Internet]. The Medical journal of
Australia. 2002 ;176(2):91.[cited
2011 Jun 7] Available from:
http://www.ncbi.nlm.nih.gov/pubme
d/11936301
16. Roulson J, Benbow EW, Hasleton
PS. Discrepancies between clinical
and autopsy diagnosis and the value
of post mortem histology; a meta-
analysis and review.
Histopathology. 2005 ;47(6):551-
559.
17. Burton JL, Underwood J. Clinical,
educational, and epidemiological
value of autopsy. [Internet]. Lancet.
2007 Apr 28;369(9571):1471-
80.[cited 2011 Mar 25] Available
from:
http://www.ncbi.nlm.nih.gov/pubme
d/17467518
18. Thayyil S, Robertson NJ, Sebire NJ,
Taylor AM. Post-mortem MR and
CT imaging in fetuses, newborns
and children: an evidenced based
approach [Internet]. Diagnostic
Histopathology. 2010 Dec
;16(12):565-572.[cited 2011 Apr 26]
Available from:
http://linkinghub.elsevier.com/retrie
ve/pii/S1756231710001258
19. Ljung P, Winskog C, Persson A,
Lundstrom C, Ynnerman A. Full
body virtual autopsies using a state-
of-the-art volume rendering pipeline
[Internet]. Visualization and
Computer Graphics, IEEE
This is the pre-peer reviewed version of the following article: State-of-the-art of visualization in post-
mortem imaging, APMIS Volume 120, Issue 4, pages 316–326, April 2012, which has been published
in final form at http://onlinelibrary.wiley.com/doi/10.1111/j.1600-0463.2011.02857.x/full
Transactions on. 2006 ;12(5):869–
876.[cited 2011 Apr 26] Available
from:
http://ieeexplore.ieee.org/xpls/abs_a
ll.jsp?arnumber=4015441
20. Jacobsen C, Bech BH, Lynnerup N.
A comparative study of cranial,
blunt trauma fractures as seen at
medicolegal autopsy and by
Computed Tomography [Internet].
BMC Medical Imaging. 2009
;9(1):18.[cited 2011 Jun 7]
Available from:
http://www.biomedcentral.com/147
1-2342/9/18
21. Jacobsen C, Lynnerup N.
Craniocerebral trauma-Congruence
between post-mortem computed
tomography diagnoses and autopsy
results:: A 2-year retrospective
study [Internet]. Forensic science
international. 2010 ;194(1-3):9–
14.[cited 2011 Jun 7] Available
from:
http://linkinghub.elsevier.com/retrie
ve/pii/S0379073809004113
22. others. Virtopsy-postmortem
multislice computed tomography
(MSCT) and magnetic resonance
imaging (MRI) in a fatal scuba
diving incident. [Internet]. Journal
of forensic sciences. 2003
;48(6):1347.[cited 2011 Jun 7]
Available from:
http://www.ncbi.nlm.nih.gov/pubme
d/14640284
23. Aghayev E, Yen K, Sonnenschein
M, Jackowski C, Thali M, Vock P,
et al. Pneumomediastinum and soft
tissue emphysema of the neck in
postmortem CT and MRI; a new
vital sign in hanging? [Internet].
Forensic science international. 2005
;153(2-3):181–188.[cited 2011 Jun
7] Available from:
http://linkinghub.elsevier.com/retrie
ve/pii/S0379073804006255
24. Jackowski C, Persson A, Thali MJ.
Whole body postmortem
angiography with a high viscosity
contrast agent solution using poly
ethylene glycol as contrast agent
dissolver [Internet]. Journal of
forensic sciences. 2008 ;53(2):465–
468.[cited 2011 Jun 7] Available
from:
http://onlinelibrary.wiley.com/doi/1
0.1111/j.1556-
4029.2008.00673.x/full
25. Jackowski C, Warntjes MJB, Berge
J, B\"ar W, Persson A. Magnetic
resonance imaging goes
postmortem: noninvasive detection
and assessment of myocardial
infarction by postmortem MRI
[Internet]. European radiology. 2010
;1–9.[cited 2011 Jun 7] Available
from:
http://www.springerlink.com/index/
N75800X71X78101N.pdf
26. Ruder TD, Hatch GM, Siegenthaler
L, Ampanozi G, Mathier S, Thali
MJ, et al. The influence of body
temperature on image contrast in
post mortem MRI. [Internet].
European journal of radiology. 2011
Mar 30;[cited 2011 Jun 7] Available
from:
http://www.ncbi.nlm.nih.gov/pubme
d/21458188
27. Thali M, Yen K, Schweitzer W,
Vock P, Ozdoba C, Dirnhofer R.
Into the decomposed body–forensic
digital autopsy using multislice-
computed tomography [Internet].
Forensic science international. 2003
;134(2-3):109–114.[cited 2011 Jun
10] Available from:
http://linkinghub.elsevier.com/retrie
ve/pii/S0379073803001373
This is the pre-peer reviewed version of the following article: State-of-the-art of visualization in post-
mortem imaging, APMIS Volume 120, Issue 4, pages 316–326, April 2012, which has been published
in final form at http://onlinelibrary.wiley.com/doi/10.1111/j.1600-0463.2011.02857.x/full
28. Takatori T. Investigations on the
mechanism of adipocere formation
and its relation to other biochemical
reactions [Internet]. Forensic
science international. 1996 ;80(1-
2):49–61.[cited 2011 Jun 10]
Available from:
http://linkinghub.elsevier.com/retrie
ve/pii/0379073896019275
29. O’Donnell CJ, Baker MA.
Postmortem CT findings of
“gastromalacia”: a trap for the
radiologist with forensic interest
[Internet]. Forensic Science,
Medicine, and Pathology. 1–5.[cited
2011 Jun 10] Available from:
http://www.springerlink.com/index/
x4566t45j3p7pg37.pdf
30. Preim B, Bartz D. Visualization in
Medicine. Theory, Algorithms, and
Applications. Series in Computer
Graphics [Internet]. Morgan
Kaufmann; 2007. [cited 2011 Jun
10] Available from:
http://www.lavoisier.fr/livre/notice.a
sp?id=OR3W2LAOA6XOWH
31. Robb RA. Three-Dimensional
Visualization in Medicine and
Biology. In: Bankman IN, editor(s).
Handbook of Medical Imaging --
Processing and Analysis. Academic
Press; 2000. p. 685-712.
32. THALI MJ, BRAUN M, BUCK U,
AGHAYEV E, JACKOWSKI C,
VOCK P, et al. VIRTOPSY:
Scientific documentation,
reconstruction and animation in
forensic: Individual and real 3D data
based geo-metric approach
including opticalbody/object surface
and radiological CT/MRI scanning
[Internet]. Journal of forensic
sciences. 50(2):428-442.[cited 2011
Jun 7] Available from:
http://cat.inist.fr/?aModele=afficheN
&cpsidt=16640105
33. Drebin RA, Carpenter L, Hanrahan
P. Volume rendering [Internet]. In:
ACM Siggraph Computer Graphics.
ACM; 1988. p. 65–74.[cited 2011
Apr 26] Available from:
http://portal.acm.org/citation.cfm?id
=378484
34. Engel K, Hadwiger M, Kniss J,
Rezk-Salama C, Weiskopf D. Real-
Time Volume Graphics. A.K.
Peters, Ltd; 2006.
35. Kniss J, Kindlmann G, Hansen C.
Multidimensional transfer functions
for interactive volume rendering
[Internet]. IEEE Transactions on
Visualization and Computer
Graphics. 2002 ;8(3):270-285.[cited
2011 Apr 26] Available from:
http://www.computer.org/portal/web
/csdl/doi/10.1109/TVCG.2002.1021
579
36. Lundström C, Ljung P, Ynnerman
A. Local histograms for design of
transfer functions in direct volume
rendering [Internet]. IEEE
Transactions on visualization and
computer graphics. 2006
;12(6):1570–1579.[cited 2011 Apr
26] Available from:
http://www.computer.org/portal/web
/csdl/doi/10.1109/TVCG.2006.100
37. Patel D, Haidacher M, Balabanian J.
Moment curves [Internet].
PacificVis ’09. 2009 ;201-208.[cited
2011 Apr 26] Available from:
http://ieeexplore.ieee.org/xpls/abs_a
ll.jsp?arnumber=4906857
38. Haidacher M, Bruckner S, Kanitsar
A, Gröller M. Information-based
transfer functions for multimodal
visualization [Internet]. Proceedings
This is the pre-peer reviewed version of the following article: State-of-the-art of visualization in post-
mortem imaging, APMIS Volume 120, Issue 4, pages 316–326, April 2012, which has been published
in final form at http://onlinelibrary.wiley.com/doi/10.1111/j.1600-0463.2011.02857.x/full
of Visual Computing for
Biomedicine. 2008 ;(April
2008):101–108.[cited 2011 Apr 26]
Available from:
http://www.cg.tuwien.ac.at/research/
publications/2008/TR-186-2-08-
04/TR-186-2-08-04-
TechnicalReport.pdf
39. Lindholm S, Ljung P, Lundstrom C,
Persson A, Ynnerman A. Spatial
Conditioning of Transfer Functions
Using Local Material Distributions
[Internet]. Visualization and
Computer Graphics, IEEE
Transactions on. 2010 ;16(6):1301–
1310.[cited 2011 Apr 26] Available
from:
http://ieeexplore.ieee.org/xpls/abs_a
ll.jsp?arnumber=5613470
40. Lundström C, Ljung P, Ynnerman
A. Multi-dimensional transfer
function design using sorted
histograms [Internet]. In:
Proceedings Eurographics/IEEE
Workshop on Volume Graphics
2006. 2006. p. 1–8.[cited 2011 Apr
26] Available from:
http://scholar.google.com/scholar?hl
=en&btnG=Search&q=intitle:Multi-
Dimensional+Transfer+Function+D
esign+Using+Sorted+Histograms#0
41. Langer MS, Bülthoff H. Perception
of shape from shading on a cloudy
day [Internet]. Max-Planck-Institut
fÃ$1/4$r biologische Kybernetik.
1999 ;[cited 2011 Jun 10] Available
from:
http://citeseerx.ist.psu.edu/viewdoc/
download?doi=10.1.1.30.7755&
;rep=rep1&type=pdf
42. Phong B. Illumination for computer-
generated images. [Internet]. 1973
;[cited 2011 Jun 10] Available from:
http://oai.dtic.mil/oai/oai?verb=getR
ecord&metadataPrefix=html&a
mp;identifier=ADA008786
43. Blinn JF. Models of light reflection
for computer synthesized pictures
[Internet]. In: Proceedings of the 4th
annual conference on Computer
graphics and interactive techniques.
ACM; 1977. p. 192–198.[cited 2011
Jun 10] Available from:
http://portal.acm.org/citation.cfm?id
=563858.563893
44. Hernell F, Ljung P, Ynnerman A.
Local ambient occlusion in direct
volume rendering. [Internet]. IEEE
transactions on visualization and
computer graphics. 2010 ;16(4):548-
59.Available from:
http://www.ncbi.nlm.nih.gov/pubme
d/20467054
45. Kronander J, Jonsson D, Low J,
Ljung P, Ynnerman A, Unger J.
Efficient Visibility Encoding for
Dynamic Illumination in Direct
Volume Rendering. [Internet]. IEEE
transactions on visualization and
computer graphics. 2011 ;[cited
2011 Jun 20] Available from:
http://www.ncbi.nlm.nih.gov/pubme
d/21301022
46. Sectra Visualization Table: Enabling
virtual autopsies [Internet]. [cited
2011 Jun 10] Available from:
http://www.sectra.com/medical/visu
alization/forensics/index.html
47. Hancock MS, Carpendale S, Vernier
FD, Wigdor D. Rotation and
Translation Mechanisms for
Tabletop Interaction [Internet]. First
IEEE International Workshop on
Horizontal Interactive Human-
Computer Systems (TABLETOP
’06). 2006 ;79-88.Available from:
http://ieeexplore.ieee.org/lpdocs/epi

This is the pre-peer reviewed version of the following article: State-of-the-art of visualization in post-
mortem imaging, APMIS Volume 120, Issue 4, pages 316–326, April 2012, which has been published
in final form at http://onlinelibrary.wiley.com/doi/10.1111/j.1600-0463.2011.02857.x/full
c03/wrapper.htm?arnumber=157919
6
This is the pre-peer reviewed version of the following article: State-of-the-art of visualization in post-
mortem imaging, APMIS Volume 120, Issue 4, pages 316–326, April 2012, which has been published
in final form at http://onlinelibrary.wiley.com/doi/10.1111/j.1600-0463.2011.02857.x/full
FIGURES
Figure 1: Example of virtual autopsy procedure from the forensic domain. Virtual autopsy activities,
shown in red, are added to the traditional workflow and enable an iterative approach. The procedure is
based on a continuous interaction between the forensic pathologist, the radiologist, and the police.
Figure 2: Post-mortem dual energy CT examination of a child. Visualization of hemosiderin (purple
color). Great vessels and organ containing blood can be seen without any iodine contrast.
Figure 3: Post-mortem dual energy CT examinations can facilitate classifications of different tissue
types, such as blood, soft tissue, tendons, and cartilage.
This is the pre-peer reviewed version of the following article: State-of-the-art of visualization in post-
mortem imaging, APMIS Volume 120, Issue 4, pages 316–326, April 2012, which has been published
in final form at http://onlinelibrary.wiley.com/doi/10.1111/j.1600-0463.2011.02857.x/full
Figure 4: CT examinations were post-mortem gas in vessels can be used as a “negative” contrast
agent. The stomach, intestines and the heart are filled with gas.
Figure 5: Visualization of air with spatial conditioning. Left: The result of applying a traditional
Transfer Function displaying air, where air outside the body is highly obscuring. Right: Applying the
spatial condition “Only render air when close to blood” for the same data set, revealing the autopsy-
relevant parts.
Figure 6: Left: Minor metal fragments (blue) may be difficult to locate. Right: Metal fragments are
highlighted by extending the Transfer Function to render neighborhoods of metal fragments (purple).
Figure 7: Left: Even though objects can have distinctive data values, they may be hard to detect in 3D,
as the bullet in this case. Right: The dual TF rendering feature significantly improves localization of
such objects.
This is the pre-peer reviewed version of the following article: State-of-the-art of visualization in post-
mortem imaging, APMIS Volume 120, Issue 4, pages 316–326, April 2012, which has been published
in final form at http://onlinelibrary.wiley.com/doi/10.1111/j.1600-0463.2011.02857.x/full
Figure 8: Left: Traditional shading. Right: Enhanced depth cues achieved through the Local Ambient
Occlusion lighting model for virtual illumination.
Figure 9: The Visualization table, having post-mortem imaging as one of its targeted application
domains.