Embed Size (px)
DESCRIPTION
Outlook on how much and where Hispanics are spending their money in Southern Arizona.
Citation preview
The State of Southern Arizona's Hispanic Marketpresented by:
www.tucsonhispanicchamber.org
Southern Arizona
HISPANIC MARKET OUTLOOK PAGE 2
HISPANIC MARKET OUTLOOK PAGE 3
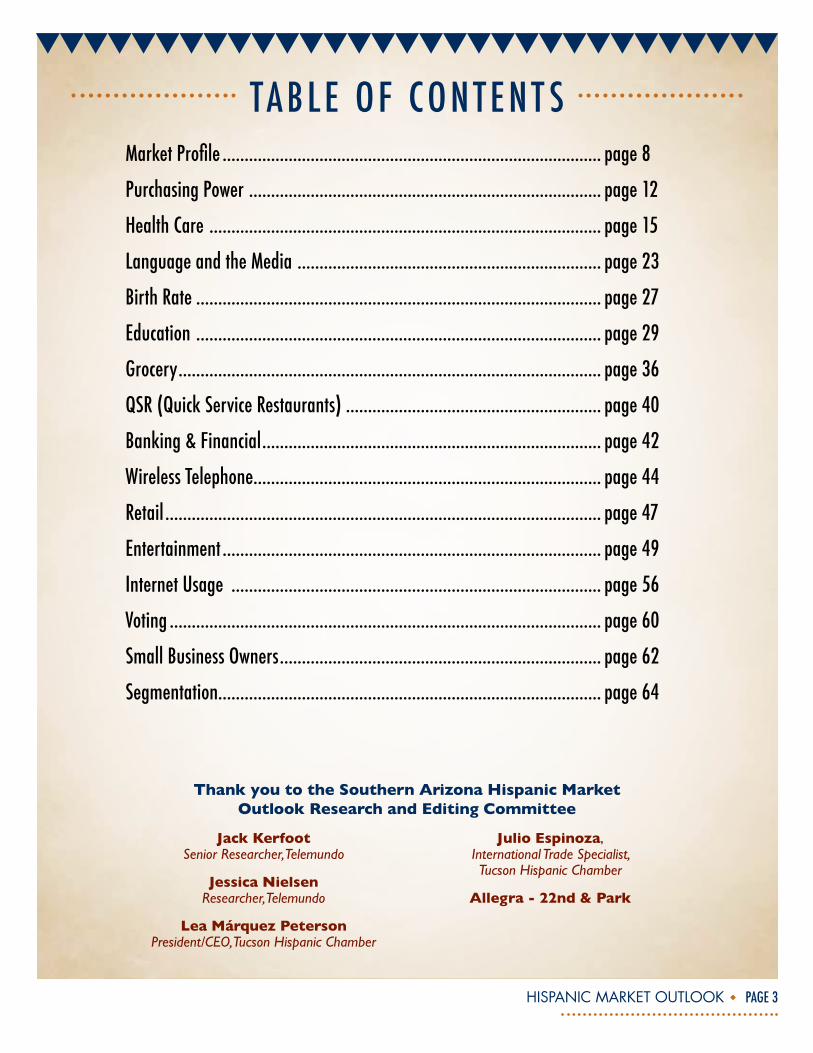
tAblE of contEnt sMarket Profile ...................................................................................... page 8
Purchasing Power ................................................................................ page 12
Health Care ......................................................................................... page 15
language and the Media ..................................................................... page 23
birth Rate ............................................................................................ page 27
Education ............................................................................................ page 29
Grocery ................................................................................................ page 36
QsR (Quick service Restaurants) .......................................................... page 40
Banking & Financial ............................................................................. page 42
Wireless Telephone ............................................................................... page 44
Retail ................................................................................................... page 47
Entertainment ...................................................................................... page 49
Internet Usage .................................................................................... page 56
Voting .................................................................................................. page 60
Small Business Owners ......................................................................... page 62
segmentation....................................................................................... page 64
Jack KerfootSenior Researcher, Telemundo
Jessica NielsenResearcher, Telemundo
Lea Márquez PetersonPresident/CEO, Tucson Hispanic Chamber
Julio Espinoza,International Trade Specialist,Tucson Hispanic Chamber
Allegra - 22nd & Park
Thank you to the Southern Arizona Hispanic Market Outlook Research and Editing Committee
HISPANIC MARKET OUTLOOK PAGE 4
Welcome to Hispanic Market Outlook 2015
Congratulations to the Tucson Hispanic Chamber and Telemundo on their inaugural edition of the Southern Arizona Hispanic Market Outlook. This report will serve as an important tool for local businesses as they work to grow their customer base, expand operations and create jobs for the people of Southern Arizona and throughout the state.
The Hispanic population in Arizona is a dynamic, fast-growing market that should be highly valued by businesses focused on their long term success.
As governor of Arizona, I understand the importance of the Hispanic population in our state. Hispanics currently make up more than one third Arizona’s population, and by 2035 will be the majority of our state. Our growing Hispanic population will include many young families and future entrepreneurs who seek high quality education for their children and a business-friendly environment to grow their firms. Both of these issues are top priorities for my administration.
I look forward to working closely with the Hispanic business community and the region as a whole to promote Arizona as a great place to live, work and do business.
Congratulations again on the first of many editions of your publication. I look forward to reading it!
Governor Doug Ducey
HISPANIC MARKET OUTLOOK PAGE 5
Welcome to Hispanic Market Outlook 2015
Bienvenidos to our inaugural Southern Arizona Hispanic Market Outlook – the most comprehensive Hispanic market research report covering Pima, Santa Cruz and Cochise Counties! Thank you to Telemundo, our research partner and the Arizona Daily Star and Clear Channel Radio for their media partnership.
The Southern Arizona Hispanic Market Outlook is one of the most significant events that our Tucson Hispanic Chamber hosts for the Southern Arizona business community. The report provides detailed information that can assist Arizona businesses in reaching the fast growing Hispanic market in Southern Arizona.
Our Tucson Hispanic Chamber and affiliate chambers in Douglas, Nogales and Sierra Vista provide business education workshops, business lending assistance and numerous networking opportunities to assist businesses in Arizona and Sonora. Please contact our team at (520) 620-0005 or visit our website: www.TucsonHispanicChamber.org to learn more about the largest Latino business organization in Arizona.
¡Bienvenidos! On behalf of Telemundo Tucson we are proud to partner with the Tucson Hispanic Chamber of Commerce in their inaugural Southern Arizona Hispanic Market Outlook.
KHRR-TV Telemundo and the Tucson Hispanic Chamber have made a commitment to provide the business communities of Tucson, Southern Arizona and Northern Mexico the facts and figures on the growing population of the region to create opportunities to expand their businesses.
KHRR-TV Telemundo has been a part of the Spanish-speaking community in the Tucson area for more than 20 years. Owned by NBCUniversal, Telemundo Tucson delivers its viewing audience, which reaches to the U.S./Mexico border, local breaking news, weather, entertainment and sports coverage across a variety of platforms, including Noticiero Telemundo Arizona, Enfoque Arizona, online at TelemundoArizona.com and via mobile and social media channels. Telemundo Tucson has received multiple awards for its commitment to journalism and community service. The success of our partners, both in the community and business is at the core of our mission.
lea Márquez Peterson, MbA, IoMPresident/cEo
Araceli De LeonPresident & General Manager Telemundo Phoenix & Tucson
at NBC Universal, Inc.
HISPANIC MARKET OUTLOOK PAGE 6
Gala and Bi-National Awards
Saturday, Oct. 17thCasino del Sol Resort
TucsonHispanicChamber.orgJaime ChamberlainChamberlain Distributing
Patricia SchwabePeach Properties / Penca Restaurant
CELEBRATINGthe Hispanic Business Man and Woman of the Year
Register at:
Small businesses are the engines of neighborhood economies. They create jobs, spur innovation and build lasting local assets.
Citi Community Development is proud to work with community organizations like Tucson Hispanic Chamber of Commerce to support America’s small businesses.
Learn more at citicommunitydevelopment.com
*Source: U.S. Small Business Administration (http://www.sba.gov/sites/default/files/sbfaq.pdf)© 2015 Citigroup Inc. All rights reserved. Citi and Citi with Arc Design are registered service marks of Citigroup Inc.
Small Businesses Have Created 65% of New U.S. Jobs.*
Saturday, Oct. 17thCasino del Sol Resort
TucsonHispanicChamber.orgJaime ChamberlainChamberlain Distributing
Patricia SchwabePeach Properties / Penca Restaurant
CELEBRATINGthe Hispanic Business Man and Woman of the Year
Register at:

HISPANIC MARKET OUTLOOK PAGE 7
ARIZONA-SONORABUSINESS RESOURCE GUIDE
Free: the key to cross-border commerce at your fi ngertips
The 2nd edition of the Arizona-Sonora Business Resource Guide is the most comprehensive directory of the businesses and agencies
involved in cross-border trade. It’s yours at no charge as a phone app. Download it today at http://tucson.com/azsonoraapp
HISPANIC MARKET OUTLOOK PAGE 8
MARkEt PRof I lE
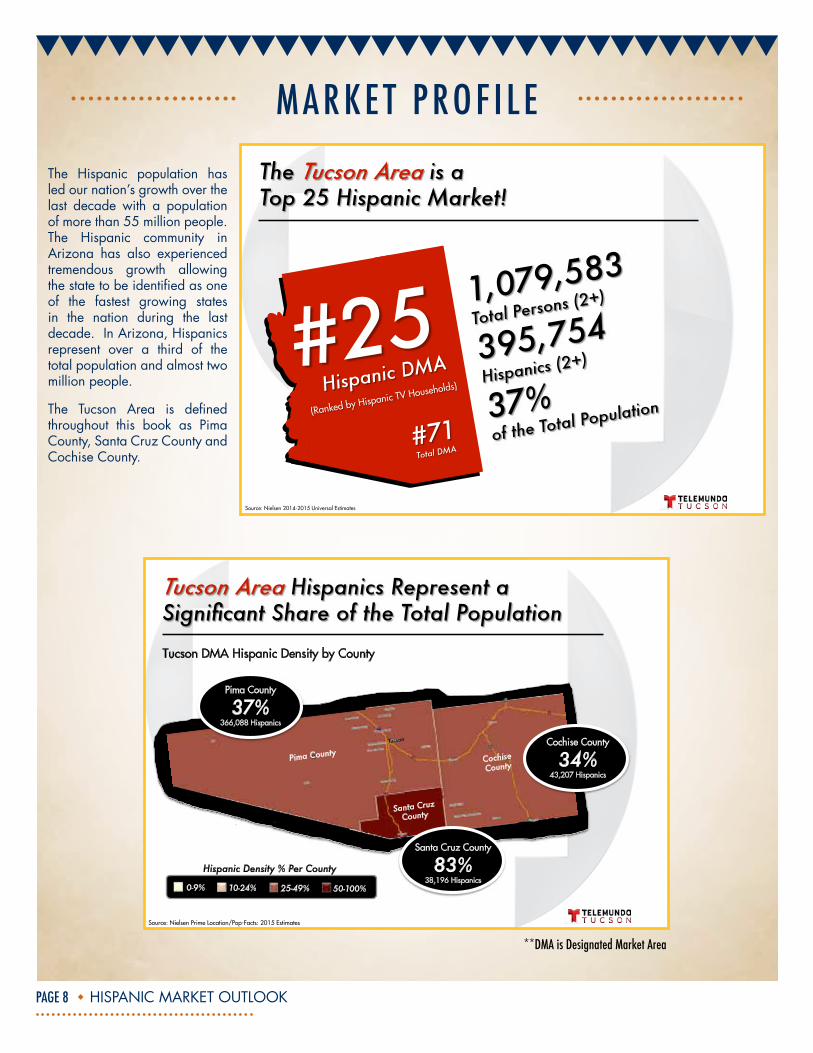
Source: Nielsen 2014-2015 Universal Estimates
Tucson DMA Hispanic Density by County
0-9% 10-24% 25-49% 50-100%
Hispanic Density % Per County
Source: Nielsen Prime Location/Pop-Facts: 2015 Estimates
Pima County
37% 366,088 Hispanics
Santa Cruz County
83% 38,196 Hispanics
Cochise County
34% 43,207 Hispanics
Pima County
Santa Cruz County
Cochise County
Tucson
The Hispanic population has led our nation’s growth over the last decade with a population of more than 55 million people. The Hispanic community in Arizona has also experienced tremendous growth allowing the state to be identified as one of the fastest growing states in the nation during the last decade. In Arizona, Hispanics represent over a third of the total population and almost two million people.
The Tucson Area is defined throughout this book as Pima County, Santa Cruz County and Cochise County.
**DMA is Designated Market Area
HISPANIC MARKET OUTLOOK PAGE 9
MARkEt PRof I lE
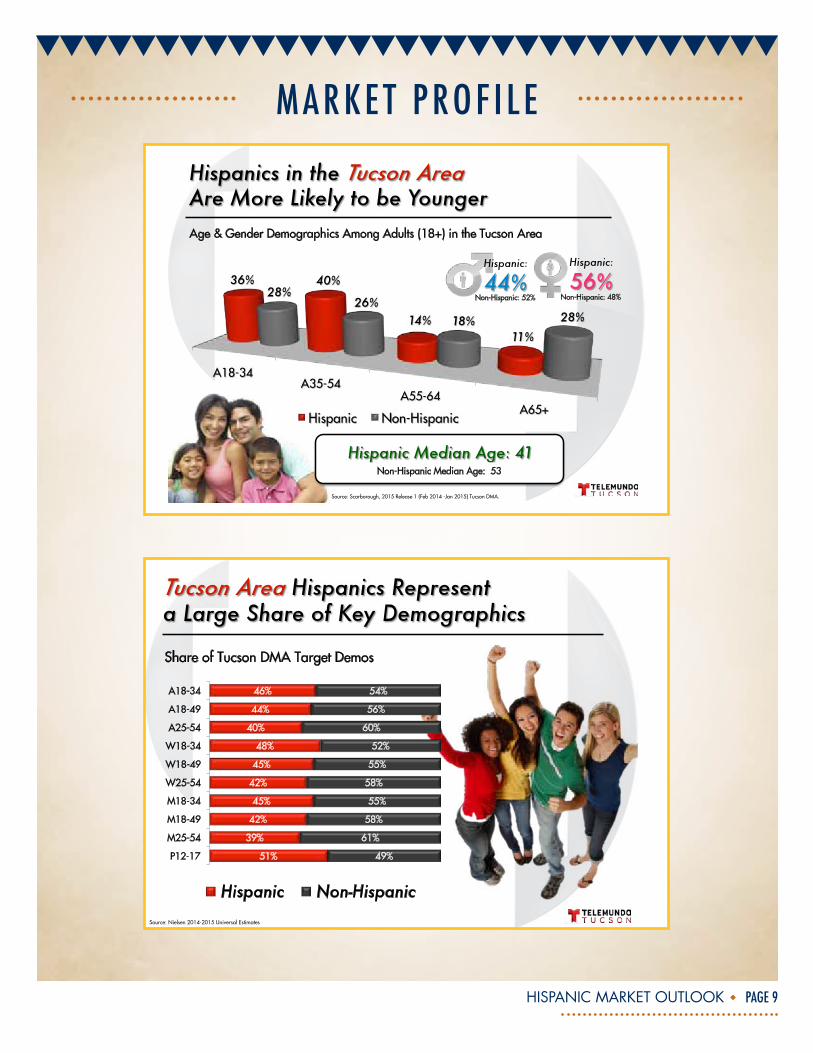
Non-Hispanic: 52% Non-Hispanic: 48%
Age & Gender Demographics Among Adults (18+) in the Tucson Area
Non-Hispanic Median Age: 53
Source: Scarborough, 2015 Release 1 (Feb 2014 -Jan 2015) Tucson DMA.
Share of Tucson DMA Target Demos
51%
39%
42%
45%
42%
45%
48%
40%
44%
46%
49%
61%
58%
55%
58%
55%
52%
60%
56%
54%
P12-17
M25-54
M18-49
M18-34
W25-54
W18-49
W18-34
A25-54
A18-49
A18-34
Hispanic Non-Hispanic Source: Nielsen 2014-2015 Universal Estimates
HISPANIC MARKET OUTLOOK PAGE 10
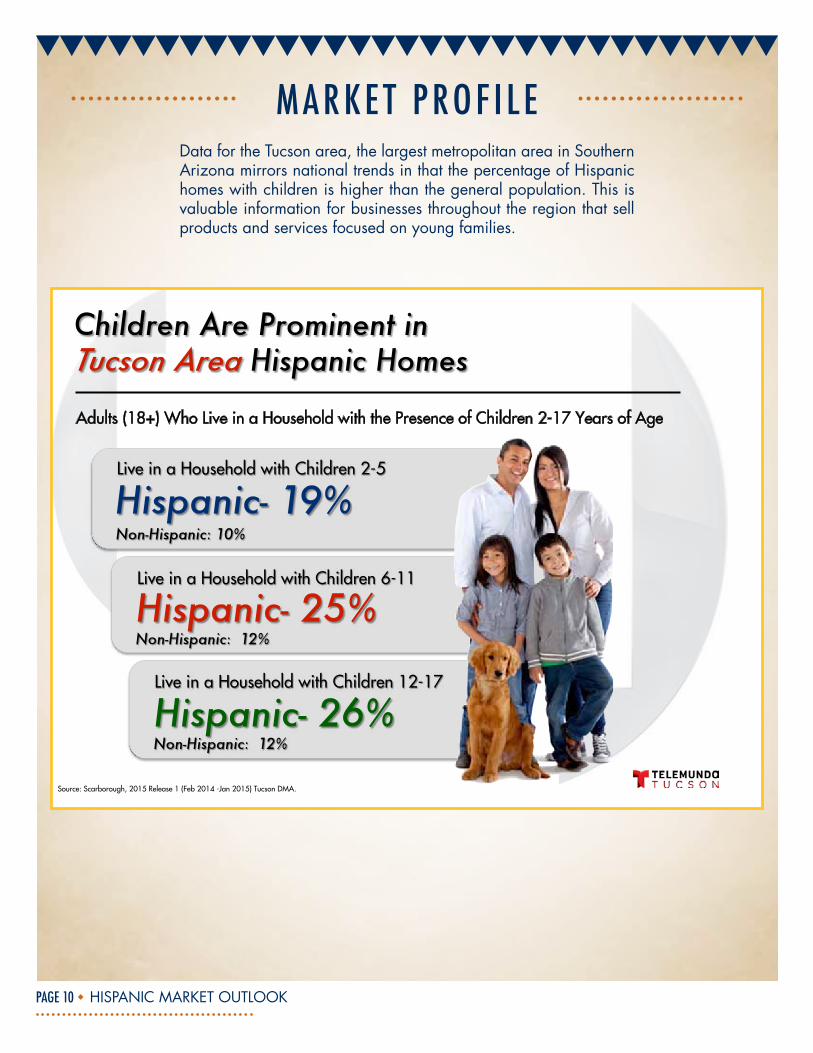
MARkEt PRof I lEData for the Tucson area, the largest metropolitan area in Southern Arizona mirrors national trends in that the percentage of Hispanic homes with children is higher than the general population. This is valuable information for businesses throughout the region that sell products and services focused on young families.
Adults (18+) Who Live in a Household with the Presence of Children 2-17 Years of Age
Source: Scarborough, 2015 Release 1 (Feb 2014 -Jan 2015) Tucson DMA.
HISPANIC MARKET OUTLOOK PAGE 11
MARkEt PRof I lE
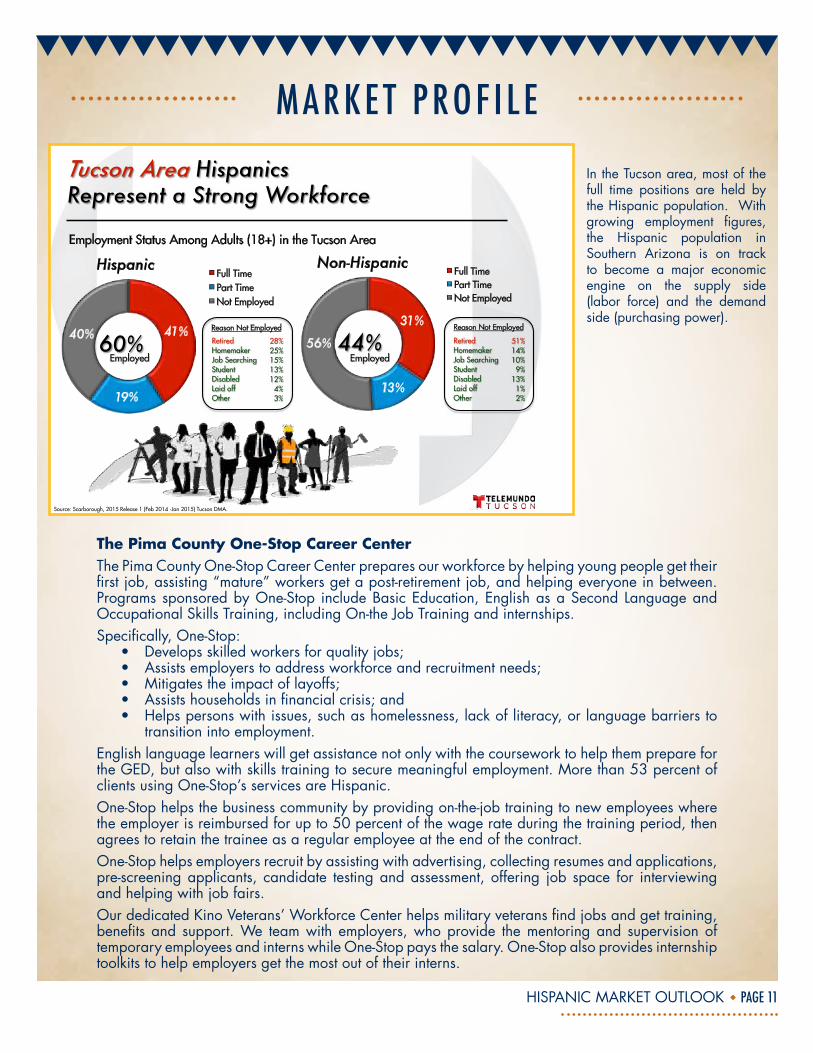
31%
13%
56%
Non-Hispanic Full Time Part Time Not Employed
41%
19%
40%
Hispanic Full Time Part Time Not Employed
Employment Status Among Adults (18+) in the Tucson Area
Reason Not Employed Reason Not Employed
Source: Scarborough, 2015 Release 1 (Feb 2014 -Jan 2015) Tucson DMA.
The Pima County One-Stop Career Center The Pima County One-Stop Career Center prepares our workforce by helping young people get their first job, assisting “mature” workers get a post-retirement job, and helping everyone in between. Programs sponsored by One-Stop include Basic Education, English as a Second Language and Occupational Skills Training, including On-the Job Training and internships. Specifically, One-Stop: • Developsskilledworkersforqualityjobs; • Assistsemployerstoaddressworkforceandrecruitmentneeds; • Mitigatestheimpactoflayoffs; • Assistshouseholdsinfinancialcrisis;and • Helpspersonswithissues,suchashomelessness,lackofliteracy,orlanguagebarriersto
transition into employment.English language learners will get assistance not only with the coursework to help them prepare for the GED, but also with skills training to secure meaningful employment. More than 53 percent of clients using One-Stop’s services are Hispanic.One-Stop helps the business community by providing on-the-job training to new employees where the employer is reimbursed for up to 50 percent of the wage rate during the training period, then agrees to retain the trainee as a regular employee at the end of the contract. One-Stop helps employers recruit by assisting with advertising, collecting resumes and applications, pre-screening applicants, candidate testing and assessment, offering job space for interviewing and helping with job fairs.Our dedicated Kino Veterans’ Workforce Center helps military veterans find jobs and get training, benefits and support. We team with employers, who provide the mentoring and supervision of temporary employees and interns while One-Stop pays the salary. One-Stop also provides internship toolkits to help employers get the most out of their interns.
In the Tucson area, most of the full time positions are held by the Hispanic population. With growing employment figures, the Hispanic population in Southern Arizona is on track to become a major economic engine on the supply side (labor force) and the demand side (purchasing power).
HISPANIC MARKET OUTLOOK PAGE 12
PURchAs InG PowER
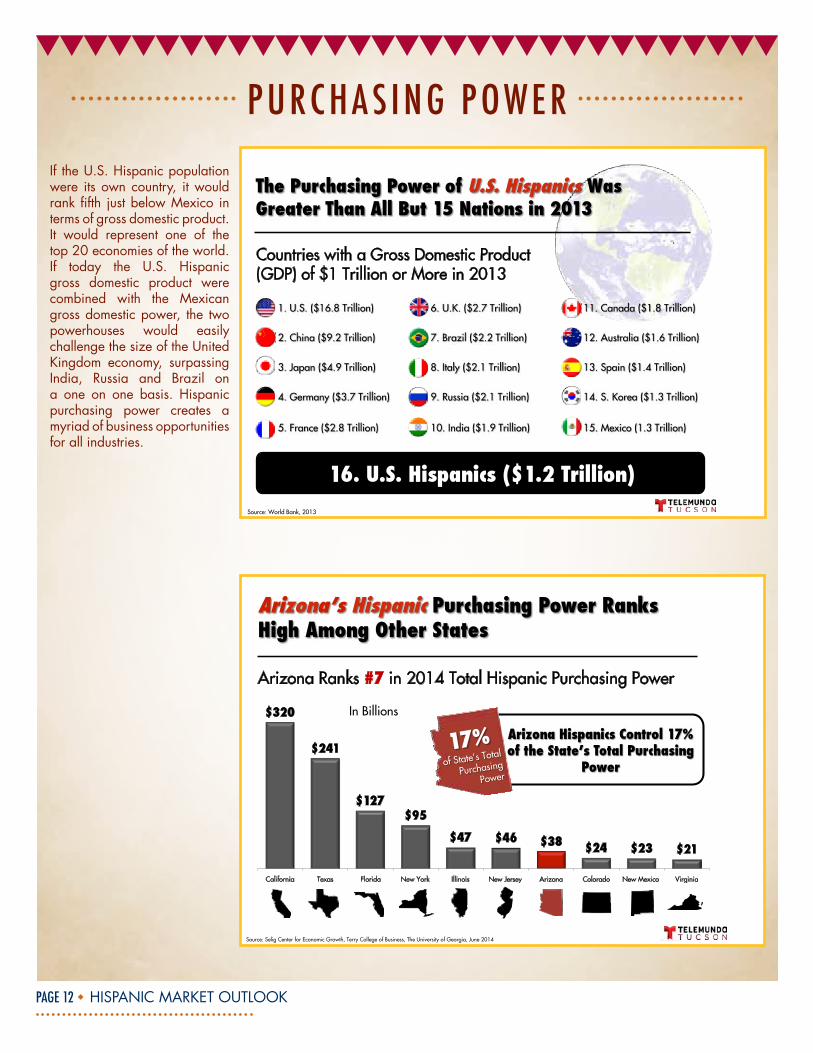
Arizona Ranks #7 in 2014 Total Hispanic Purchasing Power
$320
$241
$127 $95
$47 $46 $38 $24 $23 $21
California Texas Florida New York Illinois New Jersey Arizona Colorado New Mexico Virginia
Source: Selig Center for Economic Growth, Terry College of Business, The University of Georgia, June 2014
In Billions
Countries with a Gross Domestic Product (GDP) of $1 Trillion or More in 2013
Source: World Bank, 2013
If the U.S. Hispanic population were its own country, it would rank fifth just below Mexico in terms of gross domestic product. It would represent one of the top 20 economies of the world. If today the U.S. Hispanic gross domestic product were combined with the Mexican gross domestic power, the two powerhouses would easily challenge the size of the United Kingdom economy, surpassing India, Russia and Brazil on a one on one basis. Hispanic purchasing power creates a myriad of business opportunities for all industries.
HISPANIC MARKET OUTLOOK PAGE 13
PURchAs InG PowER
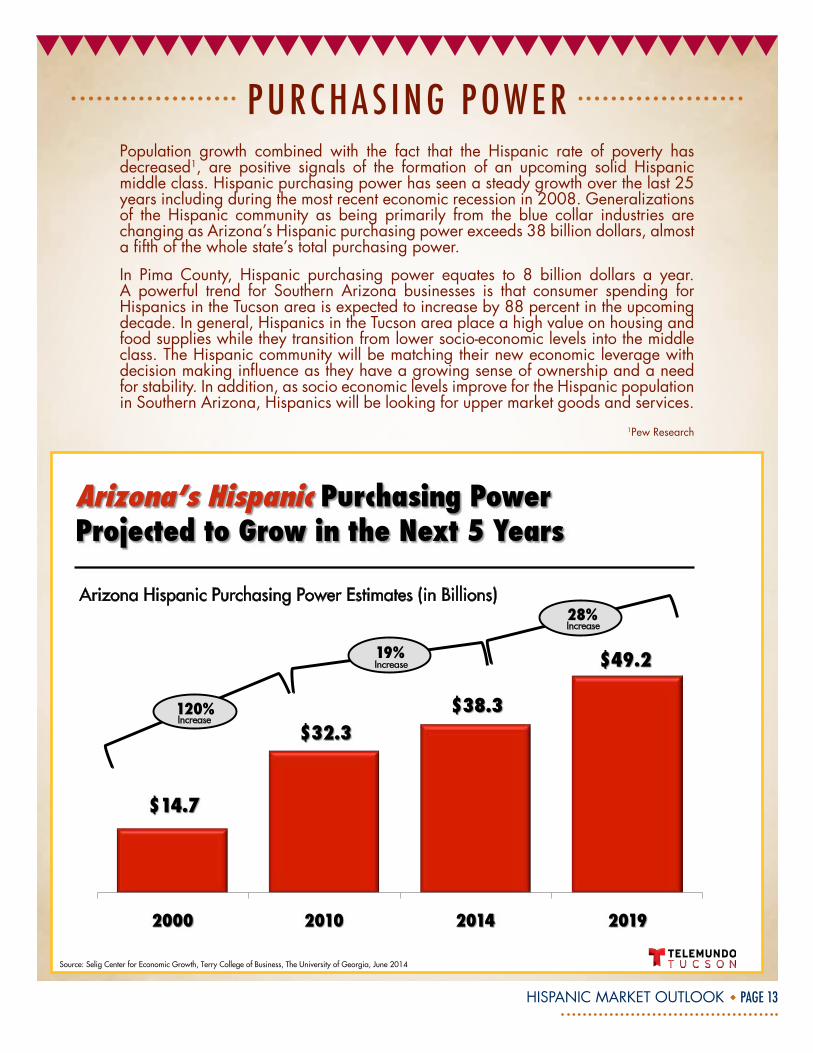
Increase
Increase
Increase
120%
19%
28%Arizona Hispanic Purchasing Power Estimates (in Billions)
Source: Selig Center for Economic Growth, Terry College of Business, The University of Georgia, June 2014
Population growth combined with the fact that the Hispanic rate of poverty has decreased1, are positive signals of the formation of an upcoming solid Hispanic middle class. Hispanic purchasing power has seen a steady growth over the last 25 years including during the most recent economic recession in 2008. Generalizations of the Hispanic community as being primarily from the blue collar industries are changing as Arizona’s Hispanic purchasing power exceeds 38 billion dollars, almost a fifth of the whole state’s total purchasing power.
In Pima County, Hispanic purchasing power equates to 8 billion dollars a year. A powerful trend for Southern Arizona businesses is that consumer spending for Hispanics in the Tucson area is expected to increase by 88 percent in the upcoming decade. In general, Hispanics in the Tucson area place a high value on housing and food supplies while they transition from lower socio-economic levels into the middle class. The Hispanic community will be matching their new economic leverage with decision making influence as they have a growing sense of ownership and a need for stability. In addition, as socio economic levels improve for the Hispanic population in Southern Arizona, Hispanics will be looking for upper market goods and services.
1Pew Research
HISPANIC MARKET OUTLOOK PAGE 14
PURchAs InG PowER
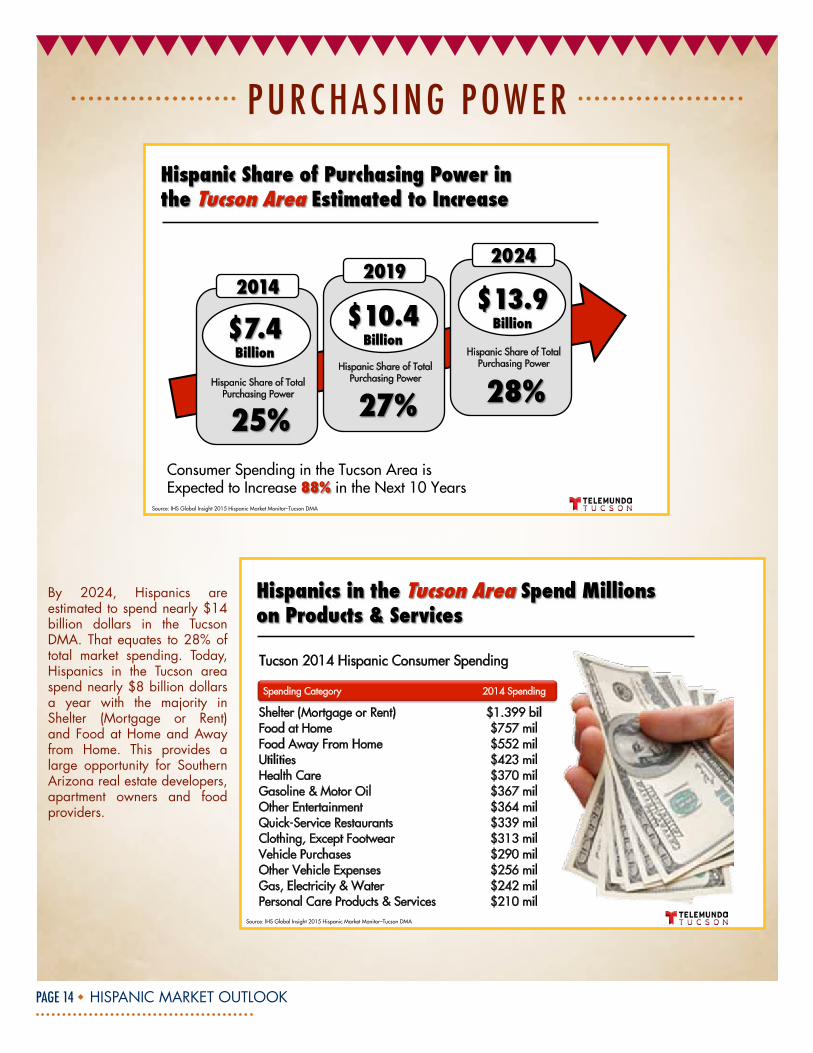
Hispanic Share of Total Purchasing Power
Source: IHS Global Insight 2015 Hispanic Market Monitor–Tucson DMA
Hispanic Share of Total Purchasing Power
Hispanic Share of Total Purchasing Power
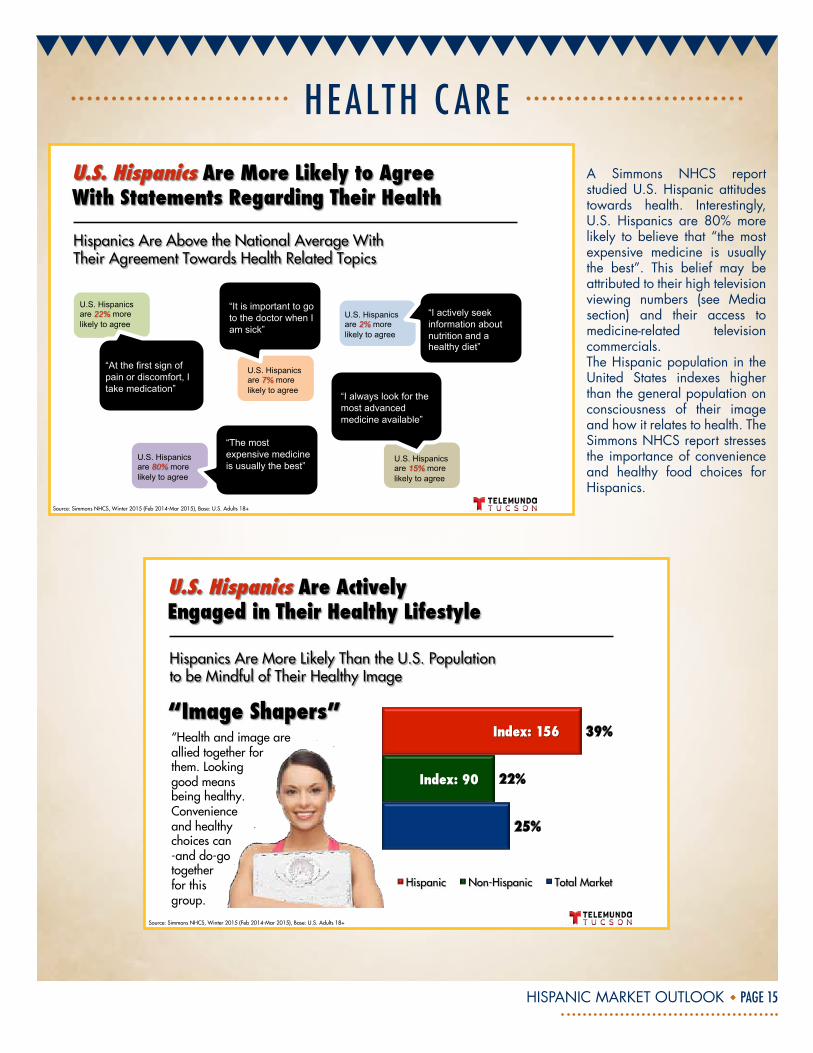
Spending Category 2014 Spending
Shelter (Mortgage or Rent) $1.399 bil Food at Home $757 mil Food Away From Home $552 mil Utilities $423 mil Health Care $370 mil Gasoline & Motor Oil $367 mil Other Entertainment $364 mil Quick-Service Restaurants $339 mil Clothing, Except Footwear $313 mil Vehicle Purchases $290 mil Other Vehicle Expenses $256 mil Gas, Electricity & Water $242 mil Personal Care Products & Services $210 mil
Source: IHS Global Insight 2015 Hispanic Market Monitor–Tucson DMA
Tucson 2014 Hispanic Consumer Spending
By 2024, Hispanics are estimated to spend nearly $14 billion dollars in the Tucson DMA. That equates to 28% of total market spending. Today, Hispanics in the Tucson area spend nearly $8 billion dollars a year with the majority in Shelter (Mortgage or Rent) and Food at Home and Away from Home. This provides a large opportunity for Southern Arizona real estate developers, apartment owners and food providers.
HISPANIC MARKET OUTLOOK PAGE 15
hEAlth c ARE
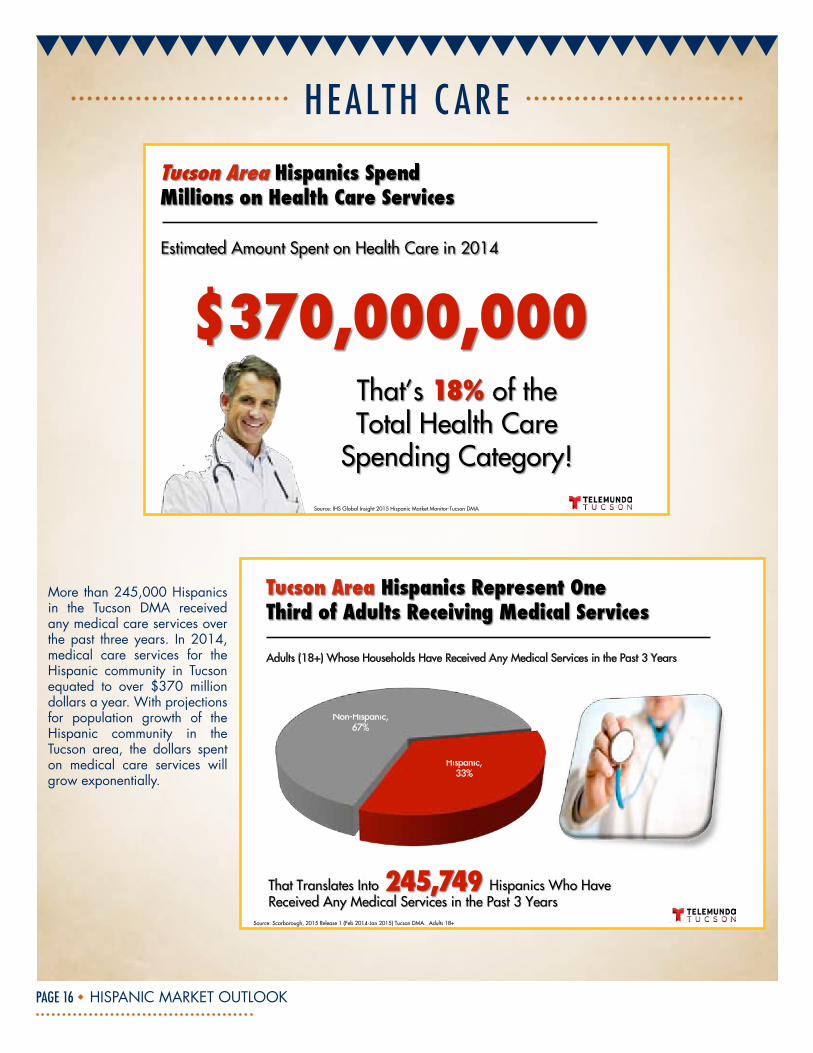
“At the first sign of pain or discomfort, I take medication”
“It is important to go to the doctor when I am sick”
“I actively seek information about nutrition and a healthy diet”
“I always look for the most advanced medicine available”
“The most expensive medicine is usually the best”
Source: Simmons NHCS, Winter 2015 (Feb 2014-Mar 2015), Base: U.S. Adults 18+
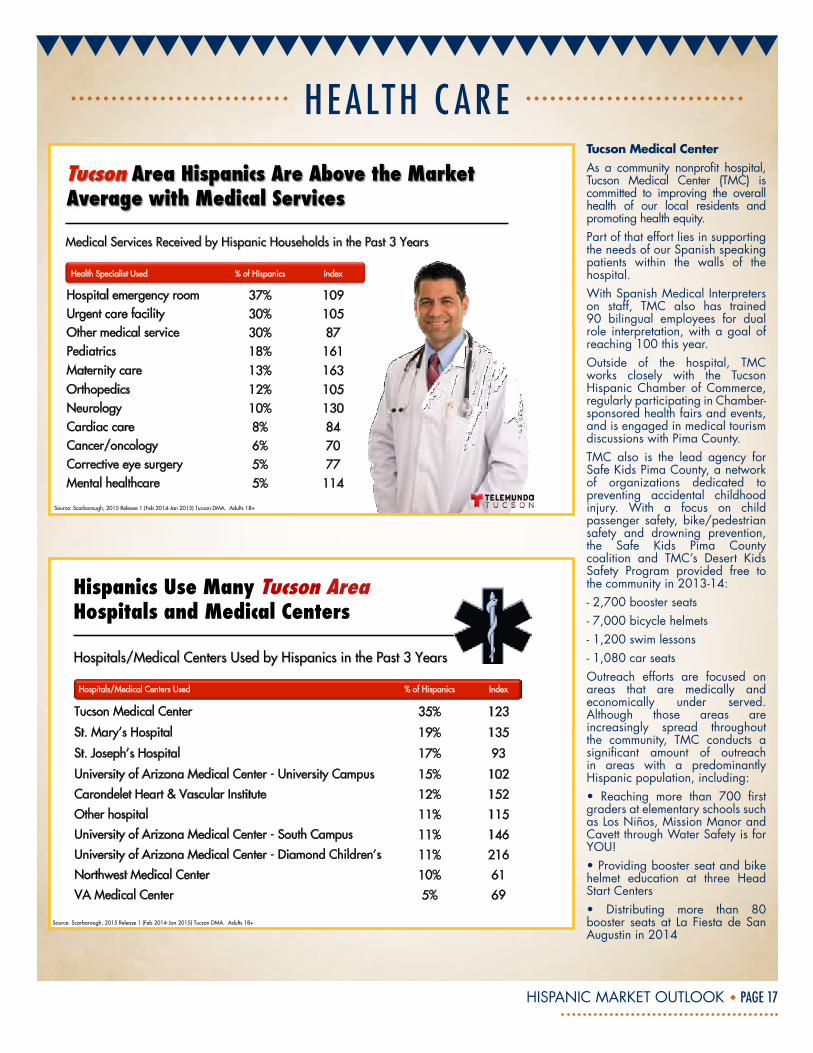
“Health and image are allied together for them. Looking good means being healthy. Convenience and healthy choices can -and do-go together for this group.
25%
22%
39%
Source: Simmons NHCS, Winter 2015 (Feb 2014-Mar 2015), Base: U.S. Adults 18+
A Simmons NHCS report studied U.S. Hispanic attitudes towards health. Interestingly, U.S. Hispanics are 80% more likely to believe that “the most expensive medicine is usually the best”. This belief may be attributed to their high television viewing numbers (see Media section) and their access to medicine-related television commercials. The Hispanic population in the United States indexes higher than the general population on consciousness of their image and how it relates to health. The Simmons NHCS report stresses the importance of convenience and healthy food choices for Hispanics.
HISPANIC MARKET OUTLOOK PAGE 16
hEAlth c ARE
Source: IHS Global Insight 2015 Hispanic Market Monitor-Tucson DMA
Hispanic, 33%
Non-Hispanic, 67%
Adults (18+) Whose Households Have Received Any Medical Services in the Past 3 Years
Source: Scarborough, 2015 Release 1 (Feb 2014-Jan 2015) Tucson DMA. Adults 18+
More than 245,000 Hispanics in the Tucson DMA received any medical care services over the past three years. In 2014, medical care services for the Hispanic community in Tucson equated to over $370 million dollars a year. With projections for population growth of the Hispanic community in the Tucson area, the dollars spent on medical care services will grow exponentially.
HISPANIC MARKET OUTLOOK PAGE 17
hEAlth c ARE
Health Specialist Used % of Hispanics Index
Hospital emergency room 37% 109 Urgent care facility 30% 105 Other medical service 30% 87 Pediatrics 18% 161 Maternity care 13% 163 Orthopedics 12% 105 Neurology 10% 130 Cardiac care 8% 84 Cancer/oncology 6% 70 Corrective eye surgery 5% 77 Mental healthcare 5% 114
Source: Scarborough, 2015 Release 1 (Feb 2014-Jan 2015) Tucson DMA. Adults 18+
Hospitals/Medical Centers Used % of Hispanics Index
Tucson Medical Center 35% 123
St. Mary's Hospital 19% 135
St. Joseph's Hospital 17% 93
University of Arizona Medical Center - University Campus 15% 102 Carondelet Heart & Vascular Institute 12% 152 Other hospital 11% 115 University of Arizona Medical Center - South Campus 11% 146 University of Arizona Medical Center - Diamond Children's 11% 216 Northwest Medical Center 10% 61 VA Medical Center 5% 69
Hispanics Use Many Tucson Area Hospitals and Medical Centers
Source: Scarborough, 2015 Release 1 (Feb 2014-Jan 2015) Tucson DMA. Adults 18+
Tucson Medical CenterAs a community nonprofit hospital, Tucson Medical Center (TMC) is committed to improving the overall health of our local residents and promoting health equity.Part of that effort lies in supporting the needs of our Spanish speaking patients within the walls of the hospital.With Spanish Medical Interpreters on staff, TMC also has trained 90 bilingual employees for dual role interpretation, with a goal of reaching 100 this year. Outside of the hospital, TMC works closely with the Tucson Hispanic Chamber of Commerce, regularly participating in Chamber-sponsored health fairs and events, and is engaged in medical tourism discussions with Pima County.TMC also is the lead agency for Safe Kids Pima County, a network of organizations dedicated to preventing accidental childhood injury. With a focus on child passenger safety, bike/pedestrian safety and drowning prevention, the Safe Kids Pima County coalition and TMC’s Desert Kids Safety Program provided free to the community in 2013-14: - 2,700 booster seats- 7,000 bicycle helmets- 1,200 swim lessons- 1,080 car seatsOutreach efforts are focused on areas that are medically and economically under served. Although those areas are increasingly spread throughout the community, TMC conducts a significant amount of outreach in areas with a predominantly Hispanic population, including: • Reaching more than 700 firstgraders at elementary schools such as Los Niños, Mission Manor and Cavett through Water Safety is for YOU!•Providingboosterseatandbikehelmet education at three Head Start Centers• Distributing more than 80booster seats at La Fiesta de San Augustin in 2014
HISPANIC MARKET OUTLOOK PAGE 18
hEAlth c ARE
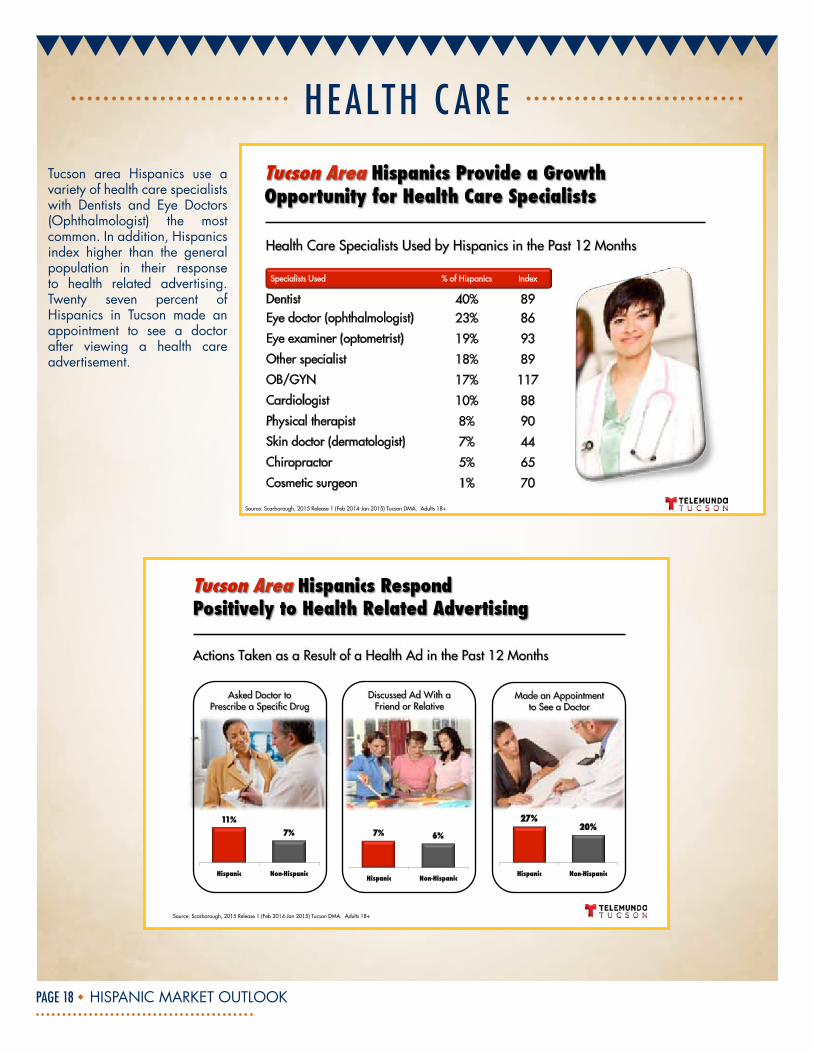
Specialists Used % of Hispanics Index
Dentist 40% 89 Eye doctor (ophthalmologist) 23% 86
Eye examiner (optometrist) 19% 93
Other specialist 18% 89
OB/GYN 17% 117
Cardiologist 10% 88
Physical therapist 8% 90
Skin doctor (dermatologist) 7% 44
Chiropractor 5% 65
Cosmetic surgeon 1% 70
Source: Scarborough, 2015 Release 1 (Feb 2014-Jan 2015) Tucson DMA. Adults 18+
Source: Scarborough, 2015 Release 1 (Feb 2014-Jan 2015) Tucson DMA. Adults 18+
11%7%
Hispanic Non-Hispanic
7% 6%
Hispanic Non-Hispanic
27%20%
Hispanic Non-Hispanic
Tucson area Hispanics use a variety of health care specialists with Dentists and Eye Doctors (Ophthalmologist) the most common. In addition, Hispanics index higher than the general population in their response to health related advertising. Twenty seven percent of Hispanics in Tucson made an appointment to see a doctor after viewing a health care advertisement.
HISPANIC MARKET OUTLOOK PAGE 19
hEAlth c ARE
Source: Scarborough, 2015 Release 1 (Feb 2014-Jan 2015) Tucson DMA. Adults 18+
7%
23%
19% 17%
15% 12%
4% 1%
24%
33%
16% 18%
7% 8%
4%
PPO Medicare Other HMO Medicaid Military POS
Hispanic Non-HispanicSource: Scarborough, 2015 Release 1 (Feb 2014-Jan 2015) Tucson DMA. Adults 18+
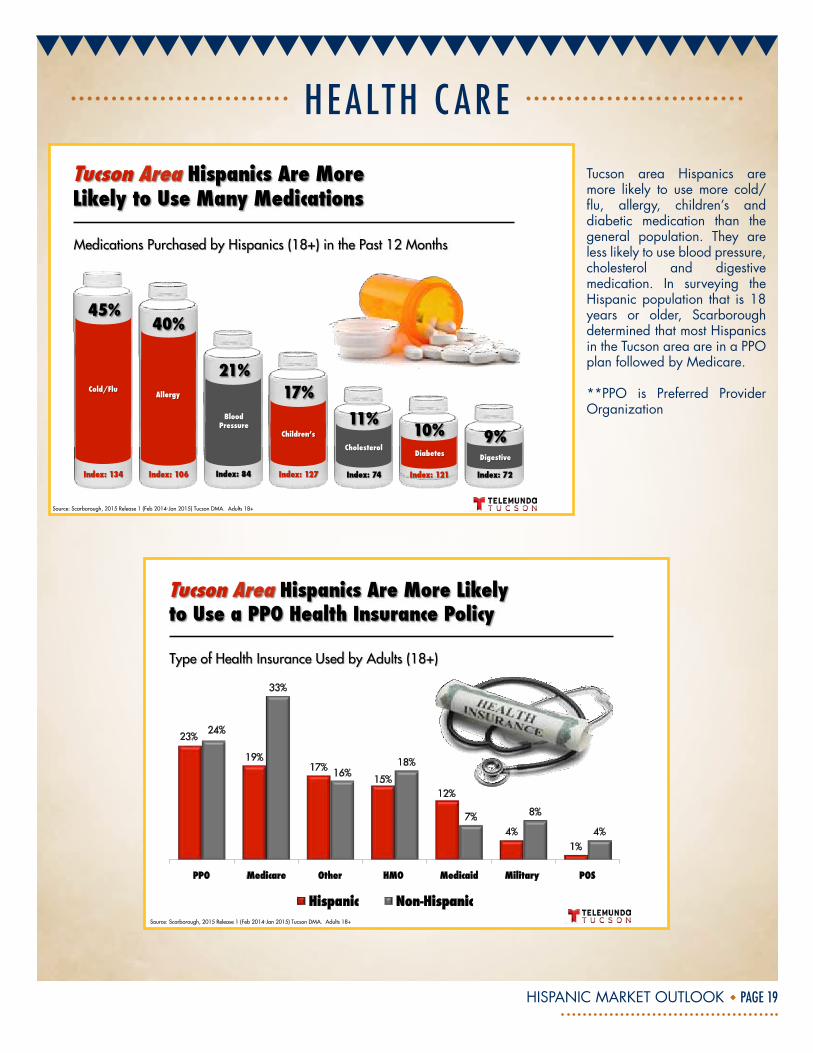
Tucson area Hispanics are more likely to use more cold/flu, allergy, children’s and diabetic medication than the general population. They are less likely to use blood pressure, cholesterol and digestive medication. In surveying the Hispanic population that is 18 years or older, Scarborough determined that most Hispanics in the Tucson area are in a PPO plan followed by Medicare.
**PPO is Preferred Provider Organization
HISPANIC MARKET OUTLOOK PAGE 20
hEAlth c ARE
24%
3%
7%
11%
8%
18%
28%
25%
2%
4%
5%
8%
15%
24%
Hispanic Non-Hispanic
OTHER
Source: Scarborough, 2015 Release 1 (Feb 2014-Jan 2015) Tucson DMA. Adults 18+
United Healthcare
Blue Cross/Blue Shield
Health Net
CIGNA
Aetna
Aflac
Other Provider
10%
45%
5%2%
21%
0%
Any Health Insurance
Individual Health Insurance
Group Health Insurance
Hispanic Non-Hispanic
Source: Scarborough, 2014 Release 1 (Feb 2013-Jan 2014) & 2015 Release 1 (Feb 2014-Jan 2015) Tucson DMA. Adults 18+
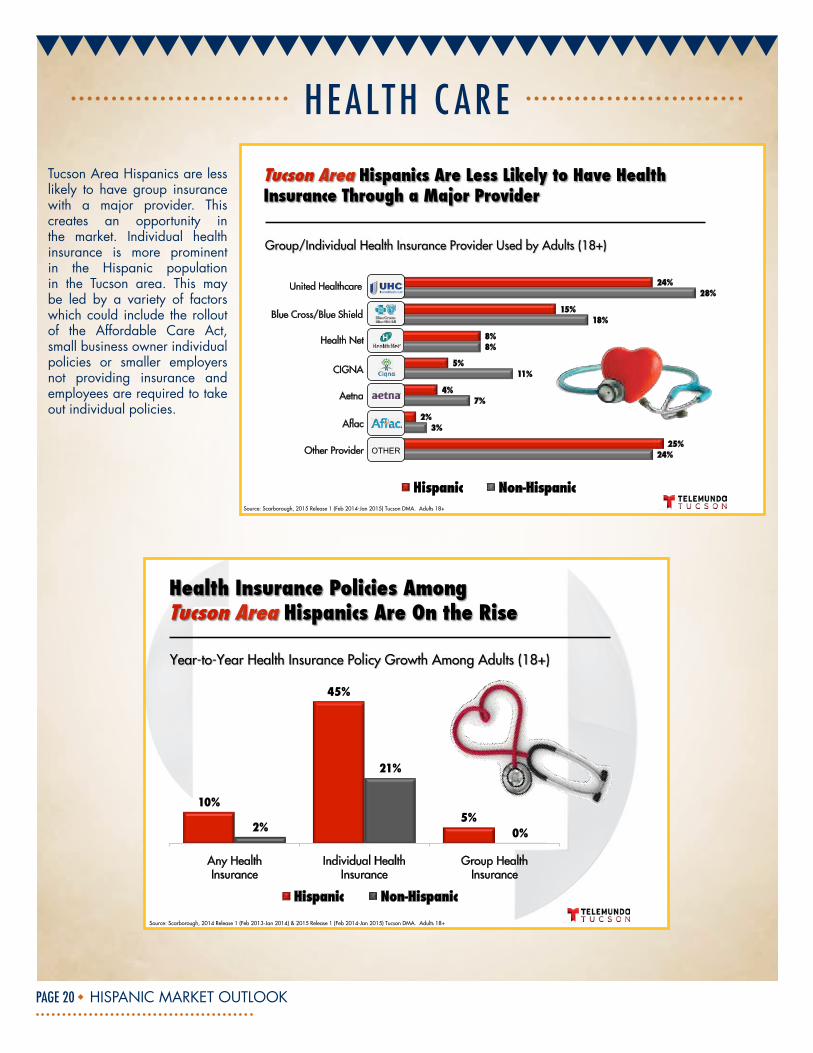
Tucson Area Hispanics are less likely to have group insurance with a major provider. This creates an opportunity in the market. Individual health insurance is more prominent in the Hispanic population in the Tucson area. This may be led by a variety of factors which could include the rollout of the Affordable Care Act, small business owner individual policies or smaller employers not providing insurance and employees are required to take out individual policies.
HISPANIC MARKET OUTLOOK PAGE 21
hEAlth c ARE
Hispanic, 65%
Non-Hispanic, 35%
Source: Scarborough, 2014 Release 1 (Feb 2013-Jan 2014) & 2015 Release 1 (Feb 2014-Jan 2015) Tucson DMA. Adults 18+
CareMore CareMore (www.caremore.com) is a Medicare Advantage Health Plan that provides focused and innovative approaches to the complex problems of aging. The founding physicians created the basis for the company twenty years ago. CareMore is also a community-focused healthcare delivery system that serves the community and our members by prolonging active and independent lives. Our CareMore Care Centers, in strategic locations within our coverage areas, serve as a physical manifestation of our Model of Care. Many of our Care Centers also have senior-focused gyms attached or adjacent to our clinic space. These are aptly named Nifty After Fifty (www.niftyafterfifty.com) locations.We serve caregivers and families by providing support, education, and access to services. CareMore’s holistic approach to the wellness of our seniors also protects the precious financial resources of seniors and the Medicare program through innovative methods of managing chronic disease, frailty, and end of life.CareMore’s outreach within the Hispanic Community includes a focus on educating and providing health and wellness information related to Medicare-eligible seniors in Arizona. We deliver knowledge via social and educational events, cooking demonstrations, exercise, and other health-related services. Our message is that we want to not only empower our communities, but give seniors the most important aspect of aging - DIGNITY.Our services and outreach to the Hispanic Community have included local events and opportunities to educate diverse communities. We have worked with organizations such as the Tucson Hispanic Chamber, Marana Health Centers, El Rio Community Clinics/Centers, American Diabetes Association’s Step Out Walk, Better Breathers Clubs in partnership with the American Lung Association, El Pueblo Community Center, City of Tucson, City of South Tucson, and the Community Food Bank. CareMore has been a proud sponsor for Arizona Bilingual’s Back to School program, Grandparents’ Day at the Tucson Children’s Museum, and our signature community forums known as Mas Por Su Medicare in partnership with Univision and Pima Council On Aging (PCOA).We are a company that is proud to give back and serve the Hispanic Community. Please consider us your community partner for all your endeavors now and in the future.
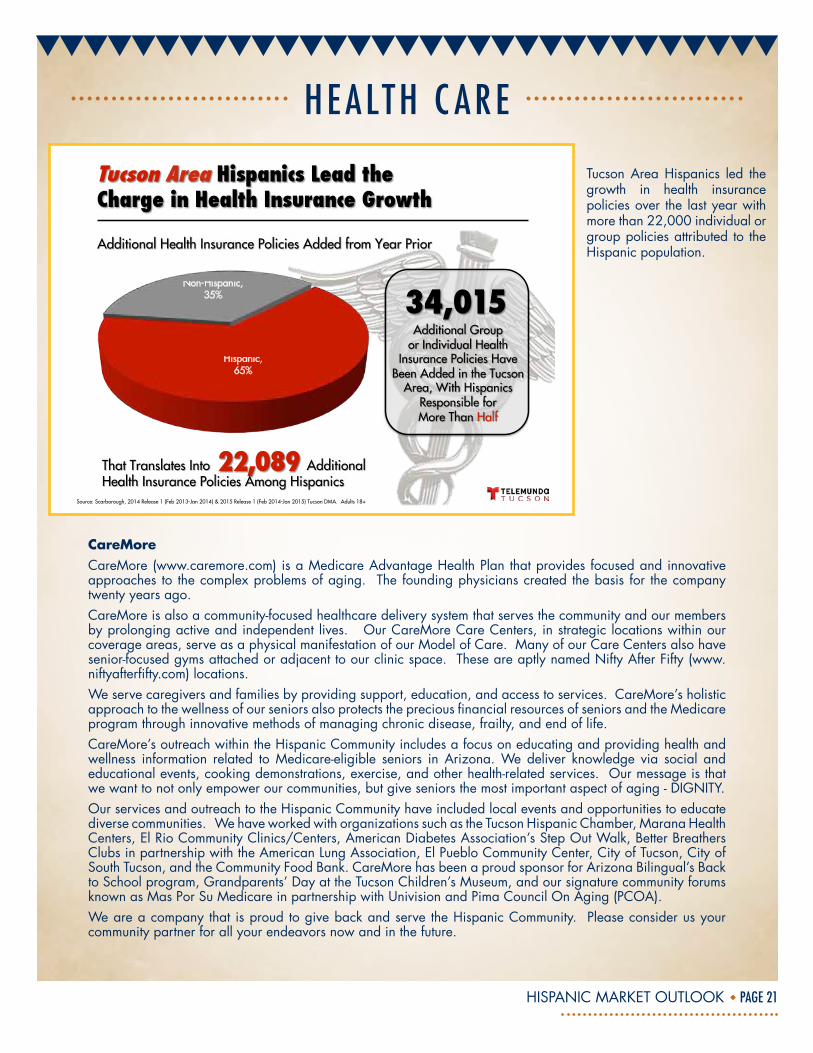
Tucson Area Hispanics led the growth in health insurance policies over the last year with more than 22,000 individual or group policies attributed to the Hispanic population.
HISPANIC MARKET OUTLOOK PAGE 22
L ANGUAGe & MeD IA
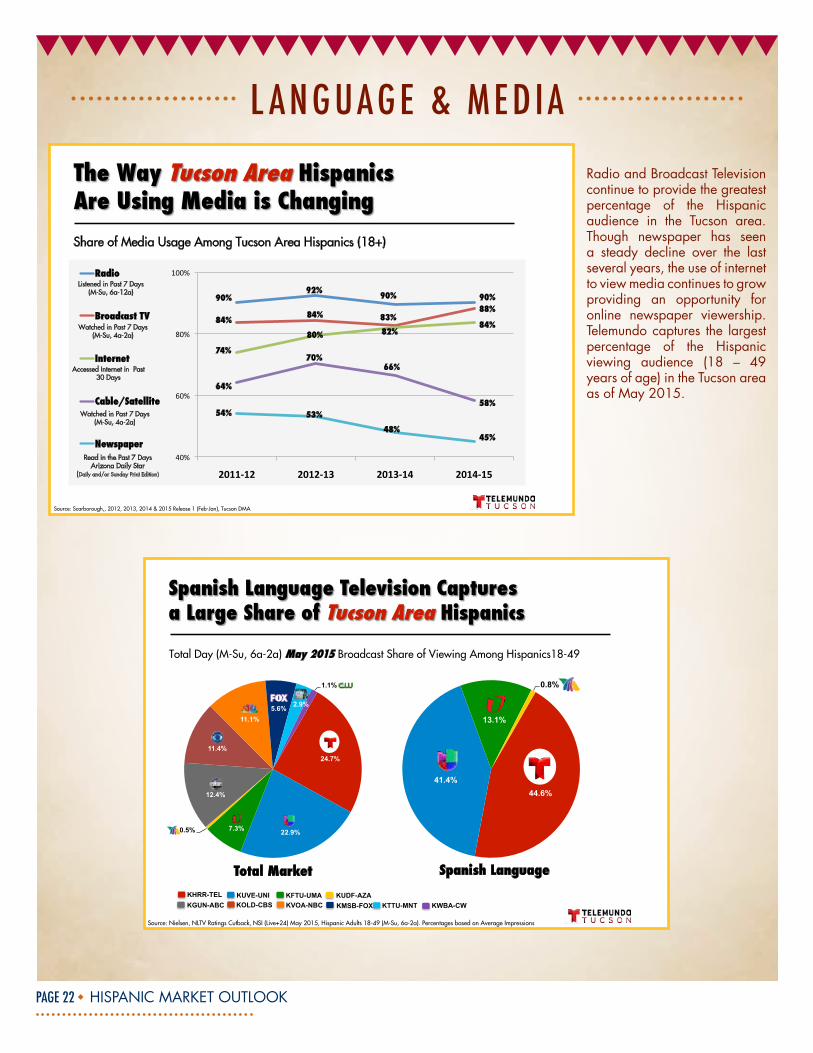
Share of Media Usage Among Tucson Area Hispanics (18+)
90%92% 90% 90%
84% 84% 83%88%
74%
80% 82%84%
64%
70%66%
58%54% 53%
48%45%
40%
60%
80%
100%
2011-‐12 2012-‐13 2013-‐14 2014-‐15
Radio
Broadcast TV
Internet
Cable/Satellite
Newspaper
Source: Scarborough,, 2012, 2013, 2014 & 2015 Release 1 (Feb-Jan), Tucson DMA
Listened in Past 7 Days (M-Su, 6a-12a)
Watched in Past 7 Days (M-Su, 4a-2a)
Watched in Past 7 Days (M-Su, 4a-2a)
Accessed Internet in Past 30 Days
Read in the Past 7 Days Arizona Daily Star
(Daily and/or Sunday Print Edition)
44.6% 41.4%
13.1%
0.8% 0
0
0
0 0
24.7%
22.9% 7.3% 0.5%
12.4%
11.4%
11.1% 5.6% 2.9%
1.1%
0 0
Total Day (M-Su, 6a-2a) May 2015 Broadcast Share of Viewing Among Hispanics18-49
Total Market Spanish Language
KWBA-CW KTTU-MNT KGUN-ABC KMSB-FOX KVOA-NBC KOLD-CBS KFTU-UMA KHRR-TEL KUVE-UNI KUDF-AZA
Source: Nielsen, NLTV Ratings Cutback, NSI (Live+24) May 2015, Hispanic Adults 18-49 (M-Su, 6a-2a). Percentages based on Average Impressions
Radio and Broadcast Television continue to provide the greatest percentage of the Hispanic audience in the Tucson area. Though newspaper has seen a steady decline over the last several years, the use of internet to view media continues to grow providing an opportunity for online newspaper viewership. Telemundo captures the largest percentage of the Hispanic viewing audience (18 – 49 years of age) in the Tucson area as of May 2015.
HISPANIC MARKET OUTLOOK PAGE 23
L ANGUAGe & MeD IA
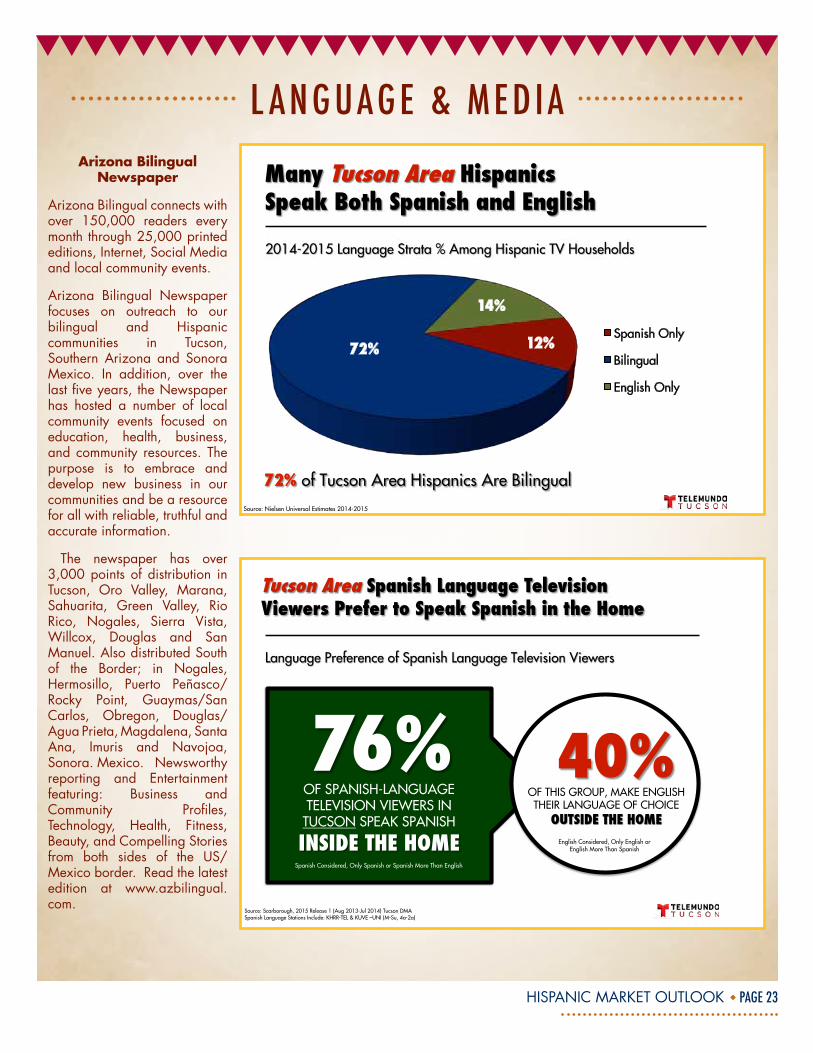
12%72%
14%
Spanish Only
Bilingual
English Only
Source: Nielsen Universal Estimates 2014-2015
Source: Scarborough, 2015 Release 1 (Aug 2013-Jul 2014) Tucson DMA Spanish Language Stations Include: KHRR-TEL & KUVE –UNI (M-Su, 4a-2a)
Spanish Considered, Only Spanish or Spanish More Than English
English Considered, Only English or English More Than Spanish
Arizona Bilingual Newspaper
Arizona Bilingual connects with over 150,000 readers every month through 25,000 printed editions, Internet, Social Media and local community events.
Arizona Bilingual Newspaper focuses on outreach to our bilingual and Hispanic communities in Tucson, Southern Arizona and Sonora Mexico. In addition, over the last five years, the Newspaper has hosted a number of local community events focused on education, health, business, and community resources. The purpose is to embrace and develop new business in our communities and be a resource for all with reliable, truthful and accurate information.
The newspaper has over 3,000 points of distribution in Tucson, Oro Valley, Marana, Sahuarita, Green Valley, Rio Rico, Nogales, Sierra Vista, Willcox, Douglas and San Manuel. Also distributed South of the Border; in Nogales,Hermosillo, Puerto Peñasco/Rocky Point, Guaymas/San Carlos, Obregon, Douglas/Agua Prieta, Magdalena, Santa Ana, Imuris and Navojoa, Sonora. Mexico. Newsworthy reporting and Entertainment featuring: Business and Community Profiles, Technology, Health, Fitness, Beauty, and Compelling Stories from both sides of the US/Mexico border. Read the latest edition at www.azbilingual.com.
HISPANIC MARKET OUTLOOK PAGE 24
L ANGUAGe & MeD IA
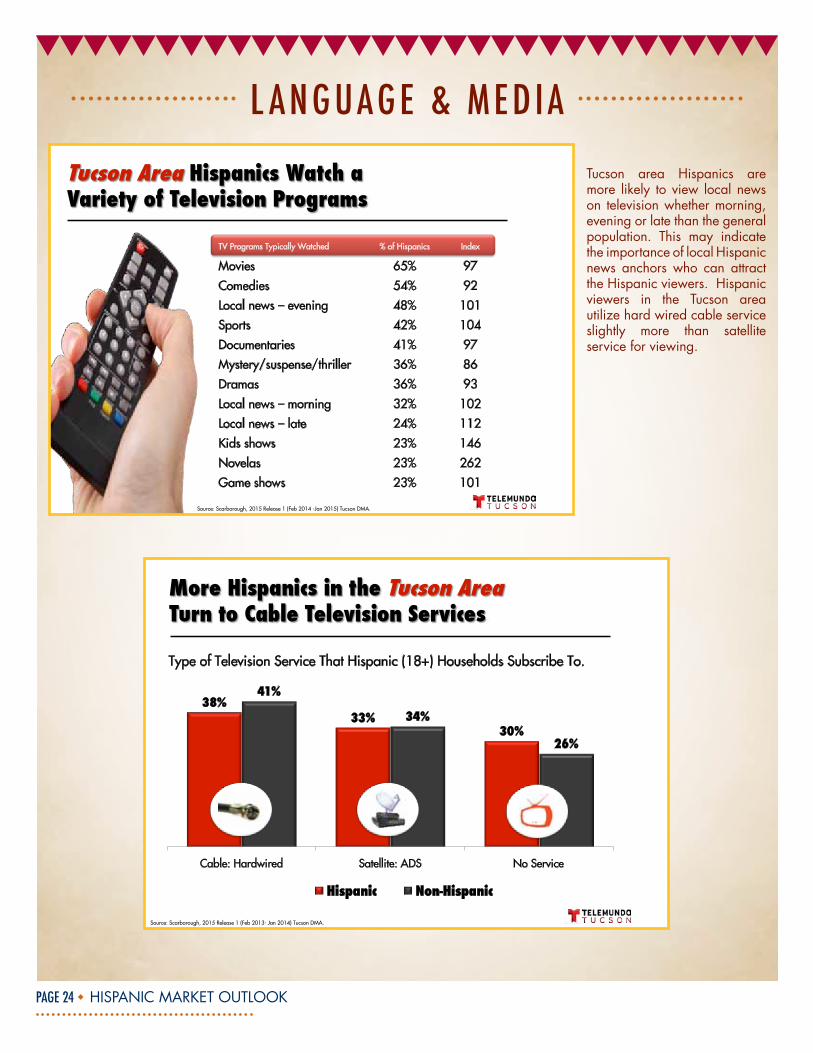
TV Programs Typically Watched % of Hispanics Index
Movies 65% 97 Comedies 54% 92 Local news – evening 48% 101 Sports 42% 104 Documentaries 41% 97 Mystery/suspense/thriller 36% 86 Dramas 36% 93 Local news – morning 32% 102 Local news – late 24% 112 Kids shows 23% 146 Novelas 23% 262 Game shows 23% 101
Source: Scarborough, 2015 Release 1 (Feb 2014 -Jan 2015) Tucson DMA.
38%33%
30%
41%
34%
26%
Cable: Hardwired Satellite: ADS No Service
Hispanic Non-Hispanic
Type of Television Service That Hispanic (18+) Households Subscribe To.
Source: Scarborough, 2015 Release 1 (Feb 2013- Jan 2014) Tucson DMA.
Tucson area Hispanics are more likely to view local news on television whether morning, evening or late than the general population. This may indicate the importance of local Hispanic news anchors who can attract the Hispanic viewers. Hispanic viewers in the Tucson area utilize hard wired cable service slightly more than satellite service for viewing.
HISPANIC MARKET OUTLOOK PAGE 25
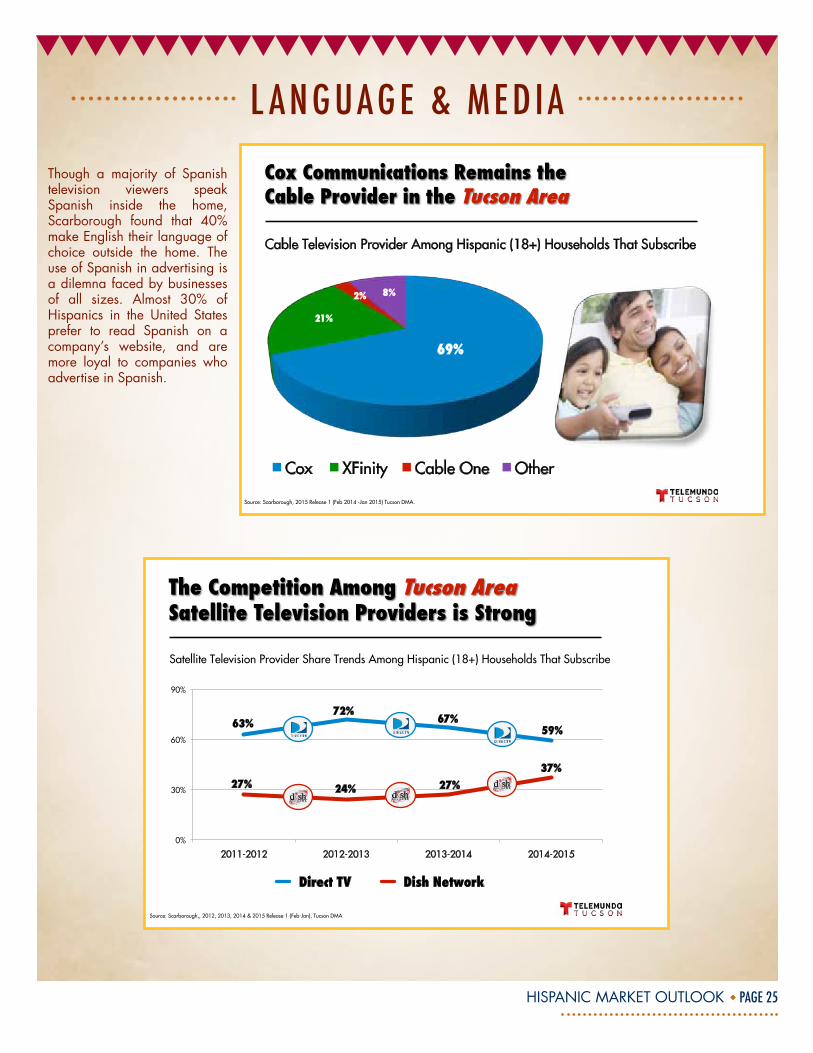
L ANGUAGe & MeD IAThough a majority of Spanish television viewers speak Spanish inside the home, Scarborough found that 40% make English their language of choice outside the home. The use of Spanish in advertising is a dilemna faced by businesses of all sizes. Almost 30% of Hispanics in the United States prefer to read Spanish on a company’s website, and are more loyal to companies who advertise in Spanish.
69%
21%
2% 8%
Cox XFinity Cable One Other
Cable Television Provider Among Hispanic (18+) Households That Subscribe
Source: Scarborough, 2015 Release 1 (Feb 2014 -Jan 2015) Tucson DMA.
Satellite Television Provider Share Trends Among Hispanic (18+) Households That Subscribe
Source: Scarborough,, 2012, 2013, 2014 & 2015 Release 1 (Feb-Jan), Tucson DMA
63%72%
67%59%
27% 24% 27%37%
0%
30%
60%
90%
2011-2012 2012-2013 2013-2014 2014-2015
Direct TV Dish Network
HISPANIC MARKET OUTLOOK PAGE 26
L ANGUAGe & MeD IA
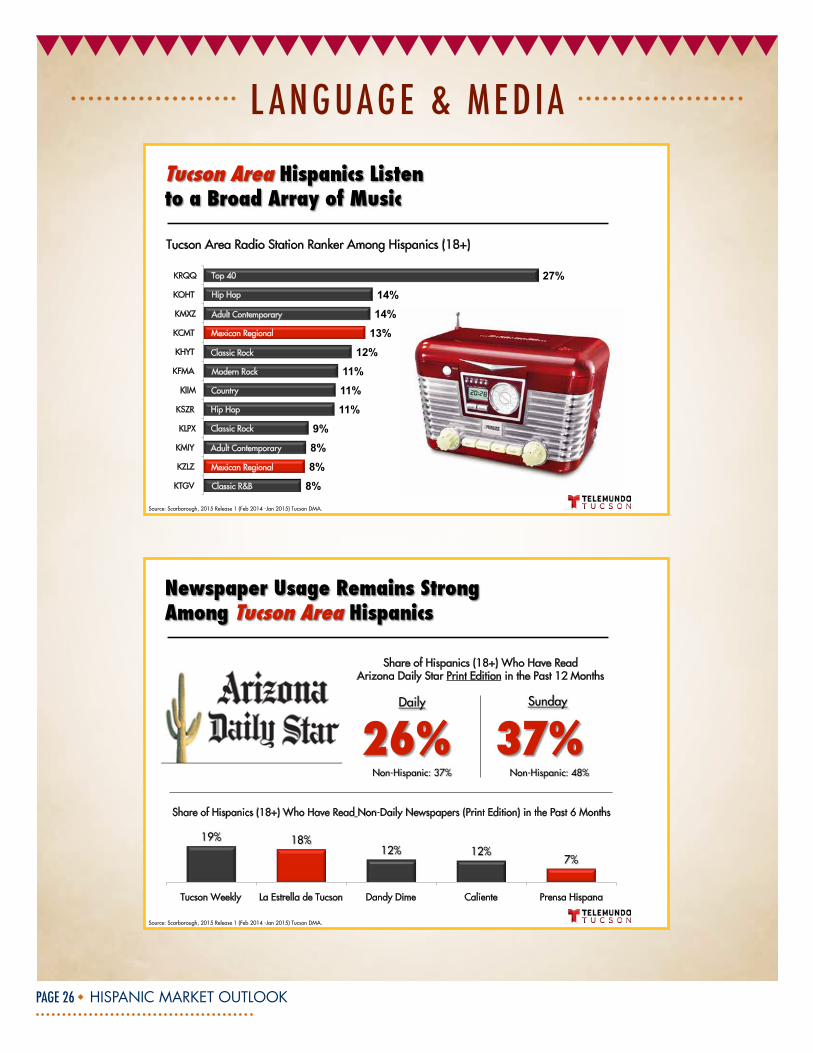
Tucson Area Radio Station Ranker Among Hispanics (18+)
8%
8%
8%
9%
11%
11%
11%
12%
13%
14%
14%
27%
KTGV
KZLZ
KMIY
KLPX
KSZR
KIIM
KFMA
KHYT
KCMT
KMXZ
KOHT
KRQQ Top 40
Hip Hop
Adult Contemporary
Mexican Regional
Classic Rock
Modern Rock
Country
Hip Hop
Classic Rock
Mexican Regional
Adult Contemporary
Classic R&B
Source: Scarborough, 2015 Release 1 (Feb 2014 -Jan 2015) Tucson DMA.
Tucson Weekly La Estrella de Tucson Dandy Dime Caliente Prensa Hispana
Source: Scarborough, 2015 Release 1 (Feb 2014 -Jan 2015) Tucson DMA.
Share of Hispanics (18+) Who Have Read Arizona Daily Star Print Edition in the Past 12 Months
Share of Hispanics (18+) Who Have Read Non-Daily Newspapers (Print Edition) in the Past 6 Months
HISPANIC MARKET OUTLOOK PAGE 27
b IR th RAtE
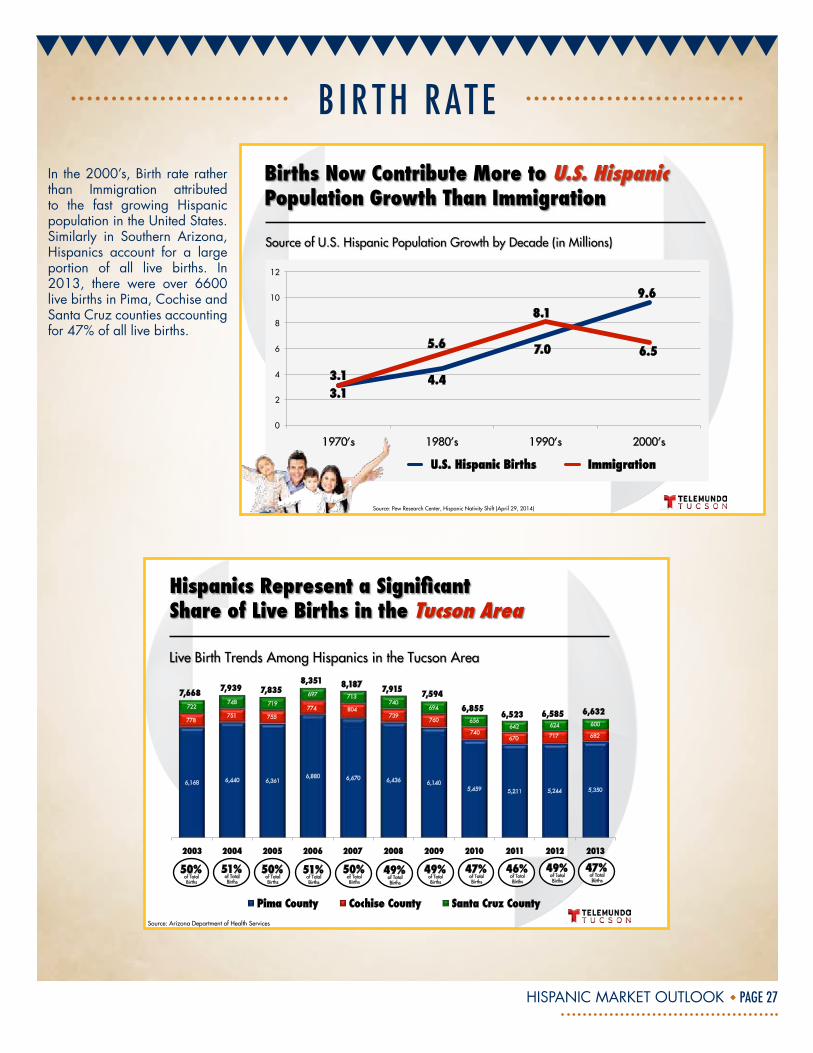
3.14.4
7.0
9.6
3.1
5.6
8.1
6.5
0
2
4
6
8
10
12
1970's 1980's 1990's 2000's
U.S. Hispanic Births Immigration
Source: Pew Research Center, Hispanic Nativity Shift (April 29, 2014)
6,168 6,440 6,361 6,880 6,670 6,436 6,140
5,459 5,211 5,244 5,350
778 751 755
774 804 739
760
740 670 717 682
722 748 719
697 713 740
694
656 642 624 600
2003 2004 2005 2006 2007 2008 2009 2010 2011 2012 2013
Pima County Cochise County Santa Cruz County
7,668 7,939 7,8358,351 8,187 7,915 7,594
6,8556,523 6,585 6,632
Source: Arizona Department of Health Services
51%50%of Total Births
of Total Births
50%of Total Births
50%of Total Births
49%of Total Births
49%of Total Births
47%of Total Births
46%of Total Births
49%of Total Births
47%of Total Births
51%of Total Births
In the 2000’s, Birth rate rather than Immigration attributed to the fast growing Hispanic population in the United States. Similarly in Southern Arizona, Hispanics account for a large portion of all live births. In 2013, there were over 6600 live births in Pima, Cochise and Santa Cruz counties accounting for 47% of all live births.
HISPANIC MARKET OUTLOOK PAGE 28
b IR th RAtE
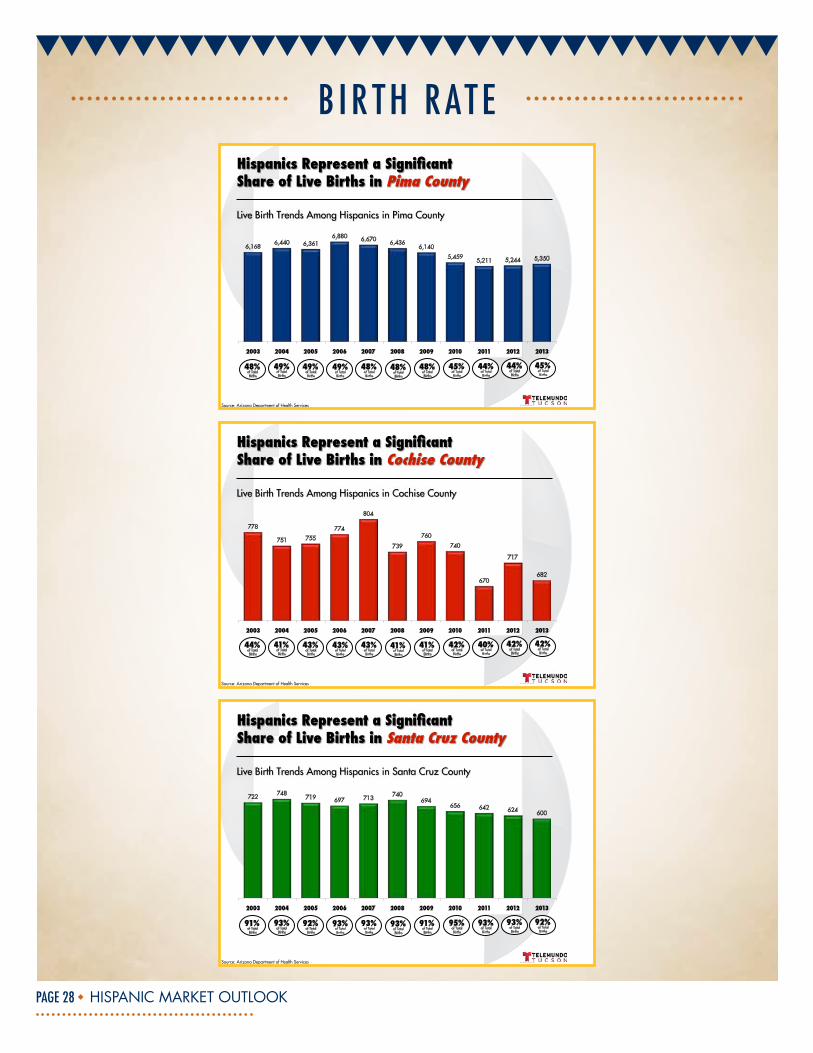
6,168 6,440 6,361
6,880 6,670 6,436 6,140
5,459 5,211 5,244 5,350
2003 2004 2005 2006 2007 2008 2009 2010 2011 2012 2013
Source: Arizona Department of Health Services
49%48%of Total Births
of Total Births
49%of Total Births
48%of Total Births
48%of Total Births
48%of Total Births
45%of Total Births
44%of Total Births
44%of Total Births
45%of Total Births
49%of Total Births
778
751 755 774
804
739
760
740
670
717
682
2003 2004 2005 2006 2007 2008 2009 2010 2011 2012 2013
Source: Arizona Department of Health Services
41%44%of Total Births
of Total Births
43%of Total Births
43%of Total Births
41%of Total Births
41%of Total Births
42%of Total Births
40%of Total Births
42%of Total Births
42%of Total Births
43%of Total Births
722 748 719 697 713 740
694 656 642 624 600
2003 2004 2005 2006 2007 2008 2009 2010 2011 2012 2013
Source: Arizona Department of Health Services
93%91%of Total Births
of Total Births
92%of Total Births
93%of Total Births
93%of Total Births
91%of Total Births
95%of Total Births
93%of Total Births
93%of Total Births
92%of Total Births
93%of Total Births
HISPANIC MARKET OUTLOOK PAGE 29
eDUC AT ION
College Enrollment Among Hispanics is Growing
“I always look for the most advanced medicine available”
Hispanics Are Behind in Obtaining 4-Year Degrees
Hispanics Are Less Likely to Have Student Loan Debt
Hispanics Are More Likely to Attend a 2-Year Public College
Hispanic Dropout Rates Have Dropped Considerably
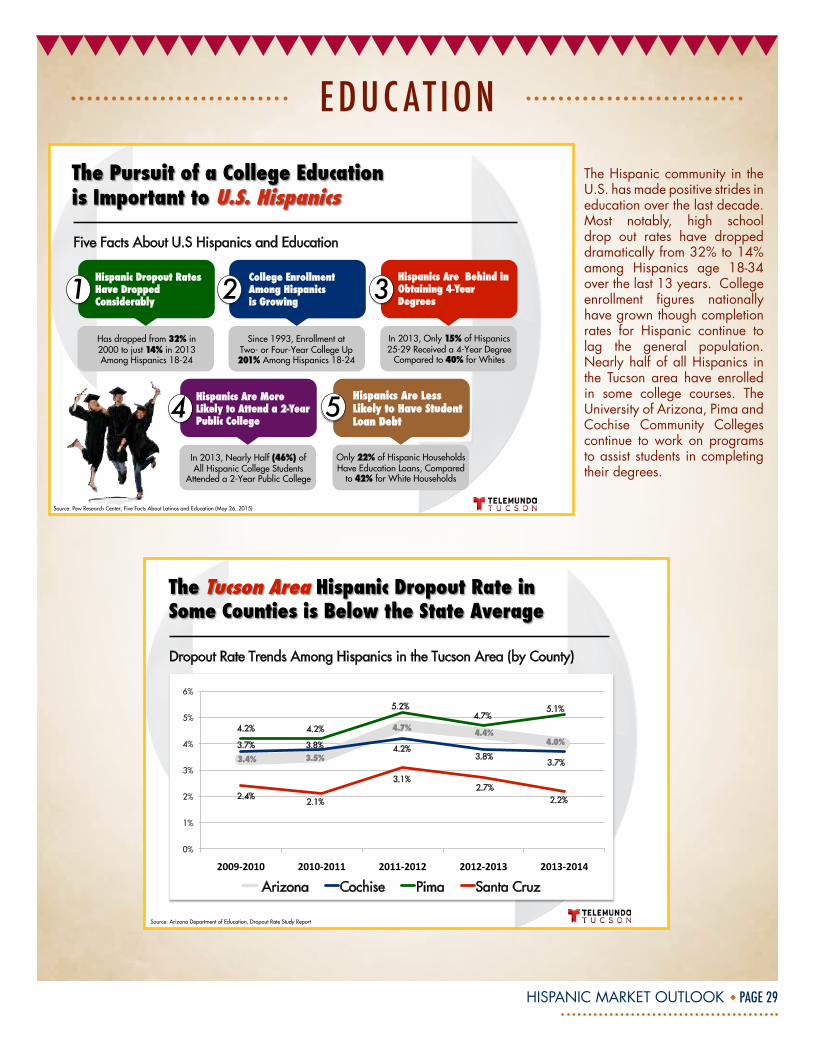
Five Facts About U.S Hispanics and Education
Has dropped from 32% in 2000 to just 14% in 2013 Among Hispanics 18-24
Since 1993, Enrollment at Two- or Four-Year College Up 201% Among Hispanics 18-24
In 2013, Only 15% of Hispanics 25-29 Received a 4-Year Degree
Compared to 40% for Whites
In 2013, Nearly Half (46%) of All Hispanic College Students
Attended a 2-Year Public College
Only 22% of Hispanic Households Have Education Loans, Compared
to 42% for White Households
Source: Pew Research Center, Five Facts About Latinos and Education (May 26, 2015)
Source: Arizona Department of Education, Dropout Rate Study Report
3.4% 3.5%
4.7% 4.4%4.0%3.7% 3.8% 4.2%
3.8% 3.7%
4.2% 4.2%
5.2% 4.7%
5.1%
2.4% 2.1%
3.1% 2.7%
2.2%
0%
1%
2%
3%
4%
5%
6%
2009-‐2010 2010-‐2011 2011-‐2012 2012-‐2013 2013-‐2014
Arizona Cochise Pima Santa Cruz
Dropout Rate Trends Among Hispanics in the Tucson Area (by County)
The Hispanic community in the U.S. has made positive strides in education over the last decade. Most notably, high school drop out rates have dropped dramatically from 32% to 14% among Hispanics age 18-34 over the last 13 years. College enrollment figures nationally have grown though completion rates for Hispanic continue to lag the general population. Nearly half of all Hispanics in the Tucson area have enrolled in some college courses. The University of Arizona, Pima and Cochise Community Colleges continue to work on programs to assist students in completing their degrees.
1 2 3
4 5
HISPANIC MARKET OUTLOOK PAGE 30
eDUC AT ION
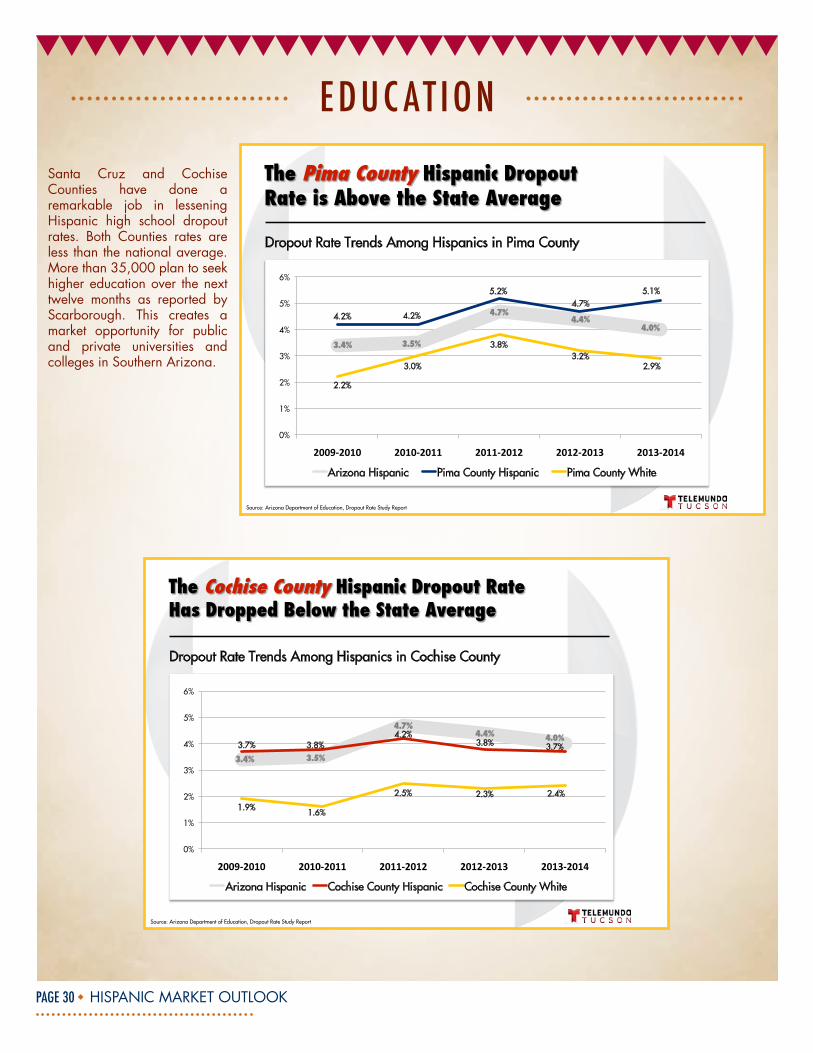
Source: Arizona Department of Education, Dropout Rate Study Report
3.4% 3.5%
4.7%4.4%
4.0%4.2% 4.2%
5.2% 4.7%
5.1%
2.2%
3.0%
3.8% 3.2%
2.9%
0%
1%
2%
3%
4%
5%
6%
2009-‐2010 2010-‐2011 2011-‐2012 2012-‐2013 2013-‐2014
Arizona Hispanic Pima County Hispanic Pima County White
Dropout Rate Trends Among Hispanics in Pima County
Source: Arizona Department of Education, Dropout Rate Study Report
3.4% 3.5%
4.7%4.4% 4.0%
3.7% 3.8% 4.2%
3.8% 3.7%
1.9% 1.6%
2.5% 2.3% 2.4%
0%
1%
2%
3%
4%
5%
6%
2009-‐2010 2010-‐2011 2011-‐2012 2012-‐2013 2013-‐2014
Arizona Hispanic Cochise County Hispanic Cochise County White
Dropout Rate Trends Among Hispanics in Cochise County
Santa Cruz and Cochise Counties have done a remarkable job in lessening Hispanic high school dropout rates. Both Counties rates are less than the national average. More than 35,000 plan to seek higher education over the next twelve months as reported by Scarborough. This creates a market opportunity for public and private universities and colleges in Southern Arizona.
HISPANIC MARKET OUTLOOK PAGE 31
eDUC AT ION
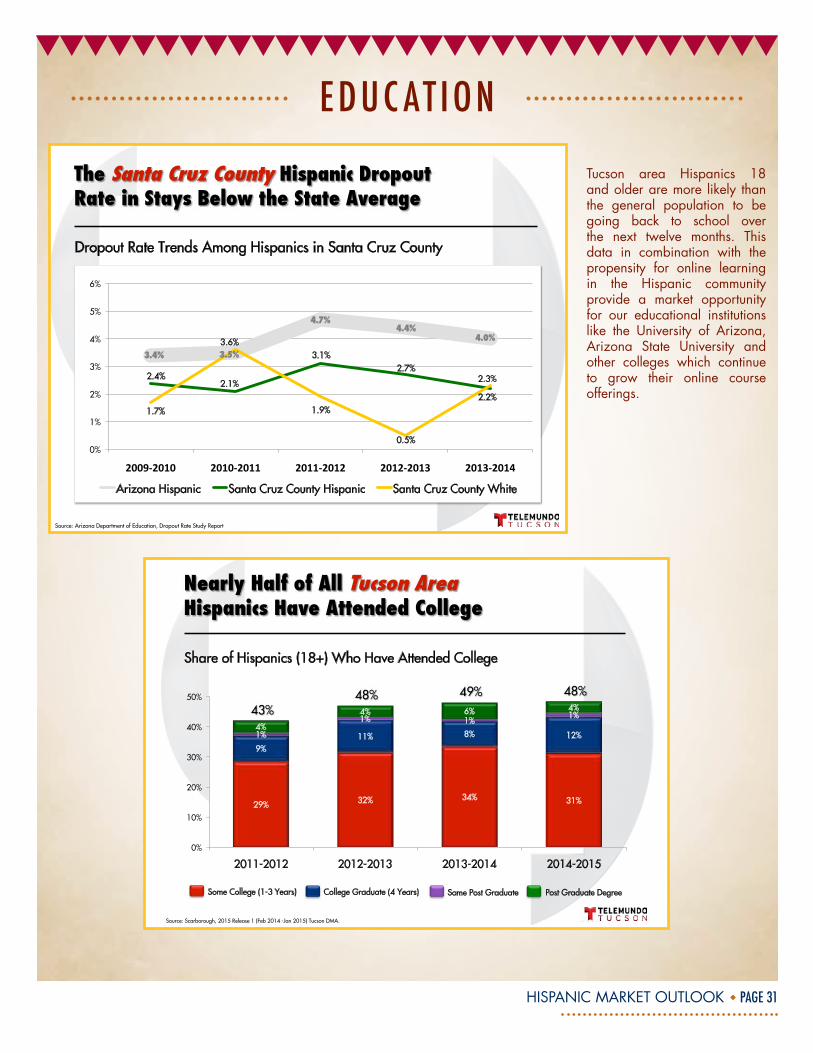
Source: Arizona Department of Education, Dropout Rate Study Report
3.4% 3.5%
4.7%4.4%
4.0%
2.4% 2.1%
3.1% 2.7%
2.2%
1.7%
3.6%
1.9%
0.5%
2.3%
0%
1%
2%
3%
4%
5%
6%
2009-‐2010 2010-‐2011 2011-‐2012 2012-‐2013 2013-‐2014
Arizona Hispanic Santa Cruz County Hispanic Santa Cruz County White
Dropout Rate Trends Among Hispanics in Santa Cruz County
29% 32% 34% 31%
9% 11% 8% 12% 1%
1% 1% 1%
4%
4% 6% 4%
0%
10%
20%
30%
40%
50%
2011-2012 2012-2013 2013-2014 2014-2015
Share of Hispanics (18+) Who Have Attended College
Some College (1-3 Years) College Graduate (4 Years) Some Post Graduate Post Graduate Degree
Source: Scarborough, 2015 Release 1 (Feb 2014 -Jan 2015) Tucson DMA.
Tucson area Hispanics 18 and older are more likely than the general population to be going back to school over the next twelve months. This data in combination with the propensity for online learning in the Hispanic community provide a market opportunity for our educational institutions like the University of Arizona, Arizona State University and other colleges which continue to grow their online course offerings.
HISPANIC MARKET OUTLOOK PAGE 32
eDUC AT ION
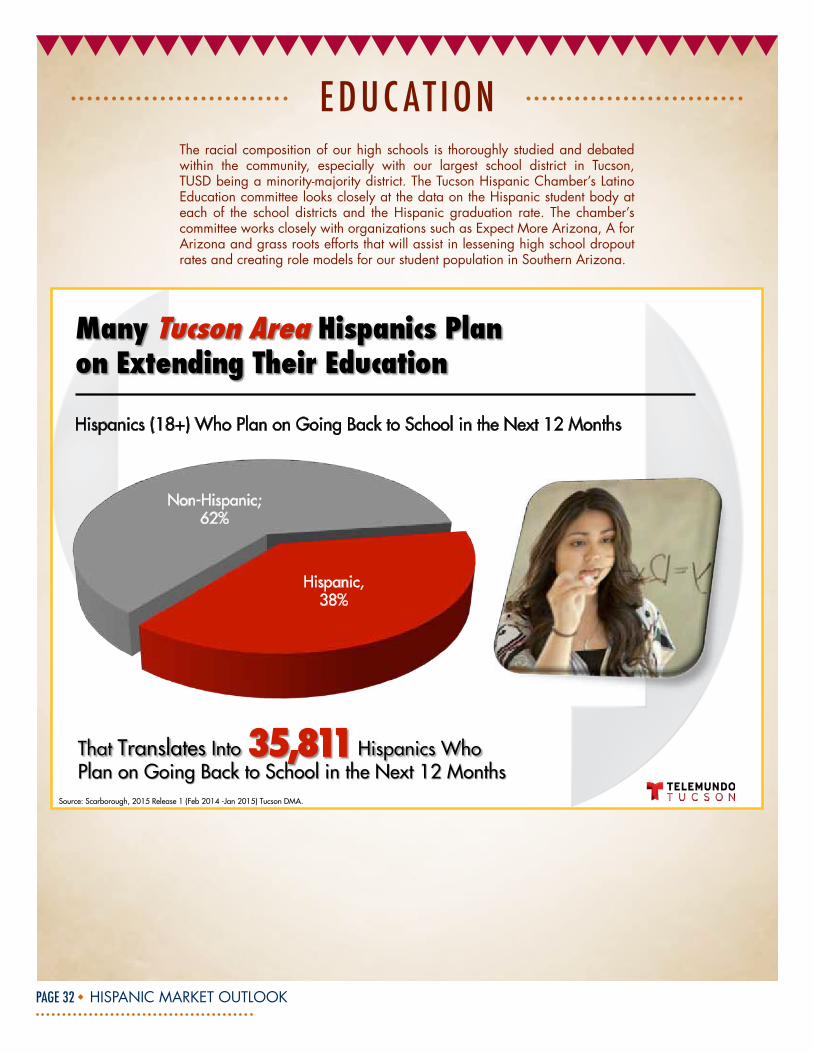
Hispanics (18+) Who Plan on Going Back to School in the Next 12 Months
Hispanic, 38%
Non-Hispanic; 62%
Source: Scarborough, 2015 Release 1 (Feb 2014 -Jan 2015) Tucson DMA.
The racial composition of our high schools is thoroughly studied and debated within the community, especially with our largest school district in Tucson, TUSD being a minority-majority district. The Tucson Hispanic Chamber’s Latino Education committee looks closely at the data on the Hispanic student body at each of the school districts and the Hispanic graduation rate. The chamber’s committee works closely with organizations such as Expect More Arizona, A for Arizona and grass roots efforts that will assist in lessening high school dropout rates and creating role models for our student population in Southern Arizona.
HISPANIC MARKET OUTLOOK PAGE 33
eDUC AT ION
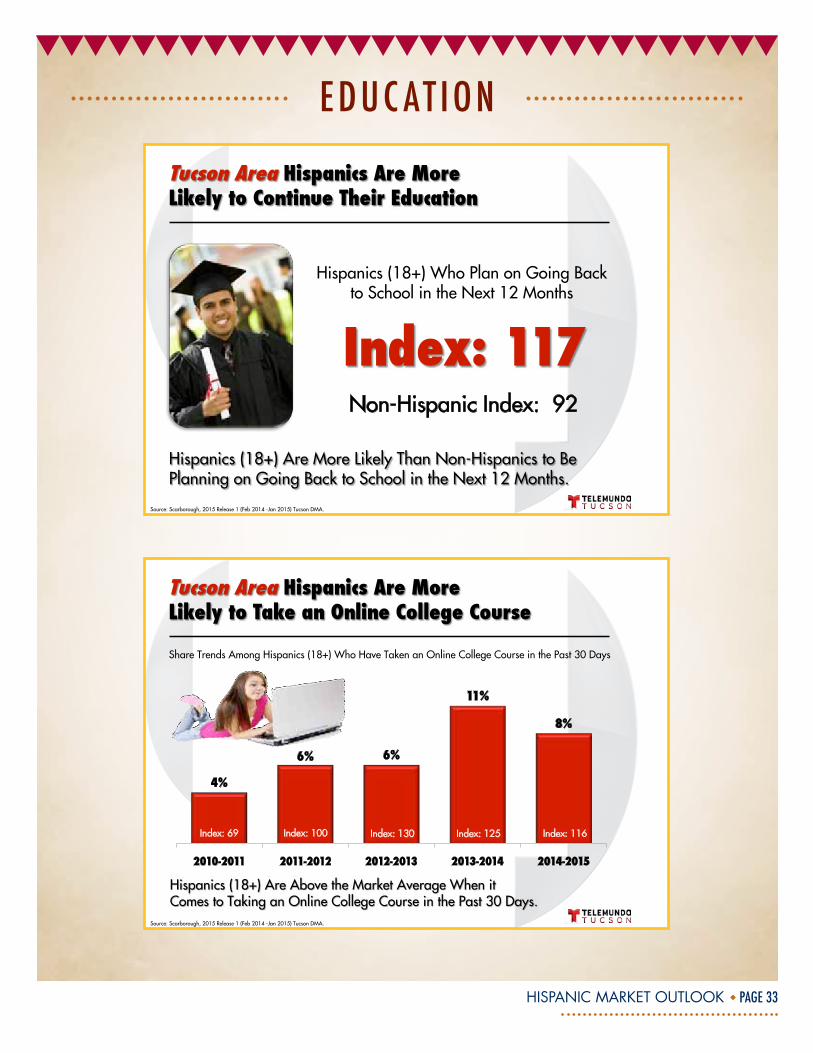
Hispanics (18+) Who Plan on Going Back to School in the Next 12 Months
Non-Hispanic Index: 92
Source: Scarborough, 2015 Release 1 (Feb 2014 -Jan 2015) Tucson DMA.
Share Trends Among Hispanics (18+) Who Have Taken an Online College Course in the Past 30 Days
4%
6% 6%
11%
8%
2010-2011 2011-2012 2012-2013 2013-2014 2014-2015
Index: 69 Index: 100 Index: 130 Index: 125 Index: 116
Source: Scarborough, 2015 Release 1 (Feb 2014 -Jan 2015) Tucson DMA.
HISPANIC MARKET OUTLOOK PAGE 34
eDUC AT ION
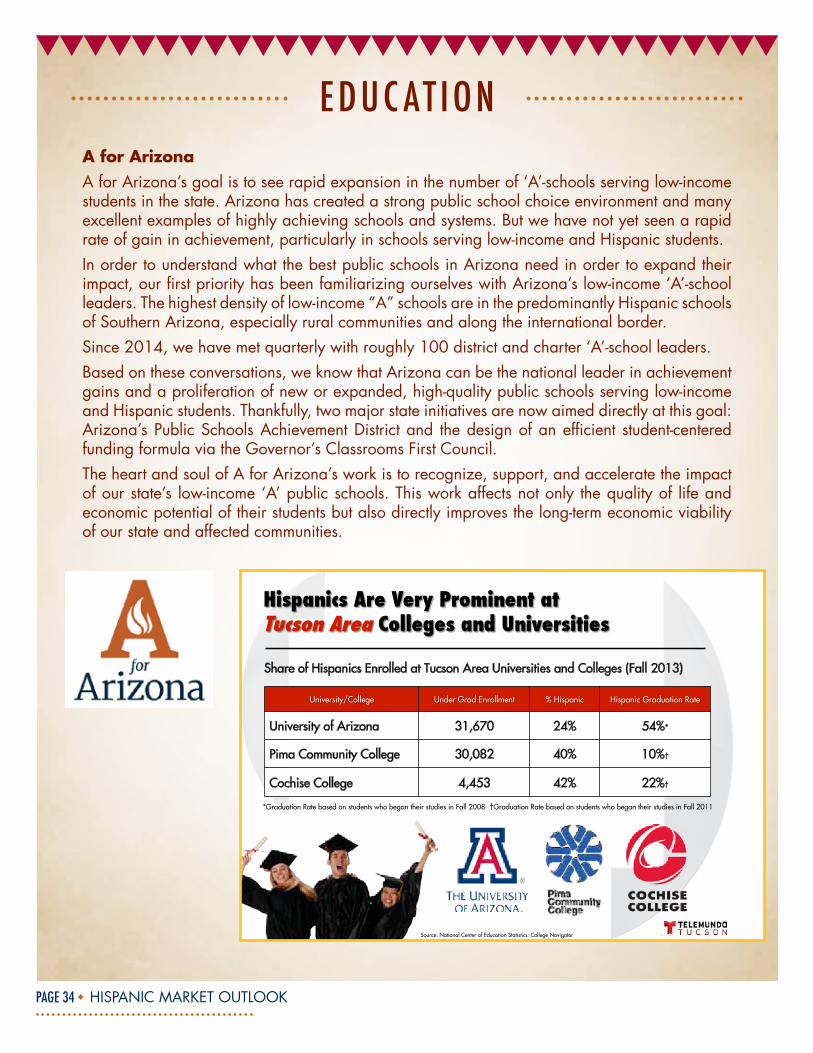
Share of Hispanics Enrolled at Tucson Area Universities and Colleges (Fall 2013)
Source: National Center of Education Statistics: College Navigator
University of Arizona 31,670 24% 54%*
Pima Community College 30,082 40% 10%†
Cochise College 4,453 42% 22%†
*Graduation Rate based on students who began their studies in Fall 2008 †Graduation Rate based on students who began their studies in Fall 2011
A for ArizonaA for Arizona’s goal is to see rapid expansion in the number of ‘A’-schools serving low-income students in the state. Arizona has created a strong public school choice environment and many excellent examples of highly achieving schools and systems. But we have not yet seen a rapid rate of gain in achievement, particularly in schools serving low-income and Hispanic students. In order to understand what the best public schools in Arizona need in order to expand their impact, our first priority has been familiarizing ourselves with Arizona’s low-income ‘A’-school leaders. The highest density of low-income “A” schools are in the predominantly Hispanic schools of Southern Arizona, especially rural communities and along the international border. Since 2014, we have met quarterly with roughly 100 district and charter ‘A’-school leaders. Based on these conversations, we know that Arizona can be the national leader in achievement gains and a proliferation of new or expanded, high-quality public schools serving low-income and Hispanic students. Thankfully, two major state initiatives are now aimed directly at this goal: Arizona’s Public Schools Achievement District and the design of an efficient student-centered funding formula via the Governor’s Classrooms First Council.The heart and soul of A for Arizona’s work is to recognize, support, and accelerate the impact of our state’s low-income ‘A’ public schools. This work affects not only the quality of life and economic potential of their students but also directly improves the long-term economic viability of our state and affected communities.
A for Arizona’s goal is to see rapid expansion in the number of ‘A’-‐schools serving low-‐income students in the state. Arizona has created a strong public school choice environment and many excellent examples of highly achieving schools and systems. But we have not yet seen a rapid rate of gain in achievement, particularly in schools serving low-‐income and Hispanic students. In order to understand what the best public schools in Arizona need in order to expand their impact, our first priority has been familiarizing ourselves with Arizona’s low-‐income ‘A’-‐school leaders. The highest density of low-‐income “A” schools are in the predominantly Hispanic schools of Southern Arizona, especially rural communities and along the international border. Since 2014, we have met quarterly with roughly 100 district and charter ‘A’-‐school leaders. Based on these conversations, we know that Arizona can be the national leader in achievement gains and a proliferation of new or expanded, high-‐quality public schools serving low-‐income and Hispanic students. Thankfully, two major state initiatives are now aimed directly at this goal: Arizona’s Public Schools Achievement District and the design of an efficient student-‐centered funding formula via the Governor’s Classrooms First Council. The heart and soul of A for Arizona’s work is to recognize, support, and accelerate the impact of our state’s low-‐income ‘A’ public schools. This work affects not only the quality of life and economic potential of their students but also directly improves the long-‐term economic viability of our state and affected communities.
HISPANIC MARKET OUTLOOK PAGE 35
eDUC AT ION
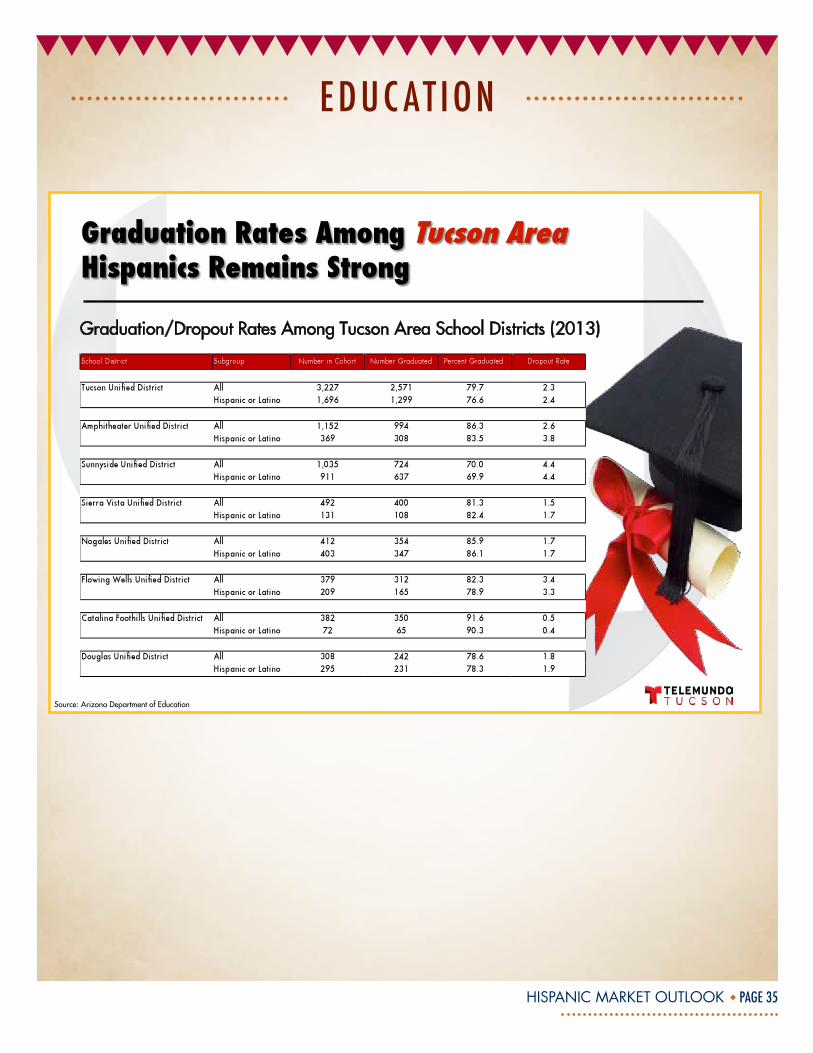
Graduation/Dropout Rates Among Tucson Area School Districts (2013)
Source: Arizona Department of Education
HISPANIC MARKET OUTLOOK PAGE 36
GRocERy
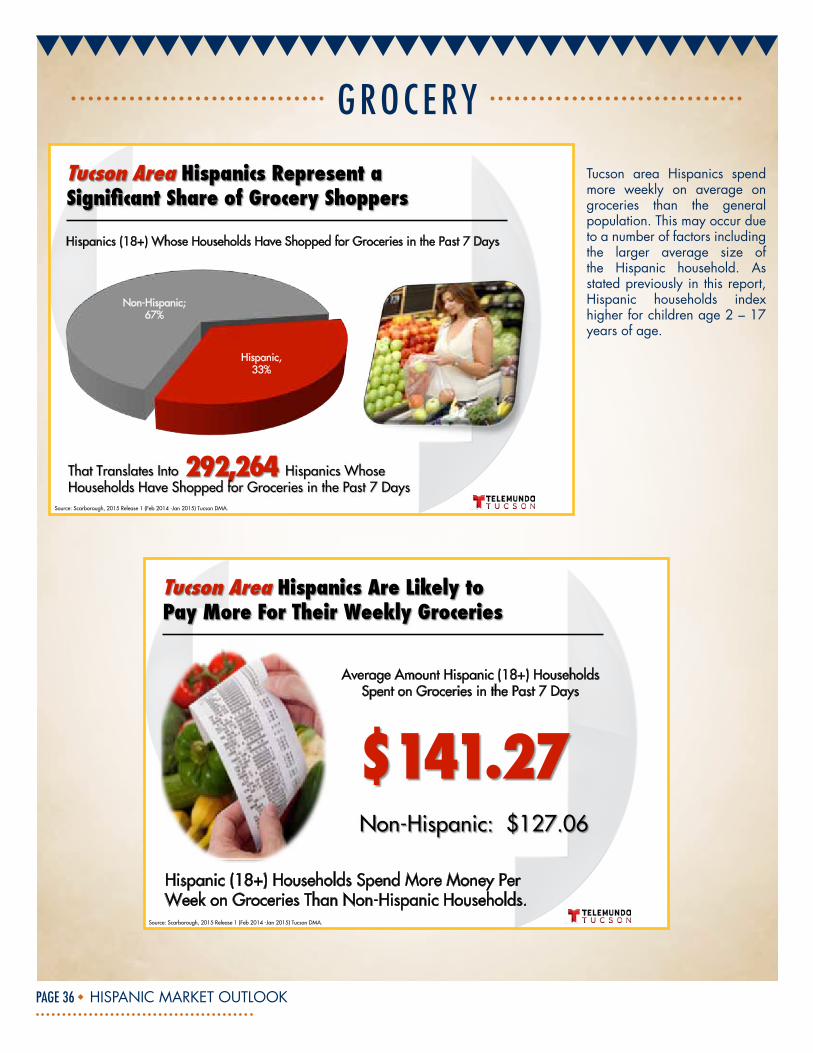
Hispanic, 33%
Non-Hispanic; 67%
Hispanics (18+) Whose Households Have Shopped for Groceries in the Past 7 Days
Source: Scarborough, 2015 Release 1 (Feb 2014 -Jan 2015) Tucson DMA.
Average Amount Hispanic (18+) Households Spent on Groceries in the Past 7 Days
Hispanic (18+) Households Spend More Money Per Week on Groceries Than Non-Hispanic Households.
Source: Scarborough, 2015 Release 1 (Feb 2014 -Jan 2015) Tucson DMA.
Tucson area Hispanics spend more weekly on average on groceries than the general population. This may occur due to a number of factors including the larger average size of the Hispanic household. As stated previously in this report, Hispanic households index higher for children age 2 – 17 years of age.
HISPANIC MARKET OUTLOOK PAGE 37
GRocERy
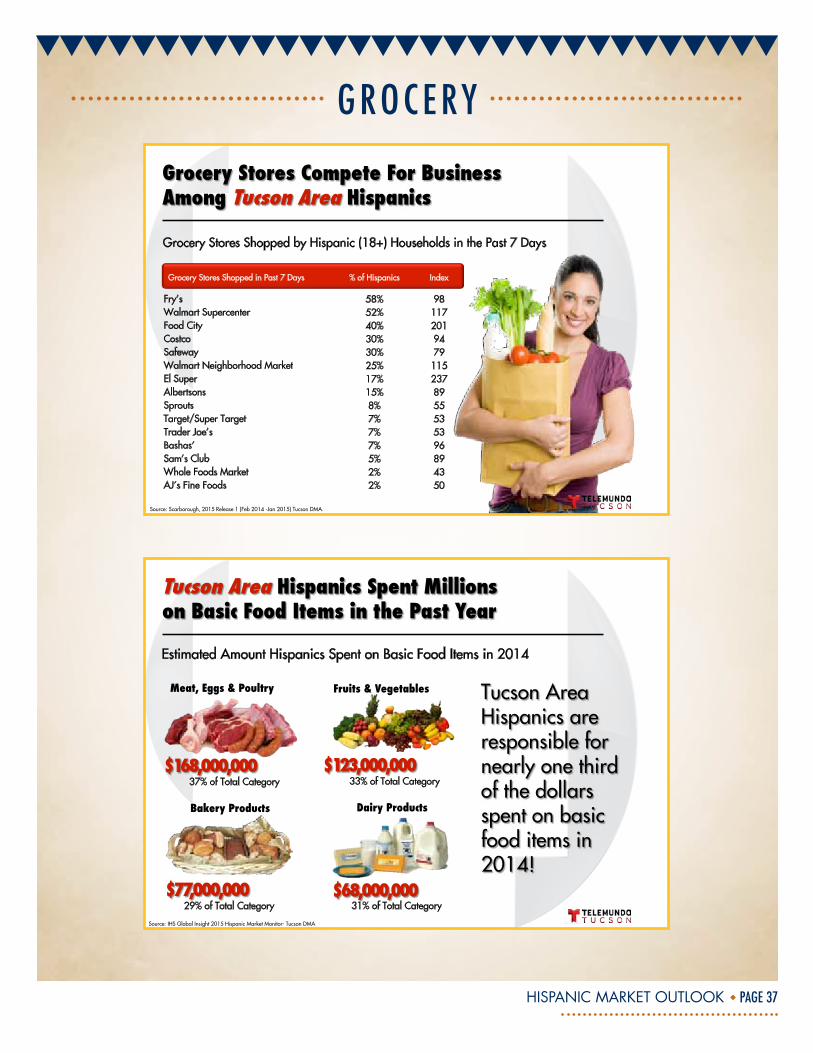
Grocery Stores Shopped in Past 7 Days % of Hispanics Index
Fry's 58% 98 Walmart Supercenter 52% 117 Food City 40% 201 Costco 30% 94 Safeway 30% 79 Walmart Neighborhood Market 25% 115 El Super 17% 237 Albertsons 15% 89 Sprouts 8% 55 Target/Super Target 7% 53 Trader Joe’s 7% 53 Bashas’ 7% 96 Sam’s Club 5% 89 Whole Foods Market 2% 43 AJ’s Fine Foods 2% 50
Grocery Stores Shopped by Hispanic (18+) Households in the Past 7 Days
Source: Scarborough, 2015 Release 1 (Feb 2014 -Jan 2015) Tucson DMA.
Estimated Amount Hispanics Spent on Basic Food Items in 2014
Fruits & VegetablesMeat, Eggs & Poultry
Bakery Products Dairy Products
33% of Total Category 37% of Total Category
29% of Total Category 31% of Total Category
Source: IHS Global Insight 2015 Hispanic Market Monitor- Tucson DMA
HISPANIC MARKET OUTLOOK PAGE 38
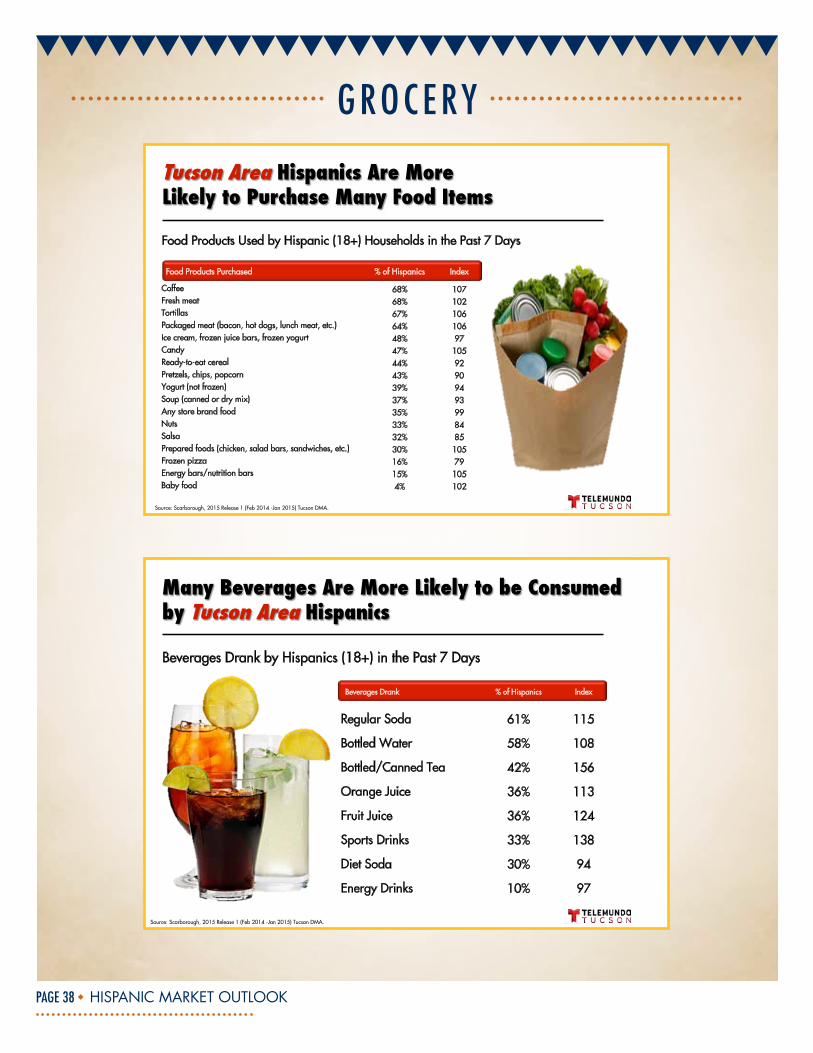
GRocERy
Food Products Purchased % of Hispanics Index
Coffee 68% 107 Fresh meat 68% 102 Tortillas 67% 106 Packaged meat (bacon, hot dogs, lunch meat, etc.) 64% 106 Ice cream, frozen juice bars, frozen yogurt 48% 97 Candy 47% 105 Ready-to-eat cereal 44% 92 Pretzels, chips, popcorn 43% 90 Yogurt (not frozen) 39% 94 Soup (canned or dry mix) 37% 93 Any store brand food 35% 99 Nuts 33% 84 Salsa 32% 85 Prepared foods (chicken, salad bars, sandwiches, etc.) 30% 105 Frozen pizza 16% 79 Energy bars/nutrition bars 15% 105 Baby food 4% 102
Food Products Used by Hispanic (18+) Households in the Past 7 Days
Source: Scarborough, 2015 Release 1 (Feb 2014 -Jan 2015) Tucson DMA.
Beverages Drank by Hispanics (18+) in the Past 7 Days
Beverages Drank % of Hispanics Index
Regular Soda 61% 115
Bottled Water 58% 108
Bottled/Canned Tea 42% 156
Orange Juice 36% 113
Fruit Juice 36% 124
Sports Drinks 33% 138
Diet Soda 30% 94
Energy Drinks 10% 97
Source: Scarborough, 2015 Release 1 (Feb 2014 -Jan 2015) Tucson DMA.
HISPANIC MARKET OUTLOOK PAGE 39
GRocERy
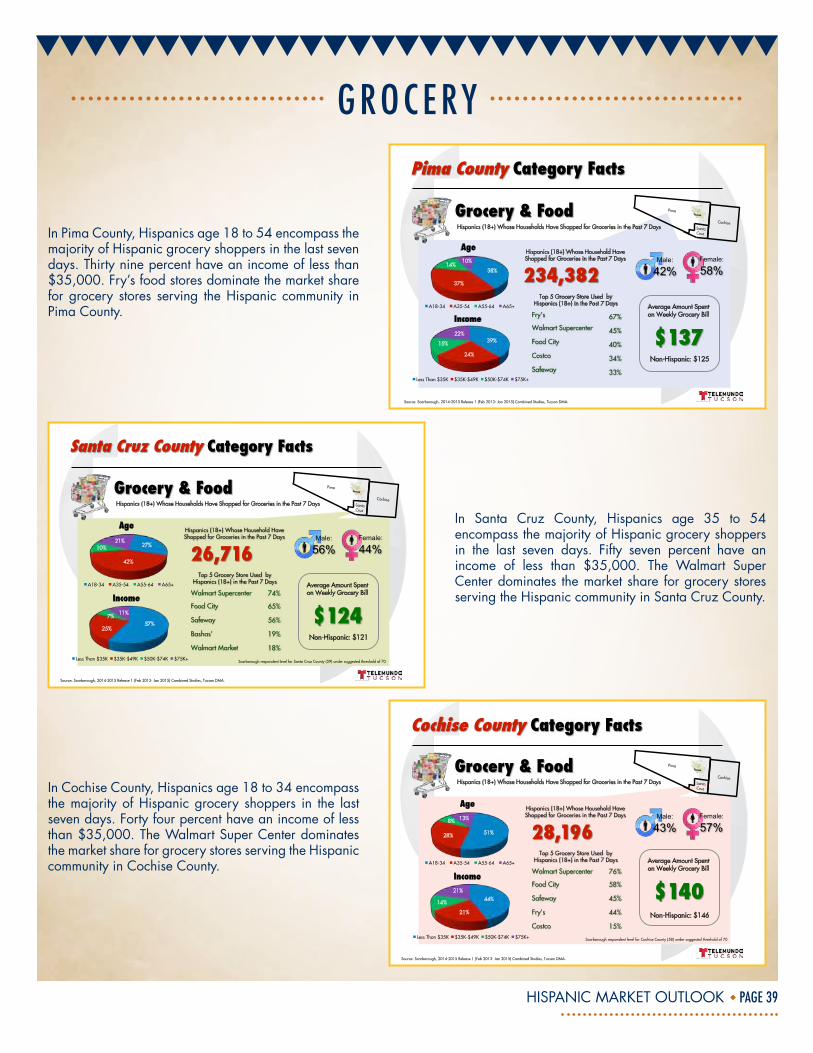
In Pima County, Hispanics age 18 to 54 encompass the majority of Hispanic grocery shoppers in the last seven days. Thirty nine percent have an income of less than $35,000. Fry’s food stores dominate the market share for grocery stores serving the Hispanic community in Pima County.
In Santa Cruz County, Hispanics age 35 to 54 encompass the majority of Hispanic grocery shoppers in the last seven days. Fifty seven percent have an income of less than $35,000. The Walmart Super Center dominates the market share for grocery stores serving the Hispanic community in Santa Cruz County.
Hispanics (18+) Whose Households Have Shopped for Groceries in the Past 7 Days
Top 5 Grocery Store Used by Hispanics (18+) in the Past 7 Days
Source: Scarborough, 2014-2015 Release 1 (Feb 2013- Jan 2015) Combined Studies, Tucson DMA.
Pima
Santa Cruz
Cochise
Tucson
38%
37%
14% 10%
Age
A18-34 A35-54 A55-64 A65+
39%
24%
15%
22%
Income
Less Than $35K $35K-$49K $50K-$74K $75K+
Hispanics (18+) Whose Household Have Shopped for Groceries in the Past 7 Days
Average Amount Spent on Weekly Grocery Bill
Non-Hispanic: $125
Source: Scarborough, 2014-2015 Release 1 (Feb 2013- Jan 2015) Combined Studies, Tucson DMA.
27%
42%
10% 21%
Age
A18-34 A35-54 A55-64 A65+
57% 25%
7% 11%
Income
Less Than $35K $35K-$49K $50K-$74K $75K+
Average Amount Spent on Weekly Grocery Bill
Non-Hispanic: $121
Hispanics (18+) Whose Households Have Shopped for Groceries in the Past 7 Days
Pima
Santa Cruz
Cochise
Tucson
Scarborough respondent level for Santa Cruz County (59) under suggested threshold of 70
Source: Scarborough, 2014-2015 Release 1 (Feb 2013- Jan 2015) Combined Studies, Tucson DMA.
51% 28%
8% 13%
Age
A18-34 A35-54 A55-64 A65+
44%
21%
14%
21%
Income
Less Than $35K $35K-$49K $50K-$74K $75K+
Average Amount Spent on Weekly Grocery Bill
Non-Hispanic: $146
Hispanics (18+) Whose Households Have Shopped for Groceries in the Past 7 Days
Pima
Santa Cruz
Cochise
Tucson
Scarborough respondent level for Cochise County (58) under suggested threshold of 70
In Cochise County, Hispanics age 18 to 34 encompass the majority of Hispanic grocery shoppers in the last seven days. Forty four percent have an income of less than $35,000. The Walmart Super Center dominates the market share for grocery stores serving the Hispanic community in Cochise County.
HISPANIC MARKET OUTLOOK PAGE 40
QsR
Source: Scarborough, 2015 Release 1 (Feb 2014- Jan 2015) Tucson DMA.
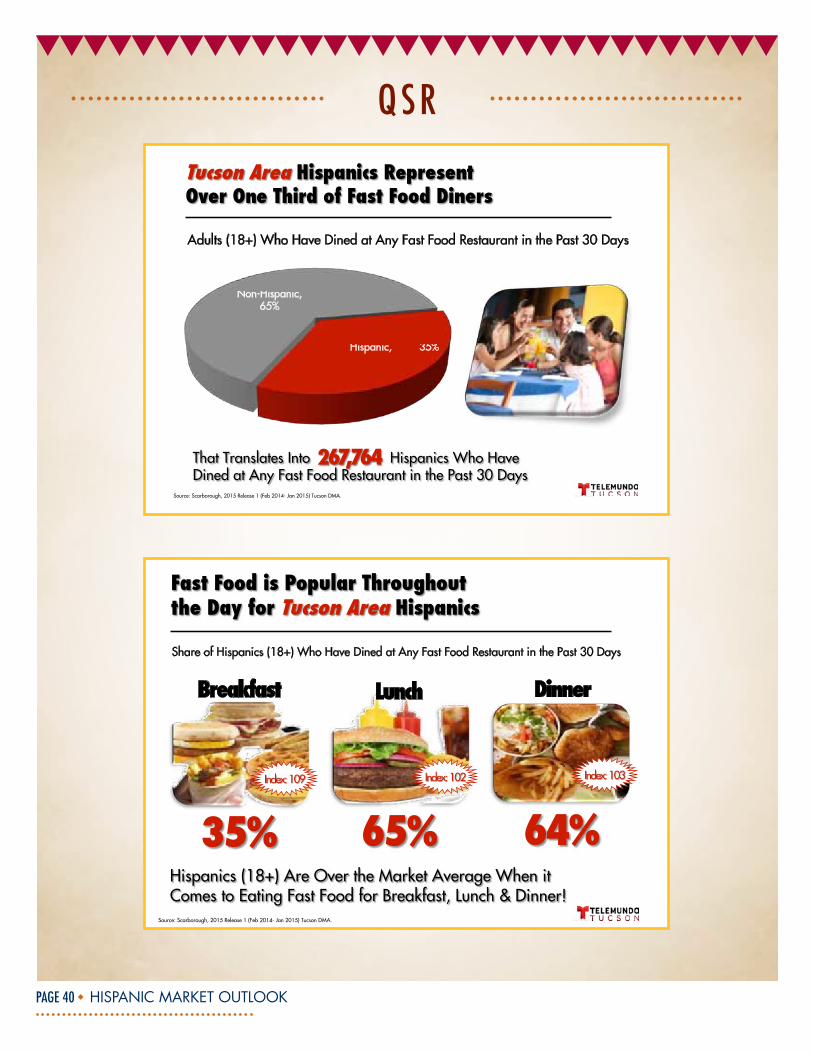
Hispanic, 35%
Non-Hispanic, 65%
Adults (18+) Who Have Dined at Any Fast Food Restaurant in the Past 30 Days
Breakfast Lunch Dinner
Source: Scarborough, 2015 Release 1 (Feb 2014- Jan 2015) Tucson DMA.
Share of Hispanics (18+) Who Have Dined at Any Fast Food Restaurant in the Past 30 Days
HISPANIC MARKET OUTLOOK PAGE 41
QsR
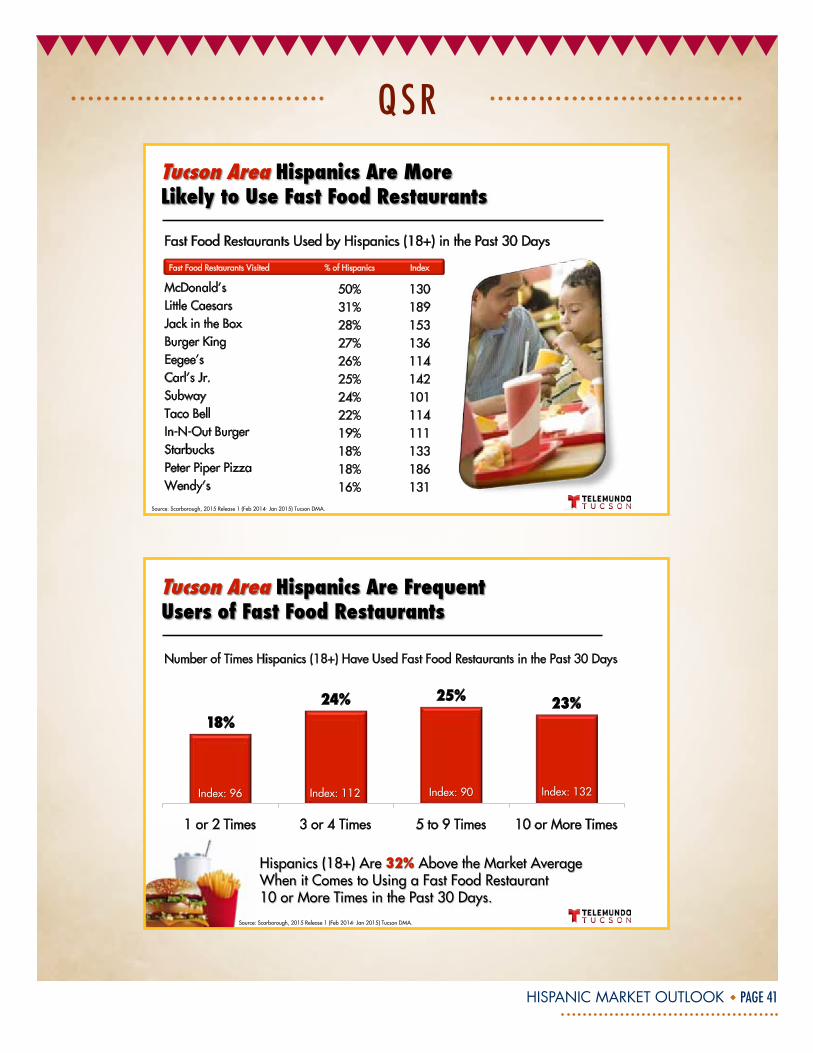
Fast Food Restaurants Visited % of Hispanics Index
McDonald's 50% 130 Little Caesars 31% 189 Jack in the Box 28% 153 Burger King 27% 136 Eegee’s 26% 114 Carl’s Jr. 25% 142 Subway 24% 101 Taco Bell 22% 114 In-N-Out Burger 19% 111 Starbucks 18% 133 Peter Piper Pizza 18% 186 Wendy’s 16% 131
Fast Food Restaurants Used by Hispanics (18+) in the Past 30 Days
Source: Scarborough, 2015 Release 1 (Feb 2014- Jan 2015) Tucson DMA.
Source: Scarborough, 2015 Release 1 (Feb 2014- Jan 2015) Tucson DMA.
Number of Times Hispanics (18+) Have Used Fast Food Restaurants in the Past 30 Days
18%24% 25% 23%
1 or 2 Times 3 or 4 Times 5 to 9 Times 10 or More Times
HISPANIC MARKET OUTLOOK PAGE 42
bAnk InG & f In Anc IAl
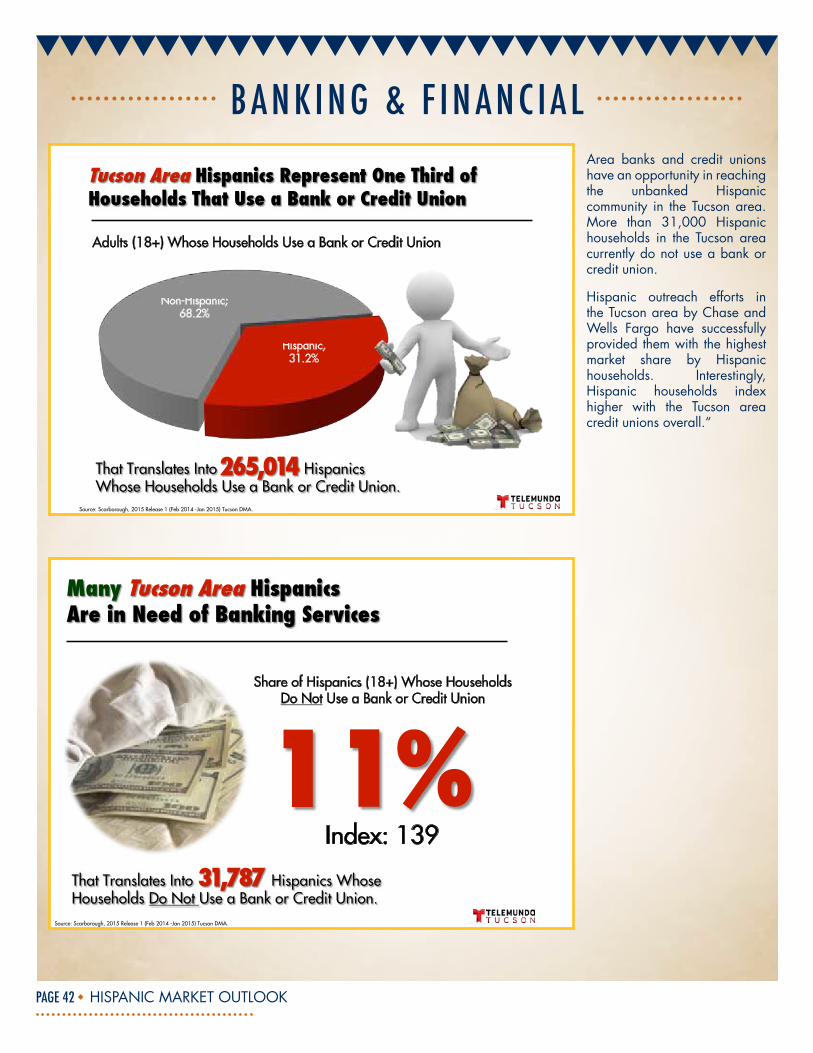
Hispanic, 31.2%
Non-Hispanic; 68.2%
Adults (18+) Whose Households Use a Bank or Credit Union
Source: Scarborough, 2015 Release 1 (Feb 2014 -Jan 2015) Tucson DMA.
Source: Scarborough, 2015 Release 1 (Feb 2014 -Jan 2015) Tucson DMA.
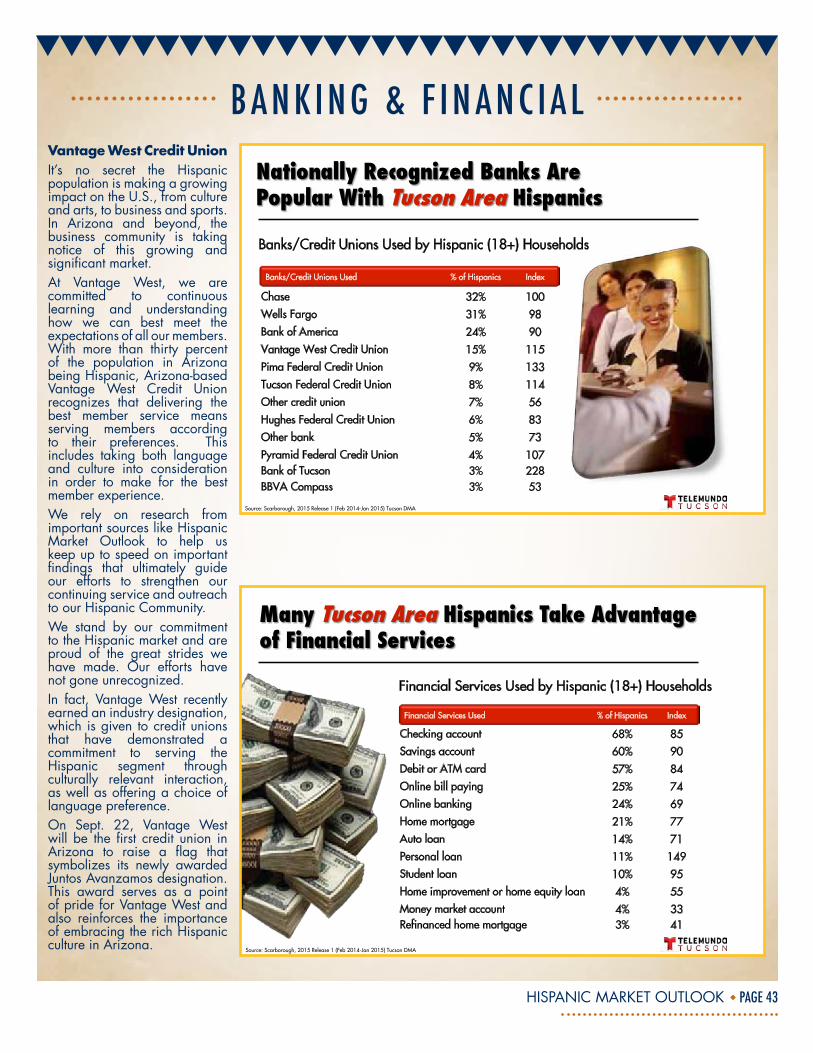
Share of Hispanics (18+) Whose Households Do Not Use a Bank or Credit Union
Index: 139
Area banks and credit unions have an opportunity in reaching the unbanked Hispanic community in the Tucson area. More than 31,000 Hispanic households in the Tucson area currently do not use a bank or credit union.
Hispanic outreach efforts in the Tucson area by Chase and Wells Fargo have successfully provided them with the highest market share by Hispanic households. Interestingly, Hispanic households index higher with the Tucson area credit unions overall.“
HISPANIC MARKET OUTLOOK PAGE 43
bAnk InG & f In Anc IAlVantage West Credit UnionIt’s no secret the Hispanic population is making a growing impact on the U.S., from culture and arts, to business and sports. In Arizona and beyond, the business community is taking notice of this growing and significant market. At Vantage West, we are committed to continuous learning and understanding how we can best meet the expectations of all our members. With more than thirty percent of the population in Arizona being Hispanic, Arizona-based Vantage West Credit Union recognizes that delivering the best member service means serving members according to their preferences. This includes taking both language and culture into consideration in order to make for the best member experience.We rely on research from important sources like Hispanic Market Outlook to help us keep up to speed on important findings that ultimately guide our efforts to strengthen our continuing service and outreach to our Hispanic Community.We stand by our commitment to the Hispanic market and are proud of the great strides we have made. Our efforts have not gone unrecognized.In fact, Vantage West recently earned an industry designation, which is given to credit unions that have demonstrated a commitment to serving the Hispanic segment through culturally relevant interaction, as well as offering a choice of language preference.On Sept. 22, Vantage West will be the first credit union in Arizona to raise a flag that symbolizes its newly awarded Juntos Avanzamos designation. This award serves as a point of pride for Vantage West and also reinforces the importance of embracing the rich Hispanic culture in Arizona.
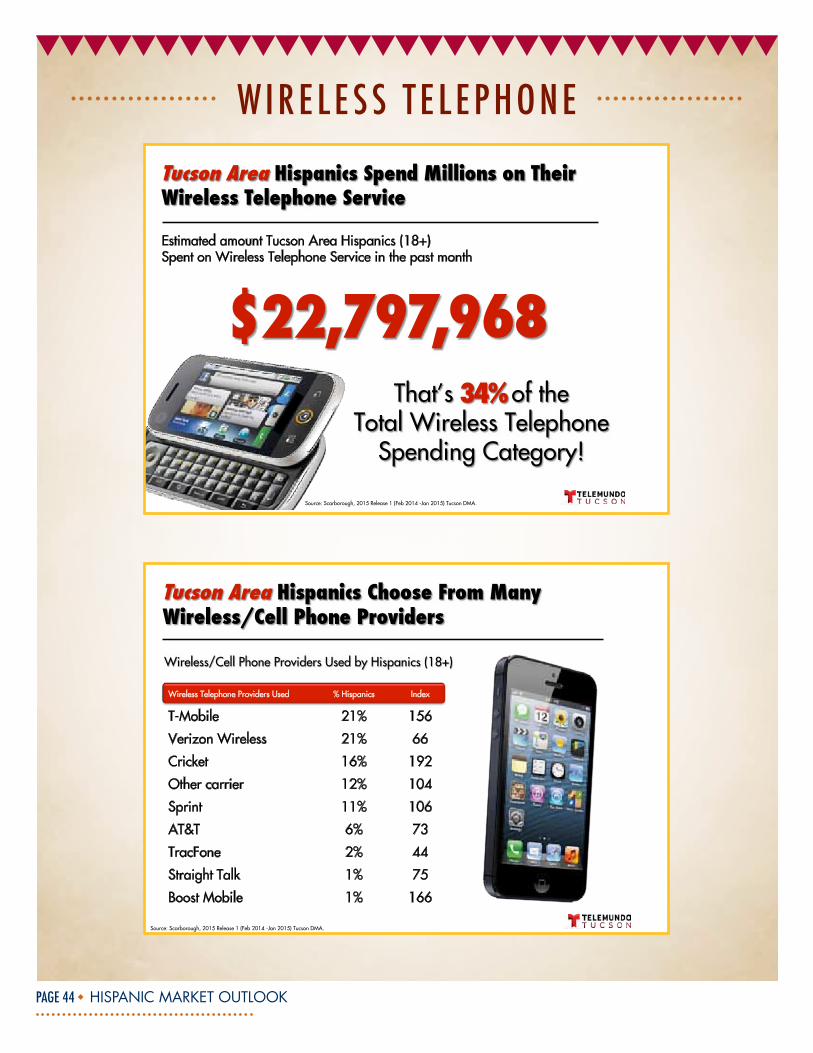
Banks/Credit Unions Used by Hispanic (18+) Households
Banks/Credit Unions Used % of Hispanics Index
Chase 32% 100 Wells Fargo 31% 98 Bank of America 24% 90 Vantage West Credit Union 15% 115 Pima Federal Credit Union 9% 133 Tucson Federal Credit Union 8% 114 Other credit union 7% 56 Hughes Federal Credit Union 6% 83 Other bank 5% 73 Pyramid Federal Credit Union 4% 107 Bank of Tucson 3% 228 BBVA Compass 3% 53
Source: Scarborough, 2015 Release 1 (Feb 2014-Jan 2015) Tucson DMA
Financial Services Used by Hispanic (18+) Households
Source: Scarborough, 2015 Release 1 (Feb 2014-Jan 2015) Tucson DMA
Financial Services Used % of Hispanics Index
Checking account 68% 85 Savings account 60% 90 Debit or ATM card 57% 84 Online bill paying 25% 74 Online banking 24% 69 Home mortgage 21% 77 Auto loan 14% 71 Personal loan 11% 149 Student loan 10% 95 Home improvement or home equity loan 4% 55 Money market account 4% 33 Refinanced home mortgage 3% 41
HISPANIC MARKET OUTLOOK PAGE 44
wIRElEss tE lEPhonE
Estimated amount Tucson Area Hispanics (18+) Spent on Wireless Telephone Service in the past month
Source: Scarborough, 2015 Release 1 (Feb 2014 -Jan 2015) Tucson DMA.
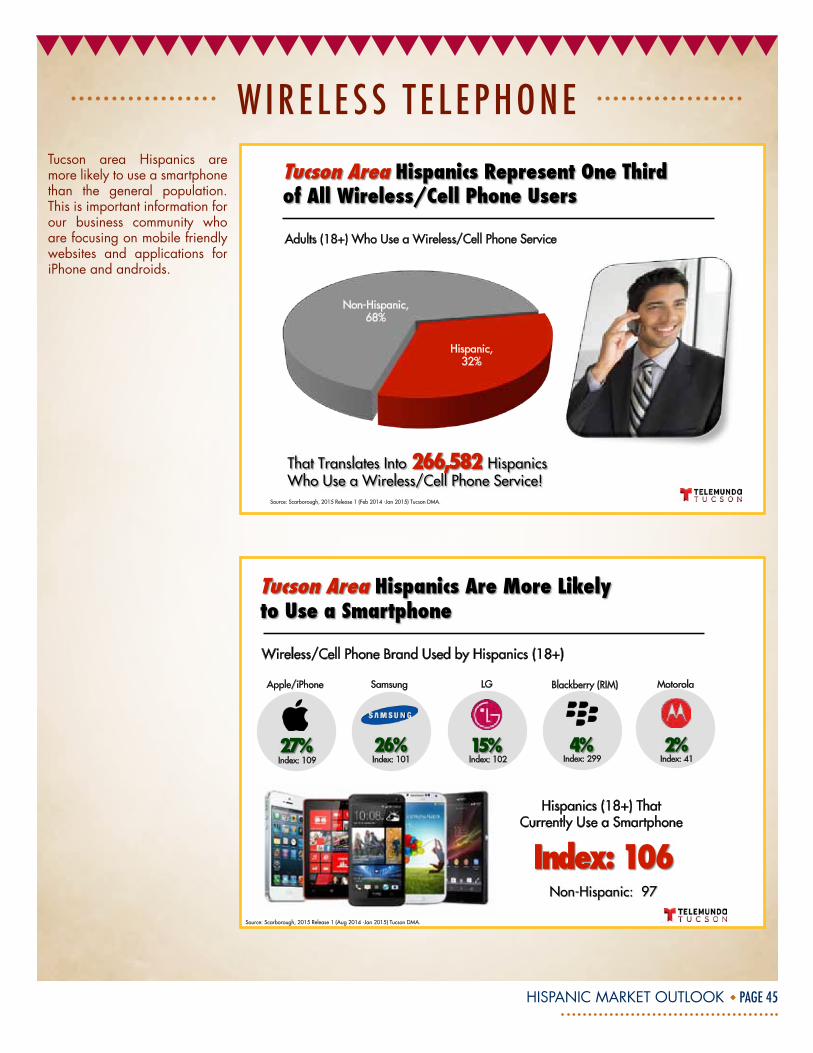
Wireless Telephone Providers Used % Hispanics Index
T-Mobile 21% 156
Verizon Wireless 21% 66
Cricket 16% 192
Other carrier 12% 104
Sprint 11% 106
AT&T 6% 73
TracFone 2% 44
Straight Talk 1% 75
Boost Mobile 1% 166
Source: Scarborough, 2015 Release 1 (Feb 2014 -Jan 2015) Tucson DMA.
HISPANIC MARKET OUTLOOK PAGE 45
wIRElEss tE lEPhonE
Hispanic, 32%
Non-Hispanic, 68%
Adults (18+) Who Use a Wireless/Cell Phone Service
Source: Scarborough, 2015 Release 1 (Feb 2014 -Jan 2015) Tucson DMA.
Hispanics (18+) That Currently Use a Smartphone
Apple/iPhone Samsung LG Blackberry (RIM) Motorola
Wireless/Cell Phone Brand Used by Hispanics (18+)
Source: Scarborough, 2015 Release 1 (Aug 2014 -Jan 2015) Tucson DMA.
Index: 109 Index: 101 Index: 102 Index: 299 Index: 41
Tucson area Hispanics are more likely to use a smartphone than the general population. This is important information for our business community who are focusing on mobile friendly websites and applications for iPhone and androids.
HISPANIC MARKET OUTLOOK PAGE 46
wIRElEss tE lEPhonE
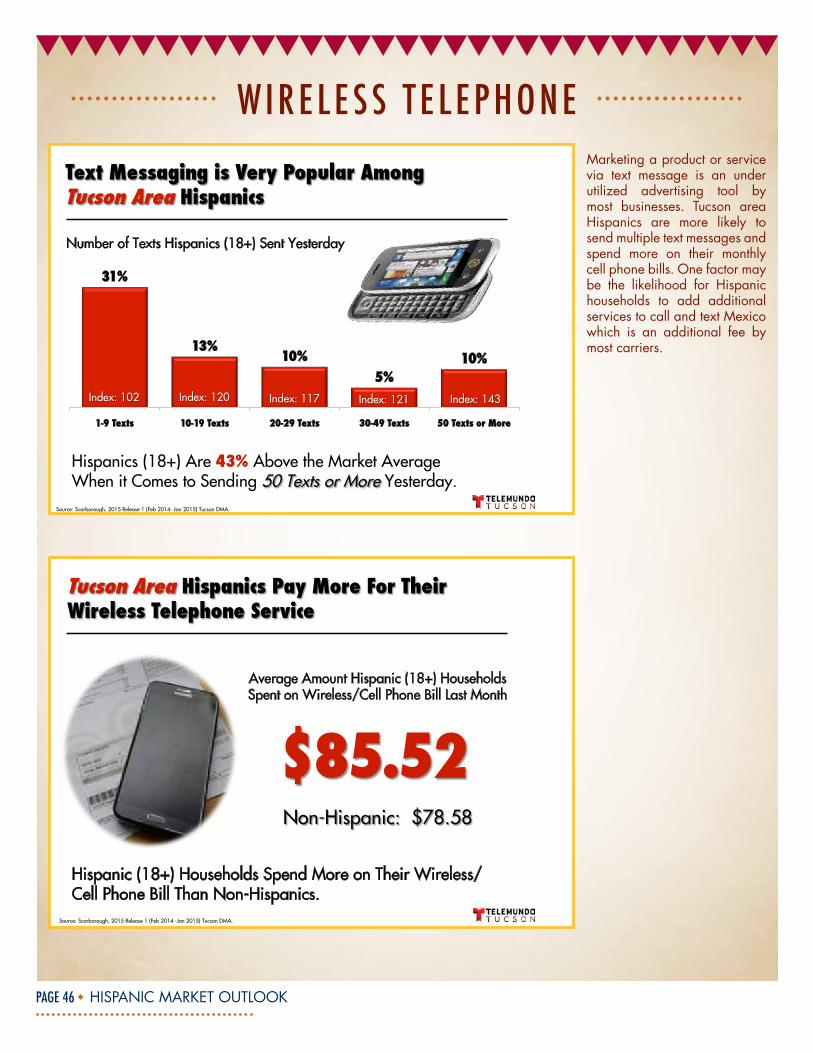
Source: Scarborough, 2015 Release 1 (Feb 2014- Jan 2015) Tucson DMA.
Number of Texts Hispanics (18+) Sent Yesterday
31%
13%10%
5%10%
1-9 Texts 10-19 Texts 20-29 Texts 30-49 Texts 50 Texts or More
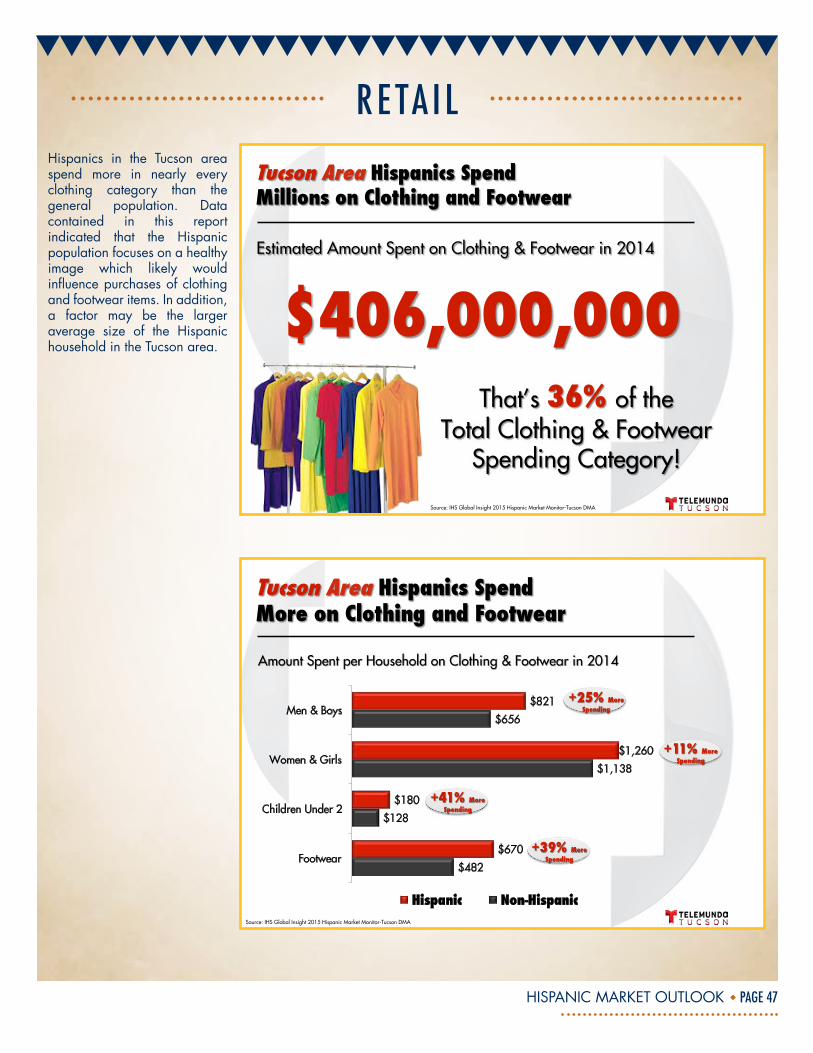
Average Amount Hispanic (18+) Households Spent on Wireless/Cell Phone Bill Last Month
Hispanic (18+) Households Spend More on Their Wireless/Cell Phone Bill Than Non-Hispanics.
Source: Scarborough, 2015 Release 1 (Feb 2014 -Jan 2015) Tucson DMA.
Marketing a product or service via text message is an under utilized advertising tool by most businesses. Tucson area Hispanics are more likely to send multiple text messages and spend more on their monthly cell phone bills. One factor may be the likelihood for Hispanic households to add additional services to call and text Mexico which is an additional fee by most carriers.
HISPANIC MARKET OUTLOOK PAGE 47
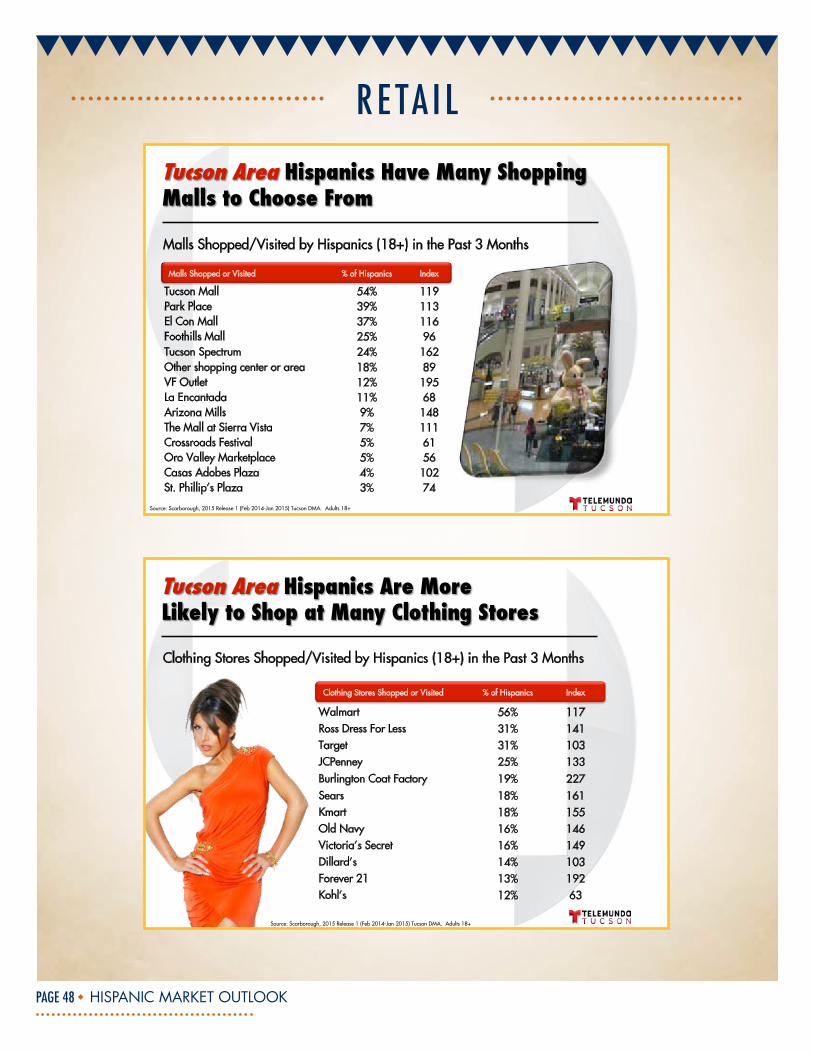
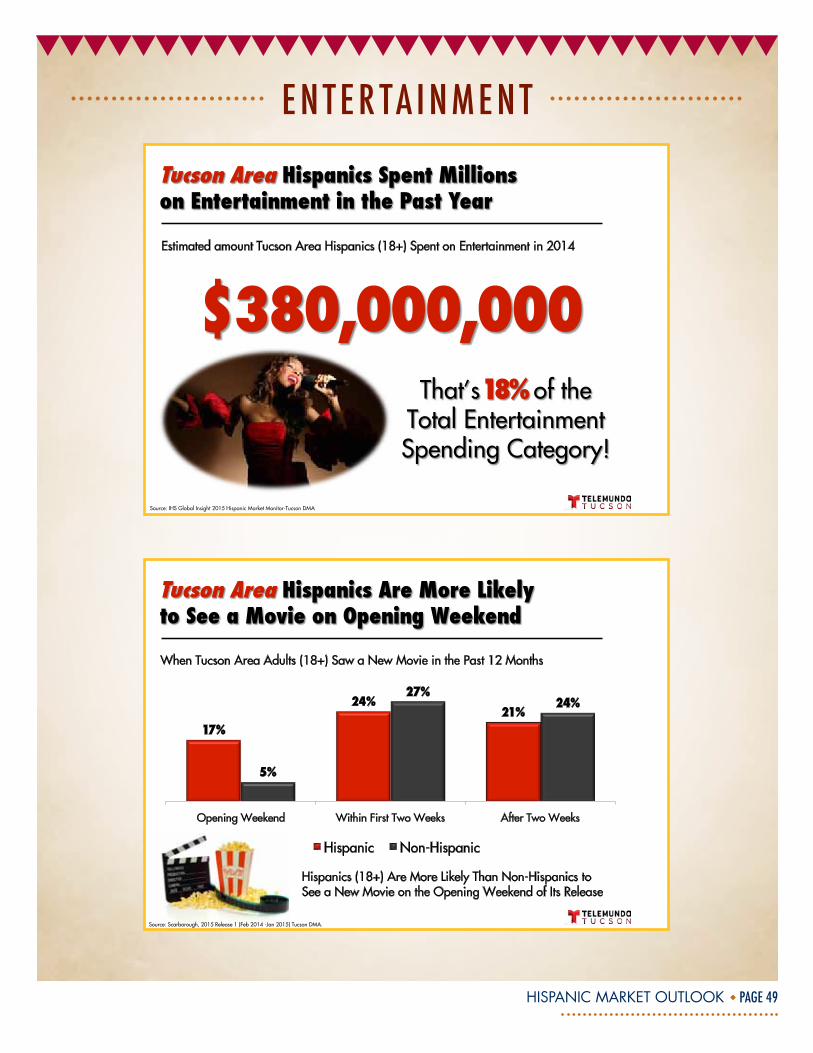
REtA I lHispanics in the Tucson area spend more in nearly every clothing category than the general population. Data contained in this report indicated that the Hispanic population focuses on a healthy image which likely would influence purchases of clothing and footwear items. In addition, a factor may be the larger average size of the Hispanic household in the Tucson area.
Source: IHS Global Insight 2015 Hispanic Market Monitor-Tucson DMA
$482
$128
$1,138
$656
$670
$180
$1,260
$821
Footwear
Children Under 2
Women & Girls
Men & Boys
Hispanic Non-HispanicSource: IHS Global Insight 2015 Hispanic Market Monitor-Tucson DMA
HISPANIC MARKET OUTLOOK PAGE 48
REtA I l
Malls Shopped or Visited % of Hispanics Index
Tucson Mall 54% 119 Park Place 39% 113 El Con Mall 37% 116 Foothills Mall 25% 96 Tucson Spectrum 24% 162 Other shopping center or area 18% 89 VF Outlet 12% 195 La Encantada 11% 68 Arizona Mills 9% 148 The Mall at Sierra Vista 7% 111 Crossroads Festival 5% 61 Oro Valley Marketplace 5% 56 Casas Adobes Plaza 4% 102 St. Phillip's Plaza 3% 74
Malls Shopped/Visited by Hispanics (18+) in the Past 3 Months
Source: Scarborough, 2015 Release 1 (Feb 2014-Jan 2015) Tucson DMA. Adults 18+
Clothing Stores Shopped or Visited % of Hispanics Index
Walmart 56% 117 Ross Dress For Less 31% 141 Target 31% 103 JCPenney 25% 133 Burlington Coat Factory 19% 227 Sears 18% 161 Kmart 18% 155 Old Navy 16% 146 Victoria's Secret 16% 149 Dillard's 14% 103 Forever 21 13% 192 Kohl's 12% 63
Clothing Stores Shopped/Visited by Hispanics (18+) in the Past 3 Months
Source: Scarborough, 2015 Release 1 (Feb 2014-Jan 2015) Tucson DMA. Adults 18+
HISPANIC MARKET OUTLOOK PAGE 49
EntER tA InMEnt
Estimated amount Tucson Area Hispanics (18+) Spent on Entertainment in 2014
Source: IHS Global Insight 2015 Hispanic Market Monitor-Tucson DMA
When Tucson Area Adults (18+) Saw a New Movie in the Past 12 Months
17%
24%21%
5%
27%24%
Opening Weekend Within First Two Weeks After Two Weeks
Hispanic Non-Hispanic
Source: Scarborough, 2015 Release 1 (Feb 2014 -Jan 2015) Tucson DMA.
Hispanics (18+) Are More Likely Than Non-Hispanics to See a New Movie on the Opening Weekend of Its Release
HISPANIC MARKET OUTLOOK PAGE 50
EntER tA InMEnt
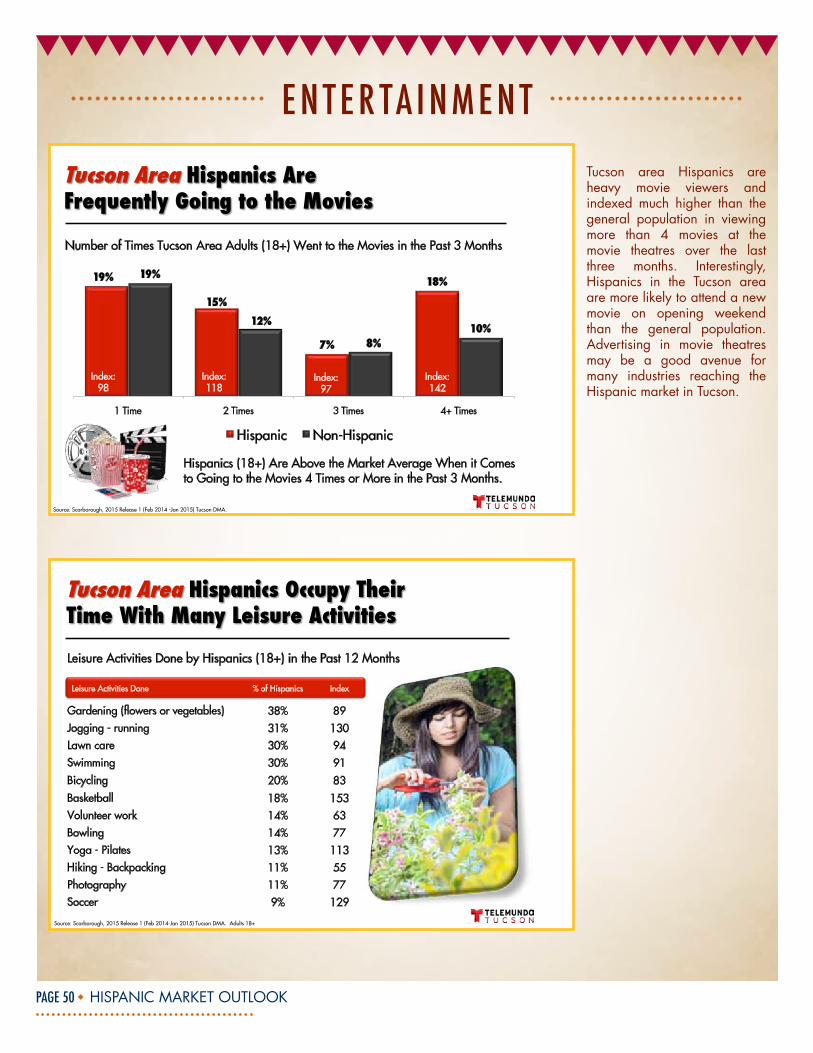
Number of Times Tucson Area Adults (18+) Went to the Movies in the Past 3 Months
19%
15%
7%
18%19%
12%
8%10%
1 Time 2 Times 3 Times 4+ Times
Hispanic Non-Hispanic
Source: Scarborough, 2015 Release 1 (Feb 2014 -Jan 2015) Tucson DMA.
Hispanics (18+) Are Above the Market Average When it Comes to Going to the Movies 4 Times or More in the Past 3 Months.
Index: 98
Index: 118
Index: 97
Index: 142
Leisure Activities Done % of Hispanics Index
Gardening (flowers or vegetables) 38% 89 Jogging - running 31% 130 Lawn care 30% 94 Swimming 30% 91 Bicycling 20% 83 Basketball 18% 153 Volunteer work 14% 63 Bowling 14% 77 Yoga - Pilates 13% 113 Hiking - Backpacking 11% 55 Photography 11% 77 Soccer 9% 129
Leisure Activities Done by Hispanics (18+) in the Past 12 Months
Source: Scarborough, 2015 Release 1 (Feb 2014-Jan 2015) Tucson DMA. Adults 18+
Tucson area Hispanics are heavy movie viewers and indexed much higher than the general population in viewing more than 4 movies at the movie theatres over the last three months. Interestingly, Hispanics in the Tucson area are more likely to attend a new movie on opening weekend than the general population. Advertising in movie theatres may be a good avenue for many industries reaching the Hispanic market in Tucson.
HISPANIC MARKET OUTLOOK PAGE 51
EntER tA InMEnt
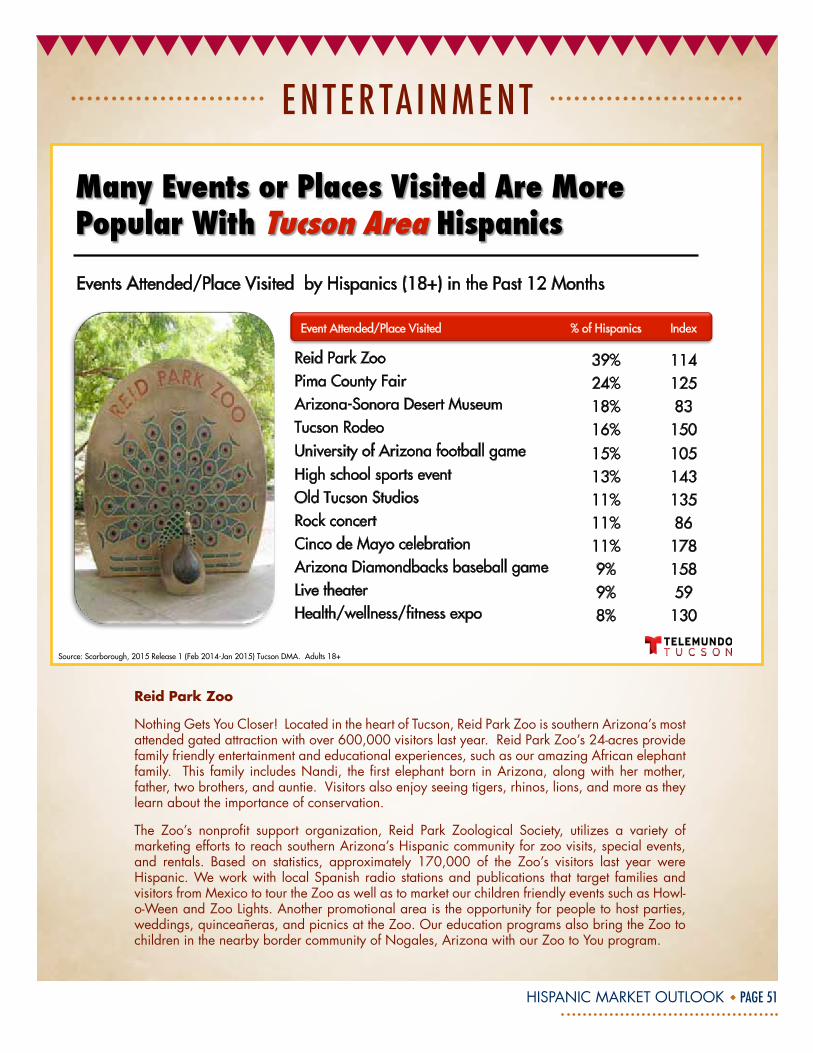
Event Attended/Place Visited % of Hispanics Index
Reid Park Zoo 39% 114 Pima County Fair 24% 125 Arizona-Sonora Desert Museum 18% 83 Tucson Rodeo 16% 150 University of Arizona football game 15% 105 High school sports event 13% 143 Old Tucson Studios 11% 135 Rock concert 11% 86 Cinco de Mayo celebration 11% 178 Arizona Diamondbacks baseball game 9% 158 Live theater 9% 59 Health/wellness/fitness expo 8% 130
Events Attended/Place Visited by Hispanics (18+) in the Past 12 Months
Source: Scarborough, 2015 Release 1 (Feb 2014-Jan 2015) Tucson DMA. Adults 18+
Reid Park Zoo
Nothing Gets You Closer! Located in the heart of Tucson, Reid Park Zoo is southern Arizona’s most attended gated attraction with over 600,000 visitors last year. Reid Park Zoo’s 24-acres provide family friendly entertainment and educational experiences, such as our amazing African elephant family. This family includes Nandi, the first elephant born in Arizona, along with her mother, father, two brothers, and auntie. Visitors also enjoy seeing tigers, rhinos, lions, and more as they learn about the importance of conservation.
The Zoo’s nonprofit support organization, Reid Park Zoological Society, utilizes a variety of marketing efforts to reach southern Arizona’s Hispanic community for zoo visits, special events, and rentals. Based on statistics, approximately 170,000 of the Zoo’s visitors last year were Hispanic. We work with local Spanish radio stations and publications that target families and visitors from Mexico to tour the Zoo as well as to market our children friendly events such as Howl-o-Ween and Zoo Lights. Another promotional area is the opportunity for people to host parties, weddings, quinceañeras, and picnics at the Zoo. Our education programs also bring the Zoo to children in the nearby border community of Nogales, Arizona with our Zoo to You program.
HISPANIC MARKET OUTLOOK PAGE 52
EntER tA InMEnt
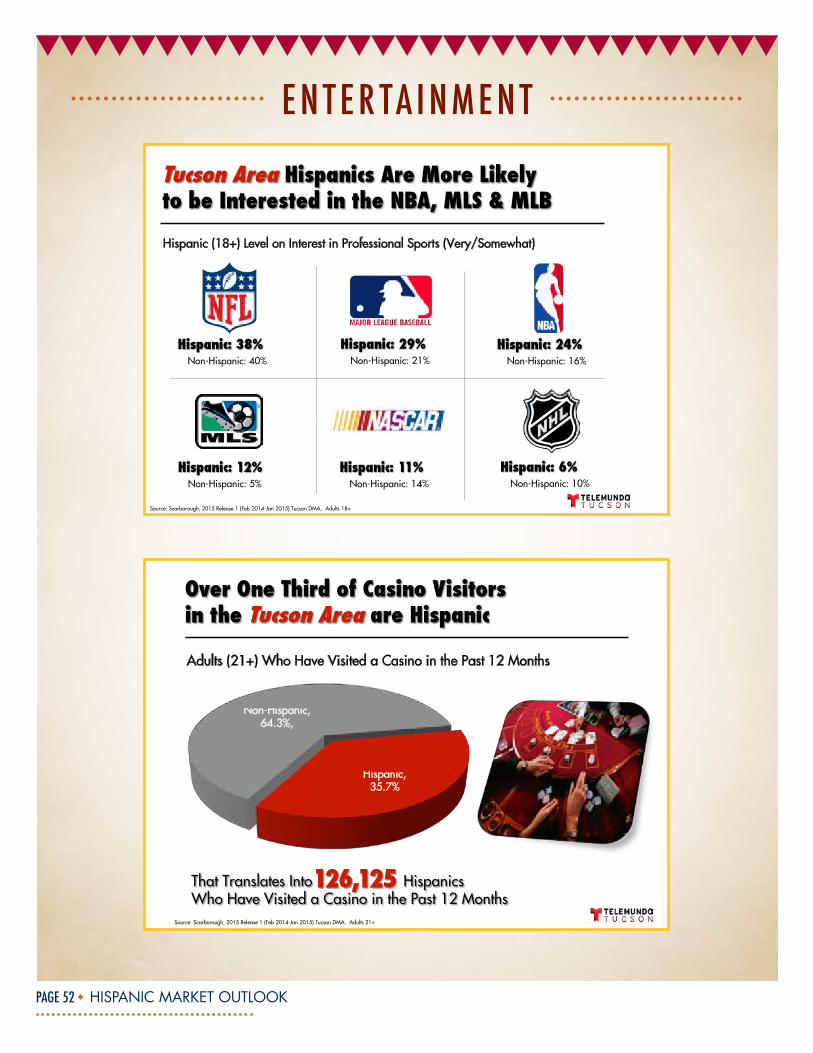
Hispanic (18+) Level on Interest in Professional Sports (Very/Somewhat)
Source: Scarborough, 2015 Release 1 (Feb 2014-Jan 2015) Tucson DMA. Adults 18+
Non-Hispanic: 40% Non-Hispanic: 16% Non-Hispanic: 21%
Non-Hispanic: 5% Non-Hispanic: 14% Non-Hispanic: 10%
Source: Scarborough, 2015 Release 1 (Feb 2014-Jan 2015) Tucson DMA. Adults 21+
Hispanic, 35.7%
Non-Hispanic, 64.3%,
Adults (21+) Who Have Visited a Casino in the Past 12 Months
HISPANIC MARKET OUTLOOK PAGE 53
EntER tA InMEnt
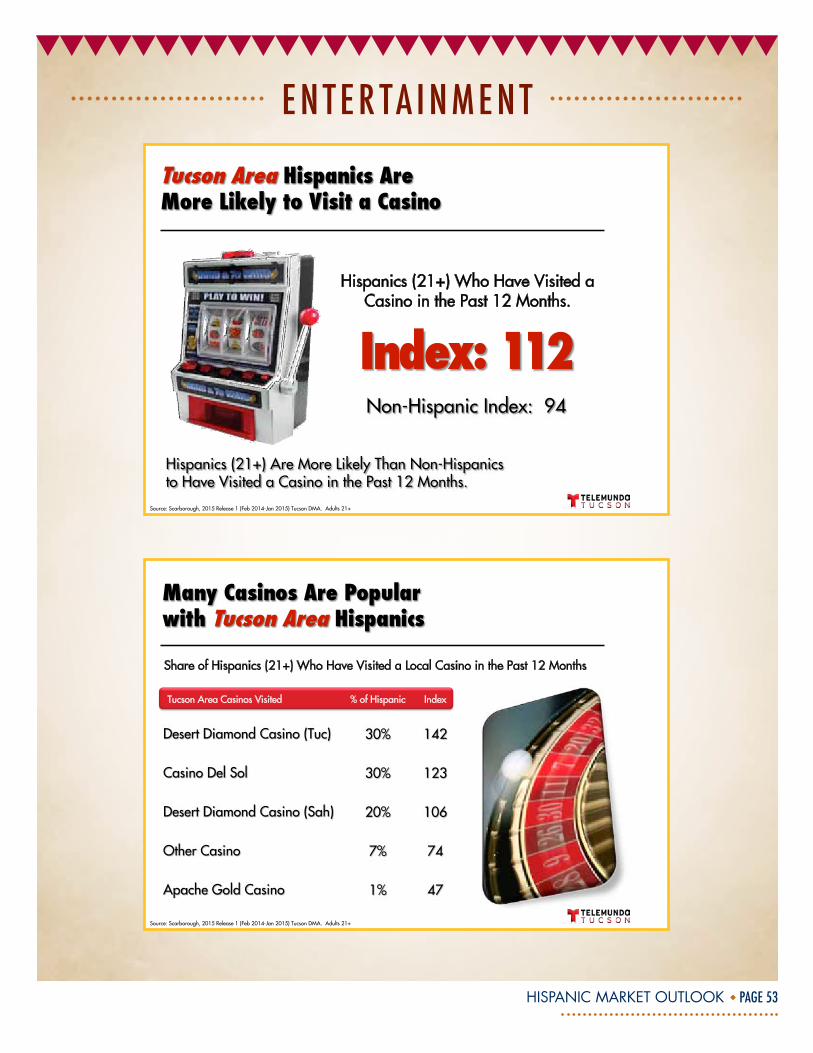
Source: Scarborough, 2015 Release 1 (Feb 2014-Jan 2015) Tucson DMA. Adults 21+
Hispanics (21+) Who Have Visited a Casino in the Past 12 Months.
Tucson Area Casinos Visited % of Hispanic Index
Share of Hispanics (21+) Who Have Visited a Local Casino in the Past 12 Months
Source: Scarborough, 2015 Release 1 (Feb 2014-Jan 2015) Tucson DMA. Adults 21+
HISPANIC MARKET OUTLOOK PAGE 54
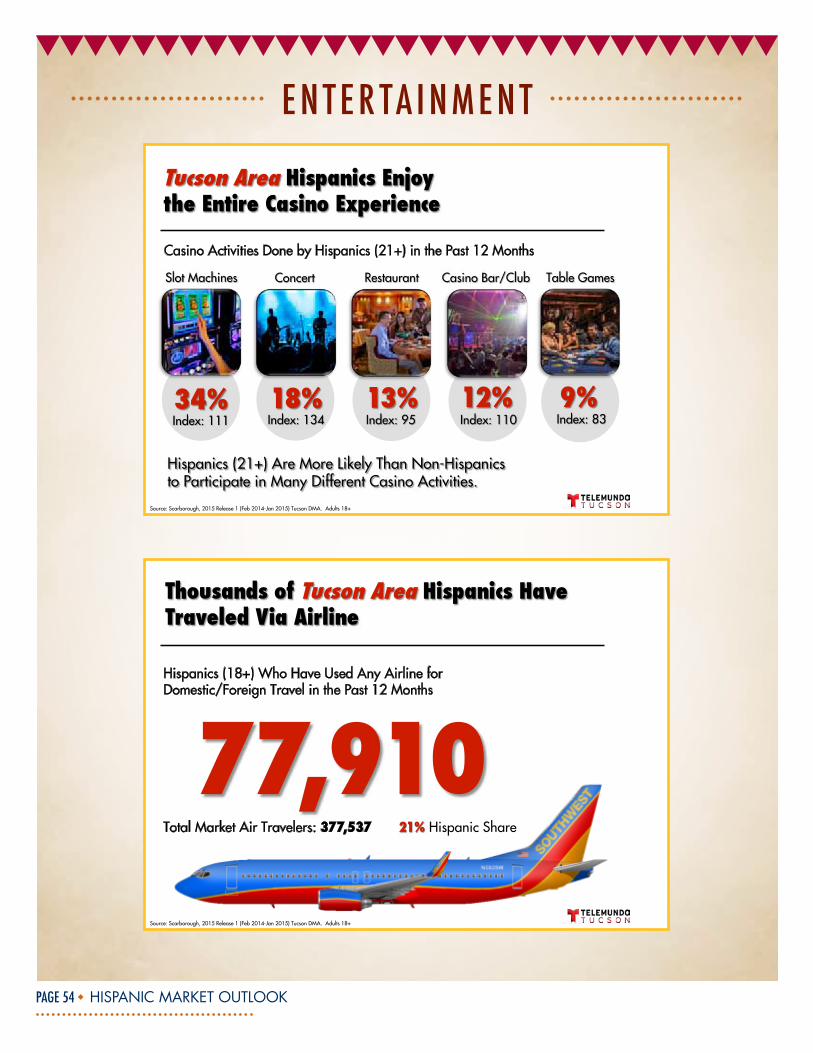
EntER tA InMEnt
Casino Activities Done by Hispanics (21+) in the Past 12 Months
Source: Scarborough, 2015 Release 1 (Feb 2014-Jan 2015) Tucson DMA. Adults 18+
Hispanics (18+) Who Have Used Any Airline for Domestic/Foreign Travel in the Past 12 Months
Source: Scarborough, 2015 Release 1 (Feb 2014-Jan 2015) Tucson DMA. Adults 18+
Total Market Air Travelers: 377,537
HISPANIC MARKET OUTLOOK PAGE 55
EntER tA InMEnt
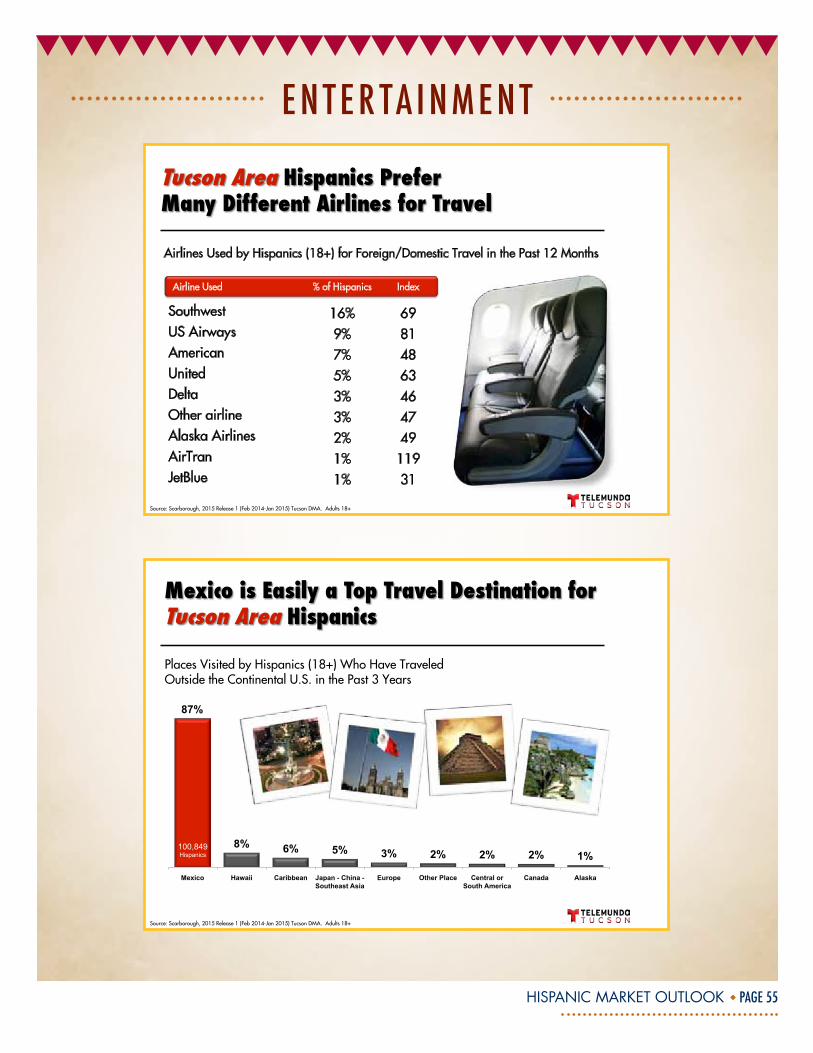
Airlines Used by Hispanics (18+) for Foreign/Domestic Travel in the Past 12 Months
Airline Used % of Hispanics Index
Southwest 16% 69 US Airways 9% 81 American 7% 48 United 5% 63 Delta 3% 46 Other airline 3% 47 Alaska Airlines 2% 49 AirTran 1% 119 JetBlue 1% 31
Source: Scarborough, 2015 Release 1 (Feb 2014-Jan 2015) Tucson DMA. Adults 18+
Places Visited by Hispanics (18+) Who Have Traveled Outside the Continental U.S. in the Past 3 Years
87%
8% 6% 5% 3% 2% 2% 2% 1%
Mexico Hawaii Caribbean Japan - China - Southeast Asia
Europe Other Place Central or South America
Canada Alaska
100,849 Hispanics
Source: Scarborough, 2015 Release 1 (Feb 2014-Jan 2015) Tucson DMA. Adults 18+
HISPANIC MARKET OUTLOOK PAGE 56
IntERnEt Us AGE
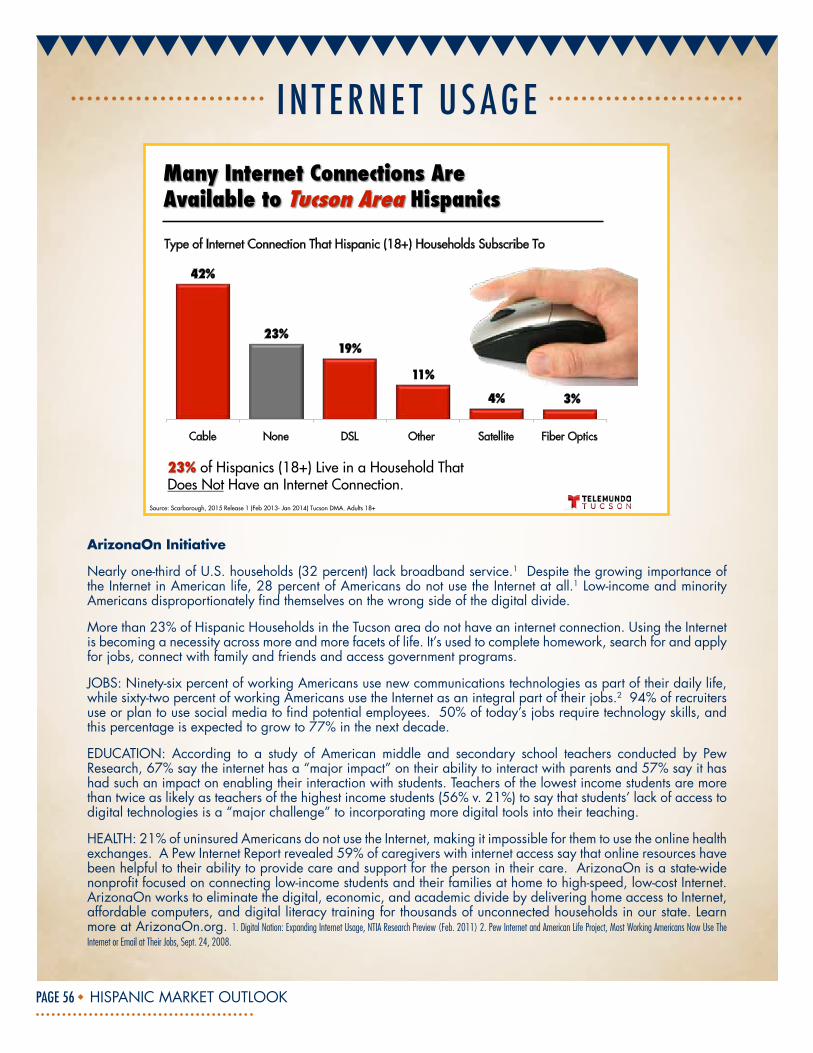
ArizonaOn Initiative
Nearly one-third of U.S. households (32 percent) lack broadband service.1 Despite the growing importance of the Internet in American life, 28 percent of Americans do not use the Internet at all.1 Low-income and minority Americans disproportionately find themselves on the wrong side of the digital divide.
More than 23% of Hispanic Households in the Tucson area do not have an internet connection. Using the Internet is becoming a necessity across more and more facets of life. It’s used to complete homework, search for and apply for jobs, connect with family and friends and access government programs.
JOBS: Ninety-six percent of working Americans use new communications technologies as part of their daily life, while sixty-two percent of working Americans use the Internet as an integral part of their jobs.2 94% of recruiters use or plan to use social media to find potential employees. 50% of today’s jobs require technology skills, and this percentage is expected to grow to 77% in the next decade.
EDUCATION: According to a study of American middle and secondary school teachers conducted by Pew Research, 67% say the internet has a “major impact” on their ability to interact with parents and 57% say it has had such an impact on enabling their interaction with students. Teachers of the lowest income students are more than twice as likely as teachers of the highest income students (56% v. 21%) to say that students’ lack of access to digital technologies is a “major challenge” to incorporating more digital tools into their teaching.
HEALTH: 21% of uninsured Americans do not use the Internet, making it impossible for them to use the online health exchanges. A Pew Internet Report revealed 59% of caregivers with internet access say that online resources have been helpful to their ability to provide care and support for the person in their care. ArizonaOn is a state-wide nonprofit focused on connecting low-income students and their families at home to high-speed, low-cost Internet. ArizonaOn works to eliminate the digital, economic, and academic divide by delivering home access to Internet, affordable computers, and digital literacy training for thousands of unconnected households in our state. Learn more at ArizonaOn.org. 1. Digital Nation: Expanding Internet Usage, NTIA Research Preview (Feb. 2011) 2. Pew Internet and American Life Project, Most Working Americans Now Use The Internet or Email at Their Jobs, Sept. 24, 2008.
42%
23%19%
11%
4% 3%
Cable None DSL Other Satellite Fiber Optics
Source: Scarborough, 2015 Release 1 (Feb 2013- Jan 2014) Tucson DMA. Adults 18+
Type of Internet Connection That Hispanic (18+) Households Subscribe To
HISPANIC MARKET OUTLOOK PAGE 57
IntERnEt Us AGE
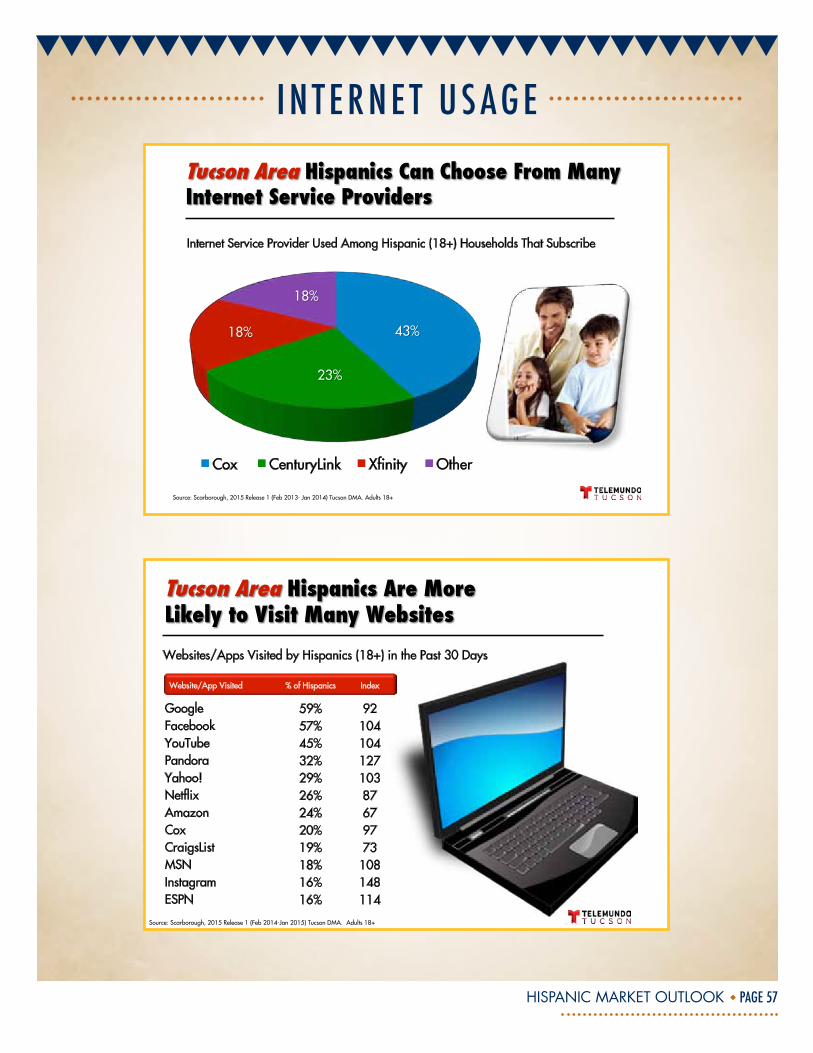
Cox CenturyLink Xfinity Other
Internet Service Provider Used Among Hispanic (18+) Households That Subscribe
Source: Scarborough, 2015 Release 1 (Feb 2013- Jan 2014) Tucson DMA. Adults 18+
Website/App Visited % of Hispanics Index
Google 59% 92 Facebook 57% 104 YouTube 45% 104 Pandora 32% 127 Yahoo! 29% 103 Netflix 26% 87 Amazon 24% 67 Cox 20% 97 CraigsList 19% 73 MSN 18% 108 Instagram 16% 148 ESPN 16% 114
Websites/Apps Visited by Hispanics (18+) in the Past 30 Days
Source: Scarborough, 2015 Release 1 (Feb 2014-Jan 2015) Tucson DMA. Adults 18+
HISPANIC MARKET OUTLOOK PAGE 58
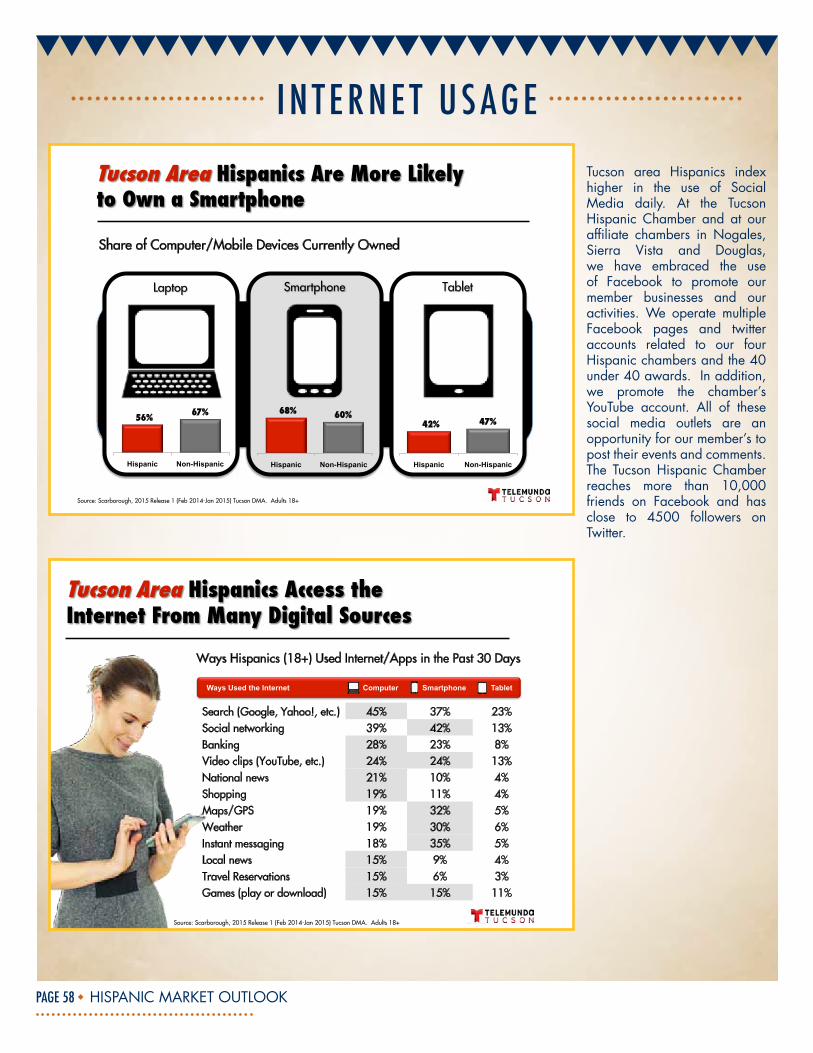
IntERnEt Us AGETucson area Hispanics index higher in the use of Social Media daily. At the Tucson Hispanic Chamber and at our affiliate chambers in Nogales, Sierra Vista and Douglas, we have embraced the use of Facebook to promote our member businesses and our activities. We operate multiple Facebook pages and twitter accounts related to our four Hispanic chambers and the 40 under 40 awards. In addition, we promote the chamber’s YouTube account. All of these social media outlets are an opportunity for our member’s to post their events and comments. The Tucson Hispanic Chamber reaches more than 10,000 friends on Facebook and has close to 4500 followers on Twitter.
56% 67%
Hispanic Non-Hispanic
Share of Computer/Mobile Devices Currently Owned
68% 60%
Hispanic Non-Hispanic
42% 47%
Hispanic Non-Hispanic
Source: Scarborough, 2015 Release 1 (Feb 2014-Jan 2015) Tucson DMA. Adults 18+
Ways Used the Internet Computer Smartphone Tablet
Search (Google, Yahoo!, etc.) 45% 37% 23% Social networking 39% 42% 13% Banking 28% 23% 8% Video clips (YouTube, etc.) 24% 24% 13% National news 21% 10% 4% Shopping 19% 11% 4% Maps/GPS 19% 32% 5% Weather 19% 30% 6% Instant messaging 18% 35% 5% Local news 15% 9% 4% Travel Reservations 15% 6% 3% Games (play or download) 15% 15% 11%
Ways Hispanics (18+) Used Internet/Apps in the Past 30 Days
Source: Scarborough, 2015 Release 1 (Feb 2014-Jan 2015) Tucson DMA. Adults 18+
HISPANIC MARKET OUTLOOK PAGE 59
IntERnEt Us AGE
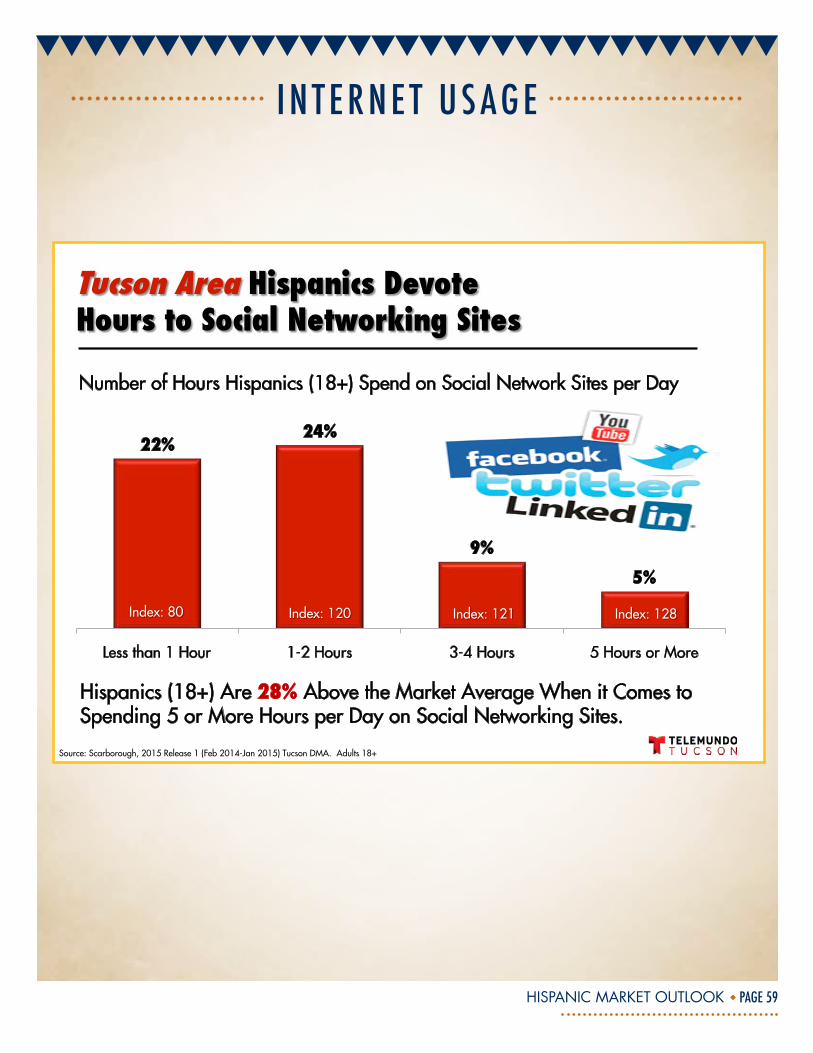
22%24%
9%5%
Less than 1 Hour 1-2 Hours 3-4 Hours 5 Hours or More
Number of Hours Hispanics (18+) Spend on Social Network Sites per Day
Hispanics (18+) Are 28% Above the Market Average When it Comes to Spending 5 or More Hours per Day on Social Networking Sites.
Source: Scarborough, 2015 Release 1 (Feb 2014-Jan 2015) Tucson DMA. Adults 18+
HISPANIC MARKET OUTLOOK PAGE 60
Vo t InG
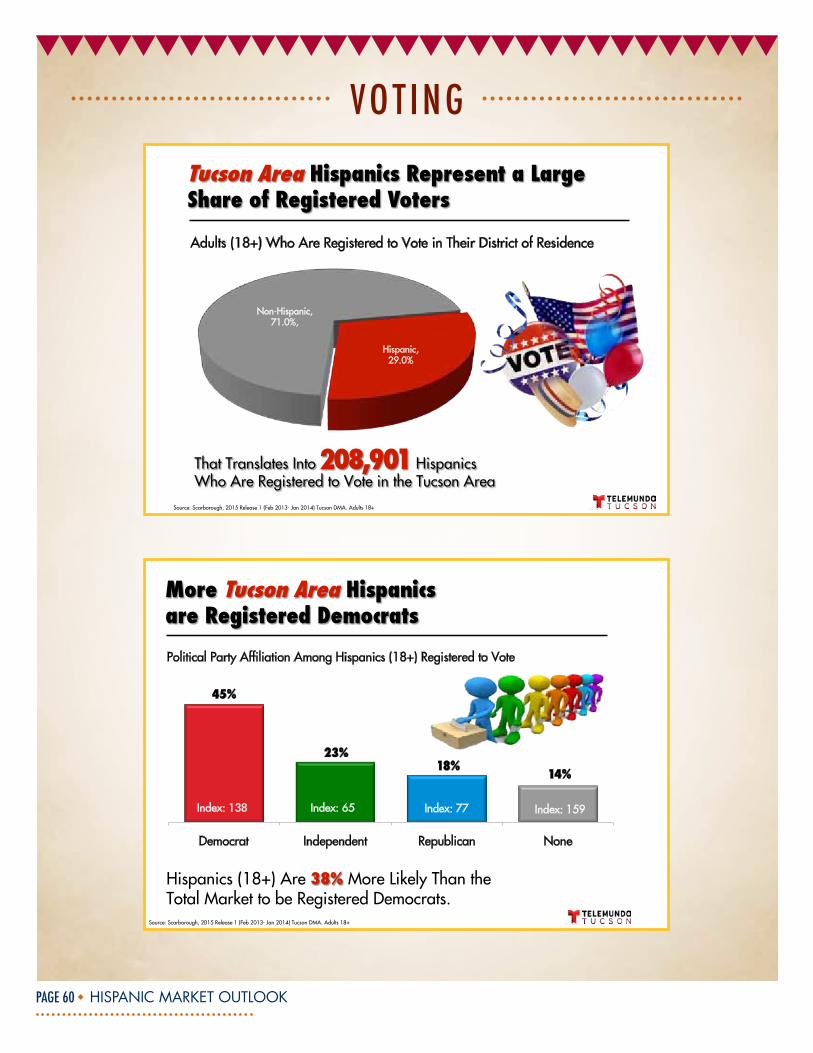
Hispanic, 29.0%
Non-Hispanic, 71.0%,
Adults (18+) Who Are Registered to Vote in Their District of Residence
Source: Scarborough, 2015 Release 1 (Feb 2013- Jan 2014) Tucson DMA. Adults 18+
Political Party Affiliation Among Hispanics (18+) Registered to Vote
45%
23%18% 14%
Democrat Independent Republican None
Index: 138 Index: 65 Index: 77 Index: 159
Source: Scarborough, 2015 Release 1 (Feb 2013- Jan 2014) Tucson DMA. Adults 18+
HISPANIC MARKET OUTLOOK PAGE 61
Vo t InG
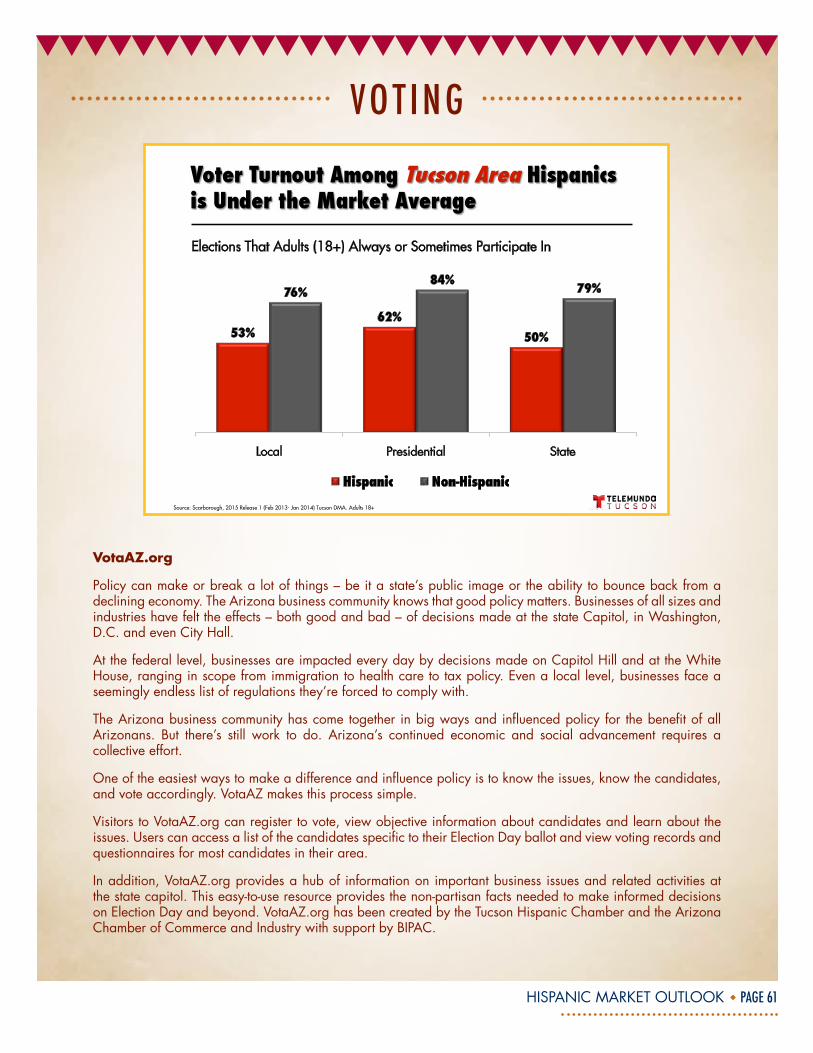
Source: Scarborough, 2015 Release 1 (Feb 2013- Jan 2014) Tucson DMA. Adults 18+
Elections That Adults (18+) Always or Sometimes Participate In
53%62%
50%
76%84%
79%
Local Presidential State
Hispanic Non-Hispanic
VotaAZ.org
Policy can make or break a lot of things – be it a state’s public image or the ability to bounce back from a declining economy. The Arizona business community knows that good policy matters. Businesses of all sizes and industries have felt the effects – both good and bad – of decisions made at the state Capitol, in Washington, D.C. and even City Hall.
At the federal level, businesses are impacted every day by decisions made on Capitol Hill and at the White House, ranging in scope from immigration to health care to tax policy. Even a local level, businesses face a seemingly endless list of regulations they’re forced to comply with.
The Arizona business community has come together in big ways and influenced policy for the benefit of all Arizonans. But there’s still work to do. Arizona’s continued economic and social advancement requires a collective effort.
One of the easiest ways to make a difference and influence policy is to know the issues, know the candidates, and vote accordingly. VotaAZ makes this process simple.
Visitors to VotaAZ.org can register to vote, view objective information about candidates and learn about the issues. Users can access a list of the candidates specific to their Election Day ballot and view voting records and questionnaires for most candidates in their area.
In addition, VotaAZ.org provides a hub of information on important business issues and related activities at the state capitol. This easy-to-use resource provides the non-partisan facts needed to make informed decisions on Election Day and beyond. VotaAZ.org has been created by the Tucson Hispanic Chamber and the Arizona Chamber of Commerce and Industry with support by BIPAC.
HISPANIC MARKET OUTLOOK PAGE 62
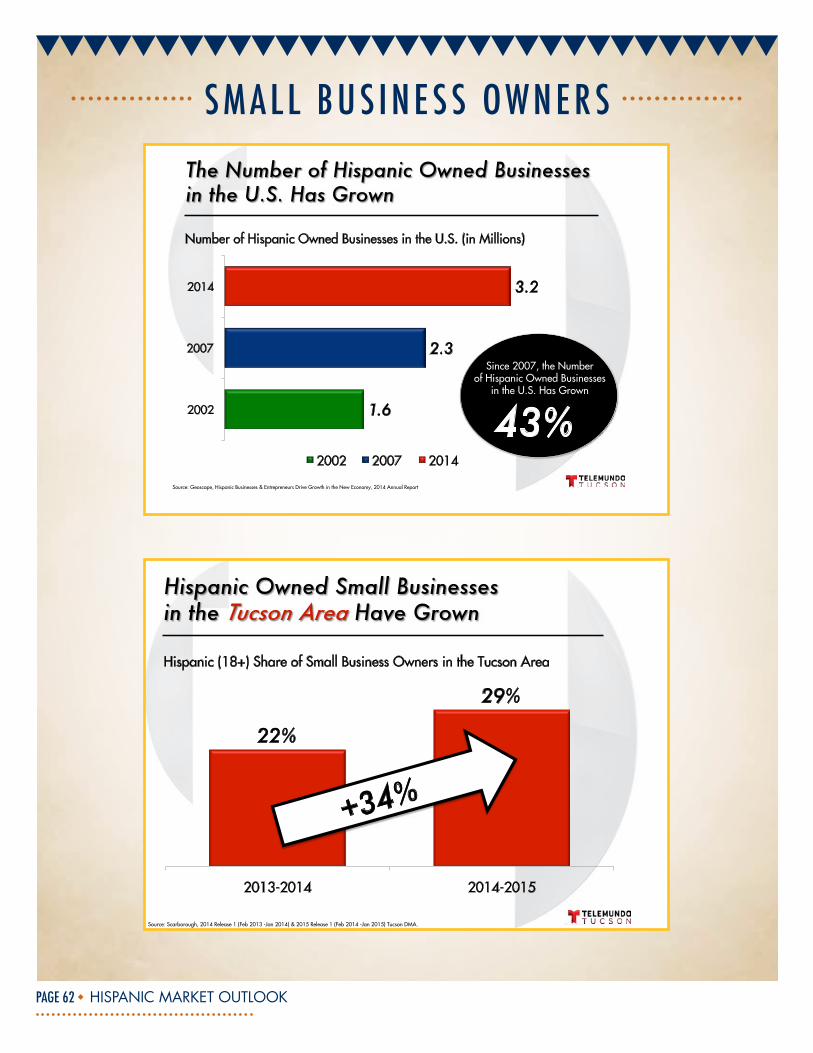
sMAll bUs InEss ownERs
Number of Hispanic Owned Businesses in the U.S. (in Millions)
1.6
2.3
3.2
2002
2007
2014
2002 2007 2014
Since 2007, the Number of Hispanic Owned Businesses
in the U.S. Has Grown
43% Source: Geoscape, Hispanic Businesses & Entrepreneurs Drive Growth in the New Economy, 2014 Annual Report
22%
29%
2013-2014 2014-2015
+34%
Hispanic (18+) Share of Small Business Owners in the Tucson Area
Source: Scarborough, 2014 Release 1 (Feb 2013 -Jan 2014) & 2015 Release 1 (Feb 2014 -Jan 2015) Tucson DMA.
HISPANIC MARKET OUTLOOK PAGE 63
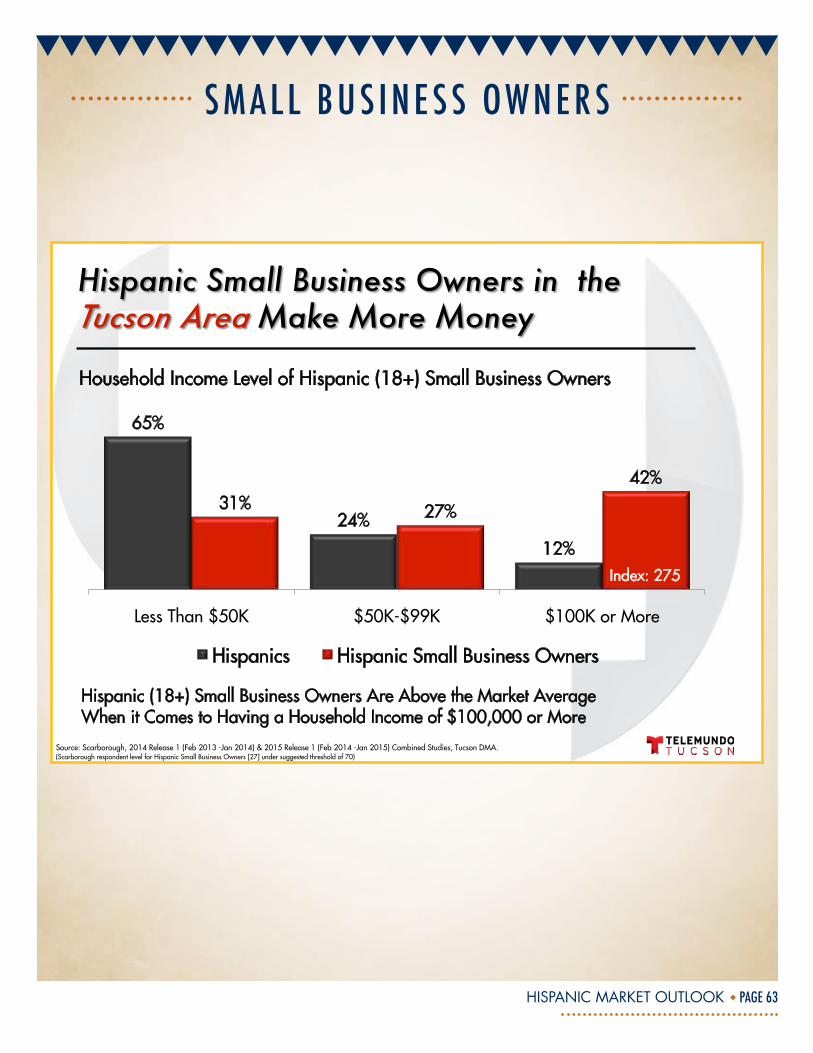
sMAll bUs InEss ownERs
Household Income Level of Hispanic (18+) Small Business Owners
Hispanic (18+) Small Business Owners Are Above the Market Average When it Comes to Having a Household Income of $100,000 or More
65%
24%
12%
31% 27%
42%
Less Than $50K $50K-$99K $100K or More
Hispanics Hispanic Small Business Owners
Source: Scarborough, 2014 Release 1 (Feb 2013 -Jan 2014) & 2015 Release 1 (Feb 2014 -Jan 2015) Combined Studies, Tucson DMA. (Scarborough respondent level for Hispanic Small Business Owners [27] under suggested threshold of 70)
Index: 275
HISPANIC MARKET OUTLOOK PAGE 64
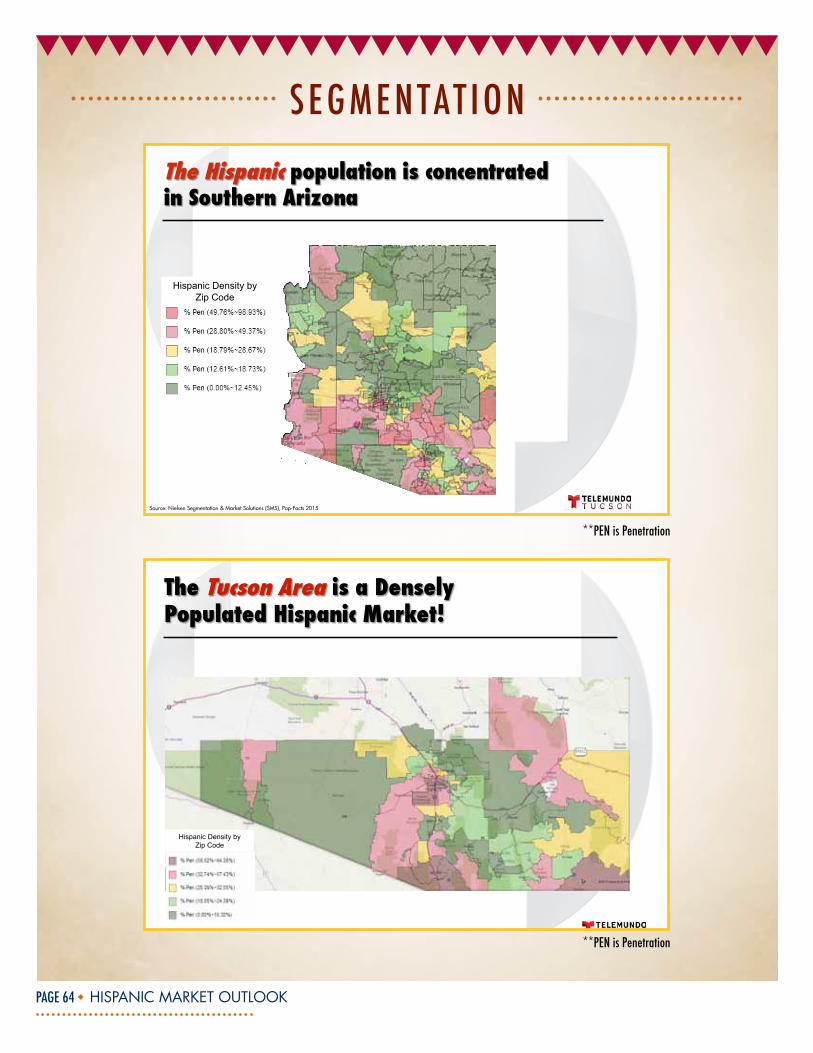
sEGMEntAt Ion
Source: Nielsen Segmentation & Market Solutions (SMS), Pop-Facts 2015
Hispanic Density by Zip Code
Source: Nielsen Segmentation & Market Solutions (SMS), Pop-Facts 2015
Hispanic Density by Zip Code
**PEn is Penetration
**PEn is Penetration
HISPANIC MARKET OUTLOOK PAGE 65
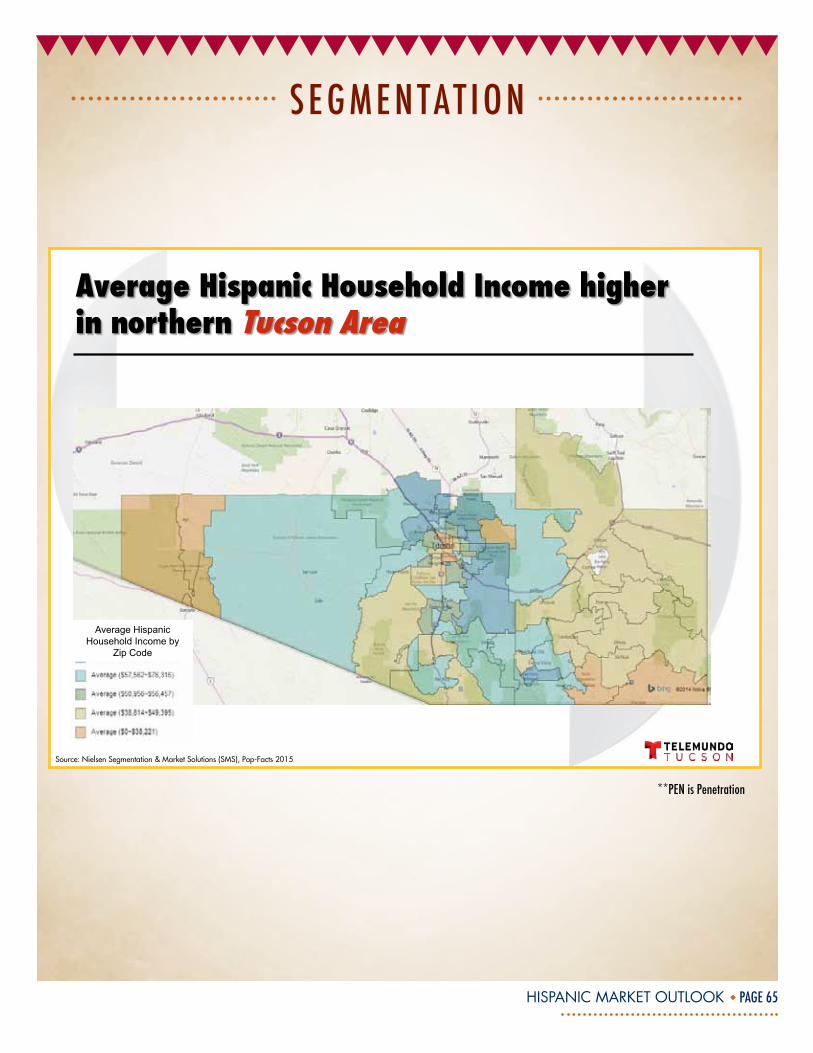
sEGMEntAt Ion
Source: Nielsen Segmentation & Market Solutions (SMS), Pop-Facts 2015
Average Hispanic Household Income by
Zip Code
**PEn is Penetration
HISPANIC MARKET OUTLOOK PAGE 66
HISPANIC MARKET OUTLOOK PAGE 67
DO MORE FOR YOUR COMMUNITY.
© 2015 JPMorgan Chase Bank, N.A. Member FDIC
EDWARD ALTAMIRANO, BUSINESS BANKING AREA MANAGER 520-792-60492 East CongressTucson, AZ 85701
SO YOU CANCHASE IS PROUD TO SUPPORT THE TUCSON HISPANIC CHAMBER OF COMMERCE
Visit Your Local Chase Branch Today.
And now, a proud member of
Tucson Medical Center is proud to announce its selection as a member of the Mayo Clinic Care Network.
This collaboration is not a merger or acquisition. TMC remains Tucson’s only independent, community-owned, not for profit hospital. What it does mean is:
Better healthcare for you. Now, doctors who practice at TMC have access to the world-renowned expertise of Mayo Clinic specialists.
At no additional cost, patients with complex medical cases benefit from having their own specialist collaborate with Mayo specialists to develop the best course of action for treatment. It’s part of TMC’s commitment to bring you the best healthcare – anywhere. When it comes to your health, you have choices to make.
Choose Well. Choose TMC.
5301 E. Grant Road | Tucson, AZ 85712 | (520) 327-5461 | tmcaz.com
BASADOS EN LA COMUNIDAD • ENFOCADOS AL PACIENTEESTAMOS
HISPANIC MARKET OUTLOOK PAGE 68
Become a member of the credit union with the home court advantage. As a local financial institution for more than 63 years, all decisions are made right here in Tucson. Our profits go towards supporting lower fees and better interest rates for our members.
As a member, you’ll score big with:
• Free checking with no minimum balance
• Exclusive, free University of Arizona® Visa® Debit cards in many designs, issued instantly in our branches
• eServices that put banking at your fingertips, including free Bill Pay, mobile banking and mobile deposits
• A vast network of free ATMs throughout Tucson and the US
• One low rate for the loan you need–no matter your credit score.* Apply and close your loan all online with our new eSign.**
Meet your financial goals by joining our team. Jump online at HughesFCU.org or call 520-794-JOIN.
Sean Miller The University of Arizona® Head Men’s Basketball Coach
Now offering
Apple Pay™
520-794-JOIN | HughesFCU.org
Get your official University of Arizona® debit card exclusively at Hughes!
Instant issue available in all branches, excluding Voyager Resort branch. *One Low Rate applies to all loans except credit builder and mortgage loans and applies to Visa® Classic Credit cards. **For members only. Excludes certain loan types. Based on credit approval. Certain restrictions apply. The University of Arizona® is a trademark of The University of Arizona and is used with permission. Visa® is a registered trademark of Visa International Service Association. Apple, and the Apple logo, are trademarks of Apple Inc., registered in the U.S. and other countries.
Federally Insured
by NCUA
team
winningMy
Like teamwork, membership makes the difference.
Follow the official Job Corps apge on Facebook at www.facebook.com/doljobcorps
Watch Job Corps on YouTubeat www.youtube.com/doljobcorps
For more Information about Job CorpsContact Ed Dummit, BCL/CTS Manager
at 520-792-3015 or [email protected]
HISPANIC MARKET OUTLOOK PAGE 69
602.631.2300 | 800.231.1363 | En español 602.631.2302 | copperpoint.com
work for youPut us to
CopperPoint is committed to providing
workers compensation insurance expertise
along with great customer service.
Financially strong and service oriented,
CopperPoint delivers Peace of Mind.
Put CopperPoint to work for you.

HISPANIC MARKET OUTLOOK PAGE 70
ROCK YOUR CAREERin the customer service industry!
NOW HIRINGStop by an Afni center Monday - Friday (9 am to 4 pm) to apply and take Afni's skill and compatibility assessment. You may even have an interview the same day!
Customer Service Representatives - 5320 N. LaCholla Blvd.Customer Service Representatives - 5451 E. Williams Blvd.Customer Sales Representatives - 7810 E. Escalante Rd.
AfniCareers.com/Tucson
HISPANIC MARKET OUTLOOK PAGE 71
The State of Southern Arizona's Hispanic Market
www.tucsonhispanicchamber.org
Southern Arizona