Embed Size (px)
Citation preview
STATE OF SOFTWARE
SECURITY Focus on Application Development
SUPPLEMENT TO VOLUME 6

03 VERACODE State of Software Security Report, Supplement to Volume 6: Focus on Application Development
1VERACODE State of Software Security Report, Supplement to Volume 6: Focus on Application Development
CO
NT
EN
TS Introduction by Chris Wysopal, CTO, CISO and Co-Founder, Veracode . . . 2
Executive Summary . . . . . . . . . . . . . . . . . . . . . . . . . . . . . . . . . . 3
Application Development Landscape . . . . . . . . . . . . . . . . . . . . . . .4
Programming language distribution . . . . . . . . . . . . . . . . . . . . . . . . .4
Policy compliance by programming language . . . . . . . . . . . . . . . . . . . 5
Top 10 vulnerability categories by programming language . . . . . . . . . . . . 6
Comparison of critical vulnerability types. . . . . . . . . . . . . . . . . . . . . . 8
Security Assessment Types . . . . . . . . . . . . . . . . . . . . . . . . . . . . 11
Remediation Analysis . . . . . . . . . . . . . . . . . . . . . . . . . . . . . . . . 13
Developer education. . . . . . . . . . . . . . . . . . . . . . . . . . . . . . . . . 13
Type of application security analysis. . . . . . . . . . . . . . . . . . . . . . . . 14
Appendix . . . . . . . . . . . . . . . . . . . . . . . . . . . . . . . . . . . . . . . 15
About the dataset . . . . . . . . . . . . . . . . . . . . . . . . . . . . . . . . . . 15
Flaw density by programming language . . . . . . . . . . . . . . . . . . . . . 15
2 VERACODE State of Software Security Report, Supplement to Volume 6: Focus on Application Development
IntroductionVeracode has assessed applications for security vulnerabilities on behalf
of our customers for over eight years. Our cloud-based platform has
analyzed hundreds of thousands of applications and over 1.5 trillion lines
of code. This has enabled us to amass a great deal of intelligence about
the state of software security. This intelligence allows us to diagnose
whether an organization is effectively reducing application security risk,
and to gain insight into how the process of reducing application risk
varies by organization and by development team.
When we relaunched the State of Software Security report series earlier this year, we focused on the
performance of organizations through the lens of industry verticals. This provides CISOs and application
security professionals with an important benchmark of how their application security programs are
proceeding relative to their peers.
But this perspective is only part of the story. As we answered questions from customers and others after
the release of State of Software Security Volume 6, it became clear that we could shed light on the story from
another angle, that of the differing risks inherent in applications according to the language used and the method
of their construction. The stakes are not small, and the timing is crucial. As organizations simultaneously con-
template the shift to continuous delivery and other DevOps innovations, and as they begin to feel the pressure
to break their applications apart into smaller, more sustainable units, they face what could be an ideal moment
to help their development teams make decisions to help improve the security of their enterprises.
When organizations are starting new development projects and selecting languages and methodologies,
the security team has an opportunity to anticipate the types of vulnerabilities that are likely to arise and how
best to test for them. The data in this report can inform decisions around developer training and which testing
techniques to use in order to make the inevitable remediation process less onerous. This information can make
it easier for security to work with development to increase the maturity of security in the SDLC and produce
less risky applications.
Chris Wysopal
CTO, CISO and Co-Founder
Veracode
3VERACODE State of Software Security Report, Supplement to Volume 6: Focus on Application Development
Executive Summary
1. Applications written in web scripting languages
have a far higher prevalence rate of vulnerability
classes like SQL injection and Cross-Site Scripting
than applications written in .NET or Java. In
particular, 64 percent of applications written in
Microsoft’s Classic ASP, 62 percent of applications
written in ColdFusion, and 56 percent of applica-
tions written in PHP were observed to have at least
one SQL injection vulnerability on initial assessment,
compared to 29 percent of .NET applications and
21 percent of Java applications. This is of concern
given the large numbers of web applications written
atop PHP-based content management systems
such as WordPress and Drupal.
2. Mobile applications had the highest rate of
cryptographic issues, at 87 percent for Android
and 80 percent for iOS. This suggests that while
mobile app developers may be aware of the need
for cryptography to protect sensitive data and thus
use it in their applications, few of them know how
to implement it correctly.
3. Applications written in different software
languages have differing pass rates against com-
mon security policies like the OWASP Top 10. This
discrepancy is due, in part, to different vulnerability
distributions, but development teams should be
aware of the statistical risks for applications written
in a particular language when considering the threat
model for the application.
4. eLearning has a big impact on remediation.
Lack of developer knowledge of security is often
cited as a barrier to producing more secure code.
The data shows that development organizations
that leverage eLearning see a 30 percent improve-
ment in fix rate compared to those that do not.
It is important to note that this may be correlative
rather than causative, since eLearning use is
associated with other success strategies such
as use of centralized policies, remediation coaching
and other aspects of a systematic program.
5. The choice of assessment type can make a
difference in remediation as well. We see a 28
percent higher fix rate for vulnerabilities found by
static analysis compared to those found by dynamic
analysis. While no single assessment technology is
sufficient to secure an application, understanding
the tools’ strengths and weaknesses as it comes
to fixing — not just finding — software vulnerabilities
is important.
4 VERACODE State of Software Security Report, Supplement to Volume 6: Focus on Application Development
Application Development Landscape The application development landscape continues to change rapidly as the
technology landscape evolves. What appeared five years ago to be separate
development trends around web and mobile applications now increasingly
looks like an integrated strategy of mobile-first development, leading to the
evolution of JavaScript-heavy single page applications.
In application development practices, the ongoing debate about agile versus waterfall has turned into a discussion
of going even faster, with continuous deployment pipelines enabling organizations to push hundreds of changes
daily directly from check-in to production. And development organizations have started to pull security left into
the development process, moving away from the old model of security as a QA or deployment gate.
Against this background of changes, this report provides an overview of applications that are being developed
by Veracode customers across a wide array of industries and use cases, from large enterprises to small enterprises
to independent software vendors. This section provides some context about the composition of Veracode’s
application repository with which to interpret the findings about application security that follow.
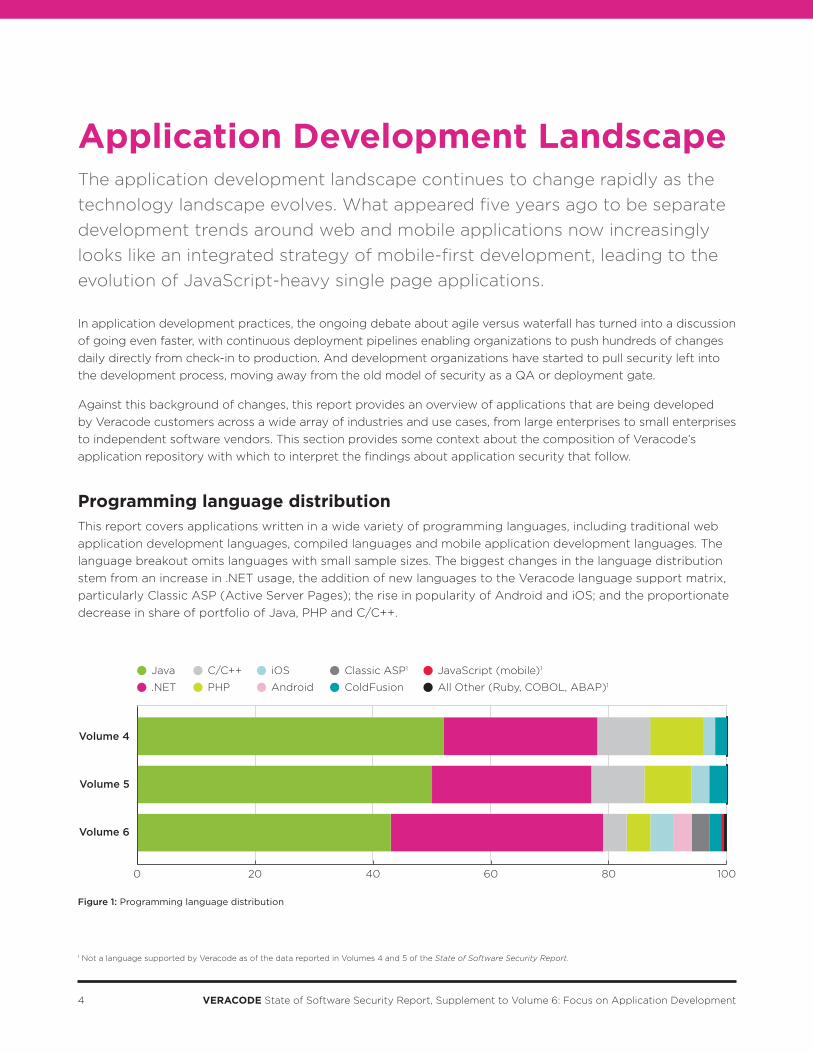
Programming language distributionThis report covers applications written in a wide variety of programming languages, including traditional web
application development languages, compiled languages and mobile application development languages. The
language breakout omits languages with small sample sizes. The biggest changes in the language distribution
stem from an increase in .NET usage, the addition of new languages to the Veracode language support matrix,
particularly Classic ASP (Active Server Pages); the rise in popularity of Android and iOS; and the proportionate
decrease in share of portfolio of Java, PHP and C/C++.
Volume 4
Volume 5
Volume 6
0 20 40 60 80 100
Classic ASP1
.NET ColdFusionPHP
Java
Android
C/C++ iOS JavaScript (mobile)1
All Other (Ruby, COBOL, ABAP)1
Figure 1: Programming language distribution
1 Not a language supported by Veracode as of the data reported in Volumes 4 and 5 of the State of Software Security Report.
5VERACODE State of Software Security Report, Supplement to Volume 6: Focus on Application Development
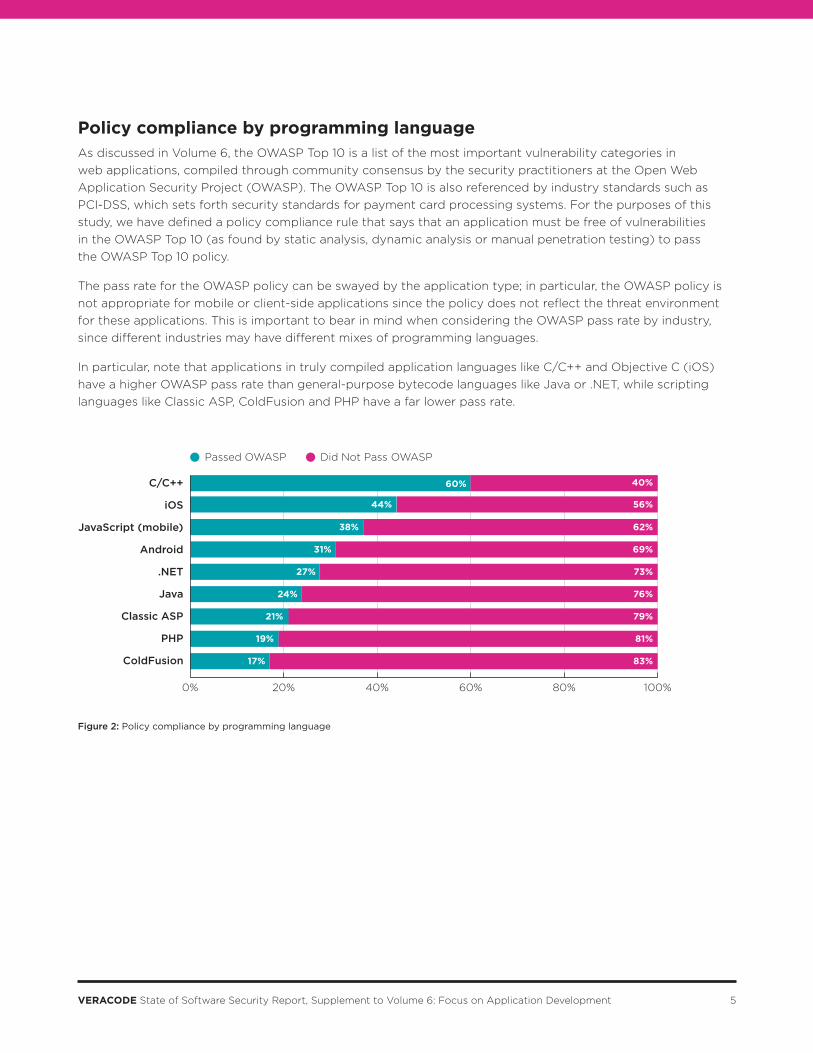
Policy compliance by programming languageAs discussed in Volume 6, the OWASP Top 10 is a list of the most important vulnerability categories in
web applications, compiled through community consensus by the security practitioners at the Open Web
Application Security Project (OWASP). The OWASP Top 10 is also referenced by industry standards such as
PCI-DSS, which sets forth security standards for payment card processing systems. For the purposes of this
study, we have defined a policy compliance rule that says that an application must be free of vulnerabilities
in the OWASP Top 10 (as found by static analysis, dynamic analysis or manual penetration testing) to pass
the OWASP Top 10 policy.
The pass rate for the OWASP policy can be swayed by the application type; in particular, the OWASP policy is
not appropriate for mobile or client-side applications since the policy does not reflect the threat environment
for these applications. This is important to bear in mind when considering the OWASP pass rate by industry,
since different industries may have different mixes of programming languages.
In particular, note that applications in truly compiled application languages like C/C++ and Objective C (iOS)
have a higher OWASP pass rate than general-purpose bytecode languages like Java or .NET, while scripting
languages like Classic ASP, ColdFusion and PHP have a far lower pass rate.
38%
44%
60%
62%
56%
40%
31% 69%
27% 73%
24% 76%
21% 79%
19% 81%
17% 83%
C/C++
iOS
JavaScript (mobile)
Android
.NET
Java
Classic ASP
PHP
ColdFusion
Passed OWASP Did Not Pass OWASP
0% 20% 40% 60% 80% 100%
Figure 2: Policy compliance by programming language
6 VERACODE State of Software Security Report, Supplement to Volume 6: Focus on Application Development
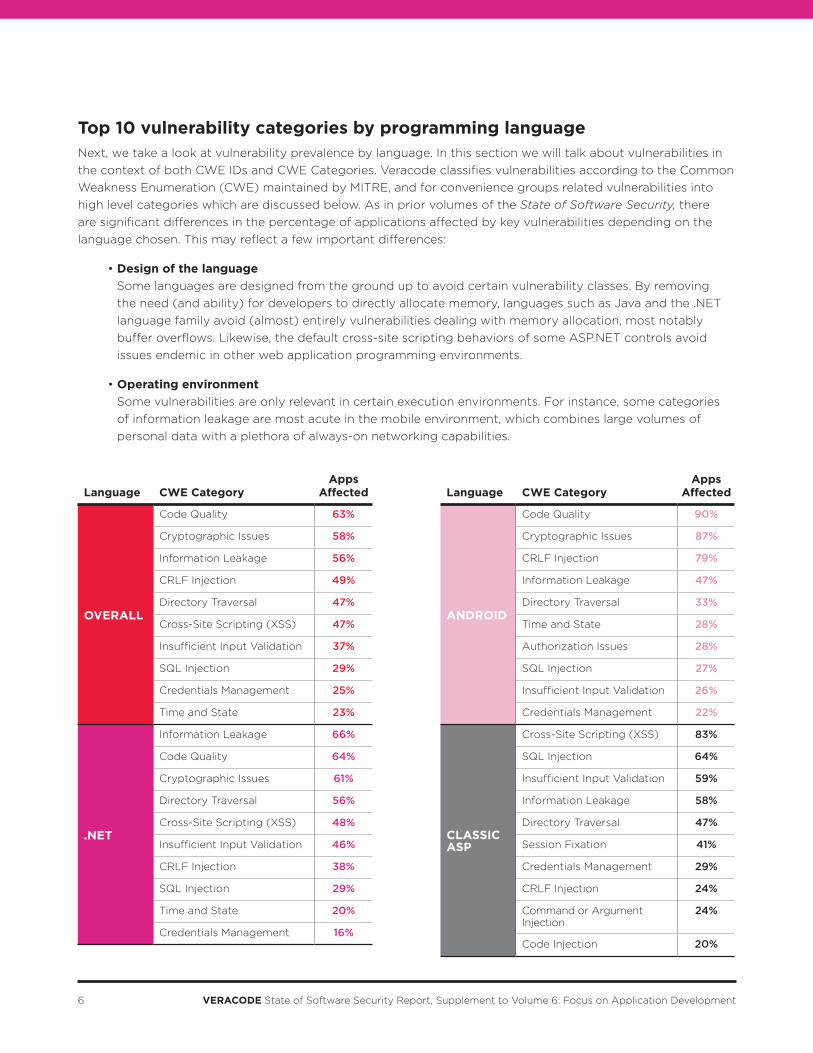
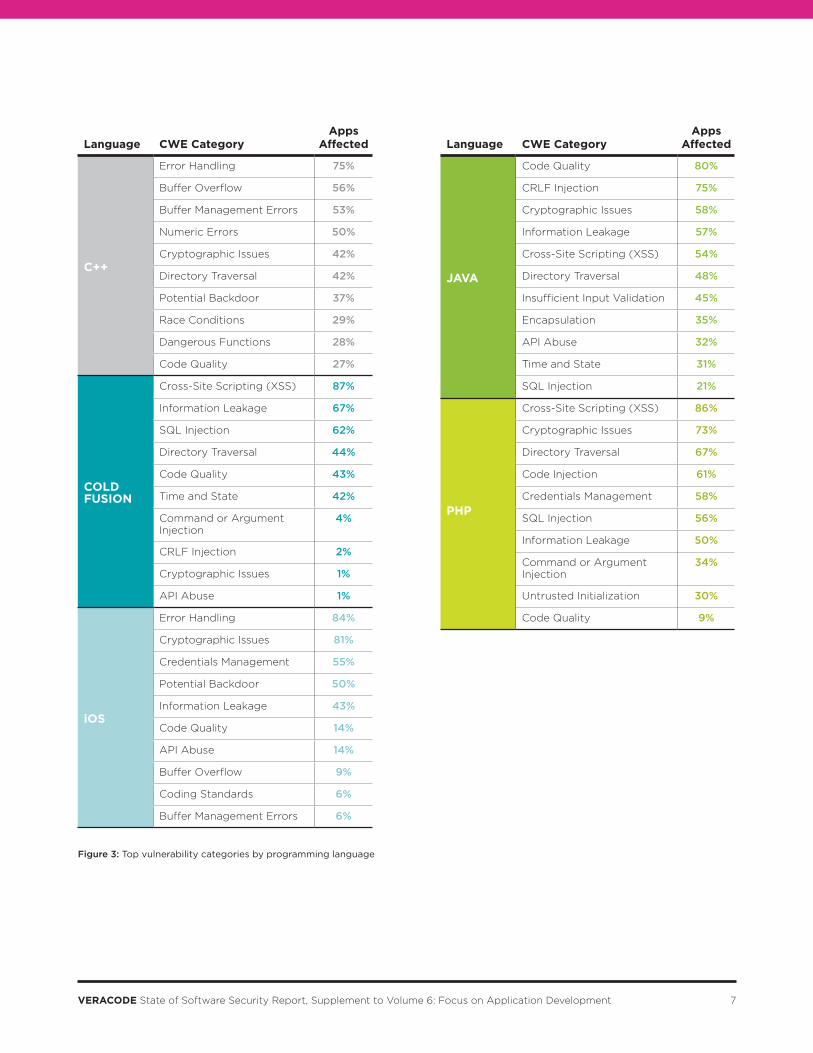
Top 10 vulnerability categories by programming languageNext, we take a look at vulnerability prevalence by language. In this section we will talk about vulnerabilities in
the context of both CWE IDs and CWE Categories. Veracode classifies vulnerabilities according to the Common
Weakness Enumeration (CWE) maintained by MITRE, and for convenience groups related vulnerabilities into
high level categories which are discussed below. As in prior volumes of the State of Software Security, there
are significant differences in the percentage of applications affected by key vulnerabilities depending on the
language chosen. This may reflect a few important differences:
• Design of the language
Some languages are designed from the ground up to avoid certain vulnerability classes. By removing
the need (and ability) for developers to directly allocate memory, languages such as Java and the .NET
language family avoid (almost) entirely vulnerabilities dealing with memory allocation, most notably
buffer overflows. Likewise, the default cross-site scripting behaviors of some ASP.NET controls avoid
issues endemic in other web application programming environments.
• Operating environment
Some vulnerabilities are only relevant in certain execution environments. For instance, some categories
of information leakage are most acute in the mobile environment, which combines large volumes of
personal data with a plethora of always-on networking capabilities.
Language
CWE Category
Apps Affected
OVERALL
Code Quality 63%
Cryptographic Issues 58%
Information Leakage 56%
CRLF Injection 49%
Directory Traversal 47%
Cross-Site Scripting (XSS) 47%
Insufficient Input Validation 37%
SQL Injection 29%
Credentials Management 25%
Time and State 23%
.NET
Information Leakage 66%
Code Quality 64%
Cryptographic Issues 61%
Directory Traversal 56%
Cross-Site Scripting (XSS) 48%
Insufficient Input Validation 46%
CRLF Injection 38%
SQL Injection 29%
Time and State 20%
Credentials Management 16%
Language
CWE Category
Apps Affected
ANDROID
Code Quality 90%
Cryptographic Issues 87%
CRLF Injection 79%
Information Leakage 47%
Directory Traversal 33%
Time and State 28%
Authorization Issues 28%
SQL Injection 27%
Insufficient Input Validation 26%
Credentials Management 22%
CLASSIC ASP
Cross-Site Scripting (XSS) 83%
SQL Injection 64%
Insufficient Input Validation 59%
Information Leakage 58%
Directory Traversal 47%
Session Fixation 41%
Credentials Management 29%
CRLF Injection 24%
Command or Argument Injection
24%
Code Injection 20%
7VERACODE State of Software Security Report, Supplement to Volume 6: Focus on Application Development
Language CWE CategoryApps
Affected
C++
Error Handling 75%
Buffer Overflow 56%
Buffer Management Errors 53%
Numeric Errors 50%
Cryptographic Issues 42%
Directory Traversal 42%
Potential Backdoor 37%
Race Conditions 29%
Dangerous Functions 28%
Code Quality 27%
COLD FUSION
Cross-Site Scripting (XSS) 87%
Information Leakage 67%
SQL Injection 62%
Directory Traversal 44%
Code Quality 43%
Time and State 42%
Command or Argument Injection
4%
CRLF Injection 2%
Cryptographic Issues 1%
API Abuse 1%
iOS
Error Handling 84%
Cryptographic Issues 81%
Credentials Management 55%
Potential Backdoor 50%
Information Leakage 43%
Code Quality 14%
API Abuse 14%
Buffer Overflow 9%
Coding Standards 6%
Buffer Management Errors 6%
Language CWE CategoryApps
Affected
JAVA
Code Quality 80%
CRLF Injection 75%
Cryptographic Issues 58%
Information Leakage 57%
Cross-Site Scripting (XSS) 54%
Directory Traversal 48%
Insufficient Input Validation 45%
Encapsulation 35%
API Abuse 32%
Time and State 31%
SQL Injection 21%
PHP
Cross-Site Scripting (XSS) 86%
Cryptographic Issues 73%
Directory Traversal 67%
Code Injection 61%
Credentials Management 58%
SQL Injection 56%
Information Leakage 50%
Command or Argument Injection
34%
Untrusted Initialization 30%
Code Quality 9%
Figure 3: Top vulnerability categories by programming language
8 VERACODE State of Software Security Report, Supplement to Volume 6: Focus on Application Development
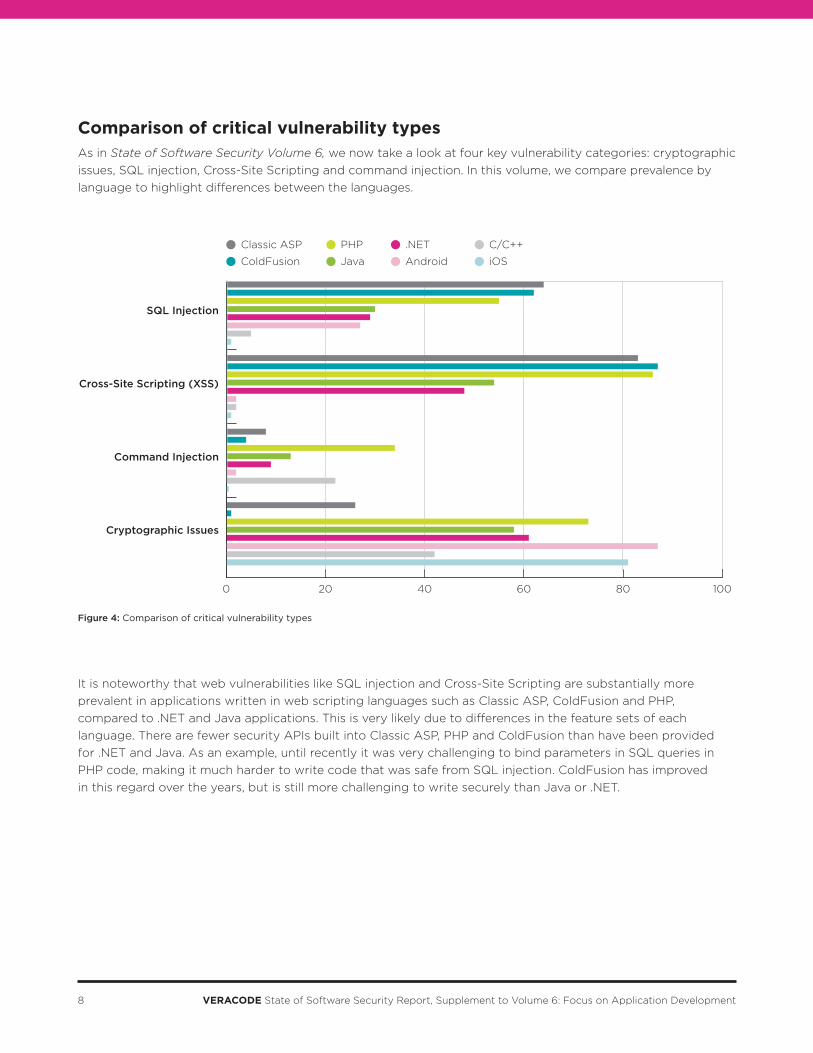
Comparison of critical vulnerability typesAs in State of Software Security Volume 6, we now take a look at four key vulnerability categories: cryptographic
issues, SQL injection, Cross-Site Scripting and command injection. In this volume, we compare prevalence by
language to highlight differences between the languages.
It is noteworthy that web vulnerabilities like SQL injection and Cross-Site Scripting are substantially more
prevalent in applications written in web scripting languages such as Classic ASP, ColdFusion and PHP,
compared to .NET and Java applications. This is very likely due to differences in the feature sets of each
language. There are fewer security APIs built into Classic ASP, PHP and ColdFusion than have been provided
for .NET and Java. As an example, until recently it was very challenging to bind parameters in SQL queries in
PHP code, making it much harder to write code that was safe from SQL injection. ColdFusion has improved
in this regard over the years, but is still more challenging to write securely than Java or .NET.
SQL Injection
Cross-Site Scripting (XSS)
Command Injection
Cryptographic Issues
0 20 40 60 80 100
Classic ASP .NET
ColdFusion
PHP
Java Android
C/C++
iOS
Figure 4: Comparison of critical vulnerability types
9VERACODE State of Software Security Report, Supplement to Volume 6: Focus on Application Development
One particular concern related to this data point is the high prevalence of PHP-based applications, thanks to
the widespread adoption of content management system (CMS) frameworks like WordPress, Drupal and Joomla.
According to some estimates, 74.6 million web sites use WordPress, and another few million use Drupal and
Joomla. The combination of the statistically higher prevalence of OWASP Top 10 vulnerabilities in PHP and the
wide usage of PHP-based CMSes is a recipe for some concern in the health of the wider Internet, and means that
organizations seeking to use these CMSes should carefully plan their deployments.
By contrast, a significantly larger number of mobile applications (both Android and iOS) have some type of
cryptographic issue, 87 percent and 81 percent, compared to other languages.
This data does not suggest that any language will be free of vulnerabilities, but it does show that there are
definite differences in the likelihood of running into these critical vulnerabilities. While it is unlikely that any
development team would develop new applications in Classic ASP, it does suggest a strategy for how to
prioritize assessment — or replacement — of these applications.
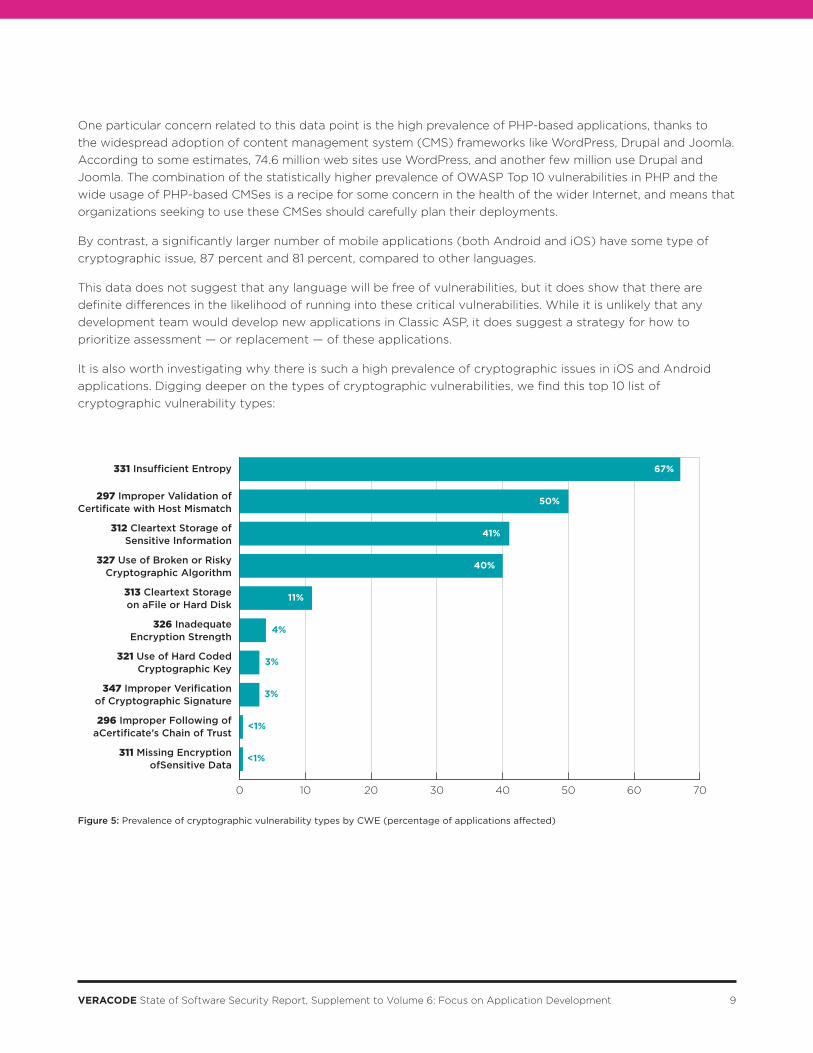
It is also worth investigating why there is such a high prevalence of cryptographic issues in iOS and Android
applications. Digging deeper on the types of cryptographic vulnerabilities, we find this top 10 list of
cryptographic vulnerability types:
0 10 20 30 40 50 60 70
67%
40%
11%
50%
41%
4%
3%
3%
<1%
<1%
331 Insufficient Entropy
297 Improper Validation ofCertificate with Host Mismatch
312 Cleartext Storage ofSensitive Information
327 Use of Broken or RiskyCryptographic Algorithm
313 Cleartext Storageon aFile or Hard Disk
326 InadequateEncryption Strength
321 Use of Hard CodedCryptographic Key
347 Improper Verificationof Cryptographic Signature
296 Improper Following ofaCertificate’s Chain of Trust
311 Missing EncryptionofSensitive Data
Figure 5: Prevalence of cryptographic vulnerability types by CWE (percentage of applications affected)
10 VERACODE State of Software Security Report, Supplement to Volume 6: Focus on Application Development
In this data, we see a combination of poor cryptographic practices — failure to store sensitive data properly,
using poor or known broken encryption algorithms, or failure to correctly communicate with secure services.
Unfortunately for developers of mobile enterprise applications, the storage and encryption of sensitive data
and secure communication to secure services are the essence of what is required to correctly protect user data.
What are the consequences of poor cryptographic practices in mobile applications? Looking back at the data
in State of Software Security Volume 6: Industry Vertical Analysis, we saw a disproportionately high share of
iOS and Android applications in both the technology and healthcare industries. The issue of poor cryptographic
practices in healthcare mobile applications is particularly troubling, given the rapid adoption of mobile apps in
that industry as a way for doctors to more quickly address patient care issues. A 2012 Pew study reported that
19 percent of smartphone users had downloaded a health app, and 52 percent sought health information on
their phone — and this was prior to Apple’s introduction of a unified framework for health data in 2014. A policy
brief by the Robert Wood Johnson Foundation in the journal Health Affairs predicts that health app prevalence
will rise to half the mobile device users worldwide by 2018.2
However, any personal health data in health apps bears a higher standard for security and privacy than that
in typical mobile apps, thanks to the requirements established in HIPAA in 1996. The high prevalence of crypto
vulnerabilities in these applications suggests that the market trend toward more convenient mobile access to
and storage of health information is likely to hit roadblocks in the form of data leakage from insecure mobile
apps and the services to which they connect.
2 Robert Wood Johnson Foundation brief cited in Conn, Joseph. “No longer a novelty, medical apps are increasingly valuable to clinicians and patients,”
Modern Healthcare, 2013-12-14.
11VERACODE State of Software Security Report, Supplement to Volume 6: Focus on Application Development
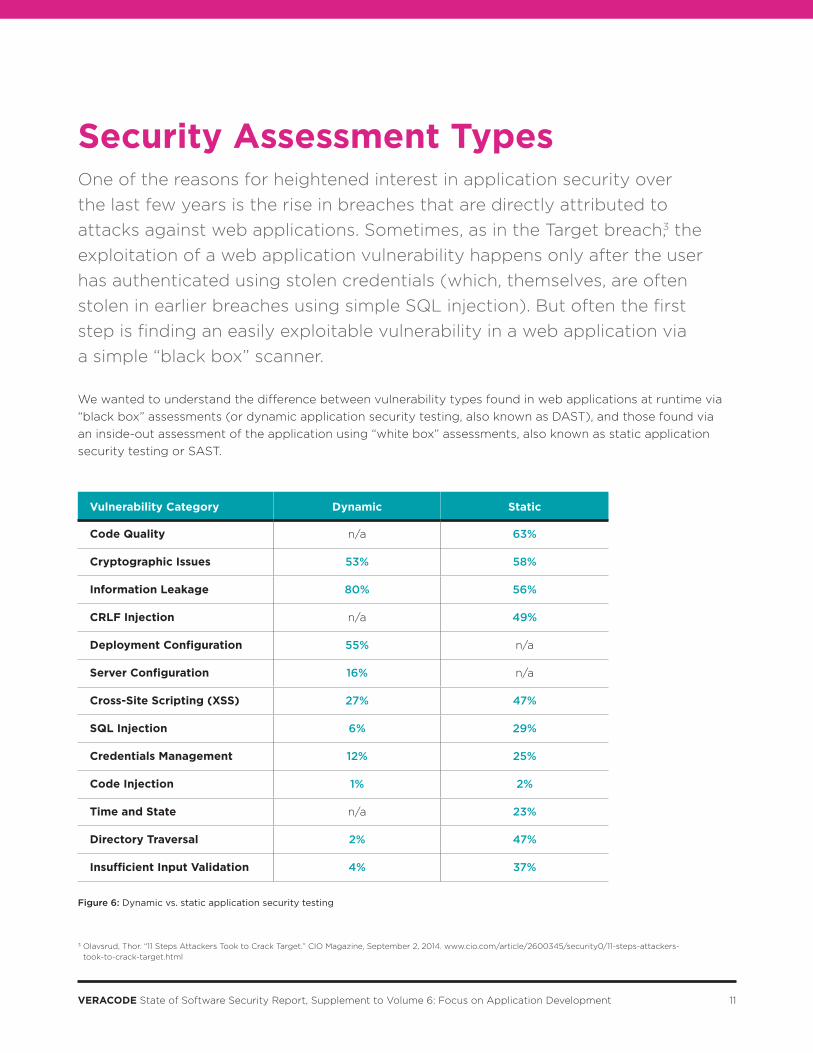
Security Assessment TypesOne of the reasons for heightened interest in application security over
the last few years is the rise in breaches that are directly attributed to
attacks against web applications. Sometimes, as in the Target breach,3 the
exploitation of a web application vulnerability happens only after the user
has authenticated using stolen credentials (which, themselves, are often
stolen in earlier breaches using simple SQL injection). But often the first
step is finding an easily exploitable vulnerability in a web application via
a simple “black box” scanner.
We wanted to understand the difference between vulnerability types found in web applications at runtime via
“black box” assessments (or dynamic application security testing, also known as DAST), and those found via
an inside-out assessment of the application using “white box” assessments, also known as static application
security testing or SAST.
Vulnerability Category Dynamic Static
Code Quality n/a 63%
Cryptographic Issues 53% 58%
Information Leakage 80% 56%
CRLF Injection n/a 49%
Deployment Configuration 55% n/a
Server Configuration 16% n/a
Cross-Site Scripting (XSS) 27% 47%
SQL Injection 6% 29%
Credentials Management 12% 25%
Code Injection 1% 2%
Time and State n/a 23%
Directory Traversal 2% 47%
Insufficient Input Validation 4% 37%
Figure 6: Dynamic vs. static application security testing
3 Olavsrud, Thor. “11 Steps Attackers Took to Crack Target.” CIO Magazine, September 2, 2014. www.cio.com/article/2600345/security0/11-steps-attackers-
took-to-crack-target.html
12 VERACODE State of Software Security Report, Supplement to Volume 6: Focus on Application Development
As noted, there are several vulnerability categories that are uniquely found by each approach. Those
uniquely found by DAST, deployment configuration and server configuration, include issues that are outside
the application code context but comprise part of the operating runtime of the application, including miscon-
figurations that may cause private web application resources (such as configuration files) to leak, or that may
allow downgrading to a less secure protected channel. Those uniquely found by SAST tend to be categories
that are challenging to observe via black box assessments, such as CRLF attacks (log or header forging), code
quality issues (including leftover debug code, use after free/double free, use of unsafe native code invocation
and other vulnerability types), and time and state errors (issues with temporary file, concurrency issues and
incorrect ownership assignment).
It is tempting to look at the higher reported prevalence of SQL injection and Cross-Site Scripting via SAST and
draw conclusions about false positive rates. The reality is that the two assessment techniques are fundamentally
different and will naturally show different prevalence. DAST relies on the ability to successfully crawl and discover
the attack surface of an application, and therefore requires more time to achieve high levels of code coverage.
We observe, however, that there is frequently pressure to shorten the time window for dynamic assessments,
based on testing windows or operational concerns. It is also challenging for DAST to fully exercise workflows
and business logic that are not easily automated, for instance, a sequence of forms that must be completed in
a certain order with certain values to access business functionality. Therefore, the reported prevalence of these
categories by DAST may understate the real situation. By the same token, SAST may report findings in these
categories that are not practically exploitable without compromising other trusted resources. such as file
systems or databases.
As has been shown many times in the industry, each of the assessment technologies available has different
strengths. A mature program will typically recognize the strengths and weaknesses of each technique and use
them at the appropriate times in the lifecycle. For instance, Gartner’s Ramon Krikken and Ben Tomhave have
suggested that organizations plan to use DAST at system test, prerelease testing, and in production, while
bringing SAST further back the SDLC, beginning in prerelease testing but also in automated continuous
integration driven testing and from the developer’s desktop.4
4 Gartner (Ramon Krikken and Ben Tomhave), “How to perform application security testing for web and mobile applications.” January 30, 2015.
13VERACODE State of Software Security Report, Supplement to Volume 6: Focus on Application Development
Remediation AnalysisIn State of Software Security Volume 6, we looked at remediation rates by
industry and evaluated a factor that may contribute to improved remediation
rates: use of remediation coaching. This report continues to evaluate other
factors that may contribute to improved remediation rates, including formal
developer education and type of security analysis performed.
Developer educationOne of the holy grails of application security programs is to reduce the rate of introduction of security vulner-
abilities. One way that industry attempts to help with this is through formal developer education. The PCI-DSS
standard goes so far as to mandate developer education in secure coding practices in support of this goal.
Many application security providers offer a developer education capability as part of their offerings, either
via in-house developed content or through a partnership with a learning content provider. This section of the
report looks at differences in remediation practice for Veracode customers who have established an eLearning
program, versus those who have not.
Note: It is challenging to obtain precise measurements of the effectiveness of developer education. To many
a CISO’s chagrin, it is difficult to measure prevention — that is, to determine which vulnerabilities might have
been introduced but were not because a developer learned secure coding practices. In many cases, the best an
application security program can do is to measure fixes made to code that existed before the program began.
It can also be difficult to correlate the training experience of individual developers with fix rates in software,
given that many developers may be responsible for a given application. The best we can hope for is some
correlation in use of eLearning with improved fix rates.
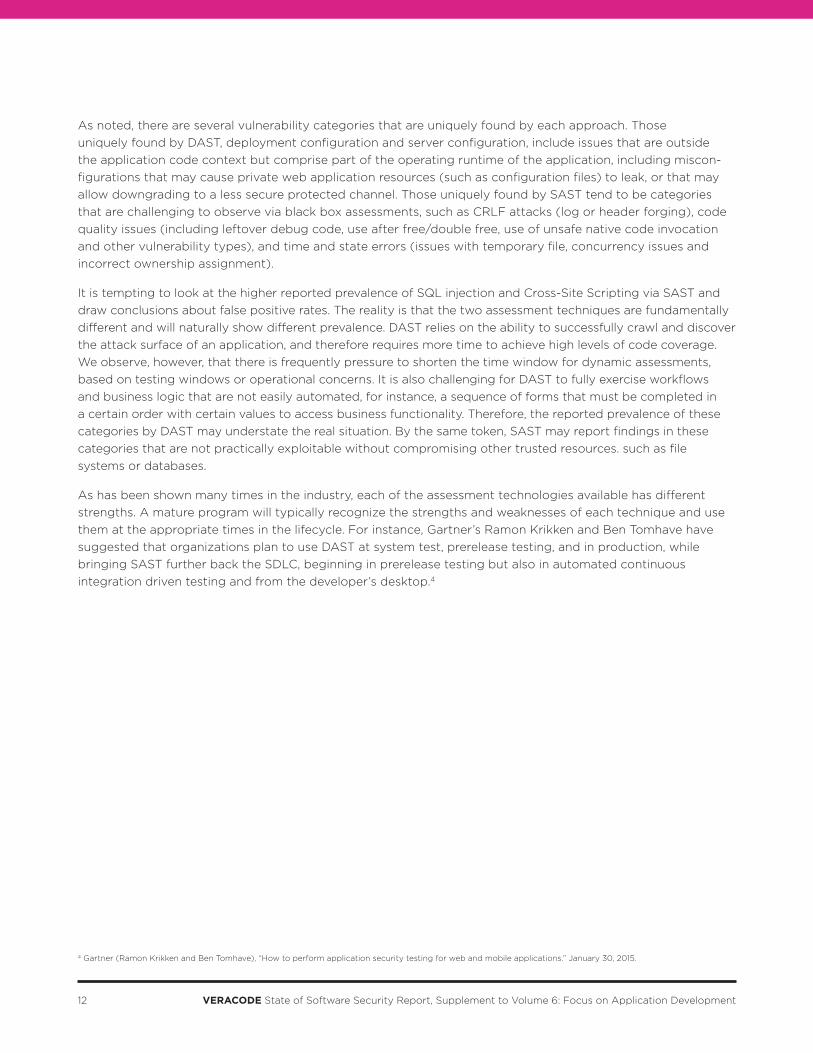
When we look at the overall fix rate of Veracode customers who have established an eLearning program,
we note that the fix rate is considerably higher, with 75 percent of vulnerabilities fixed versus 58 percent, an
improvement of 30 percent over the baseline rate. This suggests that eLearning is correlated with a higher fix
rate. We must caution, however, that there may be other factors at play here, such as the existence of a formal
application security program, effective use of application security policy or use of remediation coaching.
No eLearning Subscription
eLearning Subscription
0 10 20 30 40 50 60 70 80
58%
75%
Figure 7: Percent vulnerabilities found vs. fixed
14 VERACODE State of Software Security Report, Supplement to Volume 6: Focus on Application Development
Type of application security analysisAn axiom of application security assessment is that it’s best to conduct static assessments where possible,
because it gives developers more actionable results (line of code location of the vulnerability, data flow
information and so on). In this volume of the report, we looked at our data to see if there was evidence
that supports this hypothesis.
To examine this hypothesis, we looked at the rate of fix, which is computed as the total number of vulnerabilities
fixed divided by the total number of vulnerabilities found. Rate of fix has the advantage of applying to any
assessment type, unlike a quality measure like flaw density, which is only applicable for static assessments.
We compute this measure for each assessment type.
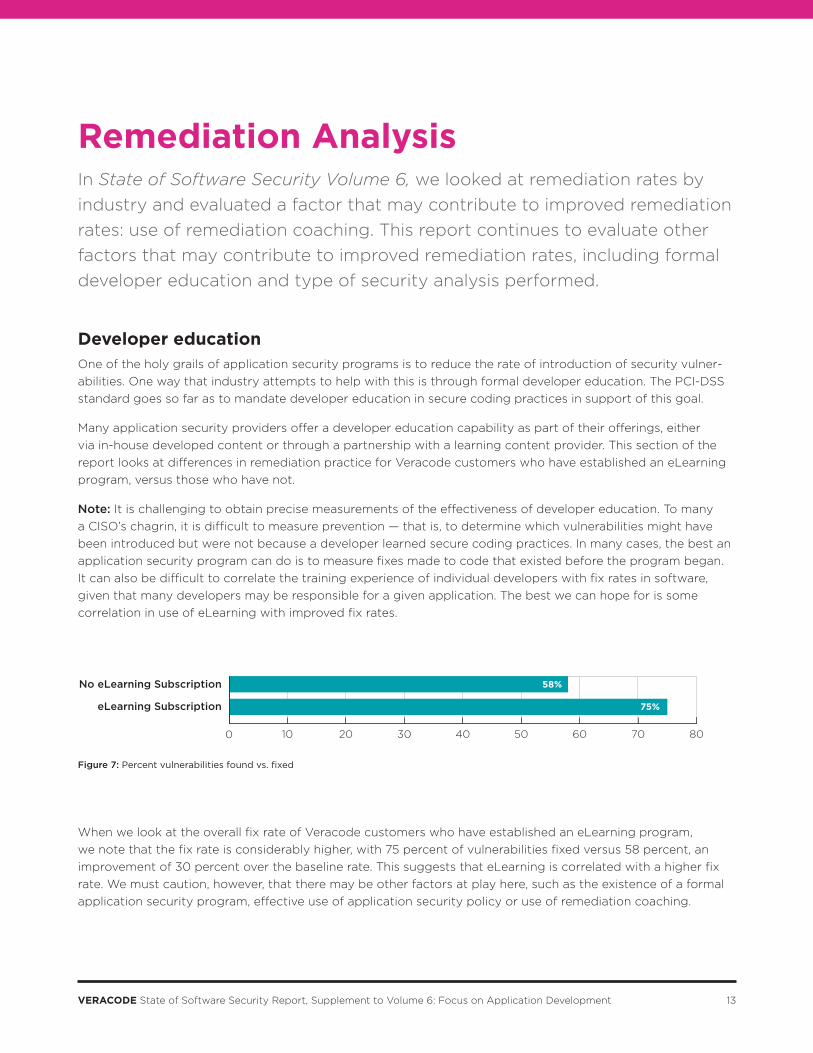
We found the following fix rates in reassessment:
The hypothesis seems to be confirmed by the comparison of the fix rate. Developers on average fix 64 percent
of static vulnerabilities, compared to 50 percent of dynamic vulnerabilities — on average, 28 percent better.
There are several possible reasons why static analysis observed a higher fix rate. The most likely is that static
provides higher fidelity data about the root cause of a vulnerability, including source file and line number.
But there are other possibilities, including the likelihood that a static assessment is being run on an application
that is actively under development and that engineering therefore already sees fixing issues as a priority, where
dynamic assessments may be run on a production system where the development team may not be actively
engaged. We tried to control for this effect by only looking at applications that were rescanned, indicating
some need to verify changes by the development team.
This is not to say that a security program should rely exclusively on static analysis. Some vulnerability classes can
only be caught at runtime, using a technique like DAST, behavioral mobile app testing or interactive application
self-testing. Some, like business logic vulnerabilities, require a skilled human tester. Some applications may not
lend themselves to static assessment at all, due to lack of programming language support or the inability to
obtain binaries (when the application is deployed) or source code. This data does suggest, though, that static
assessment is worthwhile when possible, even when other methods have been employed, and the hypothesis
that static results may be more actionable seems to be borne out.
DynamicDS
Static
Manual
0 10 20 30 40 50 60 70 80
64%
50%
52%
Figure 8: Percent vulnerabilities found vs. fixed
15VERACODE State of Software Security Report, Supplement to Volume 6: Focus on Application Development
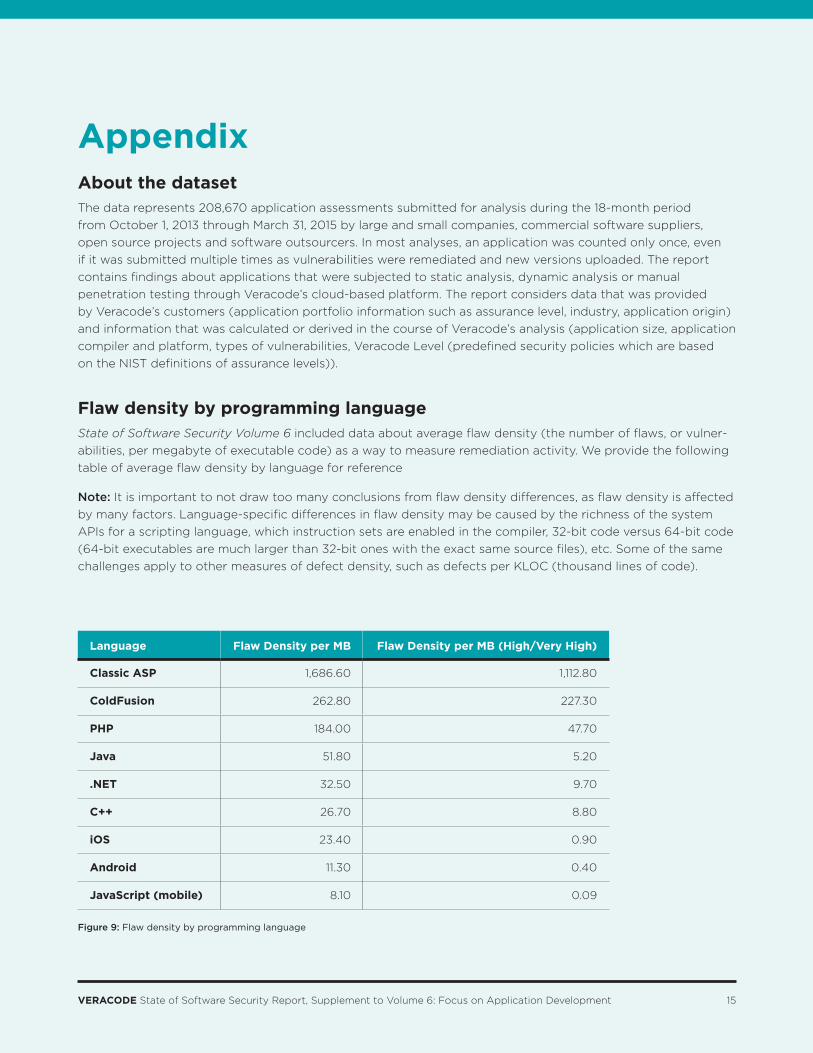
AppendixAbout the datasetThe data represents 208,670 application assessments submitted for analysis during the 18-month period
from October 1, 2013 through March 31, 2015 by large and small companies, commercial software suppliers,
open source projects and software outsourcers. In most analyses, an application was counted only once, even
if it was submitted multiple times as vulnerabilities were remediated and new versions uploaded. The report
contains findings about applications that were subjected to static analysis, dynamic analysis or manual
penetration testing through Veracode’s cloud-based platform. The report considers data that was provided
by Veracode’s customers (application portfolio information such as assurance level, industry, application origin)
and information that was calculated or derived in the course of Veracode’s analysis (application size, application
compiler and platform, types of vulnerabilities, Veracode Level (predefined security policies which are based
on the NIST definitions of assurance levels)).
Flaw density by programming languageState of Software Security Volume 6 included data about average flaw density (the number of flaws, or vulner-
abilities, per megabyte of executable code) as a way to measure remediation activity. We provide the following
table of average flaw density by language for reference
Note: It is important to not draw too many conclusions from flaw density differences, as flaw density is affected
by many factors. Language-specific differences in flaw density may be caused by the richness of the system
APIs for a scripting language, which instruction sets are enabled in the compiler, 32-bit code versus 64-bit code
(64-bit executables are much larger than 32-bit ones with the exact same source files), etc. Some of the same
challenges apply to other measures of defect density, such as defects per KLOC (thousand lines of code).
Language Flaw Density per MB Flaw Density per MB (High/Very High)
Classic ASP 1,686.60 1,112.80
ColdFusion 262.80 227.30
PHP 184.00 47.70
Java 51.80 5.20
.NET 32.50 9.70
C++ 26.70 8.80
iOS 23.40 0.90
Android 11.30 0.40
JavaScript (mobile) 8.10 0.09
Figure 9: Flaw density by programming language
16 VERACODE State of Software Security Report, Supplement to Volume 6: Focus on Application Development
SAMPLE SIZE
In any study of this size, there is a risk that sampling issues will arise because of the nature of the way
the data was collected. For instance, all the applications in this study came from organizations that were
motivated enough about application security to engage Veracode for an independent assessment of software
risk. We have taken care to only present comparisons where a statistically significant sample size was present.
ABOUT THE FINDINGS
Unless otherwise stated, all comparisons are made on the basis of the count of unique application builds
submitted and rated.

17VERACODE State of Software Security Report, Supplement to Volume 6: Focus on Application Development
Veracode’s cloud-based service and systematic
approach deliver a simpler and more scalable
solution for reducing global application-layer risk
across web, mobile and third-party applications.
Recognized as a Gartner Magic Quadrant Leader
since 2010, Veracode secures hundreds of the
world’s largest global enterprises, including
3 of the top 4 banks in the Fortune 100 and
20+ of Forbes’ 100 Most Valuable Brands.
LEARN MORE AT WWW.VERACODE.COM,
ON THE VERACODE BLOG, AND ON TWITTER.