Embed Size (px)
Citation preview
STATE OF SOFTWARE SECURITY
2016
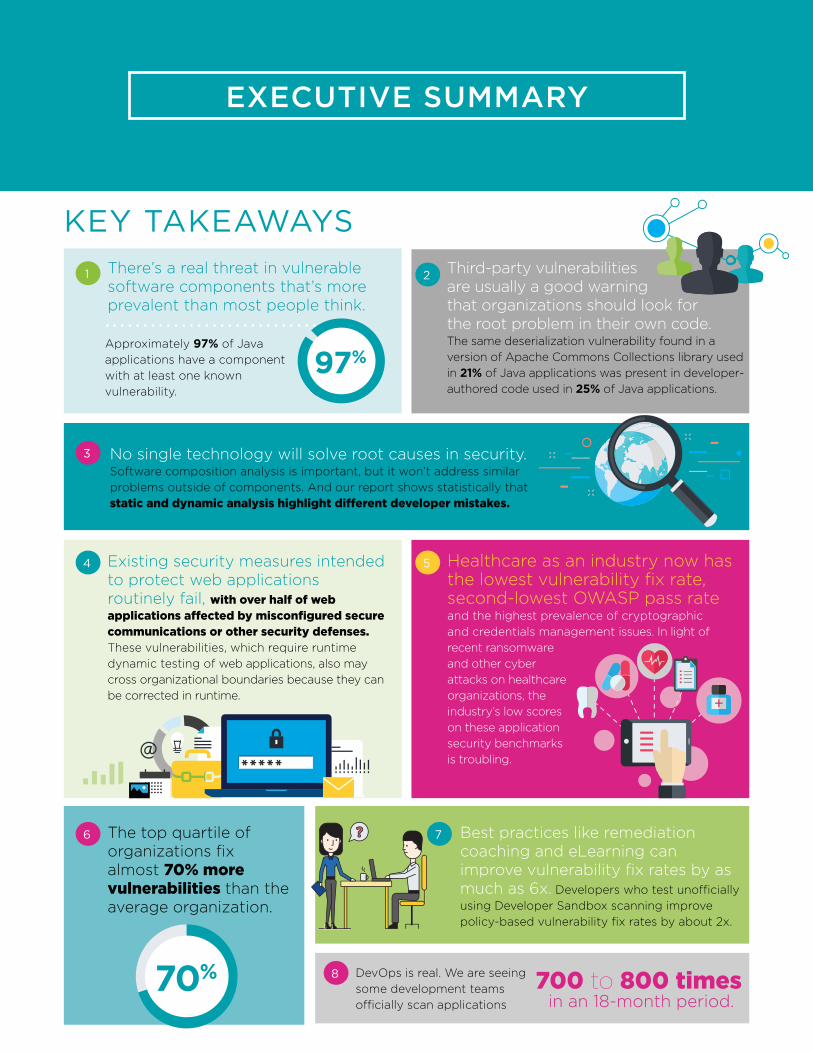
1 There’s a real threat in vulnerable software components that’s more prevalent than most people think.
Approximately 97% of Java applications have a component with at least one known vulnerability.
4 Existing security measures intended to protect web applications routinely fail, with over half of web applications affected by misconfigured secure communications or other security defenses. These vulnerabilities, which require runtime dynamic testing of web applications, also may cross organizational boundaries because they can be corrected in runtime.
3 No single technology will solve root causes in security. Software composition analysis is important, but it won’t address similar problems outside of components. And our report shows statistically that static and dynamic analysis highlight different developer mistakes.
6 The top quartile of organizations fix almost 70% more vulnerabilities than the average organization.
7 Best practices like remediation coaching and eLearning can improve vulnerability fix rates by as much as 6x. Developers who test unofficially using Developer Sandbox scanning improve policy-based vulnerability fix rates by about 2x.
8 DevOps is real. We are seeing some development teams officially scan applications
700 to 800 times in an 18-month period.
2 Third-party vulnerabilities are usually a good warning that organizations should look for the root problem in their own code. The same deserialization vulnerability found in a version of Apache Commons Collections library used in 21% of Java applications was present in developer-authored code used in 25% of Java applications.
5 Healthcare as an industry now has the lowest vulnerability fix rate, second-lowest OWASP pass rate and the highest prevalence of cryptographic and credentials management issues. In light of recent ransomware and other cyber attacks on healthcare organizations, the industry’s low scores on these application security benchmarks is troubling.
97%
EXECUTIVE SUMMARY
KEY TAKEAWAYS
70%
3 State of Software Security 2016
For the seventh year running, Veracode presents the security industry an
in-depth view of valuable application security statistics through the State
of Software Security (SOSS). This is no mere survey report. The metrics
presented here are based on real application risk postures, drawn from
code-level analysis of billions of lines of code across 300,000 assessments
performed over the last 18 months.
Veracode’s intention is to provide security practitioners with tangible
AppSec benchmarks with which to measure their own programs
against. We’ve sliced and diced the numbers to offer a range of
perspectives on the risk of applications throughout the entire
software lifecycle. This includes statistics on policy pass rates against
security standards, the statistical mix of common vulnerability types
found in applications, flaw density and average fix rate.
Last year the report spent considerable time examining benchmarks
by industry vertical performance. This volume follows up on those
measurements with some valuable updates. But before doing so,
Volume 7 of SOSS takes a close look at remediation analysis statistics
and third-party component vulnerabilities across all industries.
In examining overall industry remediation trends, the report offers some
important insight to practitioners about how well their peers are following
up on first-time security scans to continually improve security. Additionally,
the analysis closely examines some important factors that will impact
how effectively organizations are improving their vulnerability fix rates.
Meanwhile, the spotlight on third-party component vulnerabilities sheds
some light on common vulnerability tendencies, specifically within Java
components. The analysis provides conclusions that can help practitioners
get a better handle on the implications of component risk against overall
application risk.
OVERVIEW
4 State of Software Security 2016
Before we dive into more detailed explorations of remediation practices,
industry benchmarks and the intricacies of component vulnerabilities, we
felt it important first to get a level-set on the overall state of enterprise
software security.
One thing to keep in mind when looking at these overview stats and many
others deeper into the report is that unless otherwise noted, the statistics
here are based upon software never before scanned for security flaws. In
essence, these are the raw numbers that reflect the initial security of the
code before any remediation efforts have been made or rescanning has
taken place.
Based on our long-running research into these raw numbers, we can say
with some degree of accuracy that for the most part they have tended to
remain fairly consistent year over year. These consistent measurements
show that for the most part:
The fact that this number fundamentally doesn’t change year over year
indicates that there’s a lot of software out there that has still not been
brought through a formal security improvement process—whether
unremediated legacy code or new code that’s not developed via a rigorous
secure software development lifecycle (SDLC).
This steady raw state of software security should underline for organizations
the fact that even companies with mature application security programs
only scan a fraction of their portfolio. And those are the ones that are doing
it well. There are many others that aren’t doing it at all. This is not meant to
be disheartening. Instead, it offers some perspective on the breadth of the
problem and the need for sustained and continuous improvement.
Fewer than 4 out of 10 applications pass security policy requirements on initial assessment.
OVERALL STATISTICS
5 State of Software Security 2016
OVERALL OWASP TOP 10/SANS TOP 25 POLICY PASS RATESBearing that in mind, let’s start first with some simple pass-fail rates from
two different perspectives. The first is measured against compliance with
the OWASP Top 10 Project standards. The second is measured against SANS
Top 25 standards. While there’s certainly overlap, each set of standards are
based on criteria that build slightly different risk pictures for metrics-oriented
security teams. OWASP is very tightly focused on web applications from the
point of view of that threat space. Meanwhile, though Veracode hasn’t talked
a lot about the SANS standards in past software security reports, they offer
another take based on a slightly different set of threats that includes categories
such as those only relevant for client-side applications, for instance.
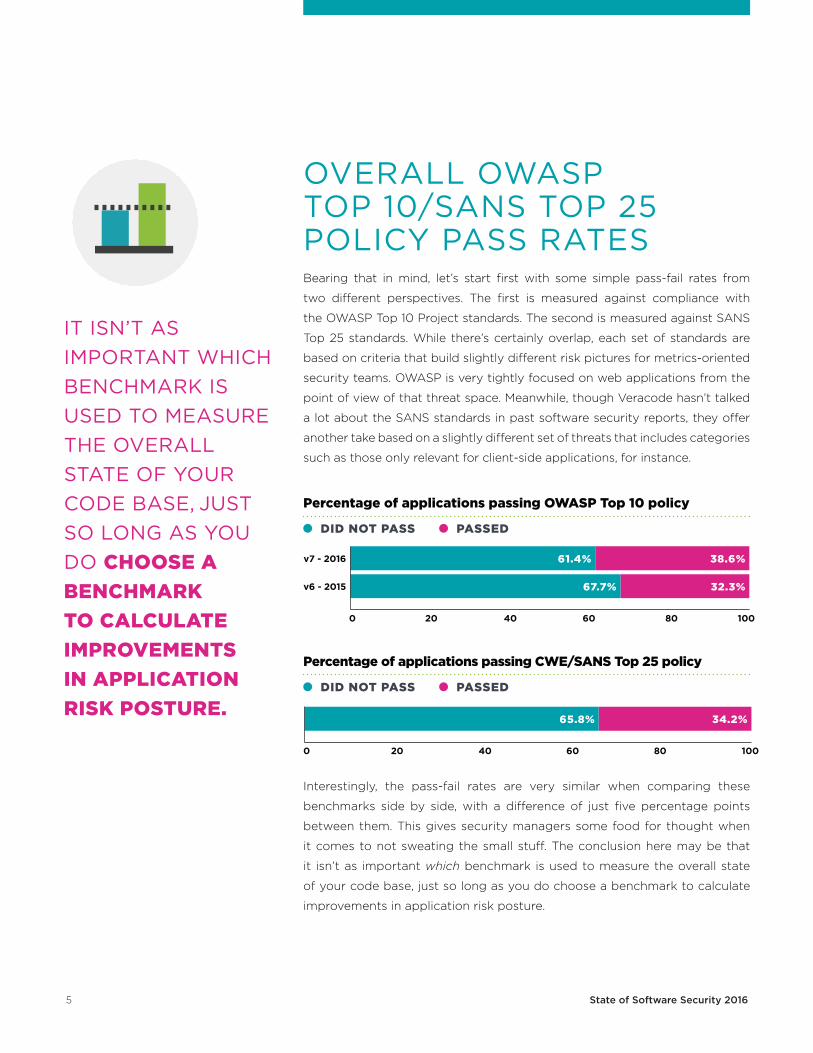
Interestingly, the pass-fail rates are very similar when comparing these
benchmarks side by side, with a difference of just five percentage points
between them. This gives security managers some food for thought when
it comes to not sweating the small stuff. The conclusion here may be that
it isn’t as important which benchmark is used to measure the overall state
of your code base, just so long as you do choose a benchmark to calculate
improvements in application risk posture.
IT ISN’T AS IMPORTANT WHICH BENCHMARK IS USED TO MEASURE THE OVERALL STATE OF YOUR CODE BASE, JUST SO LONG AS YOU DO CHOOSE A BENCHMARK TO CALCULATE IMPROVEMENTS IN APPLICATION RISK POSTURE.
Percentage of applications passing OWASP Top 10 policy
DID NOT PASS PASSED
38.6%61.4%v7 - 2016
32.3%67.7%v6 - 2015
0 20 40 60 80 100
Percentage of applications passing CWE/SANS Top 25 policy
DID NOT PASS PASSED
34.2%65.8%
0 20 40 60 80 100
6 State of Software Security 2016
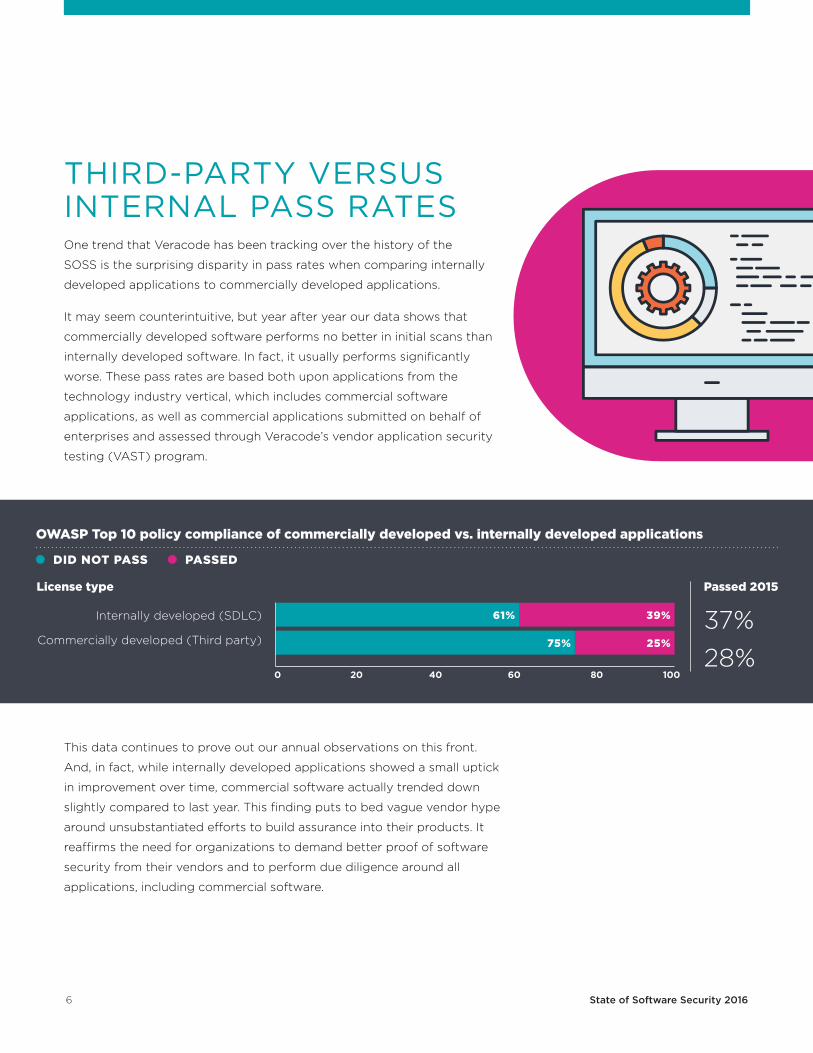
THIRD-PARTY VERSUS INTERNAL PASS RATESOne trend that Veracode has been tracking over the history of the
SOSS is the surprising disparity in pass rates when comparing internally
developed applications to commercially developed applications.
It may seem counterintuitive, but year after year our data shows that
commercially developed software performs no better in initial scans than
internally developed software. In fact, it usually performs significantly
worse. These pass rates are based both upon applications from the
technology industry vertical, which includes commercial software
applications, as well as commercial applications submitted on behalf of
enterprises and assessed through Veracode’s vendor application security
testing (VAST) program.
This data continues to prove out our annual observations on this front.
And, in fact, while internally developed applications showed a small uptick
in improvement over time, commercial software actually trended down
slightly compared to last year. This finding puts to bed vague vendor hype
around unsubstantiated efforts to build assurance into their products. It
reaffirms the need for organizations to demand better proof of software
security from their vendors and to perform due diligence around all
applications, including commercial software.
OWASP Top 10 policy compliance of commercially developed vs. internally developed applications
DID NOT PASS PASSED
Internally developed (SDLC)
Commercially developed (Third party)
Passed 2015
37%28%
License type
39%61%
25%75%
0 20 40 60 80 100
7 State of Software Security 2016
OVERALL VULNERABILITY PREVALENCE
When breaking down vulnerabilities by common categories, we do base all of our findings
on the MITRE common weakness enumeration (CWE) taxonomy. However, the level of detail
of CWE categories makes it such that there are too many categories to quickly and easily communicate the most
common broad classes of vulnerabilities that present themselves in applications. In order to solve that problem,
we roll up numerous CWE categories into about 30 higher level categories and present here the top 10 most
prevalent to occur in first-time application scans.
Here are some definitions to understand what’s included in these top 10 broad categories, as well as a handful of others referenced later in the report:
Authentication Issues:
This category is for vulnerabilities that weaken
the mechanisms an application uses to identify a
real user. Flaws include using insecure mechanisms
like the DNS to establish identity, allowing cross-site
request forgery, allowing login with very common
username/password combinations or allowing login
via SQL injection.
CRLF Injection:
This includes any vulnerability that enables
any kind of Carriage Return Line Feed (CRLF)
injection attacks. Included here are flaws involving
improper output neutralization for logs and
improper neutralization of CRLF in HTTP headers.
Code Quality:
These are sloppy issues in code quality that could
eventually impact the security of the application.
Some examples include improper resource
shutdown or release, leftover debug code and
using the wrong operator when comparing strings.
Command or Argument Injection:
One of the most severe categories of vulnerabilities,
these issues allow an attacker to run arbitrary
commands on the server hosting the application,
giving them complete control of the environment.
Credentials Management:
These are errors in the handling of user credentials
that can enable attackers to bypass access controls.
Some of the most common errors include hard-
coded passwords and plaintext passwords in
config files and elsewhere.
Cross-Site Scripting (XSS):
These are vulnerabilities that give attackers
the capability to inject client-side scripts into
the application, potentially bypassing security
controls in the process.
Cryptographic Issues:
This includes a number of risky cryptographic
practices, including using broken crypto algorithms,
improperly validating certificates, storing sensitive
information in cleartext and employing inadequate
encryption strength.
8 State of Software Security 2016
Deployment Configuration:
These are vulnerabilities that are related to an
insecure configuration of an application at runtime,
such as incorrect use of the HttpOnly flag on
cookies, or incorrect configuration of a cross-
domain security policy in a Flash object or in
JavaScript code.
Directory Traversal:
These are flaws that open up the possibility
of attacks that give malicious actors the
capability to gain unauthorized access to
restricted directories and files.
Encapsulation:
These are vulnerabilities that involve code that
doesn’t sufficiently encapsulate critical data
or functionality. This includes trust boundary
violations, protection mechanism failures and
deserialization of untrusted data.
Information Leakage:
These are flaws that allow the application
to reveal sensitive data about the application,
environment or user data that could be leveraged
by an attacker to hone future successful attacks
against the application.
Insufficient Input Validation:
Tainted input is the root cause of many security
headaches. This category includes a number of input
validation flaws that open up the application to
malformed input that can cause security issues. This
includes vulnerabilities involving open redirect and
unsafe reflection.
Server Configuration:
Like deployment configuration issues, these are
failures to configure the application securely. These
flaws include forced downgrades in encryption,
enabling proxy access to secure resources elsewhere
on the network and easily compromised storage of
sensitive information about users or sessions.
Session Fixation:
These are authentication-related vulnerabilities
where the application fails to correctly invalidate
an expired session, allowing an attacker to
impersonate a user.
SQL Injection (SQLi):
One of the most severe categories of this group,
these are any vulnerabilities that allow the attacker
to gain unauthorized access to a back-end database
by using maliciously crafted input.
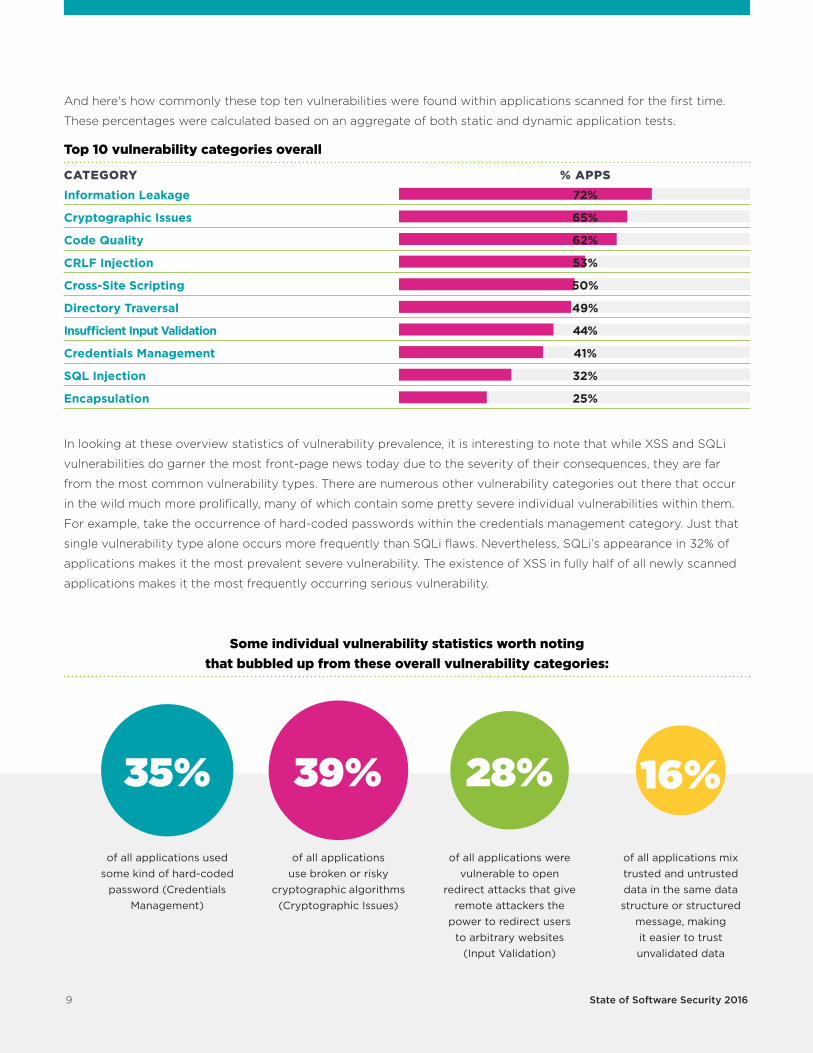
Top 10 vulnerability categories overall
CATEGORY % APPSInformation Leakage 72%
Cryptographic Issues 65%
Code Quality 62%
CRLF Injection 53%
Cross-Site Scripting 50%
Directory Traversal 49%
Insufficient Input Validation 44%
Credentials Management 41%
SQL Injection 32%
Encapsulation 25%
In looking at these overview statistics of vulnerability prevalence, it is interesting to note that while XSS and SQLi
vulnerabilities do garner the most front-page news today due to the severity of their consequences, they are far
from the most common vulnerability types. There are numerous other vulnerability categories out there that occur
in the wild much more prolifically, many of which contain some pretty severe individual vulnerabilities within them.
For example, take the occurrence of hard-coded passwords within the credentials management category. Just that
single vulnerability type alone occurs more frequently than SQLi flaws. Nevertheless, SQLi’s appearance in 32% of
applications makes it the most prevalent severe vulnerability. The existence of XSS in fully half of all newly scanned
applications makes it the most frequently occurring serious vulnerability.
Some individual vulnerability statistics worth noting that bubbled up from these overall vulnerability categories:
of all applications used some kind of hard-coded
password (Credentials Management)
35%
of all applications use broken or risky
cryptographic algorithms (Cryptographic Issues)
39%
of all applications were vulnerable to open
redirect attacks that give remote attackers the
power to redirect users to arbitrary websites
(Input Validation)
28%
of all applications mix trusted and untrusted data in the same data structure or structured
message, making it easier to trust unvalidated data
16%
9 State of Software Security 2016
And here's how commonly these top ten vulnerabilities were found within applications scanned for the first time.
These percentages were calculated based on an aggregate of both static and dynamic application tests.
10 State of Software Security 2016
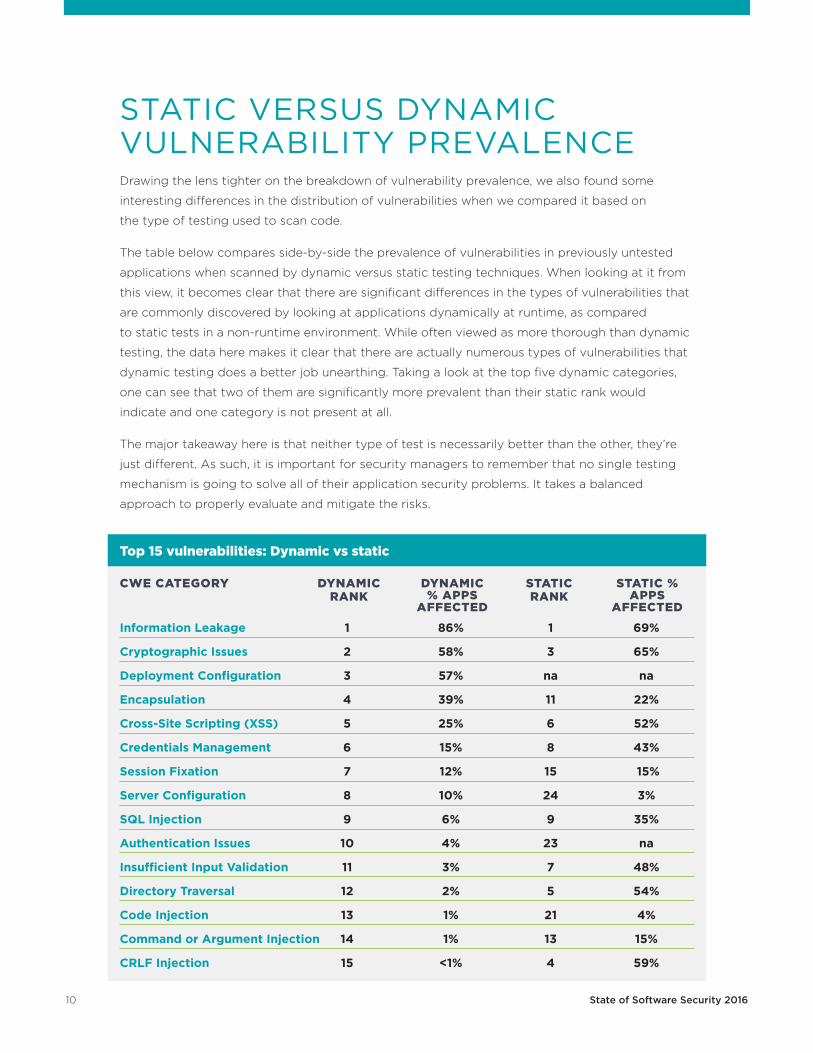
Drawing the lens tighter on the breakdown of vulnerability prevalence, we also found some
interesting differences in the distribution of vulnerabilities when we compared it based on
the type of testing used to scan code.
The table below compares side-by-side the prevalence of vulnerabilities in previously untested
applications when scanned by dynamic versus static testing techniques. When looking at it from
this view, it becomes clear that there are significant differences in the types of vulnerabilities that
are commonly discovered by looking at applications dynamically at runtime, as compared
to static tests in a non-runtime environment. While often viewed as more thorough than dynamic
testing, the data here makes it clear that there are actually numerous types of vulnerabilities that
dynamic testing does a better job unearthing. Taking a look at the top five dynamic categories,
one can see that two of them are significantly more prevalent than their static rank would
indicate and one category is not present at all.
The major takeaway here is that neither type of test is necessarily better than the other, they’re
just different. As such, it is important for security managers to remember that no single testing
mechanism is going to solve all of their application security problems. It takes a balanced
approach to properly evaluate and mitigate the risks.
Information Leakage 1 86% 1 69%
Cryptographic Issues 2 58% 3 65%
Deployment Configuration 3 57% na na
Encapsulation 4 39% 11 22%
Cross-Site Scripting (XSS) 5 25% 6 52%
Credentials Management 6 15% 8 43%
Session Fixation 7 12% 15 15%
Server Configuration 8 10% 24 3%
SQL Injection 9 6% 9 35%
Authentication Issues 10 4% 23 na
Insufficient Input Validation 11 3% 7 48%
Directory Traversal 12 2% 5 54%
Code Injection 13 1% 21 4%
Command or Argument Injection 14 1% 13 15%
CRLF Injection 15 <1% 4 59%
Top 15 vulnerabilities: Dynamic vs static
STATIC VERSUS DYNAMIC VULNERABILITY PREVALENCE
CWE CATEGORY DYNAMIC RANK
DYNAMIC % APPS
AFFECTED
STATIC % APPS
AFFECTED
STATIC RANK
11 State of Software Security 2016
There’s also one final observation to note about the top vulnerabilities
found by dynamic testing. When we look at three of the top
four vulnerability categories—cryptographic issues, deployment
configuration and encapsulation—we start to see that these can all be
lumped into a broader class of flaws that involve the misconfiguration
of protection mechanisms.
In essence, developers are introducing vulnerabilities by poorly
configuring elements that are actually meant to keep application data
safe. This could mean utilizing SSL incorrectly or using secure cookies
the wrong way. For applications that use Flash, it could mean accepting
the wrong cross-domain policies, which an attacker could use to
maliciously manipulate what’s going on in the Flash object. It could also
include the improper use of security headers. For example, there’s a
header value that can be sent in a web application that tells a browser
to turn on protection against cross-site scripting, and it turns out that
a lot of developers get that wrong.
Security teams that facilitate dynamic testing for the discovery
of these misconfigurations present some invaluable learning
opportunities to developers who can stand to improve the use
of existing security mechanisms.
DEVELOPERS ARE INTRODUCING VULNERABILITIES BY POORLY CONFIGURING ELEMENTS THAT ARE ACTUALLY MEANT TO KEEP APPLICATION DATA SAFE.
12 State of Software Security 2016
While it is important to understand the universal state of vulnerabilities across the entire code base,
security practitioners will find some of the most useful metrics for AppSec improvement revolve
around the impact that reassessment and remediation can have upon flaw density and fix rates.
The following statistics are where the rubber meets the road when it comes to the incremental
improvements that can be achieved through a programmatic approach to application security.
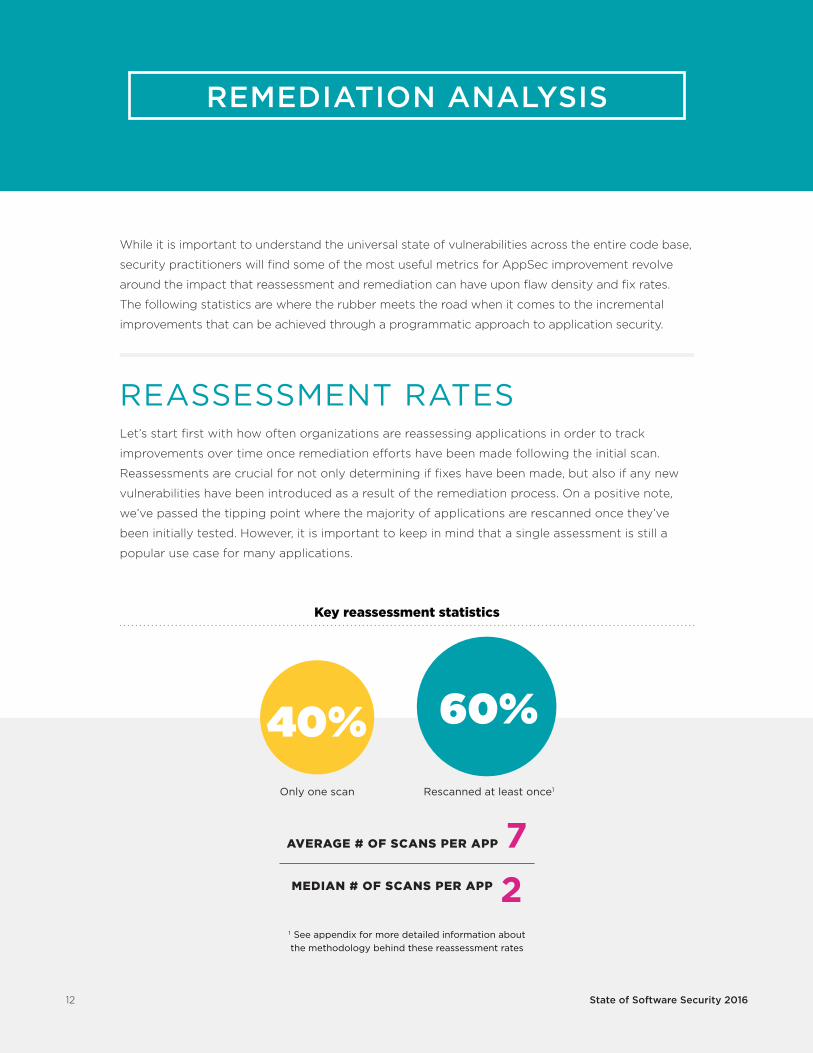
REASSESSMENT RATES Let’s start first with how often organizations are reassessing applications in order to track
improvements over time once remediation efforts have been made following the initial scan.
Reassessments are crucial for not only determining if fixes have been made, but also if any new
vulnerabilities have been introduced as a result of the remediation process. On a positive note,
we’ve passed the tipping point where the majority of applications are rescanned once they’ve
been initially tested. However, it is important to keep in mind that a single assessment is still a
popular use case for many applications.
Key reassessment statistics
1 See appendix for more detailed information about the methodology behind these reassessment rates
AVERAGE # OF SCANS PER APP 7MEDIAN # OF SCANS PER APP 2
REMEDIATION ANALYSIS
Only one scan
40%Rescanned at least once1
60%
13 State of Software Security 2016
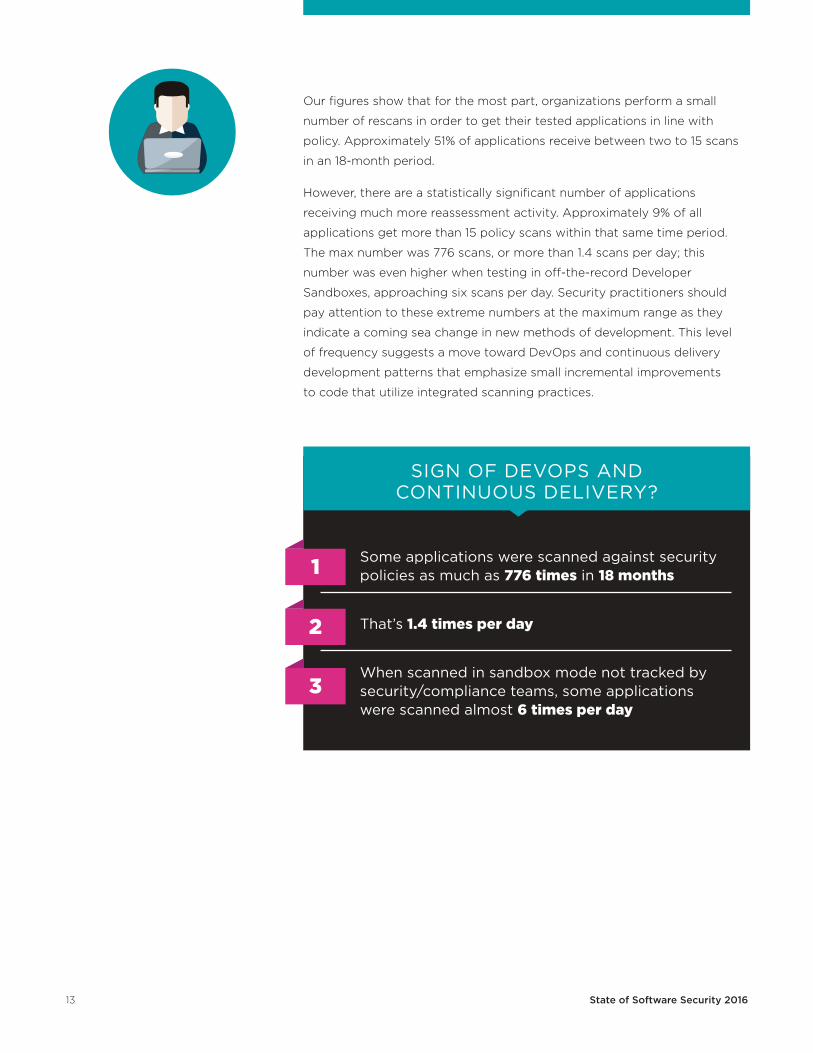
SOME APPLICATIONS WERE SCANNED AGAINST
SECURITY POLICIES AS MUCH AS 776 TIMES IN 18
MONTHS
THAT’S 1.4 TIMES PER DAY
• WHEN SCANNED IN SANDBOX MODE NOT
TRACKED BY SECURITY/COMPLIANCE TEAMS, SOME
APPLICATIONS WERE SCANNED ALMOST 6 TIMES
PER DAY
Some applications were scanned against security policies as much as 776 times in 18 months
That’s 1.4 times per day
When scanned in sandbox mode not tracked by security/compliance teams, some applications were scanned almost 6 times per day
SIGN OF DEVOPS AND CONTINUOUS DELIVERY?
1
2
3
Our figures show that for the most part, organizations perform a small
number of rescans in order to get their tested applications in line with
policy. Approximately 51% of applications receive between two to 15 scans
in an 18-month period.
However, there are a statistically significant number of applications
receiving much more reassessment activity. Approximately 9% of all
applications get more than 15 policy scans within that same time period.
The max number was 776 scans, or more than 1.4 scans per day; this
number was even higher when testing in off-the-record Developer
Sandboxes, approaching six scans per day. Security practitioners should
pay attention to these extreme numbers at the maximum range as they
indicate a coming sea change in new methods of development. This level
of frequency suggests a move toward DevOps and continuous delivery
development patterns that emphasize small incremental improvements
to code that utilize integrated scanning practices.
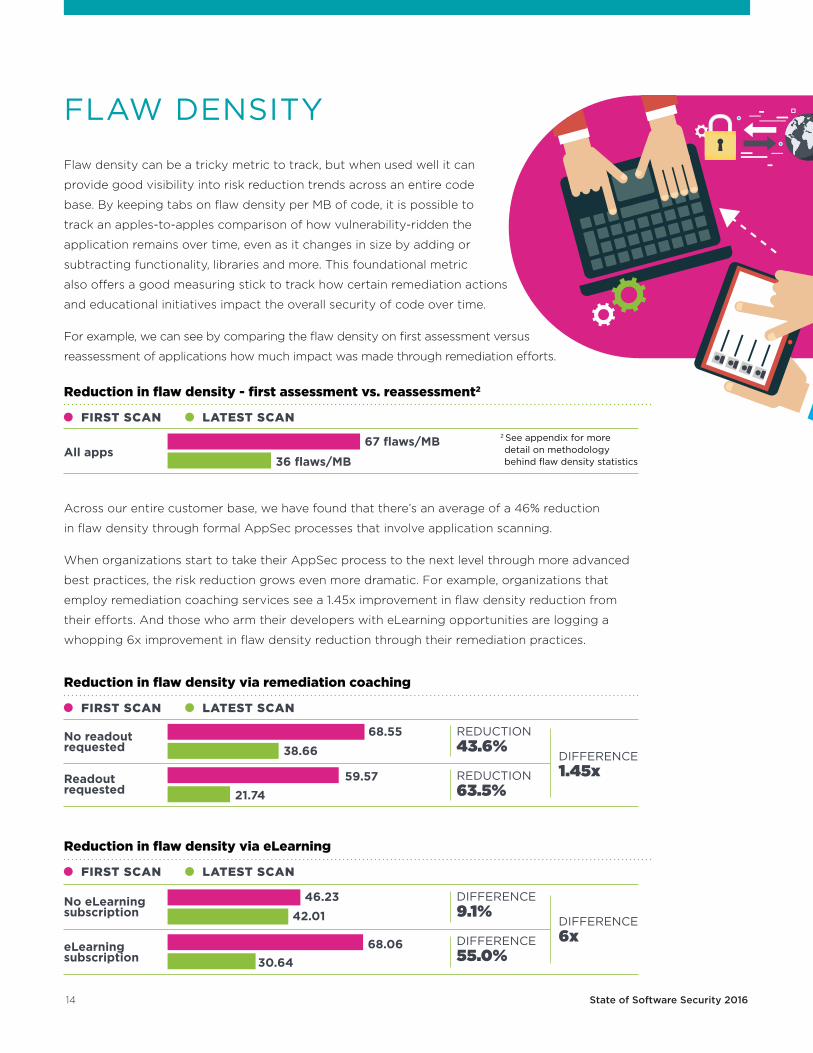
Flaw density can be a tricky metric to track, but when used well it can
provide good visibility into risk reduction trends across an entire code
base. By keeping tabs on flaw density per MB of code, it is possible to
track an apples-to-apples comparison of how vulnerability-ridden the
application remains over time, even as it changes in size by adding or
subtracting functionality, libraries and more. This foundational metric
also offers a good measuring stick to track how certain remediation actions
and educational initiatives impact the overall security of code over time.
For example, we can see by comparing the flaw density on first assessment versus
reassessment of applications how much impact was made through remediation efforts.
Across our entire customer base, we have found that there’s an average of a 46% reduction
in flaw density through formal AppSec processes that involve application scanning.
When organizations start to take their AppSec process to the next level through more advanced
best practices, the risk reduction grows even more dramatic. For example, organizations that
employ remediation coaching services see a 1.45x improvement in flaw density reduction from
their efforts. And those who arm their developers with eLearning opportunities are logging a
whopping 6x improvement in flaw density reduction through their remediation practices.
2 See appendix for more detail on methodology behind flaw density statistics
FLAW DENSITY
Reduction in flaw density - first assessment vs. reassessment2
FIRST SCAN LATEST SCAN
All apps67 flaws/MB
36 flaws/MB
Reduction in flaw density via eLearning
FIRST SCAN LATEST SCAN
DIFFERENCE9.1%
DIFFERENCE6xDIFFERENCE
55.0%
No eLearning subscription
eLearning subscription
46.2342.01
68.0630.64
Reduction in flaw density via remediation coaching
FIRST SCAN LATEST SCAN
REDUCTION43.6%
DIFFERENCE1.45xREDUCTION
63.5%
No readout requested
Readout requested
68.5538.66
59.5721.74
14 State of Software Security 2016
15 State of Software Security 2016
FIX RATE: FIXED VERSUS FOUNDIn the State of Software Security v6, we looked for the first time at fix rates of vulnerabilities. The idea behind this metric is to track the number of vulnerabilities fixed as a percentage of the total number of vulnerabilities found. As we reviewed the data from v6 over the last year, we realized that there was an overlooked factor that could potentially be distorting our fix rate calculations, namely reopen rates.
The Veracode Application Security Platform identifies four possible states for a static or dynamic vulnerability: New, Open, Fixed, and Reopened. The key to understanding the distortion lies in the final two vulnerability types:
• “Fixed” is used for vulnerabilities that were found in an early scan that are no longer found in a subsequent scan; and
• “Reopened” identifies a vulnerability that was found in an earlier scan, marked as “Fixed” in a subsequent scan, and then reappeared in a later scan.
We recognized that there was a greater impact on fix rates from vulnerabilities that were reopened than originally thought. The problem happens if a scan does not identify a vulnerability correctly as having been found in a prior scan. Both static and dynamic testing in Veracode’s analysis have features designed to ensure that we do everything possible to “re-find” previously found vulnerabilities and therefore avoid prematurely closing a vulnerability.
Based on these methods, we’ve found that the number of reopened vulnerabilities present in reassessed applications are statistically significant and need to be included as a part of fix-rate metrics. We believe that reopen rates represent one of two scenarios:
1 Changes in application scope, such as a developer not submitting part of an application for scan.
2 Vulnerability fixes successfully completed in an early scan that are inadvertently undone in a later scan. This may be done by accidentally undoing a code protection on an existing code path, or inadvertently opening a new unprotected code path to the same line of code.
We have adjusted the fix rate calculation to account for this and are restating the fix rates from v6 to include reopened vulnerabilities as well. Whenever we cite a fix rate in this study, it is calculated including the reopen rate: “fixed vulnerabilities” minus “reopened vulnerabilities,” divided by “all vulnerabilities found.”
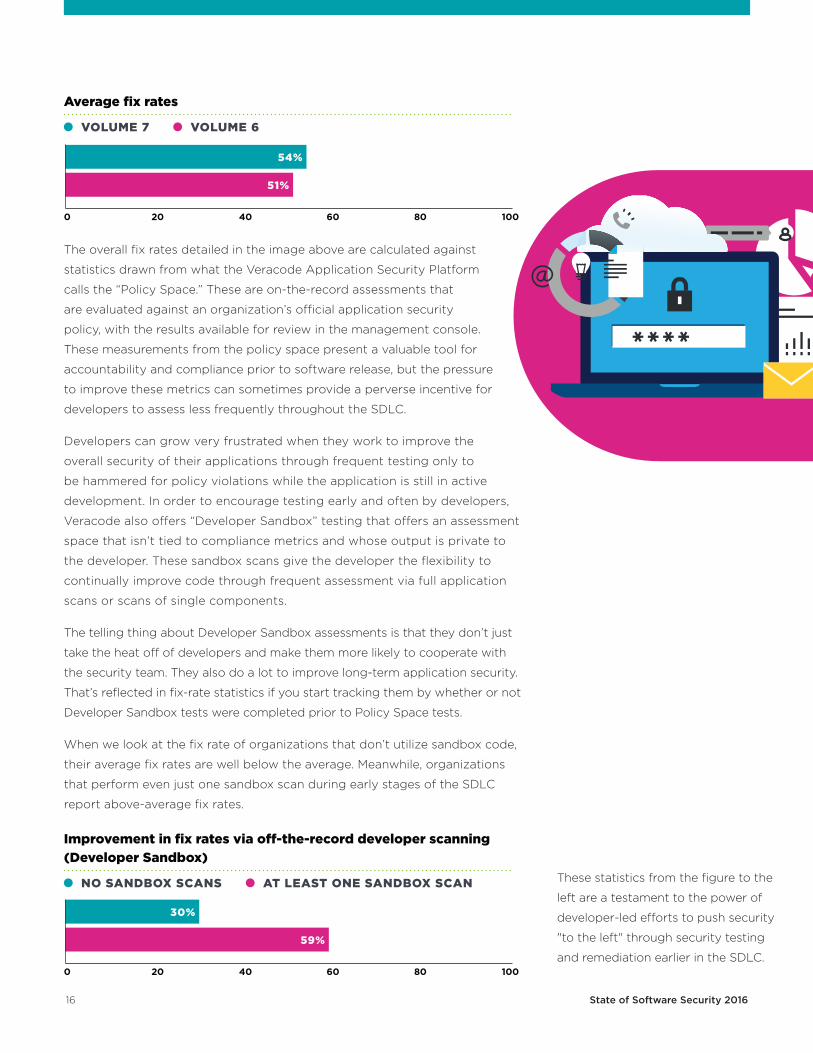
Overall, the organizations in the study fixed about 54% of the vulnerabilities found during the period, when adjusting for fixed vulnerabilities that were later reopened. This remediation rate includes both vulnerabilities found and fixed during the study and vulnerabilities fixed that were found prior to the study (“security debt”). This is an improvement from the fix rate in SOSS v6, which was 51%.
WE RECOGNIZED THAT THERE WAS A GREATER IMPACT ON FIX RATES FROM VULNERABILITIES THAT WERE REOPENED THAN ORIGINALLY THOUGHT.
16 State of Software Security 2016
The overall fix rates detailed in the image above are calculated against
statistics drawn from what the Veracode Application Security Platform
calls the “Policy Space.” These are on-the-record assessments that
are evaluated against an organization’s official application security
policy, with the results available for review in the management console.
These measurements from the policy space present a valuable tool for
accountability and compliance prior to software release, but the pressure
to improve these metrics can sometimes provide a perverse incentive for
developers to assess less frequently throughout the SDLC.
Developers can grow very frustrated when they work to improve the
overall security of their applications through frequent testing only to
be hammered for policy violations while the application is still in active
development. In order to encourage testing early and often by developers,
Veracode also offers “Developer Sandbox” testing that offers an assessment
space that isn’t tied to compliance metrics and whose output is private to
the developer. These sandbox scans give the developer the flexibility to
continually improve code through frequent assessment via full application
scans or scans of single components.
The telling thing about Developer Sandbox assessments is that they don’t just
take the heat off of developers and make them more likely to cooperate with
the security team. They also do a lot to improve long-term application security.
That’s reflected in fix-rate statistics if you start tracking them by whether or not
Developer Sandbox tests were completed prior to Policy Space tests.
When we look at the fix rate of organizations that don’t utilize sandbox code,
their average fix rates are well below the average. Meanwhile, organizations
that perform even just one sandbox scan during early stages of the SDLC
report above-average fix rates.
These statistics from the figure to the
left are a testament to the power of
developer-led efforts to push security
"to the left" through security testing
and remediation earlier in the SDLC.
Average fix rates
VOLUME 7 VOLUME 6
54%
51%
0 20 40 60 80 100
Improvement in fix rates via off-the-record developer scanning (Developer Sandbox)
NO SANDBOX SCANS AT LEAST ONE SANDBOX SCAN
30%
59%
0 20 40 60 80 100
17 State of Software Security 2016
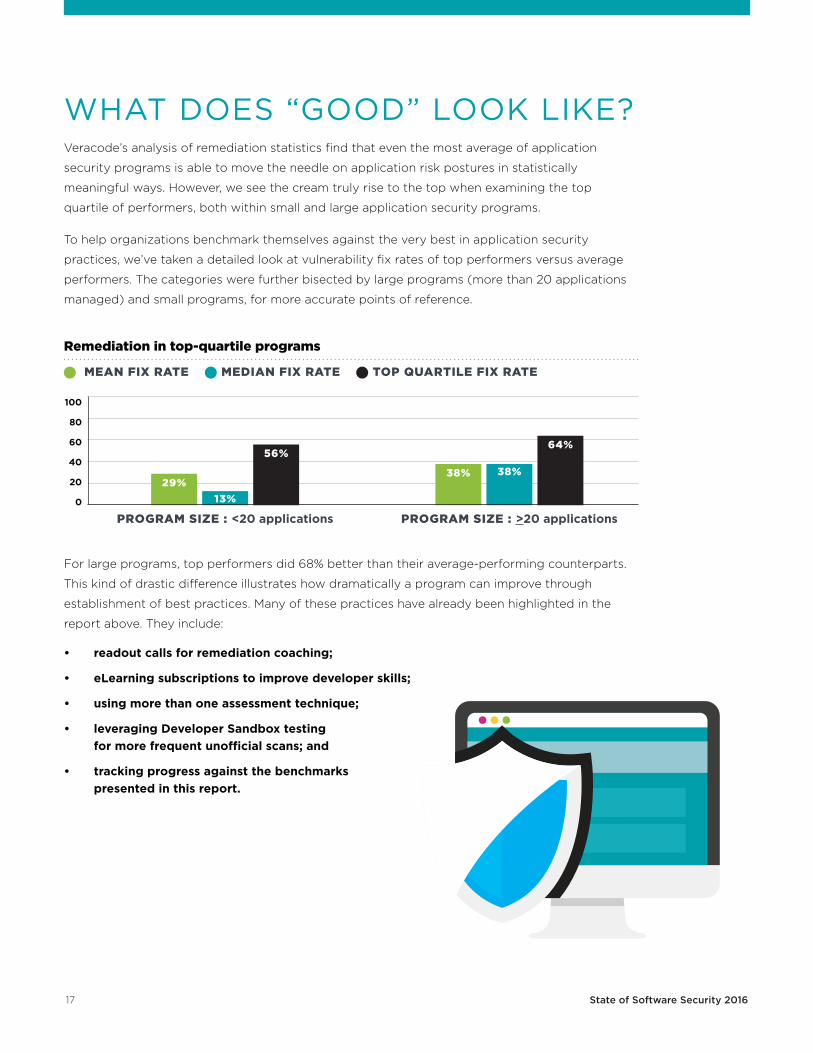
WHAT DOES “GOOD” LOOK LIKE? Veracode’s analysis of remediation statistics find that even the most average of application
security programs is able to move the needle on application risk postures in statistically
meaningful ways. However, we see the cream truly rise to the top when examining the top
quartile of performers, both within small and large application security programs.
To help organizations benchmark themselves against the very best in application security
practices, we’ve taken a detailed look at vulnerability fix rates of top performers versus average
performers. The categories were further bisected by large programs (more than 20 applications
managed) and small programs, for more accurate points of reference.
For large programs, top performers did 68% better than their average-performing counterparts.
This kind of drastic difference illustrates how dramatically a program can improve through
establishment of best practices. Many of these practices have already been highlighted in the
report above. They include:
• readout calls for remediation coaching;
• eLearning subscriptions to improve developer skills;
• using more than one assessment technique;
• leveraging Developer Sandbox testing for more frequent unofficial scans; and
• tracking progress against the benchmarks presented in this report.
Remediation in top-quartile programs
MEAN FIX RATE MEDIAN FIX RATE TOP QUARTILE FIX RATE
56%
13%29%
64%
38%38%
PROGRAM SIZE : <20 applications PROGRAM SIZE : >20 applications
100
80
60
40
20
0
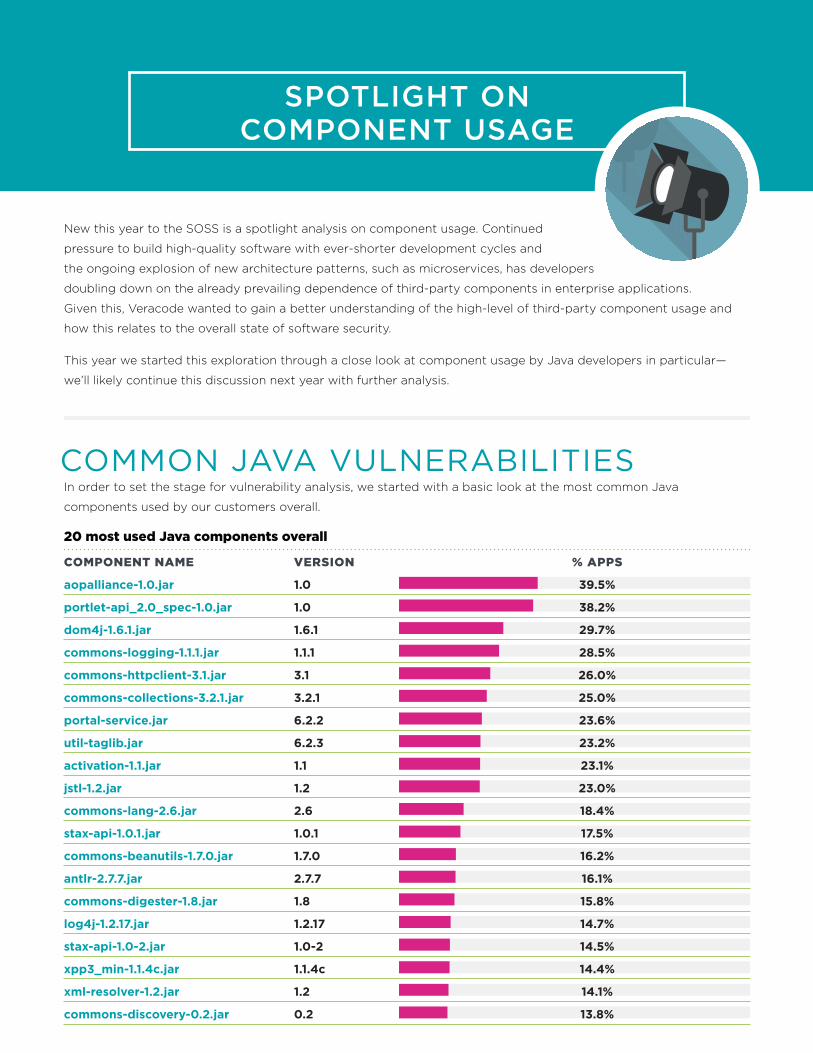
SPOTLIGHT ON COMPONENT USAGE
New this year to the SOSS is a spotlight analysis on component usage. Continued
pressure to build high-quality software with ever-shorter development cycles and
the ongoing explosion of new architecture patterns, such as microservices, has developers
doubling down on the already prevailing dependence of third-party components in enterprise applications.
Given this, Veracode wanted to gain a better understanding of the high-level of third-party component usage and
how this relates to the overall state of software security.
This year we started this exploration through a close look at component usage by Java developers in particular—
we’ll likely continue this discussion next year with further analysis.
COMMON JAVA VULNERABILITIESIn order to set the stage for vulnerability analysis, we started with a basic look at the most common Java
components used by our customers overall.
20 most used Java components overall
COMPONENT NAME VERSION % APPS
aopalliance-1.0.jar 1.0 39.5%
portlet-api_2.0_spec-1.0.jar 1.0 38.2%
dom4j-1.6.1.jar 1.6.1 29.7%
commons-logging-1.1.1.jar 1.1.1 28.5%
commons-httpclient-3.1.jar 3.1 26.0%
commons-collections-3.2.1.jar 3.2.1 25.0%
portal-service.jar 6.2.2 23.6%
util-taglib.jar 6.2.3 23.2%
activation-1.1.jar 1.1 23.1%
jstl-1.2.jar 1.2 23.0%
commons-lang-2.6.jar 2.6 18.4%
stax-api-1.0.1.jar 1.0.1 17.5%
commons-beanutils-1.7.0.jar 1.7.0 16.2%
antlr-2.7.7.jar 2.7.7 16.1%
commons-digester-1.8.jar 1.8 15.8%
log4j-1.2.17.jar 1.2.17 14.7%
stax-api-1.0-2.jar 1.0-2 14.5%
xpp3_min-1.1.4c.jar 1.1.4c 14.4%
xml-resolver-1.2.jar 1.2 14.1%
commons-discovery-0.2.jar 0.2 13.8%
19 State of Software Security 2016
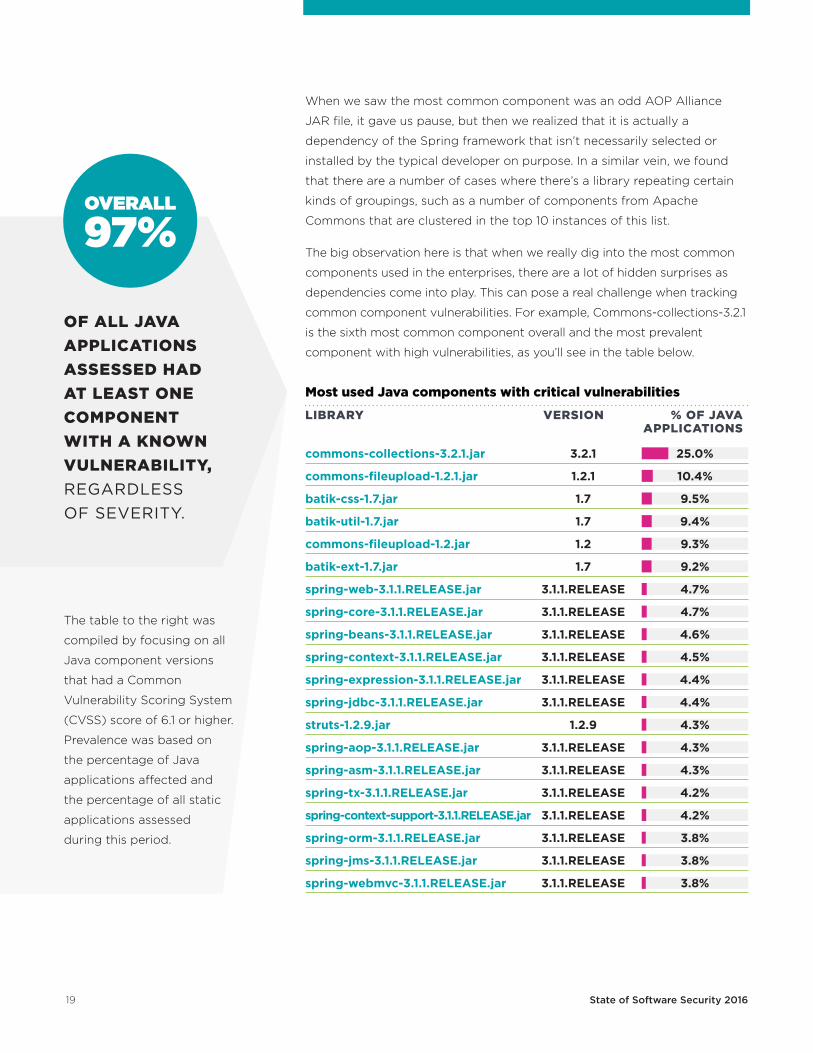
Most used Java components with critical vulnerabilities
LIBRARY VERSION % OF JAVA APPLICATIONS
commons-collections-3.2.1.jar 3.2.1 25.0%
commons-fileupload-1.2.1.jar 1.2.1 10.4%
batik-css-1.7.jar 1.7 9.5%
batik-util-1.7.jar 1.7 9.4%
commons-fileupload-1.2.jar 1.2 9.3%
batik-ext-1.7.jar 1.7 9.2%
spring-web-3.1.1.RELEASE.jar 3.1.1.RELEASE 4.7%
spring-core-3.1.1.RELEASE.jar 3.1.1.RELEASE 4.7%
spring-beans-3.1.1.RELEASE.jar 3.1.1.RELEASE 4.6%
spring-context-3.1.1.RELEASE.jar 3.1.1.RELEASE 4.5%
spring-expression-3.1.1.RELEASE.jar 3.1.1.RELEASE 4.4%
spring-jdbc-3.1.1.RELEASE.jar 3.1.1.RELEASE 4.4%
struts-1.2.9.jar 1.2.9 4.3%
spring-aop-3.1.1.RELEASE.jar 3.1.1.RELEASE 4.3%
spring-asm-3.1.1.RELEASE.jar 3.1.1.RELEASE 4.3%
spring-tx-3.1.1.RELEASE.jar 3.1.1.RELEASE 4.2%
spring-context-support-3.1.1.RELEASE.jar 3.1.1.RELEASE 4.2%
spring-orm-3.1.1.RELEASE.jar 3.1.1.RELEASE 3.8%
spring-jms-3.1.1.RELEASE.jar 3.1.1.RELEASE 3.8%
spring-webmvc-3.1.1.RELEASE.jar 3.1.1.RELEASE 3.8%
OF ALL JAVA APPLICATIONS ASSESSED HAD AT LEAST ONE COMPONENT WITH A KNOWN VULNERABILITY, REGARDLESS OF SEVERITY.
When we saw the most common component was an odd AOP Alliance
JAR file, it gave us pause, but then we realized that it is actually a
dependency of the Spring framework that isn’t necessarily selected or
installed by the typical developer on purpose. In a similar vein, we found
that there are a number of cases where there’s a library repeating certain
kinds of groupings, such as a number of components from Apache
Commons that are clustered in the top 10 instances of this list.
The big observation here is that when we really dig into the most common
components used in the enterprises, there are a lot of hidden surprises as
dependencies come into play. This can pose a real challenge when tracking
common component vulnerabilities. For example, Commons-collections-3.2.1
is the sixth most common component overall and the most prevalent
component with high vulnerabilities, as you’ll see in the table below.
OVERALL
97%
The table to the right was
compiled by focusing on all
Java component versions
that had a Common
Vulnerability Scoring System
(CVSS) score of 6.1 or higher.
Prevalence was based on
the percentage of Java
applications affected and
the percentage of all static
applications assessed
during this period.
20 State of Software Security 2016
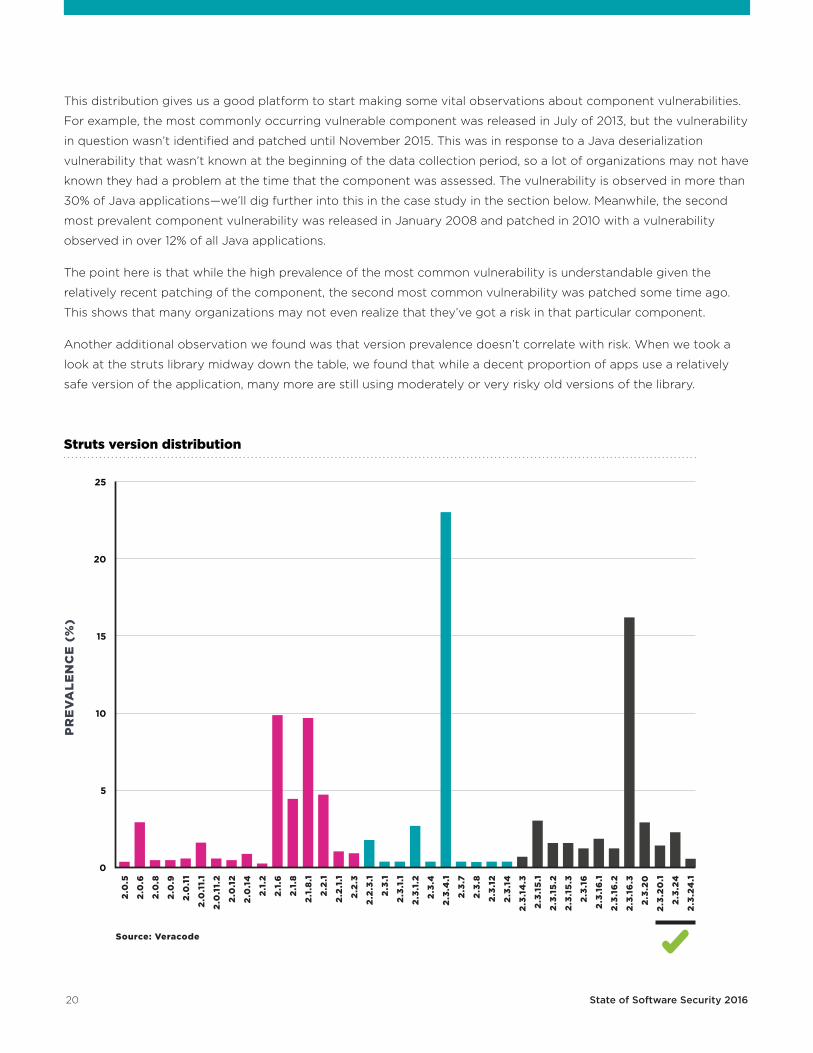
This distribution gives us a good platform to start making some vital observations about component vulnerabilities.
For example, the most commonly occurring vulnerable component was released in July of 2013, but the vulnerability
in question wasn’t identified and patched until November 2015. This was in response to a Java deserialization
vulnerability that wasn’t known at the beginning of the data collection period, so a lot of organizations may not have
known they had a problem at the time that the component was assessed. The vulnerability is observed in more than
30% of Java applications—we’ll dig further into this in the case study in the section below. Meanwhile, the second
most prevalent component vulnerability was released in January 2008 and patched in 2010 with a vulnerability
observed in over 12% of all Java applications.
The point here is that while the high prevalence of the most common vulnerability is understandable given the
relatively recent patching of the component, the second most common vulnerability was patched some time ago.
This shows that many organizations may not even realize that they’ve got a risk in that particular component.
Another additional observation we found was that version prevalence doesn’t correlate with risk. When we took a
look at the struts library midway down the table, we found that while a decent proportion of apps use a relatively
safe version of the application, many more are still using moderately or very risky old versions of the library.
Struts version distribution
PR
EV
ALE
NC
E (
%)
25
20
15
10
5
0
25
20
15
10
5
0
2.0
.5
2.0
.6
2.0
.8
2.0
.9
2.0
.11
2.0
.11.
1
2.0
.11.
2
2.0
.12
2.0
.14
2.1.
2
2.1.
6
2.1.
8
2.1.
8.1
2.2.
1
2.2.
1.1
2.2.
3
2.2.
3.1
2.3.
1
2.3.
1.1
2.3.
1.2
2.3.
4
2.3.
4.1
2.3.
7
2.3.
8
2.3.
12
2.3.
14
2.3.
14.3
2.3.
15.1
2.3.
15.2
2.3.
15.3
2.3.
16
2.3.
16.1
2.3.
16.2
2.3.
16.3
2.3.
20
2.3.
20.1
2.3.
24
2.3.
24.1
21 State of Software Security 2016
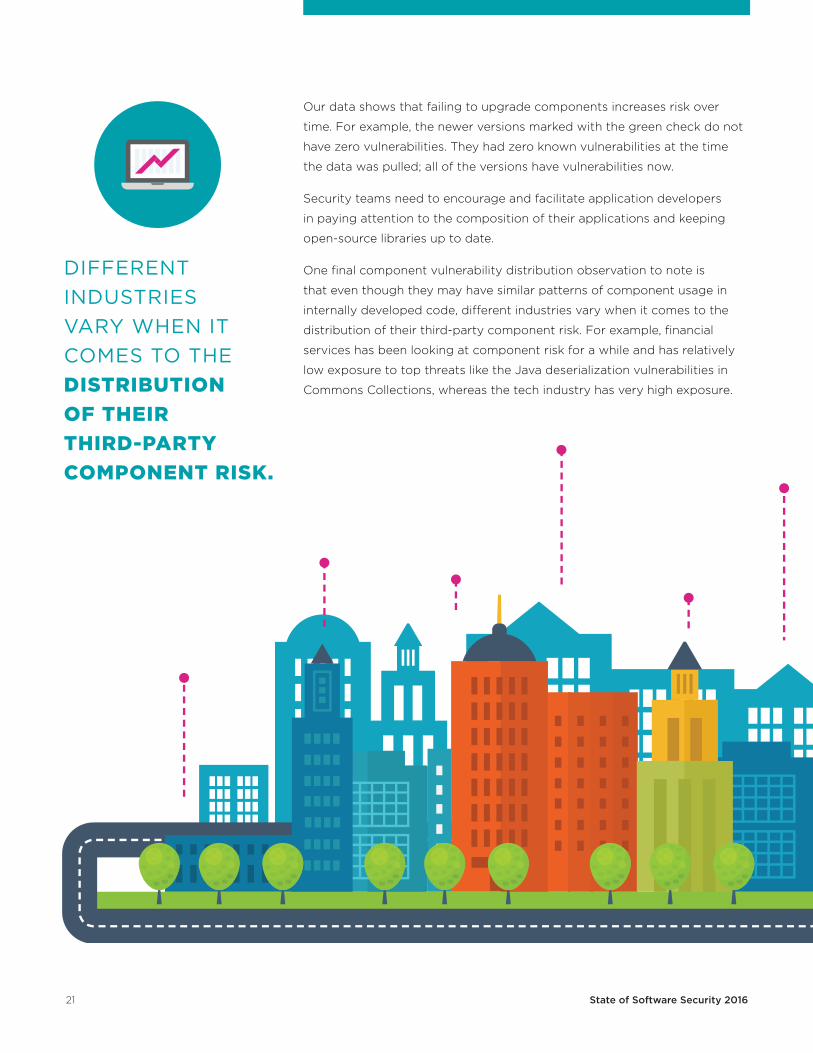
Our data shows that failing to upgrade components increases risk over
time. For example, the newer versions marked with the green check do not
have zero vulnerabilities. They had zero known vulnerabilities at the time
the data was pulled; all of the versions have vulnerabilities now.
Security teams need to encourage and facilitate application developers
in paying attention to the composition of their applications and keeping
open-source libraries up to date.
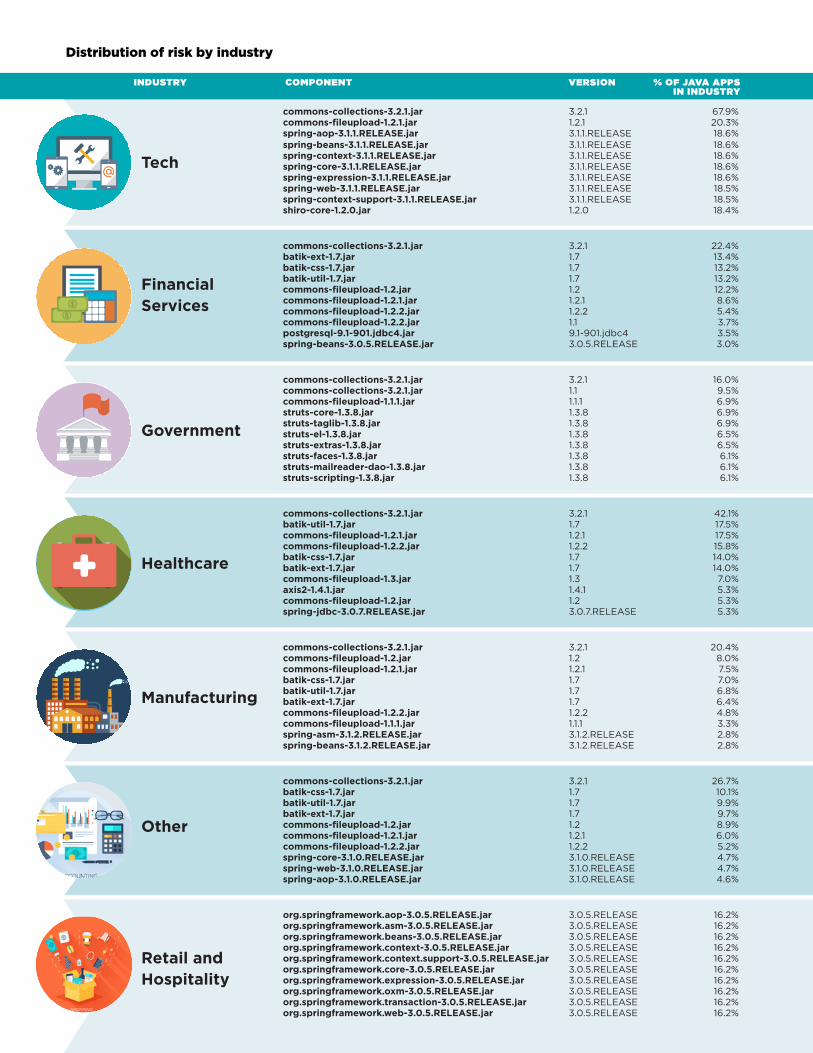
One final component vulnerability distribution observation to note is
that even though they may have similar patterns of component usage in
internally developed code, different industries vary when it comes to the
distribution of their third-party component risk. For example, financial
services has been looking at component risk for a while and has relatively
low exposure to top threats like the Java deserialization vulnerabilities in
Commons Collections, whereas the tech industry has very high exposure.
DIFFERENT INDUSTRIES VARY WHEN IT COMES TO THE DISTRIBUTION OF THEIR THIRD-PARTY COMPONENT RISK.
Tech
Financial Services
Government
Healthcare
Manufacturing
Other
Retail and Hospitality
INDUSTRY COMPONENT VERSION % OF JAVA APPS IN INDUSTRY
commons-collections-3.2.1.jar 3.2.1 67.9%commons-fileupload-1.2.1.jar 1.2.1 20.3%spring-aop-3.1.1.RELEASE.jar 3.1.1.RELEASE 18.6%spring-beans-3.1.1.RELEASE.jar 3.1.1.RELEASE 18.6%spring-context-3.1.1.RELEASE.jar 3.1.1.RELEASE 18.6%spring-core-3.1.1.RELEASE.jar 3.1.1.RELEASE 18.6%spring-expression-3.1.1.RELEASE.jar 3.1.1.RELEASE 18.6%spring-web-3.1.1.RELEASE.jar 3.1.1.RELEASE 18.5%spring-context-support-3.1.1.RELEASE.jar 3.1.1.RELEASE 18.5%shiro-core-1.2.0.jar 1.2.0 18.4%
commons-collections-3.2.1.jar 3.2.1 22.4%batik-ext-1.7.jar 1.7 13.4%batik-css-1.7.jar 1.7 13.2%batik-util-1.7.jar 1.7 13.2%commons-fileupload-1.2.jar 1.2 12.2%commons-fileupload-1.2.1.jar 1.2.1 8.6%commons-fileupload-1.2.2.jar 1.2.2 5.4%commons-fileupload-1.2.2.jar 1.1 3.7%postgresql-9.1-901.jdbc4.jar 9.1-901.jdbc4 3.5%spring-beans-3.0.5.RELEASE.jar 3.0.5.RELEASE 3.0%
commons-collections-3.2.1.jar 3.2.1 16.0%commons-collections-3.2.1.jar 1.1 9.5%commons-fileupload-1.1.1.jar 1.1.1 6.9%struts-core-1.3.8.jar 1.3.8 6.9%struts-taglib-1.3.8.jar 1.3.8 6.9%struts-el-1.3.8.jar 1.3.8 6.5%struts-extras-1.3.8.jar 1.3.8 6.5%struts-faces-1.3.8.jar 1.3.8 6.1%struts-mailreader-dao-1.3.8.jar 1.3.8 6.1%struts-scripting-1.3.8.jar 1.3.8 6.1%
commons-collections-3.2.1.jar 3.2.1 42.1%batik-util-1.7.jar 1.7 17.5%commons-fileupload-1.2.1.jar 1.2.1 17.5%commons-fileupload-1.2.2.jar 1.2.2 15.8%batik-css-1.7.jar 1.7 14.0%batik-ext-1.7.jar 1.7 14.0%commons-fileupload-1.3.jar 1.3 7.0%axis2-1.4.1.jar 1.4.1 5.3%commons-fileupload-1.2.jar 1.2 5.3%spring-jdbc-3.0.7.RELEASE.jar 3.0.7.RELEASE 5.3%
commons-collections-3.2.1.jar 3.2.1 20.4%commons-fileupload-1.2.jar 1.2 8.0%commons-fileupload-1.2.1.jar 1.2.1 7.5%batik-css-1.7.jar 1.7 7.0%batik-util-1.7.jar 1.7 6.8%batik-ext-1.7.jar 1.7 6.4%commons-fileupload-1.2.2.jar 1.2.2 4.8%commons-fileupload-1.1.1.jar 1.1.1 3.3%spring-asm-3.1.2.RELEASE.jar 3.1.2.RELEASE 2.8%spring-beans-3.1.2.RELEASE.jar 3.1.2.RELEASE 2.8%
commons-collections-3.2.1.jar 3.2.1 26.7%batik-css-1.7.jar 1.7 10.1%batik-util-1.7.jar 1.7 9.9%batik-ext-1.7.jar 1.7 9.7%commons-fileupload-1.2.jar 1.2 8.9%commons-fileupload-1.2.1.jar 1.2.1 6.0%commons-fileupload-1.2.2.jar 1.2.2 5.2%spring-core-3.1.0.RELEASE.jar 3.1.0.RELEASE 4.7%spring-web-3.1.0.RELEASE.jar 3.1.0.RELEASE 4.7%spring-aop-3.1.0.RELEASE.jar 3.1.0.RELEASE 4.6%
org.springframework.aop-3.0.5.RELEASE.jar 3.0.5.RELEASE 16.2%org.springframework.asm-3.0.5.RELEASE.jar 3.0.5.RELEASE 16.2%org.springframework.beans-3.0.5.RELEASE.jar 3.0.5.RELEASE 16.2%org.springframework.context-3.0.5.RELEASE.jar 3.0.5.RELEASE 16.2%org.springframework.context.support-3.0.5.RELEASE.jar 3.0.5.RELEASE 16.2%org.springframework.core-3.0.5.RELEASE.jar 3.0.5.RELEASE 16.2%org.springframework.expression-3.0.5.RELEASE.jar 3.0.5.RELEASE 16.2%org.springframework.oxm-3.0.5.RELEASE.jar 3.0.5.RELEASE 16.2%org.springframework.transaction-3.0.5.RELEASE.jar 3.0.5.RELEASE 16.2%org.springframework.web-3.0.5.RELEASE.jar 3.0.5.RELEASE 16.2%
Distribution of risk by industry
23 State of Software Security 2016
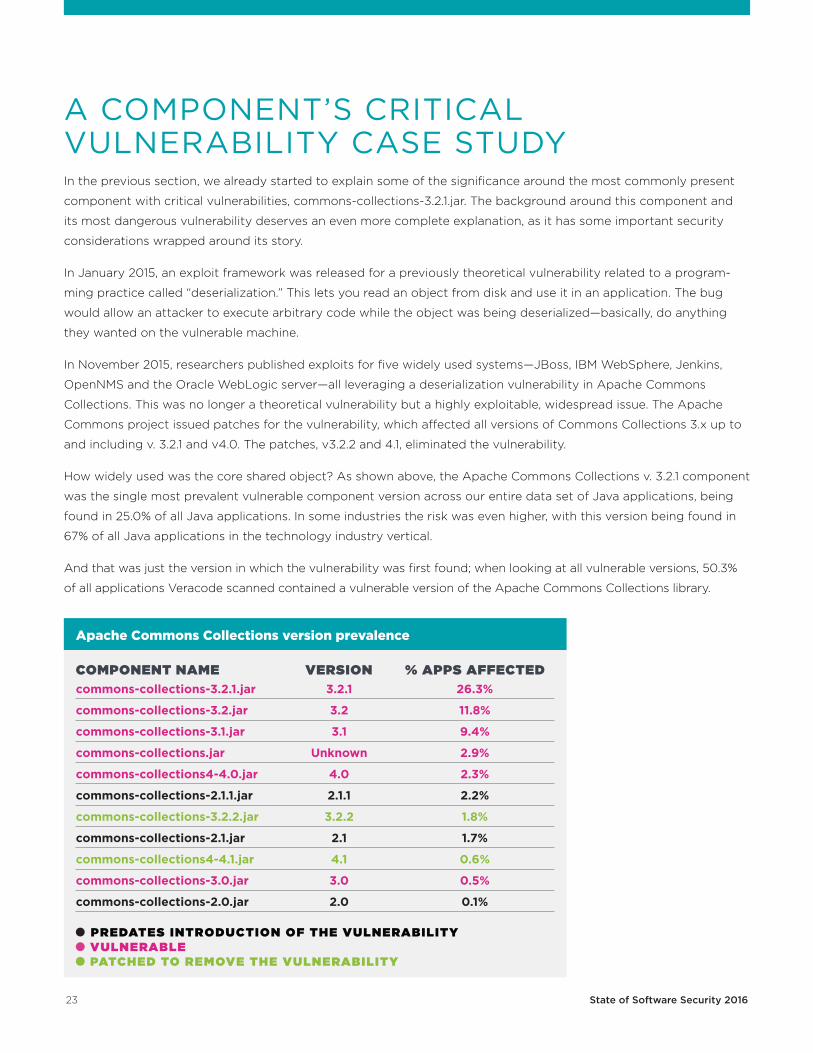
Apache Commons Collections version prevalence
COMPONENT NAME VERSION % APPS AFFECTEDcommons-collections-3.2.1.jar 3.2.1 26.3%
commons-collections-3.2.jar 3.2 11.8%
commons-collections-3.1.jar 3.1 9.4%
commons-collections.jar Unknown 2.9%
commons-collections4-4.0.jar 4.0 2.3%
commons-collections-2.1.1.jar 2.1.1 2.2%
commons-collections-3.2.2.jar 3.2.2 1.8%
commons-collections-2.1.jar 2.1 1.7%
commons-collections4-4.1.jar 4.1 0.6%
commons-collections-3.0.jar 3.0 0.5%
commons-collections-2.0.jar 2.0 0.1%
PREDATES INTRODUCTION OF THE VULNERABILITY VULNERABLE PATCHED TO REMOVE THE VULNERABILITY
A COMPONENT’S CRITICAL VULNERABILITY CASE STUDYIn the previous section, we already started to explain some of the significance around the most commonly present
component with critical vulnerabilities, commons-collections-3.2.1.jar. The background around this component and
its most dangerous vulnerability deserves an even more complete explanation, as it has some important security
considerations wrapped around its story.
In January 2015, an exploit framework was released for a previously theoretical vulnerability related to a program-
ming practice called “deserialization.” This lets you read an object from disk and use it in an application. The bug
would allow an attacker to execute arbitrary code while the object was being deserialized—basically, do anything
they wanted on the vulnerable machine.
In November 2015, researchers published exploits for five widely used systems—JBoss, IBM WebSphere, Jenkins,
OpenNMS and the Oracle WebLogic server—all leveraging a deserialization vulnerability in Apache Commons
Collections. This was no longer a theoretical vulnerability but a highly exploitable, widespread issue. The Apache
Commons project issued patches for the vulnerability, which affected all versions of Commons Collections 3.x up to
and including v. 3.2.1 and v4.0. The patches, v3.2.2 and 4.1, eliminated the vulnerability.
How widely used was the core shared object? As shown above, the Apache Commons Collections v. 3.2.1 component
was the single most prevalent vulnerable component version across our entire data set of Java applications, being
found in 25.0% of all Java applications. In some industries the risk was even higher, with this version being found in
67% of all Java applications in the technology industry vertical.
And that was just the version in which the vulnerability was first found; when looking at all vulnerable versions, 50.3%
of all applications Veracode scanned contained a vulnerable version of the Apache Commons Collections library.
24 State of Software Security 2016
The problem goes even further. A Java library that uses Apache Commons
Collections and does deserialization may also exhibit the vulnerability. Caleb
Fenton at Sourceclear has assembled a candidate list of libraries that may be
vulnerable to deserialization exploits thanks to their use of Apache Commons,
including Apache Hadoop Common, Jasper Reports, OWASP ESAPI (when
using Base64.decodeToObject) and others.1 It should also be noted that
Apache Commons Collections is not the only library that performs unsafe
deserialization; vulnerabilities related to serialization and deserialization were
disclosed in 2016 in Apache ActiveMQ and Apache Camel.
What do we learn from this? The Java deserialization vulnerability in
Apache Commons Collections is an interesting example of an open-source,
third-party component vulnerability, because it went from unknown
to critical and highly exploitable, and because it was widely used in a
variety of standard “infrastructure” applications—web servers, application
servers, CI servers, etc. But it’s worth noting that the issue was not just in
the infrastructure applications, but in any application that uses Apache
Commons Collections v.3.0 - 3.2.1 or 4.0. Addressing this vulnerability
requires a broader response than just patching servers; it requires visibility
into the component supply chain for all of your applications.
Even Broader Implications of the Apache Commmons Collections Deserialization Vulnerability
And it’s broader than that, as well. Veracode introduced a check for unsafe
deserialization (CWE 502) in a customer’s own Java code—not in an open-
source component—in our November 2015 release. In the four months from
then to the end of our data set for this volume of State of Software Security,
we detected the vulnerability in 24%, or almost one in four, of all Java
applications scanned. The prevalence was substantially higher in commercial
software, where we found the vulnerability in 41% of all applications.
This simply reinforces the point that one application security technology is
not sufficient to guard against the vulnerability landscape. A combination
approach is needed that leverages appropriate checks for your own code
and for the code in your software supply chain.
Newly discovered vulnerabilities are rarely only in open-source code; you
need to be able to look for them in closed source as well.
For a proper application security program, you need to be able to look at
vulnerabilities in open-source and commercial components, code written by
your team, and code written by your suppliers as well.
1 Fenton, Caleb, “Commons Collections Deserialization Vulnerability Research Findings,” SRC:CLR (blog), 2015-12-02.
25 State of Software Security 2016
In the last volume of SOSS, Veracode spent a considerable amount of time telling the story of stack ranking of
industry performance and taking an overall look at the numbers based on verticals. We believe it is important to
continue to look at industry performance, which is why we’re issuing another update to show how things have
changed since 2015, and also spending some time analyzing healthcare peformance, especially in the light of
growing healthcare breach incident rates over the past year.
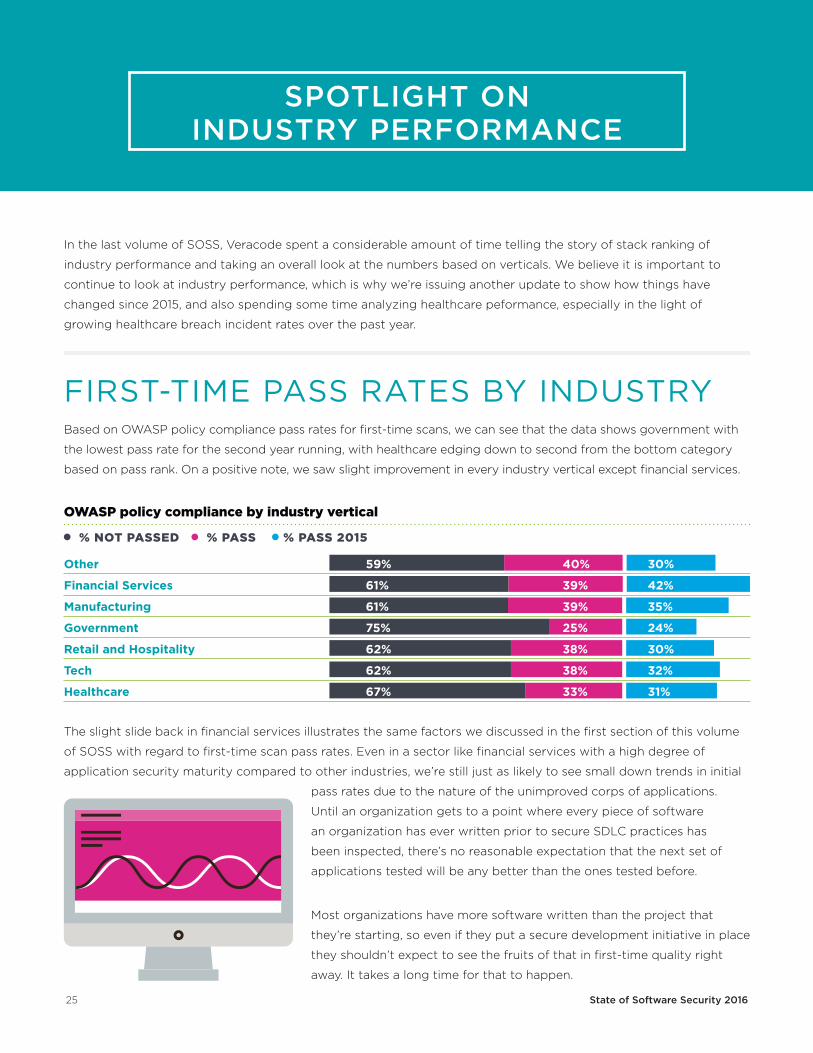
FIRST-TIME PASS RATES BY INDUSTRYBased on OWASP policy compliance pass rates for first-time scans, we can see that the data shows government with
the lowest pass rate for the second year running, with healthcare edging down to second from the bottom category
based on pass rank. On a positive note, we saw slight improvement in every industry vertical except financial services.
The slight slide back in financial services illustrates the same factors we discussed in the first section of this volume
of SOSS with regard to first-time scan pass rates. Even in a sector like financial services with a high degree of
application security maturity compared to other industries, we’re still just as likely to see small down trends in initial
pass rates due to the nature of the unimproved corps of applications.
Until an organization gets to a point where every piece of software
an organization has ever written prior to secure SDLC practices has
been inspected, there’s no reasonable expectation that the next set of
applications tested will be any better than the ones tested before.
Most organizations have more software written than the project that
they’re starting, so even if they put a secure development initiative in place
they shouldn’t expect to see the fruits of that in first-time quality right
away. It takes a long time for that to happen.
OWASP policy compliance by industry vertical
% NOT PASSED % PASS % PASS 2015
Other 59% 40% 30%
Financial Services 61% 39% 42%
Manufacturing 61% 39% 35%
Government 75% 25% 24%
Retail and Hospitality 62% 38% 30%
Tech 62% 38% 32%
Healthcare 67% 33% 31%
SPOTLIGHT ON INDUSTRY PERFORMANCE
26 State of Software Security 2016
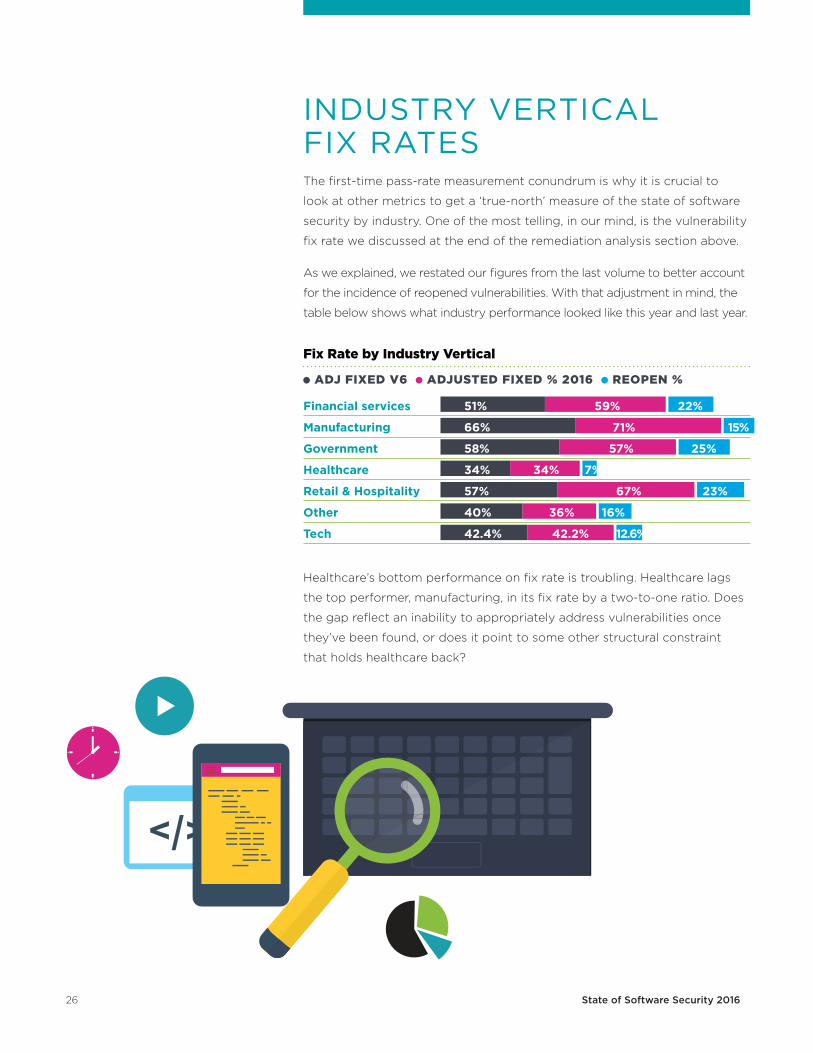
INDUSTRY VERTICAL FIX RATESThe first-time pass-rate measurement conundrum is why it is crucial to
look at other metrics to get a ‘true-north’ measure of the state of software
security by industry. One of the most telling, in our mind, is the vulnerability
fix rate we discussed at the end of the remediation analysis section above.
As we explained, we restated our figures from the last volume to better account
for the incidence of reopened vulnerabilities. With that adjustment in mind, the
table below shows what industry performance looked like this year and last year.
Healthcare’s bottom performance on fix rate is troubling. Healthcare lags
the top performer, manufacturing, in its fix rate by a two-to-one ratio. Does
the gap reflect an inability to appropriately address vulnerabilities once
they’ve been found, or does it point to some other structural constraint
that holds healthcare back?
Fix Rate by Industry Vertical
ADJ FIXED V6 ADJUSTED FIXED % 2016 REOPEN %
Financial services 51% 59% 22%
Manufacturing 66% 71% 15%
Government 58% 57% 25%
Healthcare 34% 34% 7%
Retail & Hospitality 57% 67% 23%
Other 40% 36% 16%
Tech 42.4% 42.2% 12.6%
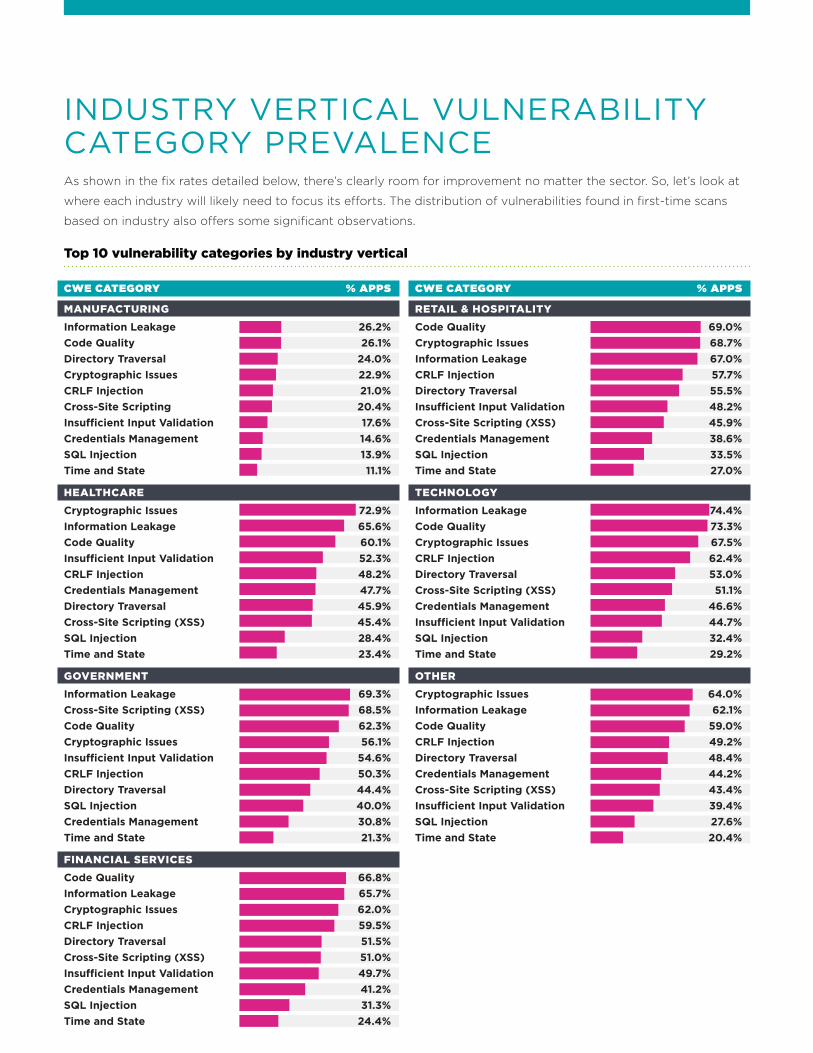
INDUSTRY VERTICAL VULNERABILITY CATEGORY PREVALENCEAs shown in the fix rates detailed below, there’s clearly room for improvement no matter the sector. So, let’s look at
where each industry will likely need to focus its efforts. The distribution of vulnerabilities found in first-time scans
based on industry also offers some significant observations.
Top 10 vulnerability categories by industry vertical
CWE CATEGORY % APPS
MANUFACTURING
Information Leakage 26.2%Code Quality 26.1%Directory Traversal 24.0%Cryptographic Issues 22.9%CRLF Injection 21.0%Cross-Site Scripting 20.4%Insufficient Input Validation 17.6%Credentials Management 14.6%SQL Injection 13.9%Time and State 11.1%
HEALTHCARE
Cryptographic Issues 72.9%Information Leakage 65.6%Code Quality 60.1%Insufficient Input Validation 52.3%CRLF Injection 48.2%Credentials Management 47.7%Directory Traversal 45.9%Cross-Site Scripting (XSS) 45.4%SQL Injection 28.4%Time and State 23.4%
GOVERNMENT
Information Leakage 69.3%Cross-Site Scripting (XSS) 68.5%Code Quality 62.3%Cryptographic Issues 56.1%Insufficient Input Validation 54.6%CRLF Injection 50.3%Directory Traversal 44.4%SQL Injection 40.0%Credentials Management 30.8%Time and State 21.3%
FINANCIAL SERVICES Code Quality 66.8%Information Leakage 65.7%Cryptographic Issues 62.0%CRLF Injection 59.5%Directory Traversal 51.5%Cross-Site Scripting (XSS) 51.0%Insufficient Input Validation 49.7%Credentials Management 41.2%SQL Injection 31.3%Time and State 24.4%
CWE CATEGORY % APPS
RETAIL & HOSPITALITYCode Quality 69.0%Cryptographic Issues 68.7%Information Leakage 67.0%CRLF Injection 57.7%Directory Traversal 55.5%Insufficient Input Validation 48.2%Cross-Site Scripting (XSS) 45.9%Credentials Management 38.6%SQL Injection 33.5%Time and State 27.0%
TECHNOLOGYInformation Leakage 74.4%Code Quality 73.3%Cryptographic Issues 67.5%CRLF Injection 62.4%Directory Traversal 53.0%Cross-Site Scripting (XSS) 51.1%Credentials Management 46.6%Insufficient Input Validation 44.7%SQL Injection 32.4%Time and State 29.2%
OTHERCryptographic Issues 64.0%Information Leakage 62.1%Code Quality 59.0%CRLF Injection 49.2%Directory Traversal 48.4%Credentials Management 44.2%Cross-Site Scripting (XSS) 43.4%Insufficient Input Validation 39.4%SQL Injection 27.6%Time and State 20.4%
28 State of Software Security 2016
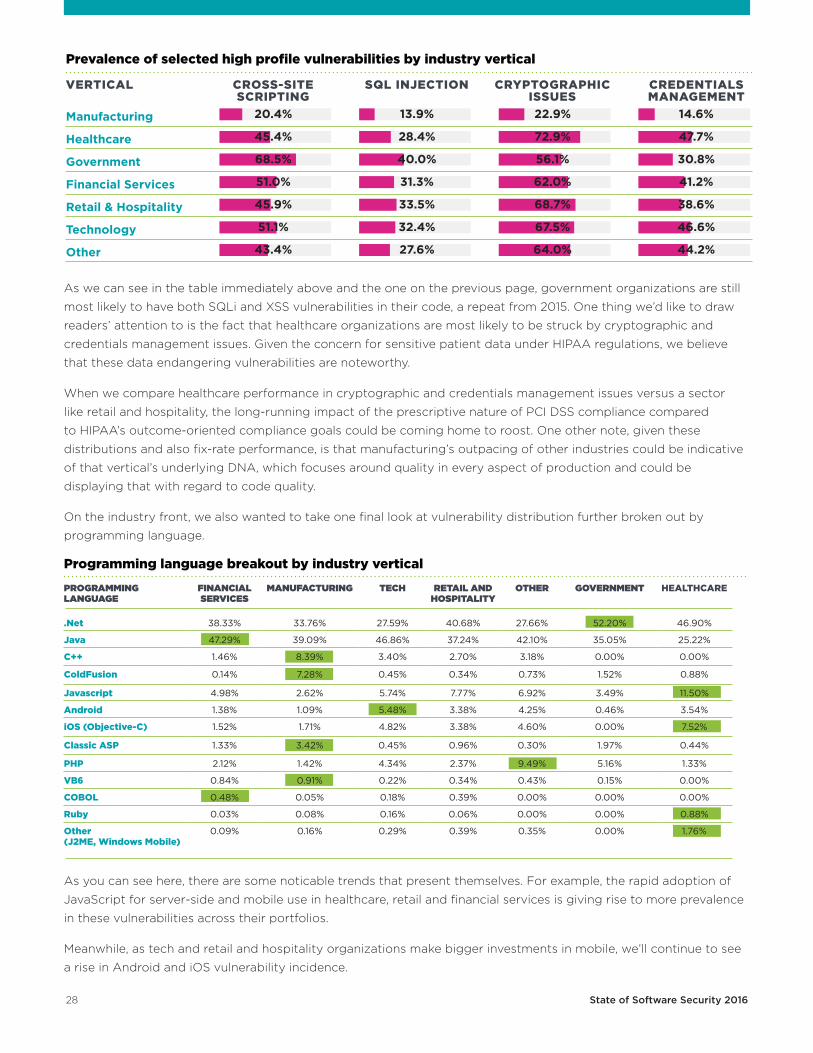
As we can see in the table immediately above and the one on the previous page, government organizations are still
most likely to have both SQLi and XSS vulnerabilities in their code, a repeat from 2015. One thing we’d like to draw
readers’ attention to is the fact that healthcare organizations are most likely to be struck by cryptographic and
credentials management issues. Given the concern for sensitive patient data under HIPAA regulations, we believe
that these data endangering vulnerabilities are noteworthy.
When we compare healthcare performance in cryptographic and credentials management issues versus a sector
like retail and hospitality, the long-running impact of the prescriptive nature of PCI DSS compliance compared
to HIPAA’s outcome-oriented compliance goals could be coming home to roost. One other note, given these
distributions and also fix-rate performance, is that manufacturing’s outpacing of other industries could be indicative
of that vertical’s underlying DNA, which focuses around quality in every aspect of production and could be
displaying that with regard to code quality.
On the industry front, we also wanted to take one final look at vulnerability distribution further broken out by
programming language.
As you can see here, there are some noticable trends that present themselves. For example, the rapid adoption of
JavaScript for server-side and mobile use in healthcare, retail and financial services is giving rise to more prevalence
in these vulnerabilities across their portfolios.
Meanwhile, as tech and retail and hospitality organizations make bigger investments in mobile, we’ll continue to see
a rise in Android and iOS vulnerability incidence.
Programming language breakout by industry vertical
PROGRAMMING LANGUAGE
FINANCIAL SERVICES
MANUFACTURING TECH RETAIL AND HOSPITALITY
OTHER GOVERNMENT HEALTHCARE
.Net 38.33% 33.76% 27.59% 40.68% 27.66% 52.20% 46.90%
Java 47.29% 39.09% 46.86% 37.24% 42.10% 35.05% 25.22%
C++ 1.46% 8.39% 3.40% 2.70% 3.18% 0.00% 0.00%
ColdFusion 0.14% 7.28% 0.45% 0.34% 0.73% 1.52% 0.88%
Javascript 4.98% 2.62% 5.74% 7.77% 6.92% 3.49% 11.50%
Android 1.38% 1.09% 5.48% 3.38% 4.25% 0.46% 3.54%
iOS (Objective-C) 1.52% 1.71% 4.82% 3.38% 4.60% 0.00% 7.52%
Classic ASP 1.33% 3.42% 0.45% 0.96% 0.30% 1.97% 0.44%
PHP 2.12% 1.42% 4.34% 2.37% 9.49% 5.16% 1.33%
VB6 0.84% 0.91% 0.22% 0.34% 0.43% 0.15% 0.00%
COBOL 0.48% 0.05% 0.18% 0.39% 0.00% 0.00% 0.00%
Ruby 0.03% 0.08% 0.16% 0.06% 0.00% 0.00% 0.88%
Other (J2ME, Windows Mobile)
0.09% 0.16% 0.29% 0.39% 0.35% 0.00% 1.76%
Prevalence of selected high profile vulnerabilities by industry vertical
VERTICAL CROSS-SITE SQL INJECTION CRYPTOGRAPHIC CREDENTIALS SCRIPTING ISSUES MANAGEMENTManufacturing 20.4% 13.9% 22.9% 14.6%
Healthcare 45.4% 28.4% 72.9% 47.7%
Government 68.5% 40.0% 56.1% 30.8%
Financial Services 51.0% 31.3% 62.0% 41.2%
Retail & Hospitality 45.9% 33.5% 68.7% 38.6%
Technology 51.1% 32.4% 67.5% 46.6%
Other 43.4% 27.6% 64.0% 44.2%
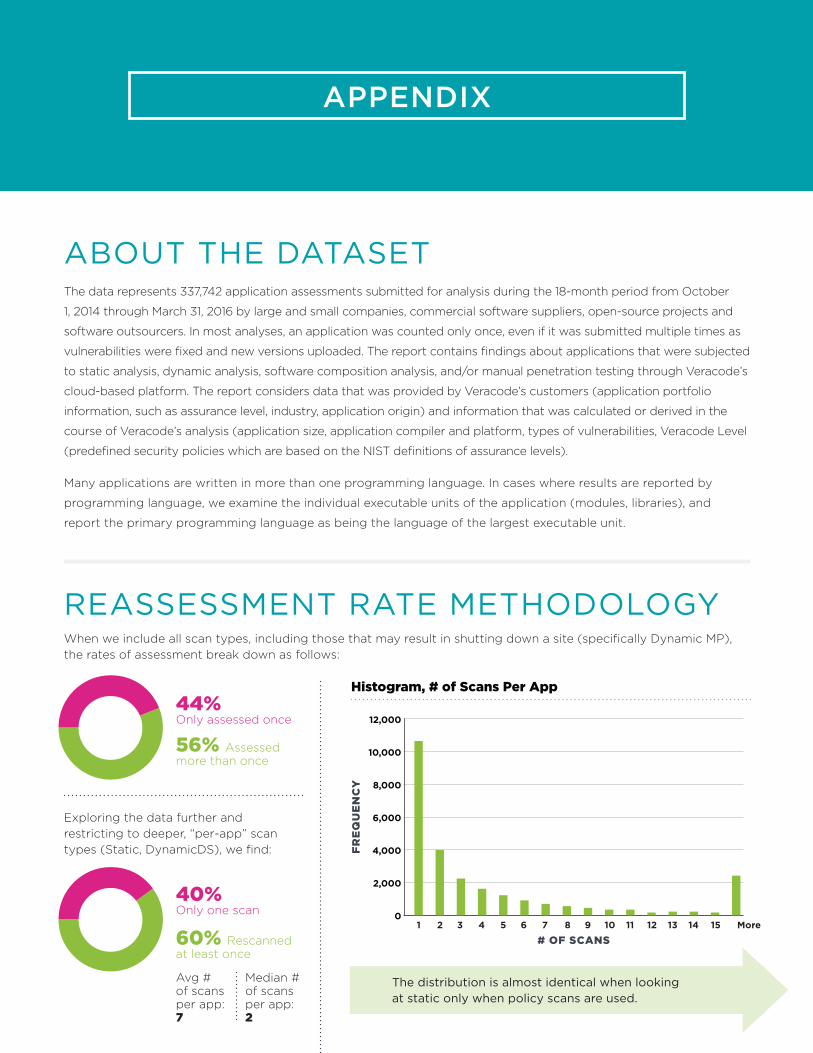
ABOUT THE DATASETThe data represents 337,742 application assessments submitted for analysis during the 18-month period from October
1, 2014 through March 31, 2016 by large and small companies, commercial software suppliers, open-source projects and
software outsourcers. In most analyses, an application was counted only once, even if it was submitted multiple times as
vulnerabilities were fixed and new versions uploaded. The report contains findings about applications that were subjected
to static analysis, dynamic analysis, software composition analysis, and/or manual penetration testing through Veracode’s
cloud-based platform. The report considers data that was provided by Veracode’s customers (application portfolio
information, such as assurance level, industry, application origin) and information that was calculated or derived in the
course of Veracode’s analysis (application size, application compiler and platform, types of vulnerabilities, Veracode Level
(predefined security policies which are based on the NIST definitions of assurance levels).
Many applications are written in more than one programming language. In cases where results are reported by
programming language, we examine the individual executable units of the application (modules, libraries), and
report the primary programming language as being the language of the largest executable unit.
REASSESSMENT RATE METHODOLOGYWhen we include all scan types, including those that may result in shutting down a site (specifically Dynamic MP), the rates of assessment break down as follows:
APPENDIX
Histogram, # of Scans Per App
Median # of scans per app: 2
Avg # of scans per app: 7
Exploring the data further and restricting to deeper, “per-app” scan types (Static, DynamicDS), we find:
40% Only one scan
60% Rescanned at least once
56% Assessed more than once
44% Only assessed once
The distribution is almost identical when looking at static only when policy scans are used.
FR
EQ
UE
NC
Y
12,000
10,000
8,000
6,000
4,000
2,000
0
# OF SCANS1 5 92 63 74 8 151413121110 More
30 State of Software Security 2016
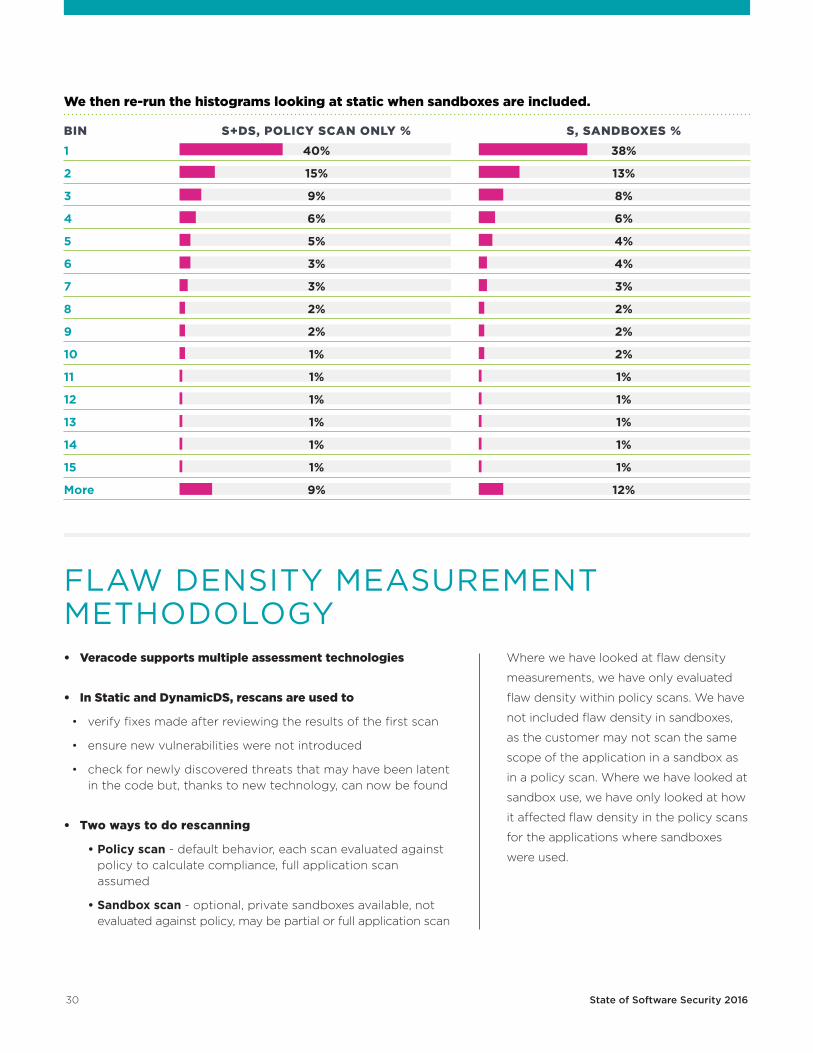
We then re-run the histograms looking at static when sandboxes are included.
FLAW DENSITY MEASUREMENT METHODOLOGY• Veracode supports multiple assessment technologies
• In Static and DynamicDS, rescans are used to
• verify fixes made after reviewing the results of the first scan
• ensure new vulnerabilities were not introduced
• check for newly discovered threats that may have been latent in the code but, thanks to new technology, can now be found
• Two ways to do rescanning
• Policy scan - default behavior, each scan evaluated against policy to calculate compliance, full application scan assumed
• Sandbox scan - optional, private sandboxes available, not evaluated against policy, may be partial or full application scan
Where we have looked at flaw density
measurements, we have only evaluated
flaw density within policy scans. We have
not included flaw density in sandboxes,
as the customer may not scan the same
scope of the application in a sandbox as
in a policy scan. Where we have looked at
sandbox use, we have only looked at how
it affected flaw density in the policy scans
for the applications where sandboxes
were used.
BIN S+DS, POLICY SCAN ONLY % S, SANDBOXES %1 40% 38%
2 15% 13%
3 9% 8%
4 6% 6%
5 5% 4%
6 3% 4%
7 3% 3%
8 2% 2%
9 2% 2%
10 1% 2%
11 1% 1%
12 1% 1%
13 1% 1%
14 1% 1%
15 1% 1%
More 9% 12%
31 State of Software Security 2016
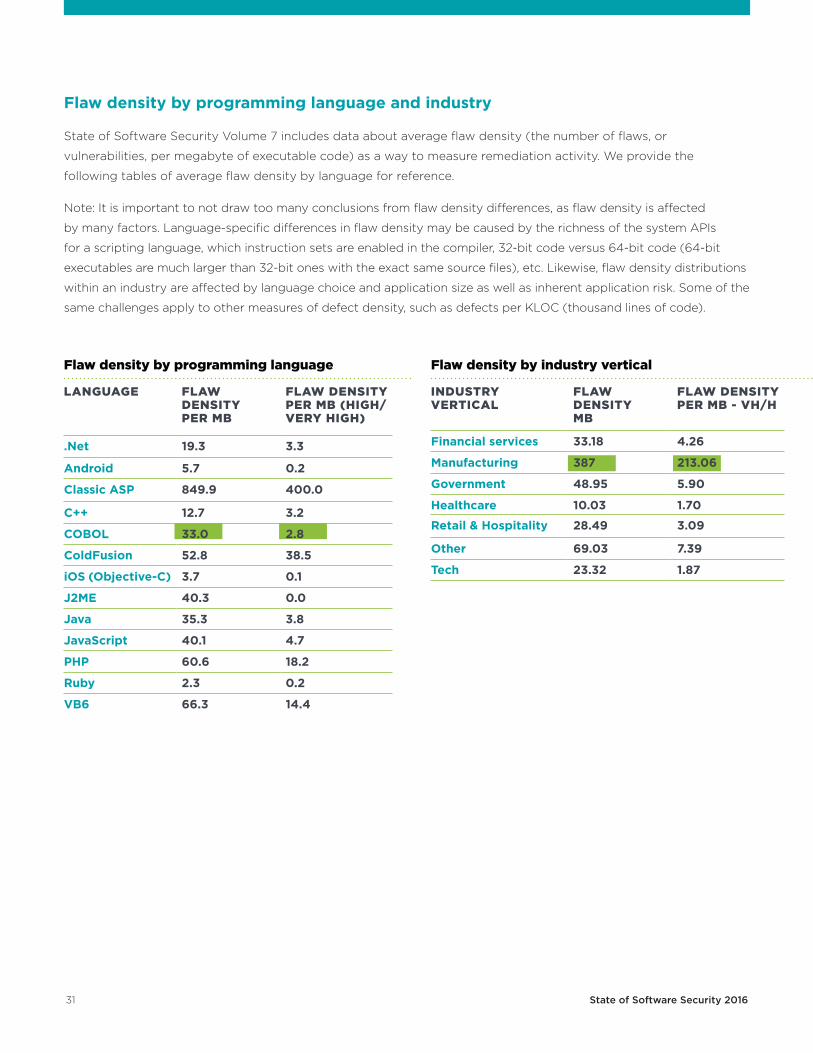
Flaw density by programming language and industry
State of Software Security Volume 7 includes data about average flaw density (the number of flaws, or
vulnerabilities, per megabyte of executable code) as a way to measure remediation activity. We provide the
following tables of average flaw density by language for reference.
Note: It is important to not draw too many conclusions from flaw density differences, as flaw density is affected
by many factors. Language-specific differences in flaw density may be caused by the richness of the system APIs
for a scripting language, which instruction sets are enabled in the compiler, 32-bit code versus 64-bit code (64-bit
executables are much larger than 32-bit ones with the exact same source files), etc. Likewise, flaw density distributions
within an industry are affected by language choice and application size as well as inherent application risk. Some of the
same challenges apply to other measures of defect density, such as defects per KLOC (thousand lines of code).
Flaw density by programming language Flaw density by industry vertical
LANGUAGE FLAW DENSITY PER MB
FLAW DENSITY PER MB (HIGH/VERY HIGH)
.Net 19.3 3.3
Android 5.7 0.2
Classic ASP 849.9 400.0
C++ 12.7 3.2
COBOL 33.0 2.8
ColdFusion 52.8 38.5
iOS (Objective-C) 3.7 0.1
J2ME 40.3 0.0
Java 35.3 3.8
JavaScript 40.1 4.7
PHP 60.6 18.2
Ruby 2.3 0.2
VB6 66.3 14.4
INDUSTRY VERTICAL
FLAW DENSITY MB
FLAW DENSITY PER MB - VH/H
Financial services 33.18 4.26
Manufacturing 387 213.06
Government 48.95 5.90
Healthcare 10.03 1.70
Retail & Hospitality 28.49 3.09
Other 69.03 7.39
Tech 23.32 1.87
32 State of Software Security 2016
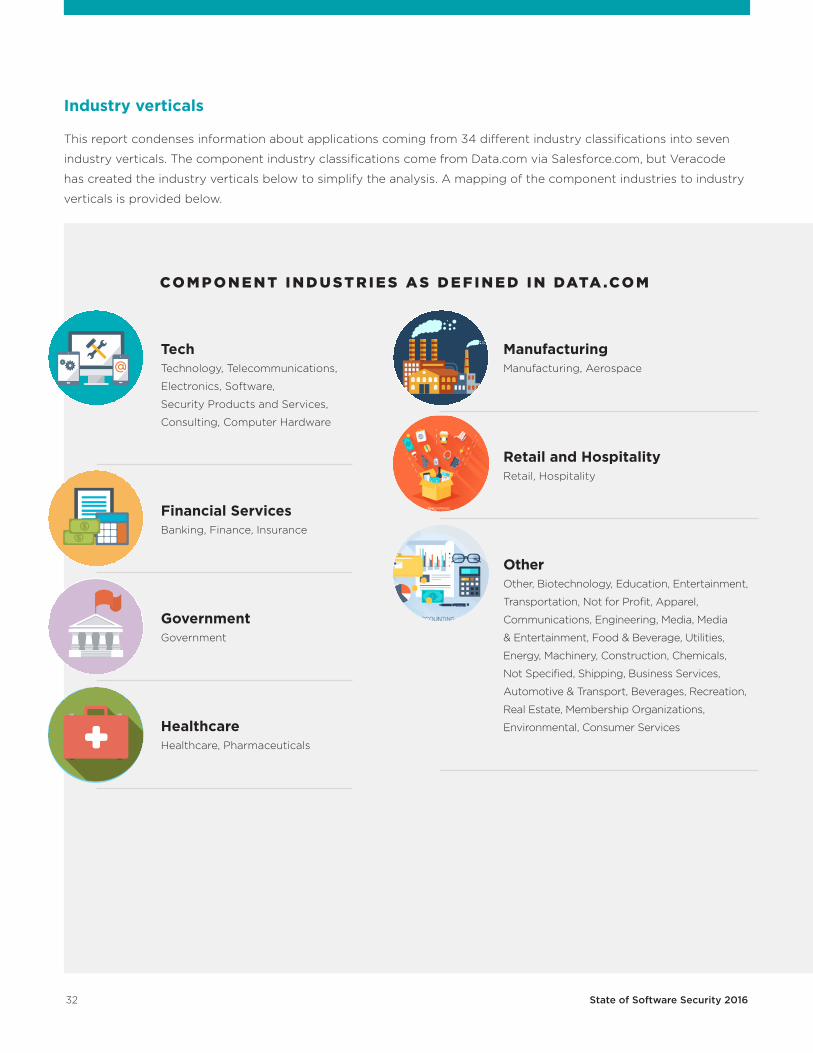
Industry verticals
This report condenses information about applications coming from 34 different industry classifications into seven
industry verticals. The component industry classifications come from Data.com via Salesforce.com, but Veracode
has created the industry verticals below to simplify the analysis. A mapping of the component industries to industry
verticals is provided below.
CO M P O N E N T I N D U ST R I E S A S D E F I N E D I N DATA .CO M
Manufacturing Manufacturing, Aerospace
Retail and Hospitality Retail, Hospitality
Other Other, Biotechnology, Education, Entertainment,
Transportation, Not for Profit, Apparel,
Communications, Engineering, Media, Media
& Entertainment, Food & Beverage, Utilities,
Energy, Machinery, Construction, Chemicals,
Not Specified, Shipping, Business Services,
Automotive & Transport, Beverages, Recreation,
Real Estate, Membership Organizations,
Environmental, Consumer Services
Tech Technology, Telecommunications,
Electronics, Software,
Security Products and Services,
Consulting, Computer Hardware
Financial Services Banking, Finance, Insurance
Government Government
Healthcare Healthcare, Pharmaceuticals

Veracode’s cloud-based service and systematic approach deliver a simpler and more scalable solution for reducing global application-layer risk across web, mobile and third-party applications. Recognized as a Gartner Magic Quadrant Leader since 2010, Veracode secures hundreds of the world’s largest global enterprises, including 3 of the top 4 banks in the Fortune 100 and 20+ of Forbes’ 100 Most Valuable Brands.
L EARN M ORE AT WWW.VERACODE .COM, ON THE VERACODE BLOG, AND ON TWIT T ER .
How are you tackling application security?Get our tips and advice on starting or managing an AppSec program with our Ultimate Guide to Getting Started With Application Security.
STATE OF SOFTWARE SECURITY
2016