Embed Size (px)
Citation preview

I LO As ia - Pa c i c Work in g Pa p er Se r ies
Partha Saha and Sher Verick
May 2016
State of rural labour markets in India
DWT for South Asia and Country Of ce for India
InternationalLabourOffice

ILO Asia-Pacific Working Paper Series
State of rural labour markets in India
Partha Saha and Sher Verick
May 2016
DWT for South Asia and Country Office for India
Copyright © International Labour Organization 2016
First published 2016
Publications of the International Labour Office enjoy copyright under Protocol 2 of the Universal Copyright
Convention. Nevertheless, short excerpts from them may be reproduced without authorization, on condition that the
source is indicated. For rights of reproduction or translation, application should be made to ILO Publications (Rights
and Permissions), International Labour Office, CH-1211 Geneva 22, Switzerland, or by email: [email protected]. The
International Labour Office welcomes such applications.
Libraries, institutions and other users registered with reproduction rights organizations may make copies in accordance
with the licences issued to them for this purpose. Visit www.ifrro.org to find the reproduction rights organization in
your country.
ILO Cataloguing in Publication Data
Saha, Partha; Verick, Sher
State of rural labour markets in India / Partha Saha, Sher Verick ; International Labour Organization ; ILO DWT for
South Asia and Country Office for India. - New Delhi: ILO, 2016 (ILO Asia-Pacific working paper series, ISSN:
2227-4391; 2227-4405 (web pdf))
ISBN: 9789221311874; 9789221311881 (web pdf)
International Labour Organization; ILO DWT for South Asia and Country Office for India.
rural employment / nonfarm employment / labour market / rural economy / agriculture / working conditions /
regional level / India
13.01.3
The designations employed in ILO publications, which are in conformity with United Nations practice, and the
presentation of material therein do not imply the expression of any opinion whatsoever on the part of the International
Labour Office concerning the legal status of any country, area or territory or of its authorities, or concerning the
delimitation of its frontiers.
The responsibility for opinions expressed in signed articles, studies and other contributions rests solely with their
authors, and publication does not constitute an endorsement by the International Labour Office of the opinions
expressed in them.
Reference to names of firms and commercial products and processes does not imply their endorsement by the
International Labour Office, and any failure to mention a particular firm, commercial product or process is not a sign
of disapproval.
ILO publications and electronic products can be obtained through major booksellers or ILO local offices in many
countries, or direct from ILO Publications, International Labour Office, CH-1211 Geneva 22, Switzerland, or ILO
DWT for South Asia and Country Office for India, Core 4B, 3rd Floor, India Habitat Centre, Lodhi Road, New Delhi
110003, India, or by email: [email protected]. Catalogues or lists of new publications are available free of charge from
the above address, or by email: [email protected].
Visit our website: www.ilo.org/publns or www.ilo.org/india.
Printed in India

Preface
The International Labour Organization (ILO) is devoted to advancing opportunities for women and men to
obtain decent and productive work. It aims to promote rights at work, encourage decent employment
opportunities, enhance social protection and strengthen dialogue in handling work-related issues. As
countries in the Asia and the Pacific region continue to recover from the global economic crisis, the ILO’s
Decent Work Agenda and the Global Jobs Pact provide critical policy frameworks to strengthen the
foundations for a more inclusive and sustainable future.
As part of an ILO project on Rural Labour Market in India, this paper by Partha Saha and Sher Verick
reviews the situation in rural labour market in India during the last one and half decade and its implication
on decent and productive employment. Drawing on a discussion covering education and skills development,
employment opportunities and social norms, agricultural mechanization, access to land, and public works
programme, this paper analyzes pace and pattern of rural diversification and some of the factors responsible
for this.
This paper is part of the ILO Asia-Pacific Working Paper Series, which is intended to enhance the body of
knowledge, stimulate discussion and encourage knowledge sharing and further research for the promotion
of decent work in Asia and the Pacific.
Panudda Boonpala
Director, ILO DWT for South Asia and the
Country Office for India


ILO DWT for South Asia and the Country Office for India iii
Table of contents
Preface ......................................................................................................................................................... i
Acknowledgments ........................................................................................................................................ v
Abstract ..................................................................................................................................................... vii
1. Introduction .......................................................................................................................................... 1
2. Rural diversification: Extent and pattern ............................................................................................. 4
3. Rural non-farm activities ..................................................................................................................... 7
4. Quality of employment ...................................................................................................................... 11
5. Gender and social group in rural non-farm employment ................................................................... 14
6. Determinants of rural diversification ................................................................................................. 16
6.1 Role of agriculture in rural diversification ....................................................................................... 16
6.2 Access to land and rural diversification ........................................................................................... 17
7. MNREGA and impact on rural livelihood ......................................................................................... 21
8. Summing up ....................................................................................................................................... 25
9. References .......................................................................................................................................... 28
10. Annexure ............................................................................................................................................ 31
List of figures
1. Average annual growth rate (1999-2000 to 2011-12) ............................................................................ 2
2. Annual average rate of growth of employment between 1999-2000 and 2011-12 ................................ 9
3. Proportion of rural households not cultivating any land and proportion of rural non-farm workers, by
major states, 1999-2000 .......................................................................................................................... 20
4. Proportion of rural households not cultivating any land and proportion of rural non-farm workers, by
major states, 2011-12 ............................................................................................................................... 20
5. Correlation between area irrigated and proportion of households having job cards, by NSS Region,
2009-10 .................................................................................................................................................... 22
6. Incidence of rural poverty and proportion of rural households which either got or sought MGNREGA
works, by state, 2009-10 .......................................................................................................................... 23
7. Per capita NSDP and proportion of rural households which either got or sought MGNREGA works,
by state, 2009-10 ..................................................................................................................................... 24
List of tables
1. Percentage of rural workers in non-farm activities (15 years and above) ............................................. 5
2. Percentage distribution of rural households, by household type within each asset ownership decile ... 6
3. Percentage distribution of rural non-agricultural households, by household type within each asset
ownership decile ........................................................................................................................................ 6
4. Percentage of rural workers in non-farm employment by industry (15 years and above, principal
status) ........................................................................................................................................................ 8
5. Percentage of rural workers in non-farm activities, by type of employment (15 years and above) ...... 9
6. Percentage of rural workers in non-farm wage employment, by type of employer (15 years and above)
................................................................................................................................................................. 10
7. Percentage of rural workers in non-farm wage employment, by number of workers in the enterprise
(15 years and above) ................................................................................................................................ 11
8. Percentage of rural workers in non-farm employment, by location of workplace (15 years and above)
................................................................................................................................................................. 11
9. Percentage of rural workers in non-farm wage employment, by type of job contract (15 years and
above) ...................................................................................................................................................... 12
10. Percentage of rural workers in non-farm formal sector employment, by formal and informal nature
of employment (15 years and above) ...................................................................................................... 13
11. Percentage of rural workers in non-farm employment, by level of education (15 years and above) ....
................................................................................................................................................................. 13
12. Percentage distribution of rural workers in non-farm employment, by level of technical education,
across different sectors (15 years and above) .......................................................................................... 14
13. Percentage of rural workers, by sector and gender (15 years and above) ......................................... 15
14. Proportion of females usually engaged in domestic duties (by usual principal activity) willing to
work within household premises, by type of work acceptable (15 years and above).............................. 15
15. Percentage of rural workers, by sector and social group (15 years and above) ................................. 16
16. Percentage distribution of area operated by rural households, by size class of operational holding .....
................................................................................................................................................................. 18
17. Percentage distribution of rural households, by size class of operational holding ............................ 19
18. Access index of operational holding for rural households, by size class of operational holding ...... 19
19. Proportion of households having job cards in each social group, rural India .................................... 22
20. Proportion of households that got work in each social group, rural India, 2009-10 ......................... 23

ILO DWT for South Asia and the Country Office for India v
Acknowledgements
We would like to thank participants of National Seminar on Dynamics of Rural Labour Relations in India,
organized by National Institute of Rural Development and Panchayati Raj, Hyderabad, India (10th to 12th
March, 2016) for their comments and suggestions which helped in further developing this paper. Our thanks
also go to Ruchika Chaudhary for helping with the formatting and editing. The responsibility of this paper
remains ours only.


ILO DWT for South Asia and the Country Office for India vii
Abstract
In India, while contribution of agriculture to GDP has been declining, agriculture still remains mainstay of
the rural economy by employing almost half of the population. However, the gap between job seekers in
rural areas and employment opportunities in agriculture has been widening and non-farm sector has become
an increasingly important source of livelihood. This paper analyses rural diversification across States in
rural India, factors responsible for non-agricultural employment, and identifies industries within rural non-
farm sector which are generating employment opportunities. Further, paper also looks into role of
agriculture in rural diversification. This study is based on Employment and Unemployment Survey
(National Sample Survey Organization) for the years 1999-2000 and 2011-12, and All India Debt and
Investment Survey (National sample Survey Organization) for the years 2002-03 and 2012-13. The broad
story that emerged from this analysis is that of a significant shift towards non-farm employment in rural
areas, and this shift happened predominantly among economically weaker sections of the rural society.
Access to land was an important determinant in this process of rural employment diversification.
About the authors
Partha Saha is Assistant Professor at Jindal School of Government and Public Policy, O.P. Jindal
Global University, Haryana, India.
Sher Verick is Deputy Director, ILO DWT for South Asia and the Country Office for India.
The responsibility for opinions expressed in articles, studies and other contributions
rests solely with their authors, and publication does not constitute an endorsement by
the International Labour Office of the opinions expressed in them, or of any products,
processes or geographical designations mentioned.


ILO DWT for South Asia and the Country Office for India 1
1. Introduction
Productive, decent, and durable (longer term) employment opportunities are what every individual in a
society looks forward to. One of the biggest challenges that the economy faces today is to provide quality
jobs to its growing labour force and thereby reap the benefits of demographic dividend. The problem of
lack of productive and decent employment opportunities became even more glaring when compared with
the unprecedented growth which the economy experienced during the last decade. During the period 1999-
2000 to 2011-12, the average annual growth rate of gross domestic product (GDP) was 7.4 per cent (GoI,
2013). This high and unprecedented rate of economic growth however failed to create any significant
impact towards generation of productive and decent work opportunities particularly in rural areas.
In case of most of the developing countries, development trajectory witnessed transition from a
predominantly agrarian economy to an industrialized one. Eventually new sectors emerge and share of
people dependent primarily on agriculture witnesses a reduction – the pace of which depends on various
factors. Also, the pace of economic diversification varies considerably between rural and urban areas.
Several empirical studies on developing countries have shown non-farm activities were gaining importance
in rural economies of developing countries (Hazell and Haggblade, 1993; Sen, 1996; Lanjouw, 1999). There
is a growing evidence of livelihood diversification in Africa towards non-agricultural sources of income,
and proportion of households depending solely on agriculture was a minority in many countries (Ellis,
2000; Francis, 2000; Bryceson, 2002). The range of non-farm activities were enormous and it primarily
depended on “distinct agrarian histories and levels of in situ peasant agricultural commodity production”
(Bryceson, 2002).
India was no exception to this process of structural transformation towards greater dependence on non-
agriculture, and contribution of agriculture to Gross Domestic Product (GDP) declined considerably over
the years (currently at 14% of GDP). This fall in the share of GDP was not accompanied by a concomitant
decline in agricultural employment (with almost half of the workforce still depending on agriculture for
livelihood). Therefore, the Kaldor-Kuznet long term dynamics of the economy was not fully realized in the
Indian context (Kaldor, 1967; Kuznets, 1965). However, in India, even though agriculture remained the
mainstay of rural livelihood, increasingly rural households are engaging in diversified economic activities.
Also, with increasing land fragmentation and rising demand for land for non-agricultural purposes, capacity
of agricultural sector to provide livelihood security (particularly to youth) is increasingly getting difficult.
National level studies indicated to a growing importance of non-farm sector in India. Based on a nationally
representative household survey in rural areas, Lanjouw and Shariff (2004) observed that on an average
non-farm income accounted for one-third of all household income. In addition to national level studies
based on employment and unemployment surveys conducted by National Sample Survey Organization
(NSSO), several studies at regional and village level also indicated to the growing importance of non-farm
activities in rural economy. Petty businesses (like tea stall, cycle repairing shops) as well as cane crushers,
rice mills, transport operators were growing in number in several parts of rural India (Wiser and Wiser,
1971; Epstein, 1973; Srinivas, 1976). Basant (1993) based on a primary survey in Gujarat observed that
nearly three fourth of the sample households had reported more than one sources of income. Other studies
have pointed out instances where individuals (primarily males) were specializing in occupations like band-
playing, boring tube-wells and construction related activities (Saith and Tankha, 1992; Saha, 2009).

2 ILO DWT for South Asia and the Country Office for India
Thus, while agriculture still remained mainstay of the rural economy, the gap between job seekers in rural
areas and employment opportunities in agriculture widened. Non-farm sector is slowly becoming an
increasingly important source of livelihood in rural India. More and more people in rural India have
diversified their sources of income, and non-farm sector played a pivotal role in this process of rural
diversification. Interestingly, studies have pointed out that diversification was not only an option for the
poor but also for the rich, and in fact the benefits for the richer households were found larger as compared
to the benefits accruing to the poor due to diversification (Hazel and Ramasamy, 1991).
If we consider employment growth of adults (15 years and above) on a longer term basis (principal status
implying at least half of the year), then we would observe that during the period 1999-2000 and 2011-12,
overall rural employment grew at an average of less than one per cent per annum, while rural non-farm
employment registered considerable increase (Figure 1).
Figure 1: Average annual growth rate (1999-2000 to 2011-12)
Clearly from Figure 1, we observe that there was considerable shift in rural employment out of agriculture
– a phenomenon quite common among developing countries. 1
By and large, two alternative hypotheses have been used to explain this phenomenon of increasing rural
non-farm employment. On the one hand it has been argued that this diversification is due to push factor or
driven by agricultural distress (Vaidyanathan, 1986; Ghuman, 2005), and on the other hand it is argued to
be driven by agricultural growth (i.e., farm and non-farm sectors act as complementary to each other). In
other words, agriculture has been argued to play a role in growth and development of non-farm sector – in
some areas agricultural growth has spurred non-farm activities (and hence resulted in non-farm
1National Sample Survey Organization has adopted the definition as used by Census of India for urban and rural areas. According
to this definition, urban areas are places with municipality/corporation/cantonment or all other places with a minimum population
of 5000, at least male working population as non-agriculturalists, and a population density of 390 persons per sq. km. All other
places are defined as rural sector. (http://mospi.nic.in/Mospi_New/upload/nsso/concepts_golden.pdf)
7.4
0.81
5.1
0
2
4
6
8
GDP at constant (2004-5)
prices
Rural employment (15 yrs
and above) in principal status
Rural non-farm employment
(15 yrs and above) in
principal status
Percen
tag
e

ILO DWT for South Asia and the Country Office for India 3
employment), while in others, lack of agricultural growth has pushed people into non-agricultural sources
of livelihood and in this sense non-farm activities were viewed as “residual” sector.
While studies have analyzed the flow from agriculture to non-agriculture through production and
consumption linkages, it might even be the case that farm and non-farm sectors develop by and large
independently without any significant inter-relationship between them. Regional characteristics also play a
crucial role in explaining growth and development of non-farm employment in rural areas.
Scholars who argued agricultural growth to be the principal driver of rural diversification documented the
impact of green revolution in agriculture and the coming up of new economic activities related to agriculture
in the green revolution villages. This finding was similar in line with what Kuznets (1966) had predicted.
The forward and backward linkages of the new agricultural production techniques had spawned a series of
new related economic activities in the villages. This in turn was recasting the income basket of the
households with more and more income from non-agricultural sources.
While the prosperity led diversification of the rural economy was advanced as an explanation for the new
found growing non-farm employment in rural areas, another interpretation, in fact exactly the opposite one,
was put forth sometime later. Very broadly, this argument can be stated as distress induced rural employment
diversification.
Importance of non-farm employment in rural areas lies in the fact that potentially it can absorb surplus
labour from agriculture and thereby reduce distress migration from rural to urban areas. Although access to
non-farm activities can increase monthly per capita consumption expenditure, it also has the potential of
causing greater inequality. Studies based on rural China found evidence of rising income inequality in areas
where non-farm activities flourished, even though non-farm activities contributed significantly to growth
in income (Kung and Lee, 2001; Khan et al., 1992). Therefore, although there are studies which suggested
that access to non-farm activities improved economic conditions of poor households (Lanjouw, 1999), there
are studies which indicated to a worsening of inequality due to rural non-farm activities.
While the rationale for undertaking this research is to understand rural non-farm sector in India, an
overarching objective of this study is to try and arrive at some broad conclusions across space regarding
the factors that influences growth and development of rural non-farm sector and its consequences on overall
rural livelihoods.
Against this background, this study seeks to provide a broad overview of different dimensions of rural
labour markets in India. The questions that would be addressed in this study include:
What has been the pace of rural diversification across states?
What are the factors responsible for non-agricultural employment? What are the key determinants
of participation in more remunerative non-farm activities?
Is land ownership a determinant of participation in non-farm activities?
What are the constraints towards development of rural non-farm sector?
Within the non-farm sector, what are the activities which are generating significant employment
opportunities and why? What about quality of employment in non-farm sector?
What are the educational qualifications of people in non-agricultural activities?

4 ILO DWT for South Asia and the Country Office for India
Is non-farm employment gender neutral or caste neutral?
This study is primarily based on Employment and Unemployment Surveys conducted by National Sample
Survey Organization (NSSO) for the years 1999-2000 and 2011-12. In addition to employment and
unemployment survey, this study also takes into account All India Debt and Investment Surveys for the
years 2002-03 and 2012-13 which were also conducted by NSSO. It may be pointed out at the outset that
the analysis presented here is based on workers who are employed as per usual principal activity status (i.e.,
employed for at least half of the reference year) with the objective of capturing the trends in participation
in rural labour market for a relatively longer time duration (and hence relatively more durable).
For all the statistical work in this paper, we have focused on employment of persons in the age group 15
years and above. In many writings on employment based on NSS data (particularly female employment),
including on the recent trends, low/declining levels of employment among women have been explained on
account of withdrawal of girl children from the workforce and increasing school attendance among girls.
By limiting all our statistical work to the age group 15 years and above, we have tried to separate out trends
in employment with trends in school attendance.
Section 2 looks into extent and pattern of rural non-farm employment during the period 1999-2000 and
2011-12 (the latest year for which large sample employment and unemployment surveys are available).
This section also analyses shift in principal source of income from agriculture to non-agriculture across
asset deciles using All India Debt and Investment Surveys. In Section 3 we analyse employment
opportunities in non-farm sector – share of employment across industries, type of employment, type of
enterprise and also work place location. In this section we will see within non-farm sector, which industries
are generating more employment and what is the nature of such employment. Section 4 focusses on quality
of employment in non-farm sector, and educational qualification of workers. Section 5 analyses
employment in non-farm sector by gender and social group. Land being the most important means of
production in rural areas, Section 6 looks into role of agriculture and access to land in rural diversification.
The following section (Section 7) looks into performance of MGNREGA at State level, and also analyses
some of its impact on rural labour market. Finally, the last section (Section 8) provides a brief summary.
2. Rural diversification: Extent and pattern
As already mentioned, in order to reap benefits of demographic dividend, it is important that productive,
decent, and durable (longer term) employment opportunities are created on a sustained basis. With the
spread of educational opportunities, expectation regarding such kind of employment has risen, particularly
among the youth. The objective for moving out of agricultural employment is primarily to achieve decent
and productive work opportunities (though other reasons like land fragmentation, falling agricultural
profitability, increasing agricultural mechanization are also important). During the period 1999-2000 to
2011-12, there has been considerable increase in rural non-farm employment in both principal as well as
subsidiary status (Table 1). The rise in rural non-farm employment was experienced both among males and
females. Overall, rural non-farm employment increased by 12 percentage points in 12 years, which implies
one percentage point increase every year. Considering the size of India’s workforce, such a shift in favour
of non-farm employment is indeed significant.

ILO DWT for South Asia and the Country Office for India 5
Table 1: Percentage of rural workers in non-farm activities (15 years and above)
Category 1999-2000 2011-12
Male (Principal Status) 28.9 40.86
Male (Subsidiary Status) 18.5 42.03
Female (Principal Status) 15.8 25.51
Female (Subsidiary Status) 10.0 33.26
All Non-farm Workers (Principal Status) 25.1 37.21
All Non-farm Workers (Subsidiary Status) 14.8 37.91
Source: Calculated from Employment and Unemployment Survey, NSSO, 1999-2000 and 2011-12
Among major States (Table A1) the maximum increase in rural non-farm employment was experienced in
Jammu and Kashmir (33 percentage points) followed by Goa (21 percentage points) and Punjab (20
percentage points). Similar trends were observed in case of male rural non-farm workers (Table A2) as well
as female non-farm workers (Table A3). However, the magnitude of rise in non-farm employment among
females was much higher in these three States as compared to males.
Having observed that there has been a significant shift in favour of rural non-farm employment, the next
thing that we need to look at is whether or not this shift is taking place across all economic classes or not.
To find this out, we have analysed All India Debt and Investment Survey data for the years 2002-03 and
2012-13. The primary objective of these decadal surveys is to arrive at estimates of asset ownership and
extent of liabilities of households, and also to make an assessment regarding the extent of borrowing. These
decadal surveys provide data on the value and composition of household assets along with information on
household indebtedness.
Economic well-being of a household in rural or agrarian economy is crucially linked to ownership of assets.
In an agrarian economy, whether workers in a household sell their labour power or deploy it in their own
household enterprise depends crucially on the extent to which they own various means of production. Also,
ownership of assets also provides a certain degree of security against adverse economic shocks
All items owned by the households having money value were considered as household assets. This included
physical assets like land, buildings, livestock, agricultural machinery and implements, non-farm business
equipment, all transport equipment, durable household goods, and financial assets like dues receivable on
loans advances in cash or in kind and shares and deposits held by the members of the household.
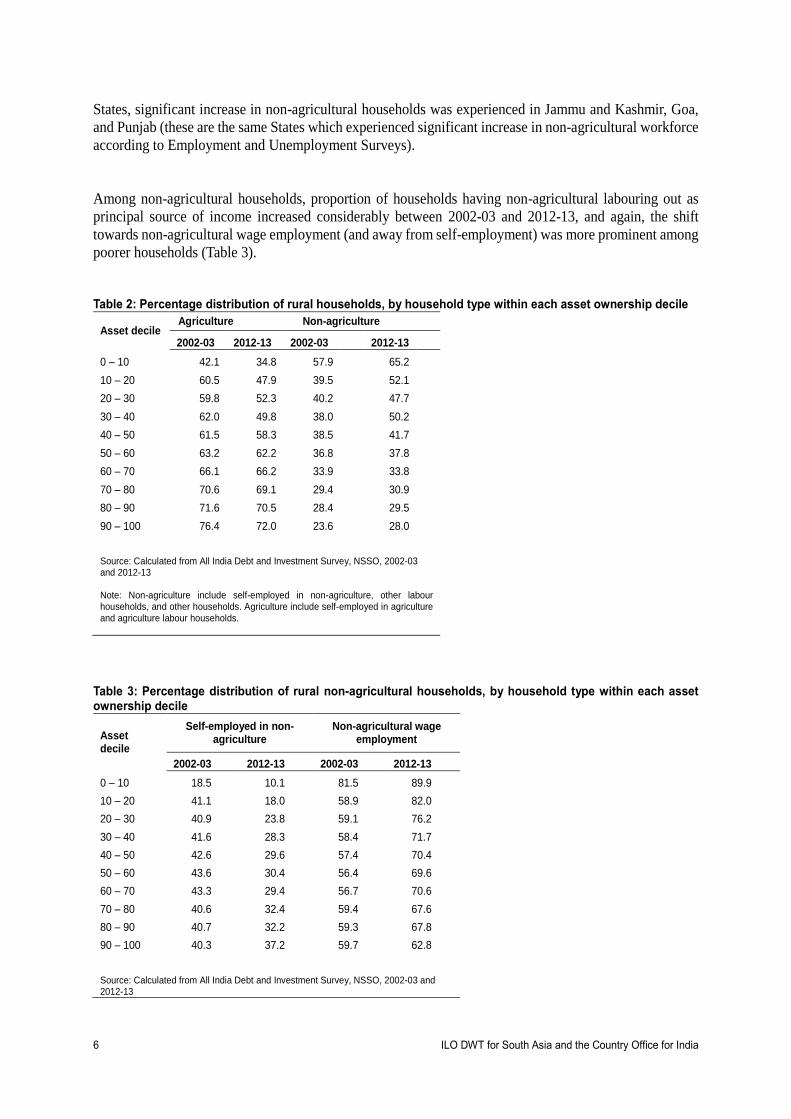
From Table 2 we can clearly observe that the shift from agriculture to non-agriculture has happened across
all asset deciles, and in rural India, proportion of agricultural households (i.e., households whose principal
source of income comes from agriculture) has declined from 63 per cent in 2002-03 to 58 per cent in 2012-
13. However, the decline in proportion of agricultural households was much less at higher asset deciles as
compared to lower deciles. From Table 2 it could be observed that the magnitude of decline from fifth decile
onwards was much less. In other words, the shift from agriculture to non-agriculture was much more
pronounced among poorer households.
Among major States, except for Maharashtra, Gujarat, Haryana, and Rajasthan, there has been a decline in
the proportion of households having agriculture as the principal source of income (Table A4). Among major
6 ILO DWT for South Asia and the Country Office for India
States, significant increase in non-agricultural households was experienced in Jammu and Kashmir, Goa,
and Punjab (these are the same States which experienced significant increase in non-agricultural workforce
according to Employment and Unemployment Surveys).
Among non-agricultural households, proportion of households having non-agricultural labouring out as
principal source of income increased considerably between 2002-03 and 2012-13, and again, the shift
towards non-agricultural wage employment (and away from self-employment) was more prominent among
poorer households (Table 3).
Table 2: Percentage distribution of rural households, by household type within each asset ownership decile
Asset decile Agriculture Non-agriculture
2002-03 2012-13 2002-03 2012-13
0 – 10 42.1 34.8 57.9 65.2
10 – 20 60.5 47.9 39.5 52.1
20 – 30 59.8 52.3 40.2 47.7
30 – 40 62.0 49.8 38.0 50.2
40 – 50 61.5 58.3 38.5 41.7
50 – 60 63.2 62.2 36.8 37.8
60 – 70 66.1 66.2 33.9 33.8
70 – 80 70.6 69.1 29.4 30.9
80 – 90 71.6 70.5 28.4 29.5
90 – 100 76.4 72.0 23.6 28.0 Source: Calculated from All India Debt and Investment Survey, NSSO, 2002-03 and 2012-13
Note: Non-agriculture include self-employed in non-agriculture, other labour households, and other households. Agriculture include self-employed in agriculture and agriculture labour households.
Table 3: Percentage distribution of rural non-agricultural households, by household type within each asset ownership decile
Asset decile
Self-employed in non-agriculture
Non-agricultural wage employment
2002-03 2012-13 2002-03 2012-13
0 – 10 18.5 10.1 81.5 89.9
10 – 20 41.1 18.0 58.9 82.0
20 – 30 40.9 23.8 59.1 76.2
30 – 40 41.6 28.3 58.4 71.7
40 – 50 42.6 29.6 57.4 70.4
50 – 60 43.6 30.4 56.4 69.6
60 – 70 43.3 29.4 56.7 70.6
70 – 80 40.6 32.4 59.4 67.6
80 – 90 40.7 32.2 59.3 67.8
90 – 100 40.3 37.2 59.7 62.8 Source: Calculated from All India Debt and Investment Survey, NSSO, 2002-03 and 2012-13
ILO DWT for South Asia and the Country Office for India 7
Overall, during the period 1999-2000 to 2011-12, there has been a significant shift in rural workforce from
agriculture to non-agricultural activities, and this shift was more prominent among households with lower
asset base. Also, among the non-agricultural households, share of self-employed households declined and
share of households depending primarily on wage employment increased. So, it can be reasonably
concluded that households with lower asset base were depending more and more on non-agricultural
sources of income, primarily on non-agricultural wage employment.
3. Rural non-farm activities
We now look into activities within the non-farm sector that are generating significant employment
opportunities. For our analysis, non-farm sector has been broadly classified under four major heads viz.,
manufacturing, construction, other non-manufacturing, and services. From Table 4 we observe that within
non-farm sector, there has been a decline in share of employment in all sectors except construction, and the
share of construction sector within non-farm sector has more than doubled between 1999-2000 and 2011-
12.
Among manufacturing sector, four industries with highest share of workers in 1999-2000 were textile, food
products, wood and wood products, other non-metallic minerals. Out of these four industries, except for
wood and wood products, the other three have maintained their supremacy in terms of non-farm
employment in 2011-12 (even though their respective employment shares have declined). In 2011-12,
wearing apparel industry had the highest share of employment in manufacturing sector. Wearing apparel
has indeed seen rise in employment share from 1.3 percent in 1999-2000 to 3.2 per cent in 2011-12. Wood
and wood products industry experienced a massive decline in share of employment from 4.4 per cent in
1999-2000 to only 0.4 per cent in 2011-12. Food processing sector was one of the high employment
generating sectors in India even though there were concerns over conditions of work.
Among service sector, retail trade was by far the most important form of non-farm employment in rural
India, followed by land transport, and education. Interestingly, share of public administration in non-farm
employment has considerably declined from 5.5 per cent in 1999-2000 to 2.4 per cent in 2011-12. This
clearly is a reflection of withdrawal of State from various public services.
The biggest increase in non-agricultural employment has been in construction sector, where the share of
non-farm employment has increased from 14.4 per cent in 1999-2000 to 30.1 per cent in 2011-12. Increase
in employment in construction sector along with increased infrastructure investment gave a major boost to
total employment attracting agricultural workers into non-agricultural employment. Among non-farm
activities, construction was one of the predominant forms of employment to a considerable section of
workers due to the fact that it did not necessarily ask for any specific skill as well as due to the option of
seasonal employment which allowed workers to take up agricultural activities during peak seasons (Ranjan,
2009).

8 ILO DWT for South Asia and the Country Office for India
Table 4: Percentage of rural workers in non-farm employment by industry (15 years and above, principal status)
Sector 1999-2000 2011-12
Industry % of workers Industry % of workers
Manufacturing textile 5.2 wearing apparel 3.24
Manufacturing food products and beverages 4.7
other non-metallic mineral products 3.10
Manufacturing wood and wood products 4.4 food products 2.71
Manufacturing other non-metallic mineral products 3.7 textiles 2.51
All manufacturing - 29.2 - 22.7
Construction - 14.4 - 30.1
Other Non-manufacturing - 2.8 - 2.1
All Non-manufacturing - 17.2 - 32.2
Services retail trade 17.1 retail trade 14.1
Services land transport 8.1 land transport 7.9
Services other service activities 6.6 education 6.0
Services education 5.9 public administration 2.4
All Services - 53.6 - 45.1
All Non-farm Sector - 100 - 100 Source: Calculated from Employment and Unemployment Survey, NSSO, 1999-2000 and 2011-12
Even though share of manufacturing sector in rural non-farm employment declined during the period 1999-
2000 and 2011-12, manufacturing employment has increased at an annual average rate of 2.13 per cent.
The biggest loser in manufacturing sector has been the textile industry, where employment has shrunk by
an annual average rate of 1.82 per cent (Figure 2).2 Similarly, even though share of service sector has
declined, overall employment in service sector has increased by an annual average rate of 3.02 per cent.
Within the service sector, employment in land transport and retail trade seems to have grown the fastest at
an annual average rate of 4.83 per cent and 2.74 per cent respectively. The reason why share of both
manufacturing sector and service sector declined despite overall increase in employment is the
unprecedented growth of employment in construction industry (which is part of non-manufacturing sector).
During the period 1999-2000 and 2011-12, employment in construction sector has grown at an annual
average rate of 19.85 per cent. The increase in construction sector employment alone contributed 55.5 per
cent to overall increase in rural non-farm employment. In other words, construction sector alone accounted
for more than half of the overall increase in rural non-farm employment between 1999-2000 and 2011-12.
2 Textile industry has in recent years experienced a phenomenon of Indian companies investing abroad. According to a news report
which analysed data published by Reserve Bank of India, during the period June, 2015 to October, 2015, twelve companies have
invested abroad and one of them has set up a joint venture close to $50 million. According to its company’s own estimate, this joint
venture is likely to generate more than 20,000 direct and indirect employments. Africa is fast becoming an important destination
because textile exports from Africa do not attract 14 per cent import duty in US and European markets. According to the news
report, industry experts feel that one job can be created in textile industry for every Rs. 10000 invested. Vietnam is another country
which has the potential to become another destination for investment in textile industry because according to Trans Pacific
Partnership Agreement, member countries can avail duty-free access in other member countries if textile industry uses yarn
produced within its own country (Hindustan Times, dated 31st October, 2015).

ILO DWT for South Asia and the Country Office for India 9
Figure 2: Annual average rate of growth of employment between 1999-2000 and 2011-12
Among States we have observed that Punjab experienced significant shift towards rural non-farm
employment during 1999-2000 to 2011-12 at an annual average rate of 7.4 per cent. Here again, it was
construction led employment growth (Figure A1).
Next we look into type of employment. Overall, within rural non-farm sector, there has been a decline in
self-employment and rise in casual wage employment. Only the service sector experienced a rise in self-
employment (Table 5). What we observe from Table 5 is that, as far as type of employment is concerned,
manufacturing, construction, and services indicate three different trends:
Manufacturing employment is moving more towards wage employment (both salaried and casual
wage employment).
Construction employment is moving significantly towards casual wage employment only. The
dominance of construction sector in casual wage employment was to such an extent that in 2011-
12, 72 per cent of all casual workers were employed in construction sector alone (Table A5).
Service sector employment is moving more towards self-employment and salaried wage
employment. The trend indicates to a significant decline in casual wage employment in service
sector.
Table 5: Percentage of rural workers in non-farm activities, by type of employment (15 years and above)
Status / Sector Self-employment Salaried employment Casual wage employment
Principal Status 1999-2000 2011-12 1999-2000 2011-12 1999-2000 2011-12
Manufacturing 55.6 51.2 23.1 26.3 21.3 22.5
Construction 20.8 8.9 3.3 2.3 75.9 88.7
Other Non-manufacturing 9.8 6.2 34.3 38.4 55.9 55.4
Services 50.4 53.8 33.4 37.5 16.2 8.7
All Non-farm Sector 46.5 38.7 24.6 24.4 28.9 36.9 Source: Calculated from Employment and Unemployment Survey, NSSO, 1999-2000 and 2011-12
-1.82
2.13
19.85
2.74
4.833.02
5.14
-5
0
5
10
15
20
25P
erc
en
tag
e

10 ILO DWT for South Asia and the Country Office for India
Within non-farm sector, if we focus only on non-farm wage employment, we observe that the share of
public sector has increased. In fact, share of public sector has increased in all sectors except manufacturing
between 1999-2000 and 2011-12 (Table 6). This is quite surprising because despite liberalization,
globalization and privatization of the Indian economy, dependence on public sector for non-farm wage
employment in rural areas has not declined, and on the contrary, it is on the rise.
Table 6: Percentage of rural workers in non-farm wage employment, by type of employer (15 years and above)
Status / Sector Public Others
Principal Status 1999-2000 2011-12 1999-2000 2011-12
Manufacturing 2.5 1.6 97.5 98.4
Construction 4.1 11.0 95.9 89.0
Other Non-manufacturing 26.9 28.4 73.1 71.6
Services 31.8 38.4 68.2 61.6
All Non-farm Sector 18.4 19.2 81.6 80.8 Source: Calculated from Employment and Unemployment Survey, NSSO, 1999-2000 and 2011-12
If we look into non-farm wage employment in terms of size of enterprise, we would observe that there has
been a definite shift towards larger enterprises. Proportion of workers working in enterprises which
employed less than six workers has declined from 60 per cent in 1999-2000 to 41 per cent in 2011-12 (Table
7). Although enterprises employing more than ten workers have experienced a rise in share of employment,
the biggest increase in employment happened in case of enterprises employing between six and nine
workers. This was particularly true in case of construction industry which registered an increase of 14
percentage points in the share of rural non-farm workers employed in such small enterprises (employing 6-
9 workers). For the construction industry, there was in fact a drop in proportion of workers employed in
enterprises employing 10 or more employees. By and large, there has been a shift in rural non-farm
employment towards larger enterprises. However, construction sector which has experienced
unprecedented growth in employment experienced a decline in the share of workers employed in enterprises
employing 10 or more workers.3 Combining the two smaller groups what emerged was that more than 60
per cent of rural no-farm wage workers were working in enterprises employing less than nine workers. One
of the inherent problems of working in such enterprises is that the labour productivity is quite low. For
instance, in case of manufacturing enterprises, studies have shown that productivity in large enterprises
(employing 500 or more workers) was eight times the productivity in enterprises employing less than 9
workers (Mazumdar and Sarkar, 2008).
3 Stringency of labour regulations has been considered to be one of the major reasons for the phenomenon of “missing middle”,
which in other words imply that medium sized enterprises have a disproportionately lower share of overall employment. In India,
there are over 40 Central and State labour laws, and most of them are applicable to firms in formal sector and to firms employing
a certain minimum number of workers. As the number of workers keeps increasing, firms enter the purview of more and more
stringent labour laws (World Bank, 2013). However, this view has been objected by several scholars on the ground that the
implementation of labour laws is rather weak, and almost non-existant. There are studies which show contrary results as well. For
instance, Acharya, Baghai-Wadji and Subramanian (2010) supported the argument that strong labor laws can be efficient and have
positive impact on firms by encouraging their innovativeness (Acharya et al., 2010).

ILO DWT for South Asia and the Country Office for India 11
Table 7: Percentage of rural workers in non-farm wage employment, by number of workers in the enterprise (15 years and above)
Status / Sector Less than 6 6 – 9 10 and above
Principal Status 1999-2000 2011-12 1999-2000 2011-12 1999-2000 2011-12
Manufacturing 32.7 24.4 7.1 11.7 60.2 63.6
Construction 49.9 42.5 12.4 26.0 37.7 30.3
Other Non-manufacturing 18.1 14.1 11.8 11.3 70.1 74.4
Services 65.1 49.9 5.2 16.9 29.7 32.3
All Non-farm Sector 60.2 40.8 7.0 19.8 32.8 38.4 Source: Calculated from Employment and Unemployment Survey, NSSO, 1999-2000 and 2011-12
As far as work place is concerned, a major chunk of rural non-farm workers continued working in rural
areas only (Table 8)
Table 8: Percentage of rural workers in non-farm employment, by location of workplace (15 years and above)
Status / Sector No fixed place Rural area Urban area
Principal Status 1999-2000 2011-12 1999-2000 2011-12 1999-2000 2011-12
Manufacturing 2.5 1.1 91.5 91.0 6.0 7.1
Construction 8.1 2.3 82.2 86.1 9.7 10.5
Other Non-manufacturing 6.6 2.2 88.0 86.9 5.4 10.6
Services 9.2 5.4 83.9 86.0 6.9 7.5
All Non-farm Sector 7.0 3.4 86.0 87.2 7.0 8.4 Source: Calculated from Employment and Unemployment Survey, NSSO, 1999-2000 and 2011-12
Within rural non-farm sector, construction industry experienced massive growth in employment accounting
for more than half of the increase in overall employment. However, it was majorly casual wage employment
which has grown in the construction sector. Textile sector fared poorly in terms of employment generation,
and it has registered a decline in employment during 1999-2000 to 2011-12. Within the service sector, it
was land transport and retail trade which experienced significant growth in employment.
During 1999-2000 to 2011-12, there has been a definite shift of rural non-farm wage employment towards
larger enterprises with construction industry being the only exception where share of workers employed in
enterprises employing 10 or more workers declined.
4. Quality of employment
Dualistic nature of the economy is a characteristic found in most developing countries. This dualism is
manifested by the simultaneous presence of an informal sector where employment relations are not
governed by any State regulation or collective bargaining process; and formal sector where conditions of
employment, by and large, follow rules and regulations of the State and where collective bargaining through
trade unions is not an uncommon phenomenon. Informal sector is where the surplus labour is located, and
this surplus labour need not be wholly unemployed. The possibility of work and income sharing makes
persistence of under-employment a common feature of informal sector. Since output is shared by more

12 ILO DWT for South Asia and the Country Office for India
workers, output per worker is less in informal sector as compared to that in the formal sector. Therefore, a
shift towards more formal employment is always desirable for a more inclusive growth.
A shift from agricultural employment to formal sector non-agricultural employment does not happen at one
go, and quite often shifts in qualitatively better employment opportunities happen over generations. But the
important point is that the shift from agricultural to non-agricultural sources of income is a dominant
phenomenon in the Indian economy.
Non-farm activities can be divided into two broad categories - “high-labour-productivity activities leading
to high-income activity, and low-labour productivity activities that serve only as residual source of income”
(Lanjouw, 1999). Even though low productivity activities were common among the poor and the illiterate,
such activities served important purpose in terms of providing source of livelihood.
In the previous section we have observed that there was a tendency towards increasing casualization of
rural non-farm employment. Such work opportunities do not have any written contract between the
employer and the employee. Table 9 precisely reflects this trend among rural non-farm wage employment
towards increasing casualization without any written contract. Between 2004-5 and 2011-12, there has been
seven percentage point increase in the proportion of rural non-farm wage workers who did not have any
written contract. Clearly, an overwhelmingly vast majority of rural non-farm wage employment existed
without any formal contract.
This was however contrary to the idea of decent work and inclusive growth. In order to achieve inclusive
growth, the 12th Five Year Plan stressed on generating sufficient number of productive and decent work
opportunities. Rural employment generation during the last decade has been rather sluggish, particularly
when viewed against high rate of economic growth. One of the positive things that have happened was the
increase in formal sector employment in rural non-farm sector. However, what was a matter of concern was
the increasing trend of informal employment contracts even within the formal sector. From Table 10 we
observe that close to 60 per cent of formal sector jobs were characterised by informal employment contracts.
So, even within formal sector, 60 per cent of workers worked under informal job arrangement with no social
security benefit.
Table 9: Percentage of rural workers in non-farm wage employment, by type of job contract (15 years and above)
Status / Sector No written contract Written contract up to 1 year
Written contract for more than 1 year
Principal Status 2004-05 2011-12 2004-05 2011-12 2004-05 2011-12
Manufacturing 90.3 88.8 1.5 1.8 8.2 9.2
Construction 96.5 96.8 0.4 1.5 3.1 0.8
Other Non-manufacturing 79.9 76.2 3.4 1.7 16.7 21.9
Services 63.2 65.9 2.9 3.6 33.9 29.9
All Non-farm Sector 80.3 87.0 1.8 1.6 17.9 11.4 Source: Calculated from Employment and Unemployment Survey, NSSO, 1999-2000 and 2011-12

ILO DWT for South Asia and the Country Office for India 13
Table 10: Percentage of rural workers in non-farm formal sector employment, by formal and informal nature of employment (15 years and above)
Status / Sector Employed in formal sector
Formal sector and formal employment (as % of all formal sector employment)
Formal sector but informal employment (as % of all formal sector employment)
Principal Status 2004-05 2011-12 2004-05 2011-12 2004-05 2011-12
Manufacturing 22.4 42.2 24.3 31.4 75.7 68.6
Construction 18.0 35.6 3.9 8.5 96.1 91.5
Other Non-manufacturing 61.4 91.8 38.7 51.4 61.3 48.6
Services 28.9 34.6 66.7 65.1 33.3 34.9
All Non-farm Sector 25.6 37.8 46.1 40.5 53.9 59.5 Source: Calculated from Employment and Unemployment Survey, NSSO, 1999-2000 and 2011-12
Note: Informal employment is defined as that form of employment where the employee is not eligible for any kind of social security benefit like provident fund, gratuity, pension, health care, maternity benefit etc.
Educational attainment is an important determinant of quality of job (IHDR, 2011; World Bank, 2012; IHD,
2014). With one-fourth of rural non-farm workers being illiterate, educational levels of workers in non-
farm sector remain a matter of concern, particularly when non-farm sector is supposed to provide productive
and decent employment opportunities. Though share of illiterate workers has declined over the years, more
than one third of workers in construction sector (which experienced significant employment growth) still
remained illiterate (Table 11). Clearly, these workers are employed in casual wage employment with very
little or no social security at all. This is a big challenge for the largest growing sector in terms of providing
decent employment, and particularly so, when it accounts for 44 per cent of all illiterate workers in rural
non-farm sector (Table A6).
Within service sector (with trend indicating to a shift towards self-employment and salaried wage
employment) share of workers with higher secondary educational level and above experienced an increase
of ten percentage points (Table 11). Also, among all workers with at least higher secondary education,
services accounted for at least three-fourth of them (Table A6). It is difficult to conclusively determine how
educational attainment can influence rural non-farm employment. There are occupations where workers
regardless of their educational attainment are involved in. Also, there are occupations which require high
degree of skill. Formal education is not necessarily an important factor in determining non-farm
employment in rural areas. However, as far as decent job opportunities are concerned, this analysis indicated
that decent job opportunities in services improved with higher levels of education.
Table 11: Percentage of rural workers in non-farm employment, by level of education (15 years and above)
Status / Sector Illiterate Primary Secondary Higher secondary and
above
Principal Status 1999-2000 2011-12 1999-2000 2011-12 1999-2000 2011-12 1999-2000 2011-12
Manufacturing 37.3 26.6 15.8 16.2 8.8 12.2 5.6 11.9
Construction 44.1 36.2 15.1 17.6 7.2 8.8 2.7 4.6
Other Non-manufacturing 43.4 32.2 13.4 16.0 12.5 12.2 5.5 15.4
Services 24.1 16.1 12.2 12.2 15.1 16.5 18.5 27.8
All Non-farm Sector 31.4 24.8 13.7 14.8 12.0 13.1 12.1 17.0 Source: Calculated from Employment and Unemployment Survey, NSSO, 1999-2000 and 2011-12
Note: The categories of level of education will not add up to 100% because we have not taken into account certain categories like literate without formal schooling and literate below primary

14 ILO DWT for South Asia and the Country Office for India
As far as technical education is concerned, an overwhelming majority of 97 per cent of rural non-farm
workers did not have any technical education at all (Table A7). What was of even more concern was that
the proportion of rural non-farm workers without any technical education in fact gone up marginally in
2011-12 as compared to what it was in 1999-2000. As in case of general education, share of service sector
in technical education was also higher as compared to other major sectors. For instance, in 2011-12, services
accounted for 45 per cent of rural non-farm workforce, but its share in workers possessing technical degree
was 81 per. In other words, 81 per cent of workers with technical education were employed in service sector
alone in 2011-12 (Table 12). On the contrary, fastest growing industry in terms of employment creation,
namely construction industry, which accounted for 30 per cent of rural non-farm workforce in 2011-12, had
a share of less than four per cent amongst workers having technical degree (Table 12). Therefore,
employment in construction industry was growing without any significant impact on technical knowledge
and skill set of its workforce. So, construction sector was creating jobs without any technical knowledge.
Table 12: Percentage distribution of rural workers in non-farm employment, by level of technical education, across different sectors (15 years and above)
Status / Sector No Technical Education Diploma or Certificate (Below Graduate Level)
Technical Degree in Agriculture, Engineering, Technology, Medicine etc.
Principal Status 1999-2000 2011-12 1999-2000 2011-12 1999-2000 2011-12
Manufacturing 29.5 22.6 19.6 29.6 16.2 12.8
Construction 14.7 30.7 5.7 8.2 5.3 3.7
Other Non-manufacturing 2.7 2.0 3.2 4.8 6.1 2.7
Services 53.0 44.6 71.4 57.4 72.3 80.7
All Non-farm Sector 100.0 100.0 100.0 100.0 100.0 100.0 Source: Calculated from Employment and Unemployment Survey, NSSO, 1999-2000 and 2011-12
Though there were occupations where workers regardless of their educational attainment were involved in,
education do play an important role in determining the quality of employment. With one-fourth of rural
non-farm workers being illiterate, educational levels of workers in non-farm sector remained a matter of
concern. Low general education base makes skill training more difficult.4 Construction industry, which was
the largest employment creating industry in the country, also accounted for the largest share of illiterate
workers, and also very small share of workers with technical degree. Service sector provided greater
employment opportunities for the better educated workers.
5. Gender and social group in rural non-farm employment
Women are at a disadvantage in terms of access to non-farm jobs. Share of women in non-farm employment
has in fact declined during the period 1999-2000 to 2011-12 (Table 13). Decline in female employment was
observed in case of agricultural activities as well. Decline in proportion of households that cultivated land
directed resulted in a decline in proportion of women who were self-employed in agriculture. With a clear
4 With high employment growth, employment opportunities have increased, but there exist huge shortage of skilled workers.
Shortage exist at two levels: (i) shortage of number of persons trained, and (ii) persons trained do not possess required skill. Out-
dated syllabus of Industrial Training Institutes, Mismatch between training and job requirement, ineffective apprenticeship training
system are some of the reasons mentioned in the literature for shortage of skilled workers in the country (Mehrotra ed., 2014).
ILO DWT for South Asia and the Country Office for India 15
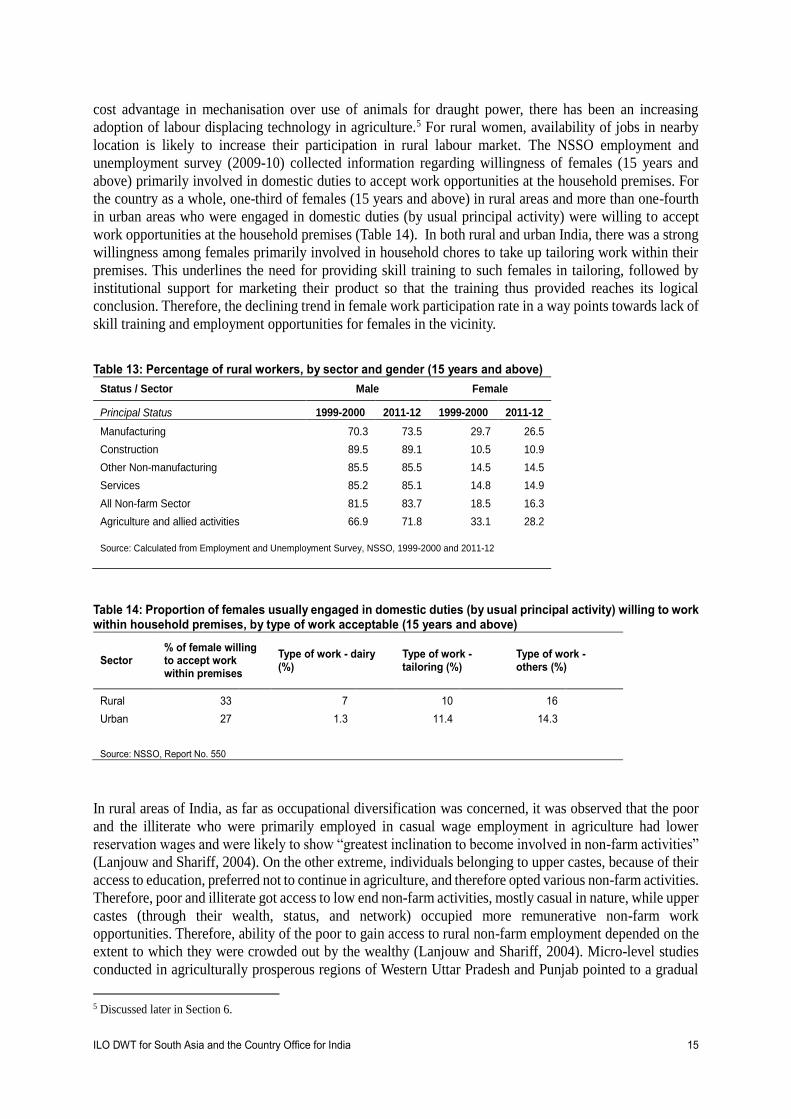
cost advantage in mechanisation over use of animals for draught power, there has been an increasing
adoption of labour displacing technology in agriculture.5 For rural women, availability of jobs in nearby
location is likely to increase their participation in rural labour market. The NSSO employment and
unemployment survey (2009-10) collected information regarding willingness of females (15 years and
above) primarily involved in domestic duties to accept work opportunities at the household premises. For
the country as a whole, one-third of females (15 years and above) in rural areas and more than one-fourth
in urban areas who were engaged in domestic duties (by usual principal activity) were willing to accept
work opportunities at the household premises (Table 14). In both rural and urban India, there was a strong
willingness among females primarily involved in household chores to take up tailoring work within their
premises. This underlines the need for providing skill training to such females in tailoring, followed by
institutional support for marketing their product so that the training thus provided reaches its logical
conclusion. Therefore, the declining trend in female work participation rate in a way points towards lack of
skill training and employment opportunities for females in the vicinity. Table 13: Percentage of rural workers, by sector and gender (15 years and above)
Status / Sector Male Female
Principal Status 1999-2000 2011-12 1999-2000 2011-12
Manufacturing 70.3 73.5 29.7 26.5
Construction 89.5 89.1 10.5 10.9
Other Non-manufacturing 85.5 85.5 14.5 14.5
Services 85.2 85.1 14.8 14.9
All Non-farm Sector 81.5 83.7 18.5 16.3
Agriculture and allied activities 66.9 71.8 33.1 28.2
Source: Calculated from Employment and Unemployment Survey, NSSO, 1999-2000 and 2011-12
Table 14: Proportion of females usually engaged in domestic duties (by usual principal activity) willing to work within household premises, by type of work acceptable (15 years and above)
Sector % of female willing to accept work within premises
Type of work - dairy (%)
Type of work - tailoring (%)
Type of work - others (%)
Rural 33 7 10 16
Urban 27 1.3 11.4 14.3 Source: NSSO, Report No. 550
In rural areas of India, as far as occupational diversification was concerned, it was observed that the poor
and the illiterate who were primarily employed in casual wage employment in agriculture had lower
reservation wages and were likely to show “greatest inclination to become involved in non-farm activities”
(Lanjouw and Shariff, 2004). On the other extreme, individuals belonging to upper castes, because of their
access to education, preferred not to continue in agriculture, and therefore opted various non-farm activities.
Therefore, poor and illiterate got access to low end non-farm activities, mostly casual in nature, while upper
castes (through their wealth, status, and network) occupied more remunerative non-farm work
opportunities. Therefore, ability of the poor to gain access to rural non-farm employment depended on the
extent to which they were crowded out by the wealthy (Lanjouw and Shariff, 2004). Micro-level studies
conducted in agriculturally prosperous regions of Western Uttar Pradesh and Punjab pointed to a gradual
5 Discussed later in Section 6.
16 ILO DWT for South Asia and the Country Office for India
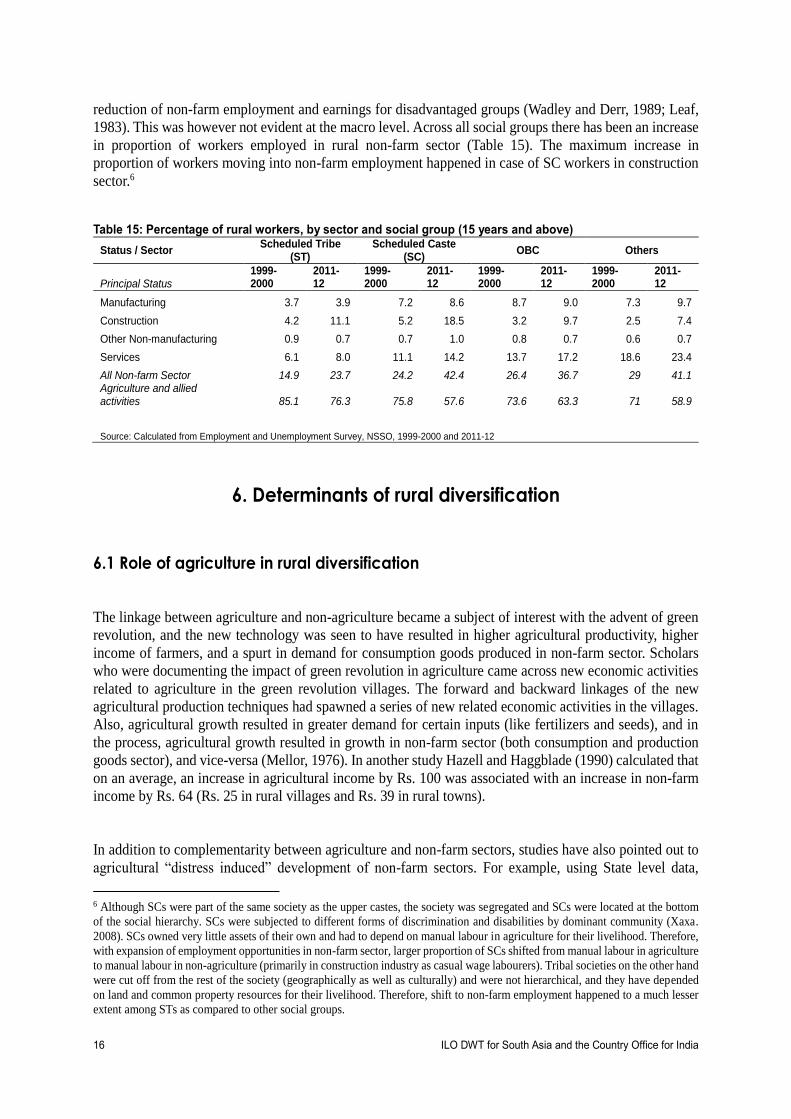
reduction of non-farm employment and earnings for disadvantaged groups (Wadley and Derr, 1989; Leaf,
1983). This was however not evident at the macro level. Across all social groups there has been an increase
in proportion of workers employed in rural non-farm sector (Table 15). The maximum increase in
proportion of workers moving into non-farm employment happened in case of SC workers in construction
sector.6
Table 15: Percentage of rural workers, by sector and social group (15 years and above)
Status / Sector Scheduled Tribe
(ST) Scheduled Caste
(SC) OBC Others
Principal Status 1999-2000
2011-12
1999-2000
2011-12
1999-2000
2011-12
1999-2000
2011-12
Manufacturing 3.7 3.9 7.2 8.6 8.7 9.0 7.3 9.7
Construction 4.2 11.1 5.2 18.5 3.2 9.7 2.5 7.4
Other Non-manufacturing 0.9 0.7 0.7 1.0 0.8 0.7 0.6 0.7
Services 6.1 8.0 11.1 14.2 13.7 17.2 18.6 23.4
All Non-farm Sector 14.9 23.7 24.2 42.4 26.4 36.7 29 41.1 Agriculture and allied activities 85.1 76.3 75.8 57.6 73.6 63.3 71 58.9 Source: Calculated from Employment and Unemployment Survey, NSSO, 1999-2000 and 2011-12
6. Determinants of rural diversification
6.1 Role of agriculture in rural diversification
The linkage between agriculture and non-agriculture became a subject of interest with the advent of green
revolution, and the new technology was seen to have resulted in higher agricultural productivity, higher
income of farmers, and a spurt in demand for consumption goods produced in non-farm sector. Scholars
who were documenting the impact of green revolution in agriculture came across new economic activities
related to agriculture in the green revolution villages. The forward and backward linkages of the new
agricultural production techniques had spawned a series of new related economic activities in the villages.
Also, agricultural growth resulted in greater demand for certain inputs (like fertilizers and seeds), and in
the process, agricultural growth resulted in growth in non-farm sector (both consumption and production
goods sector), and vice-versa (Mellor, 1976). In another study Hazell and Haggblade (1990) calculated that
on an average, an increase in agricultural income by Rs. 100 was associated with an increase in non-farm
income by Rs. 64 (Rs. 25 in rural villages and Rs. 39 in rural towns).
In addition to complementarity between agriculture and non-farm sectors, studies have also pointed out to
agricultural “distress induced” development of non-farm sectors. For example, using State level data,
6 Although SCs were part of the same society as the upper castes, the society was segregated and SCs were located at the bottom
of the social hierarchy. SCs were subjected to different forms of discrimination and disabilities by dominant community (Xaxa.
2008). SCs owned very little assets of their own and had to depend on manual labour in agriculture for their livelihood. Therefore,
with expansion of employment opportunities in non-farm sector, larger proportion of SCs shifted from manual labour in agriculture
to manual labour in non-agriculture (primarily in construction industry as casual wage labourers). Tribal societies on the other hand
were cut off from the rest of the society (geographically as well as culturally) and were not hierarchical, and they have depended
on land and common property resources for their livelihood. Therefore, shift to non-farm employment happened to a much lesser
extent among STs as compared to other social groups.

ILO DWT for South Asia and the Country Office for India 17
Vaidyanathan (1983) noted that where agriculture was unable to provide employment, non-farm sector
played a crucial role in absorbing the surplus labour, and “rural workers who cannot get adequate work in
agriculture spill over into rural non-agricultral activities so that the later act ….as a sponge for the excess
labour”. Vaidyanathan (1983) further advanced the hypothesis that “the higher the rate of unemployment,
the higher is likely to be the share of non-agricultural sector in total rural employment and the lower the
non-agricultural wage relative to that in agriculture”. The author established a positive association between
non-farm employment and agricultural income as well as income distribution.7
There have been several studies analysing the role played by agriculture in promoting non-farm
employment. While some of these studies have indicated the positive role played by agricultural growth,
there are others who noted that it was not really growth and dynamism of agricultural sector which
contributed to non-farm employment. Further, neither commercialization of agriculture nor infrastructural
development led to an increase in non-farm employment (Ranjan, 2009).
One of the important changes happening in Indian agriculture since 1991 has been increasing mechanization
of agriculture resulting in large scale displacement of workers from farm sector. Production and sale of
tractors, has continued, over the last two decades despite the slowdown in the agricultural sector. Indian
agricultural sector has a higher density of four-wheel tractors than other less-developed countries and India
is also one of the largest manufacturers of tractors in the world (Sarkar, 2013). Domestic sale of tractor has
experienced phenomenal increase particularly since 2003-4. Between 2003-4 and 2009-10, compound
annual rate of growth of sale of tractor in India was 10.5 per cent.8
6.2 Access to land and rural diversification
Land is by far the most important form of asset owned by rural households in India. Economic well-being
of a household in an agrarian economy is crucially linked to ownership of land. Ownership of land, is an
important determinant of the location of a household in the system of agrarian relations. In an agrarian
economy, whether workers in a household sell their labour power or deploy it in their own household
enterprise depends crucially on the extent to which they have access to various means of production, and
most importantly, access to land. De Janvry et al. (2005) observed that land was negatively related with
non-farm income and positively related with farm income. Proportion of workers engaged in non-farm
activities was higher among landless households.
Basant (1993) tried to examine the determinants of rural non-farm employment drawing from the primary
data collected from 30 villages in five districts (Vadodara, Bhavnagar, Mehasana, Panchmahals and Valsad)
of Gujarat. The study found that the proportion of non-farm employment was higher in the villages reporting
larger proportion of landless households implying that landlessness was one of the important correlates of
households having their main source income in non-farm activities. It was also observed that access to land
provided more possibilities of diversification. From the ongoing analysis one could clearly observe that the
7 Correlation between rural unemployment rate by current daily status and rural non-farm employment was found to be 0.52 in
1999-2000 and 0.32 in 2011-12. This to some extent indicated that rural non-farm employment was slowly fading out to be of
residual form (implying push factor from agriculture), and seemed to be gaining prominence in rural economy.
8 Annual Report, Department of Agriculture and Cooperation, Ministry of Agriculture, Government of India, various years.

18 ILO DWT for South Asia and the Country Office for India
relationship between rural non-farm employment and land ownership was 'U' shaped curve where rural
non-farm employment was found to be higher among the very poor or the landless, and also among those
having land and better economic status. Of course the motivations as well as the outcomes across the two
sets of households varied significantly.
Ghuman (2005), based on a study of three villages in Punjab reported that non-farm employment of
agricultural households was half of that of households which had non-agricultural background. The author
further noted that “higher proportion of marginal landholders joining non-farm sector may be because of
the reason that they are neither able to earn enough from land nor find year-round employment on land”
(Ghuman, 2005). In punjab, what we have observed is an increasing concentration of operational holding
among richer households (Table A8), which has resulted in increasing land alienation for the economically
vulnerable groups.
During the period 2002-03 and 2012-13, there has been a significant increase in cultivation on small plots
of land. Share of area operated by farm size of less than one hectare has increased considerably during the
last decade (Table 16). Such small units are clearly un-economic and therefore dependence on non-farm
employment has been growing in rural India.
Table 16: Percentage distribution of area operated by rural households, by size class of operational holding
Land Size Class (Ha) 2002-03 2012-13
Landless 0.0 0.0
0.001 – Less than 1 24.1 32.6
1 – Less than 2 21.5 22.5
2 – Less than 3 15.1 13.9
3 – Less than 5 15.7 13.4
5 – Less than 10 14.9 10.9
10 and Above 8.7 6.7
All Size Classes 100.0 100.0 Source: Calculated from AIDIS, NSSO (2002-03 and 2012-13)
Also, the share of rural households operating less than one hectare of land has increased considerably
(which is expected given that the share of area operated by farm size of less than one hectare has increased
considerably). Shares of households operating all other size classes of land have declined (Table 17). It may
be highlighted here that even though the proportion of households operating ten hectare and above has
declined by 60 per cent (Table 17), the share of land operated by these large landowners declined by only
22 per cent during 2002-03 and 2012-13 (Table 16). This clearly implies that land concentration among
large landowners has increased considerably. If we consider the Access Index of operational holding (ratio
of proportion of area operated to proportion of households), then we would observe that the value of Access
Index for households operating ten hectare and above has increased from 17.4 in 2002-03 to 33.5 in 2012-
13 (Table 18).

ILO DWT for South Asia and the Country Office for India 19
Table 17: Percentage distribution of rural households, by size class of operational holding
Land size class (Ha) 2002-03 2012-13
Landless 39.7 37.7
0.001 – Less than 1 40.8 47.2
1 – Less than 2 10.5 8.9
2 – Less than 3 4.3 3.2
3 – Less than 5 2.7 1.9
5 – Less than 10 1.5 0.9
10 and Above 0.5 0.2
All Size Classes 100.0 100.0 Source: Calculated from AIDIS, NSSO (2002-03 and 2012-13)
Table 18: Access index of operational holding for rural households, by size class of operational holding
Land Size Class (Ha) 2002-03 2012-13
Landless 0.0 0.0
0.001 – Less than 1 0.6 0.7
1 – Less than 2 2.0 2.5
2 – Less than 3 3.5 4.3
3 – Less than 5 5.8 7.1
5 – Less than 10 9.9 12.1
10 and Above 17.4 33.5
All Size Classes 1.0 1.0 Source: Calculated from AIDIS, NSSO (2002-03 and 2012-13)
Note: Access Index is defined as the ratio of proportion of area operated to proportion of households within each land size class
While rising land fragmentation is responsible for falling employment opportunities in agriculture,
increasing concentration of landholdings can also indirectly contribute to decline in overall labour
absorption (that is, not only reduce levels of self-employment in agriculture but also reduce levels of wage
employment generated in agriculture) as for a given cropping pattern, large landowners tend to deploy
labour displacing technology to a greater extent. As Rawal and Saha (forthcoming) noted “greater adoption
of labour displacing technology (in particular, increasing use of machines and weedicides), caused by
increasing concentration of landholdings and increasing cost advantage of using labour displacing
techniques among other factors, is likely to have been an important factor behind the decline in overall level
of labour absorption in agriculture”.
If we do a State level analysis of proportion of rural households not cultivating any land and proportion of
rural non-farm workers, it was observed that generally States with higher proportion of rural households
not cultivating any land also had higher proportion of rural non-farm workers.9 For the country as a whole,
proportion of rural households not cultivating any land increased from 35.4 per cent in 1987-88 to 48.5 per
cent in 2011-12 (Rawal, 2013). Lack of access to land was therefore an important factor responsible for
participation in rural non-farm employment. There was a decline in proportion of rural households
9 Correlation coefficient between proportion of households not cultivating any land and proportion of rural non-farm
workers at State level was found to be 0.54 for the year 2011-12 and 0.49 for the year 1999-2000.

20 ILO DWT for South Asia and the Country Office for India
cultivating land and it was a phenomenon experienced by all major States (Rawal, 2013). If we plot a simple
scatter diagram of proportion of rural households not cultivating any land (Rawal, 2013), and proportion of
rural non-farm workers for the two years considered here (1999-2000 and 2011-12), then we would observe
a positive correlation between the two as depicted in the following two diagrams (Figure 3 and Figure 4).
Figure 3: Proportion of rural households not cultivating any land and proportion of rural non-farm workers, by major states, 1999-2000
Figure 4: Proportion of rural households not cultivating any land and proportion of rural non-farm workers, by major states, 2011-12
0
20
40
60
80
100
0.0 10.0 20.0 30.0 40.0 50.0 60.0 70.0 80.0 90.0 100.0
% o
f ru
ral
ho
use
ho
lds
no
t cult
ivati
ng
any l
and
% of rural non-farm workers (15 years and above, principal status)
Correlation = 0.49
0
20
40
60
80
100
0.0 10.0 20.0 30.0 40.0 50.0 60.0 70.0 80.0 90.0 100.0
% o
f ru
ral
ho
use
ho
lds
no
t cult
ivati
ng a
ny
land
% of rural non-farm workers (15 years and above, principal status)
Correlation = 0.54
ILO DWT for South Asia and the Country Office for India 21
7. MNREGA and impact on rural livelihood
The Mahatma Gandhi National Employment Guarantee Act (MGNREGA), 2005, has generated lot of
interest among policy makers and researchers, both within and outside India, and is often cited as the largest
social security programme in the world benefiting around 50 million rural households every year since 2008
(i.e., since the time it has been universalized).
The objectives of this programme can be broadly classified into three categories viz., social protection (by
guaranteeing employment opportunities), creation of assets (water and soil conservation, controlling
droughts and floods), empowering the poor (demand driven approach at the grass-root level and
participatory planning). Undoubtedly, by its very design, legal provisions, and transparency and
accountability inherent in the Act, it “marks a paradigm shift from previous wage employment
programmes” (MoRD, 2012).
Despite several shortcomings pointed out in the literature regarding implementation, this programme did
have a positive impact in terms of providing livelihood security and empowerment of the poor. In an
assessment of NREGA into its second year of implementation, Mathur (2007) noted that due to the
implementation of MGNREGA, migration was reduced in several villages in Andhra Pradesh, Chattisgarh,
Orissa, and Rajasthan. Not only that, the minimum wages was raised in several States, and participation of
women into the labour force increased significantly. The issue of empowerment of the poor through
NREGA can be verified from the fact that in several places (among these four States) “rural workers have
negotiated with private employers, even refusing casual work at double the earlier wage” (Mathur, 2007).
In India, it is the SCs and STs among whom the incidence of poverty is higher than other social groups.10
Over the years, even though the gap between SCs and STs vis-à-vis rest of the population has declined in
terms of certain socio-economic indicators, livelihood insecurity is most pronounced among them (India
Human Development Report, 2011). The desperation for better livelihood options among the marginalised
can be gauged by the fact that SCs and STs have accounted for 30 per cent and 25 per cent of total person
days worked in this programme respectively (MoRD, 2012). This is clearly much higher than their
respective population share which was 16.6 per cent and 8.6 per cent for SCs and STs respectively (Census,
2011). Such high participation of SCs and STs will have a positive impact on their livelihood security, and
in the long run, will improve their productivity and efficiency.
Job card is the most important document of this entire programme, and job card number has to be mentioned
while demanding work. It maintains record of days of employment and payment received by all the
members of the household who participated in this programme. Within a span of three years 56.5 million
households in rural India (35 per cent) had job cards by the year 2009-10, which is a testimony to its positive
feedback from the rural population.11 The latest round of employment and unemployment survey indicated
to an increase in proportion of households with job cards. If we consider the proportion of households which
had job cards within a specific social group, then we find that the proportion of households with job cards
was the highest among ST households followed by SC households (Table 19).
10 In rural India during 2011-12, incidence of poverty among SC population was 31.5%, and that among ST population was 45.3%.
The incidence of poverty among OBCs was 22.7%, while among forward castes it was 15.5% (Panagariya and More, 2013).
11 The number of job cards issued by the year 2012 was 120 million (MoRD, 2012)
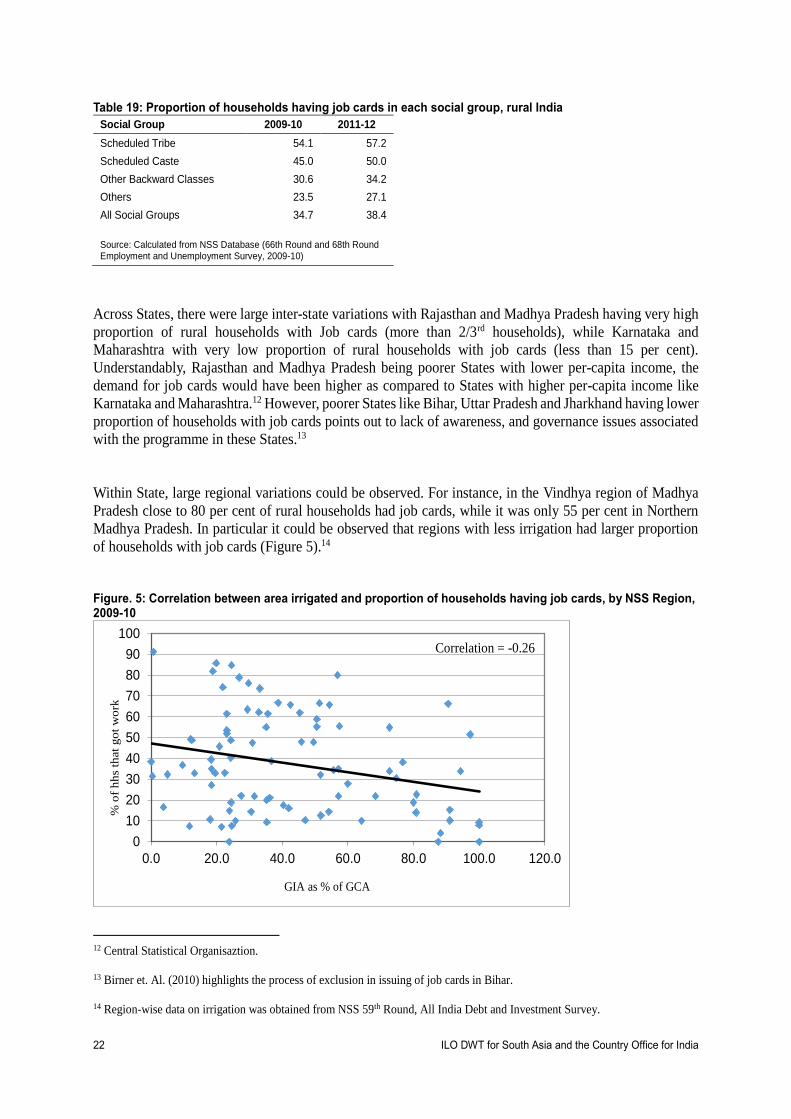
22 ILO DWT for South Asia and the Country Office for India
Table 19: Proportion of households having job cards in each social group, rural India Social Group 2009-10 2011-12
Scheduled Tribe 54.1 57.2
Scheduled Caste 45.0 50.0
Other Backward Classes 30.6 34.2
Others 23.5 27.1
All Social Groups 34.7 38.4
Source: Calculated from NSS Database (66th Round and 68th Round Employment and Unemployment Survey, 2009-10)
Across States, there were large inter-state variations with Rajasthan and Madhya Pradesh having very high
proportion of rural households with Job cards (more than 2/3rd households), while Karnataka and
Maharashtra with very low proportion of rural households with job cards (less than 15 per cent).
Understandably, Rajasthan and Madhya Pradesh being poorer States with lower per-capita income, the
demand for job cards would have been higher as compared to States with higher per-capita income like
Karnataka and Maharashtra.12 However, poorer States like Bihar, Uttar Pradesh and Jharkhand having lower
proportion of households with job cards points out to lack of awareness, and governance issues associated
with the programme in these States.13
Within State, large regional variations could be observed. For instance, in the Vindhya region of Madhya
Pradesh close to 80 per cent of rural households had job cards, while it was only 55 per cent in Northern
Madhya Pradesh. In particular it could be observed that regions with less irrigation had larger proportion
of households with job cards (Figure 5).14
Figure. 5: Correlation between area irrigated and proportion of households having job cards, by NSS Region, 2009-10
12 Central Statistical Organisaztion.
13 Birner et. Al. (2010) highlights the process of exclusion in issuing of job cards in Bihar.
14 Region-wise data on irrigation was obtained from NSS 59th Round, All India Debt and Investment Survey.
0
10
20
30
40
50
60
70
80
90
100
0.0 20.0 40.0 60.0 80.0 100.0 120.0
% o
f h
hs
that
go
t w
ork
GIA as % of GCA
Correlation = -0.26
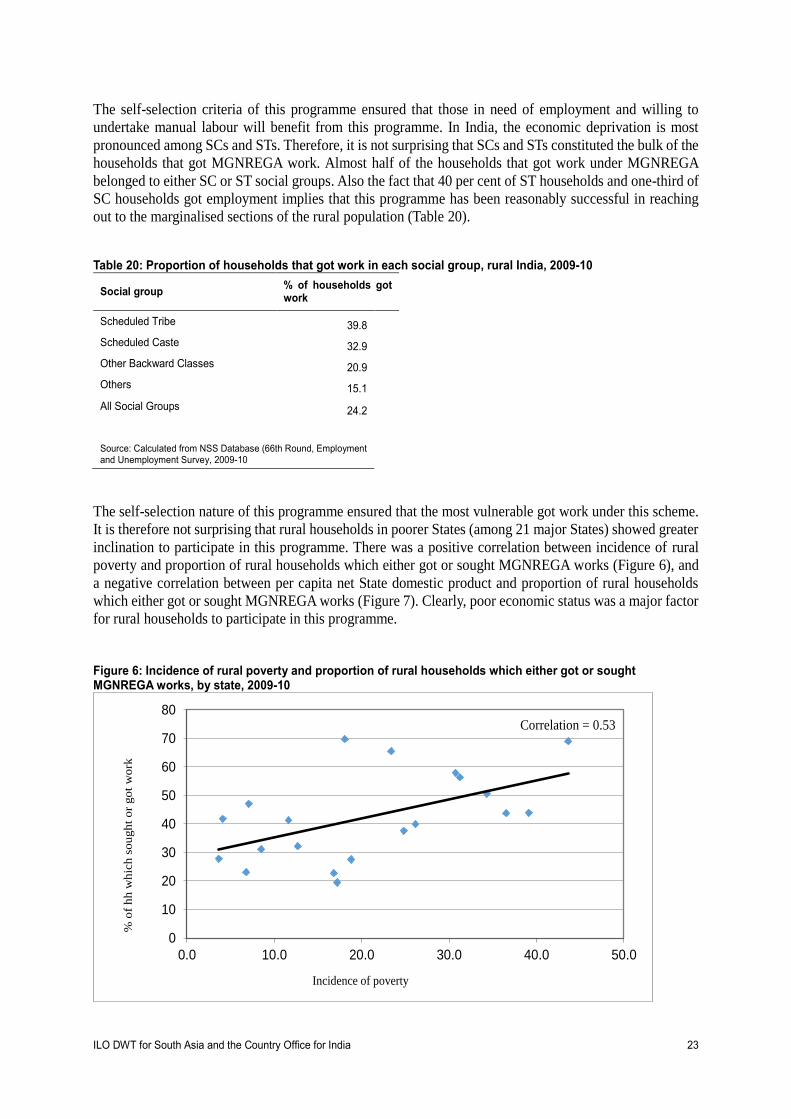
ILO DWT for South Asia and the Country Office for India 23
The self-selection criteria of this programme ensured that those in need of employment and willing to
undertake manual labour will benefit from this programme. In India, the economic deprivation is most
pronounced among SCs and STs. Therefore, it is not surprising that SCs and STs constituted the bulk of the
households that got MGNREGA work. Almost half of the households that got work under MGNREGA
belonged to either SC or ST social groups. Also the fact that 40 per cent of ST households and one-third of
SC households got employment implies that this programme has been reasonably successful in reaching
out to the marginalised sections of the rural population (Table 20).
Table 20: Proportion of households that got work in each social group, rural India, 2009-10
Social group % of households got work
Scheduled Tribe 39.8
Scheduled Caste 32.9
Other Backward Classes 20.9
Others 15.1
All Social Groups 24.2
Source: Calculated from NSS Database (66th Round, Employment and Unemployment Survey, 2009-10
The self-selection nature of this programme ensured that the most vulnerable got work under this scheme.
It is therefore not surprising that rural households in poorer States (among 21 major States) showed greater
inclination to participate in this programme. There was a positive correlation between incidence of rural
poverty and proportion of rural households which either got or sought MGNREGA works (Figure 6), and
a negative correlation between per capita net State domestic product and proportion of rural households
which either got or sought MGNREGA works (Figure 7). Clearly, poor economic status was a major factor
for rural households to participate in this programme.
Figure 6: Incidence of rural poverty and proportion of rural households which either got or sought MGNREGA works, by state, 2009-10
0
10
20
30
40
50
60
70
80
0.0 10.0 20.0 30.0 40.0 50.0
% o
f h
h w
hic
h s
ou
gh
t o
r go
t w
ork
Incidence of poverty
Correlation = 0.53

24 ILO DWT for South Asia and the Country Office for India
Figure 7: Per capita NSDP and proportion of rural households which either got or sought MGNREGA works, by state, 2009-10
From the above analysis (Figures 6 and 7) it is clear that the willingness to participate in MGNREGA was
higher in poorer States. If we consider the proportion of rural households which got MGNREGA works out
of those which were willing to participate in it, then, no pattern could be observed across States based on
per capita NSDP or incidence of rural poverty. In other words, relative economic well-being of States was
not related to performance in MGNREGA with respect to fulfilment of demand for work.15 While some of
the econommically weaker States like Rajasthan, Madhya Pradesh, Chhattisgarh were better performers in
this regard (which is a positive thing), other economically backward States like Bihar, Jharkhand, Orissa
were lagging behind. Among the well off States, Punjab, Maharashtra, Karnataka witnessed considerable
proportion of unmet demand under MGNREGA. The political economy factors prevailing in the rural
labour market in these agriculturally well off States might be the reason for sluggish performance in
MGNREGA. But which political economy factors, and in what way it is impacting employment generation
in MGNREGA is subject to further in-depth research in these areas.
Enhancement of household income in rural areas through more days of employment is the hallmark of
MGNREGA. There is an ongoing debate in the country regarding advantages and disadvantages of an
employment generation programme like MGNREGA. While there is no intention of going into that debate
here, it may be pertinent to mention here that through universal demand driven programme like MGNREGA
the government can actually influence the rural labour market indirectly through greater empowerment to
the workers, and increasing the bargaining power of the workers vis-à-vis their employers. Studies have
pointed out that MGNREGA has raised the market wage rate in agriculture resulting in an increase in cost
of production. The recent rise in agricultural wages has been principally attributed to MGNREGA. While
this might be the case as suggested in various micro-level studies (Haque, 2012), wages in MGNREGA are
lower than agricultural wages in most of the regions in India. Analysis of NSS 66th Round data (2009-10)
revealed that in 70 per cent of the regions in rural India, agricultural wages were higher than MGNREGA
wages. The regions where MGNREGA wages were higher than agricultural wages were mostly the regions
15 No. of households demanding MGNREGA work = No. of households which got work + No. of households which sought but did
not get work
0
10
20
30
40
50
60
70
80
0 10000 20000 30000 40000 50000 60000
% o
f h
h w
hic
h s
ou
gh
t o
r go
t w
ork
Per capita NSDP
Correlation = 0.62
ILO DWT for South Asia and the Country Office for India 25
with low agricultural productivity and low level of human development achievements (Uttar Pradesh,
Jharkhand, Orissa, Bihar, Chhattisgarh, Madhya Pradesh).
While MGNREGA wages might have resulted in increase in agricultural wages leading to an increase in
cost of cultivation in some regions, what the above analysis brings out is the fact that in low productive
backward regions the agricultural wages actually received (even after accounting for the upward
MGNREGA effect) were much lower than the stipulated minimum wages. Therefore, in absence of
MGNREGA it would have been even lower. This in turn brings out the deplorable living conditions of the
working masses in such regions. It is precisely for such group that MGNREGA holds immense socio-
economic importance, and therefore, the upward push that MGNREGA exerted on agricultural wages
should be viewed as a positive phenomenon in such backward regions.
Within three months of coming to office, the new government has made significant changes in MGNREGA
allowing for machine use in activities like road connectivity, building construction, production of building
material, and dug wells for improving land productivity. An obvious implication of this is to raise the
existing ratio of expenses between material and labour from 40:60 to 51:49. The argument for raising the
share of material expenses was based on the belief that creation of material-intensive assets would increase
their durability. However, this change does not really support evidence as even this 40 per cent target was
not met in the past. For instance, in 2013-14, 26.6 per cent of MGNREGA funds were spent on material,
and the year prior to this, it was 27.7 per cent – much lower than the permissible limit of 40 per cent. Also,
this increased share of material is likely to increase the influence of job contractors in MGNREGA and
squeeze funds available for wages.
8. Summing up
This study has been undertaken in order to try and arrive at some broad conclusions across space regarding
the factors that influences growth and development of rural non-farm sector and its consequences on overall
rural livelihoods. This study is primarily based on Employment and Unemployment Surveys conducted by
National Sample Survey Organization (NSSO) for the years 1999-2000 and 2011-12. In addition to
employment and unemployment survey, this study also takes into account All India Debt and Investment
Surveys for the years 2002-03 and 2012-13 which were also conducted by NSSO.
Overall, there has been a significant increase in rural non-farm employment over the years (12 percentage
points in 12 years). This shift from agriculture to non-agriculture has happened across all asset deciles in
rural India, and it was much more pronounced among poorer households. More specifically, the shift
happened among poorer households from agriculture towards non-agricultural wage employment (and
away from self-employment). Thus, even though shift away from agriculture was happening across all asset
groups, it was by and large distress driven.
The biggest increase in non-agricultural employment has been in construction sector, where the share of
non-farm employment has increased from 14.4 per cent in 1999-2000 to 30.1 per cent in 2011-12. This high
proportion of workers going into construction sector as casual wage workers led to an overall decline in
self-employment and rise in casual wage employment in rural non-farm sector. In terms of size of enterprise,
by and large, there has been a shift in rural non-farm employment towards larger enterprises. However,

26 ILO DWT for South Asia and the Country Office for India
construction sector which has experienced unprecedented growth in employment experienced a decline in
the share of workers employed in enterprises employing 10 or more workers.
Majority of workers joining construction industry as casual wage workers had low educational attainment.
In fact, low educational level remained a major challenge for the rural non-farm sector, particularly when
non-farm sector is supposed to provide productive and decent employment opportunities. This was a bigger
challenge in terms of providing decent employment for the construction sector which was the largest
growing sector, and particularly so, when it accounted for 44 per cent of all illiterate workers in rural non-
farm sector. Lower educational attainment was one of the reasons for scarcity of skilled manpower. Even
this limited skilled manpower was heavily concentrated in the service sector. Service sector provided greater
employment opportunities for the better educated workers. In other words, construction sector which was
the fastest growing in terms of rural non-farm employment was creating jobs without any technical
knowledge.
Large scale mechanization of agriculture resulted in large scale displacement of workers from farm sector
into non-farm sources of income. Access to land was an important determinant of this shift from agriculture
to non-agriculture. State level analysis of proportion of rural households not cultivating any land and
proportion of rural non-farm workers indicated that generally States with higher proportion of rural
households not cultivating any land also had higher proportion of rural non-farm workers.
Categorization of rural non-farm sector as “residual” does not seem to hold much ground given its growing
importance in rural employment generation, and its positive impact in reducing poverty and inequality (as
pointed out in several studies). Rural non-farm employment has been considered as an important vehicle
for reduction of unemployment and consequently poverty not only in India but in other parts of Asia, Africa,
and Latin America. Countries that made significant progress in poverty reduction created considerable non-
farm activities. In China, for instance, non-farm activities became important since 1970s resulting in rapid
growth of non-farm employment at around 12 per cent per annum, and thereby contributed significantly
towards poverty reduction (Stern, 2001). Rapid growth of rural enterprises in China particularly township
and village enterprises provided increasing jobs outside agriculture and diversified sources of agricultural
income. In India, growth of rural non-farm employment resulted in improved rural wages and was one of
the main factors for reducing rural poverty during the 1980s (Dev, 2002). The major constraints inhibiting
non-farm employment were limited access to formal credit, low level of skill development, access to
market, and persistent inequality in ownership of different kinds of assets. Also, sluggish growth of
agricultural sector played a dampening role on demand for goods produced in non-farm sector. Increasing
public expenditure in rural infrastructure, and expenditure on rural employment programmes are important
to boost rural non-farm employment.
It is in this context of overall scenario of rural labour market that MGNREGA assumes significance in
providing social protection, asset creation, and empowering the poor. In India, the economic deprivation is
most pronounced among SCs and STs. Therefore, it is not surprising that SCs and STs constituted the bulk
of the households that got MGNREGA work. Almost half of the households that got work under
MGNREGA belonged to either SC or ST social groups. Across States, performance of MGNREGA has
varied considerably. While some of the econommically weaker States like Rajasthan, Madhya Pradesh,
Chhattisgarh were better performers in this regard (which is a positive thing), other economically backward
States like Bihar, Jharkhand, Orissa were lagging behind. In addition to increase in days of employment, a
very significant impact of MGNREGA has been in an overall rise in rural wages, and thereby resulting in
improvement of consumption among poorer households.

ILO DWT for South Asia and the Country Office for India 27
The broad story that emerged from this analysis is that of a significant shift towards non-farm employment
in rural areas, and this shift happened predominantly among economically weaker sections of the rural
society. Access to land was an important determinant in this process of diversification.
28 ILO DWT for South Asia and the Country Office for India
References
Acharya, V.V.; Baghai-Wadji, R.; Subramanian, K.V. (2010). Labor Laws and Innovation, NBER Working
Paper No. 16484
Basant, R. (1993). Diversification of Economic Activities in Rural Gujarat: Key Results Of A Field Study,
Working Paper Series No. 53 (Ahmedabad, Gujarat Institute of Development Research)
Bryceson, D.F. (2002). “Multiplex Livelihoods in Rural Africa: Recasting the Terms and Conditions of
Gainful Employment”, The Journal of Modern African Studies, Vol. 40, No. 1.
DeJanvry, A.; Sadoulet, E.; Zhu, N. (2005). The Role of Non-farm Incomes in Reducing Rural Poverty and
Inequality in China, Working Paper (Berkeley, Department of Agriculture and Resource Economics,
University of California)
Dev, M.S. (2002). “Bold Initiatives Needed on Agricultural and Rural Employment”, Economic and
Political weekly, Vol. 37, No. 12.
Ellis, F. (2000). “Rural Livelihoods and Diversity in Developing Countries” (Oxford University Press)
Epstein, S. (1973). “South India: Yesterday, Today and Tomorrow: Mysore Village Revisited” (London,
Macmillan)
Francis, E. (2000). “Making a Living: Changing Livelihoods in Rural Africa” (London, Routledge)
Ghuman, R.S. (2005). “Rural Non-farm Employment Scenario: Reflections from Recent Data in Punjab”,
Economic and Political weekly, Vol. 44, No. 16.
Government of India. (2013). “Economic Survey 2012-13”, Ministry of Finance (New Delh)
Haque, T. (2012). “MGNREGS and its Effects on Agriculture”, in Ashok Pankaj (ed.), “Right to Work and
Rural India” (New Delhi, Sage Publications)
Hazell, P.; Haggblade, S. (1990). Rural-Urban Growth Linkages in India, PRE Working Paper Series No.
430 (Agriculture and Rural Development Department, World Bank)
Hazell, P.; Haggblade, S. (1993). “Farm Non-farm Growth Linkages and the Welfare of the Poor”, in Lipton,
M., Van der Gaag, J. (eds), “Including the Poor” (Washington, DC, World Bank)
Hazel, P.; Ramasamy, C. (1991). “The Green Revolution Reconsidered: The Impact of High-Yielding Rice
Varieties in South India” (Baltimore, John Hopkins)
India Human Development Report. (2011). “India Human Development Report: Towards Social Inclusion”,
Oxford University Press, New Delhi.
Institute for Human Development. (2014). “India Labour and Employment Report, 2014”, Institute for
Human Development and Academic Foundation.
Kaldor, N. (1967). “Strategic Factors in Economic Development” (Ithaca, New York, Cornell University
Press)

ILO DWT for South Asia and the Country Office for India 29
Khan, A. R.; Griffin, K.; Riskin, C.; Renwei, Z. (1992). “Household Income and its Distribution in China”,
China Quarterly, No. 132.
Kung, J.K.S.; Lee, Y. (2001). “So What If There Is Income Inequality? The Distributive Consequences of
Rural Non-farm Employment in China”, Economic Development and Cultural Change, Vol. 50, No. 1.
Kuznets, S. (1965). “Economic Growth and Structure” (New Delhi, Oxford and IBH Publishing Company)
Lanjouw, P. (1999). “Rural Non-agricultural Employment and Poverty in Ecuador”, Economic Development
and Cultural Change, Vol. 48, No. 1.
Lanjouw, P.; Shariff, A. (2004). “Rural Non-Farm Employment in India: Access, Incomes and Poverty
Impact”, Economic and Political Weekly, Vol. 39, No. 4.
Leaf, M.J. (1983). “The Green Revolution and Cultural Change in a Punjab Village, 1965-1978”, Economic
Development and Cultural Change, Vol. 31, No. 2.
Mathur, L. (2007). “Employment Guarantee: Progress So Far”, Economic and Political Weekly, Vol. 43,
No. 8.
Mazumdar, D.; Sarkar, S. (2008). “Globalization, Labour Markets and Inequality in India” (Routledge)
Mellor, J. (ed). (1976). “Agriculture on the Road to Industrialization” (Baltimore, Johns Hopkins University
Press)
Mehrotra, S. (ed). (2014). “India’s Skills Challenge: Reforming Vocational Education and Training to
Harness the Demographic Dividend”, (New Delhi, Oxford University Press)
Ministry of Rural Development (MoRD). (2012). “MGNREGA Sameeksha: An Anthology of Research
Studies on the Mahatma Gandhi National Rural Employment Guarantee Act, 2005” (Orient BlackSwan)
Panagariya, A.; More, V. (2013). Poverty by Social, Religious and Economic Groups in India and its Largest
States 1993-94 to 2011-12, Working Paper No. 2013-03 (Columbia University, Programme on Indian
Economic Policies)
Ranjan, S. (2009). “Growth of Rural Non-Farm Employment in Uttar Pradesh: Reflections from Recent
Data”, Economic and Political Weekly, Vol. 44, No. 4.
Rao, N.C., Dasgupta, S. (2009). “Nature of Employment in the Food Processing Sector”, Economic and
Political Weekly, Vol. 44, No. 17.
Rawal, V. (2013). “Changes in Distribution of Operational Holdings of Land in Rural India”, Review of
Agrarian Studies, Vol. 3, No. 2.
Saha, P. (2014). “Participation in Tenancy Market: An Analysis of Caste and Class in Two Villages in Uttar
Pradesh”, in Suman, C.K., Babu, Suresh, V., and Nath, P, K. (eds) “Agrarian Crisis in India”, Academic
Foundation.
Saith, A.; Tankha, A. (1992). Longitudinal Analysis of Structural Change in a North Indian Village 1970-
1987, Working Paper Series No. 128 (The Hague, Institute of Social Studies)
30 ILO DWT for South Asia and the Country Office for India
Saha, P.; Rawal, V. (forthcoming). “Women’s Employment in India: What do Recent NSS Surveys of
Employment and Unemployment Show?”, C P Chandrasekhar (ed.), “Essays in Honour of Utsa Patnaik”,
Tulika Publisher.
Sarkar, A. (2013). “Tractor Production and Sales in India, 1989-2009”, Review of Agrarian Studies, Vol. 3,
No.1.
Sen, B. (1996). “Rural Non-farm Sector in Bangladesh: Stagnating and Residual, or Dynamic and
Potential”, The Bangladesh Development Studies, Vol. 24, Nos. 3/4.
Srinivas, M.N. (1976). “The Remembered Village” (Berkeley, University of California Press)
Stern, N. (2001). “Building a Climate for Investment, Growth, and Poverty Reduction in India”, 16th EXIM
Bank Commencement Lecture, Mumbai.
Vaidyanathan, A. (1986). “Labour use in rural India: A study of spatial and temporal variation”, Economic
and Political Weekly, Vol. 21, No. 52.
Wadley, S.S.; Derr, B.W. (1990). “Karimpur 1925-1984: Understanding Rural India through Restitudes”,
in Bardhan, P. (ed), Conversation between Economists and Anthropologists (New Delhi, Oxford University
Press)
Wiser, W.; Wiser, C. (1971). “Behind Mud Walls”, California, Berkeley.
World Bank. (2013). World Development Report, 2013 (Washington, DC)
World Bank. (2012). More and Better Jobs in South Asia (Washington, DC)
Xaxa, V. (2008). “State, Society and Tribes”, Pearson Education.
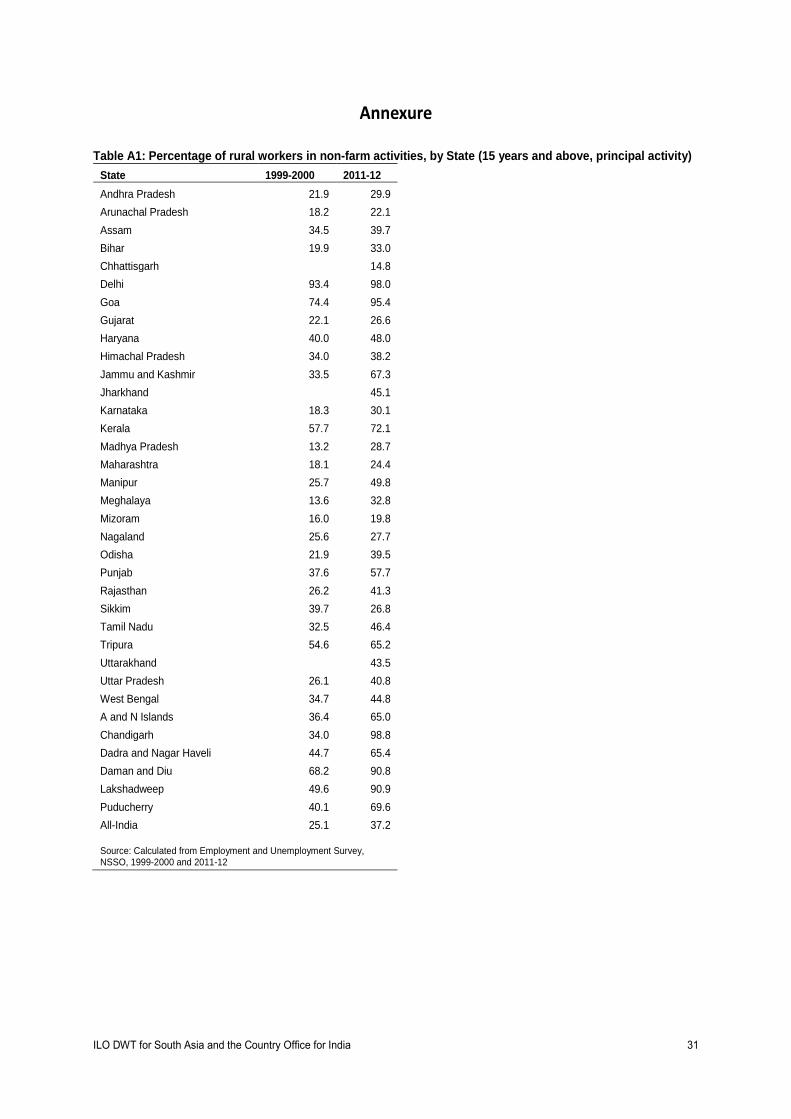
ILO DWT for South Asia and the Country Office for India 31
Annexure
Table A1: Percentage of rural workers in non-farm activities, by State (15 years and above, principal activity)
State 1999-2000 2011-12
Andhra Pradesh 21.9 29.9
Arunachal Pradesh 18.2 22.1
Assam 34.5 39.7
Bihar 19.9 33.0
Chhattisgarh 14.8
Delhi 93.4 98.0
Goa 74.4 95.4
Gujarat 22.1 26.6
Haryana 40.0 48.0
Himachal Pradesh 34.0 38.2
Jammu and Kashmir 33.5 67.3
Jharkhand 45.1
Karnataka 18.3 30.1
Kerala 57.7 72.1
Madhya Pradesh 13.2 28.7
Maharashtra 18.1 24.4
Manipur 25.7 49.8
Meghalaya 13.6 32.8
Mizoram 16.0 19.8
Nagaland 25.6 27.7
Odisha 21.9 39.5
Punjab 37.6 57.7
Rajasthan 26.2 41.3
Sikkim 39.7 26.8
Tamil Nadu 32.5 46.4
Tripura 54.6 65.2
Uttarakhand 43.5
Uttar Pradesh 26.1 40.8
West Bengal 34.7 44.8
A and N Islands 36.4 65.0
Chandigarh 34.0 98.8
Dadra and Nagar Haveli 44.7 65.4
Daman and Diu 68.2 90.8
Lakshadweep 49.6 90.9
Puducherry 40.1 69.6
All-India 25.1 37.2
Source: Calculated from Employment and Unemployment Survey, NSSO, 1999-2000 and 2011-12

32 ILO DWT for South Asia and the Country Office for India
Table A2: Percentage of rural male workers in non-farm activities, by state (15 years and above, principal activity)
State 1999-2000 2011-12
Andhra Pradesh 26.1 35.8
Arunachal Pradesh 26.2 29.0
Assam 36.3 41.5
Bihar 21.1 33.4
Chhattisgarh 18.4
Delhi 93.8 97.5
Goa 76.7 96.3
Gujarat 28.6 30.4
Haryana 40.7 49.7
Himachal Pradesh 49.2 60.9
Jammu and Kashmir 34.1 66.7
Jharkhand 49.0
Karnataka 21.6 34.2
Kerala 58.7 73.2
Madhya Pradesh 16.2 31.1
Maharashtra 26.6 30.3
Manipur 22.5 43.8
Meghalaya 14.1 39.3
Mizoram 16.6 22.9
Nagaland 30.2 33.2
Odisha 22.9 40.7
Punjab 36.7 56.5
Rajasthan 33.6 50.0
Sikkim 43.4 37.6
Tamil Nadu 37.7 48.5
Tripura 54.9 64.7
Uttarakhand 59.4
Uttar Pradesh 28.6 43.6
West Bengal 33.5 43.2
A and N Islands 40.0 62.8
Chandigarh 32.0 98.7
Dadra and Nagar Haveli 61.4 70.7
Daman and Diu 78.4 90.8
Lakshadweep 51.8 89.8
Puducherry 47.4 74.3
All-India 28.9 40.9 Source: Calculated from Employment and Unemployment Survey, NSSO, 1999-2000 and 2011-12

ILO DWT for South Asia and the Country Office for India 33
Table A3: Percentage of rural female workers in non-farm activities, by state (15 years and above, principal activity)
State 1999-2000 2011-12
Andhra Pradesh 16.1 21.6
Arunachal Pradesh 5.6 9.4
Assam 23.0 26.7
Bihar 15.1 26.9
Chhattisgarh 9.1
Delhi 80.2 100.0
Goa 66.2 92.9
Gujarat 9.7 14.6
Haryana 29.3 31.0
Himachal Pradesh 7.9 12.6
Jammu and Kashmir 25.1 76.3
Jharkhand 22.2
Karnataka 12.6 20.8
Kerala 54.8 68.6
Madhya Pradesh 8.0 20.9
Maharashtra 6.1 12.2
Manipur 37.2 70.3
Meghalaya 12.9 23.9
Mizoram 15.2 14.2
Nagaland 14.4 12.0
Odisha 19.3 34.4
Punjab 50.1 72.4
Rajasthan 10.6 21.6
Sikkim 30.6 13.6
Tamil Nadu 24.6 42.6
Tripura 52.0 67.8
Uttarakhand 9.6
Uttar Pradesh 15.8 24.5
West Bengal 40.9 53.6
A and N Islands 23.1 71.8
Chandigarh 97.2 100.0
Dadra and Nagar Haveli 16.1 48.5
Daman and Diu 33.9 89.7
Lakshadweep 39.4 99.5
Puducherry 25.3 58.7
All-India 15.8 25.5 Source: Calculated from Employment and Unemployment Survey, NSSO, 1999-2000 and 2011-12
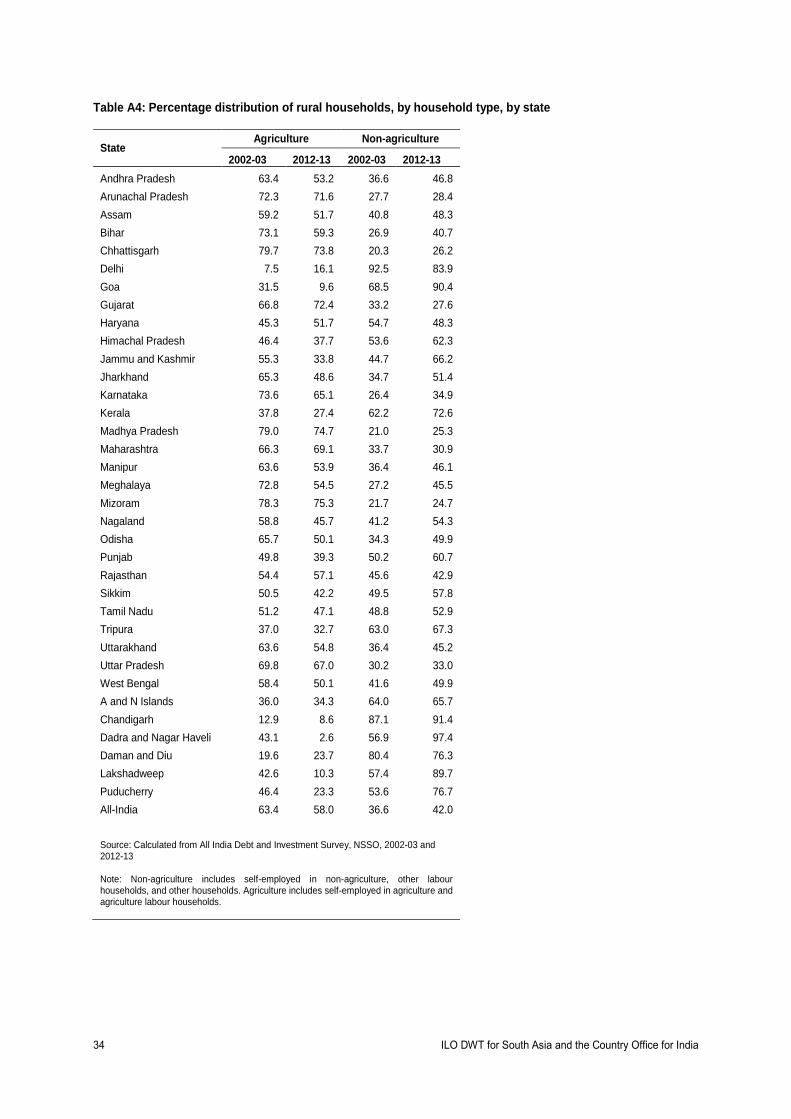
34 ILO DWT for South Asia and the Country Office for India
Table A4: Percentage distribution of rural households, by household type, by state
State Agriculture Non-agriculture
2002-03 2012-13 2002-03 2012-13
Andhra Pradesh 63.4 53.2 36.6 46.8
Arunachal Pradesh 72.3 71.6 27.7 28.4
Assam 59.2 51.7 40.8 48.3
Bihar 73.1 59.3 26.9 40.7
Chhattisgarh 79.7 73.8 20.3 26.2
Delhi 7.5 16.1 92.5 83.9
Goa 31.5 9.6 68.5 90.4
Gujarat 66.8 72.4 33.2 27.6
Haryana 45.3 51.7 54.7 48.3
Himachal Pradesh 46.4 37.7 53.6 62.3
Jammu and Kashmir 55.3 33.8 44.7 66.2
Jharkhand 65.3 48.6 34.7 51.4
Karnataka 73.6 65.1 26.4 34.9
Kerala 37.8 27.4 62.2 72.6
Madhya Pradesh 79.0 74.7 21.0 25.3
Maharashtra 66.3 69.1 33.7 30.9
Manipur 63.6 53.9 36.4 46.1
Meghalaya 72.8 54.5 27.2 45.5
Mizoram 78.3 75.3 21.7 24.7
Nagaland 58.8 45.7 41.2 54.3
Odisha 65.7 50.1 34.3 49.9
Punjab 49.8 39.3 50.2 60.7
Rajasthan 54.4 57.1 45.6 42.9
Sikkim 50.5 42.2 49.5 57.8
Tamil Nadu 51.2 47.1 48.8 52.9
Tripura 37.0 32.7 63.0 67.3
Uttarakhand 63.6 54.8 36.4 45.2
Uttar Pradesh 69.8 67.0 30.2 33.0
West Bengal 58.4 50.1 41.6 49.9
A and N Islands 36.0 34.3 64.0 65.7
Chandigarh 12.9 8.6 87.1 91.4
Dadra and Nagar Haveli 43.1 2.6 56.9 97.4
Daman and Diu 19.6 23.7 80.4 76.3
Lakshadweep 42.6 10.3 57.4 89.7
Puducherry 46.4 23.3 53.6 76.7
All-India 63.4 58.0 36.6 42.0 Source: Calculated from All India Debt and Investment Survey, NSSO, 2002-03 and 2012-13
Note: Non-agriculture includes self-employed in non-agriculture, other labour households, and other households. Agriculture includes self-employed in agriculture and agriculture labour households.
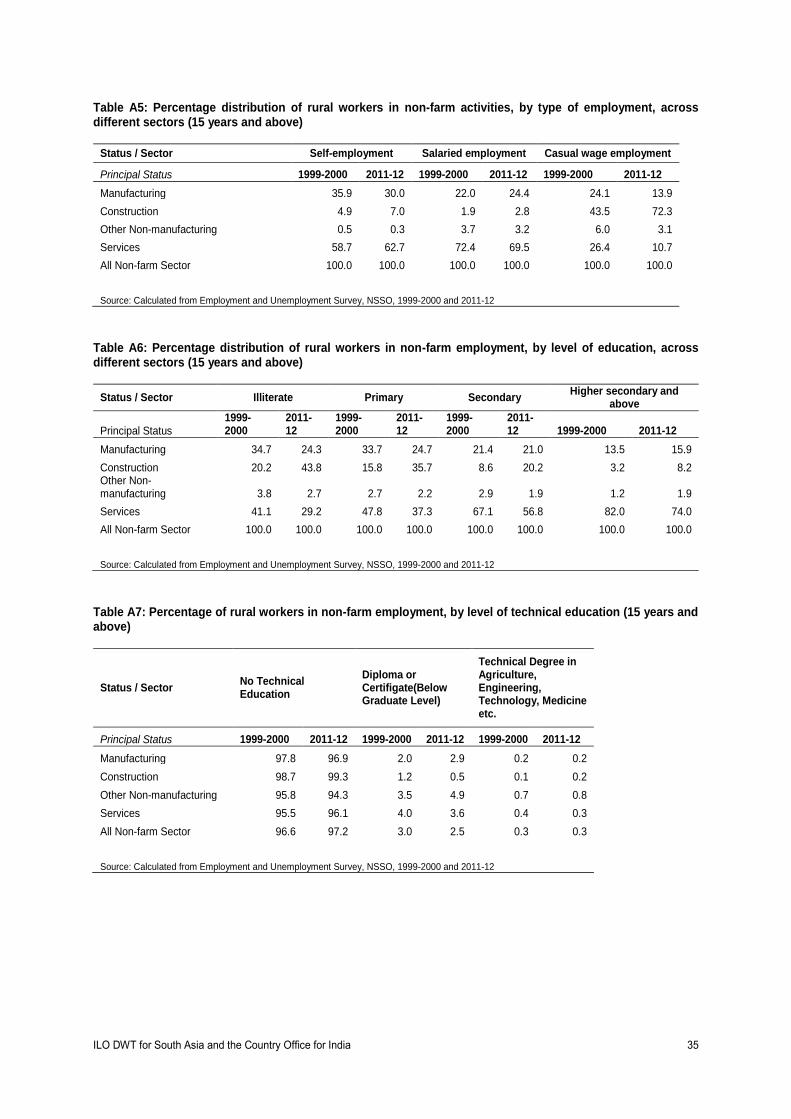
ILO DWT for South Asia and the Country Office for India 35
Table A5: Percentage distribution of rural workers in non-farm activities, by type of employment, across different sectors (15 years and above)
Status / Sector Self-employment Salaried employment Casual wage employment
Principal Status 1999-2000 2011-12 1999-2000 2011-12 1999-2000 2011-12
Manufacturing 35.9 30.0 22.0 24.4 24.1 13.9
Construction 4.9 7.0 1.9 2.8 43.5 72.3
Other Non-manufacturing 0.5 0.3 3.7 3.2 6.0 3.1
Services 58.7 62.7 72.4 69.5 26.4 10.7
All Non-farm Sector 100.0 100.0 100.0 100.0 100.0 100.0 Source: Calculated from Employment and Unemployment Survey, NSSO, 1999-2000 and 2011-12
Table A6: Percentage distribution of rural workers in non-farm employment, by level of education, across different sectors (15 years and above)
Status / Sector Illiterate Primary Secondary Higher secondary and
above
Principal Status 1999-2000
2011-12
1999-2000
2011-12
1999-2000
2011-12 1999-2000 2011-12
Manufacturing 34.7 24.3 33.7 24.7 21.4 21.0 13.5 15.9
Construction 20.2 43.8 15.8 35.7 8.6 20.2 3.2 8.2 Other Non-manufacturing 3.8 2.7 2.7 2.2 2.9 1.9 1.2 1.9
Services 41.1 29.2 47.8 37.3 67.1 56.8 82.0 74.0
All Non-farm Sector 100.0 100.0 100.0 100.0 100.0 100.0 100.0 100.0 Source: Calculated from Employment and Unemployment Survey, NSSO, 1999-2000 and 2011-12
Table A7: Percentage of rural workers in non-farm employment, by level of technical education (15 years and above)
Status / Sector No Technical Education
Diploma or Certifigate(Below Graduate Level)
Technical Degree in Agriculture, Engineering, Technology, Medicine etc.
Principal Status 1999-2000 2011-12 1999-2000 2011-12 1999-2000 2011-12
Manufacturing 97.8 96.9 2.0 2.9 0.2 0.2
Construction 98.7 99.3 1.2 0.5 0.1 0.2
Other Non-manufacturing 95.8 94.3 3.5 4.9 0.7 0.8
Services 95.5 96.1 4.0 3.6 0.4 0.3
All Non-farm Sector 96.6 97.2 3.0 2.5 0.3 0.3 Source: Calculated from Employment and Unemployment Survey, NSSO, 1999-2000 and 2011-12
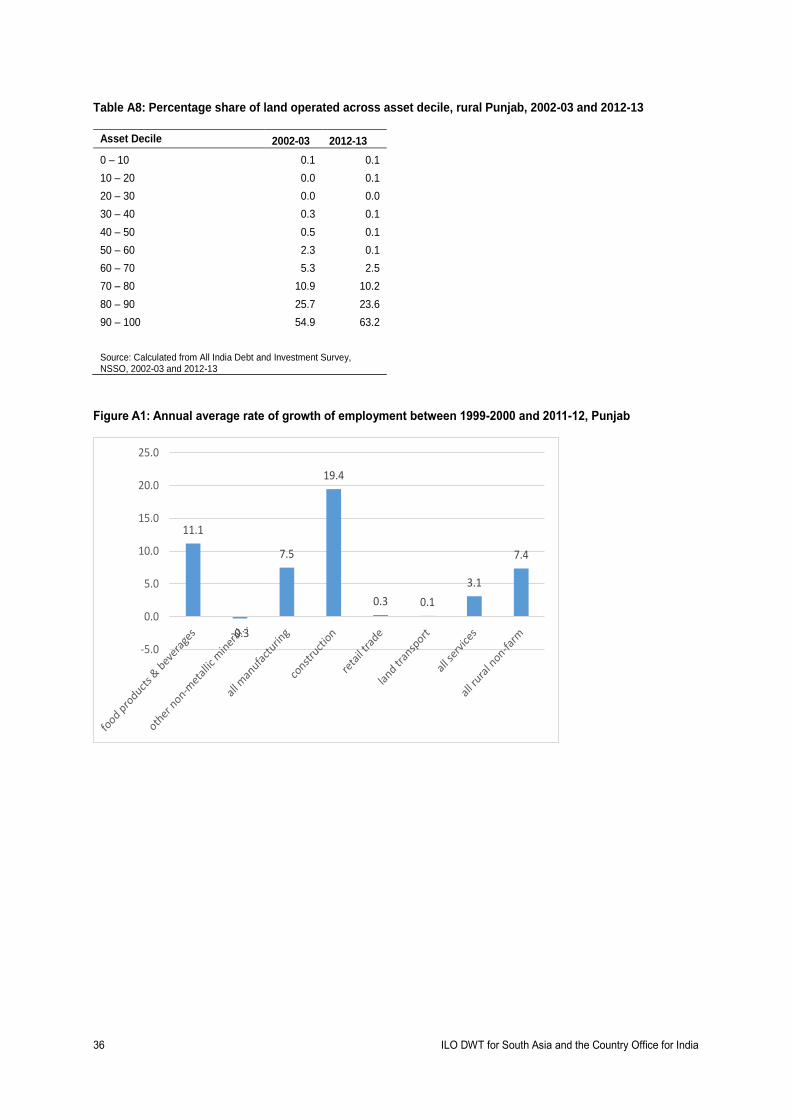
36 ILO DWT for South Asia and the Country Office for India
Table A8: Percentage share of land operated across asset decile, rural Punjab, 2002-03 and 2012-13
Asset Decile 2002-03 2012-13
0 – 10 0.1 0.1
10 – 20 0.0 0.1
20 – 30 0.0 0.0
30 – 40 0.3 0.1
40 – 50 0.5 0.1
50 – 60 2.3 0.1
60 – 70 5.3 2.5
70 – 80 10.9 10.2
80 – 90 25.7 23.6
90 – 100 54.9 63.2 Source: Calculated from All India Debt and Investment Survey, NSSO, 2002-03 and 2012-13
Figure A1: Annual average rate of growth of employment between 1999-2000 and 2011-12, Punjab
11.1
-0.3
7.5
19.4
0.3 0.1
3.1
7.4
-5.0
0.0
5.0
10.0
15.0
20.0
25.0


Regional Office for Asia and the Pacific 1
ILO DWT for South Asia and Country Office for India
India Habitat Centre, Core 4B, 3rd Floor
Lodhi road, New Delhi-110 003
India
Tel.: +91 11 4750 9200, Fax.: +91 11 2460 2111
Email: [email protected]
www.ilo.org/india
ISSN: 2227-4391 (print)
2227-4405 (web pdf)
S ta te o f ru ra l labour mark ets i n Ind ia
In India, while contribution of agriculture to GDP has been declining, agriculture still
remains mainstay of the rural economy by employing almost half of the
population. However, the gap between job seekers in rural areas and employment
opportunities in agriculture has been widening and non-farm sector has become
an increasingly important source of livelihood. This paper analyses rural
diversification across States in rural India, factors responsible for non-agricultural
employment, and identifies industries within rural non-farm sector which are
generating employment opportunities. Further, paper also looks into role of
agriculture in rural diversification. This study is based on Employment and
Unemployment Survey (National Sample Survey Organization) for the years 1999-
2000 and 2011-12, and All India Debt and Investment Survey (National sample
Survey Organization) for the years 2002-03 and 2012-13. The broad story that
emerged from this analysis is that of a significant shift towards non-farm
employment in rural areas, and this shift happened predominantly among
economically weaker sections of the rural society. Access to land was an
important determinant in this process of rural employment diversification.