Embed Size (px)
Citation preview

African Journal of Agricultural Research Vol. 7(32), pp. 4474-4488, 21 August, 2012 Available online at http://www.academicjournals.org/AJAR DOI: 10.5897/AJARx11.017 ISSN 1991-637X ©2012 Academic Journals
Review
Rural labour market developments in the Republic of Macedonia
Verica Janeska1 and Štefan Bojnec2*
1Institute of Economics, University “Ss. Cyril and Methodius”, Skopje, Republic of Macedonia.
2Faculty of Management, University of Primorska, Koper, Slovenia.
Accepted 5 June, 2012
The significant changes in the quantitative and qualitative characteristics of human resources in rural Macedonia can be explained by the continued tendency of emigration from villages to urban areas and abroad. The intensity of emigration has altered the demographic structure and reproductive base of the rural population, along with the income of rural households. The rural and agricultural labour market faces a mismatch with respect to the unfavourable age, education and spatial distribution of the total labour force. A reduction in the participation of women in the agricultural labour force is a new feature. The overall transformation is apparent in the income structure of rural households. An increase of the share of households with mixed income sources notably stems from households that receive remittances and foreign currency funds from family members abroad. The demographic revitalization of rural areas depends on economic revitalization, with a more rational use of the labour force and human resources, as well as, restructuring of agricultural production and agricultural holdings. In addition, improvements are necessary in the functioning of market institutions to better meet the needs of smaller farmers and the rural economy.
Key words: Rural labour market, agricultural transformation, rural households, emigration process, rural economy business management.
INTRODUCTION
The labour market in the Republic of Macedonia
1 has
developed through different phases (Micevska, 2008). It is generally accepted for developed and developing countries that the knowledge-based economic growth is crucial for raising level of international competitiveness, but the education system needs to be geared towards producing a workforce that can be used efficiently in the labour market (Sapsford and Tzannatos, 1993; Jajri and Ismail, 2010). Grgić et al. (2010) investigated the dissatisfaction of the rural population with their quality of *Corresponding author. E-mail: [email protected], [email protected]. Tel: +386 5 610 2046. Fax: +386 5 610 2015.
1The country inside use the name the Republic of Macedonia, while under the
United Nations is recognized as the Former Yugoslav Republic of Macedonia. In this paper we use the shorter name the Republic of Macedonia.
life and intentions to migrate from rural areas in Croatia, arguing that the major hardships of rural life are of economic nature – lack of employment opportunities, inadequate choice of profession and lower income compared with those in a city. The challenging issues faced by the Macedonian rural economy are similar to those in some developing countries with agriculture in an unstable economy (Schultz, 1945) and affect aspects of rural business development, such as a lack of mana-gement skills, finance, access to bank credit, access to markets and appropriate technology. In addition to this are low levels of production capacity, a lack of recognition by large companies, a lack of interest, long bureaucratic processes, and an absence of support for the roles that small businesses can play in economic development (Jakimovski, 2002; Todaro and Smith, 2003; Kongolo, 2010; Todorov and Vittuari, 2010). In the agricultural sector, the family farm structure prevails (Hanson, 1996; Swinnen and Van Herck, 2009).
This study assesses the role of rural labour market

Janeska and Bojnec 4475
Table 1. Basic demographic features in the Republic of Macedonia, by statistical regions (NUTS 3).
Region Total population
Changes- Increase
1994- 2002 Growth rate (%)
Migration balance
Population density
per km2
1994 2002 Number % 1994 2002
Total 1,945,932 2,022,547 76,615 3.94 0.48 -30,992 76 79
Vardar 131,035 133,180 2,145 1.64 0.2 -1,670 40.7 41.4
East 201,525 203,213 1,688 0.84 0.1 -3,305 48.3 48.7
Southwest 211,226 219,741 8,515 4.03 0.49 -6,191 64.2 66.8
Southeast 168,481 171,416 2,935 1.74 0.22 -4,743 64.8 66
Pelagonija 242,614 238,136 -4,478 -1.85 -0.23 -5,297 49.7 48.8
Polog 281,982 305,930 23,948 8.49 1.02 -8,472 116.8 126.7
Northeast 163,841 172,787 8,946 5.46 0.66 -1,557 70.6 74.4
Skopje 545,228 578,144 32,916 6.04 0.73 243 314.6 333.6
Source: State Statistical Office of the Republic of Macedonia, (http://www.stat.gov.mk). Population Censuses of 1994 and 2002.
developments in the Republic of Macedonia, where small-scale farms and subsistence agriculture (Abele and Frohberg, 2003) play important social-buffer role in the rural economy (Petrick and Weingarten, 2004). The contribution of this paper is in threefold. First, it is the first study to provide a qualitative and quantitative analysis of key issues surrounding the development of the rural labour market and agriculture in the Republic of Macedonia. Secondly, the paper also assesses the institutional framework for the functioning of rural labour markets and its impacts on development, along with structural changes in the labour market of the rural economy and agriculture. Finally, the paper analyzes human capital and labour mobility, providing a descriptive overview that draws upon informative and comprehensive reports on the factors driving rural and agricultural labour markets. In spite of high unemployment rates and job shedding, agriculture and the rural economy in the Republic of Macedonia have remained very important for maintaining jobs, small businesses and entrepreneurship, economic development and poverty alleviation during the transition (Swinnen et al., 2005; Macours and Swinnen, 2008).
The rest of the paper is structured in the following way. The study first presented demographic developments by statistical regions in the Republic of Macedonia, after which the labour force and employment of the rural population are analysed for the total economy, urban and rural. It then focuses on the labour force in rural areas and its structure by gender, age, and education. This was followed by the specific attention given to the labour force in agriculture during the pre-transition and transition periods. Furthermore, based on the empirical analyses of rural labour market developments, the paper considers the main determinants of labour market changes in agriculture and rural areas, after which newer studies and operational programming from the national institutions are presented in order to present policy response and policy implications. Finally, the main findings and
conclusions are derived.
DEMOGRAPHIC DEVELOPMENTS BY STATISTICAL REGIONS
The Republic of Macedonia is characterized by a high degree of demographic differences among the regions with respect to the total population, natural and migratory movements, population density and other demographic features
2. The basic demographic data, according the
population censuses 1994 and 2002 (SSORM, 1994, 2002) are presented in Table 1 on statistical regional level (NUTS 3).
According to a mapping of socio-economic differences among the municipalities, the latter in the Republic of Macedonia are categorised into six zones based on the concentration of the population in the municipalities. These comprise areas with low concentrations (up to 50 persons per km
2), zones of medium concentration (51 to
100 inhabitants per km2), overpopulated zones (101 to
150 inhabitants per km2), significantly overpopulated
zone (151 to 500 inhabitants per km2), very significantly
overpopulated zone (501 to 1,000 inhabitants per km2)
and extremely crowded areas (over 1,000 inhabitants per km
2) (UNDP, 2004). Pursuant to the territorial
organisation in 2002, more than a third (37) of the municipalities were classed as low-concentration area, 17 municipalities had an average concentration, 9 were overcrowded, 10 were significantly overcrowded, 5 were very substantially overcrowded and 6 municipalities had over 1,000 inhabitants per km
2.
In 2008, about 43% of the population lived in rural areas, which entailed 86.7% of the total area of land. The State Statistical Office reported data on regional statistics
2The collection, processing and publication of regional data are based on the Nomenclature of Territorial Units for Statistics (NUTS).

4476 Afr. J. Agric. Res. Table 2. Demographic indicators for the Republic of Macedonia, 2010.
Parameter Republic of Macedonia
Statistical regions
Vardar East Southwest Southeast Pelagonija Polog Northeast Skopje
Total population (in thousands)
2,057.30 153.9 179.7 221.8 173 234 315.4 175.2 604.3
Population density (per km
2)
82.6 38.1 51.8 66.4 63.1 49.6 130.4 75.8 333.4
Old-age dependency ratio (in %)
41.2 40.7 38.7 38.1 40.8 44.2 37.8 42.4 43.6
Average age (in years, 2008 data)
37 38 39 36 37 40 33 36 37
Source: State Statistical Office of the Republic of Macedonia, Statistical Review: Population and Social Statistics, No. 2.4.11.14 / 697, Skopje, 2011b (http://www.stat.gov.mk). in 2010, including demographic data (Table 2). The average population density in 2010 was 82.6 inhabitants per km
2. Most of the population lived in cities, and the most
densely populated place was the Skopje region (333 persons per km
2). The population in the Republic of
Macedonia is still showing a positive natural increase, although, with a reduced pace of growth compared with the 1990s. According to the 2010 data, the natural population growth in 2010 amounted 5,183 persons (SSORM, 2011a) and the population growth rate was estimated at 0.32%.
The average age of the population in 2008 was approxi-mately 37 years (and approximately 38 years in 2010), and almost 71% of the population were of working-age (between 15 and 64). The oldest population was recorded in Pelagonia, while the youngest population lived in the Polog statistical region. The share of the working-age population among the total in these two regions respectively amounted to 69.3 and 72.5%, respectively.
LABOUR FORCE AND EMPLOYMENT OF THE RURAL POPULATION
For identification of the existing condition of the labour market, as well as, the scope and quality of the available human resources in rural areas, it is first necessary to review the changes in the total rural population, as the pool from which the labour force is recruited. Taking into consideration the long duration of demographic processes, we review the changes over a long time interval.
The changes in the size and structural characteristics of the labour force and employees, as well as, the inactive population, are analysed according to the available Labour Force Survey (LFS) data for the period between 2004 to 2010.
Changes in the total population, urban and rural
Major changes in the distribution and redistribution of the population in the Republic of Macedonia since the beginning of the 1960s have contributed to increased heterogeneity in its internal distribution and emphasised spatial–demographic polarisation. Among other ways, this is expressed in a larger concentration of the popu-lation in urban areas and the depopulation in the greater part of rural areas. According to the Population Census of 1961 (SSORM, 1961), more than three-fifths (61.4%) of the total population in the Republic of Macedonia lived in the rural areas.
After that, there was a period of continual reduction in the rural population, which fell to about 50% of the total population in 1971. In the intercensal period of 1981 to 1994, the total population in the country increased by 6.2% while the rural population decreased by 42,374 persons or 5.2%. In the same period, the share of the rural population in the total population fell from 44.9 to 40.0%. In the period since 1994, in the Republic of Macedonia, there have been substantial changes in the territorial organisation and identification of the rural and urban settlements in the country
3. Because of the
incomparability of the data to assess the existing conditions and changes in the spatial distribution of the population in the rural areas, we reviewed the available data from the population censuses of 1994 and 2002
3The first one was in 1996, when the territory of the Republic of Macedonia was divided into 123 municipalities, but the law did not determine rural and
urban settlements. With the second one in 2004, 84 municipalities were
established, and the rural and urban settlements were determined. According to the Law on the Territorial Organisation of the Local Self Government in the
Republic of Macedonia, the villages are determined to be settlements with the
one functional meaning in which one sector prevails and the physiognomy and function of the area is agricultural (Official Gazette of RM., No. 55/04).

Janeska and Bojnec 4477
Table 3. Number and share (in %) of the urban and rural population of the Republic of Macedonia, on regional level (NUTS 3), 1994 and 2002.
Regions Population census 1994 Population census 2002
Total Urban Rural Total Urban Rural
Republic of Macedonia
Number 1945932 2022547 1147006 875541
% 100 100 56.7 43.3
Vardar
Number 152479 104143 48336 154535 106207 48328
% 100.0 68.3 31.7 100.0 68.7 31.3
East
Number 180081 111345 68736 181858 120547 61311
% 100.0 61.8 38.2 100.0 66.3 33.7
Southwest
Number 212856 99010 113846 221546 79964 141582
% 100.0 46.5 53.5 100.0 36.1 63.9
Southeast
Number 168481 74497 93984 171416 77632 93784
% 100.0 44.2 55.8 100.0 45.3 54.7
Pelagonian
Number 242614 162250 80364 238136 160925 77211
% 100.0 66.9 33.1 100.0 67.6 32.4
Polog
Number 280352 83270 197082 304125 88762 215363
% 100.0 29.7 70.3 100.0 29.2 70.8
Northeast
Number 163841 87420 76421 172787 97757 75030
% 100.0 53.4 46.6 100.0 56.6 43.4
Skopje
Number 545228 578144 415212 162932
% 100.0 100.0 71.8 28.2
Source: State Statistical Office of the Republic of Macedonia, Population Censuses 1994 and 2002 (http://www.stat.gov.mk).
(processed according to the territorial organisation from 2004). In 2002, the share of the rural population among the total population amounted 43.3%. At the regional statistical level, it varied from 70.8% (Polog) to 28.2% (Skopje). With addition to Polog, those statistical regions with a larger share of the rural population are the Southwest and the Southeast statistical regions (Table 3).
The data for the urban and rural population showed that in the period between 1994 to 2002, the reduction of
the rural population continued in all of the statistical regions except in the Southwest and Polog regions. In these two statistical regions, there was and has remained a dominant share of the rural population. In 2002, almost three-fifths (59.2%) of the total rural population was concentrated in three statistical regions (Polog, Southwest and Skopje). According to the existing territorial organisation, almost half (41) of the total number of municipalities (84) in the Republic of Macedonia is solely made up of rural populations. Most of

4478 Afr. J. Agric. Res. the rural settlements have extremely small populations and because of the unfavourable age structure, they are at risk of being without a resident, such as Novaci (where the population density is 5 inhabitants per km
2) and Drugovo (8
inhabitants per km2). This situation is primarily caused by
the intensive rural-urban emigration that took place be-fore the 1990s, as well as, emigration abroad over the last two decades. At the same time, there are rural municipalities with a very high population density, such as Aracinovo (400 inhabitants per km
2), Bogovinje (211
inhabitants per km2) and Vrapciste (161 inhabitants per
km2). These are mainly settlements with high fertility
rates, where emigration has not caused a significant fall in the natural increase of the population. In line with the law for regional development, the Bureau for Regional Development has determined those villages that are deemed to be located in underdeveloped areas
4. These
statistics revealed that about 69% of the national territory and approximately 17% of the total rural population are designed as being in underdeveloped areas. The criteria for determining the economically underdeveloped areas are unreliable, however, because some Macedonian villages with high rates of migration, a lack of municipal services and economic infrastructure have not been given the status of extremely underdeveloped villages and vice versa. According to the decision determining economically underdeveloped areas (Official Gazette of RM, No. 17/06 and 54/06), 64% of the total number of villages in the Republic of Macedonia are eligible for support under this law. The total number of rural centres is 113, of which 20 also have the status of „specific region‟.
5 The total number
of villages with the status of specific region is 1,005 and they are divided as follows: 1. 50% are mountainous, predominantly in the Southwest statistical region; they are followed by the statistical regional groups of Polog and Pelagonija, and the Northeast and East, with the smallest share being located in the Vardar and Skopje statistical regions; 2. 33% are extremely underdeveloped villages, located mainly in the statistical regions of East, Vardar, Pelagonia and Northeast; and 3. 15% of the villages are located on the borderline. Nowadays, a great number of rural municipalities are facing a process of depopulation, and fall under the status of a specific region. This situation will determine to a large
4The basic criteria and indicators for determining the level of development, i.e. the
underdeveloped areas in the Republic of Macedonia, are the socio-economic index (for which the following indicators are used: GDP per capita, budget income per
capita, and increase of the added value of the nonfinancial sector) and the
demographic index (for which the following indicators are used: natural population increase, ageing coefficient, net migration per 1,000 inhabitants and graduated
students per 1,000 inhabitants (aged 25-64 years) (Official Gazette of RM, No.
162/08). 5Main criteria for determining areas with specific development needs are: the
level of economic development; demographic index; geographic location; the level
of technical and social infrastructure; the value of the natural resources and the cultural heritage (Official Gazette of RM. No. 63/07).
extent the existing conditions of the rural labour market, and will no doubt have great influence on those in the future, especially, in the regional context. Basically, these difficulties will be manifested in a lack of human resources, particularly, among the younger and educated labour forces. At the same time, attention should be paid to the continuous depopulation of small rural areas on the one hand, and the significant growth of the population in the larger rural municipalities on the other hand. This implies an unequal distribution of the human resources and imposes the need for a differentiated approach in the identification of strategic objectives for the development of these areas and rural labour markets. The labour force in the rural areas The changes and the current status of the available human resources and labour force in rural areas in the Republic of Macedonia are considered on the bases of available data from the LFS for the period 2004 to 2010 (Table 4). They showed that during this period, the rural population aged between 15 to 79 increased by 14.9%, and its share of the total population in the country (aged 15 to 79) rose from 38.2 (2004) to 42.5% (2010). During this period, the share of the active population, that is, the labour force in the total population age 15 to 79 grew from 46.8% (2004) to 54.8% (2010) in rural areas and the inactive population respectively declined from 53.2 to 45.2%. Simultaneously, within the total labour force, relatively larger growth was seen in the share of the employed (41.4%), compared with the unemployed persons (22.5%). Such changes caused a rise in the employment rate and a fall in the unemployment rate. Apart from these changes, employment in rural areas remained relatively low and unemployment was extremely high. The large share of the inactive population and the high unemployment rate in these areas signify a lack of participation by a relatively large proportion of the working-age population and the labour force.
Gender, age and educational structure of the rural population From the point of view of the available human resources in the rural areas in the Republic of Macedonia, observations of the changes in the demographic structure (gender and age) are important, as those of the educational structure of the working-age population and the labour force. The LFS data showed that among the total population aged from 15 to 79 men make up the larger share. Besides a slight decrease in the period 2004 to 2010, the participation of men among the employed and unemployed persons was and remains dominant and very high (Table 5). The gender structure of the inactive population is opposite. This situation can be partly explained by the fact that most of the rural

Janeska and Bojnec 4479
Table 4. Working age population (aged between15-79) by economic activity in the rural areas of the Republic of Macedonia, 2004-2010.
2004 2005 2006 2007 2008 2009 2010
Total population 609902 648002 664865 647248 698145 693632 700951
Employed persons 183114 208210 233005 235896 262409 258433 258958
Unemployed persons 102029 110962 115543 110280 114006 119720 125031
Inactive population 324760 328830 316317 301072 321731 315479 316961
Employment rate* 30.0 32.1 35.0 36.4 37.6 37.3 36.9
Employment rate** 34.6 36.9
41.3 42.8 42.2 40.6
Unemployment rate*** 35.8 34.8 33.1 31.9 30.3 31.7 32.6
Share of inactive in total population 53.2 50.7 47.6 46.5 46.1 45.5 45.2
Share of labour force in total population 46.8 49.3 52.4 53.5 53.9 54.5 54.8
* According the ILO recommendations (share of employed in workig age population 15-79); ** According the EUROSTAT recommendations (share of employed in workig age population 15-64); *** According the ILO recommendations (share of unemployed in the total labour force). Source: State Statistical Office of the Republic of Macedonia, Labour Force Survey 2004, 2005, 2006, 2007, 2008, 2009 and 2010 (http://www.stat.gov.mk).
Table 5. Gender structure (in %) of the working age population (15-79) by economic activity in the areas of the Republic of Macedonia, 2004-2010.
Parameter 2004 2005 2006 2007 2008 2009 2010
Total population 609902 648002 664865 647248 698145 693632 700951
Men 50.8 50.7 51.4 51.1 50.1 51.1 50.7
Women 49.2 49.3 48.6 48.9 49.9 48.9 49.3
Employed persons 183114 208210 233005 235896 262409 258433 258958
Men 70.1 67.5 69.1 67.2 68.1 68.9 67.8
Women 29.9 32.5 30.9 32.8 31.9 31.1 32.2
Unemployed persons 102029 110962 115543 110280 114006 119720 125031
Men 66.5 64.3 64.9 65.5 62.9 65.9 66.3
Women 33.5 35.7 35.1 34.5 37.1 34.1 33.7
Inactive population 324760 328830 316317 301072 321731 315479 316961
Men 34.9 35.5 33.4 33.2 32.4 30.9 30.6
Women 65.1 64.5 66.6 66.8 67.6 69.1 69.4
Source: State Statistical Office of the Republic of Macedonia, Labour Force Survey 2004, 2005, 2006, 2007, 2008, 2009 and 2010 (http://www.stat.gov.mk).
population is concentrated in statistical regions where the share of the Albanian population prevails. Traditionally, Albanian women in rural areas are less economically active than they are in urban areas.
A large share of women in the inactive population does not mean that this segment of the population is not active at all or that they are not a potentially available labour force in rural areas. Rather, this finding should be observed in the context of the great number of unpaid family workers in agriculture, as well as, the age structure of the inactive rural population. As for the age structure of the rural population (aged 15 to 79), the LFS data showed that in the period 2004 to 2010, the greatest
increases were noticed in the age groups 40 to 49 (25.5%) and 50 to 64 (22.2%). Significantly smaller increases were seen among the young population aged 15 to 29 (14.4%) and the younger middle-aged popu-lation aged 30-39 (11.8%), with only a slight fall for the population aged 65 and over (2.9%). Despite these changes, the share of the younger population (15 to 39) in the period observed remained relatively high and amounted about 50% (Table 6).
Substantial differences were found in the age structure of the employed and unemployed persons in rural areas. The proportion of youth (15 to 29) is lower among the total employed than among the contingent of unemployed
4480 Afr. J. Agric. Res.
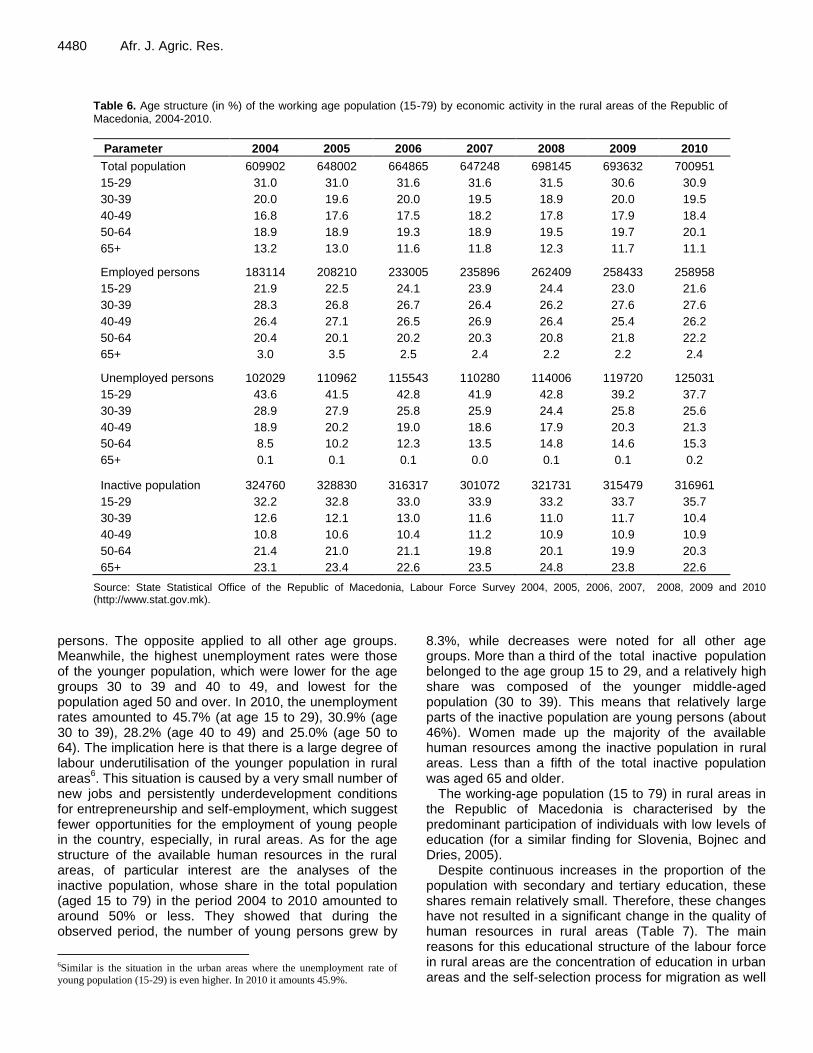
Table 6. Age structure (in %) of the working age population (15-79) by economic activity in the rural areas of the Republic of Macedonia, 2004-2010.
Parameter 2004 2005 2006 2007 2008 2009 2010
Total population 609902 648002 664865 647248 698145 693632 700951
15-29 31.0 31.0 31.6 31.6 31.5 30.6 30.9
30-39 20.0 19.6 20.0 19.5 18.9 20.0 19.5
40-49 16.8 17.6 17.5 18.2 17.8 17.9 18.4
50-64 18.9 18.9 19.3 18.9 19.5 19.7 20.1
65+ 13.2 13.0 11.6 11.8 12.3 11.7 11.1
Employed persons 183114 208210 233005 235896 262409 258433 258958
15-29 21.9 22.5 24.1 23.9 24.4 23.0 21.6
30-39 28.3 26.8 26.7 26.4 26.2 27.6 27.6
40-49 26.4 27.1 26.5 26.9 26.4 25.4 26.2
50-64 20.4 20.1 20.2 20.3 20.8 21.8 22.2
65+ 3.0 3.5 2.5 2.4 2.2 2.2 2.4
Unemployed persons 102029 110962 115543 110280 114006 119720 125031
15-29 43.6 41.5 42.8 41.9 42.8 39.2 37.7
30-39 28.9 27.9 25.8 25.9 24.4 25.8 25.6
40-49 18.9 20.2 19.0 18.6 17.9 20.3 21.3
50-64 8.5 10.2 12.3 13.5 14.8 14.6 15.3
65+ 0.1 0.1 0.1 0.0 0.1 0.1 0.2
Inactive population 324760 328830 316317 301072 321731 315479 316961
15-29 32.2 32.8 33.0 33.9 33.2 33.7 35.7
30-39 12.6 12.1 13.0 11.6 11.0 11.7 10.4
40-49 10.8 10.6 10.4 11.2 10.9 10.9 10.9
50-64 21.4 21.0 21.1 19.8 20.1 19.9 20.3
65+ 23.1 23.4 22.6 23.5 24.8 23.8 22.6
Source: State Statistical Office of the Republic of Macedonia, Labour Force Survey 2004, 2005, 2006, 2007, 2008, 2009 and 2010 (http://www.stat.gov.mk).
persons. The opposite applied to all other age groups. Meanwhile, the highest unemployment rates were those of the younger population, which were lower for the age groups 30 to 39 and 40 to 49, and lowest for the population aged 50 and over. In 2010, the unemployment rates amounted to 45.7% (at age 15 to 29), 30.9% (age 30 to 39), 28.2% (age 40 to 49) and 25.0% (age 50 to 64). The implication here is that there is a large degree of labour underutilisation of the younger population in rural areas
6. This situation is caused by a very small number of
new jobs and persistently underdevelopment conditions for entrepreneurship and self-employment, which suggest fewer opportunities for the employment of young people in the country, especially, in rural areas. As for the age structure of the available human resources in the rural areas, of particular interest are the analyses of the inactive population, whose share in the total population (aged 15 to 79) in the period 2004 to 2010 amounted to around 50% or less. They showed that during the observed period, the number of young persons grew by
6Similar is the situation in the urban areas where the unemployment rate of young population (15-29) is even higher. In 2010 it amounts 45.9%.
8.3%, while decreases were noted for all other age groups. More than a third of the total inactive population belonged to the age group 15 to 29, and a relatively high share was composed of the younger middle-aged population (30 to 39). This means that relatively large parts of the inactive population are young persons (about 46%). Women made up the majority of the available human resources among the inactive population in rural areas. Less than a fifth of the total inactive population was aged 65 and older.
The working-age population (15 to 79) in rural areas in the Republic of Macedonia is characterised by the predominant participation of individuals with low levels of education (for a similar finding for Slovenia, Bojnec and Dries, 2005).
Despite continuous increases in the proportion of the population with secondary and tertiary education, these shares remain relatively small. Therefore, these changes have not resulted in a significant change in the quality of human resources in rural areas (Table 7). The main reasons for this educational structure of the labour force in rural areas are the concentration of education in urban areas and the self-selection process for migration as well

Janeska and Bojnec 4481
Table 7. Educational structure (in %) of the working age population (15-79) by economic activity in the rural areas of the Republic of Macedonia, 2004-2010.
Parameter 2004 2005 2006 2007 2008 2009 2010
Total population 609902 648002 664865 647248 698145 693632 700951
Low level of educaion 68.1 66.4 66.2 63.2 62.7 61.3 59.2
Secondary education 28.8 30.4 30.0 32.7 33.2 33.7 34.9
Tertiary education 3.1 3.2 3.8 4.1 4.0 5.0 5.8
Employed persons 183144 208210 233005 25896 262409 258433 258958
Low level of educaion 50.8 52.3 52.7 47.9 46.4 46.1 43.5
Secondary education 42.1 40.7 39.8 44.7 46.6 45.6 46.6
Tertiary education 7.0 7.0 7.6 7.4 7.0 8.4 9.8
Unemployed persons 102029 110962 115543 110280 114006 119720 125031
Low level of educaion 52.1 46.4 47.9 46.6 46.4 45.1 42.0
Secondary education 44.9 50.7 48.2 49.0 48.2 48.2 49.6
Tertiary education 3.0 2.9 3.9 4.4 5.3 6.7 8.3
Inactive population 324760 328830 316317 301072 321731 315479 316961
Low level of educaion 82.8 82.0 82.8 81.2 81.8 79.9 78.9
Secondary education 16.3 17.0 16.2 17.4 17.0 18.5 19.5
Tertiary education 0.9 1.0 1.0 1.4 1.2 1.6 1.6
Source: State Statistical Office of the Republic of Macedonia, Labour Force Survey 2004, 2005, 2006, 2007, 2008, 2009 and 2010 (http://www.stat.gov.mk).
as emigration abroad. The changes of the educational structure of the labour force (employed and unemployed persons) have taken place in the same direction. In the period of 2004 to 2010, the number of employed persons with secondary education increased by 56.7% and by 97.0% for those with tertiary education. As for the un-employed persons, these indicators amounted to 35.5 and 242.1%, respectively. Nevertheless, this increase has not resulted in significant improvement of labour force quality in rural areas, owing to the initial very poor educational structure.
As for the inactive population, the absolute decrease of persons with low levels of education (by 7.1%) is evident, as is the increase of those with secondary (17.3%) and tertiary education (67.8%). Alongside these changes, the educational structure of the inactive population in rural areas remained very unfavourable. About four-fifths of this population (80%) had low levels of education.
THE LABOUR FORCE IN AGRICULTURE
The available data for the total and active agricultural population from the population census of 2002 (SSORM, 2002), the census of agriculture in 2007 (SSORM, 2007) and the LFS differ more or less. One reason is the different definitions and methodologies used for data collection and data processing. Consequently, the data do not allow more precise identification of the labour force engaged in the agricultural sector. As a result, in
reviewing of the size and structural characteristics of the labour force in the agricultural sector, it is important to take into consideration the changes that have occurred in the agricultural population over a long time interval. Agricultural population in the pre-transition period
In the period of 1953 to 1994, the Republic of Macedonia was marked by a trend of continual reductions in the labour force in the agricultural sector, but with a varying degree over time. So in the period of 1953 to 1961, the total agricultural population fell by about 97,000 and during the intercensal period (1961 to 1971) by about 64,400 persons. The largest extent of change occurred in the period 1971 to 1981. At the same time, while the data are incomparable
7, the reduction of the labour force is
most apparent, because it reached about 265,000 persons. Such changes are the result of a fast process of industrialization, as well as, the intensive and spon-taneous transfer of an agricultural into a non-agricultural population.
The total transfer of the agricultural into the non-agricultural population in the period of 1953 to 1981 is estimated at about 660,000 to 690,000 persons (Penev and Tomic, 1986: 7). It should be noted that the scope of
7The data are not completely comparable due to the change of the definition of
the agricultural population. In 1953, 1961 and 1971, the total agricultural
population was defined according to occupation, and in 1981 and 1994 it was defined according to sector of employment.

4482 Afr. J. Agric. Res.
Table 8. Active agricultural population in the Republic of Macedonia, 1981, 1994 and 2002.
Variable Number
1981 1994 2002
Active agricultural population - total 215805 91354 49849
Economically active agricultural population 214943 53444 44044*
Household members who helps out / Unpaid family workers 862 37910 5805
Share (in %) of economically active in total active agricultural population 99.6 58.5 88.4
* Status of employment: 17964 employed; 277 employers; 25803 own account workers. Source: Censuses of Population 1981, 1994 and 2002, State Statistical Office, Republic of Macedonia (http://www.stat.gov.mk).
the transfer is significantly larger in relation to the scope of the reduction of the total agricultural population, because it includes both natural and migratory movements. During the period of 1981 to 1994, the reduction of the agricultural population (165,795 persons) continued. Even though it was much smaller in relation to the previous period, it showed a substantial change under the conditions of an unfavourable economic slowdown and economic recession. It is important to point out that this period partially coincides with the start of the socio-economic transformation of the country from the previous socio-economic framework of the former Yugoslavian self-managed system to a market economy within an independent Macedonian state in 1991. Therefore, these movements do not correspond with the development and structure of the economic sectors in the country, that is, in great part, they are results of ina-dequate treatment of the development of the agriculture and rural areas.
The share of agriculture in the total population in the Republic of Macedonia also shows the extent of the changes that have occurred. Namely, according to the census years, the aforementioned indicator amounted to 62.7% (SSORM, 1953), 51.4% (SSORM, 1961), 39.9% (SSORM, 1971), 21.7% (SSORM, 1981) and 11.8% (SSORM, 1994). This evidence clearly reveals the significant decline in the share of the agricultural population among the total population. At the same time, also evident is the huge change that occurred in the share of the agricultural population among the rural population, which decreased from 91.3% (1953) to 48.4% (1981) and 29.5% (according to the situation in 1994). This entailed a dramatic change in the structure of the rural population, because less than a third of it was made up by the agricultural segment. If we take into consideration that about 90.0% of the agricultural population is located in rural areas, then, the change that has taken place is even clearer.
Active agricultural population in the period of transition
The changes in the total and active agricultural
population in the Republic of Macedonia are also characteristic for the period of transition. In parallel, there has been the problem of identifying their scope. Thus, the analysis of the active agricultural population draws upon data from several sources that more or less methodo-logically different. The population census of 1994 revealed that the active agricultural population at the beginning of the transition period (the start of the 1990s) has been downsized by more than half compared with the situation in 1981 (Table 8). The change is even greater if we observe the economically active share of the agricultural population. This trend also continued in the period after 1994, but to a lesser degree. That was confirmed by the population census of 2002, although, the data from these two censuses are methodologically not comparable
8.
The LFS has been conducted in the Republic of Macedonia since 1996. In relation to the active agri-cultural population, these data showed that the period of 1996 to 2010 was marked by significant oscillations. The size of the active agricultural population in the interval ranged from 149,163 (2001) to 87,608 persons (2004). This huge difference of more than 60,000 persons is hard to explain by significant changes in the development and structure of the economic sectors in the country. The size of the active agricultural population was relatively more stable during the last five years of this period (Table 9).
In the period 1996 to 2010, the participation rate of the active agricultural population among the total economically active population, that is, the total employed in the country,hovered at around 20%, although, with certain exceptions. That suggests a relatively small share for the agricultural sector, which is still higher than in the EU-27 countries. Nevertheless, from the point of view of the country analysed and from its experience of economic development and changes in the real sector during the last decade, this indicator can be considered underestimated. The active agricultural population in the Republic of Macedonia is characterized by a specific structure owing to the significantly large share of
8In relation to the economic structure of the population, the population census of 2002 applied the same methodology as the LFS.

Janeska and Bojnec 4483 Table 9. Active agricultural population in the Republic of Macedonia, 1996-2010.
Variable 1996 1997 1998 1999 2000 2001 2002 2003 2004 2005 2006 2007 2008 2009 2010
Total economically active population - employed 537591 512301 539762 545222 549846 599308 561341 545108 522995 545253 570404 590234 609015 629901 637855
Active population in agriculture - total 99857 94932 107249 115361 119971 149163 133581 119951 87608 106179 114485 107433 119498 116601 121521
Economically active population in agriculture* 66123 72342 66901 64883 66161 71548 71753 61424 47683 54248 57658 54340 62693 60889 76316
- Unpaid family workers in agriculture** 33734 22590 40348 50478 53810 77615 61828 58576 39925 51931 56827 53093 56805 55712 45205
Share (in %) of active agricultural population
in total active population (employed) 18.6 18.5 19.9 21.2 21.8 24.9 23.8 22.0 16.8 19.5 20.1 18.2 19.6 18.5 19.1
Share (in %) of unpaid family
workers in total active agricultural population 33.8 23.8 37.6 43.8 44.9 52.0 46.3 48.8 45.6 48.9 49.6 49.4 47.5 47.8 37.2
*Active agricultural population without unpaid family workers in the agriculture; ** For the period 1997-2002 they are approximated as 90% of the total unpaid family workers. Source: Labour Force Survey, State Statistical Office, Republic of Macedonia (http://www.stat.gov.mk).
the unpaid family workers
9. Their participation
among the total active agricultural population after 2001 has been higher than 45%, which means that almost half of the active farmers do not practice their occupation professionally and are helped by members of their families in the agricultural household. A substantial change is seen for 2010 when this share amounted to 37.2%. The available data from the LFS showed that most (about 90% or more) of the active farmers are engaged on their own property, that is, on the individual agricultural holdings. This means that a relatively small part of the labour force is employed by businesses with other forms of ownership (social, mixed, collective, state, and undefined) (Table 10).
In 2007, a census of agriculture was conducted in the Republic of Macedonia, which among other things gave information about the share of the labour force engaged on individual agricultural
9In the LFS, unpaid family workers are defined as persons who work
without pay in a business entity or farm (owned by a family member).
holdings and that employed by business entities. It showed that 476,613 persons were engaged in the field of agriculture, among which 471,069 were employed by individual holdings and 5,544 by business entities. Beside the different metho-dological approach, it can be stated that there is a huge deflection of these data from those in the LFS. For clarification of these data, it is important to point to the structure of the total number of members of individual households (454,504 persons) who worked more than 50 h on individual agricultural holdings, according to the type of agricultural activity. For 167,992 persons, working in agriculture was a sole activity and for 24,812 it was the main activity, for 98,318 it was an additional activity and for 163,382 a temporary activity.
This conclusion in turn means that almost 200,000 members of individual agricultural holdings can be viewed as the active agricultural population. This information corresponds to the number of individual agricultural holdings, which according to the census of agriculture of 2007 amounted to 192,378 holdings. In this context, the
large number of seasonal workers should be taken into account, which in 2007 amounted to 109,606 persons (among whom 103,187 were employed by individual holdings and 6,419 by business entities).
Based on the aforementioned data, it is very difficult to precisely identify the size of the active agricultural population in the Republic of Macedonia. Taking into consideration the genesis of the changes in the agricultural sector and the active agricultural population over a longer term, as well as the changes and existing conditions in the economic development of the country during the transition period, the active agricultural popu-lation can be estimated as larger than 100,000 persons. That means that the size of the active agricultural population is larger than that registered by the LFS. In this context, it is important to also bear in mind the very small number of active farmers who are registered and have health and pension insurance (about 20,000 persons). Therefore, a valid presupposition is that many active farmers (a relatively large share) do not declare their activity, that is, they are
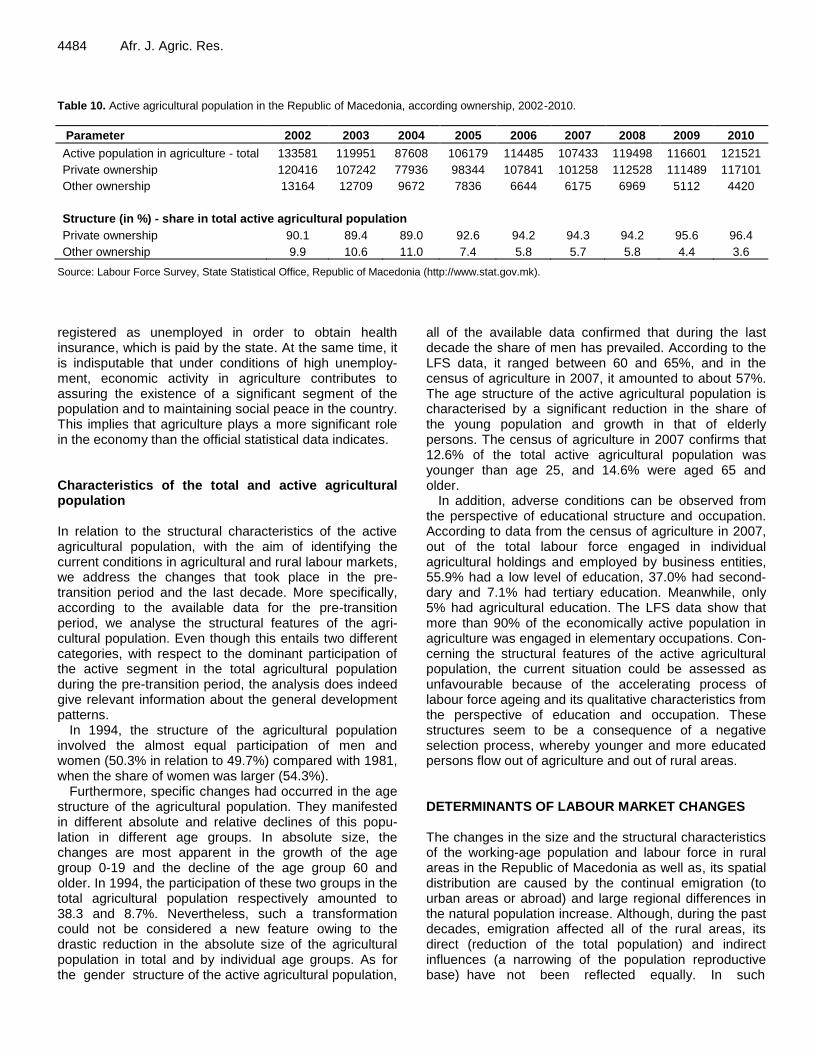
4484 Afr. J. Agric. Res. Table 10. Active agricultural population in the Republic of Macedonia, according ownership, 2002-2010.
Parameter 2002 2003 2004 2005 2006 2007 2008 2009 2010
Active population in agriculture - total 133581 119951 87608 106179 114485 107433 119498 116601 121521
Private ownership 120416 107242 77936 98344 107841 101258 112528 111489 117101
Other ownership 13164 12709 9672 7836 6644 6175 6969 5112 4420
Structure (in %) - share in total active agricultural population
Private ownership 90.1 89.4 89.0 92.6 94.2 94.3 94.2 95.6 96.4
Other ownership 9.9 10.6 11.0 7.4 5.8 5.7 5.8 4.4 3.6
Source: Labour Force Survey, State Statistical Office, Republic of Macedonia (http://www.stat.gov.mk).
registered as unemployed in order to obtain health insurance, which is paid by the state. At the same time, it is indisputable that under conditions of high unemploy-ment, economic activity in agriculture contributes to assuring the existence of a significant segment of the population and to maintaining social peace in the country. This implies that agriculture plays a more significant role in the economy than the official statistical data indicates. Characteristics of the total and active agricultural population In relation to the structural characteristics of the active agricultural population, with the aim of identifying the current conditions in agricultural and rural labour markets, we address the changes that took place in the pre-transition period and the last decade. More specifically, according to the available data for the pre-transition period, we analyse the structural features of the agri-cultural population. Even though this entails two different categories, with respect to the dominant participation of the active segment in the total agricultural population during the pre-transition period, the analysis does indeed give relevant information about the general development patterns.
In 1994, the structure of the agricultural population involved the almost equal participation of men and women (50.3% in relation to 49.7%) compared with 1981, when the share of women was larger (54.3%).
Furthermore, specific changes had occurred in the age structure of the agricultural population. They manifested in different absolute and relative declines of this popu-lation in different age groups. In absolute size, the changes are most apparent in the growth of the age group 0-19 and the decline of the age group 60 and older. In 1994, the participation of these two groups in the total agricultural population respectively amounted to 38.3 and 8.7%. Nevertheless, such a transformation could not be considered a new feature owing to the drastic reduction in the absolute size of the agricultural population in total and by individual age groups. As for the gender structure of the active agricultural population,
all of the available data confirmed that during the last decade the share of men has prevailed. According to the LFS data, it ranged between 60 and 65%, and in the census of agriculture in 2007, it amounted to about 57%. The age structure of the active agricultural population is characterised by a significant reduction in the share of the young population and growth in that of elderly persons. The census of agriculture in 2007 confirms that 12.6% of the total active agricultural population was younger than age 25, and 14.6% were aged 65 and older.
In addition, adverse conditions can be observed from the perspective of educational structure and occupation. According to data from the census of agriculture in 2007, out of the total labour force engaged in individual agricultural holdings and employed by business entities, 55.9% had a low level of education, 37.0% had second-dary and 7.1% had tertiary education. Meanwhile, only 5% had agricultural education. The LFS data show that more than 90% of the economically active population in agriculture was engaged in elementary occupations. Con-cerning the structural features of the active agricultural population, the current situation could be assessed as unfavourable because of the accelerating process of labour force ageing and its qualitative characteristics from the perspective of education and occupation. These structures seem to be a consequence of a negative selection process, whereby younger and more educated persons flow out of agriculture and out of rural areas. DETERMINANTS OF LABOUR MARKET CHANGES The changes in the size and the structural characteristics of the working-age population and labour force in rural areas in the Republic of Macedonia as well as, its spatial distribution are caused by the continual emigration (to urban areas or abroad) and large regional differences in the natural population increase. Although, during the past decades, emigration affected all of the rural areas, its direct (reduction of the total population) and indirect influences (a narrowing of the population reproductive base) have not been reflected equally. In such

circumstances, both components of population growth – a natural increase and migration movements (internal and external) – are the basic determinants of the current conditions of the labour market in rural areas. The major changes of the fertility rate during the last two decades have caused an enormous reduction in the natural increase in population in the Republic of Macedonia. In the period 1994 to 2010, it was reduced by more than three times (from 15,772 to 5,183) and the rate of the natural population increase declined from 8.1 to only 2.5 per 1,000 persons. In absolute size, the natural population increase was drastically reduced in all areas of the country, including the high fertility areas, which in great part are rural. The natural population movements in the Republic of Macedonia are characterised by a large degree of heterogeneity and regional differences. In 2010, the natural population increase rates were highest in the Skopje and Polog statistical regions, where the majority or 85% of the total natural increase in the country occurred. The relatively large growth of the population in some municipalities of Skopje and Polog, as well as, in the Southwest statistical region is still under the influence of a high rate of increase in the natural population, although, a great number of them include migratory areas. These three statistical regions represent the areas where the largest part of the rural population is concentrated. The total fertility rate shows that during the last years, the reproduction of the population, in the sense of a renewal of the generations has not taken place in any of the statistical regions. Moreover, a gradual reduction of the working-age population can be expected, along with that of the labour force in rural areas in the aforementioned three statistical regions. The degree of the reduction will mainly be determined by the extent of emigration movements abroad.
The intensity of rural-urban migration has declined significantly since 1990 compared with previous decades, particularly, the period of 1961 to 1971 when this kind of migration reached its culmination. This trend started in the second half of 1980s and coincided with growing rates of emigration abroad. Net migration (calculated by a vital-statistics method) shows that in the period 1981 to 1994, rural areas lost more than 130,000 inhabitants, while positive net migration in urban areas amounted to only 2,640 persons. This means that the greatest part of the rural population departing villages chose to migrates abroad (Dimitrieva et al., 2000). The available data confirmed that in the first half of the 1990s, the volume of rural-urban migration recorded was very small
10. This
trend continued during the next few years until 1996. Data from regular statistical research of immigrants and emigrants showed that the negative net migration of rural areas amounted to about 1,000 persons. Rural-urban migration since 1996 has been substantially different, mainly because of the aforementioned changes in
9In the period 1990-1994, the negative net migration (annual average) of rural areas amounted to 1,468 persons.
Janeska and Bojnec 4485 territorial organisation and the identification of rural and urban settlements. Available data for the period of 2006 to 2010 confirmed a similar trend and intensity of rural-urban migrations as that recorded in the first half of the 1990s.
With respect to the influence of migration on changes in the rural labour market, as well as, the existing size and structural characteristics of the labour force and available human resources, emigration abroad has played a crucial role. During the last two decades, it has reached a very high scale. In the absence of precise information based on numerous domestic and foreign data sources, it can be estimated that 150,000 to 200,000 persons have left the Republic of Macedonia. Namely, the population census of 1994 registered 173,611 Macedonian citizens abroad, out of which 45,888 persons had left the country in the period of 1990 to 1994 (SSORM, 1994). Since 1994, the migration of Macedonian citizens to European Union (EU) countries has continued, which from the period of 2001 to 2010, has amounted to more than 10,000 persons per year (Eurostat, 2011). At the same time significant have been emigration flows of Macedonian citizens to the overseas countries such as the United States, Canada and Australia. Emigration has been especially intense from rural areas in the Polog and Southwest statistical regions. POLICY PRACTICES AND POLICY IMPLICATIONS
Based on the size and the structural features of the labour force (particularly of unemployed persons) and the inactive population, one can conclude that in rural areas in the Republic of Macedonia, there are still significant available human resources. Yet, if we bear in mind the territorial distribution of the total rural population, then, the majority of these resources are concentrated in three regions. This means that to a greater or lesser degree, an appropriate labour force is lacking in a majority of the agricultural areas of the country. This is consistent with the findings by Rizov and Swinnen (2004) on human capital, market imperfections and labour reallocation, also for other transition countries. Consequently, today a large part of the agricultural and arable land remains under-cultivated or uncultivated. With respect to the structural features of the available human resources, the situation of the labour force and the share of working-age population (15 to 64) among the inactive population are quite different. Most of the labour force consists of a young male population with a relatively unfavourable educational structure. At the same time, the greatest share of the inactive population and its potential human resources consists of a relatively young female popu-lation with a very unfavourable educational structure.
The key policy challenges regarding the rural labour market developments in the Republic of Macedonia are also similar to some other countries in terms of aban-doned villages, decrease in the total rural population and

4486 Afr. J. Agric. Res.
the process of demographic ageing in the majority of the rural settlements, particularly in agricultural regions (Bojnec, 2011). In addition, there are differences in de-mographic and economic trends by regions. The highest concentration of the rural population and labour force is particularly in two regions. Yet, there is limited access to social assistance and insurance benefits in rural areas owing to a higher exposure of rural population at the risk-of-poverty and social exclusion.
During the last decade, a considerable number of policy documents, strategies, action plans and program-mes were officially adopted in order to challenge the rural labour market developments. In 2007, the Strategy for Agriculture and Rural Development 2007 to 2013 was adopted by the Government (MAFWE, 2011a, 2011b). This established the basis for creating operational plans, including the EU accession Instrument for Pre-Accession Assistance for Rural Development (IPARD). Within the Development Plan 2008 to 2013, there is a chapter 7 on Agricultural and Rural Development, including main aims and measures with expected direct or indirect impacts on the rural economic and labour market developments, the labour force education and transfer of knowledge.
In 2009, the Strategy for Regional Development of the Republic of Macedonia 2009 to 2019 was adopted. Significant attention is devoted to the rural development (MLSG, 2009). The Strategic goal 2 (higher demographic, economic, social and spatial cohesion between and within the regions) in the priority 2.1 (demographic revi-talisation and more balanced population distribution between and within the regions) and the priority 2.3 (increase and more balanced distribution of investments and employment between and within the regions), a considerable attention devoted to the measures that are related to the development of rural areas facing the de-population, population and labour force ageing, a relatively low educational level of the labour force, poor infrastructure development, lack of investments and similar shortcomings in rural development.
In 2011, the Programme for Implementation of the Decentralization Process and Local Self-Government Development in the Republic of Macedonia 2011 to 2014 was adopted (MLSG, 2011). In this document, there are set of measures and activities important for the rural development, such as: institutional re-engineering and establishment of a sustainable system of capacity building at the local level (including rural areas) as well as, development of indicators for measurement of local service quality delivery.
The Macedonian practical policy experience and its policy responses and measures towards the rural development and improvements of the rural labour market situation have been limited to the most recent years. In the implementation, a majority of the proposed measures have been either held back owing from a lack of financial resources or have been lagging behind.
Therefore, it would be desirable by the government to improve budget programming to ensure timely and
purposeful allocation of the anticipated budget resources for the implementation of the strategic documents. In addition, it would require strengthening the fund-raising capacities at national level, given the fact that the usage of EU and other foreign funds available to Republic of Macedonia have been negligible. At the same time, it would require strengthening the coordination activities at the national level in order to improve effectiveness in policy making in terms of implementation policy mea-sures, and particularly, monitoring and evaluation of the programme outcomes. The government can also contribute to mitigation of the negative consequences of emigration on the rural labour market developments to provide investment funds for improvements of the economic and infrastructural development in rural areas; to improve the access to social, health and education services in rural areas; and to promote investments for rural development.
The IPARD funds measures and policies provide an additional opportunity for rural development (Angelovska and Bojnec, 2011; Petroska Angelovska et al., 2012). The EU funds should be used to support the implementation of the policies, measures and activities envisaged within the adopted strategic documents in the domain of the rural and agricultural development. In 2009, the Republic of Macedonia accredited the IPARD programme. In the period 2009 to 2011, there has only been for 1.4 million euro realised investments for the agricultural development by 125 concluded contracts. Considering that 40 million euro were available, this means that only 3.5% of them were used (Kapital, 2012). The Agency for financial support of the agriculture has conducted advertisements and publications of the opportunities for the IPARD funds measures for farmer‟s and companies, the great majority of the available IPARD funds have remained unused. Among the main reasons for a very low utilisation rate of the available IPARD funds are unresolved legal-property relations in rural areas, a weak financial support of the banks for funding invest-ment projects, a relatively small-scale and fragmented land structure of farms and a lack of interest by the farmers. In addition, the companies and farmers are also not familiar with the possibilities for using IPARD funds, while the application process is a very complex. CONCLUSION
Human resource management is important for the development of agriculture and the rural economy. This analysis of the quantitative and qualitative characteristics of the human resources in rural areas and agriculture in the Republic of Macedonia shows that during the last two decades, which coincide with the period of transition, significant changes have occurred. These can be explained by the continued trend of emigration from villages to urban areas and abroad, especially, from traditional areas of emigration. The emigration was
initially stimulated by economic conditions, stemming from the inadequate treatment of the agricultural sector and the development of villages. The extent of emigration has directly or indirectly influenced changes in the demographic structure of the population, especially, the reduction of the reproductive base of the rural population, along with that of the agricultural population and the labour force in all of the regions, except the statistical regions of Polog and Southwest.
The evidence and information gathered from the analysis of the rural and agricultural population, espe-cially, the size and the characteristics of the labour force in agriculture led to the conclusion that the Republic of Macedonia has disposed a certain kind of human potential. With a view to determining of the optimal use of natural resources and developing agricultural sector judging by its qualitative characteristics, the labour force can be regarded as insufficient in a majority of the agricultural regions. This implies a rural and agricultural labour market mismatch. In many rural areas, the lack of labour force presents a serious limiting factor in the development of agricultural production. In that sense, there is an evident tendency towards a worsening imbalance between the two basic factors of agricultural production: the land that has the natural potential and the asymmetric concentration of the rural and agricultural population, as well as the available labour force. As for the characteristics of the labour force and their influence on development, the reduction of the participation of women in the agricultural labour force can be seen as a new feature. Yet, this change remains in the shadow of an unfavourable age and educational structure, as well as, the adverse spatial distribution of the total labour force. For market-oriented agricultural production, a significant factor is the level of education of farmers. In that regard, maximal consideration should be given to the registered unemployed who are agricultural experts and faculty degree-educated persons, whose number in the country is not small.
Looking at the aspect of the qualitative changes in human resources in agriculture, the transformation that has occurred in the income structure of rural households should be highlighted. Concerning income sources, there has been an increase in the share of mixed households and especially, in that of households that receive remittances and foreign currency funds from family members who are abroad. This is especially charac-teristic for the Polog and Southwest statistical regions where a significant share of the rural population is concentrated. In these areas, the percentage of purely agricultural households is smaller and at the same time, the inflows of remittances are significant, owing to the higher degree of emigration abroad.
A precondition for the rational use of the labour force and the achievement of intensive agricultural production is a change in the structure of agricultural holdings accor-ding to the size of the asset. Significant improvements
Janeska and Bojnec 4487 are also necessary in the functioning of market institu-tions to meet the needs of smaller farmers. Small and fragmented assets are limiting factor for the appropriate economic use of the labour force, as well as, the use of modern mechanisation. Experience shows that the assets not smaller than 5 ha are the minimum required for a size of production units capable of larger market production, full employment and the creation of income that will completely satisfy the needs of the rural house-hold. According to the census of agriculture in 2007, of the total 192,378 agricultural holdings of 43.4% had up to 0.5 ha, and 20.1% had 0.5 to 1 ha of agricultural land. Only 9,737 or 4.1% of the agricultural holdings had more than 5 ha (SSORM, 2007). Taking into consideration that the quality of human capital is one of the most important factors for efficient agricultural development, the existing situation in the Republic of Macedonia requires a greater focus of attention on the human resources in this sector. For changes in a positive direction, a demographic and economic revitalisation of rural areas is necessary. Amid the conditions of social and economic transformation, and the implications of the long-term economic crisis, during the 1990s there was a significant increase in interest among urban citizens in migrating (or returning) to rural areas. Yet this interest was not adequately capitalised upon to accelerate a revitalisation of rural areas. ACKNOWLEDGEMENTS This paper is a result of a research conducted within the project Factor Markets: Comparative Analysis of Factor Markets for Agriculture across the Member States, 245123-FP7-KBBE-2009-3 (Janeska and Bojnec, 2011). The authors wish to thank the anonymous journal reviewers for useful comments on the previous version of this paper. All views expressed are those by the authors. REFERENCES Abele S, Frohberg K (2003). Subsistence Agriculture in Central and
Eastern Europe: How to Break the Vicious Circle? Studies on the Agricultural and Food Sector in Central and Eastern Europe 22. Halle (Saale): Institute of Agricultural Development in Central and Eastern Europe IAMO. p.233 ISBN 3-9809270-2-4.
Angelova B, Bojnec Š (2011). Developments in the agricultural and rural capital market of the Former Yugoslav Republic of Macedonia. Factor Markets Working Paper No. 9, Centre for European Policy Studies, Brussels.
Bojnec Š (2011). Agricultural and rural labour markets in the EU candidate countries of Croatia, Former Yugoslav Republic of Macedonia and Turkey, Factor Markets Working Paper No. 6. Brussels: Centre for European Policy Studies.
Bojnec Š, Dries L (2005). Causes of changes in agricultural employment in Slovenia: Evidence from micro-data. J. Agric. Econ. 56(3):399-416.
Dimitrieva E, Janeska V, Hinic B (2000). Les mouvements migratoires (internes et internationaux) et la répartition spatiale de la population dans l'ancienne République Yougoslave de Macédoine, Mouvements migratoires et la répartition spatiale de la population, La démographie des Balkans (Edité par: Byron Kotzamanis). Thessalie: Université de

4488 Afr. J. Agric. Res.
Thessalie - Université de Macédoine Réseau DémoBalk pp.46-77. Eurostat (2011). Population by sex, age and citizenship (migr_pop1ctz).
in: http://epp.eurostat.ec.europa.eu. Grgić I, Žimbrek T, Tratnik M, Markovina J, Juračak J (2010). Quality of
life in rural areas of Croatia: To stay or to leave? Afr. J. Agric. Res. 5(8):653-660.
Hanson R (1996). Family farm structure and market orientation in the Republic of Macedonia. Madison, WI, USA, Dep. of Agricultural Economics, University of Wisconsin (Thesis).
Jajri I, Ismail R (2010). Impact of labour quality on labour productivity and economic growth. Afr. J. Bus. Manag. 4(4):486.
Jakimovski J (2002). Rural development: does Macedonia need a new approach. Paper prepared for a presentation at the Xth EAAE Congress “Exploring Diversity in the European Agri-Food System”, Zaragoza, 28-31 August 2002.
Janeska V, Bojnec Š (2011). Rural labour market developments in the Former Yugoslav Republic of Macedonia. Factor Markets Working Paper No. 5, Centre for European Policy Studies, Brussels.
Kapital (2012). http://www.kapital.mk, 14 March 2011. Kongolo M (2010). Job creation versus job shedding and the role of
SMEs in economic development. Afr. J. Bus. Manag. 4(11):2288-2295.
Macours K, Swinnen JFM (2008). Rural poverty in transition countries. World Dev. 36(11):2170-2187.
Micevska M (2008). The labour market in Macedonia: a labour demand analysis. Labour 22(2):345-368.
Ministry for Local Self-government of the Republic of Macedonia (MLSG) (2009). Strategy for Regional Development of the Republic of Macedonia 2009-2019, Official Gazette of the Republic of Macedonia No. 119/09, Skopje.
Ministry for Local Self-government of the Republic of Macedonia (MLSG) (2011). Programme for Implementation of the Decentralisation Process and Local Self-Government Development in the Republic of Macedonia 2011-2014, Skopje (http://wwwmls.gov.mk).
Ministry of Agriculture, Forestry and Water Economy (MAFWE) (2011b). Strategy for agriculture and Rural Development 2007-2013, Skopje.
Ministry of Agriculture, Forestry and Water Economy of the Republic of Macedonia (MAFWE) (2011a). Report on the Agriculture and Rural Development 2010 (supported by USAID), Skopje.
Penev G, Tomic D (1986). The evolution of the agricultural population in the regions of Yugoslavia in relation to economic development, Demografska sveska 13. Belgrade: Center for demographic research, Institute of social science of the University of Belgrade p. 40.
Petrick M, Weingarten P (ed.) (2004). The Role of Agriculture in Central and Eastern European Rural Development: Engine of Change or Social Buffer? Studies on the Agricultural and Food Sector in Central and Eastern Europe 25. Halle (Saale): Institute of Agricultural Development in Central and Eastern Europe IAMO p. 426.
Petroska Angelovska N, Ackovska M, Bojnec Š (2012). Agricultural land markets and land leasing of the Former Yugoslav Republic of Macedonia. Factor Markets Working Paper No. 11, Centre for European Policy Studies, Brussels.
Rizov M, Swinnen JFM (2004). Human capital, market imperfections,
and labor reallocation in transition. J. Comp. Econ. 32(4):745-774. Sapsford D, Tzannatos Z (1993). The Economics of the Labour Market.
London: Macmillan. Schultz TW (1945). Agriculture in an Unstable Economy. New York:
McGrawHill. P.299 State Statistical Office of the Republic of Macedonia (SSORM) (1953, 1961, 1971, 1981, 1994, 2002). Population Censuses 1953, 1961, 1971, 1981, 1994, 2002. Skopje: State Statistical Office of the Republic of Macedoni
State Statistical Office of the Republic of Macedonia (SSORM) (2005, 2006, 2007, 2008, 2009, 2010, 2011). Labour Force Survey 2004, 2005, 2006, 2007, 2008, 2009, 2010. Skopje: State Statistical Office of the Republic of Macedonia.
State Statistical Office of the Republic of Macedonia (SSORM) (2007). Census of Agriculture 2007. Skopje: State Statistical Office of the Republic of Macedonia.
State Statistical Office of the Republic of Macedonia (SSORM) (2011a). Natural Population Change. Statistical Review: Population and Social Statistics, No. 2.4.11.10 /693. Skopje: State Statistical Office of the Republic of Macedonia.
State Statistical Office of the Republic of Macedonia (SSORM) (2011b). Statistical Review: Population and Social Statistics, No. 2.4.11.14 / 697. Skopje: State Statistical Office of the Republic of Macedonia.
Swinnen J, Dries L, Macours K (2005). Transition and agricultural labour. Agric. Econ., 32(1): 15-34.
Swinnen JFM, Van Herck K (2009). Agricultural Aspects of Accession to the European Union: Lessons from the EU New Member States and implications for the Former Yugoslav Republic of Macedonia. Report prepared for UNDP. Leuven: LICOS Centre for institutions and Economic Performance, University of Leuven & Brussels: Centre for European Policy Studies.
Todaro MP, Smith SC (2003). Economic Development, 8th edition, Pearson.
Todorov K, Vittuari M (2010). Towards a shift from agricultural to rural development policy. The case of the Republic of Macedonia. European Association of Agricultural Economists 118th Seminar, August 25-27, 2010, Ljubljana, Slovenia. http://purl.umn.edu/94898.
United Nations Development Programme (UNDP) (2004). Mapping of the socio-economic disparities among Macedonian municipalities. Skopje: State Statistical Office, Ministry for Local Self-government, UNDP.