Embed Size (px)
Citation preview
STATE OF MICHIGAN
Department of State Police and
Department of Management and Budget
2011 Model Year Police Vehicle
Evaluation Program
Published by: Michigan State Police Precision Driving Unit
November, 2010
Prepared by: Ms. Sheila Cowles, Michigan State Police
Photographs by: Mr. Ray Holt, Michigan State Police
TABLE OF CONTENTS
SECTIONS PAGE
Preface.......................................................................................................................................... 1
Acknowledgements ..................................................................................................................... 3
Test Equipment ............................................................................................................................ 4 Police Package Vehicle Descriptions
Police Package Vehicle Photographs and Descriptions ................................................................. 5
Police Package Vehicle Descriptions Summary ............................................................................20
Competitive Evaluation
Vehicle Dynamics Testing
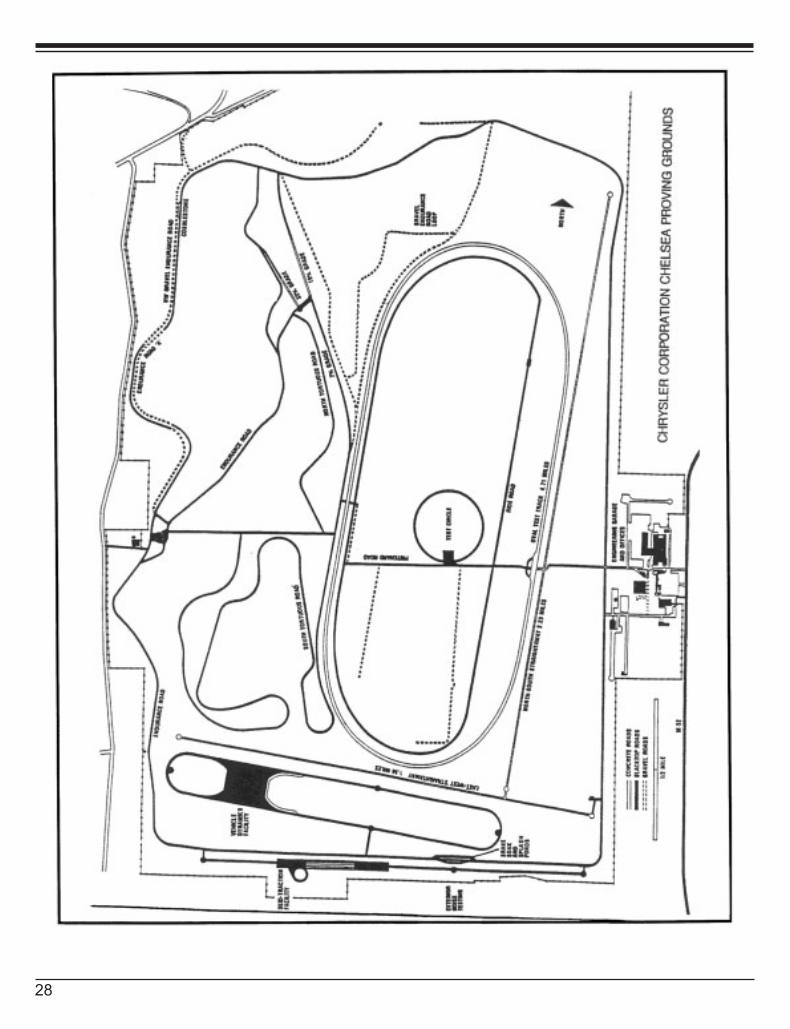
Test Objective and Methodology ...................................................................................................22 Test Facility Diagram ....................................................................................................................23
Test Data ......................................................................................................................................24
Comparison Chart .........................................................................................................................26
Acceleration, Top Speed and Brake Testing
Acceleration and Top Speed Test Objectives and Methodology....................................................27 Test Facility Diagram ....................................................................................................................28
Acceleration and Top Speed Data.................................................................................................29
Summary of Acceleration and Top Speed .....................................................................................34
Acceleration and Top Speed Test Data Comparison Charts .........................................................36 Brake Test Objectives and Methodology .......................................................................................38
Brake Test Data ............................................................................................................................39
Brake Test Data Comparison Chart ..............................................................................................45
Ergonomics and Communications Evaluation
Test Objective and Methodology ...................................................................................................46
Test Data ......................................................................................................................................47 Test Data Comparison Chart.........................................................................................................48
Fuel Economy Test Objective and Methodology ...................................................................................................49
Test Data ......................................................................................................................................49
Test Data Comparison Chart.........................................................................................................50
Scoring and Bid Adjustment Methodology ...............................................................................51
Performance Comparison of 2010-2011 Test Vehicles.............................................................53
Motorcycle Performance Data, Description, and Photographs................................................61
About the National Institute of Justice, the Law Enforcement and Corrections
Standards and Testing Program, the Law Enforcement and Corrections Technology
Center System, and the Office of Law Enforcement Standards...............................................81
1
1
PREFACE
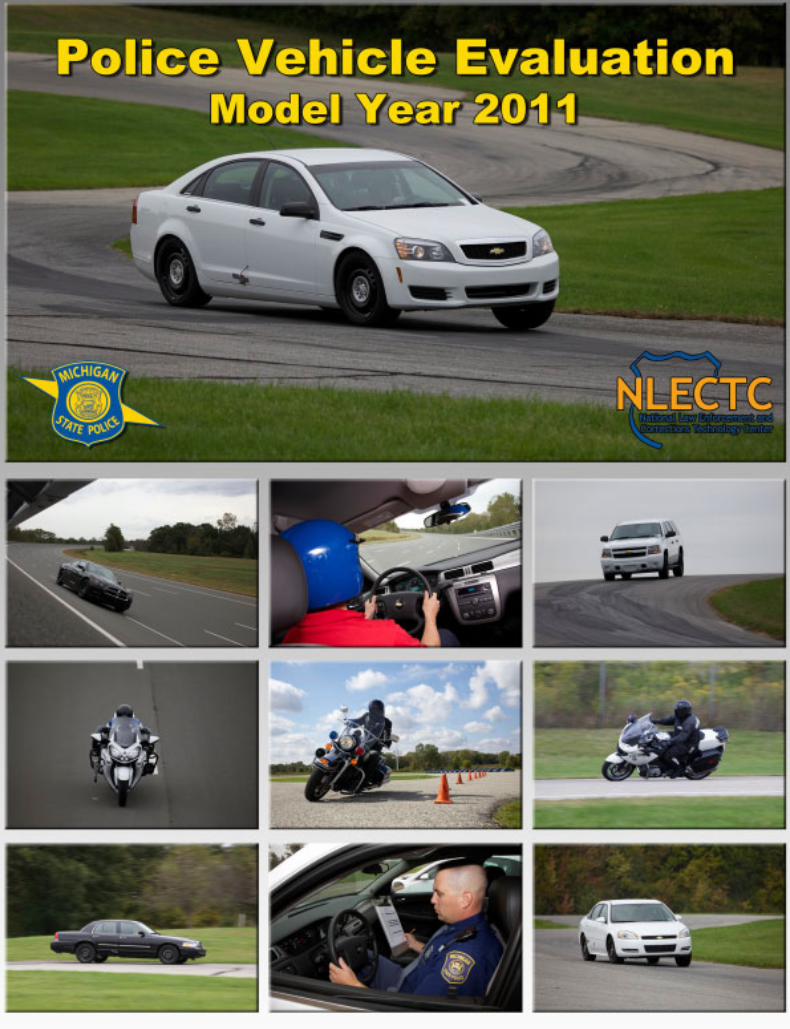
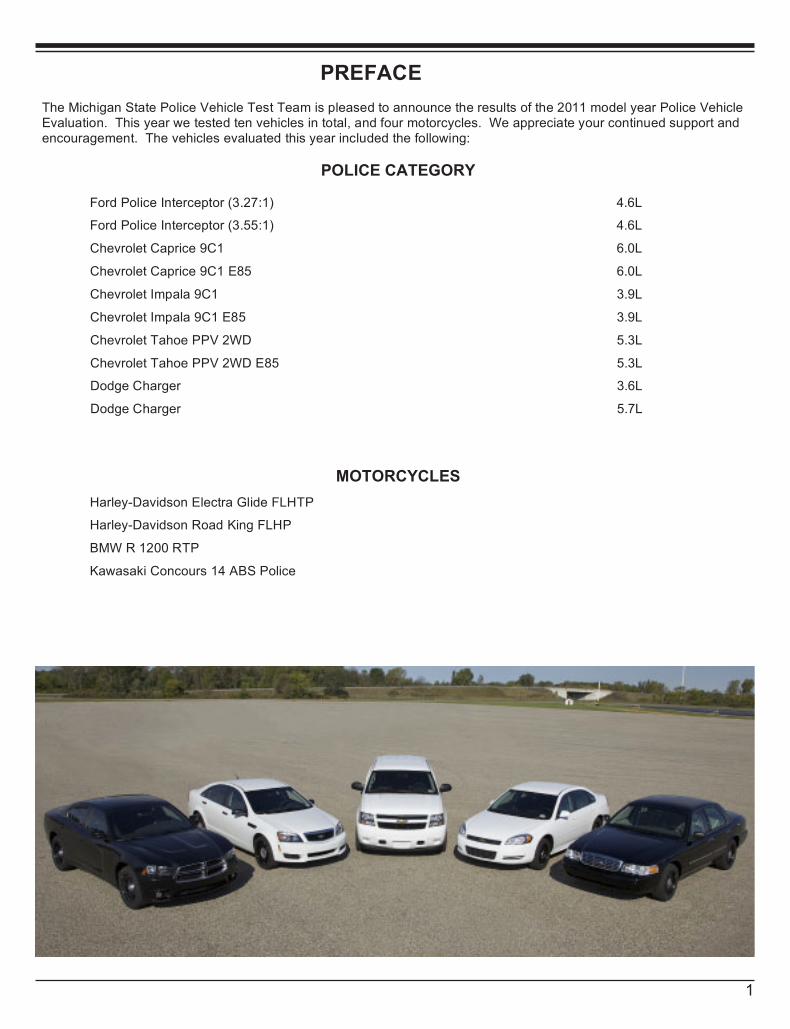
The Michigan State Police Vehicle Test Team is pleased to announce the results of the 2011 model year Police Vehicle Evaluation. This year we tested ten vehicles in total, and four motorcycles. We appreciate your continued support and encouragement. The vehicles evaluated this year included the following:
POLICE CATEGORY
Ford Police Interceptor (3.27:1) 4.6L
Ford Police Interceptor (3.55:1) 4.6L
Chevrolet Caprice 9C1 6.0L
Chevrolet Caprice 9C1 E85 6.0L
Chevrolet Impala 9C1 3.9L
Chevrolet Impala 9C1 E85 3.9L
Chevrolet Tahoe PPV 2WD 5.3L
Chevrolet Tahoe PPV 2WD E85 5.3L
Dodge Charger 3.6L
Dodge Charger 5.7L
MOTORCYCLES
Harley-Davidson Electra Glide FLHTP
Harley-Davidson Road King FLHP
BMW R 1200 RTP
Kawasaki Concours 14 ABS Police
2
2
GENERAL INFORMATION All of the cars were tested with a clean roof (no overhead light or lightbar) and without “A” pillar mount spotlights. We believe this is the best way to ensure all of the vehicles are tested on an equal basis. Remember that once overhead lights, spotlights, radio antennas, sirens, and other emergency equipment are installed, overall performance may be somewhat lower than we report. Each vehicle was tested with the tires that are available as original equipment on the production model. Specific tire information for each vehicle is available in the Vehicle Description portion of this report. All vehicles listed in this report were equipped with electronic speed limiters. Motorcycles were tested with equipment installed as provided by their respective manufacturer. Harley-Davidson chose to test their bikes with minimal equipment. BMW and Kawasaki chose to test their bike with the majority of the equipment installed.
Chrysler Proving Grounds - Acceleration, Top Speed, & Braking Tests We had a full line up of test vehicles. We would like to thank Mr. Craig Hageman for the assistance we received from the staff at the Chrysler Proving Grounds. We experienced a rain delay during this portion of testing. It was suspended from 9:15 am until 12:40 pm. However, all portions were completed by the end of the day.
We appreciate the support we received from General Motors, Ford, Chrysler, Harley-Davidson, BMW and Kawasaki Motors Corp. during testing. This also was the fourth year of motorcycle testing and we continue to get great feedback on this important component to the testing lineup. We expect other manufacturers that produce law enforcement motorcycles to participate in the future.
Michigan State Police Precision Driving Unit- Motorcycle DynamicsSunday we completed the motorcycle dynamics testing with cool temperatures. This portion of the testing continues to grow. We had a large audience of observers, all interested in the new products being tested.
Grattan Raceway - Vehicle Dynamics (High Speed Handling) Test The weather was great and all the dynamics tests were completed. The vehicles were loaded up and returned to the Precision Driving Unit where they were made ready for the Ergonomics portion of the test.
After the second series of laps the Chevrolet Caprice 9C1 (regular fuel) was examined by GM personnel as the drivers expressed concern regarding the vehicles ability to remain stable while turning. The drivers experienced a floating sensation as the vehicle was driven at high speeds through various turns on the raceway. The drivers were also experiencing a noticeable vibration during heavy braking. GM engineers and technicians thoroughly checked the vehicle and found nothing of concern. While driving the Chevrolet Caprice 9C1 (regular fuel) during the third series of laps, the driver aborted the run due to a reduction of engine power. The vehicle was examined by GM engineers and technicians with no problems identified. When restarted, the vehicle returned to full power. This series of laps were run again at the end of the day to complete the test. This vehicle did not exhibit this problem again during the remainder of testing.
After a thorough post test inspection, GM engineers discovered that pre-production, hand built, proto type front struts used on the Caprice 9C1 experienced internal parts failure and the rear suspension cradle required stiffer isolation bushings. On October 7
th, the MSP Test Team met GM personnel at the Grattan Raceway for further evaluation of the
Chevrolet Caprice 9C1. With these two issues resolved, the test team found the handling of the Caprice to be much improved.
The original times posted by the Chevrolet Caprice 9C1 on test day remain as the official results. The laps driven on October 7
th were merely for determining handling issues have been resolved.
We recommend you review the information contained in this report and then apply it to the needs of your agency. This report is not an endorsement of products, but a means of learning what’s available for your officers so they can do their job effectively and safely. If anything in this report requires further explanation or clarification, please call or write.
Lt. Keith Wilson Michigan State Police, Precision Driving Unit,
7426 North Canal Road, Lansing, Michigan 48913 Phone: 517-322-1789 Fax: 517-322-0725 E-mail: [email protected]
3
3
ACKNOWLEGEMENTS
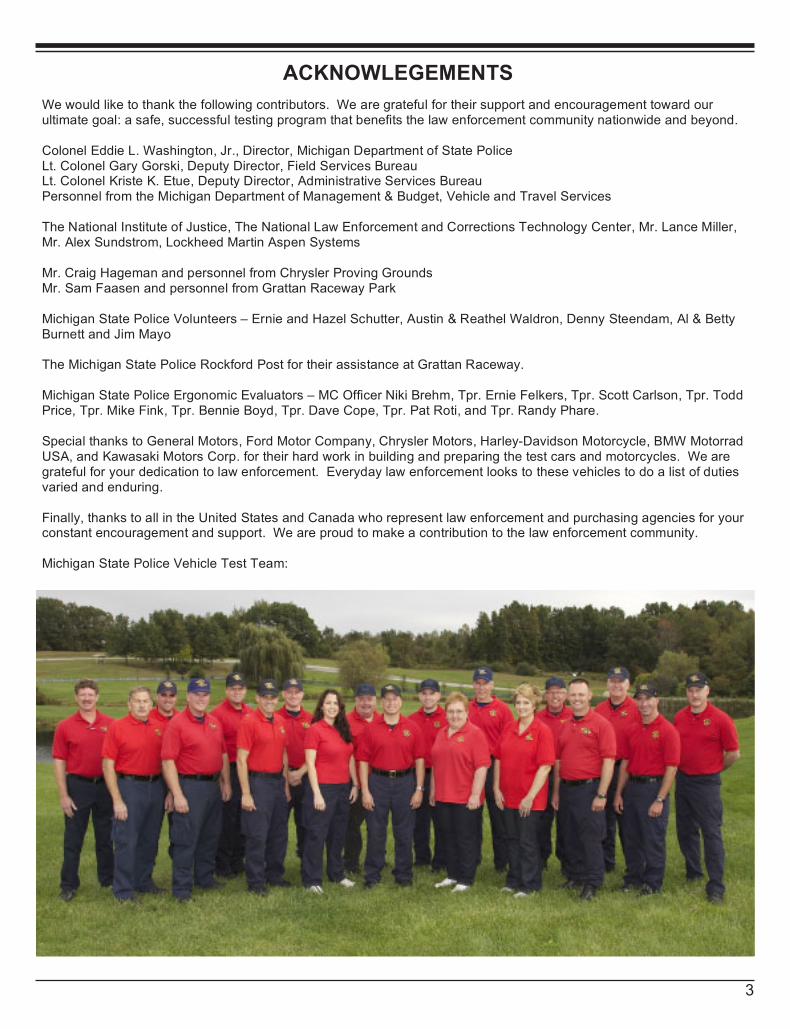
We would like to thank the following contributors. We are grateful for their support and encouragement toward our ultimate goal: a safe, successful testing program that benefits the law enforcement community nationwide and beyond. Colonel Eddie L. Washington, Jr., Director, Michigan Department of State Police Lt. Colonel Gary Gorski, Deputy Director, Field Services Bureau Lt. Colonel Kriste K. Etue, Deputy Director, Administrative Services Bureau Personnel from the Michigan Department of Management & Budget, Vehicle and Travel Services The National Institute of Justice, The National Law Enforcement and Corrections Technology Center, Mr. Lance Miller, Mr. Alex Sundstrom, Lockheed Martin Aspen Systems Mr. Craig Hageman and personnel from Chrysler Proving Grounds Mr. Sam Faasen and personnel from Grattan Raceway Park Michigan State Police Volunteers – Ernie and Hazel Schutter, Austin & Reathel Waldron, Denny Steendam, Al & Betty Burnett and Jim Mayo The Michigan State Police Rockford Post for their assistance at Grattan Raceway. Michigan State Police Ergonomic Evaluators – MC Officer Niki Brehm, Tpr. Ernie Felkers, Tpr. Scott Carlson, Tpr. Todd Price, Tpr. Mike Fink, Tpr. Bennie Boyd, Tpr. Dave Cope, Tpr. Pat Roti, and Tpr. Randy Phare. Special thanks to General Motors, Ford Motor Company, Chrysler Motors, Harley-Davidson Motorcycle, BMW Motorrad USA, and Kawasaki Motors Corp. for their hard work in building and preparing the test cars and motorcycles. We are grateful for your dedication to law enforcement. Everyday law enforcement looks to these vehicles to do a list of duties varied and enduring. Finally, thanks to all in the United States and Canada who represent law enforcement and purchasing agencies for your constant encouragement and support. We are proud to make a contribution to the law enforcement community. Michigan State Police Vehicle Test Team:
2
GENERAL INFORMATION All of the cars were tested with a clean roof (no overhead light or lightbar) and without “A” pillar mount spotlights. We believe this is the best way to ensure all of the vehicles are tested on an equal basis. Remember that once overhead lights, spotlights, radio antennas, sirens, and other emergency equipment are installed, overall performance may be somewhat lower than we report. Each vehicle was tested with the tires that are available as original equipment on the production model. Specific tire information for each vehicle is available in the Vehicle Description portion of this report. All vehicles listed in this report were equipped with electronic speed limiters. Motorcycles were tested with equipment installed as provided by their respective manufacturer. Harley-Davidson chose to test their bikes with minimal equipment. BMW and Kawasaki chose to test their bike with the majority of the equipment installed.
Chrysler Proving Grounds - Acceleration, Top Speed, & Braking Tests We had a full line up of test vehicles. We would like to thank Mr. Craig Hageman for the assistance we received from the staff at the Chrysler Proving Grounds. We experienced a rain delay during this portion of testing. It was suspended from 9:15 am until 12:40 pm. However, all portions were completed by the end of the day.
We appreciate the support we received from General Motors, Ford, Chrysler, Harley-Davidson, BMW and Kawasaki Motors Corp. during testing. This also was the fourth year of motorcycle testing and we continue to get great feedback on this important component to the testing lineup. We expect other manufacturers that produce law enforcement motorcycles to participate in the future.
Michigan State Police Precision Driving Unit- Motorcycle DynamicsSunday we completed the motorcycle dynamics testing with cool temperatures. This portion of the testing continues to grow. We had a large audience of observers, all interested in the new products being tested.
Grattan Raceway - Vehicle Dynamics (High Speed Handling) Test The weather was great and all the dynamics tests were completed. The vehicles were loaded up and returned to the Precision Driving Unit where they were made ready for the Ergonomics portion of the test.
After the second series of laps the Chevrolet Caprice 9C1 (regular fuel) was examined by GM personnel as the drivers expressed concern regarding the vehicles ability to remain stable while turning. The drivers experienced a floating sensation as the vehicle was driven at high speeds through various turns on the raceway. The drivers were also experiencing a noticeable vibration during heavy braking. GM engineers and technicians thoroughly checked the vehicle and found nothing of concern. While driving the Chevrolet Caprice 9C1 (regular fuel) during the third series of laps, the driver aborted the run due to a reduction of engine power. The vehicle was examined by GM engineers and technicians with no problems identified. When restarted, the vehicle returned to full power. This series of laps were run again at the end of the day to complete the test. This vehicle did not exhibit this problem again during the remainder of testing.
After a thorough post test inspection, GM engineers discovered that pre-production, hand built, proto type front struts used on the Caprice 9C1 experienced internal parts failure and the rear suspension cradle required stiffer isolation bushings. On October 7
th, the MSP Test Team met GM personnel at the Grattan Raceway for further evaluation of the
Chevrolet Caprice 9C1. With these two issues resolved, the test team found the handling of the Caprice to be much improved.
The original times posted by the Chevrolet Caprice 9C1 on test day remain as the official results. The laps driven on October 7
th were merely for determining handling issues have been resolved.
We recommend you review the information contained in this report and then apply it to the needs of your agency. This report is not an endorsement of products, but a means of learning what’s available for your officers so they can do their job effectively and safely. If anything in this report requires further explanation or clarification, please call or write.
Lt. Keith Wilson Michigan State Police, Precision Driving Unit,
7426 North Canal Road, Lansing, Michigan 48913 Phone: 517-322-1789 Fax: 517-322-0725 E-mail: [email protected]
4
4
TEST EQUIPMENT
The following test equipment is utilized during the acceleration, top speed, braking, and vehicle dynamics portion of the evaluation program.
Corrsys Datron a Kistler Company 39205 Country Club Dr. Suite C20, Farmington Hills, Mi 48331
DLS Smart Sensor – Optical non-contact speed and distance sensor Correvit L-350 1 Axis Optical Sensor
Shoei Helmets, 3002 Dow Ave., Suite 128, Tustin, CA 92780 Law Enforcement Helmet – Model RJ-Air LE Motorcycle Helmet – Multi Tech
AMB i.t. US INC., 1631 Phoenix Blvd., Suite 11, College Park, GA 30349 AMB TranX extended loop decoder Mains adapter 230 V AC/12 V DC AMB TranX260 transponders
AMMCO TOOLS, Inc., 2100 Commonwealth Ave., North Chicago, IL 60064 Decelerometer, Model 7350
5
5
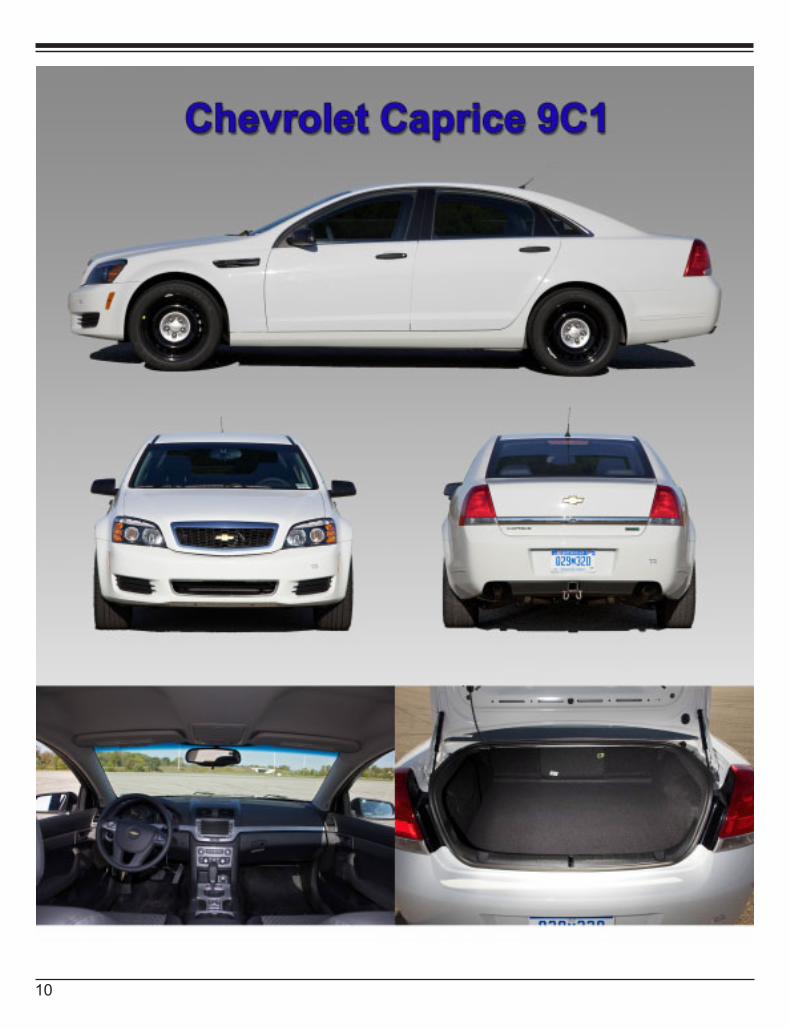
TEST VEHICLE DESCRIPTIONS AND PHOTOGRAPHS
6
7
7
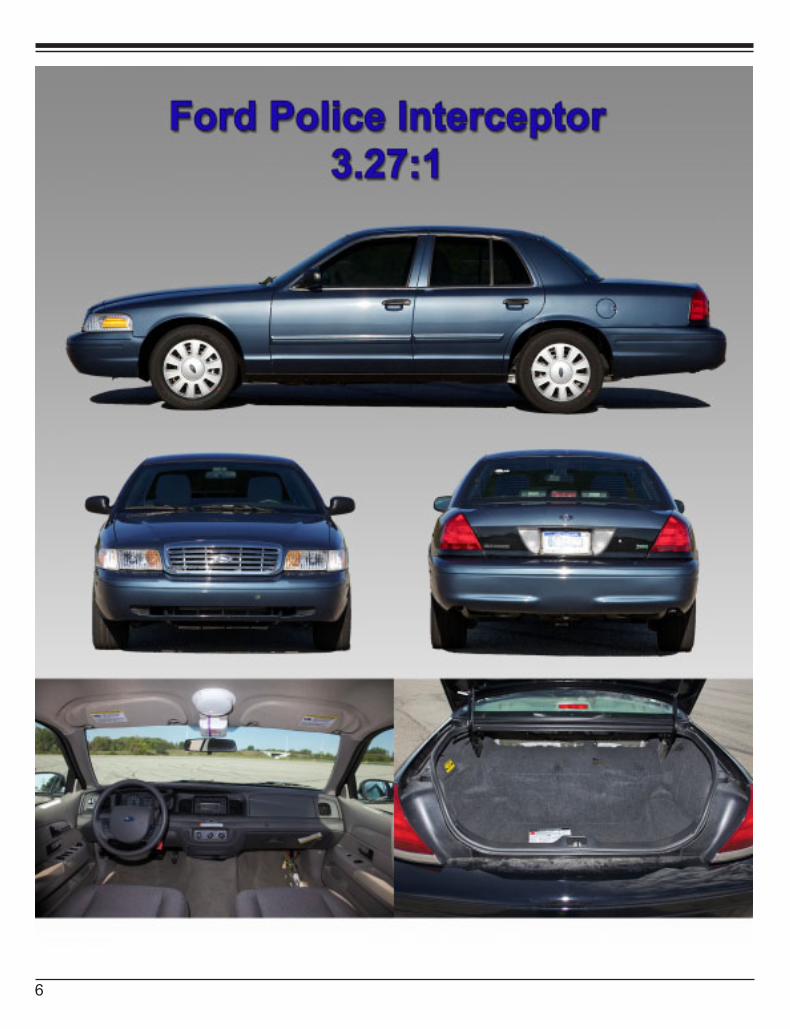
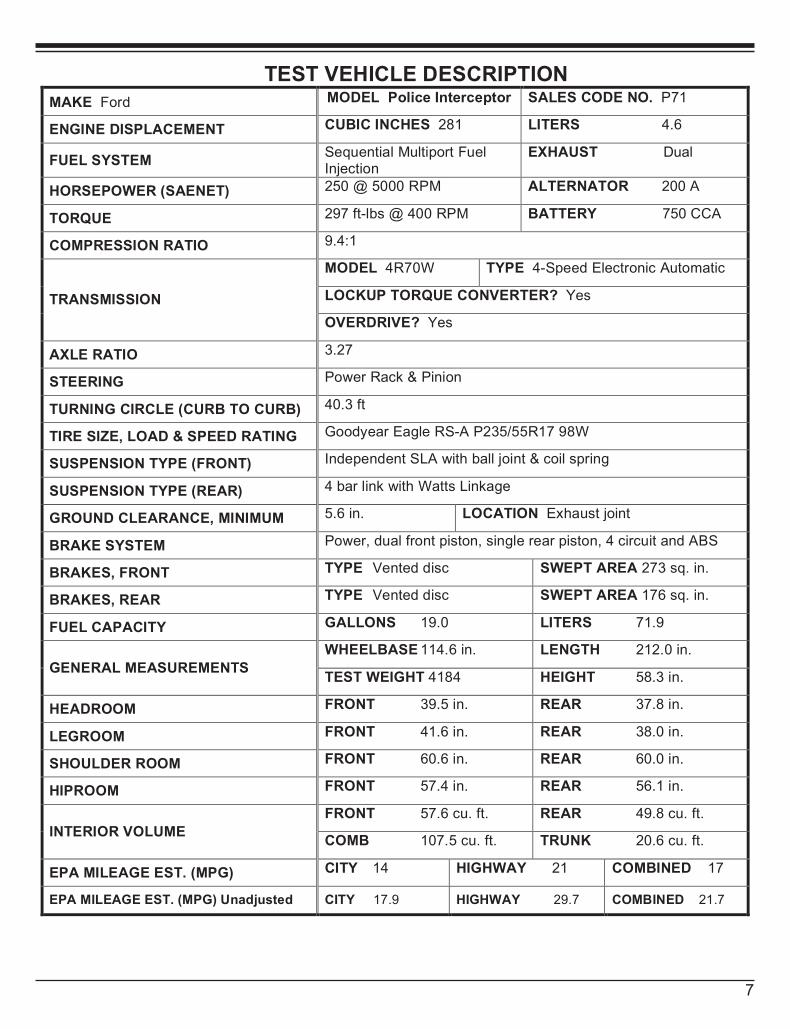
TEST VEHICLE DESCRIPTION MAKE Ford MODEL Police Interceptor SALES CODE NO. P71
ENGINE DISPLACEMENT CUBIC INCHES 281 LITERS 4.6
FUEL SYSTEM Sequential Multiport Fuel Injection
EXHAUST Dual
HORSEPOWER (SAENET) 250 @ 5000 RPM ALTERNATOR 200 A
TORQUE 297 ft-lbs @ 400 RPM BATTERY 750 CCA
COMPRESSION RATIO 9.4:1
MODEL 4R70W TYPE 4-Speed Electronic Automatic
LOCKUP TORQUE CONVERTER? Yes TRANSMISSION
OVERDRIVE? Yes
AXLE RATIO 3.27
STEERING Power Rack & Pinion
TURNING CIRCLE (CURB TO CURB) 40.3 ft
TIRE SIZE, LOAD & SPEED RATING Goodyear Eagle RS-A P235/55R17 98W
SUSPENSION TYPE (FRONT) Independent SLA with ball joint & coil spring
SUSPENSION TYPE (REAR) 4 bar link with Watts Linkage
GROUND CLEARANCE, MINIMUM 5.6 in. LOCATION Exhaust joint
BRAKE SYSTEM Power, dual front piston, single rear piston, 4 circuit and ABS
BRAKES, FRONT TYPE Vented disc SWEPT AREA 273 sq. in.
BRAKES, REAR TYPE Vented disc SWEPT AREA 176 sq. in.
FUEL CAPACITY GALLONS 19.0 LITERS 71.9
WHEELBASE 114.6 in. LENGTH 212.0 in. GENERAL MEASUREMENTS
TEST WEIGHT 4184 HEIGHT 58.3 in.
HEADROOM FRONT 39.5 in. REAR 37.8 in.
LEGROOM FRONT 41.6 in. REAR 38.0 in.
SHOULDER ROOM FRONT 60.6 in. REAR 60.0 in.
HIPROOM FRONT 57.4 in. REAR 56.1 in.
FRONT 57.6 cu. ft. REAR 49.8 cu. ft. INTERIOR VOLUME
COMB 107.5 cu. ft. TRUNK 20.6 cu. ft.
EPA MILEAGE EST. (MPG) CITY 14 HIGHWAY 21 COMBINED 17
EPA MILEAGE EST. (MPG) Unadjusted CITY 17.9 HIGHWAY 29.7 COMBINED 21.7
8
9
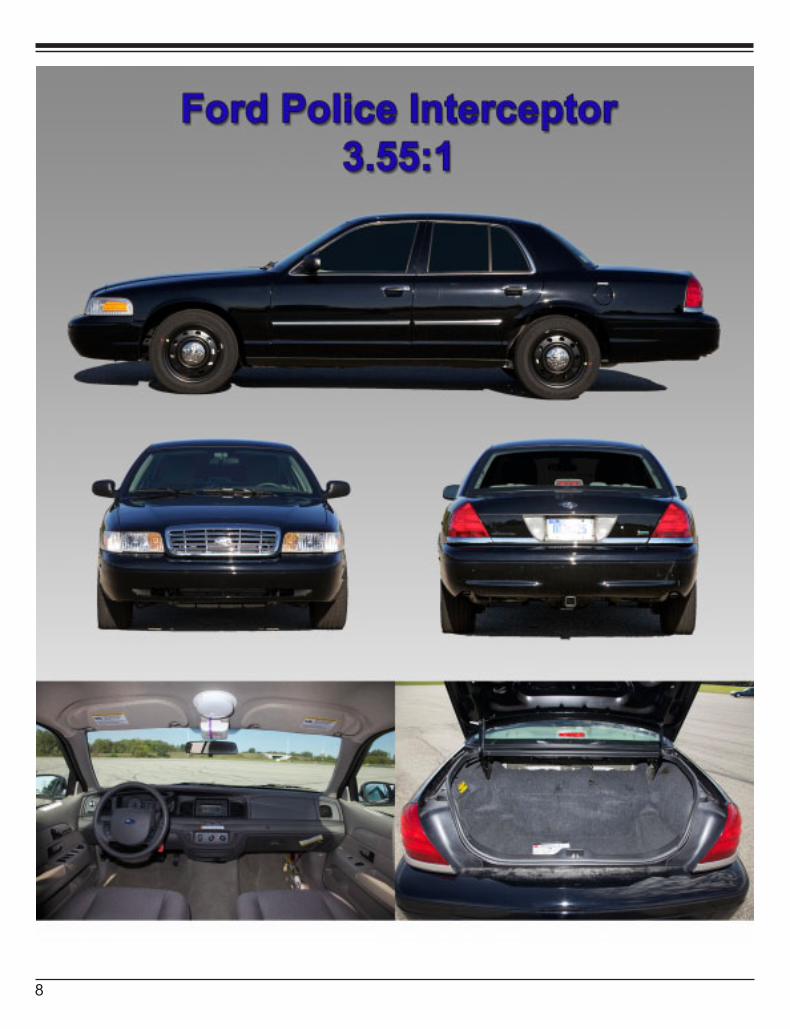
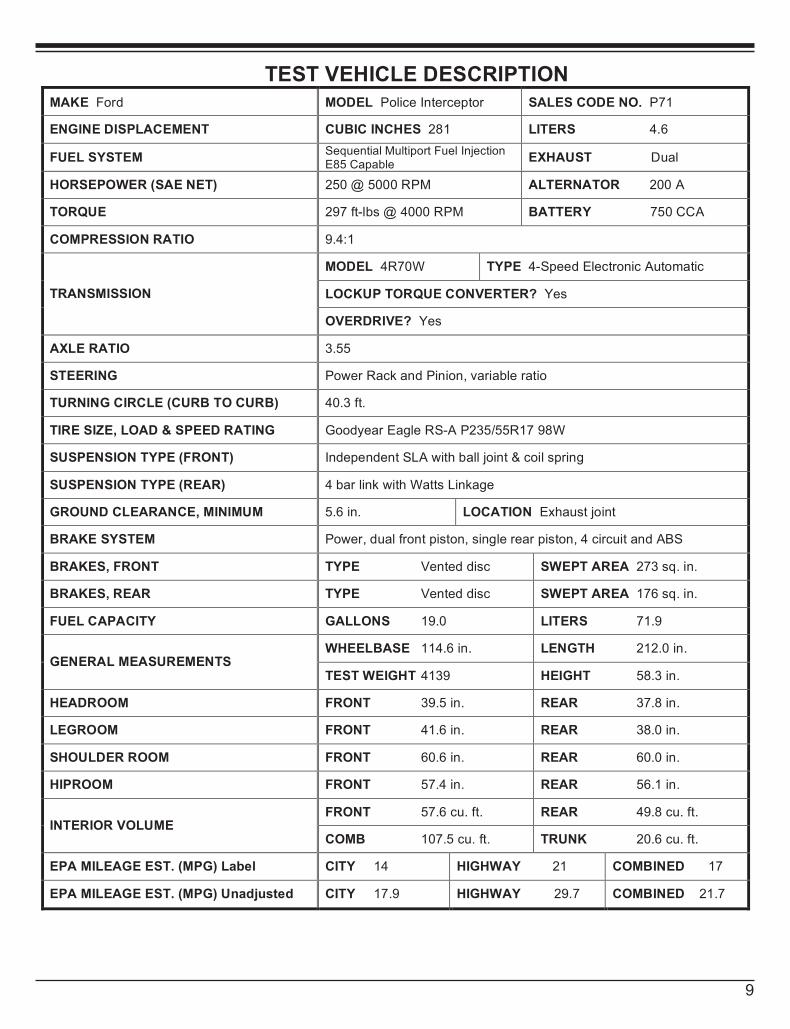
TEST VEHICLE DESCRIPTION MAKE Ford MODEL Police Interceptor SALES CODE NO. P71
ENGINE DISPLACEMENT CUBIC INCHES 281 LITERS 4.6
FUEL SYSTEM Sequential Multiport Fuel Injection E85 Capable
EXHAUST Dual
HORSEPOWER (SAE NET) 250 @ 5000 RPM ALTERNATOR 200 A
TORQUE 297 ft-lbs @ 4000 RPM BATTERY 750 CCA
COMPRESSION RATIO 9.4:1
MODEL 4R70W TYPE 4-Speed Electronic Automatic
LOCKUP TORQUE CONVERTER? Yes TRANSMISSION
OVERDRIVE? Yes
AXLE RATIO 3.55
STEERING Power Rack and Pinion, variable ratio
TURNING CIRCLE (CURB TO CURB) 40.3 ft.
TIRE SIZE, LOAD & SPEED RATING Goodyear Eagle RS-A P235/55R17 98W
SUSPENSION TYPE (FRONT) Independent SLA with ball joint & coil spring
SUSPENSION TYPE (REAR) 4 bar link with Watts Linkage
GROUND CLEARANCE, MINIMUM 5.6 in. LOCATION Exhaust joint
BRAKE SYSTEM Power, dual front piston, single rear piston, 4 circuit and ABS
BRAKES, FRONT TYPE Vented disc SWEPT AREA 273 sq. in.
BRAKES, REAR TYPE Vented disc SWEPT AREA 176 sq. in.
FUEL CAPACITY GALLONS 19.0 LITERS 71.9
WHEELBASE 114.6 in. LENGTH 212.0 in. GENERAL MEASUREMENTS
TEST WEIGHT 4139 HEIGHT 58.3 in.
HEADROOM FRONT 39.5 in. REAR 37.8 in.
LEGROOM FRONT 41.6 in. REAR 38.0 in.
SHOULDER ROOM FRONT 60.6 in. REAR 60.0 in.
HIPROOM FRONT 57.4 in. REAR 56.1 in.
FRONT 57.6 cu. ft. REAR 49.8 cu. ft. INTERIOR VOLUME
COMB 107.5 cu. ft. TRUNK 20.6 cu. ft.
EPA MILEAGE EST. (MPG) Label CITY 14 HIGHWAY 21 COMBINED 17
EPA MILEAGE EST. (MPG) Unadjusted CITY 17.9 HIGHWAY 29.7 COMBINED 21.7
9
9
TEST VEHICLE DESCRIPTION MAKE Ford MODEL Police Interceptor SALES CODE NO. P71
ENGINE DISPLACEMENT CUBIC INCHES 281 LITERS 4.6
FUEL SYSTEM Sequential Multiport Fuel Injection E85 Capable
EXHAUST Dual
HORSEPOWER (SAE NET) 250 @ 5000 RPM ALTERNATOR 200 A
TORQUE 297 ft-lbs @ 4000 RPM BATTERY 750 CCA
COMPRESSION RATIO 9.4:1
MODEL 4R70W TYPE 4-Speed Electronic Automatic
LOCKUP TORQUE CONVERTER? Yes TRANSMISSION
OVERDRIVE? Yes
AXLE RATIO 3.55
STEERING Power Rack and Pinion, variable ratio
TURNING CIRCLE (CURB TO CURB) 40.3 ft.
TIRE SIZE, LOAD & SPEED RATING Goodyear Eagle RS-A P235/55R17 98W
SUSPENSION TYPE (FRONT) Independent SLA with ball joint & coil spring
SUSPENSION TYPE (REAR) 4 bar link with Watts Linkage
GROUND CLEARANCE, MINIMUM 5.6 in. LOCATION Exhaust joint
BRAKE SYSTEM Power, dual front piston, single rear piston, 4 circuit and ABS
BRAKES, FRONT TYPE Vented disc SWEPT AREA 273 sq. in.
BRAKES, REAR TYPE Vented disc SWEPT AREA 176 sq. in.
FUEL CAPACITY GALLONS 19.0 LITERS 71.9
WHEELBASE 114.6 in. LENGTH 212.0 in. GENERAL MEASUREMENTS
TEST WEIGHT 4139 HEIGHT 58.3 in.
HEADROOM FRONT 39.5 in. REAR 37.8 in.
LEGROOM FRONT 41.6 in. REAR 38.0 in.
SHOULDER ROOM FRONT 60.6 in. REAR 60.0 in.
HIPROOM FRONT 57.4 in. REAR 56.1 in.
FRONT 57.6 cu. ft. REAR 49.8 cu. ft. INTERIOR VOLUME
COMB 107.5 cu. ft. TRUNK 20.6 cu. ft.
EPA MILEAGE EST. (MPG) Label CITY 14 HIGHWAY 21 COMBINED 17
EPA MILEAGE EST. (MPG) Unadjusted CITY 17.9 HIGHWAY 29.7 COMBINED 21.7
10
11
11
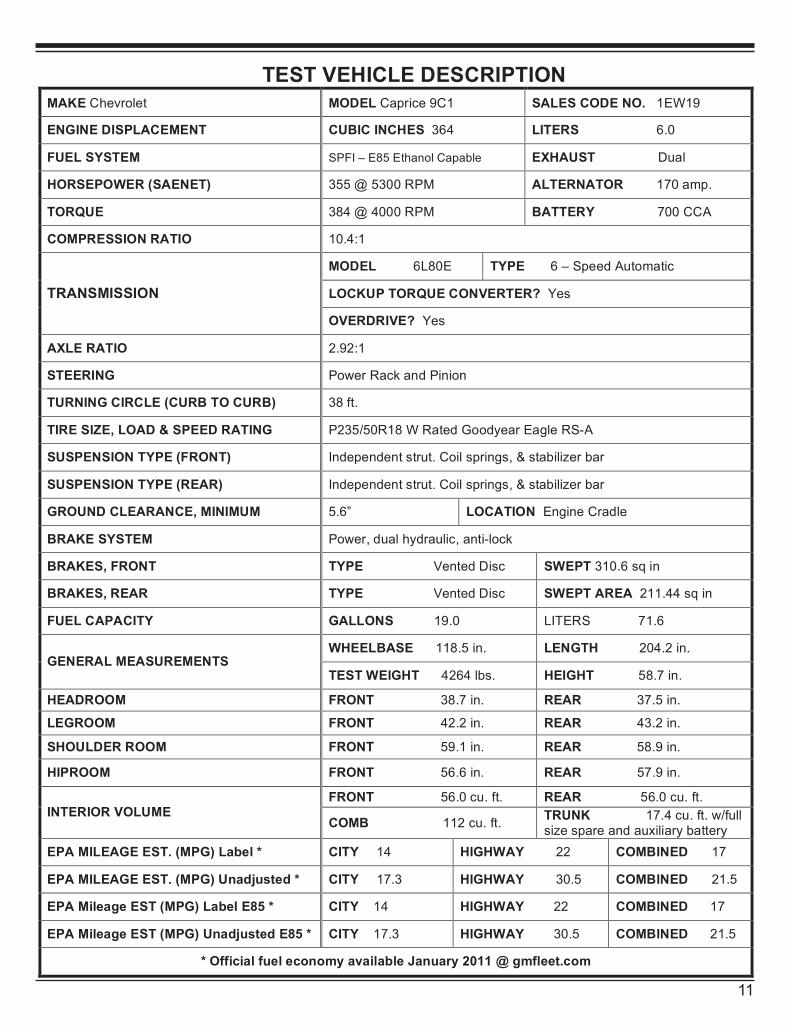
TEST VEHICLE DESCRIPTION MAKE Chevrolet MODEL Caprice 9C1 SALES CODE NO. 1EW19
ENGINE DISPLACEMENT CUBIC INCHES 364 LITERS 6.0
FUEL SYSTEM SPFI – E85 Ethanol Capable EXHAUST Dual
HORSEPOWER (SAENET) 355 @ 5300 RPM ALTERNATOR 170 amp.
TORQUE 384 @ 4000 RPM BATTERY 700 CCA
COMPRESSION RATIO 10.4:1
MODEL 6L80E TYPE 6 – Speed Automatic
LOCKUP TORQUE CONVERTER? Yes TRANSMISSION
OVERDRIVE? Yes
AXLE RATIO 2.92:1
STEERING Power Rack and Pinion
TURNING CIRCLE (CURB TO CURB) 38 ft.
TIRE SIZE, LOAD & SPEED RATING P235/50R18 W Rated Goodyear Eagle RS-A
SUSPENSION TYPE (FRONT) Independent strut. Coil springs, & stabilizer bar
SUSPENSION TYPE (REAR) Independent strut. Coil springs, & stabilizer bar
GROUND CLEARANCE, MINIMUM 5.6” LOCATION Engine Cradle
BRAKE SYSTEM Power, dual hydraulic, anti-lock
BRAKES, FRONT TYPE Vented Disc SWEPT 310.6 sq in
BRAKES, REAR TYPE Vented Disc SWEPT AREA 211.44 sq in
FUEL CAPACITY GALLONS 19.0 LITERS 71.6
WHEELBASE 118.5 in. LENGTH 204.2 in. GENERAL MEASUREMENTS
TEST WEIGHT 4264 lbs. HEIGHT 58.7 in.
HEADROOM FRONT 38.7 in. REAR 37.5 in.
LEGROOM FRONT 42.2 in. REAR 43.2 in.
SHOULDER ROOM FRONT 59.1 in. REAR 58.9 in.
HIPROOM FRONT 56.6 in. REAR 57.9 in.
FRONT 56.0 cu. ft. REAR 56.0 cu. ft. INTERIOR VOLUME
COMB 112 cu. ft. TRUNK 17.4 cu. ft. w/full size spare and auxiliary battery
EPA MILEAGE EST. (MPG) Label * CITY 14 HIGHWAY 22 COMBINED 17
EPA MILEAGE EST. (MPG) Unadjusted * CITY 17.3 HIGHWAY 30.5 COMBINED 21.5
EPA Mileage EST (MPG) Label E85 * CITY 14 HIGHWAY 22 COMBINED 17
EPA Mileage EST (MPG) Unadjusted E85 * CITY 17.3 HIGHWAY 30.5 COMBINED 21.5
* Official fuel economy available January 2011 @ gmfleet.com
12
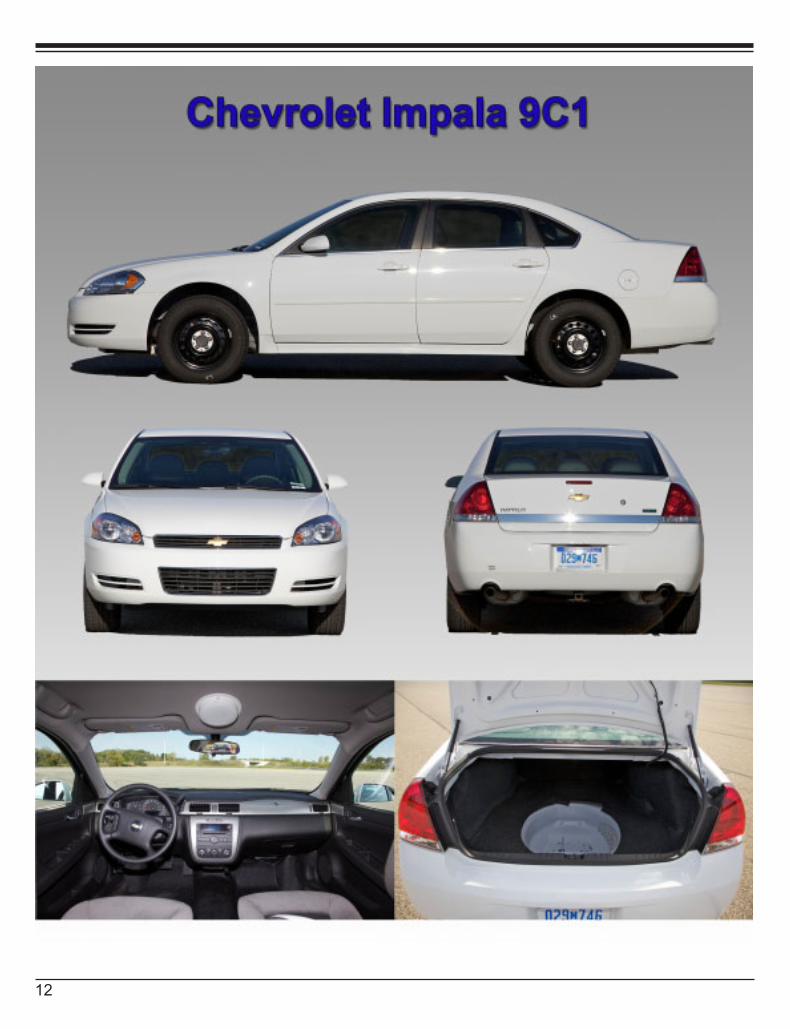
13
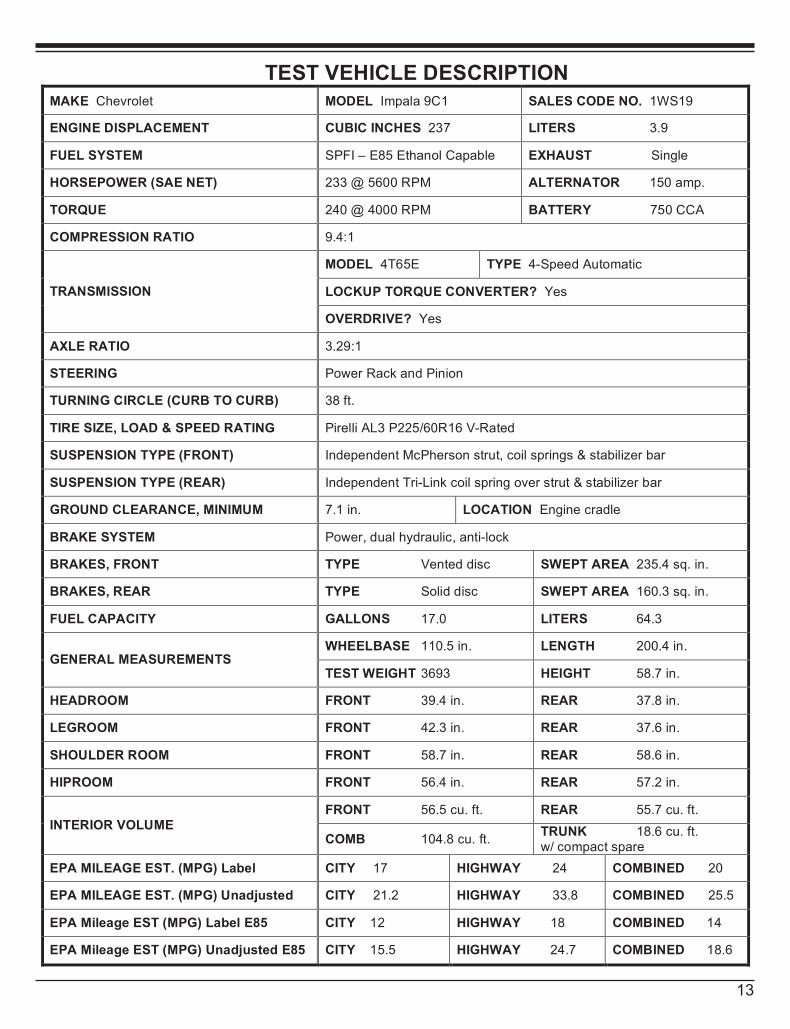
TEST VEHICLE DESCRIPTION
MAKE Chevrolet MODEL Impala 9C1 SALES CODE NO. 1WS19
ENGINE DISPLACEMENT CUBIC INCHES 237 LITERS 3.9
FUEL SYSTEM SPFI – E85 Ethanol Capable EXHAUST Single
HORSEPOWER (SAE NET) 233 @ 5600 RPM ALTERNATOR 150 amp.
TORQUE 240 @ 4000 RPM BATTERY 750 CCA
COMPRESSION RATIO 9.4:1
MODEL 4T65E TYPE 4-Speed Automatic
LOCKUP TORQUE CONVERTER? Yes TRANSMISSION
OVERDRIVE? Yes
AXLE RATIO 3.29:1
STEERING Power Rack and Pinion
TURNING CIRCLE (CURB TO CURB) 38 ft.
TIRE SIZE, LOAD & SPEED RATING Pirelli AL3 P225/60R16 V-Rated
SUSPENSION TYPE (FRONT) Independent McPherson strut, coil springs & stabilizer bar
SUSPENSION TYPE (REAR) Independent Tri-Link coil spring over strut & stabilizer bar
GROUND CLEARANCE, MINIMUM 7.1 in. LOCATION Engine cradle
BRAKE SYSTEM Power, dual hydraulic, anti-lock
BRAKES, FRONT TYPE Vented disc SWEPT AREA 235.4 sq. in.
BRAKES, REAR TYPE Solid disc SWEPT AREA 160.3 sq. in.
FUEL CAPACITY GALLONS 17.0 LITERS 64.3
WHEELBASE 110.5 in. LENGTH 200.4 in. GENERAL MEASUREMENTS
TEST WEIGHT 3693 HEIGHT 58.7 in.
HEADROOM FRONT 39.4 in. REAR 37.8 in.
LEGROOM FRONT 42.3 in. REAR 37.6 in.
SHOULDER ROOM FRONT 58.7 in. REAR 58.6 in.
HIPROOM FRONT 56.4 in. REAR 57.2 in.
FRONT 56.5 cu. ft. REAR 55.7 cu. ft. INTERIOR VOLUME
COMB 104.8 cu. ft. TRUNK 18.6 cu. ft. w/ compact spare
EPA MILEAGE EST. (MPG) Label CITY 17 HIGHWAY 24 COMBINED 20
EPA MILEAGE EST. (MPG) Unadjusted CITY 21.2 HIGHWAY 33.8 COMBINED 25.5
EPA Mileage EST (MPG) Label E85 CITY 12 HIGHWAY 18 COMBINED 14
EPA Mileage EST (MPG) Unadjusted E85 CITY 15.5 HIGHWAY 24.7 COMBINED 18.6
13
13
TEST VEHICLE DESCRIPTION
MAKE Chevrolet MODEL Impala 9C1 SALES CODE NO. 1WS19
ENGINE DISPLACEMENT CUBIC INCHES 237 LITERS 3.9
FUEL SYSTEM SPFI – E85 Ethanol Capable EXHAUST Single
HORSEPOWER (SAE NET) 233 @ 5600 RPM ALTERNATOR 150 amp.
TORQUE 240 @ 4000 RPM BATTERY 750 CCA
COMPRESSION RATIO 9.4:1
MODEL 4T65E TYPE 4-Speed Automatic
LOCKUP TORQUE CONVERTER? Yes TRANSMISSION
OVERDRIVE? Yes
AXLE RATIO 3.29:1
STEERING Power Rack and Pinion
TURNING CIRCLE (CURB TO CURB) 38 ft.
TIRE SIZE, LOAD & SPEED RATING Pirelli AL3 P225/60R16 V-Rated
SUSPENSION TYPE (FRONT) Independent McPherson strut, coil springs & stabilizer bar
SUSPENSION TYPE (REAR) Independent Tri-Link coil spring over strut & stabilizer bar
GROUND CLEARANCE, MINIMUM 7.1 in. LOCATION Engine cradle
BRAKE SYSTEM Power, dual hydraulic, anti-lock
BRAKES, FRONT TYPE Vented disc SWEPT AREA 235.4 sq. in.
BRAKES, REAR TYPE Solid disc SWEPT AREA 160.3 sq. in.
FUEL CAPACITY GALLONS 17.0 LITERS 64.3
WHEELBASE 110.5 in. LENGTH 200.4 in. GENERAL MEASUREMENTS
TEST WEIGHT 3693 HEIGHT 58.7 in.
HEADROOM FRONT 39.4 in. REAR 37.8 in.
LEGROOM FRONT 42.3 in. REAR 37.6 in.
SHOULDER ROOM FRONT 58.7 in. REAR 58.6 in.
HIPROOM FRONT 56.4 in. REAR 57.2 in.
FRONT 56.5 cu. ft. REAR 55.7 cu. ft. INTERIOR VOLUME
COMB 104.8 cu. ft. TRUNK 18.6 cu. ft. w/ compact spare
EPA MILEAGE EST. (MPG) Label CITY 17 HIGHWAY 24 COMBINED 20
EPA MILEAGE EST. (MPG) Unadjusted CITY 21.2 HIGHWAY 33.8 COMBINED 25.5
EPA Mileage EST (MPG) Label E85 CITY 12 HIGHWAY 18 COMBINED 14
EPA Mileage EST (MPG) Unadjusted E85 CITY 15.5 HIGHWAY 24.7 COMBINED 18.6
14
15
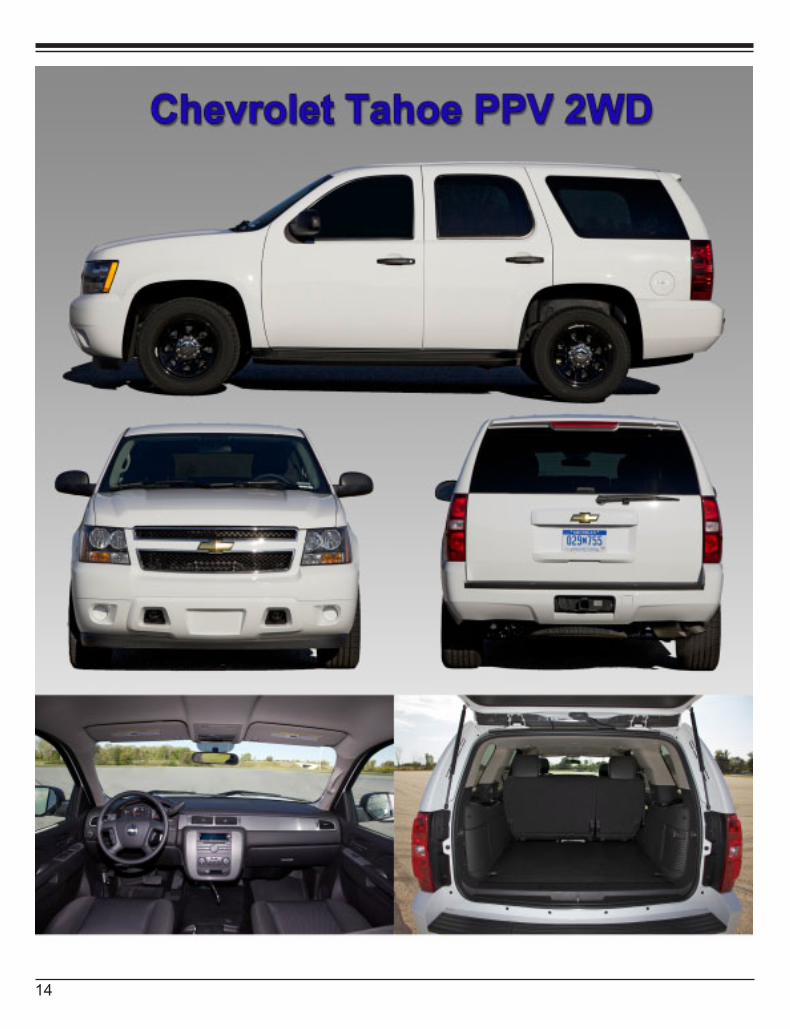
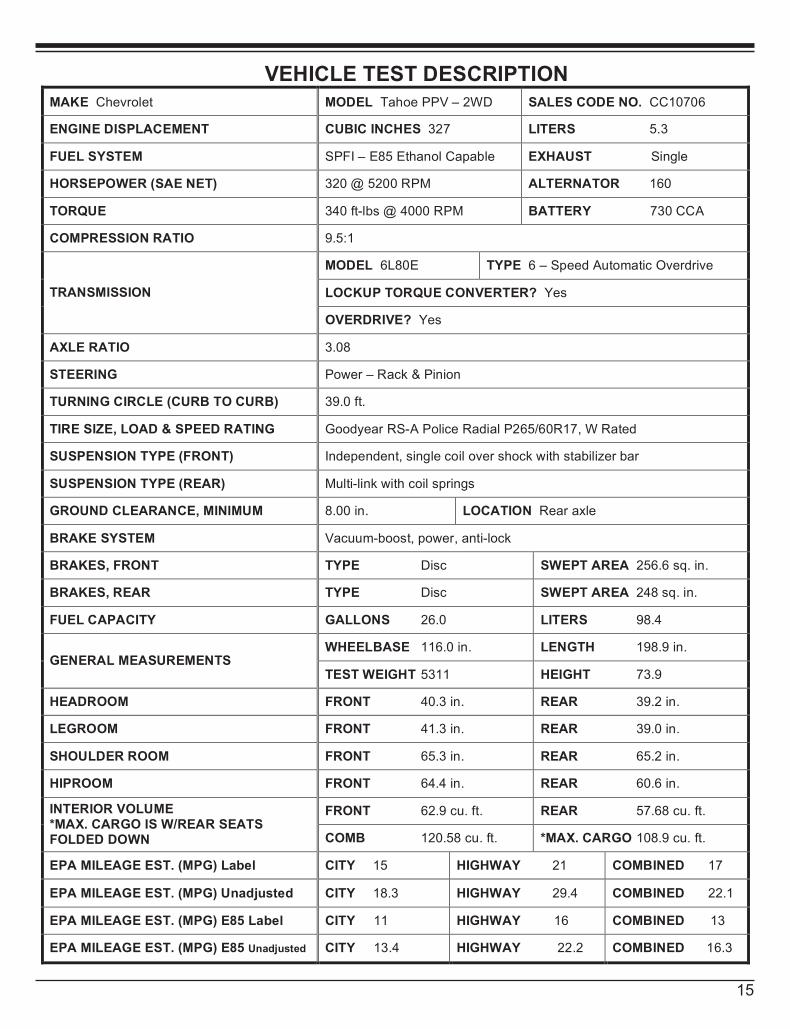
VEHICLE TEST DESCRIPTION
MAKE Chevrolet MODEL Tahoe PPV – 2WD SALES CODE NO. CC10706
ENGINE DISPLACEMENT CUBIC INCHES 327 LITERS 5.3
FUEL SYSTEM SPFI – E85 Ethanol Capable EXHAUST Single
HORSEPOWER (SAE NET) 320 @ 5200 RPM ALTERNATOR 160
TORQUE 340 ft-lbs @ 4000 RPM BATTERY 730 CCA
COMPRESSION RATIO 9.5:1
MODEL 6L80E TYPE 6 – Speed Automatic Overdrive
LOCKUP TORQUE CONVERTER? Yes TRANSMISSION
OVERDRIVE? Yes
AXLE RATIO 3.08
STEERING Power – Rack & Pinion
TURNING CIRCLE (CURB TO CURB) 39.0 ft.
TIRE SIZE, LOAD & SPEED RATING Goodyear RS-A Police Radial P265/60R17, W Rated
SUSPENSION TYPE (FRONT) Independent, single coil over shock with stabilizer bar
SUSPENSION TYPE (REAR) Multi-link with coil springs
GROUND CLEARANCE, MINIMUM 8.00 in. LOCATION Rear axle
BRAKE SYSTEM Vacuum-boost, power, anti-lock
BRAKES, FRONT TYPE Disc SWEPT AREA 256.6 sq. in.
BRAKES, REAR TYPE Disc SWEPT AREA 248 sq. in.
FUEL CAPACITY GALLONS 26.0 LITERS 98.4
WHEELBASE 116.0 in. LENGTH 198.9 in. GENERAL MEASUREMENTS
TEST WEIGHT 5311 HEIGHT 73.9
HEADROOM FRONT 40.3 in. REAR 39.2 in.
LEGROOM FRONT 41.3 in. REAR 39.0 in.
SHOULDER ROOM FRONT 65.3 in. REAR 65.2 in.
HIPROOM FRONT 64.4 in. REAR 60.6 in.
FRONT 62.9 cu. ft. REAR 57.68 cu. ft. INTERIOR VOLUME *MAX. CARGO IS W/REAR SEATS FOLDED DOWN COMB 120.58 cu. ft. *MAX. CARGO 108.9 cu. ft.
EPA MILEAGE EST. (MPG) Label CITY 15 HIGHWAY 21 COMBINED 17
EPA MILEAGE EST. (MPG) Unadjusted CITY 18.3 HIGHWAY 29.4 COMBINED 22.1
EPA MILEAGE EST. (MPG) E85 Label CITY 11 HIGHWAY 16 COMBINED 13
EPA MILEAGE EST. (MPG) E85 Unadjusted CITY 13.4 HIGHWAY 22.2 COMBINED 16.3
15
15
VEHICLE TEST DESCRIPTION
MAKE Chevrolet MODEL Tahoe PPV – 2WD SALES CODE NO. CC10706
ENGINE DISPLACEMENT CUBIC INCHES 327 LITERS 5.3
FUEL SYSTEM SPFI – E85 Ethanol Capable EXHAUST Single
HORSEPOWER (SAE NET) 320 @ 5200 RPM ALTERNATOR 160
TORQUE 340 ft-lbs @ 4000 RPM BATTERY 730 CCA
COMPRESSION RATIO 9.5:1
MODEL 6L80E TYPE 6 – Speed Automatic Overdrive
LOCKUP TORQUE CONVERTER? Yes TRANSMISSION
OVERDRIVE? Yes
AXLE RATIO 3.08
STEERING Power – Rack & Pinion
TURNING CIRCLE (CURB TO CURB) 39.0 ft.
TIRE SIZE, LOAD & SPEED RATING Goodyear RS-A Police Radial P265/60R17, W Rated
SUSPENSION TYPE (FRONT) Independent, single coil over shock with stabilizer bar
SUSPENSION TYPE (REAR) Multi-link with coil springs
GROUND CLEARANCE, MINIMUM 8.00 in. LOCATION Rear axle
BRAKE SYSTEM Vacuum-boost, power, anti-lock
BRAKES, FRONT TYPE Disc SWEPT AREA 256.6 sq. in.
BRAKES, REAR TYPE Disc SWEPT AREA 248 sq. in.
FUEL CAPACITY GALLONS 26.0 LITERS 98.4
WHEELBASE 116.0 in. LENGTH 198.9 in. GENERAL MEASUREMENTS
TEST WEIGHT 5311 HEIGHT 73.9
HEADROOM FRONT 40.3 in. REAR 39.2 in.
LEGROOM FRONT 41.3 in. REAR 39.0 in.
SHOULDER ROOM FRONT 65.3 in. REAR 65.2 in.
HIPROOM FRONT 64.4 in. REAR 60.6 in.
FRONT 62.9 cu. ft. REAR 57.68 cu. ft. INTERIOR VOLUME *MAX. CARGO IS W/REAR SEATS FOLDED DOWN COMB 120.58 cu. ft. *MAX. CARGO 108.9 cu. ft.
EPA MILEAGE EST. (MPG) Label CITY 15 HIGHWAY 21 COMBINED 17
EPA MILEAGE EST. (MPG) Unadjusted CITY 18.3 HIGHWAY 29.4 COMBINED 22.1
EPA MILEAGE EST. (MPG) E85 Label CITY 11 HIGHWAY 16 COMBINED 13
EPA MILEAGE EST. (MPG) E85 Unadjusted CITY 13.4 HIGHWAY 22.2 COMBINED 16.3
16
17
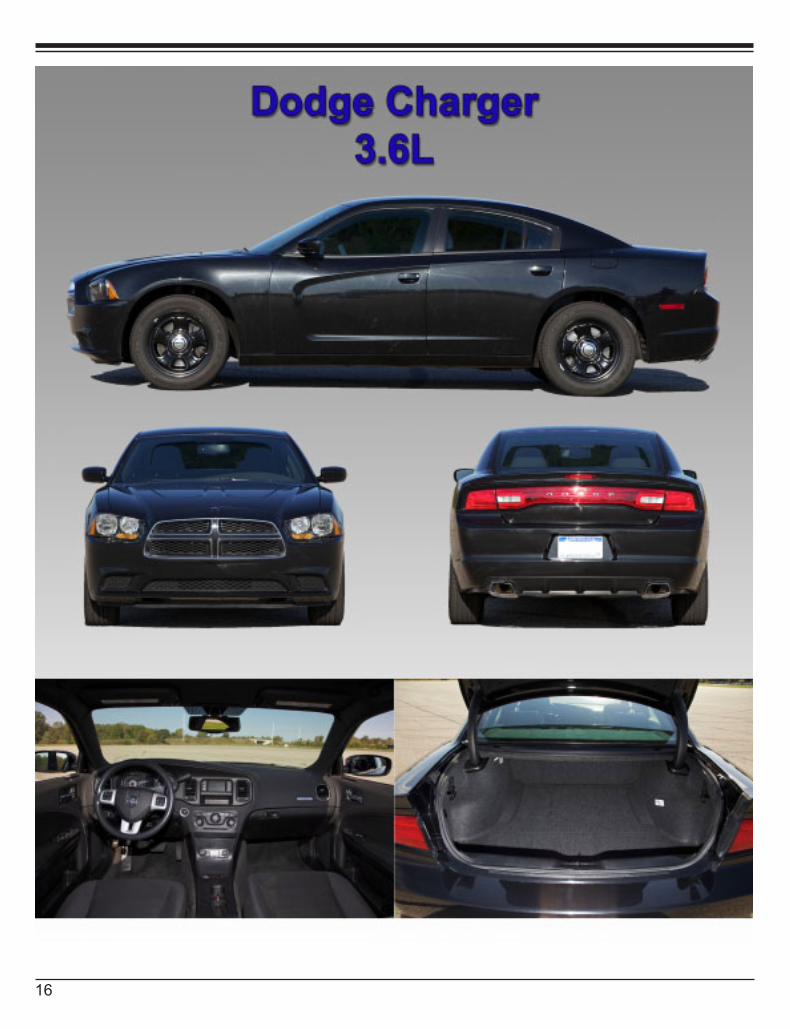
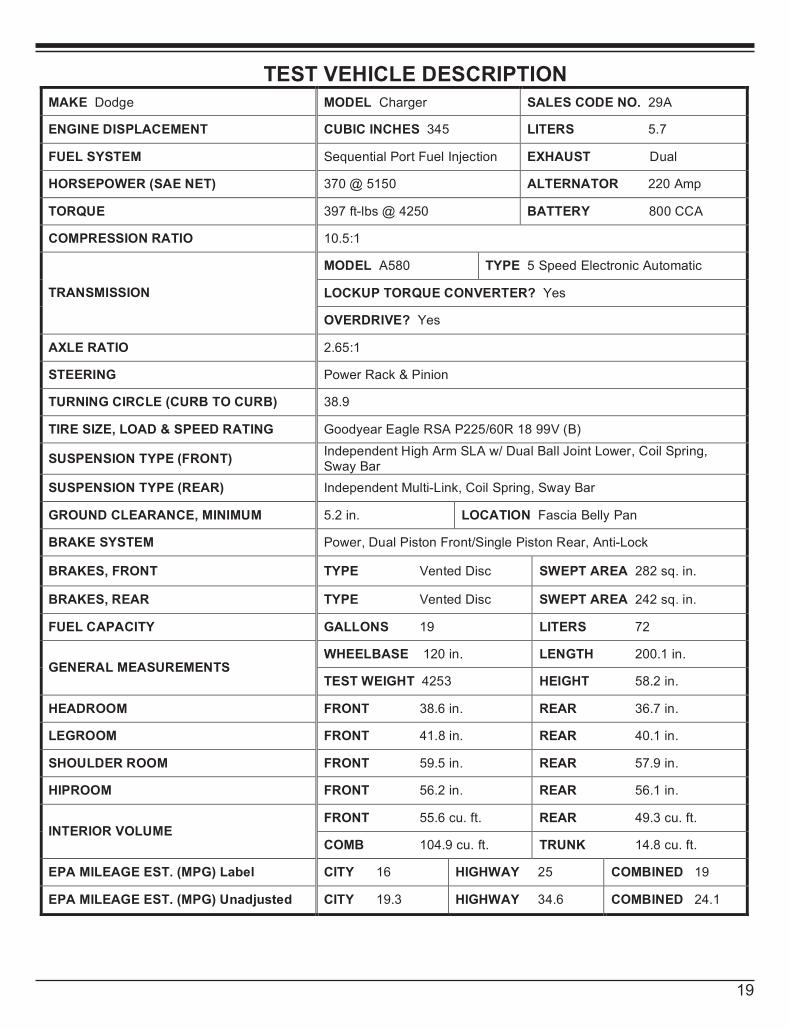
TEST VEHICLE DESCRIPTION MAKE Dodge MODEL Charger SALES CODE NO. 27A
ENGINE DISPLACEMENT CUBIC INCHES 220 LITERS 3.6
FUEL SYSTEM Sequential Port Fuel Injection EXHAUST Dual
HORSEPOWER (SAE NET) 291 @ 6400 ALTERNATOR 220 Amp
TORQUE 260 ft-lbs @ 4400 BATTERY 800 CCA
COMPRESSION RATIO 10.2:1
MODEL A580 TYPE 5 Speed Electronic Automatic
LOCKUP TORQUE CONVERTER? Yes TRANSMISSION
OVERDRIVE? Yes
AXLE RATIO 2.65:1
STEERING Power Rack & Pinion
TURNING CIRCLE (CURB TO CURB) 38.9
TIRE SIZE, LOAD & SPEED RATING Goodyear Eagle RSA P225/60R 18 99V (B)
SUSPENSION TYPE (FRONT) Independent High Arm SLA with Dual Ball Joint Lower, Coil Spring, Sway Bar
SUSPENSION TYPE (REAR) Independent Multi-Link, Coil Spring, Sway Bar
GROUND CLEARANCE, MINIMUM 5.2 in. LOCATION Fascia Belly Pan
BRAKE SYSTEM Power, Dual Piston Front/Single Piston Rear, Anti-Lock
BRAKES, FRONT TYPE Vented Disc SWEPT AREA 282 sq. in.
BRAKES, REAR TYPE Vented Disc SWEPT AREA 242 sq. in.
FUEL CAPACITY GALLONS 19 LITERS 72
WHEELBASE 120 in. LENGTH 200.1 in. GENERAL MEASUREMENTS
TEST WEIGHT 4035 HEIGHT 58.2 in.
HEADROOM FRONT 38.6 in. REAR 36.7 in.
LEGROOM FRONT 41.8 in. REAR 40.1 in.
SHOULDER ROOM FRONT 59.5 in. REAR 57.9 in.
HIPROOM FRONT 56.2 in. REAR 56.1 in.
FRONT 55.6 cu. ft. REAR 49.31 cu. ft. INTERIOR VOLUME
COMB 104.9 cu. ft. TRUNK 14.8 cu. ft.
EPA MILEAGE EST. (MPG) Label CITY 19 HIGHWAY 26 COMBINED 21
EPA MILEAGE EST. (MPG) Unadjusted CITY 23.2 HIGHWAY 36.6 COMBINED 27.8

17
17
TEST VEHICLE DESCRIPTION MAKE Dodge MODEL Charger SALES CODE NO. 27A
ENGINE DISPLACEMENT CUBIC INCHES 220 LITERS 3.6
FUEL SYSTEM Sequential Port Fuel Injection EXHAUST Dual
HORSEPOWER (SAE NET) 291 @ 6400 ALTERNATOR 220 Amp
TORQUE 260 ft-lbs @ 4400 BATTERY 800 CCA
COMPRESSION RATIO 10.2:1
MODEL A580 TYPE 5 Speed Electronic Automatic
LOCKUP TORQUE CONVERTER? Yes TRANSMISSION
OVERDRIVE? Yes
AXLE RATIO 2.65:1
STEERING Power Rack & Pinion
TURNING CIRCLE (CURB TO CURB) 38.9
TIRE SIZE, LOAD & SPEED RATING Goodyear Eagle RSA P225/60R 18 99V (B)
SUSPENSION TYPE (FRONT) Independent High Arm SLA with Dual Ball Joint Lower, Coil Spring, Sway Bar
SUSPENSION TYPE (REAR) Independent Multi-Link, Coil Spring, Sway Bar
GROUND CLEARANCE, MINIMUM 5.2 in. LOCATION Fascia Belly Pan
BRAKE SYSTEM Power, Dual Piston Front/Single Piston Rear, Anti-Lock
BRAKES, FRONT TYPE Vented Disc SWEPT AREA 282 sq. in.
BRAKES, REAR TYPE Vented Disc SWEPT AREA 242 sq. in.
FUEL CAPACITY GALLONS 19 LITERS 72
WHEELBASE 120 in. LENGTH 200.1 in. GENERAL MEASUREMENTS
TEST WEIGHT 4035 HEIGHT 58.2 in.
HEADROOM FRONT 38.6 in. REAR 36.7 in.
LEGROOM FRONT 41.8 in. REAR 40.1 in.
SHOULDER ROOM FRONT 59.5 in. REAR 57.9 in.
HIPROOM FRONT 56.2 in. REAR 56.1 in.
FRONT 55.6 cu. ft. REAR 49.31 cu. ft. INTERIOR VOLUME
COMB 104.9 cu. ft. TRUNK 14.8 cu. ft.
EPA MILEAGE EST. (MPG) Label CITY 19 HIGHWAY 26 COMBINED 21
EPA MILEAGE EST. (MPG) Unadjusted CITY 23.2 HIGHWAY 36.6 COMBINED 27.8
18
19
19
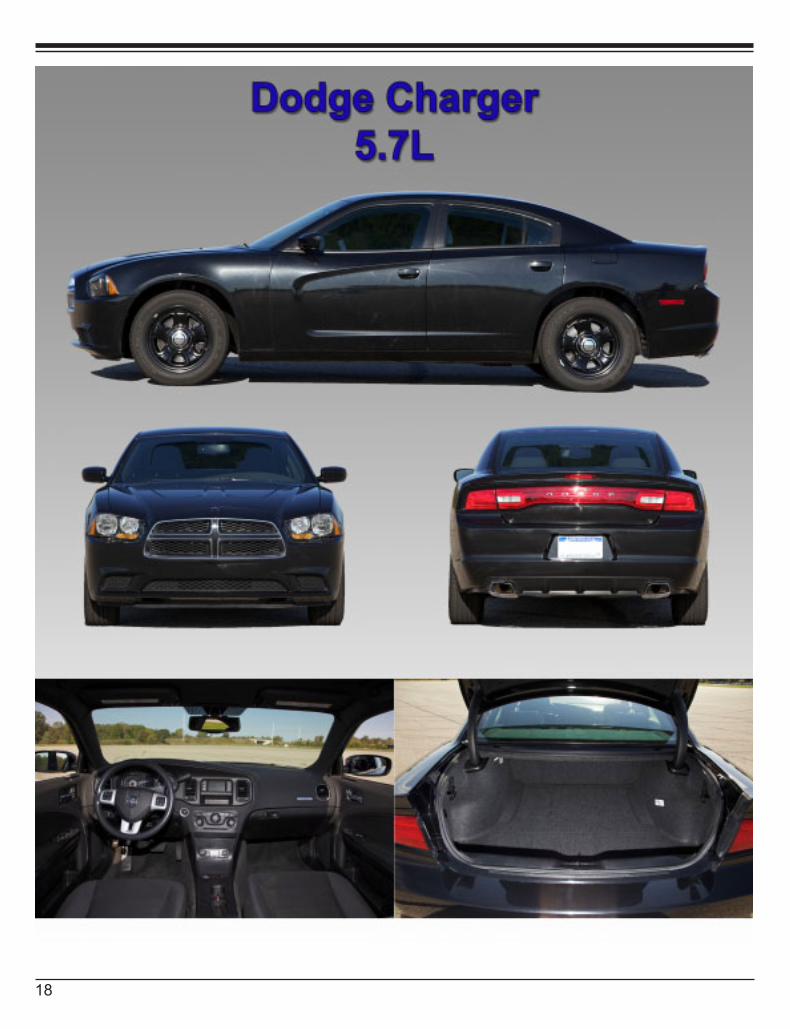
TEST VEHICLE DESCRIPTION MAKE Dodge MODEL Charger SALES CODE NO. 29A
ENGINE DISPLACEMENT CUBIC INCHES 345 LITERS 5.7
FUEL SYSTEM Sequential Port Fuel Injection EXHAUST Dual
HORSEPOWER (SAE NET) 370 @ 5150 ALTERNATOR 220 Amp
TORQUE 397 ft-lbs @ 4250 BATTERY 800 CCA
COMPRESSION RATIO 10.5:1
MODEL A580 TYPE 5 Speed Electronic Automatic
LOCKUP TORQUE CONVERTER? Yes TRANSMISSION
OVERDRIVE? Yes
AXLE RATIO 2.65:1
STEERING Power Rack & Pinion
TURNING CIRCLE (CURB TO CURB) 38.9
TIRE SIZE, LOAD & SPEED RATING Goodyear Eagle RSA P225/60R 18 99V (B)
SUSPENSION TYPE (FRONT) Independent High Arm SLA w/ Dual Ball Joint Lower, Coil Spring, Sway Bar
SUSPENSION TYPE (REAR) Independent Multi-Link, Coil Spring, Sway Bar
GROUND CLEARANCE, MINIMUM 5.2 in. LOCATION Fascia Belly Pan
BRAKE SYSTEM Power, Dual Piston Front/Single Piston Rear, Anti-Lock
BRAKES, FRONT TYPE Vented Disc SWEPT AREA 282 sq. in.
BRAKES, REAR TYPE Vented Disc SWEPT AREA 242 sq. in.
FUEL CAPACITY GALLONS 19 LITERS 72
WHEELBASE 120 in. LENGTH 200.1 in. GENERAL MEASUREMENTS
TEST WEIGHT 4253 HEIGHT 58.2 in.
HEADROOM FRONT 38.6 in. REAR 36.7 in.
LEGROOM FRONT 41.8 in. REAR 40.1 in.
SHOULDER ROOM FRONT 59.5 in. REAR 57.9 in.
HIPROOM FRONT 56.2 in. REAR 56.1 in.
FRONT 55.6 cu. ft. REAR 49.3 cu. ft. INTERIOR VOLUME
COMB 104.9 cu. ft. TRUNK 14.8 cu. ft.
EPA MILEAGE EST. (MPG) Label CITY 16 HIGHWAY 25 COMBINED 19
EPA MILEAGE EST. (MPG) Unadjusted CITY 19.3 HIGHWAY 34.6 COMBINED 24.1
20
20
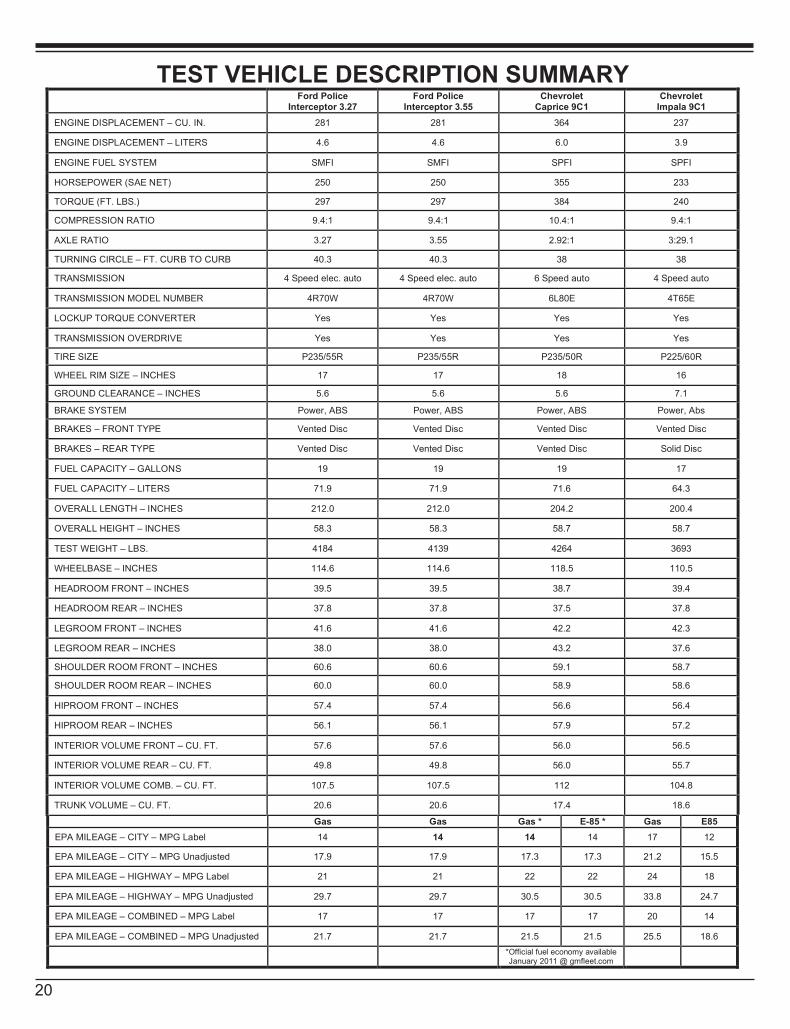
TEST VEHICLE DESCRIPTION SUMMARY
Ford Police Interceptor 3.27
Ford Police Interceptor 3.55
Chevrolet Caprice 9C1
Chevrolet Impala 9C1
ENGINE DISPLACEMENT – CU. IN. 281 281 364 237
ENGINE DISPLACEMENT – LITERS 4.6 4.6 6.0 3.9
ENGINE FUEL SYSTEM SMFI SMFI SPFI SPFI
HORSEPOWER (SAE NET) 250 250 355 233
TORQUE (FT. LBS.) 297 297 384 240
COMPRESSION RATIO 9.4:1 9.4:1 10.4:1 9.4:1
AXLE RATIO 3.27 3.55 2.92:1 3:29.1
TURNING CIRCLE – FT. CURB TO CURB 40.3 40.3 38 38
TRANSMISSION 4 Speed elec. auto 4 Speed elec. auto 6 Speed auto 4 Speed auto
TRANSMISSION MODEL NUMBER 4R70W 4R70W 6L80E 4T65E
LOCKUP TORQUE CONVERTER Yes Yes Yes Yes
TRANSMISSION OVERDRIVE Yes Yes Yes Yes
TIRE SIZE P235/55R P235/55R P235/50R P225/60R
WHEEL RIM SIZE – INCHES 17 17 18 16
GROUND CLEARANCE – INCHES 5.6 5.6 5.6 7.1
BRAKE SYSTEM Power, ABS Power, ABS Power, ABS Power, Abs
BRAKES – FRONT TYPE Vented Disc Vented Disc Vented Disc Vented Disc
BRAKES – REAR TYPE Vented Disc Vented Disc Vented Disc Solid Disc
FUEL CAPACITY – GALLONS 19 19 19 17
FUEL CAPACITY – LITERS 71.9 71.9 71.6 64.3
OVERALL LENGTH – INCHES 212.0 212.0 204.2 200.4
OVERALL HEIGHT – INCHES 58.3 58.3 58.7 58.7
TEST WEIGHT – LBS. 4184 4139 4264 3693
WHEELBASE – INCHES 114.6 114.6 118.5 110.5
HEADROOM FRONT – INCHES 39.5 39.5 38.7 39.4
HEADROOM REAR – INCHES 37.8 37.8 37.5 37.8
LEGROOM FRONT – INCHES 41.6 41.6 42.2 42.3
LEGROOM REAR – INCHES 38.0 38.0 43.2 37.6
SHOULDER ROOM FRONT – INCHES 60.6 60.6 59.1 58.7
SHOULDER ROOM REAR – INCHES 60.0 60.0 58.9 58.6
HIPROOM FRONT – INCHES 57.4 57.4 56.6 56.4
HIPROOM REAR – INCHES 56.1 56.1 57.9 57.2
INTERIOR VOLUME FRONT – CU. FT. 57.6 57.6 56.0 56.5
INTERIOR VOLUME REAR – CU. FT. 49.8 49.8 56.0 55.7
INTERIOR VOLUME COMB. – CU. FT. 107.5 107.5 112 104.8
TRUNK VOLUME – CU. FT. 20.6 20.6 17.4 18.6
Gas Gas Gas * E-85 * Gas E85
EPA MILEAGE – CITY – MPG Label 14 14 14 14 17 12
EPA MILEAGE – CITY – MPG Unadjusted 17.9 17.9 17.3 17.3 21.2 15.5
EPA MILEAGE – HIGHWAY – MPG Label 21 21 22 22 24 18
EPA MILEAGE – HIGHWAY – MPG Unadjusted 29.7 29.7 30.5 30.5 33.8 24.7
EPA MILEAGE – COMBINED – MPG Label 17 17 17 17 20 14
EPA MILEAGE – COMBINED – MPG Unadjusted 21.7 21.7 21.5 21.5 25.5 18.6
*Official fuel economy available January 2011 @ gmfleet.com
21
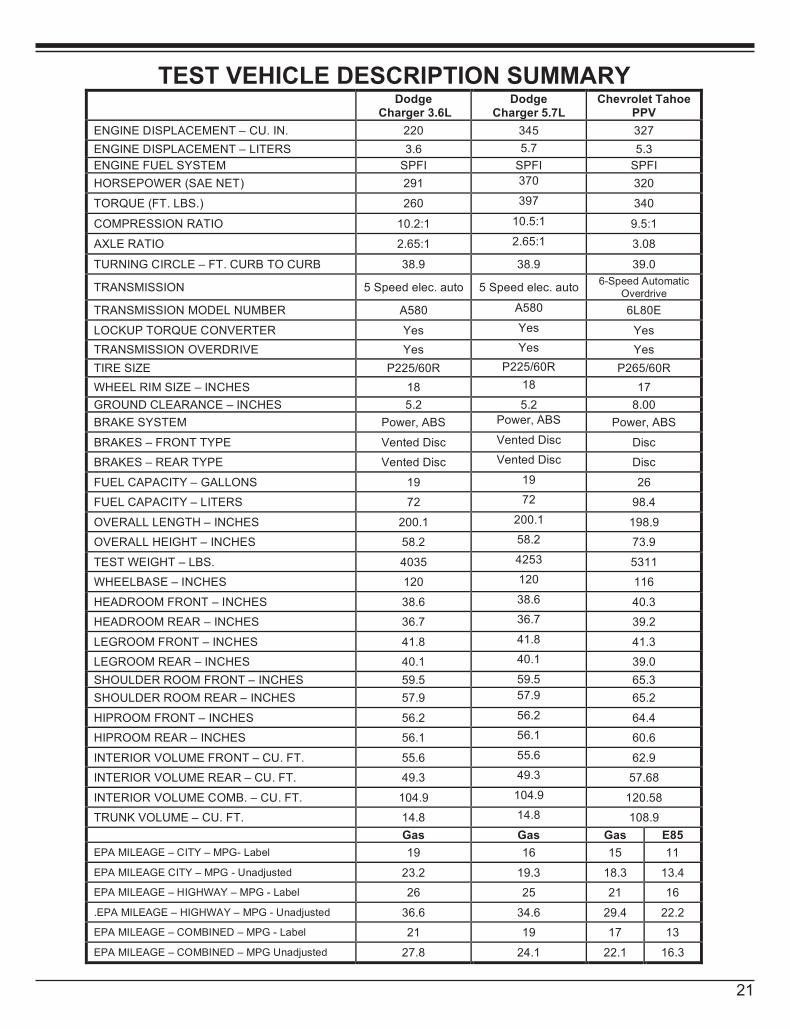
TEST VEHICLE DESCRIPTION SUMMARY
Dodge Charger 3.6L
Dodge Charger 5.7L
Chevrolet Tahoe PPV
ENGINE DISPLACEMENT – CU. IN. 220 345 327
ENGINE DISPLACEMENT – LITERS 3.6 5.7 5.3
ENGINE FUEL SYSTEM SPFI SPFI SPFI
HORSEPOWER (SAE NET) 291 370 320
TORQUE (FT. LBS.) 260 397 340
COMPRESSION RATIO 10.2:1 10.5:1 9.5:1
AXLE RATIO 2.65:1 2.65:1 3.08
TURNING CIRCLE – FT. CURB TO CURB 38.9 38.9 39.0
TRANSMISSION 5 Speed elec. auto 5 Speed elec. auto 6-Speed Automatic
Overdrive
TRANSMISSION MODEL NUMBER A580 A580 6L80E
LOCKUP TORQUE CONVERTER Yes Yes Yes
TRANSMISSION OVERDRIVE Yes Yes Yes
TIRE SIZE P225/60R P225/60R P265/60R
WHEEL RIM SIZE – INCHES 18 18 17
GROUND CLEARANCE – INCHES 5.2 5.2 8.00
BRAKE SYSTEM Power, ABS Power, ABS Power, ABS
BRAKES – FRONT TYPE Vented Disc Vented Disc Disc
BRAKES – REAR TYPE Vented Disc Vented Disc Disc
FUEL CAPACITY – GALLONS 19 19 26
FUEL CAPACITY – LITERS 72 72 98.4
OVERALL LENGTH – INCHES 200.1 200.1 198.9
OVERALL HEIGHT – INCHES 58.2 58.2 73.9
TEST WEIGHT – LBS. 4035 4253 5311
WHEELBASE – INCHES 120 120 116
HEADROOM FRONT – INCHES 38.6 38.6 40.3
HEADROOM REAR – INCHES 36.7 36.7 39.2
LEGROOM FRONT – INCHES 41.8 41.8 41.3
LEGROOM REAR – INCHES 40.1 40.1 39.0
SHOULDER ROOM FRONT – INCHES 59.5 59.5 65.3
SHOULDER ROOM REAR – INCHES 57.9 57.9 65.2
HIPROOM FRONT – INCHES 56.2 56.2 64.4
HIPROOM REAR – INCHES 56.1 56.1 60.6
INTERIOR VOLUME FRONT – CU. FT. 55.6 55.6 62.9
INTERIOR VOLUME REAR – CU. FT. 49.3 49.3 57.68
INTERIOR VOLUME COMB. – CU. FT. 104.9 104.9 120.58
TRUNK VOLUME – CU. FT. 14.8 14.8 108.9
Gas Gas Gas E85
EPA MILEAGE – CITY – MPG- Label 19 16 15 11
EPA MILEAGE CITY – MPG - Unadjusted 23.2 19.3 18.3 13.4
EPA MILEAGE – HIGHWAY – MPG - Label 26 25 21 16
.EPA MILEAGE – HIGHWAY – MPG - Unadjusted 36.6 34.6 29.4 22.2
EPA MILEAGE – COMBINED – MPG - Label 21 19 17 13
EPA MILEAGE – COMBINED – MPG Unadjusted 27.8 24.1 22.1 16.3
21
20
TEST VEHICLE DESCRIPTION SUMMARY
Ford Police Interceptor 3.27
Ford Police Interceptor 3.55
Chevrolet Caprice 9C1
Chevrolet Impala 9C1
ENGINE DISPLACEMENT – CU. IN. 281 281 364 237
ENGINE DISPLACEMENT – LITERS 4.6 4.6 6.0 3.9
ENGINE FUEL SYSTEM SMFI SMFI SPFI SPFI
HORSEPOWER (SAE NET) 250 250 355 233
TORQUE (FT. LBS.) 297 297 384 240
COMPRESSION RATIO 9.4:1 9.4:1 10.4:1 9.4:1
AXLE RATIO 3.27 3.55 2.92:1 3:29.1
TURNING CIRCLE – FT. CURB TO CURB 40.3 40.3 38 38
TRANSMISSION 4 Speed elec. auto 4 Speed elec. auto 6 Speed auto 4 Speed auto
TRANSMISSION MODEL NUMBER 4R70W 4R70W 6L80E 4T65E
LOCKUP TORQUE CONVERTER Yes Yes Yes Yes
TRANSMISSION OVERDRIVE Yes Yes Yes Yes
TIRE SIZE P235/55R P235/55R P235/50R P225/60R
WHEEL RIM SIZE – INCHES 17 17 18 16
GROUND CLEARANCE – INCHES 5.6 5.6 5.6 7.1
BRAKE SYSTEM Power, ABS Power, ABS Power, ABS Power, Abs
BRAKES – FRONT TYPE Vented Disc Vented Disc Vented Disc Vented Disc
BRAKES – REAR TYPE Vented Disc Vented Disc Vented Disc Solid Disc
FUEL CAPACITY – GALLONS 19 19 19 17
FUEL CAPACITY – LITERS 71.9 71.9 71.6 64.3
OVERALL LENGTH – INCHES 212.0 212.0 204.2 200.4
OVERALL HEIGHT – INCHES 58.3 58.3 58.7 58.7
TEST WEIGHT – LBS. 4184 4139 4264 3693
WHEELBASE – INCHES 114.6 114.6 118.5 110.5
HEADROOM FRONT – INCHES 39.5 39.5 38.7 39.4
HEADROOM REAR – INCHES 37.8 37.8 37.5 37.8
LEGROOM FRONT – INCHES 41.6 41.6 42.2 42.3
LEGROOM REAR – INCHES 38.0 38.0 43.2 37.6
SHOULDER ROOM FRONT – INCHES 60.6 60.6 59.1 58.7
SHOULDER ROOM REAR – INCHES 60.0 60.0 58.9 58.6
HIPROOM FRONT – INCHES 57.4 57.4 56.6 56.4
HIPROOM REAR – INCHES 56.1 56.1 57.9 57.2
INTERIOR VOLUME FRONT – CU. FT. 57.6 57.6 56.0 56.5
INTERIOR VOLUME REAR – CU. FT. 49.8 49.8 56.0 55.7
INTERIOR VOLUME COMB. – CU. FT. 107.5 107.5 112 104.8
TRUNK VOLUME – CU. FT. 20.6 20.6 17.4 18.6
Gas Gas Gas * E-85 * Gas E85
EPA MILEAGE – CITY – MPG Label 14 14 14 14 17 12
EPA MILEAGE – CITY – MPG Unadjusted 17.9 17.9 17.3 17.3 21.2 15.5
EPA MILEAGE – HIGHWAY – MPG Label 21 21 22 22 24 18
EPA MILEAGE – HIGHWAY – MPG Unadjusted 29.7 29.7 30.5 30.5 33.8 24.7
EPA MILEAGE – COMBINED – MPG Label 17 17 17 17 20 14
EPA MILEAGE – COMBINED – MPG Unadjusted 21.7 21.7 21.5 21.5 25.5 18.6
*Official fuel economy available January 2011 @ gmfleet.com
21
TEST VEHICLE DESCRIPTION SUMMARY
Dodge Charger 3.6L
Dodge Charger 5.7L
Chevrolet Tahoe PPV
ENGINE DISPLACEMENT – CU. IN. 220 345 327
ENGINE DISPLACEMENT – LITERS 3.6 5.7 5.3
ENGINE FUEL SYSTEM SPFI SPFI SPFI
HORSEPOWER (SAE NET) 291 370 320
TORQUE (FT. LBS.) 260 397 340
COMPRESSION RATIO 10.2:1 10.5:1 9.5:1
AXLE RATIO 2.65:1 2.65:1 3.08
TURNING CIRCLE – FT. CURB TO CURB 38.9 38.9 39.0
TRANSMISSION 5 Speed elec. auto 5 Speed elec. auto 6-Speed Automatic
Overdrive
TRANSMISSION MODEL NUMBER A580 A580 6L80E
LOCKUP TORQUE CONVERTER Yes Yes Yes
TRANSMISSION OVERDRIVE Yes Yes Yes
TIRE SIZE P225/60R P225/60R P265/60R
WHEEL RIM SIZE – INCHES 18 18 17
GROUND CLEARANCE – INCHES 5.2 5.2 8.00
BRAKE SYSTEM Power, ABS Power, ABS Power, ABS
BRAKES – FRONT TYPE Vented Disc Vented Disc Disc
BRAKES – REAR TYPE Vented Disc Vented Disc Disc
FUEL CAPACITY – GALLONS 19 19 26
FUEL CAPACITY – LITERS 72 72 98.4
OVERALL LENGTH – INCHES 200.1 200.1 198.9
OVERALL HEIGHT – INCHES 58.2 58.2 73.9
TEST WEIGHT – LBS. 4035 4253 5311
WHEELBASE – INCHES 120 120 116
HEADROOM FRONT – INCHES 38.6 38.6 40.3
HEADROOM REAR – INCHES 36.7 36.7 39.2
LEGROOM FRONT – INCHES 41.8 41.8 41.3
LEGROOM REAR – INCHES 40.1 40.1 39.0
SHOULDER ROOM FRONT – INCHES 59.5 59.5 65.3
SHOULDER ROOM REAR – INCHES 57.9 57.9 65.2
HIPROOM FRONT – INCHES 56.2 56.2 64.4
HIPROOM REAR – INCHES 56.1 56.1 60.6
INTERIOR VOLUME FRONT – CU. FT. 55.6 55.6 62.9
INTERIOR VOLUME REAR – CU. FT. 49.3 49.3 57.68
INTERIOR VOLUME COMB. – CU. FT. 104.9 104.9 120.58
TRUNK VOLUME – CU. FT. 14.8 14.8 108.9
Gas Gas Gas E85
EPA MILEAGE – CITY – MPG- Label 19 16 15 11
EPA MILEAGE CITY – MPG - Unadjusted 23.2 19.3 18.3 13.4
EPA MILEAGE – HIGHWAY – MPG - Label 26 25 21 16
.EPA MILEAGE – HIGHWAY – MPG - Unadjusted 36.6 34.6 29.4 22.2
EPA MILEAGE – COMBINED – MPG - Label 21 19 17 13
EPA MILEAGE – COMBINED – MPG Unadjusted 27.8 24.1 22.1 16.3
22
22
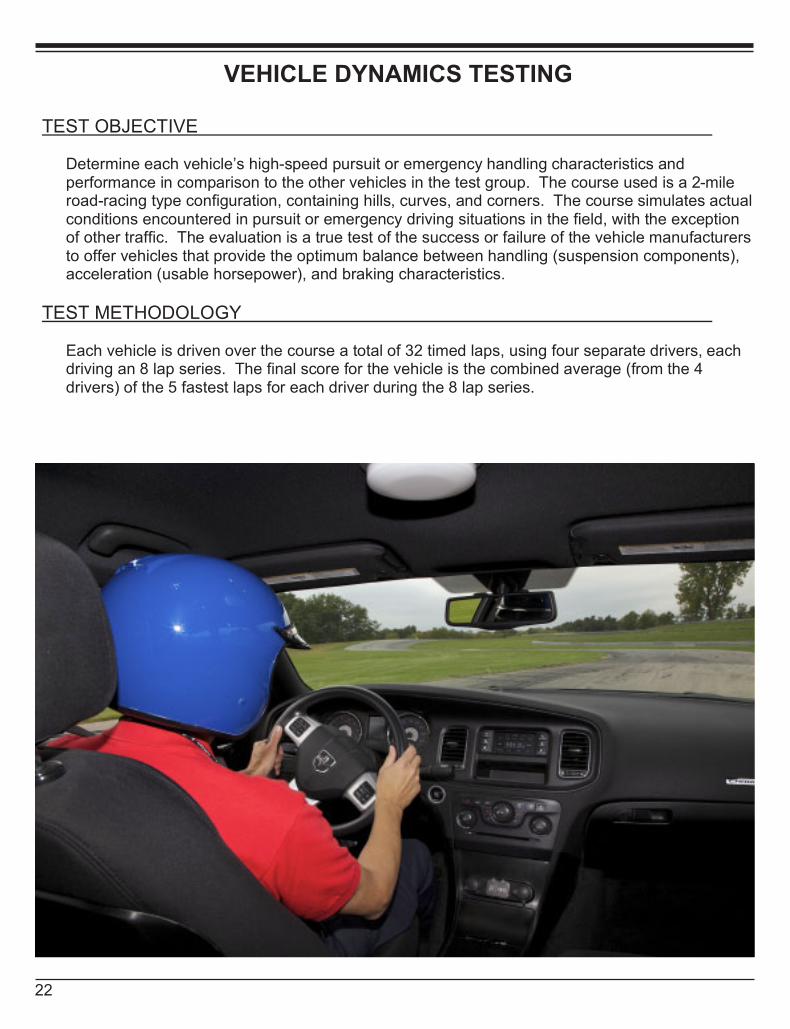
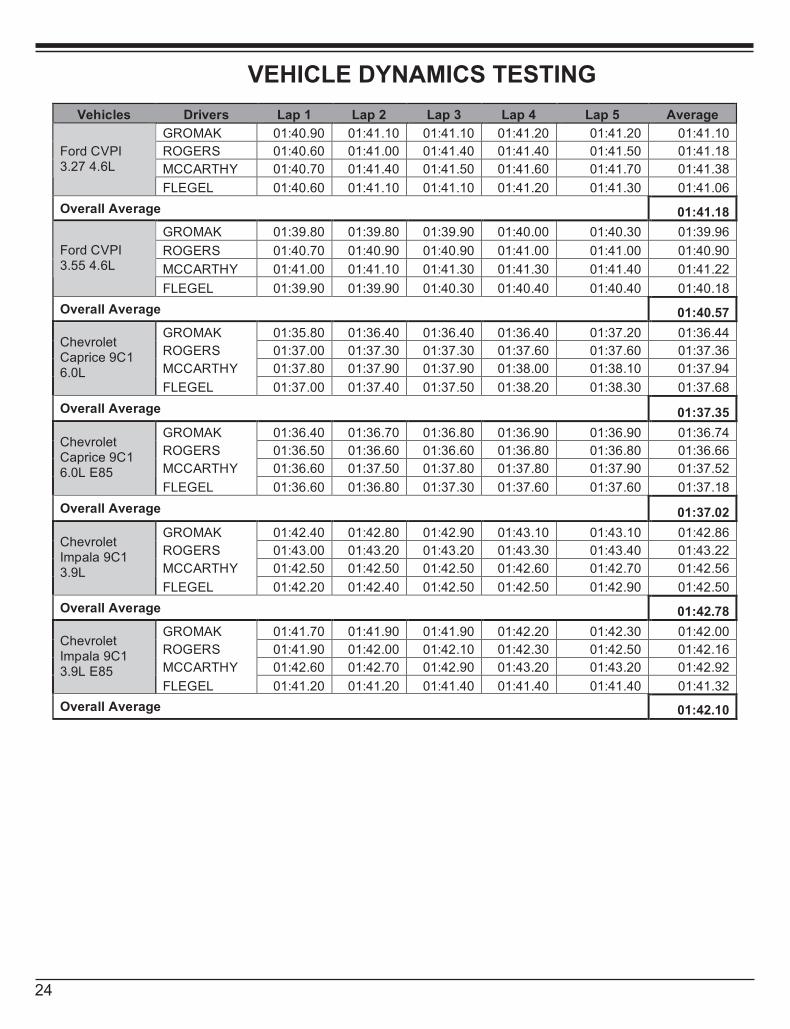
VEHICLE DYNAMICS TESTING
TEST OBJECTIVE
Determine each vehicle’s high-speed pursuit or emergency handling characteristics and performance in comparison to the other vehicles in the test group. The course used is a 2-mile road-racing type configuration, containing hills, curves, and corners. The course simulates actual conditions encountered in pursuit or emergency driving situations in the field, with the exception of other traffic. The evaluation is a true test of the success or failure of the vehicle manufacturers to offer vehicles that provide the optimum balance between handling (suspension components), acceleration (usable horsepower), and braking characteristics.
TEST METHODOLOGY
Each vehicle is driven over the course a total of 32 timed laps, using four separate drivers, each driving an 8 lap series. The final score for the vehicle is the combined average (from the 4 drivers) of the 5 fastest laps for each driver during the 8 lap series.
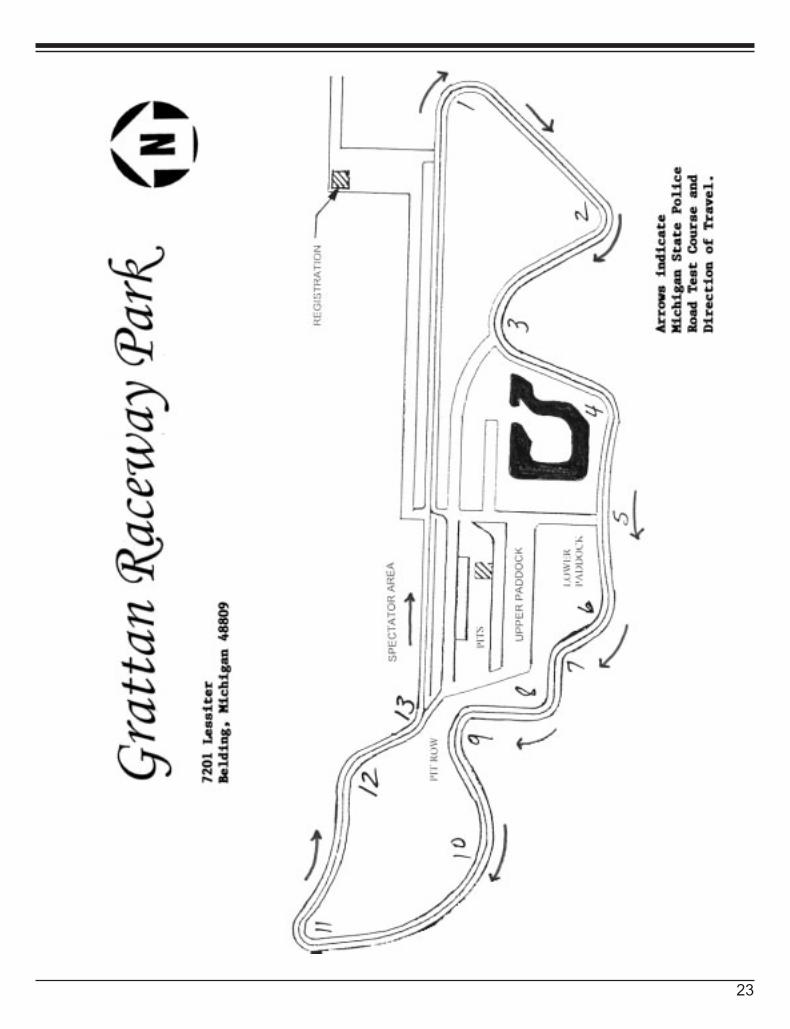
23
23
24
25
VEHICLE DYNAMICS TESTING
Vehicles Drivers Lap 1 Lap 2 Lap 3 Lap 4 Lap 5 Average
GROMAK 01:42.60 01:42.70 01:43.00 01:43.00 01:43.00 01:42.86
ROGERS 01:42.70 01:43.20 01:43.30 01:43.60 01:43.60 01:43.28
MCCARTHY 01:43.20 01:43.60 01:43.60 01:43.70 01:44.00 01:43.62
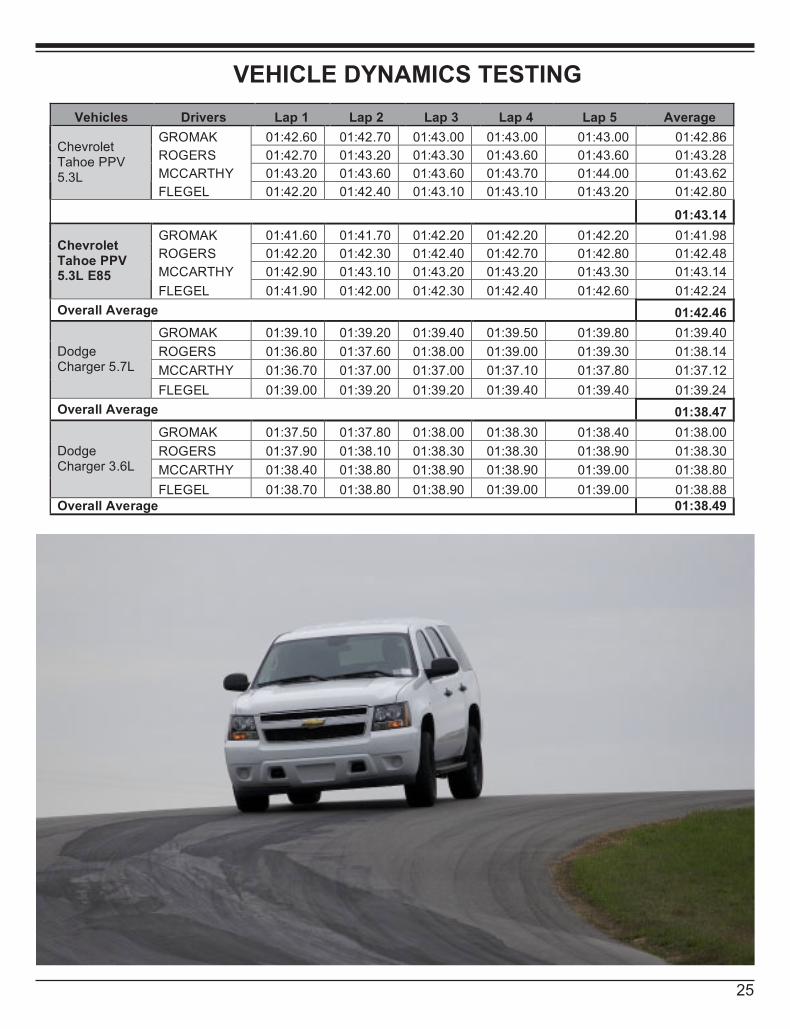
Chevrolet Tahoe PPV 5.3L
FLEGEL 01:42.20 01:42.40 01:43.10 01:43.10 01:43.20 01:42.80
01:43.14
GROMAK 01:41.60 01:41.70 01:42.20 01:42.20 01:42.20 01:41.98
ROGERS 01:42.20 01:42.30 01:42.40 01:42.70 01:42.80 01:42.48
MCCARTHY 01:42.90 01:43.10 01:43.20 01:43.20 01:43.30 01:43.14
Chevrolet Tahoe PPV 5.3L E85
FLEGEL 01:41.90 01:42.00 01:42.30 01:42.40 01:42.60 01:42.24
Overall Average 01:42.46
GROMAK 01:39.10 01:39.20 01:39.40 01:39.50 01:39.80 01:39.40
ROGERS 01:36.80 01:37.60 01:38.00 01:39.00 01:39.30 01:38.14
MCCARTHY 01:36.70 01:37.00 01:37.00 01:37.10 01:37.80 01:37.12
Dodge Charger 5.7L
FLEGEL 01:39.00 01:39.20 01:39.20 01:39.40 01:39.40 01:39.24
Overall Average 01:38.47
GROMAK 01:37.50 01:37.80 01:38.00 01:38.30 01:38.40 01:38.00
ROGERS 01:37.90 01:38.10 01:38.30 01:38.30 01:38.90 01:38.30
MCCARTHY 01:38.40 01:38.80 01:38.90 01:38.90 01:39.00 01:38.80
Dodge Charger 3.6L
FLEGEL 01:38.70 01:38.80 01:38.90 01:39.00 01:39.00 01:38.88 Overall Average 01:38.49
24
VEHICLE DYNAMICS TESTING
Vehicles Drivers Lap 1 Lap 2 Lap 3 Lap 4 Lap 5 Average
GROMAK 01:40.90 01:41.10 01:41.10 01:41.20 01:41.20 01:41.10
ROGERS 01:40.60 01:41.00 01:41.40 01:41.40 01:41.50 01:41.18
MCCARTHY 01:40.70 01:41.40 01:41.50 01:41.60 01:41.70 01:41.38
Ford CVPI 3.27 4.6L
FLEGEL 01:40.60 01:41.10 01:41.10 01:41.20 01:41.30 01:41.06
Overall Average 01:41.18
GROMAK 01:39.80 01:39.80 01:39.90 01:40.00 01:40.30 01:39.96
ROGERS 01:40.70 01:40.90 01:40.90 01:41.00 01:41.00 01:40.90
MCCARTHY 01:41.00 01:41.10 01:41.30 01:41.30 01:41.40 01:41.22
Ford CVPI 3.55 4.6L
FLEGEL 01:39.90 01:39.90 01:40.30 01:40.40 01:40.40 01:40.18
Overall Average 01:40.57
GROMAK 01:35.80 01:36.40 01:36.40 01:36.40 01:37.20 01:36.44
ROGERS 01:37.00 01:37.30 01:37.30 01:37.60 01:37.60 01:37.36
MCCARTHY 01:37.80 01:37.90 01:37.90 01:38.00 01:38.10 01:37.94
Chevrolet Caprice 9C1 6.0L
FLEGEL 01:37.00 01:37.40 01:37.50 01:38.20 01:38.30 01:37.68
Overall Average 01:37.35
GROMAK 01:36.40 01:36.70 01:36.80 01:36.90 01:36.90 01:36.74
ROGERS 01:36.50 01:36.60 01:36.60 01:36.80 01:36.80 01:36.66
MCCARTHY 01:36.60 01:37.50 01:37.80 01:37.80 01:37.90 01:37.52
Chevrolet Caprice 9C1 6.0L E85
FLEGEL 01:36.60 01:36.80 01:37.30 01:37.60 01:37.60 01:37.18
Overall Average 01:37.02
GROMAK 01:42.40 01:42.80 01:42.90 01:43.10 01:43.10 01:42.86
ROGERS 01:43.00 01:43.20 01:43.20 01:43.30 01:43.40 01:43.22
MCCARTHY 01:42.50 01:42.50 01:42.50 01:42.60 01:42.70 01:42.56
Chevrolet Impala 9C1 3.9L
FLEGEL 01:42.20 01:42.40 01:42.50 01:42.50 01:42.90 01:42.50
Overall Average 01:42.78
GROMAK 01:41.70 01:41.90 01:41.90 01:42.20 01:42.30 01:42.00
ROGERS 01:41.90 01:42.00 01:42.10 01:42.30 01:42.50 01:42.16
MCCARTHY 01:42.60 01:42.70 01:42.90 01:43.20 01:43.20 01:42.92
Chevrolet Impala 9C1 3.9L E85
FLEGEL 01:41.20 01:41.20 01:41.40 01:41.40 01:41.40 01:41.32
Overall Average 01:42.10
25
25
VEHICLE DYNAMICS TESTING
Vehicles Drivers Lap 1 Lap 2 Lap 3 Lap 4 Lap 5 Average
GROMAK 01:42.60 01:42.70 01:43.00 01:43.00 01:43.00 01:42.86
ROGERS 01:42.70 01:43.20 01:43.30 01:43.60 01:43.60 01:43.28
MCCARTHY 01:43.20 01:43.60 01:43.60 01:43.70 01:44.00 01:43.62
Chevrolet Tahoe PPV 5.3L
FLEGEL 01:42.20 01:42.40 01:43.10 01:43.10 01:43.20 01:42.80
01:43.14
GROMAK 01:41.60 01:41.70 01:42.20 01:42.20 01:42.20 01:41.98
ROGERS 01:42.20 01:42.30 01:42.40 01:42.70 01:42.80 01:42.48
MCCARTHY 01:42.90 01:43.10 01:43.20 01:43.20 01:43.30 01:43.14
Chevrolet Tahoe PPV 5.3L E85
FLEGEL 01:41.90 01:42.00 01:42.30 01:42.40 01:42.60 01:42.24
Overall Average 01:42.46
GROMAK 01:39.10 01:39.20 01:39.40 01:39.50 01:39.80 01:39.40
ROGERS 01:36.80 01:37.60 01:38.00 01:39.00 01:39.30 01:38.14
MCCARTHY 01:36.70 01:37.00 01:37.00 01:37.10 01:37.80 01:37.12
Dodge Charger 5.7L
FLEGEL 01:39.00 01:39.20 01:39.20 01:39.40 01:39.40 01:39.24
Overall Average 01:38.47
GROMAK 01:37.50 01:37.80 01:38.00 01:38.30 01:38.40 01:38.00
ROGERS 01:37.90 01:38.10 01:38.30 01:38.30 01:38.90 01:38.30
MCCARTHY 01:38.40 01:38.80 01:38.90 01:38.90 01:39.00 01:38.80
Dodge Charger 3.6L
FLEGEL 01:38.70 01:38.80 01:38.90 01:39.00 01:39.00 01:38.88 Overall Average 01:38.49
24
VEHICLE DYNAMICS TESTING
Vehicles Drivers Lap 1 Lap 2 Lap 3 Lap 4 Lap 5 Average
GROMAK 01:40.90 01:41.10 01:41.10 01:41.20 01:41.20 01:41.10
ROGERS 01:40.60 01:41.00 01:41.40 01:41.40 01:41.50 01:41.18
MCCARTHY 01:40.70 01:41.40 01:41.50 01:41.60 01:41.70 01:41.38
Ford CVPI 3.27 4.6L
FLEGEL 01:40.60 01:41.10 01:41.10 01:41.20 01:41.30 01:41.06
Overall Average 01:41.18
GROMAK 01:39.80 01:39.80 01:39.90 01:40.00 01:40.30 01:39.96
ROGERS 01:40.70 01:40.90 01:40.90 01:41.00 01:41.00 01:40.90
MCCARTHY 01:41.00 01:41.10 01:41.30 01:41.30 01:41.40 01:41.22
Ford CVPI 3.55 4.6L
FLEGEL 01:39.90 01:39.90 01:40.30 01:40.40 01:40.40 01:40.18
Overall Average 01:40.57
GROMAK 01:35.80 01:36.40 01:36.40 01:36.40 01:37.20 01:36.44
ROGERS 01:37.00 01:37.30 01:37.30 01:37.60 01:37.60 01:37.36
MCCARTHY 01:37.80 01:37.90 01:37.90 01:38.00 01:38.10 01:37.94
Chevrolet Caprice 9C1 6.0L
FLEGEL 01:37.00 01:37.40 01:37.50 01:38.20 01:38.30 01:37.68
Overall Average 01:37.35
GROMAK 01:36.40 01:36.70 01:36.80 01:36.90 01:36.90 01:36.74
ROGERS 01:36.50 01:36.60 01:36.60 01:36.80 01:36.80 01:36.66
MCCARTHY 01:36.60 01:37.50 01:37.80 01:37.80 01:37.90 01:37.52
Chevrolet Caprice 9C1 6.0L E85
FLEGEL 01:36.60 01:36.80 01:37.30 01:37.60 01:37.60 01:37.18
Overall Average 01:37.02
GROMAK 01:42.40 01:42.80 01:42.90 01:43.10 01:43.10 01:42.86
ROGERS 01:43.00 01:43.20 01:43.20 01:43.30 01:43.40 01:43.22
MCCARTHY 01:42.50 01:42.50 01:42.50 01:42.60 01:42.70 01:42.56
Chevrolet Impala 9C1 3.9L
FLEGEL 01:42.20 01:42.40 01:42.50 01:42.50 01:42.90 01:42.50
Overall Average 01:42.78
GROMAK 01:41.70 01:41.90 01:41.90 01:42.20 01:42.30 01:42.00
ROGERS 01:41.90 01:42.00 01:42.10 01:42.30 01:42.50 01:42.16
MCCARTHY 01:42.60 01:42.70 01:42.90 01:43.20 01:43.20 01:42.92
Chevrolet Impala 9C1 3.9L E85
FLEGEL 01:41.20 01:41.20 01:41.40 01:41.40 01:41.40 01:41.32
Overall Average 01:42.10
26
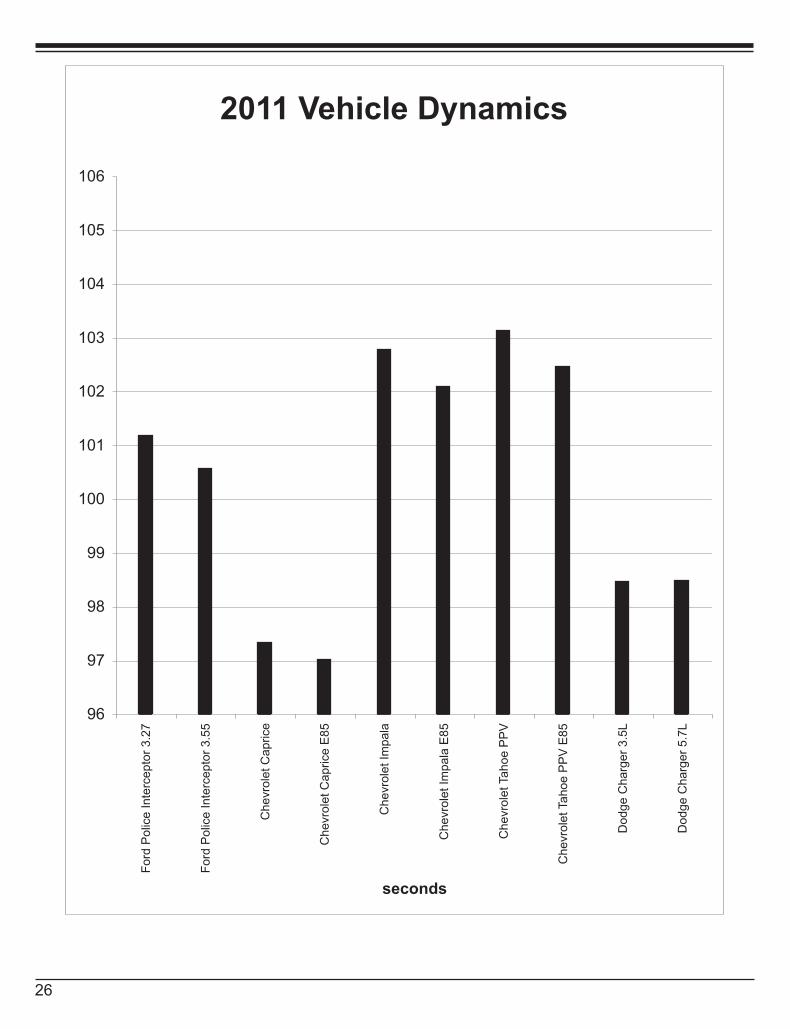
2011 Vehicle Dynamics
96
97
98
99
100
101
102
103
104
105
106
Ford
Polic
e Inte
rcepto
r 3.2
7
Ford
Polic
e Inte
rcepto
r 3.5
5
Chevro
let C
aprice
Chevro
let C
aprice E
85
Chevro
let Im
pala
Chevro
let Im
pala
E85
Chevro
let Tahoe P
PV
Chevro
let Tahoe P
PV
E85
Dodge C
harg
er
3.5
L
Dodge C
harg
er
5.7
L
seconds
27
27
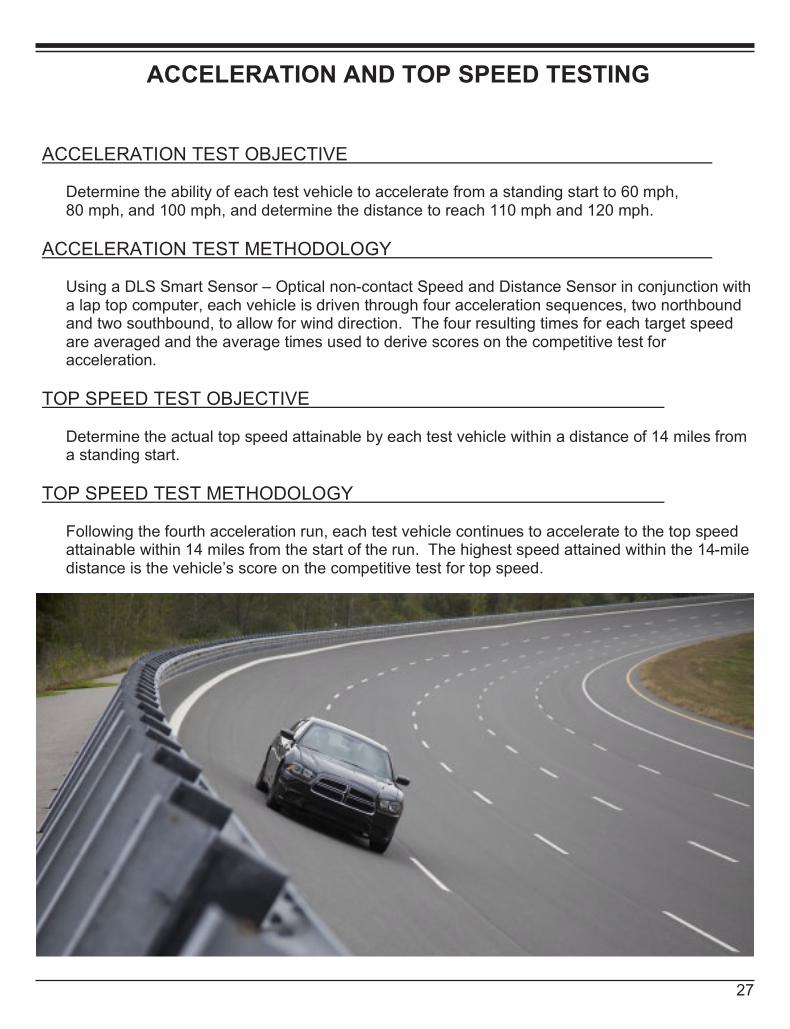
ACCELERATION AND TOP SPEED TESTING
ACCELERATION TEST OBJECTIVE
Determine the ability of each test vehicle to accelerate from a standing start to 60 mph, 80 mph, and 100 mph, and determine the distance to reach 110 mph and 120 mph.
ACCELERATION TEST METHODOLOGY
Using a DLS Smart Sensor – Optical non-contact Speed and Distance Sensor in conjunction with a lap top computer, each vehicle is driven through four acceleration sequences, two northbound and two southbound, to allow for wind direction. The four resulting times for each target speed are averaged and the average times used to derive scores on the competitive test for acceleration.
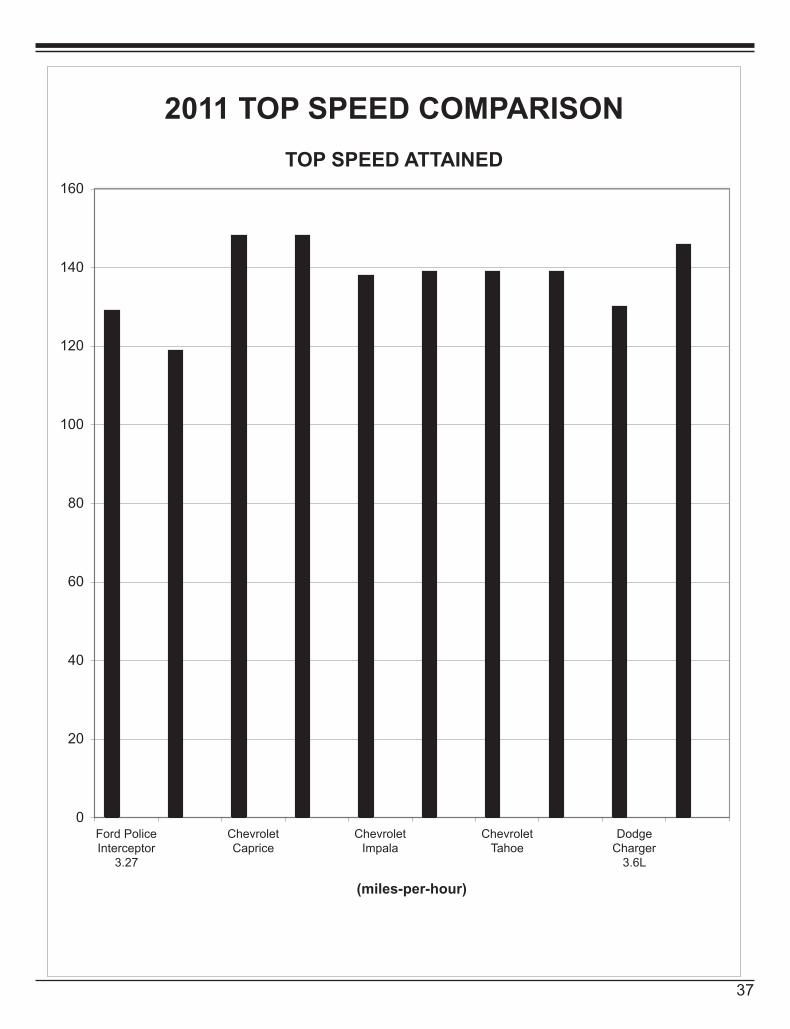
TOP SPEED TEST OBJECTIVE
Determine the actual top speed attainable by each test vehicle within a distance of 14 miles from a standing start.
TOP SPEED TEST METHODOLOGY
Following the fourth acceleration run, each test vehicle continues to accelerate to the top speed attainable within 14 miles from the start of the run. The highest speed attained within the 14-mile distance is the vehicle’s score on the competitive test for top speed.
Picture
2011 Vehicle Dynamics
96
97
98
99
100
101
102
103
104
105
106
Ford
Polic
e Inte
rcepto
r 3.2
7
Ford
Polic
e Inte
rcepto
r 3.5
5
Chevro
let C
aprice
Chevro
let C
aprice E
85
Chevro
let Im
pala
Chevro
let Im
pala
E85
Chevro
let Tahoe P
PV
Chevro
let Tahoe P
PV
E85
Dodge C
harg
er
3.5
L
Dodge C
harg
er
5.7
L
seconds
28
28
29
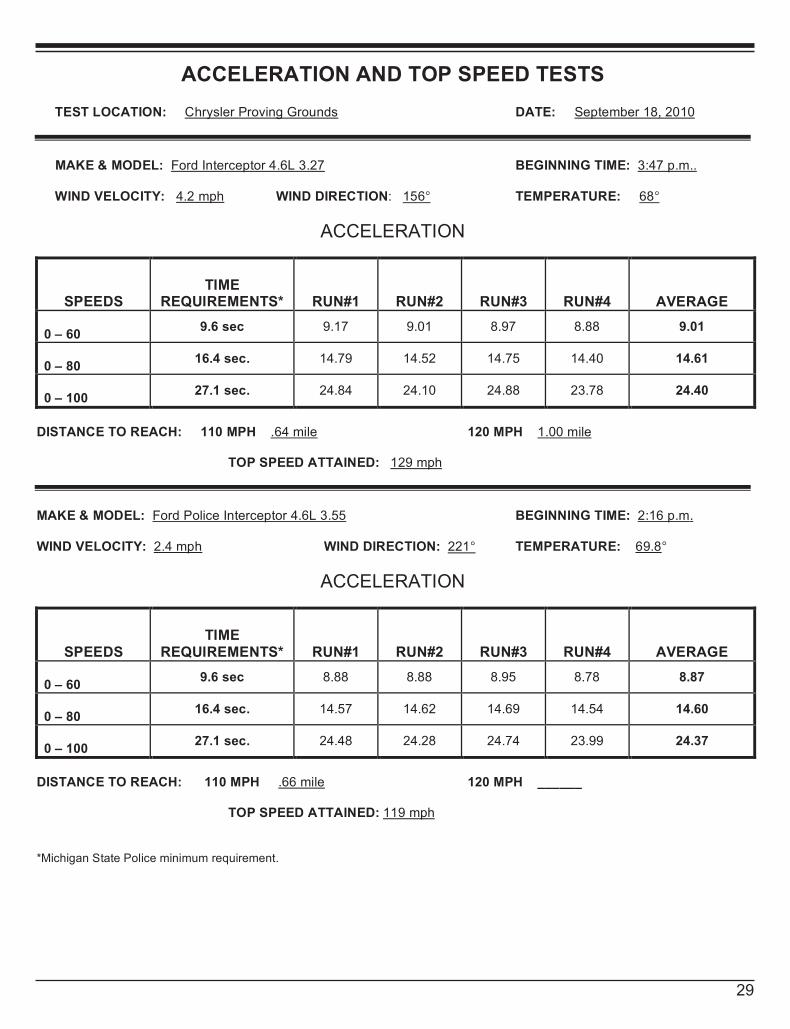
ACCELERATION AND TOP SPEED TESTS
TEST LOCATION: Chrysler Proving Grounds DATE: September 18, 2010
MAKE & MODEL: Ford Interceptor 4.6L 3.27 BEGINNING TIME: 3:47 p.m.. WIND VELOCITY: 4.2 mph WIND DIRECTION: 156° TEMPERATURE: 68°
ACCELERATION
SPEEDS TIME
REQUIREMENTS*
RUN#1
RUN#2
RUN#3
RUN#4
AVERAGE 0 – 60
9.6 sec 9.17 9.01 8.97 8.88 9.01
0 – 80
16.4 sec. 14.79 14.52 14.75 14.40 14.61
0 – 100
27.1 sec. 24.84 24.10 24.88 23.78 24.40
DISTANCE TO REACH: 110 MPH .64 mile 120 MPH 1.00 mile TOP SPEED ATTAINED: 129 mph
MAKE & MODEL: Ford Police Interceptor 4.6L 3.55 BEGINNING TIME: 2:16 p.m. WIND VELOCITY: 2.4 mph WIND DIRECTION: 221° TEMPERATURE: 69.8°
ACCELERATION
SPEEDS TIME
REQUIREMENTS*
RUN#1
RUN#2
RUN#3
RUN#4
AVERAGE 0 – 60
9.6 sec 8.88 8.88 8.95 8.78 8.87
0 – 80
16.4 sec. 14.57 14.62 14.69 14.54 14.60
0 – 100
27.1 sec. 24.48 24.28 24.74 23.99 24.37
DISTANCE TO REACH: 110 MPH .66 mile 120 MPH ______ TOP SPEED ATTAINED: 119 mph *Michigan State Police minimum requirement.
29
29
ACCELERATION AND TOP SPEED TESTS
TEST LOCATION: Chrysler Proving Grounds DATE: September 18, 2010
MAKE & MODEL: Ford Interceptor 4.6L 3.27 BEGINNING TIME: 3:47 p.m.. WIND VELOCITY: 4.2 mph WIND DIRECTION: 156° TEMPERATURE: 68°
ACCELERATION
SPEEDS TIME
REQUIREMENTS*
RUN#1
RUN#2
RUN#3
RUN#4
AVERAGE 0 – 60
9.6 sec 9.17 9.01 8.97 8.88 9.01
0 – 80
16.4 sec. 14.79 14.52 14.75 14.40 14.61
0 – 100
27.1 sec. 24.84 24.10 24.88 23.78 24.40
DISTANCE TO REACH: 110 MPH .64 mile 120 MPH 1.00 mile TOP SPEED ATTAINED: 129 mph
MAKE & MODEL: Ford Police Interceptor 4.6L 3.55 BEGINNING TIME: 2:16 p.m. WIND VELOCITY: 2.4 mph WIND DIRECTION: 221° TEMPERATURE: 69.8°
ACCELERATION
SPEEDS TIME
REQUIREMENTS*
RUN#1
RUN#2
RUN#3
RUN#4
AVERAGE 0 – 60
9.6 sec 8.88 8.88 8.95 8.78 8.87
0 – 80
16.4 sec. 14.57 14.62 14.69 14.54 14.60
0 – 100
27.1 sec. 24.48 24.28 24.74 23.99 24.37
DISTANCE TO REACH: 110 MPH .66 mile 120 MPH ______ TOP SPEED ATTAINED: 119 mph *Michigan State Police minimum requirement.
30
30
ACCELERATION AND TOP SPEED TESTS
TEST LOCATION: Chrysler Proving Grounds DATE: September 18, 2010
MAKE & MODEL: Chevrolet Caprice 9C1 BEGINNING TIME: 3:29 p.m. WIND VELOCITY: 1.5 mph WIND DIRECTION: 119° TEMPERATURE: 68°
ACCELERATION
SPEEDS TIME
REQUIREMENTS*
RUN#1
RUN#2
RUN#3
RUN#4
AVERAGE 0 – 60
9.6 sec 6.32 6.23 6.02 6.14 6.18
0 – 80
16.4 sec. 10.22 10.00 9.87 9.95 10.01
0 – 100
27.1 sec. 15.01 14.81 14.62 14.65 14.77
DISTANCE TO REACH: 110 MPH .35 mile 120 MPH .48 mile TOP SPEED ATTAINED: 148 mph
MAKE & MODEL: Chevrolet Caprice 9C1 E85 BEGINNING TIME: 12:43 p.m. WIND VELOCITY: 4.7 mph WIND DIRECTION: 219° TEMPERATURE: 66.7°
ACCELERATION
SPEEDS TIME
REQUIREMENTS*
RUN#1
RUN#2
RUN#3
RUN#4
AVERAGE 0 – 60
9.6 sec 6.32 6.16 6.09 6.01 6.15
0 – 80
16.4 sec. 10.21 9.91 9.82 9.69 9.91
0 – 100
27.1 sec. 14.96 14.56 14.55 14.25 14.58
DISTANCE TO REACH: 110 MPH .34 mile 120 MPH .45 mile TOP SPEED ATTAINED: 148 mph *Michigan State Police minimum requirement.
31
ACCELERATION AND TOP SPEED TESTS
TEST LOCATION: Chrysler Proving Grounds DATE: September 18, 2010
MAKE & MODEL: Chevrolet Impala 9C1 BEGINNING TIME: 8:03 a.m. WIND VELOCITY: 6.4 mph WIND DIRECTION: 180° TEMPERATURE: 55.1°
ACCELERATION
SPEEDS TIME
REQUIREMENTS*
RUN#1
RUN#2
RUN#3
RUN#4
AVERAGE 0 – 60
9.6 sec 8.98 8.77 8.86 8.53 8.78
0 – 80
16.4 sec. 14.27 14.01 13.98 13.68 13.99
0 – 100
27.1 sec. 24.39 23.28 24.43 22.86 23.74
DISTANCE TO REACH: 110 MPH .60 mile 120 MPH .85 mile TOP SPEED ATTAINED: 138 mph
MAKE & MODEL: Chevrolet Impala 9C1 E85 BEGINNING TIME: 5:07 p.m. WIND VELOCITY: 2.4 mph WIND DIRECTION: 230° TEMPERATURE: 69.4°
ACCELERATION
SPEEDS TIME
REQUIREMENTS*
RUN#1
RUN#2
RUN#3
RUN#4
AVERAGE 0 – 60
9.6 sec 8.83 8.64 8.65 8.60 8.68
0 – 80
16.4 sec. 14.12 13.83 13.90 13.76 13.90
0 – 100
27.1 sec. 23.30 22.82 23.01 22.64 22.94
DISTANCE TO REACH: 110 MPH .58 mile 120 MPH .83 mile TOP SPEED ATTAINED: 139 mph *Michigan State Police minimum requirement.

31
31
ACCELERATION AND TOP SPEED TESTS
TEST LOCATION: Chrysler Proving Grounds DATE: September 18, 2010
MAKE & MODEL: Chevrolet Impala 9C1 BEGINNING TIME: 8:03 a.m. WIND VELOCITY: 6.4 mph WIND DIRECTION: 180° TEMPERATURE: 55.1°
ACCELERATION
SPEEDS TIME
REQUIREMENTS*
RUN#1
RUN#2
RUN#3
RUN#4
AVERAGE 0 – 60
9.6 sec 8.98 8.77 8.86 8.53 8.78
0 – 80
16.4 sec. 14.27 14.01 13.98 13.68 13.99
0 – 100
27.1 sec. 24.39 23.28 24.43 22.86 23.74
DISTANCE TO REACH: 110 MPH .60 mile 120 MPH .85 mile TOP SPEED ATTAINED: 138 mph
MAKE & MODEL: Chevrolet Impala 9C1 E85 BEGINNING TIME: 5:07 p.m. WIND VELOCITY: 2.4 mph WIND DIRECTION: 230° TEMPERATURE: 69.4°
ACCELERATION
SPEEDS TIME
REQUIREMENTS*
RUN#1
RUN#2
RUN#3
RUN#4
AVERAGE 0 – 60
9.6 sec 8.83 8.64 8.65 8.60 8.68
0 – 80
16.4 sec. 14.12 13.83 13.90 13.76 13.90
0 – 100
27.1 sec. 23.30 22.82 23.01 22.64 22.94
DISTANCE TO REACH: 110 MPH .58 mile 120 MPH .83 mile TOP SPEED ATTAINED: 139 mph *Michigan State Police minimum requirement.
32
32
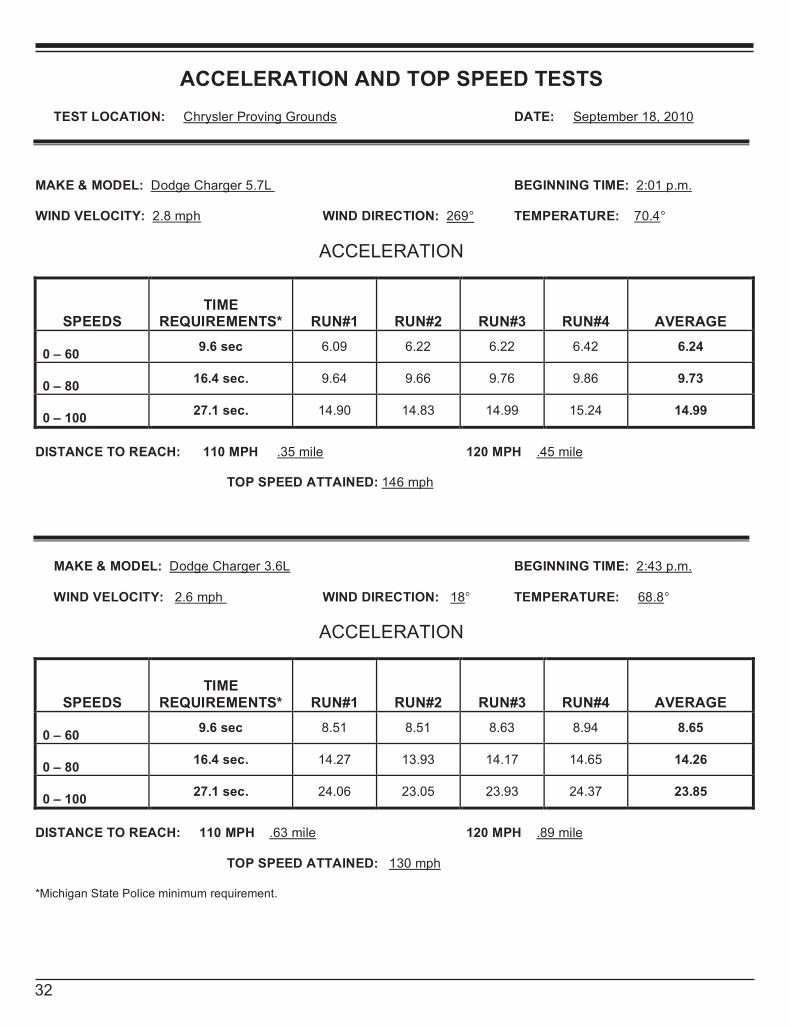
ACCELERATION AND TOP SPEED TESTS
TEST LOCATION: Chrysler Proving Grounds DATE: September 18, 2010
MAKE & MODEL: Dodge Charger 5.7L BEGINNING TIME: 2:01 p.m. WIND VELOCITY: 2.8 mph WIND DIRECTION: 269° TEMPERATURE: 70.4°
ACCELERATION
SPEEDS TIME
REQUIREMENTS*
RUN#1
RUN#2
RUN#3
RUN#4
AVERAGE 0 – 60
9.6 sec 6.09 6.22 6.22 6.42 6.24
0 – 80
16.4 sec. 9.64 9.66 9.76 9.86 9.73
0 – 100
27.1 sec. 14.90 14.83 14.99 15.24 14.99
DISTANCE TO REACH: 110 MPH .35 mile 120 MPH .45 mile TOP SPEED ATTAINED: 146 mph
MAKE & MODEL: Dodge Charger 3.6L BEGINNING TIME: 2:43 p.m. WIND VELOCITY: 2.6 mph WIND DIRECTION: 18° TEMPERATURE: 68.8°
ACCELERATION
SPEEDS TIME
REQUIREMENTS*
RUN#1
RUN#2
RUN#3
RUN#4
AVERAGE 0 – 60
9.6 sec 8.51 8.51 8.63 8.94 8.65
0 – 80
16.4 sec. 14.27 13.93 14.17 14.65 14.26
0 – 100
27.1 sec. 24.06 23.05 23.93 24.37 23.85
DISTANCE TO REACH: 110 MPH .63 mile 120 MPH .89 mile TOP SPEED ATTAINED: 130 mph *Michigan State Police minimum requirement.
33
33
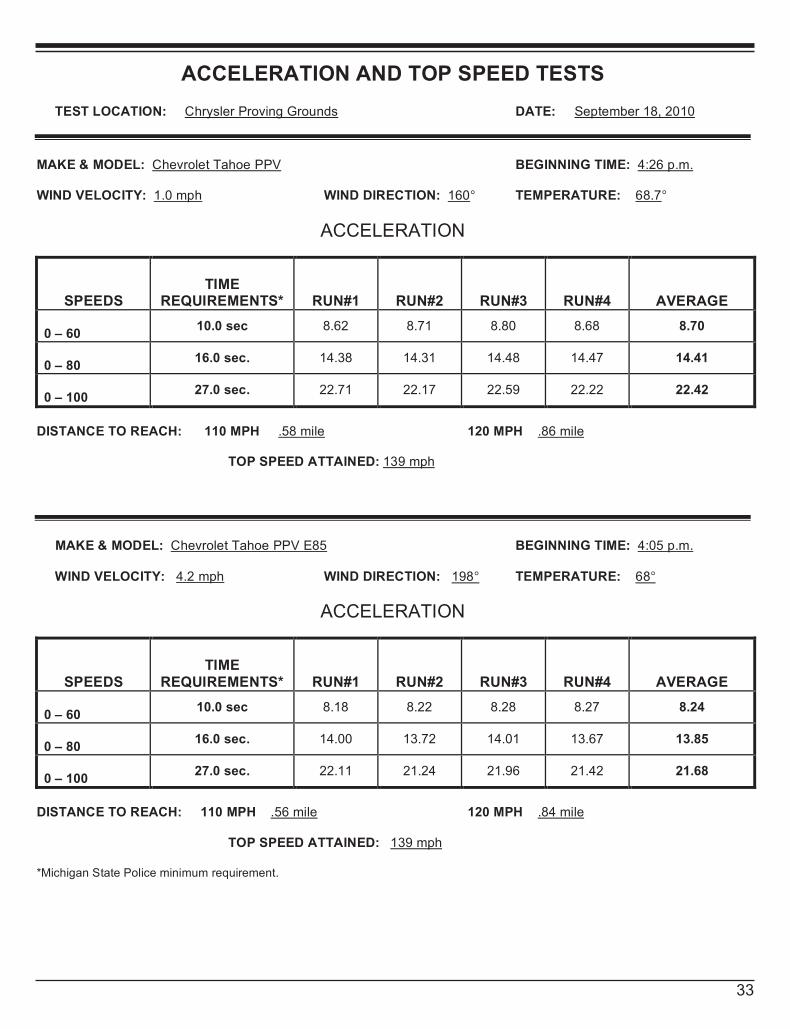
ACCELERATION AND TOP SPEED TESTS
TEST LOCATION: Chrysler Proving Grounds DATE: September 18, 2010
MAKE & MODEL: Chevrolet Tahoe PPV BEGINNING TIME: 4:26 p.m. WIND VELOCITY: 1.0 mph WIND DIRECTION: 160° TEMPERATURE: 68.7°
ACCELERATION
SPEEDS TIME
REQUIREMENTS*
RUN#1
RUN#2
RUN#3
RUN#4
AVERAGE 0 – 60
10.0 sec 8.62 8.71 8.80 8.68 8.70
0 – 80
16.0 sec. 14.38 14.31 14.48 14.47 14.41
0 – 100
27.0 sec. 22.71 22.17 22.59 22.22 22.42
DISTANCE TO REACH: 110 MPH .58 mile 120 MPH .86 mile TOP SPEED ATTAINED: 139 mph
MAKE & MODEL: Chevrolet Tahoe PPV E85 BEGINNING TIME: 4:05 p.m. WIND VELOCITY: 4.2 mph WIND DIRECTION: 198° TEMPERATURE: 68°
ACCELERATION
SPEEDS TIME
REQUIREMENTS*
RUN#1
RUN#2
RUN#3
RUN#4
AVERAGE 0 – 60
10.0 sec 8.18 8.22 8.28 8.27 8.24
0 – 80
16.0 sec. 14.00 13.72 14.01 13.67 13.85
0 – 100
27.0 sec. 22.11 21.24 21.96 21.42 21.68
DISTANCE TO REACH: 110 MPH .56 mile 120 MPH .84 mile TOP SPEED ATTAINED: 139 mph *Michigan State Police minimum requirement.
34
34
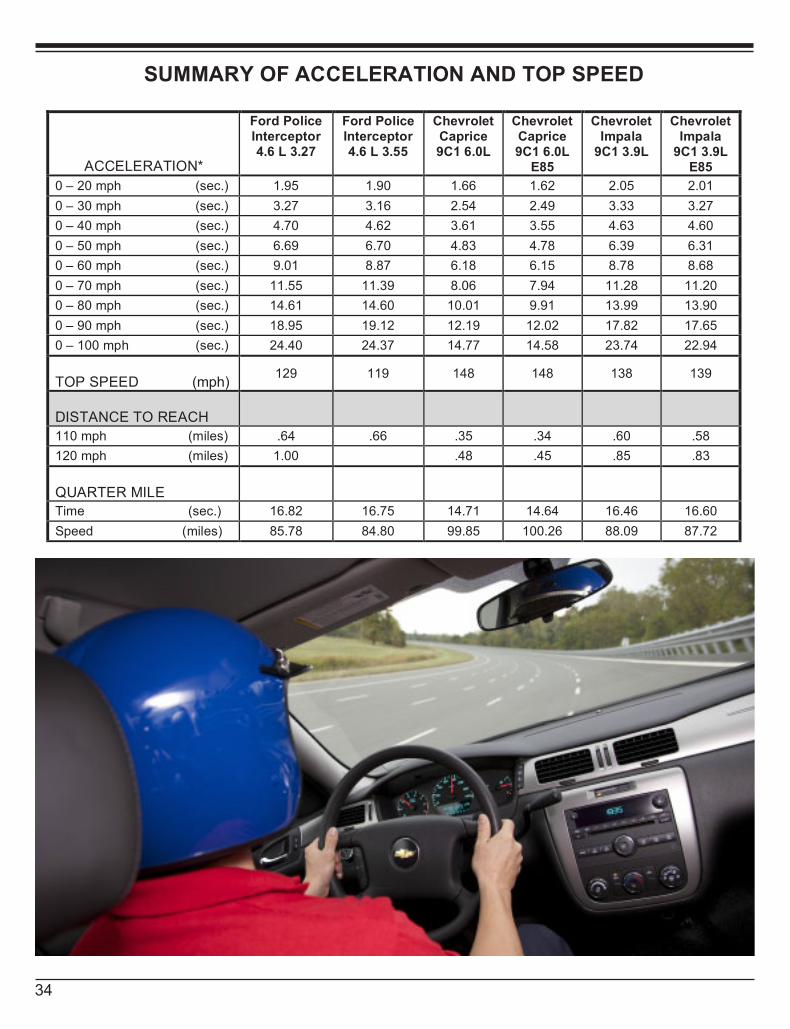
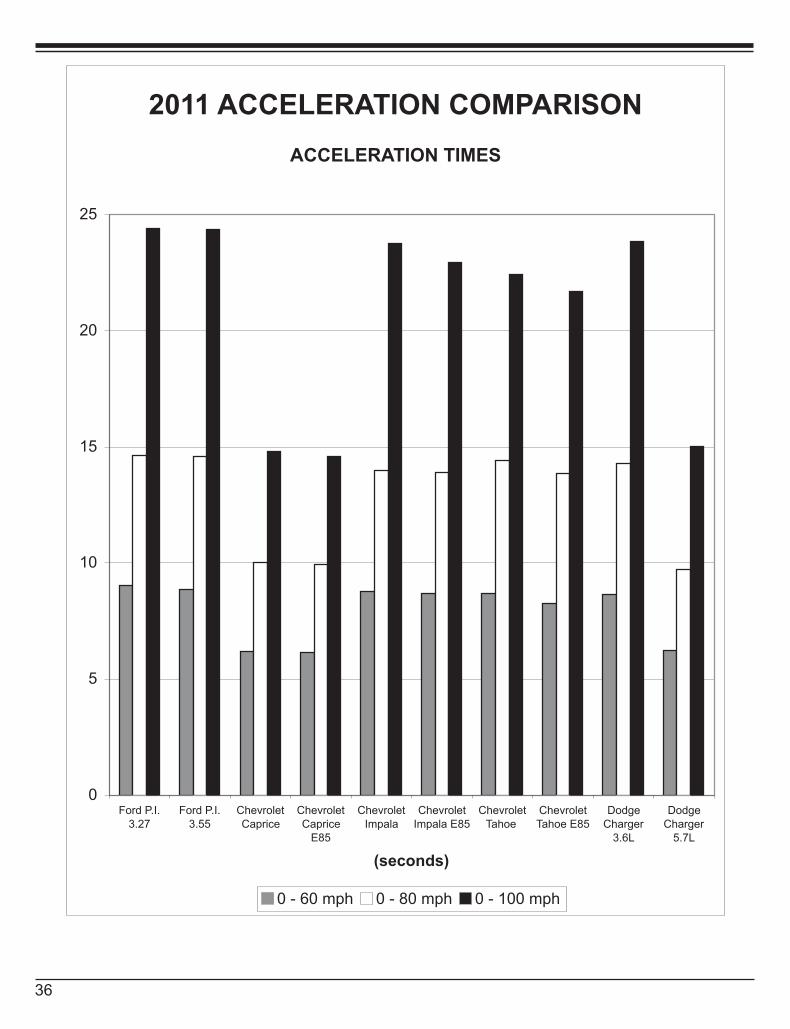
SUMMARY OF ACCELERATION AND TOP SPEED
ACCELERATION*
Ford Police Interceptor 4.6 L 3.27
Ford Police Interceptor 4.6 L 3.55
Chevrolet Caprice 9C1 6.0L
Chevrolet Caprice 9C1 6.0L
E85
Chevrolet Impala
9C1 3.9L
Chevrolet Impala
9C1 3.9L E85
0 – 20 mph (sec.) 1.95 1.90 1.66 1.62 2.05 2.01
0 – 30 mph (sec.) 3.27 3.16 2.54 2.49 3.33 3.27
0 – 40 mph (sec.) 4.70 4.62 3.61 3.55 4.63 4.60
0 – 50 mph (sec.) 6.69 6.70 4.83 4.78 6.39 6.31
0 – 60 mph (sec.) 9.01 8.87 6.18 6.15 8.78 8.68
0 – 70 mph (sec.) 11.55 11.39 8.06 7.94 11.28 11.20
0 – 80 mph (sec.) 14.61 14.60 10.01 9.91 13.99 13.90
0 – 90 mph (sec.) 18.95 19.12 12.19 12.02 17.82 17.65
0 – 100 mph (sec.) 24.40 24.37 14.77 14.58 23.74 22.94
TOP SPEED (mph) 129 119 148 148 138 139
DISTANCE TO REACH
110 mph (miles) .64 .66 .35 .34 .60 .58
120 mph (miles) 1.00 .48 .45 .85 .83
QUARTER MILE
Time (sec.) 16.82 16.75 14.71 14.64 16.46 16.60
Speed (miles) 85.78 84.80 99.85 100.26 88.09 87.72
35
35
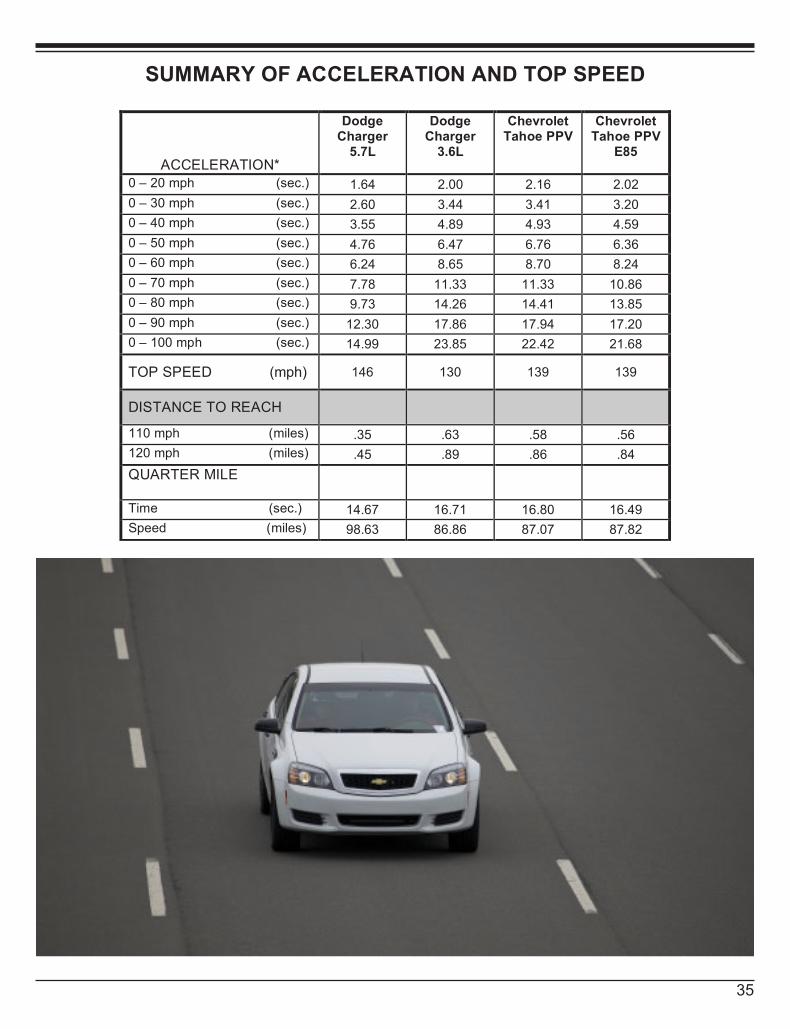
SUMMARY OF ACCELERATION AND TOP SPEED
ACCELERATION*
Dodge Charger
5.7L
Dodge Charger
3.6L
Chevrolet Tahoe PPV
Chevrolet Tahoe PPV
E85
0 – 20 mph (sec.) 1.64 2.00 2.16 2.02
0 – 30 mph (sec.) 2.60 3.44 3.41 3.20
0 – 40 mph (sec.) 3.55 4.89 4.93 4.59
0 – 50 mph (sec.) 4.76 6.47 6.76 6.36
0 – 60 mph (sec.) 6.24 8.65 8.70 8.24
0 – 70 mph (sec.) 7.78 11.33 11.33 10.86
0 – 80 mph (sec.) 9.73 14.26 14.41 13.85
0 – 90 mph (sec.) 12.30 17.86 17.94 17.20
0 – 100 mph (sec.) 14.99 23.85 22.42 21.68
TOP SPEED (mph) 146 130 139 139
DISTANCE TO REACH
110 mph (miles) .35 .63 .58 .56
120 mph (miles) .45 .89 .86 .84
QUARTER MILE
Time (sec.) 14.67 16.71 16.80 16.49
Speed (miles) 98.63 86.86 87.07 87.82
36
2011 ACCELERATION COMPARISON
ACCELERATION TIMES
0
5
10
15
20
25
Ford P.I.
3.27
Ford P.I.
3.55
Chevrolet
Caprice
Chevrolet
Caprice
E85
Chevrolet
Impala
Chevrolet
Impala E85
Chevrolet
Tahoe
Chevrolet
Tahoe E85
Dodge
Charger
3.6L
Dodge
Charger
5.7L
(seconds)
0 - 60 mph 0 - 80 mph 0 - 100 mph
37
2011 ACCELERATION COMPARISON
ACCELERATION TIMES
0
5
10
15
20
25
Ford P.I.
3.27
Ford P.I.
3.55
Chevrolet
Caprice
Chevrolet
Caprice
E85
Chevrolet
Impala
Chevrolet
Impala E85
Chevrolet
Tahoe
Chevrolet
Tahoe E85
Dodge
Charger
3.6L
Dodge
Charger
5.7L
(seconds)
0 - 60 mph 0 - 80 mph 0 - 100 mph
2011 TOP SPEED COMPARISON
TOP SPEED ATTAINED
0
20
40
60
80
100
120
140
160
Ford Police
Interceptor
3.27
Chevrolet
Caprice
Chevrolet
Impala
Chevrolet
Tahoe
Dodge
Charger
3.6L
(miles-per-hour)
38
38
BRAKE TESTING
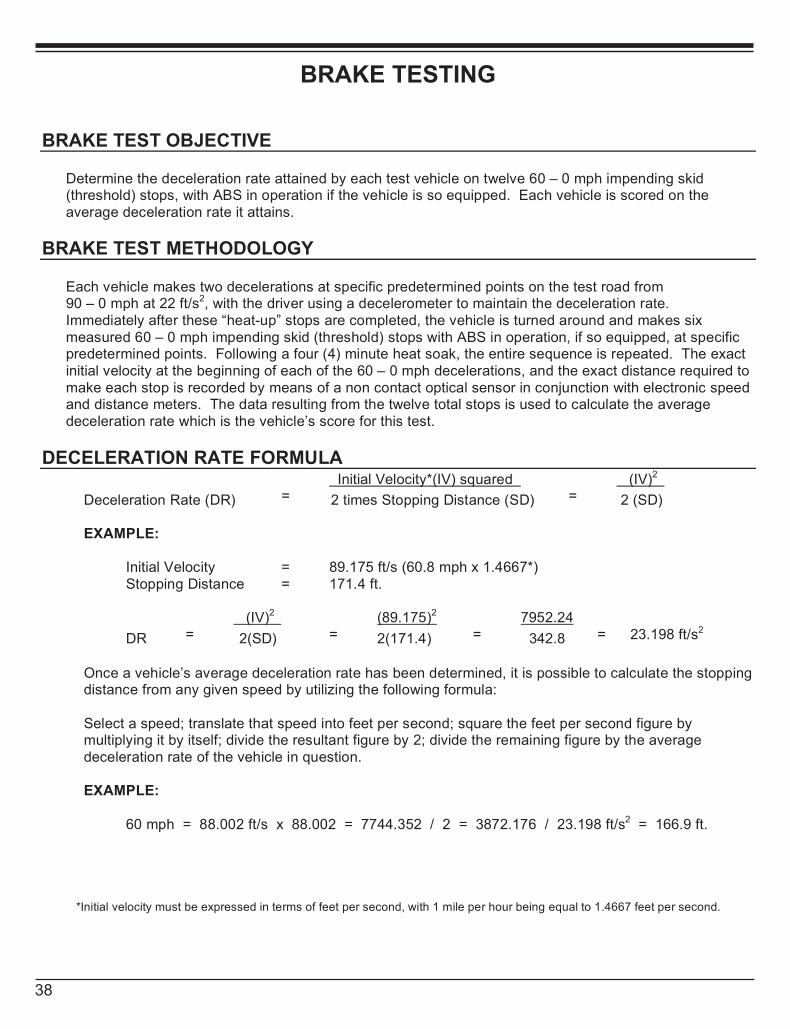
BRAKE TEST OBJECTIVE
Determine the deceleration rate attained by each test vehicle on twelve 60 – 0 mph impending skid (threshold) stops, with ABS in operation if the vehicle is so equipped. Each vehicle is scored on the average deceleration rate it attains.
BRAKE TEST METHODOLOGY
Each vehicle makes two decelerations at specific predetermined points on the test road from 90 – 0 mph at 22 ft/s2, with the driver using a decelerometer to maintain the deceleration rate. Immediately after these “heat-up” stops are completed, the vehicle is turned around and makes six measured 60 – 0 mph impending skid (threshold) stops with ABS in operation, if so equipped, at specific predetermined points. Following a four (4) minute heat soak, the entire sequence is repeated. The exact initial velocity at the beginning of each of the 60 – 0 mph decelerations, and the exact distance required to make each stop is recorded by means of a non contact optical sensor in conjunction with electronic speed and distance meters. The data resulting from the twelve total stops is used to calculate the average deceleration rate which is the vehicle’s score for this test.
DECELERATION RATE FORMULA Initial Velocity*(IV) squared (IV)2
Deceleration Rate (DR) = 2 times Stopping Distance (SD) = 2 (SD)
EXAMPLE: Initial Velocity = 89.175 ft/s (60.8 mph x 1.4667*) Stopping Distance = 171.4 ft. (IV)2 (89.175)2 7952.24
DR = 2(SD) = 2(171.4) = 342.8 = 23.198 ft/s2
Once a vehicle’s average deceleration rate has been determined, it is possible to calculate the stopping distance from any given speed by utilizing the following formula:
Select a speed; translate that speed into feet per second; square the feet per second figure by multiplying it by itself; divide the resultant figure by 2; divide the remaining figure by the average deceleration rate of the vehicle in question. EXAMPLE:
60 mph = 88.002 ft/s x 88.002 = 7744.352 / 2 = 3872.176 / 23.198 ft/s2 = 166.9 ft.
*Initial velocity must be expressed in terms of feet per second, with 1 mile per hour being equal to 1.4667 feet per second.
39
38
BRAKE TESTING
BRAKE TEST OBJECTIVE
Determine the deceleration rate attained by each test vehicle on twelve 60 – 0 mph impending skid (threshold) stops, with ABS in operation if the vehicle is so equipped. Each vehicle is scored on the average deceleration rate it attains.
BRAKE TEST METHODOLOGY
Each vehicle makes two decelerations at specific predetermined points on the test road from 90 – 0 mph at 22 ft/s2, with the driver using a decelerometer to maintain the deceleration rate. Immediately after these “heat-up” stops are completed, the vehicle is turned around and makes six measured 60 – 0 mph impending skid (threshold) stops with ABS in operation, if so equipped, at specific predetermined points. Following a four (4) minute heat soak, the entire sequence is repeated. The exact initial velocity at the beginning of each of the 60 – 0 mph decelerations, and the exact distance required to make each stop is recorded by means of a non contact optical sensor in conjunction with electronic speed and distance meters. The data resulting from the twelve total stops is used to calculate the average deceleration rate which is the vehicle’s score for this test.
DECELERATION RATE FORMULA Initial Velocity*(IV) squared (IV)2
Deceleration Rate (DR) = 2 times Stopping Distance (SD) = 2 (SD)
EXAMPLE: Initial Velocity = 89.175 ft/s (60.8 mph x 1.4667*) Stopping Distance = 171.4 ft. (IV)2 (89.175)2 7952.24
DR = 2(SD) = 2(171.4) = 342.8 = 23.198 ft/s2
Once a vehicle’s average deceleration rate has been determined, it is possible to calculate the stopping distance from any given speed by utilizing the following formula:
Select a speed; translate that speed into feet per second; square the feet per second figure by multiplying it by itself; divide the resultant figure by 2; divide the remaining figure by the average deceleration rate of the vehicle in question.
EXAMPLE:
60 mph = 88.002 ft/s x 88.002 = 7744.352 / 2 = 3872.176 / 23.198 ft/s2 = 166.9 ft.
*Initial velocity must be expressed in terms of feet per second, with 1 mile per hour being equal to 1.4667 feet per second.
39
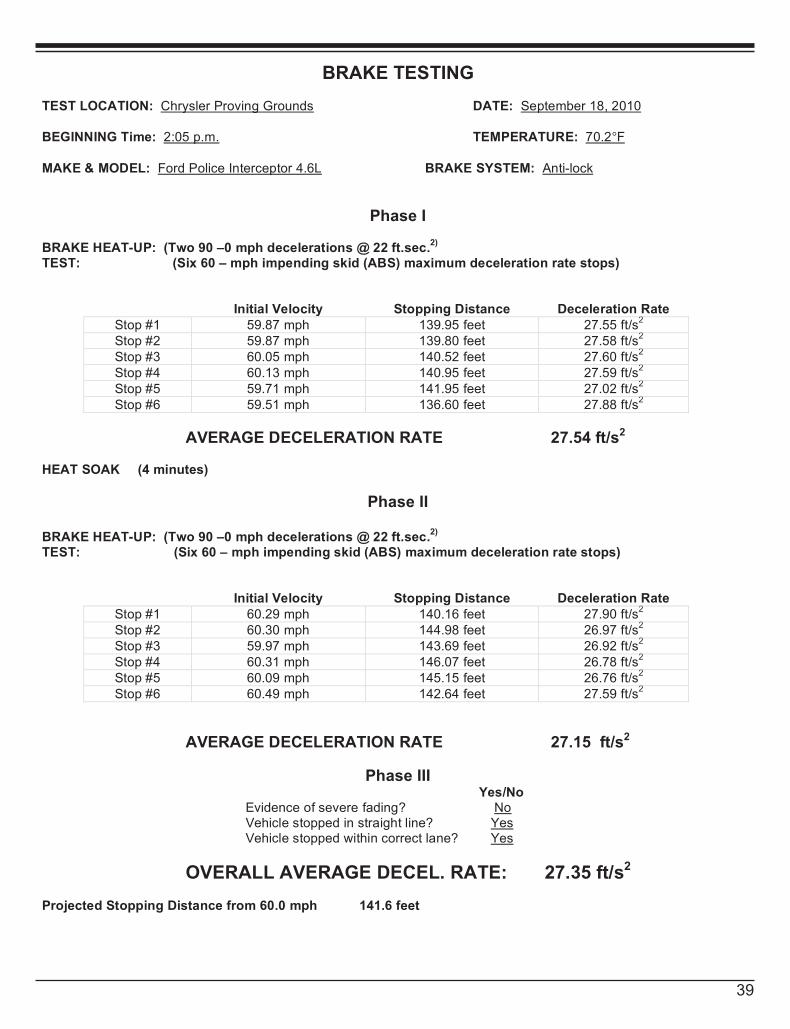
BRAKE TESTING
TEST LOCATION: Chrysler Proving Grounds DATE: September 18, 2010 BEGINNING Time: 2:05 p.m. TEMPERATURE: 70.2°F MAKE & MODEL: Ford Police Interceptor 4.6L BRAKE SYSTEM: Anti-lock
Phase I BRAKE HEAT-UP: (Two 90 –0 mph decelerations @ 22 ft.sec.
2)
TEST: (Six 60 – mph impending skid (ABS) maximum deceleration rate stops)
Initial Velocity Stopping Distance Deceleration Rate Stop #1 59.87 mph 139.95 feet 27.55 ft/s
2
Stop #2 59.87 mph 139.80 feet 27.58 ft/s2
Stop #3 60.05 mph 140.52 feet 27.60 ft/s2
Stop #4 60.13 mph 140.95 feet 27.59 ft/s2
Stop #5 59.71 mph 141.95 feet 27.02 ft/s2
Stop #6 59.51 mph 136.60 feet 27.88 ft/s2
AVERAGE DECELERATION RATE 27.54 ft/s2 HEAT SOAK (4 minutes)
Phase II
BRAKE HEAT-UP: (Two 90 –0 mph decelerations @ 22 ft.sec.2)
TEST: (Six 60 – mph impending skid (ABS) maximum deceleration rate stops)
Initial Velocity Stopping Distance Deceleration Rate Stop #1 60.29 mph 140.16 feet 27.90 ft/s
2
Stop #2 60.30 mph 144.98 feet 26.97 ft/s2
Stop #3 59.97 mph 143.69 feet 26.92 ft/s2
Stop #4 60.31 mph 146.07 feet 26.78 ft/s2
Stop #5 60.09 mph 145.15 feet 26.76 ft/s2
Stop #6 60.49 mph 142.64 feet 27.59 ft/s2
AVERAGE DECELERATION RATE 27.15 ft/s2
Phase III Yes/No Evidence of severe fading? No Vehicle stopped in straight line? Yes Vehicle stopped within correct lane? Yes
OVERALL AVERAGE DECEL. RATE: 27.35 ft/s2 Projected Stopping Distance from 60.0 mph 141.6 feet

40
40
BRAKE TESTING
TEST LOCATION: Chrysler Proving Grounds DATE: September 18, 2010 BEGINNING Time: 1:36 p.m. TEMPERATURE: 70.3°F MAKE & MODEL: Chevrolet Caprice 9C1 6.0 BRAKE SYSTEM: Anti-lock
Phase I BRAKE HEAT-UP: (Two 90 –0 mph decelerations @ 22 ft.sec.
2)
TEST: (Six 60 – mph impending skid (ABS) maximum deceleration rate stops)
Initial Velocity Stopping Distance Deceleration Rate Stop #1 59.78 mph 124.35 feet 30.91 ft/s
2
Stop #2 60.97 mph 129.04 feet 30.98 ft/s2
Stop #3 60.23 mph 130.14 feet 29.98 ft/s2
Stop #4 60.22 mph 125.84 feet 31.00 ft/s2
Stop #5 59.87 mph 127.82 feet 30.17 ft/s2
Stop #6 59.38 mph 124.70 feet 30.42 ft/s2
AVERAGE DECELERATION RATE 30.58 ft/s2 HEAT SOAK (4 minutes)
Phase II
BRAKE HEAT-UP: (Two 90 –0 mph decelerations @ 22 ft.sec.2)
TEST: (Six 60 – mph impending skid (ABS) maximum deceleration rate stops)
Initial Velocity Stopping Distance Deceleration Rate Stop #1 59.75 mph 127.17 feet 30.20 ft/s
2
Stop #2 59.70 mph 127.26 feet 30.12 ft/s2
Stop #3 60.58 mph 132.23 feet 29.85 ft/s2
Stop #4 59.89 mph 130.48 feet 29.57 ft/s2
Stop #5 60.09 mph 131.84 feet 29.46 ft/s2
Stop #6 60.41 mph 132.62 feet 29.60 ft/s2
AVERAGE DECELERATION RATE 29.80 ft/s2
Phase III Yes/No Evidence of severe fading? No Vehicle stopped in straight line? Yes Vehicle stopped within correct lane? Yes
OVERALL AVERAGE DECEL. RATE: 30.19 ft/s2 Projected Stopping Distance from 60.0 mph 128.3 feet
41
41
BRAKE TESTING
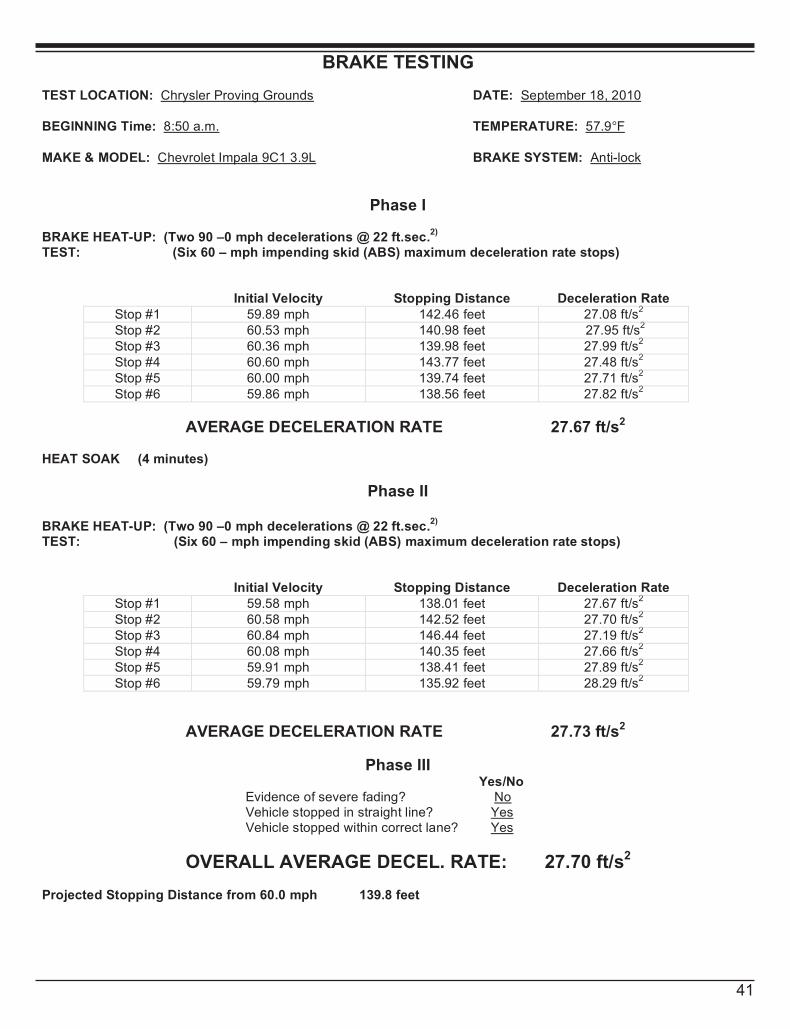
TEST LOCATION: Chrysler Proving Grounds DATE: September 18, 2010 BEGINNING Time: 8:50 a.m. TEMPERATURE: 57.9°F MAKE & MODEL: Chevrolet Impala 9C1 3.9L BRAKE SYSTEM: Anti-lock
Phase I BRAKE HEAT-UP: (Two 90 –0 mph decelerations @ 22 ft.sec.
2)
TEST: (Six 60 – mph impending skid (ABS) maximum deceleration rate stops)
Initial Velocity Stopping Distance Deceleration Rate Stop #1 59.89 mph 142.46 feet 27.08 ft/s
2
Stop #2 60.53 mph 140.98 feet 27.95 ft/s2
Stop #3 60.36 mph 139.98 feet 27.99 ft/s2
Stop #4 60.60 mph 143.77 feet 27.48 ft/s2
Stop #5 60.00 mph 139.74 feet 27.71 ft/s2
Stop #6 59.86 mph 138.56 feet 27.82 ft/s2
AVERAGE DECELERATION RATE 27.67 ft/s2 HEAT SOAK (4 minutes)
Phase II
BRAKE HEAT-UP: (Two 90 –0 mph decelerations @ 22 ft.sec.2)
TEST: (Six 60 – mph impending skid (ABS) maximum deceleration rate stops)
Initial Velocity Stopping Distance Deceleration Rate Stop #1 59.58 mph 138.01 feet 27.67 ft/s
2
Stop #2 60.58 mph 142.52 feet 27.70 ft/s2
Stop #3 60.84 mph 146.44 feet 27.19 ft/s2
Stop #4 60.08 mph 140.35 feet 27.66 ft/s2
Stop #5 59.91 mph 138.41 feet 27.89 ft/s2
Stop #6 59.79 mph 135.92 feet 28.29 ft/s2
AVERAGE DECELERATION RATE 27.73 ft/s2
Phase III Yes/No Evidence of severe fading? No Vehicle stopped in straight line? Yes Vehicle stopped within correct lane? Yes
OVERALL AVERAGE DECEL. RATE: 27.70 ft/s2 Projected Stopping Distance from 60.0 mph 139.8 feet

42
42
BRAKE TESTING
TEST LOCATION: Chrysler Proving Grounds DATE: September 18, 2010 BEGINNING Time: 5:02 p.m. TEMPERATURE: 69.3°F MAKE & MODEL: Dodge Charger 3.6L BRAKE SYSTEM: Anti-lock
Phase I BRAKE HEAT-UP: (Two 90 –0 mph decelerations @ 22 ft.sec.
2)
TEST: (Six 60 – mph impending skid (ABS) maximum deceleration rate stops)
Initial Velocity Stopping Distance Deceleration Rate Stop #1 59.91 mph 133.84 feet 28.84 ft/s
2
Stop #2 60.31 mph 133.37 feet 29.33 ft/s2
Stop #3 59.88 mph 133.23 feet 28.94 ft/s2
Stop #4 60.43 mph 136.47 feet 28.78 ft/s2
Stop #5 59.60 mph 132.32 feet 28.88 ft/s2
Stop #6 60.57 mph 134.43 feet 29.35 ft/s2
AVERAGE DECELERATION RATE 29.02 ft/s2 HEAT SOAK (4 minutes)
Phase II
BRAKE HEAT-UP: (Two 90 –0 mph decelerations @ 22 ft.sec.2)
TEST: (Six 60 – mph impending skid (ABS) maximum deceleration rate stops)
Initial Velocity Stopping Distance Deceleration Rate Stop #1 60.53 mph 137.45 feet 28.67 ft/s
2
Stop #2 60.34 mph 134.90 feet 29.03 ft/s2
Stop #3 60.18 mph 135.85 feet 28.68 ft/s2
Stop #4 60.45 mph 133.48 feet 29.44 ft/s2
Stop #5 60.32 mph 134.37 feet 29.12 ft/s2
Stop #6 60.68 mph 132.69 feet 29.85 ft/s2
AVERAGE DECELERATION RATE 29.13 ft/s2
Phase III Yes/No Evidence of severe fading? No Vehicle stopped in straight line? Yes Vehicle stopped within correct lane? Yes
OVERALL AVERAGE DECEL. RATE: 29.08 ft/s2 Projected Stopping Distance from 60.0 mph 133.2 feet
43
BRAKE TESTING
TEST LOCATION: Chrysler Proving Grounds DATE: September 18, 2010 BEGINNING Time: 3:32 p.m. TEMPERATURE: 68°F MAKE & MODEL: Dodge Charger 5.7L BRAKE SYSTEM: Anti-lock
Phase I BRAKE HEAT-UP: (Two 90 –0 mph decelerations @ 22 ft.sec.
2)
TEST: (Six 60 – mph impending skid (ABS) maximum deceleration rate stops)
Initial Velocity Stopping Distance Deceleration Rate Stop #1 60.24 mph 134.73 feet 28.97 ft/s
2
Stop #2 60.20 mph 133.63 feet 29.17 ft/s2
Stop #3 60.07 mph 133.81 feet 29.00 ft/s2
Stop #4 60.60 mph 136.58 feet 28.92 ft/s2
Stop #5 60.59 mph 138.23 feet 28.57 ft/s2
Stop #6 59.67 mph 131.66 feet 29.08 ft/s2
AVERAGE DECELERATION RATE 28.95 ft/s2 HEAT SOAK (4 minutes)
Phase II
BRAKE HEAT-UP: (Two 90 –0 mph decelerations @ 22 ft.sec.2)
TEST: (Six 60 – mph impending skid (ABS) maximum deceleration rate stops)
Initial Velocity Stopping Distance Deceleration Rate Stop #1 60.44 mph 136.09 feet 28.87 ft/s
2
Stop #2 60.92 mph 136.26 feet 29.30 ft/s2
Stop #3 60.36 mph 136.59 feet 28.69 ft/s2
Stop #4 59.95 mph 130.71 feet 29.58 ft/s2
Stop #5 59.70 mph 133.89 feet 28.63 ft/s2
Stop #6 60.38 mph 139.07 feet 28.20 ft/s2
AVERAGE DECELERATION RATE 28.88 ft/s2
Phase III Yes/No Evidence of severe fading? No Vehicle stopped in straight line? Yes Vehicle stopped within correct lane? Yes
OVERALL AVERAGE DECEL. RATE: 28.92 ft/s2 Projected Stopping Distance from 60.0 mph 133.9 feet

43
43
BRAKE TESTING
TEST LOCATION: Chrysler Proving Grounds DATE: September 18, 2010 BEGINNING Time: 3:32 p.m. TEMPERATURE: 68°F MAKE & MODEL: Dodge Charger 5.7L BRAKE SYSTEM: Anti-lock
Phase I BRAKE HEAT-UP: (Two 90 –0 mph decelerations @ 22 ft.sec.
2)
TEST: (Six 60 – mph impending skid (ABS) maximum deceleration rate stops)
Initial Velocity Stopping Distance Deceleration Rate Stop #1 60.24 mph 134.73 feet 28.97 ft/s
2
Stop #2 60.20 mph 133.63 feet 29.17 ft/s2
Stop #3 60.07 mph 133.81 feet 29.00 ft/s2
Stop #4 60.60 mph 136.58 feet 28.92 ft/s2
Stop #5 60.59 mph 138.23 feet 28.57 ft/s2
Stop #6 59.67 mph 131.66 feet 29.08 ft/s2
AVERAGE DECELERATION RATE 28.95 ft/s2 HEAT SOAK (4 minutes)
Phase II
BRAKE HEAT-UP: (Two 90 –0 mph decelerations @ 22 ft.sec.2)
TEST: (Six 60 – mph impending skid (ABS) maximum deceleration rate stops)
Initial Velocity Stopping Distance Deceleration Rate Stop #1 60.44 mph 136.09 feet 28.87 ft/s
2
Stop #2 60.92 mph 136.26 feet 29.30 ft/s2
Stop #3 60.36 mph 136.59 feet 28.69 ft/s2
Stop #4 59.95 mph 130.71 feet 29.58 ft/s2
Stop #5 59.70 mph 133.89 feet 28.63 ft/s2
Stop #6 60.38 mph 139.07 feet 28.20 ft/s2
AVERAGE DECELERATION RATE 28.88 ft/s2
Phase III Yes/No Evidence of severe fading? No Vehicle stopped in straight line? Yes Vehicle stopped within correct lane? Yes
OVERALL AVERAGE DECEL. RATE: 28.92 ft/s2 Projected Stopping Distance from 60.0 mph 133.9 feet
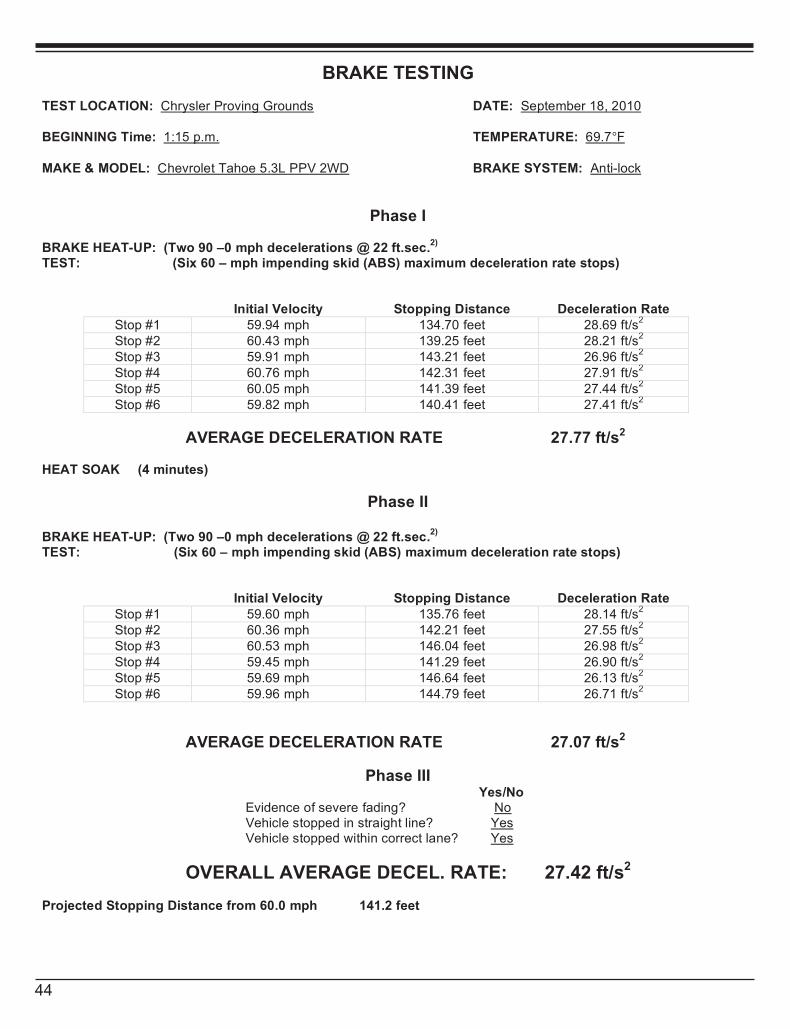
44
44
BRAKE TESTING
TEST LOCATION: Chrysler Proving Grounds DATE: September 18, 2010 BEGINNING Time: 1:15 p.m. TEMPERATURE: 69.7°F MAKE & MODEL: Chevrolet Tahoe 5.3L PPV 2WD BRAKE SYSTEM: Anti-lock
Phase I BRAKE HEAT-UP: (Two 90 –0 mph decelerations @ 22 ft.sec.
2)
TEST: (Six 60 – mph impending skid (ABS) maximum deceleration rate stops)
Initial Velocity Stopping Distance Deceleration Rate Stop #1 59.94 mph 134.70 feet 28.69 ft/s
2
Stop #2 60.43 mph 139.25 feet 28.21 ft/s2
Stop #3 59.91 mph 143.21 feet 26.96 ft/s2
Stop #4 60.76 mph 142.31 feet 27.91 ft/s2
Stop #5 60.05 mph 141.39 feet 27.44 ft/s2
Stop #6 59.82 mph 140.41 feet 27.41 ft/s2
AVERAGE DECELERATION RATE 27.77 ft/s2 HEAT SOAK (4 minutes)
Phase II
BRAKE HEAT-UP: (Two 90 –0 mph decelerations @ 22 ft.sec.2)
TEST: (Six 60 – mph impending skid (ABS) maximum deceleration rate stops)
Initial Velocity Stopping Distance Deceleration Rate Stop #1 59.60 mph 135.76 feet 28.14 ft/s
2
Stop #2 60.36 mph 142.21 feet 27.55 ft/s2
Stop #3 60.53 mph 146.04 feet 26.98 ft/s2
Stop #4 59.45 mph 141.29 feet 26.90 ft/s2
Stop #5 59.69 mph 146.64 feet 26.13 ft/s2
Stop #6 59.96 mph 144.79 feet 26.71 ft/s2
AVERAGE DECELERATION RATE 27.07 ft/s2
Phase III Yes/No Evidence of severe fading? No Vehicle stopped in straight line? Yes Vehicle stopped within correct lane? Yes
OVERALL AVERAGE DECEL. RATE: 27.42 ft/s2 Projected Stopping Distance from 60.0 mph 141.2 feet
2011 Brake TestingSTOPPING DISTANCE
125
128
131
134
137
140
143
146
149
Ford Police Interceptor Chevrolet Caprice Chevrolet Impala Chevrolet Tahoe Dodge Charger 3.6L Dodge Charger 5.7L
(in "feet" from 60.0 mph)
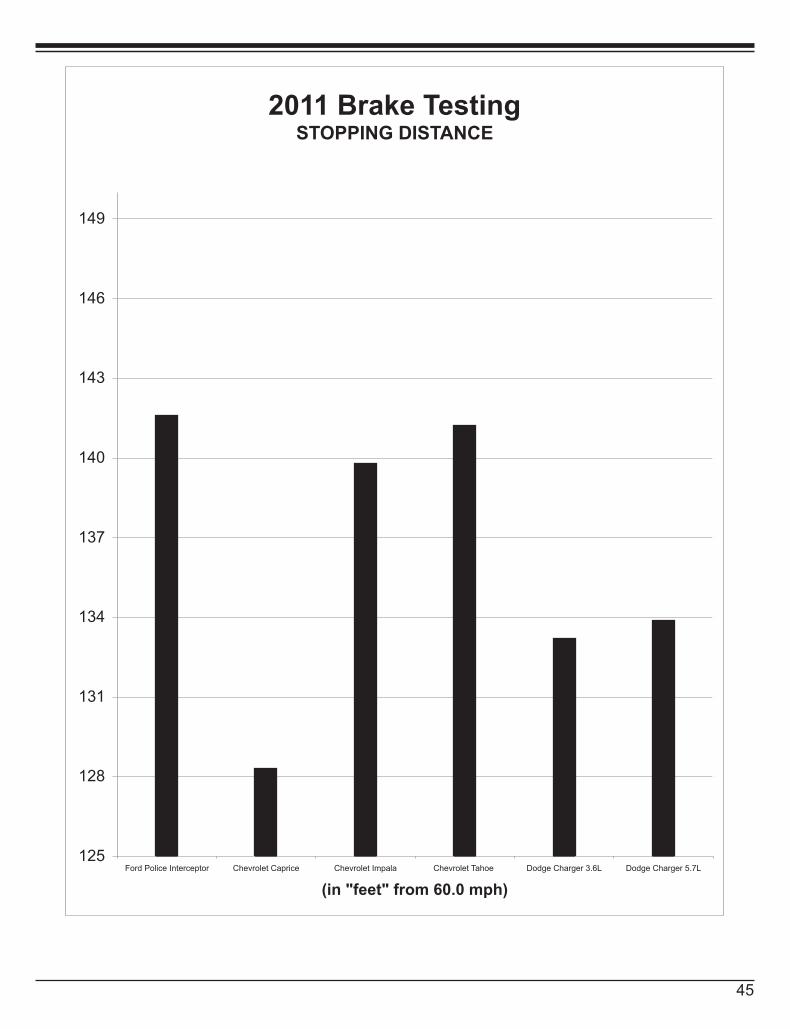
45
2011 Brake TestingSTOPPING DISTANCE
125
128
131
134
137
140
143
146
149
Ford Police Interceptor Chevrolet Caprice Chevrolet Impala Chevrolet Tahoe Dodge Charger 3.6L Dodge Charger 5.7L
(in "feet" from 60.0 mph)
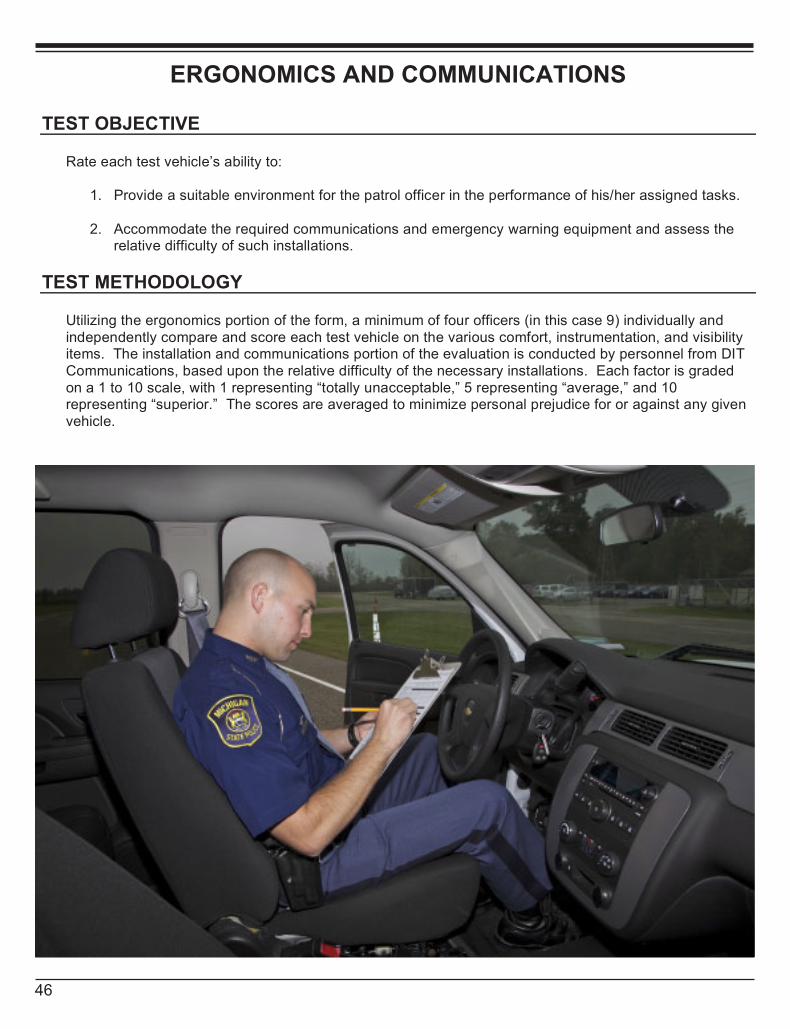
46
46
ERGONOMICS AND COMMUNICATIONS
TEST OBJECTIVE
Rate each test vehicle’s ability to:
1. Provide a suitable environment for the patrol officer in the performance of his/her assigned tasks.
2. Accommodate the required communications and emergency warning equipment and assess the relative difficulty of such installations.
TEST METHODOLOGY
Utilizing the ergonomics portion of the form, a minimum of four officers (in this case 9) individually and independently compare and score each test vehicle on the various comfort, instrumentation, and visibility items. The installation and communications portion of the evaluation is conducted by personnel from DIT Communications, based upon the relative difficulty of the necessary installations. Each factor is graded on a 1 to 10 scale, with 1 representing “totally unacceptable,” 5 representing “average,” and 10 representing “superior.” The scores are averaged to minimize personal prejudice for or against any given vehicle.
47
ERGONOMICS AND COMMUNICATIONS
ERGONOMICS Ford Police Interceptor
Dodge Charger
Chevrolet Impala 9C1
Chevrolet Caprice
Chevrolet Tahoe PPV
FRONT SEAT
Padding 7.78 7.56 7.11 7.56 7.33
Depth of Bucket Seat 7.56 7.56 7.11 7.00 7.89
Adjustability – Front to Rear 8.00 8.67 8.22 7.75 7.89
Upholstery 7.11 7.44 7.00 7.89 6.89
Bucket Seat Design 7.11 7.89 7.44 7.56 7.67
Headroom 8.78 8.44 7.78 6.89 9.78
Seatbelts 6.44 8.00 7.78 5.78 8.11
Ease of Entry and Exit 7.56 7.67 7.11 7.33 8.89
Overall Comfort Rating 7.00 8.22 7.00 7.78 8.11
REAR SEAT
Leg room – Front seat back 6.33 4.78 4.44 9.22 7.44
Ease of Entry and Exit 6.78 4.56 4.89 7.78 7.33
INSTRUMENTATION
Clarity 7.33 7.44 8.00 7.33 7.89
Placement 7.56 7.11 8.11 7.78 7.56
VEHICLE CONTROLS
Pedals, Size and Position 7.63 7.89 7.78 7.44 8.33
Power Window Switch 8.22 8.44 8.11 7.22 8.56
Inside Door Lock Switch 7.11 8.11 6.89 6.56 8.56
Automatic Door Lock Switch 8.11 7.67 6.22 6.56 8.00
Outside Mirror Controls 7.00 8.11 6.89 7.22 8.56
Steering Wheel, Size, Tilt Release, and Surface
8.00 6.33 7.78 7.78 8.11
Heat/AC Vent Placement and Adjustability
8.00 7.78 7.56 7.22 7.78
VISIBILITY
Front (Windshield) 8.67 8.11 8.33 8.00 8.56
Rear (Back Window) 7.33 6.11 5.67 6.67 6.00
Left Rear Quarter 7.67 5.44 6.33 7.11 6.00
Right Rear Quarter 7.11 5.56 6.33 7.22 4.56
Outside Rear View Mirrors 7.22 6.89 4.56 5.56 9.33
COMMUNICATIONS
Dashboard Accessibility 8.55 7.25 7.75 5.05 8.40
Trunk Accessibility 8.53 7.25 6.93 7.25 8.08
Engine Compartment 8.33 6.42 6.83 9.08 8.17
TOTAL SCORES 212.81 202.70 195.95 203.57 219.76
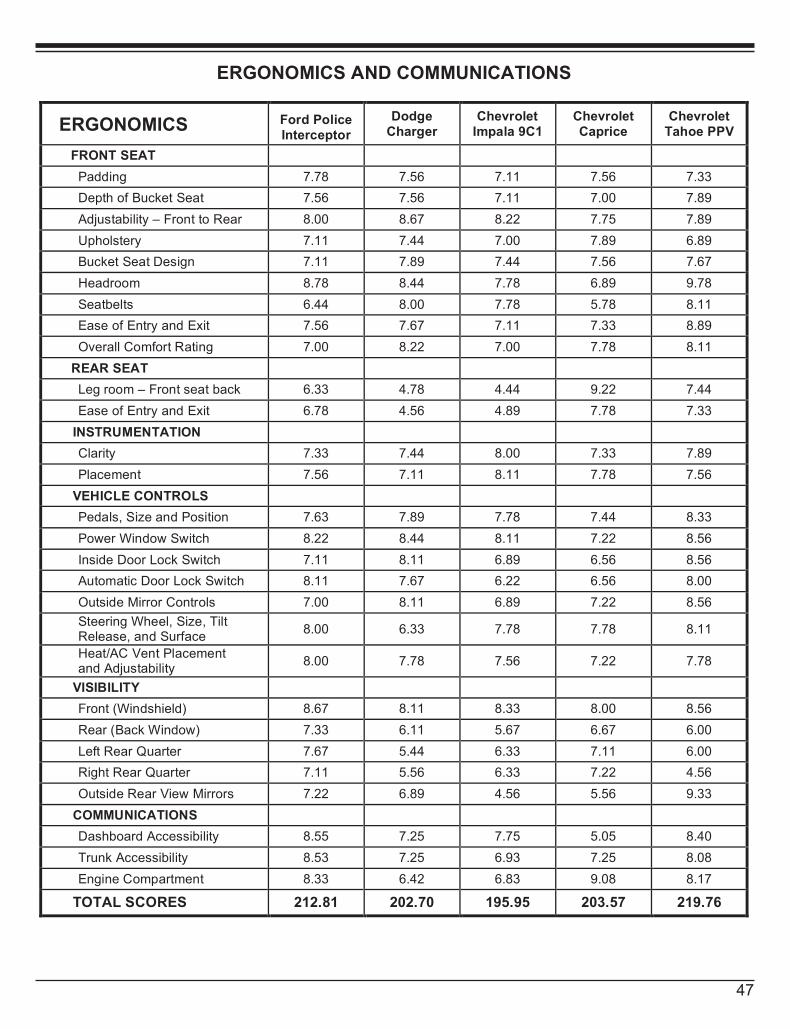
47
47
ERGONOMICS AND COMMUNICATIONS
ERGONOMICS Ford Police Interceptor
Dodge Charger
Chevrolet Impala 9C1
Chevrolet Caprice
Chevrolet Tahoe PPV
FRONT SEAT
Padding 7.78 7.56 7.11 7.56 7.33
Depth of Bucket Seat 7.56 7.56 7.11 7.00 7.89
Adjustability – Front to Rear 8.00 8.67 8.22 7.75 7.89
Upholstery 7.11 7.44 7.00 7.89 6.89
Bucket Seat Design 7.11 7.89 7.44 7.56 7.67
Headroom 8.78 8.44 7.78 6.89 9.78
Seatbelts 6.44 8.00 7.78 5.78 8.11
Ease of Entry and Exit 7.56 7.67 7.11 7.33 8.89
Overall Comfort Rating 7.00 8.22 7.00 7.78 8.11
REAR SEAT
Leg room – Front seat back 6.33 4.78 4.44 9.22 7.44
Ease of Entry and Exit 6.78 4.56 4.89 7.78 7.33
INSTRUMENTATION
Clarity 7.33 7.44 8.00 7.33 7.89
Placement 7.56 7.11 8.11 7.78 7.56
VEHICLE CONTROLS
Pedals, Size and Position 7.63 7.89 7.78 7.44 8.33
Power Window Switch 8.22 8.44 8.11 7.22 8.56
Inside Door Lock Switch 7.11 8.11 6.89 6.56 8.56
Automatic Door Lock Switch 8.11 7.67 6.22 6.56 8.00
Outside Mirror Controls 7.00 8.11 6.89 7.22 8.56
Steering Wheel, Size, Tilt Release, and Surface
8.00 6.33 7.78 7.78 8.11
Heat/AC Vent Placement and Adjustability
8.00 7.78 7.56 7.22 7.78
VISIBILITY
Front (Windshield) 8.67 8.11 8.33 8.00 8.56
Rear (Back Window) 7.33 6.11 5.67 6.67 6.00
Left Rear Quarter 7.67 5.44 6.33 7.11 6.00
Right Rear Quarter 7.11 5.56 6.33 7.22 4.56
Outside Rear View Mirrors 7.22 6.89 4.56 5.56 9.33
COMMUNICATIONS
Dashboard Accessibility 8.55 7.25 7.75 5.05 8.40
Trunk Accessibility 8.53 7.25 6.93 7.25 8.08
Engine Compartment 8.33 6.42 6.83 9.08 8.17
TOTAL SCORES 212.81 202.70 195.95 203.57 219.76
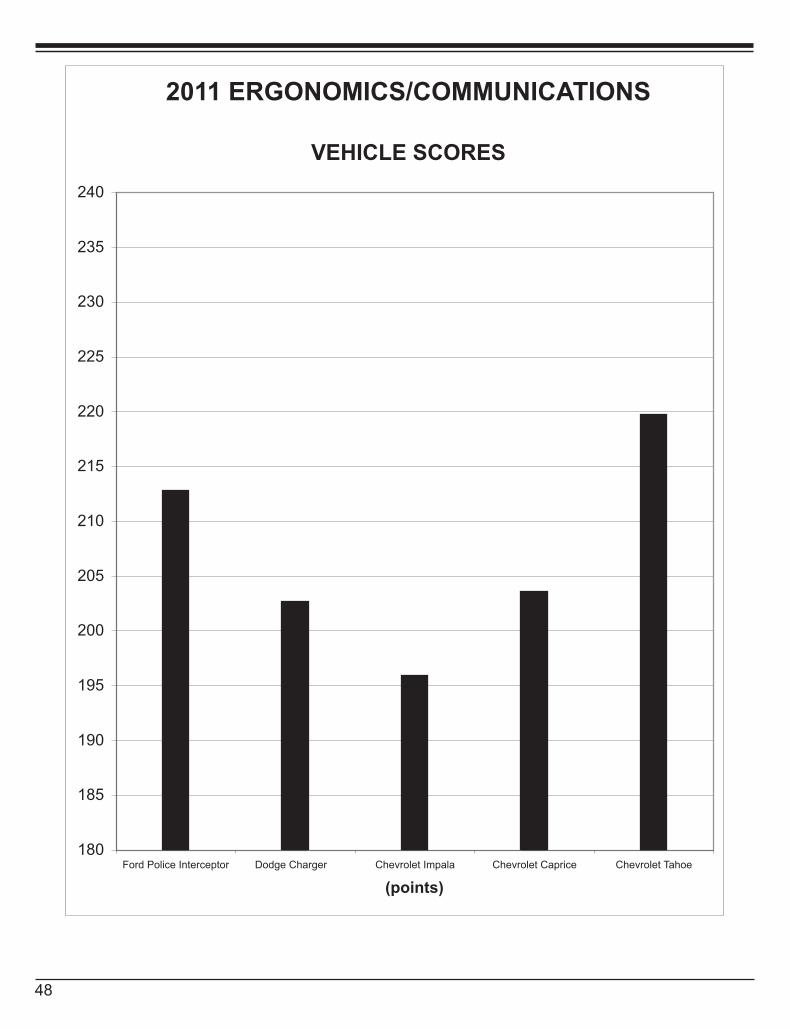
48
2011 ERGONOMICS/COMMUNICATIONS
VEHICLE SCORES
180
185
190
195
200
205
210
215
220
225
230
235
240
Ford Police Interceptor Dodge Charger Chevrolet Impala Chevrolet Caprice Chevrolet Tahoe
(points)
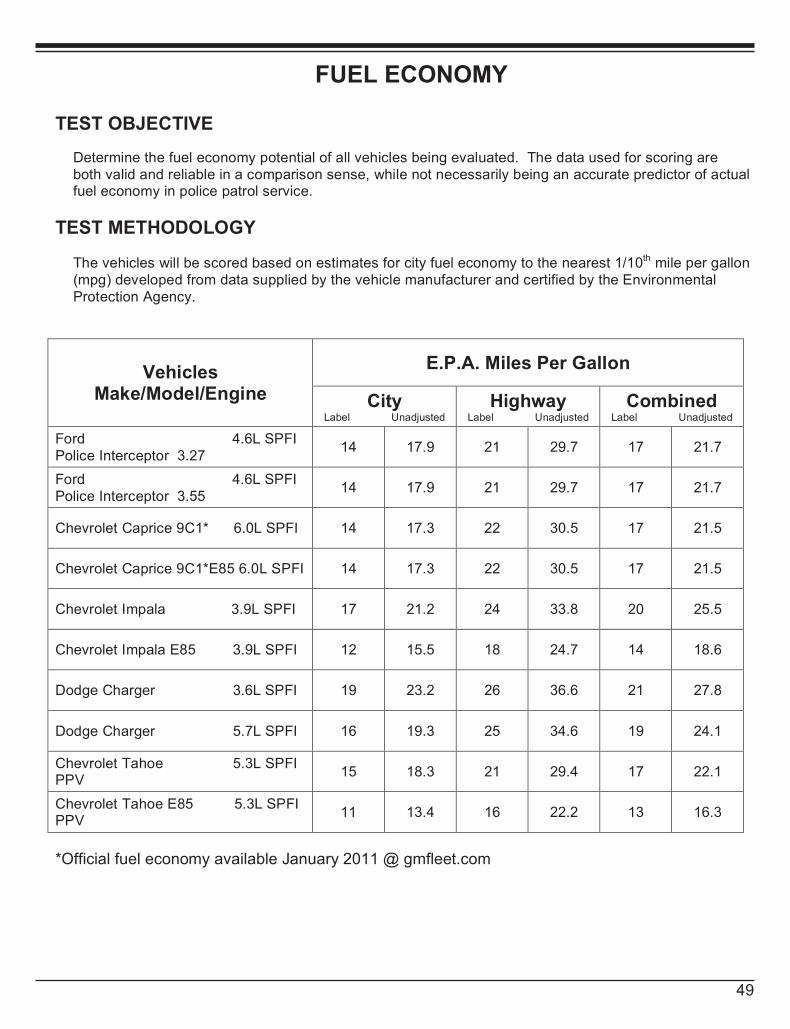
49
2011 ERGONOMICS/COMMUNICATIONS
VEHICLE SCORES
180
185
190
195
200
205
210
215
220
225
230
235
240
Ford Police Interceptor Dodge Charger Chevrolet Impala Chevrolet Caprice Chevrolet Tahoe
(points)
49
FUEL ECONOMY
TEST OBJECTIVE
Determine the fuel economy potential of all vehicles being evaluated. The data used for scoring are both valid and reliable in a comparison sense, while not necessarily being an accurate predictor of actual fuel economy in police patrol service.
TEST METHODOLOGY The vehicles will be scored based on estimates for city fuel economy to the nearest 1/10th mile per gallon (mpg) developed from data supplied by the vehicle manufacturer and certified by the Environmental Protection Agency.
E.P.A. Miles Per Gallon Vehicles
Make/Model/Engine City Label Unadjusted
Highway Label Unadjusted
Combined Label Unadjusted
Ford 4.6L SPFI Police Interceptor 3.27
14 17.9 21 29.7 17 21.7
Ford 4.6L SPFI Police Interceptor 3.55
14 17.9 21 29.7 17 21.7
Chevrolet Caprice 9C1* 6.0L SPFI 14 17.3 22 30.5 17 21.5
Chevrolet Caprice 9C1*E85 6.0L SPFI 14 17.3 22 30.5 17 21.5
Chevrolet Impala 3.9L SPFI 17 21.2 24 33.8 20 25.5
Chevrolet Impala E85 3.9L SPFI 12 15.5 18 24.7 14 18.6
Dodge Charger 3.6L SPFI 19 23.2 26 36.6 21 27.8
Dodge Charger 5.7L SPFI 16 19.3 25 34.6 19 24.1
Chevrolet Tahoe 5.3L SPFI PPV
15 18.3 21 29.4 17 22.1
Chevrolet Tahoe E85 5.3L SPFI PPV
11 13.4 16 22.2 13 16.3
*Official fuel economy available January 2011 @ gmfleet.com
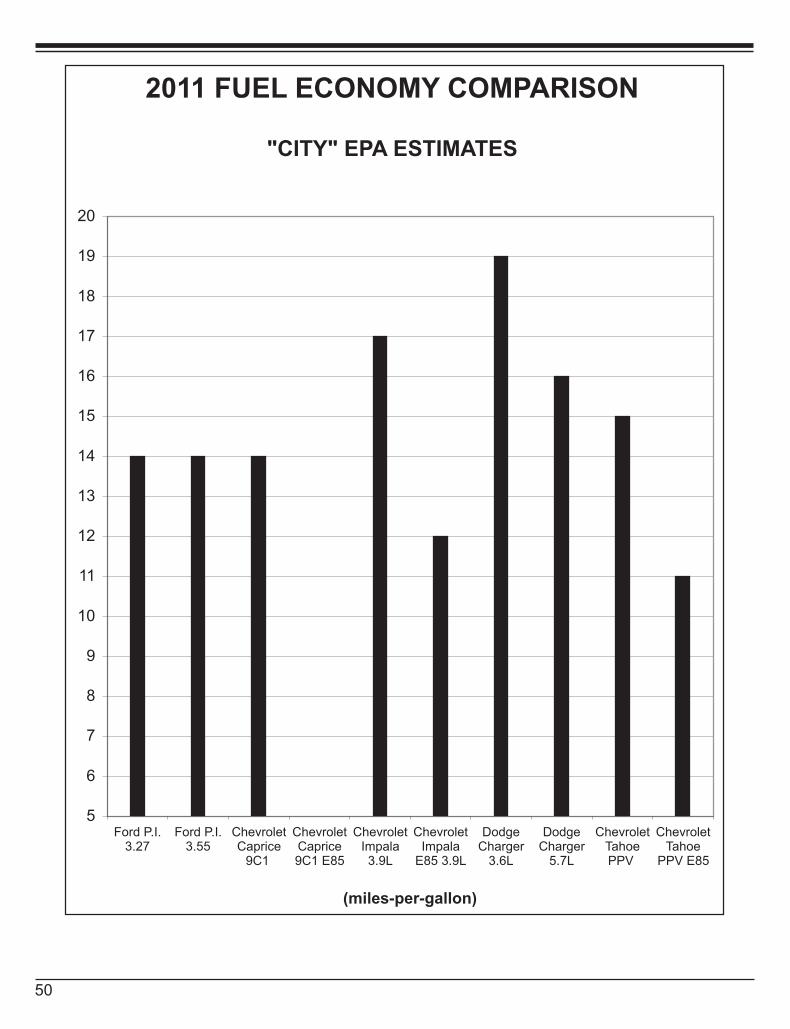
50
2011 FUEL ECONOMY COMPARISON
"CITY" EPA ESTIMATES
5
6
7
8
9
10
11
12
13
14
15
16
17
18
19
20
Ford P.I.3.27
Ford P.I.3.55
ChevroletCaprice
9C1
ChevroletCaprice9C1 E85
ChevroletImpala3.9L
ChevroletImpala
E85 3.9L
DodgeCharger
3.6L
DodgeCharger
5.7L
ChevroletTahoePPV
ChevroletTahoe
PPV E85
(miles-per-gallon)
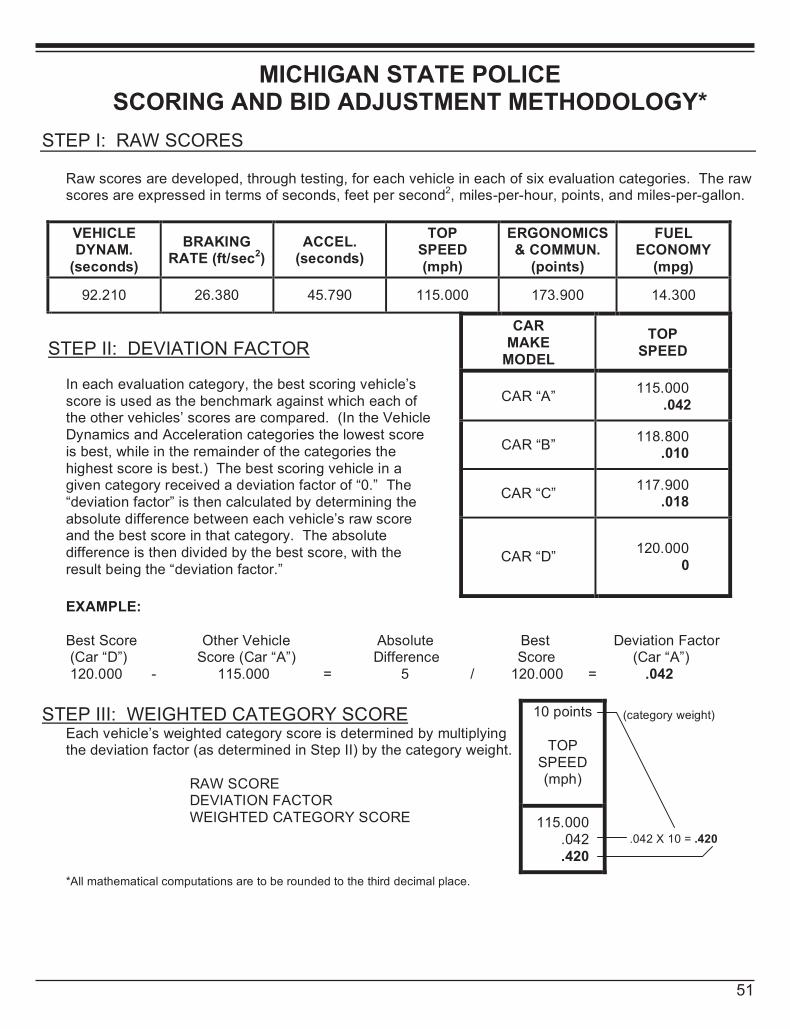
51
51
MICHIGAN STATE POLICE SCORING AND BID ADJUSTMENT METHODOLOGY*
STEP I: RAW SCORES
Raw scores are developed, through testing, for each vehicle in each of six evaluation categories. The raw scores are expressed in terms of seconds, feet per second2, miles-per-hour, points, and miles-per-gallon.
VEHICLE DYNAM.
(seconds)
BRAKING RATE (ft/sec2)
ACCEL. (seconds)
TOP SPEED (mph)
ERGONOMICS & COMMUN.
(points)
FUEL ECONOMY
(mpg)
92.210 26.380 45.790 115.000 173.900 14.300
CAR MAKE
MODEL
TOP SPEED
CAR “A” 115.000 .042
CAR “B” 118.800 .010
CAR “C” 117.900 .018
STEP II: DEVIATION FACTOR
In each evaluation category, the best scoring vehicle’s score is used as the benchmark against which each of the other vehicles’ scores are compared. (In the Vehicle Dynamics and Acceleration categories the lowest score is best, while in the remainder of the categories the highest score is best.) The best scoring vehicle in a given category received a deviation factor of “0.” The “deviation factor” is then calculated by determining the absolute difference between each vehicle’s raw score and the best score in that category. The absolute difference is then divided by the best score, with the result being the “deviation factor.”
CAR “D” 120.000 0
EXAMPLE: Best Score Other Vehicle Absolute Best Deviation Factor (Car “D”) Score (Car “A”) Difference Score (Car “A”) 120.000 - 115.000 = 5 / 120.000 = .042
10 points
TOP SPEED (mph)
STEP III: WEIGHTED CATEGORY SCORE Each vehicle’s weighted category score is determined by multiplying the deviation factor (as determined in Step II) by the category weight.
RAW SCORE DEVIATION FACTOR WEIGHTED CATEGORY SCORE
115.000 .042 .420
*All mathematical computations are to be rounded to the third decimal place.
(category weight) .042 X 10 = .420
2011 FUEL ECONOMY COMPARISON
"CITY" EPA ESTIMATES
5
6
7
8
9
10
11
12
13
14
15
16
17
18
19
20
Ford P.I.3.27
Ford P.I.3.55
ChevroletCaprice
9C1
ChevroletCaprice9C1 E85
ChevroletImpala3.9L
ChevroletImpala
E85 3.9L
DodgeCharger
3.6L
DodgeCharger
5.7L
ChevroletTahoePPV
ChevroletTahoe
PPV E85
(miles-per-gallon)
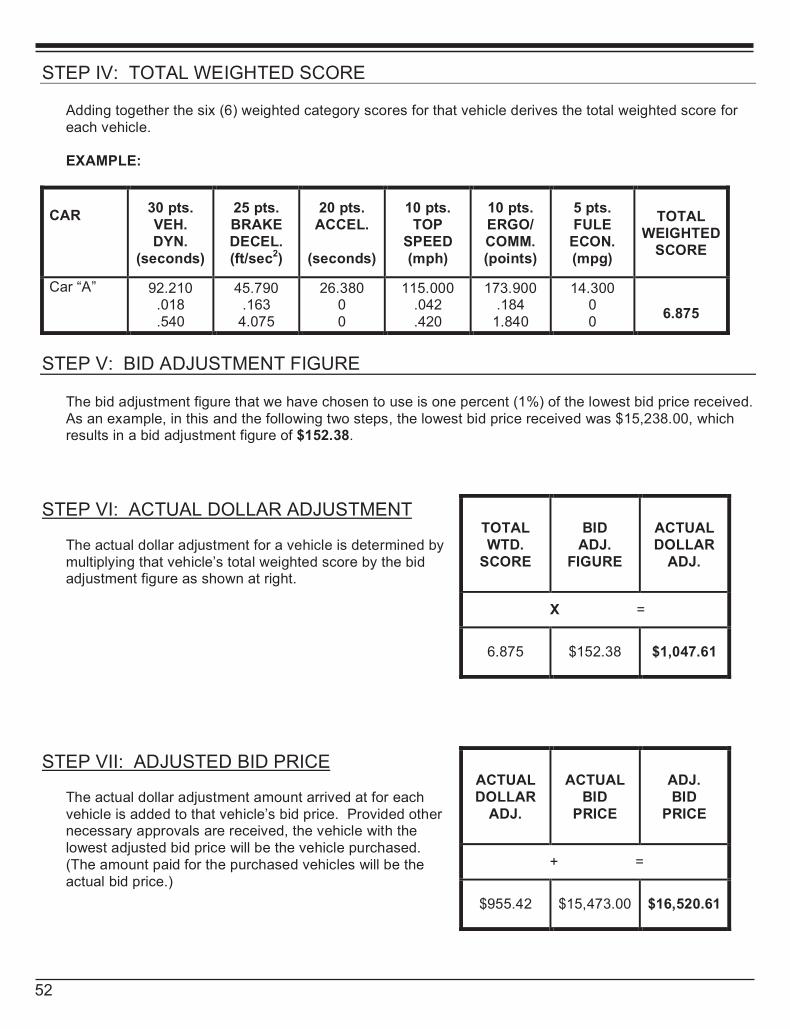
52
52
STEP IV: TOTAL WEIGHTED SCORE
Adding together the six (6) weighted category scores for that vehicle derives the total weighted score for each vehicle. EXAMPLE:
CAR
30 pts. VEH. DYN.
(seconds)
25 pts. BRAKE DECEL. (ft/sec2)
20 pts. ACCEL.
(seconds)
10 pts. TOP
SPEED (mph)
10 pts. ERGO/ COMM. (points)
5 pts. FULE
ECON. (mpg)
TOTAL WEIGHTED
SCORE
Car “A” 92.210 .018 .540
45.790 .163
4.075
26.380 0 0
115.000 .042 .420
173.900 .184
1.840
14.300 0 0
6.875
STEP V: BID ADJUSTMENT FIGURE
The bid adjustment figure that we have chosen to use is one percent (1%) of the lowest bid price received. As an example, in this and the following two steps, the lowest bid price received was $15,238.00, which results in a bid adjustment figure of $152.38.
TOTAL WTD.
SCORE
BID ADJ.
FIGURE
ACTUAL DOLLAR
ADJ.
X =
STEP VI: ACTUAL DOLLAR ADJUSTMENT The actual dollar adjustment for a vehicle is determined by multiplying that vehicle’s total weighted score by the bid adjustment figure as shown at right.
6.875 $152.38 $1,047.61
ACTUAL DOLLAR
ADJ.
ACTUAL BID
PRICE
ADJ. BID
PRICE
+ =
STEP VII: ADJUSTED BID PRICE The actual dollar adjustment amount arrived at for each vehicle is added to that vehicle’s bid price. Provided other necessary approvals are received, the vehicle with the lowest adjusted bid price will be the vehicle purchased. (The amount paid for the purchased vehicles will be the actual bid price.)
$955.42 $15,473.00 $16,520.61
53
PERFORMANCE COMPARISONS OF 2010 AND 2011 TEST VEHICLES
The following charts illustrate the scores achieved by each make and model of vehicle tested for model years 2010 and 2011. The charts presented are for the following performance categories:
Vehicle Dynamics Acceleration 0 – 60 mph Acceleration 0 – 80 mph Acceleration 0 – 100 mph Top Speed Braking (Calculated 60 – 0 mph Stopping Distance)
The reader should bear in mind the following information regarding variables when reviewing the 2010 – 2011 performance comparison charts. While as many variables as possible are eliminated from a given year’s testing, those that occur over the span of a full year are sometimes impossible to eliminate. The acceleration, top speed, and brake testing of both the 2010 and 2011 model year vehicles were conducted in the latter half of September. Temperatures on the test day in September of 2009 ranged between 39.8° F at the start of testing to a high of approximately 57.5° F during the afternoon.
Temperatures during the testing this year varied, ranging between 61° F when testing started, to an
afternoon high of 75° F. Such things as temperature, humidity, and barometric pressure affect the
performance of internal combustion engines and brake components, and may cause minor differences from one year’s evaluation to the next. Another factor to be considered is the individual differences between two cars of the same make and model. The test cars that we evaluate are representative of their given make and model. Other cars of the same make and model will not, however, be exactly the same, particularly when it comes to performance. (It is well known that two consecutive cars off the same assembly line will perform slightly differently from each other.) Minor differences in performance from year to year within the same make and model are not only possible, but are to be expected.
53
53
PERFORMANCE COMPARISONS OF 2010 AND 2011 TEST VEHICLES
The following charts illustrate the scores achieved by each make and model of vehicle tested for model years 2010 and 2011. The charts presented are for the following performance categories:
Vehicle Dynamics Acceleration 0 – 60 mph Acceleration 0 – 80 mph Acceleration 0 – 100 mph Top Speed Braking (Calculated 60 – 0 mph Stopping Distance)
The reader should bear in mind the following information regarding variables when reviewing the 2010 – 2011 performance comparison charts. While as many variables as possible are eliminated from a given year’s testing, those that occur over the span of a full year are sometimes impossible to eliminate. The acceleration, top speed, and brake testing of both the 2010 and 2011 model year vehicles were conducted in the latter half of September. Temperatures on the test day in September of 2009 ranged between 39.8° F at the start of testing to a high of approximately 57.5° F during the afternoon.
Temperatures during the testing this year varied, ranging between 61° F when testing started, to an
afternoon high of 75° F. Such things as temperature, humidity, and barometric pressure affect the
performance of internal combustion engines and brake components, and may cause minor differences from one year’s evaluation to the next. Another factor to be considered is the individual differences between two cars of the same make and model. The test cars that we evaluate are representative of their given make and model. Other cars of the same make and model will not, however, be exactly the same, particularly when it comes to performance. (It is well known that two consecutive cars off the same assembly line will perform slightly differently from each other.) Minor differences in performance from year to year within the same make and model are not only possible, but are to be expected.
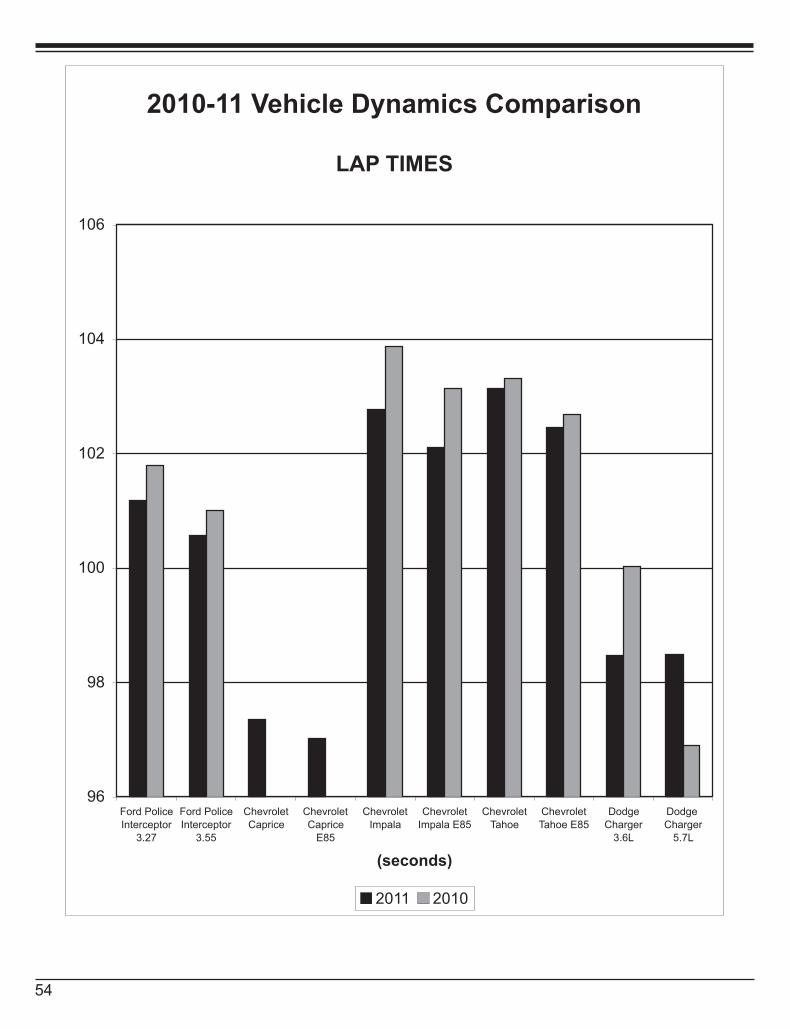
54
2010-11 Vehicle Dynamics Comparison
LAP TIMES
96
98
100
102
104
106
Ford Police
Interceptor
3.27
Ford Police
Interceptor
3.55
Chevrolet
Caprice
Chevrolet
Caprice
E85
Chevrolet
Impala
Chevrolet
Impala E85
Chevrolet
Tahoe
Chevrolet
Tahoe E85
Dodge
Charger
3.6L
Dodge
Charger
5.7L
(seconds)
2011 2010
2010-11 ACCELERATION COMPARISON
0-80 MPH
0
1
2
3
4
5
6
7
8
9
10
11
12
13
14
15
16
Ford Police
Interceptor
3.27
Ford Police
Interceptor
3.55
Chevrolet
Impala
Chevrolet
Impala E85
Chevrolet
Tahoe
Chevrolet
Tahoe E85
Dodge
Charger 3.6L
Dodge
Charger 5.7L
(seconds)
2011 2010
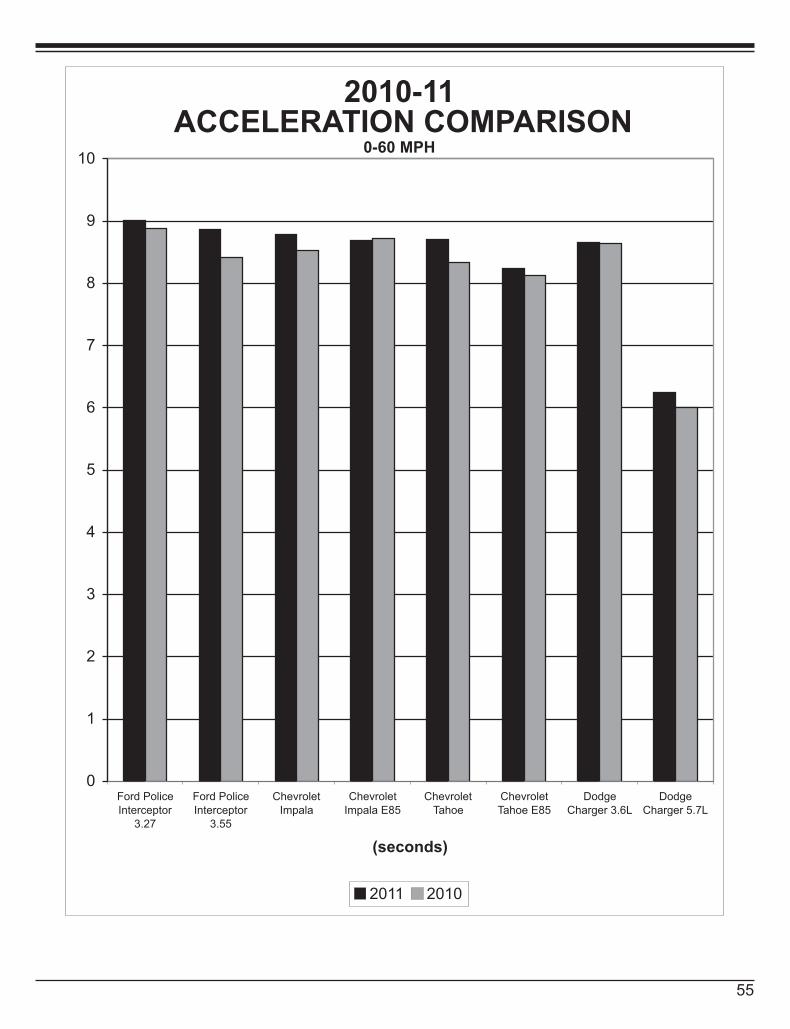
55
2010-11 Vehicle Dynamics Comparison
LAP TIMES
96
98
100
102
104
106
Ford Police
Interceptor
3.27
Ford Police
Interceptor
3.55
Chevrolet
Caprice
Chevrolet
Caprice
E85
Chevrolet
Impala
Chevrolet
Impala E85
Chevrolet
Tahoe
Chevrolet
Tahoe E85
Dodge
Charger
3.6L
Dodge
Charger
5.7L
(seconds)
2011 2010
2010-11 ACCELERATION COMPARISON
0-60 MPH
0
1
2
3
4
5
6
7
8
9
10
Ford Police
Interceptor
3.27
Ford Police
Interceptor
3.55
Chevrolet
Impala
Chevrolet
Impala E85
Chevrolet
Tahoe
Chevrolet
Tahoe E85
Dodge
Charger 3.6L
Dodge
Charger 5.7L
(seconds)
2011 2010
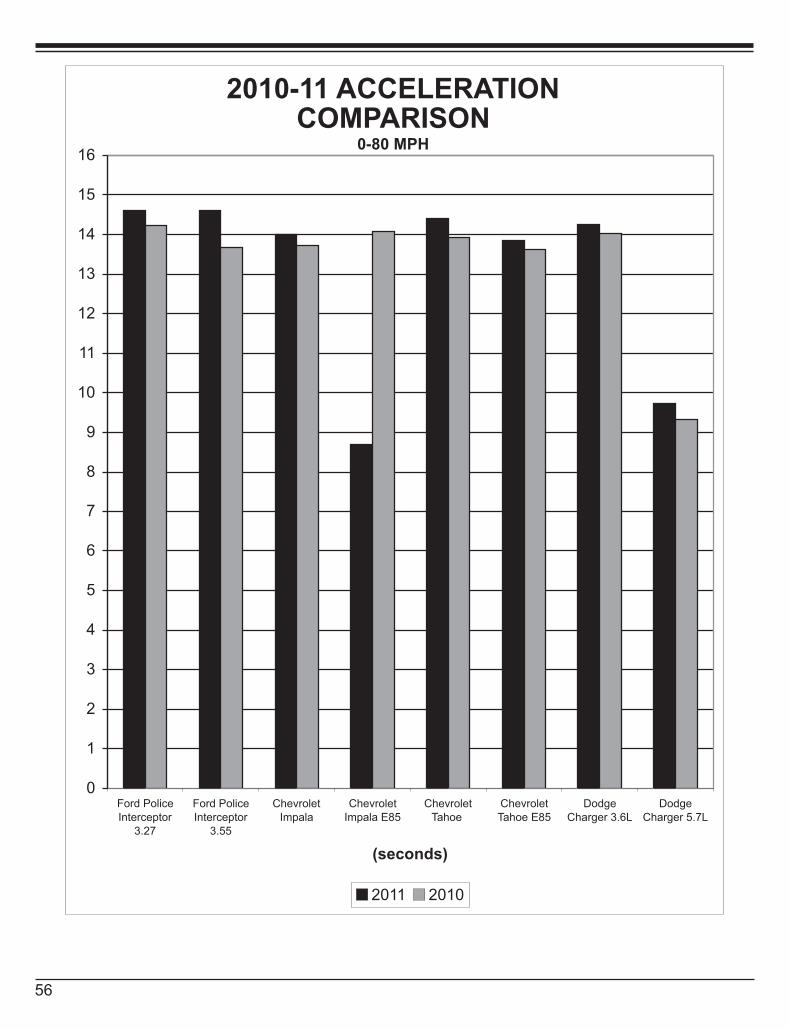
56
2010-11 ACCELERATION COMPARISON
0-80 MPH
0
1
2
3
4
5
6
7
8
9
10
11
12
13
14
15
16
Ford Police
Interceptor
3.27
Ford Police
Interceptor
3.55
Chevrolet
Impala
Chevrolet
Impala E85
Chevrolet
Tahoe
Chevrolet
Tahoe E85
Dodge
Charger 3.6L
Dodge
Charger 5.7L
(seconds)
2011 2010
2010-11 ACCELERATION COMPARISON
0-100 MPH
0
5
10
15
20
25
30
Ford Police
Interceptor
3.27
Ford Police
Interceptor
3.55
Chevrolet
Impala
Chevrolet
Impala E85
Chevrolet
Tahoe
Chevrolet
Tahoe E85
Dodge
Charger 3.5L
Dodge
Charger 5.7L
(seconds)
2011 2010
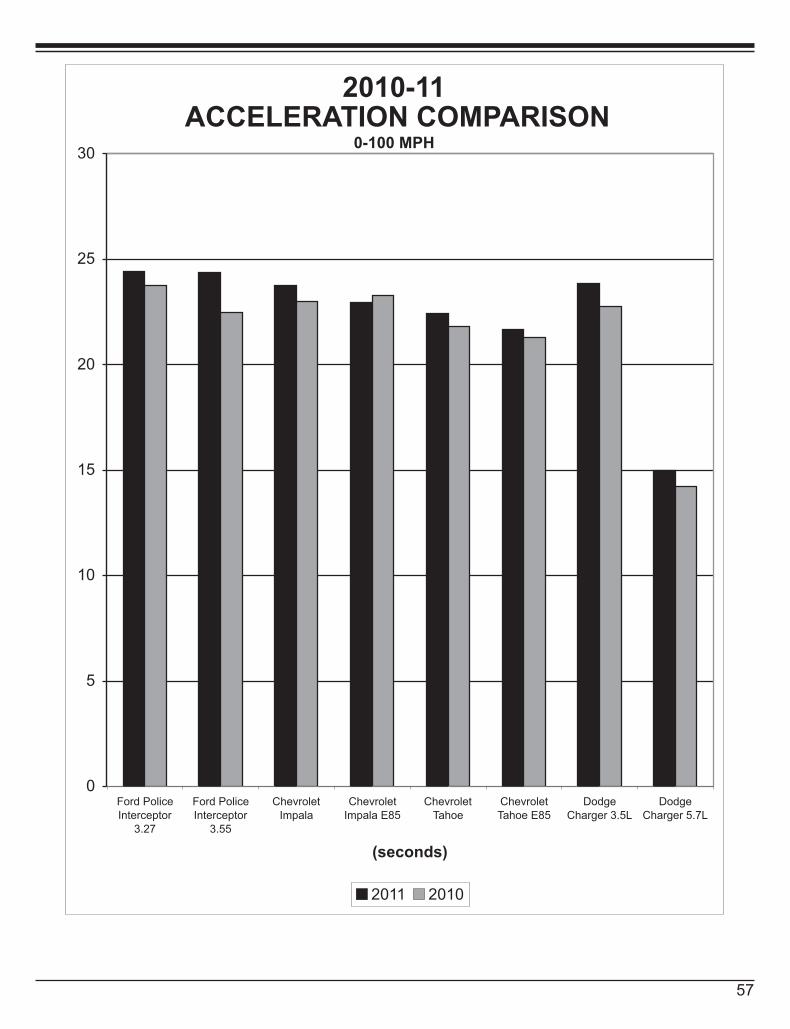
57
2010-11 ACCELERATION COMPARISON
0-80 MPH
0
1
2
3
4
5
6
7
8
9
10
11
12
13
14
15
16
Ford Police
Interceptor
3.27
Ford Police
Interceptor
3.55
Chevrolet
Impala
Chevrolet
Impala E85
Chevrolet
Tahoe
Chevrolet
Tahoe E85
Dodge
Charger 3.6L
Dodge
Charger 5.7L
(seconds)
2011 2010
2010-11 ACCELERATION COMPARISON
0-100 MPH
0
5
10
15
20
25
30
Ford Police
Interceptor
3.27
Ford Police
Interceptor
3.55
Chevrolet
Impala
Chevrolet
Impala E85
Chevrolet
Tahoe
Chevrolet
Tahoe E85
Dodge
Charger 3.5L
Dodge
Charger 5.7L
(seconds)
2011 2010
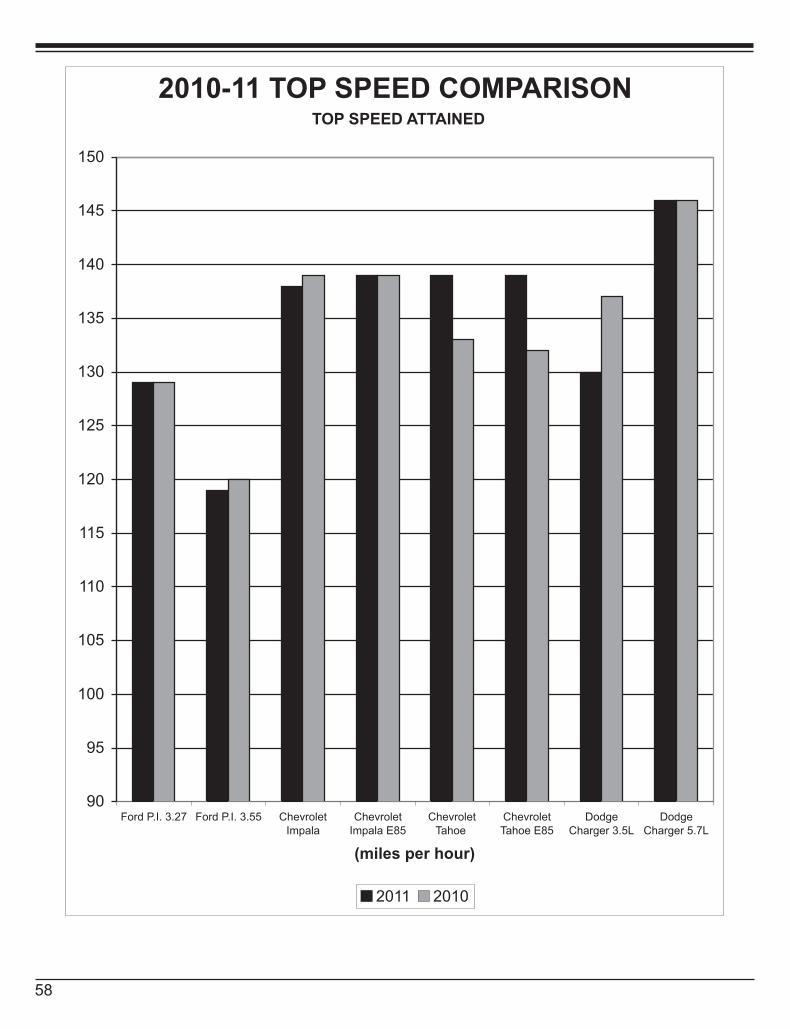
58
2010-11 TOP SPEED COMPARISON TOP SPEED ATTAINED
90
95
100
105
110
115
120
125
130
135
140
145
150
Ford P.I. 3.27 Ford P.I. 3.55 Chevrolet
Impala
Chevrolet
Impala E85
Chevrolet
Tahoe
Chevrolet
Tahoe E85
Dodge
Charger 3.5L
Dodge
Charger 5.7L
(miles per hour)
2011 2010
2010-11 BRAKE TESTING COMPARISON
STOPPING DISTANCES
0
10
20
30
40
50
60
70
80
90
100
110
120
130
140
150
160
Ford Police Interceptor
3.27
Chevrolet Impala Chevrolet Tahoe Dodge Charger 3.6L Dodge Charger 5.7L
(in "feet" from 60 mph)
2011 2010
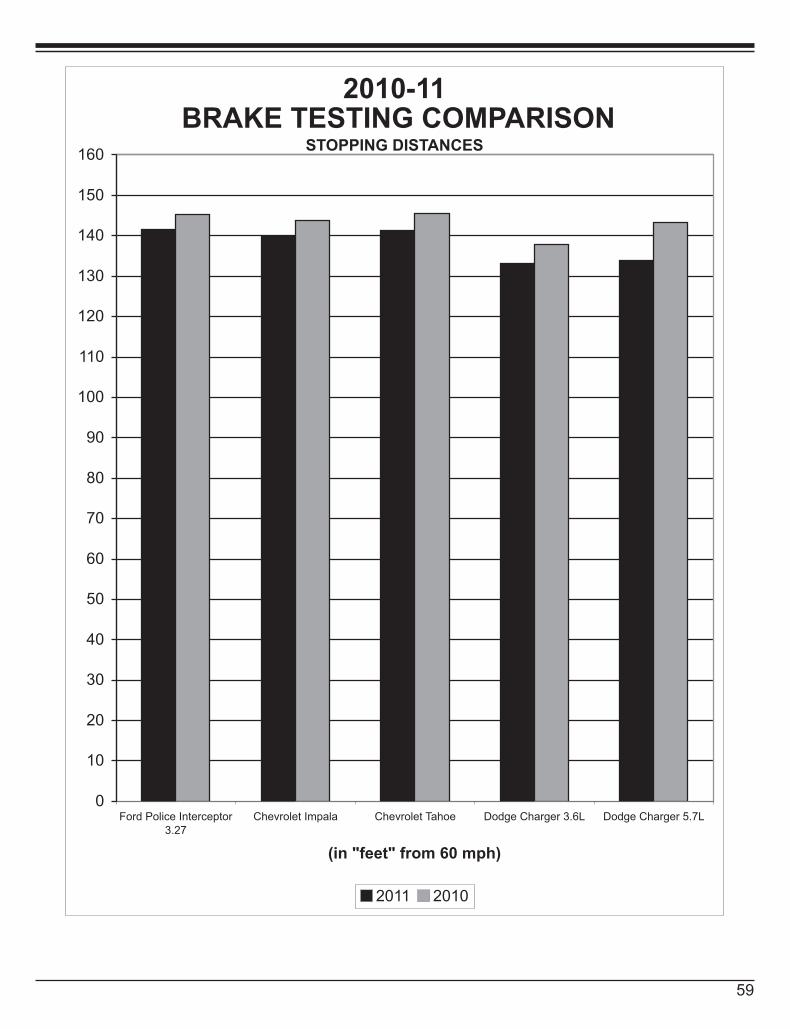
59
2010-11 TOP SPEED COMPARISON TOP SPEED ATTAINED
90
95
100
105
110
115
120
125
130
135
140
145
150
Ford P.I. 3.27 Ford P.I. 3.55 Chevrolet
Impala
Chevrolet
Impala E85
Chevrolet
Tahoe
Chevrolet
Tahoe E85
Dodge
Charger 3.5L
Dodge
Charger 5.7L
(miles per hour)
2011 2010
2010-11 BRAKE TESTING COMPARISON
STOPPING DISTANCES
0
10
20
30
40
50
60
70
80
90
100
110
120
130
140
150
160
Ford Police Interceptor
3.27
Chevrolet Impala Chevrolet Tahoe Dodge Charger 3.6L Dodge Charger 5.7L
(in "feet" from 60 mph)
2011 2010
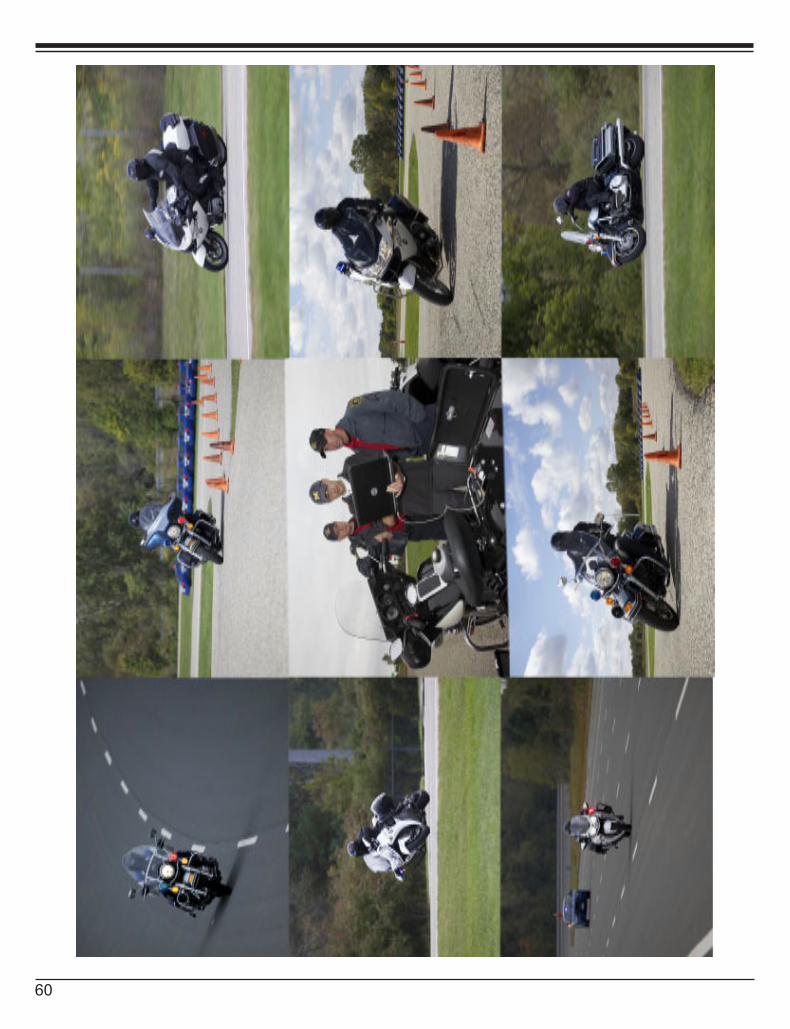
60
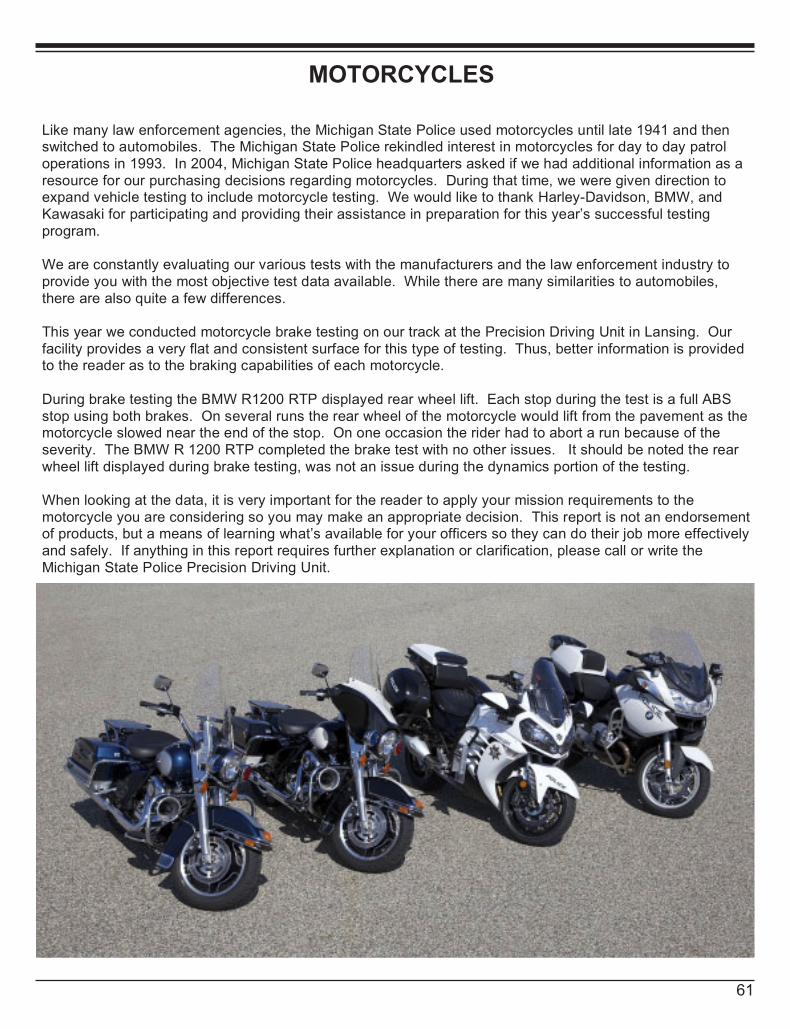
61
61
MOTORCYCLES
Like many law enforcement agencies, the Michigan State Police used motorcycles until late 1941 and then switched to automobiles. The Michigan State Police rekindled interest in motorcycles for day to day patrol operations in 1993. In 2004, Michigan State Police headquarters asked if we had additional information as a resource for our purchasing decisions regarding motorcycles. During that time, we were given direction to expand vehicle testing to include motorcycle testing. We would like to thank Harley-Davidson, BMW, and Kawasaki for participating and providing their assistance in preparation for this year’s successful testing program. We are constantly evaluating our various tests with the manufacturers and the law enforcement industry to provide you with the most objective test data available. While there are many similarities to automobiles, there are also quite a few differences. This year we conducted motorcycle brake testing on our track at the Precision Driving Unit in Lansing. Our facility provides a very flat and consistent surface for this type of testing. Thus, better information is provided to the reader as to the braking capabilities of each motorcycle. During brake testing the BMW R1200 RTP displayed rear wheel lift. Each stop during the test is a full ABS stop using both brakes. On several runs the rear wheel of the motorcycle would lift from the pavement as the motorcycle slowed near the end of the stop. On one occasion the rider had to abort a run because of the severity. The BMW R 1200 RTP completed the brake test with no other issues. It should be noted the rear wheel lift displayed during brake testing, was not an issue during the dynamics portion of the testing. When looking at the data, it is very important for the reader to apply your mission requirements to the motorcycle you are considering so you may make an appropriate decision. This report is not an endorsement of products, but a means of learning what’s available for your officers so they can do their job more effectively and safely. If anything in this report requires further explanation or clarification, please call or write the Michigan State Police Precision Driving Unit.
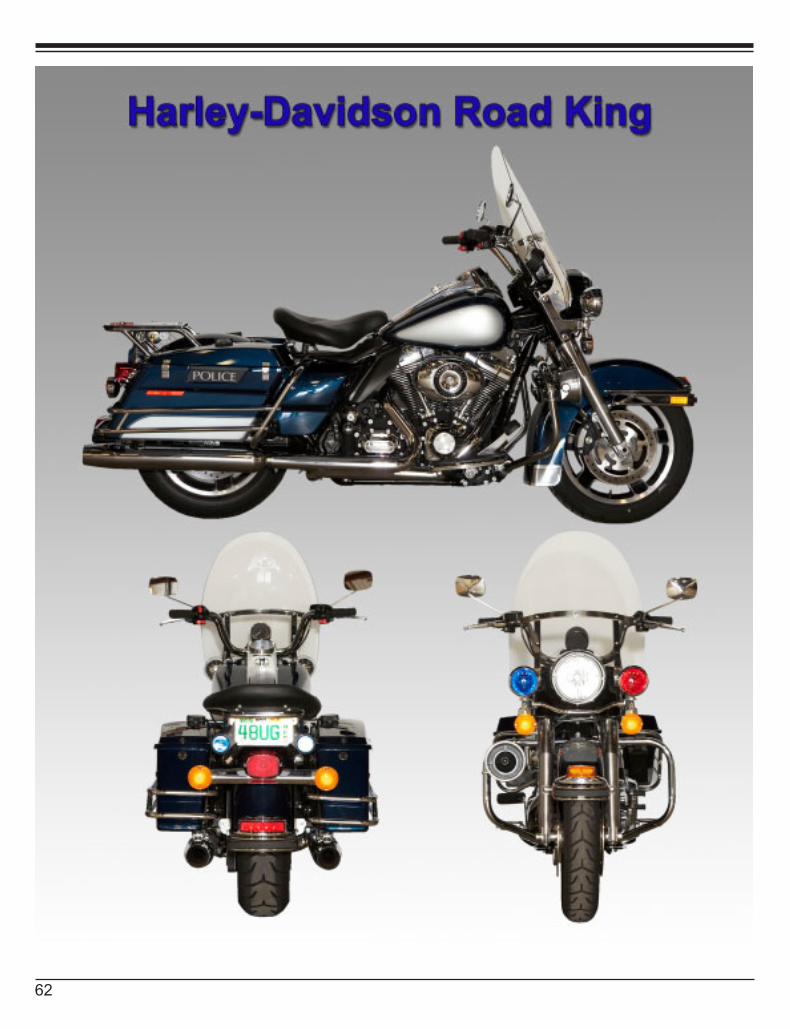
62
63
TEST VEHICLE DESCRIPTION
MAKE Harley-Davidson MODEL FLHP SALES CODE NO. N/A
ENGINE DISPLACEMENT CUBIC CENTIMETERS 1690 CUBIC INCHES 103
FUEL SYSTEM EFI EXHAUST Crossover Dual
BORE & STROKE 3.875 x 4.375 in ALTERNATOR 50 amp
TORQUE 102 ft-lbs @ 3500 RPM BATTERY 28 Amp Hour 270 CCA
COMPRESSION RATIO 9.6:1
TRANSMISSION PRIMARY DRIVE 34/46 FINAL DRIVE 32/68
GEAR RATIO 2.875 overall
LEAN ANGLE LEFT 31 Deg RIGHT 33 Deg
CLUTCH Wet multiple plate
WHEELS/TIRES Wheels/Slotted Disk Cast Aluminum front and rear / Front 17 x 3 / Rear 16 x 5 Tires / Front Dunlop D407F 130/80B17 Rear Dunlop D407 180/65B16
FRONT SUSPENSION FORK ANGLE 29.25° RAKE 26°
REAR SUSPENSION Swing Arm w/ Air Adjustable Shocks
SUSPENSION TRAVEL FRONT 4.6 in. REAR 3.0 in.
GROUND CLEARANCE, MINIMUM 5.1 in.
BRAKE SYSTEM Hydraulic Disc / Independent Front & Rear ABS
BRAKES, FRONT TYPE Dual Disc SWEPT AREA 180sq in.
BRAKES, REAR TYPE Single Disc SWEPT AREA 90sq in.
FUEL CAPACITY GALLONS 6 LITERS 22.71
OIL CAPACITY 4 Qts
WHEELBASE 63.54 in. LENGTH 95.14 in.
TEST WEIGHT 845 lbs. OVERALL HEIGHT 55.1 in.
GENERAL MEASUREMENTS
SEAT HEIGHT 27.3 in. laden
EPA MILEAGE EST. (MPG) CITY 35 HIGHWAY 54 COMBINED 44.5
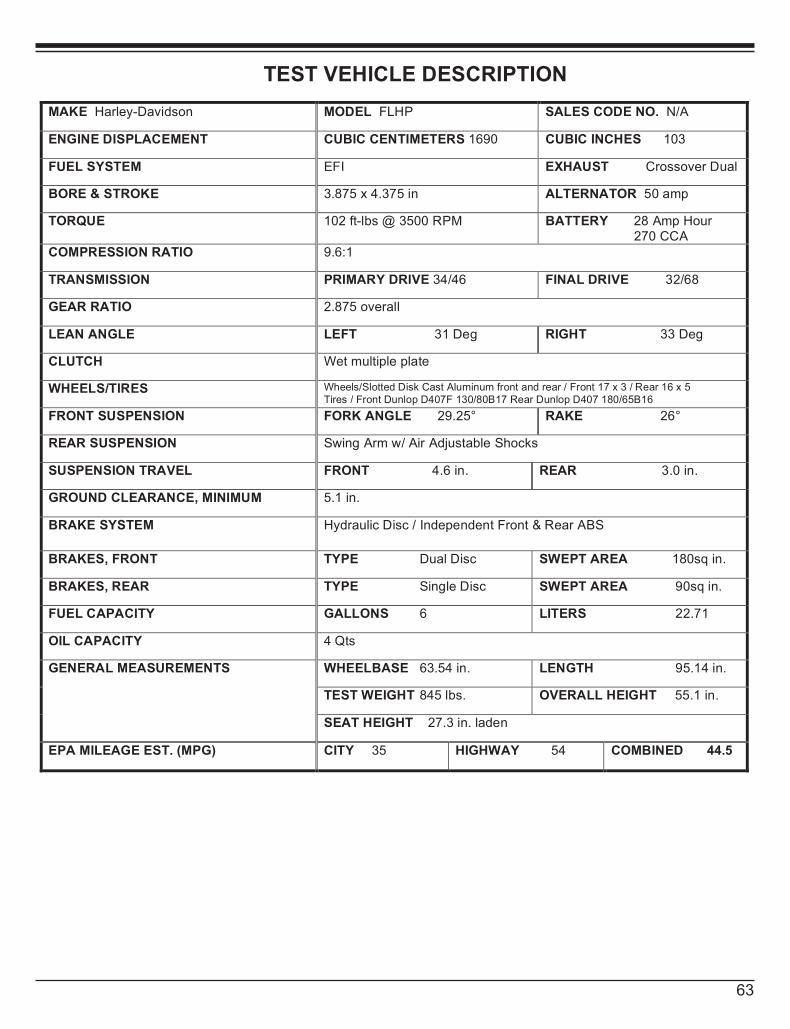
63
63
TEST VEHICLE DESCRIPTION
MAKE Harley-Davidson MODEL FLHP SALES CODE NO. N/A
ENGINE DISPLACEMENT CUBIC CENTIMETERS 1690 CUBIC INCHES 103
FUEL SYSTEM EFI EXHAUST Crossover Dual
BORE & STROKE 3.875 x 4.375 in ALTERNATOR 50 amp
TORQUE 102 ft-lbs @ 3500 RPM BATTERY 28 Amp Hour 270 CCA
COMPRESSION RATIO 9.6:1
TRANSMISSION PRIMARY DRIVE 34/46 FINAL DRIVE 32/68
GEAR RATIO 2.875 overall
LEAN ANGLE LEFT 31 Deg RIGHT 33 Deg
CLUTCH Wet multiple plate
WHEELS/TIRES Wheels/Slotted Disk Cast Aluminum front and rear / Front 17 x 3 / Rear 16 x 5 Tires / Front Dunlop D407F 130/80B17 Rear Dunlop D407 180/65B16
FRONT SUSPENSION FORK ANGLE 29.25° RAKE 26°
REAR SUSPENSION Swing Arm w/ Air Adjustable Shocks
SUSPENSION TRAVEL FRONT 4.6 in. REAR 3.0 in.
GROUND CLEARANCE, MINIMUM 5.1 in.
BRAKE SYSTEM Hydraulic Disc / Independent Front & Rear ABS
BRAKES, FRONT TYPE Dual Disc SWEPT AREA 180sq in.
BRAKES, REAR TYPE Single Disc SWEPT AREA 90sq in.
FUEL CAPACITY GALLONS 6 LITERS 22.71
OIL CAPACITY 4 Qts
WHEELBASE 63.54 in. LENGTH 95.14 in.
TEST WEIGHT 845 lbs. OVERALL HEIGHT 55.1 in.
GENERAL MEASUREMENTS
SEAT HEIGHT 27.3 in. laden
EPA MILEAGE EST. (MPG) CITY 35 HIGHWAY 54 COMBINED 44.5
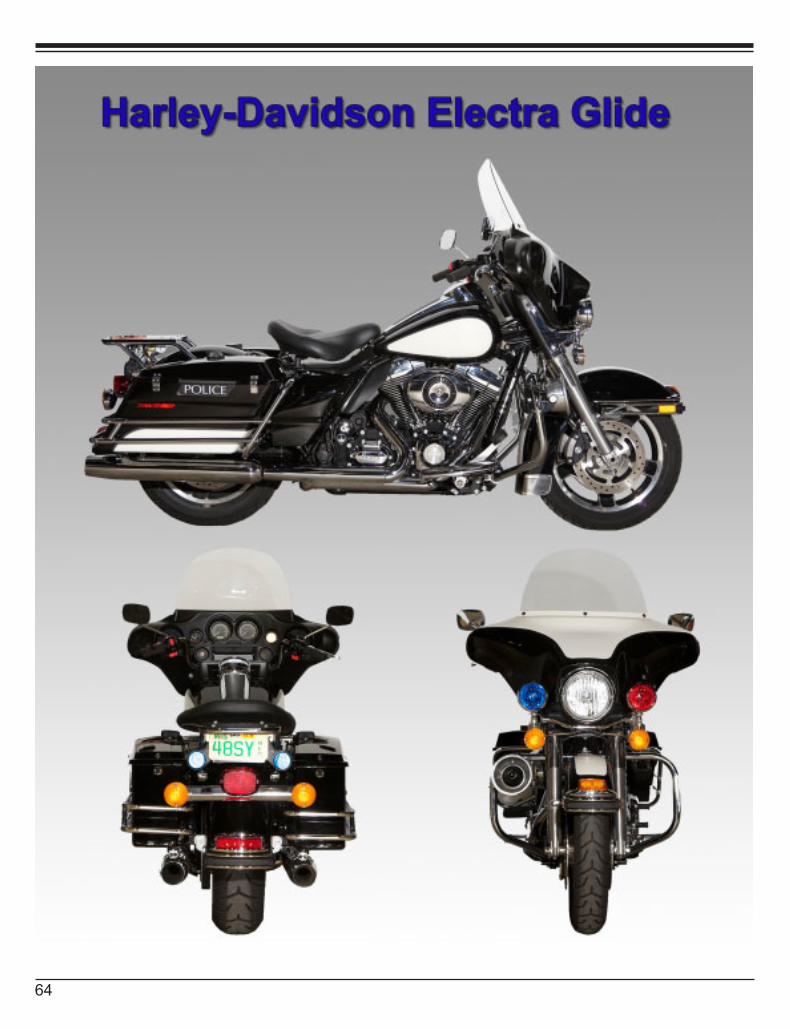
64
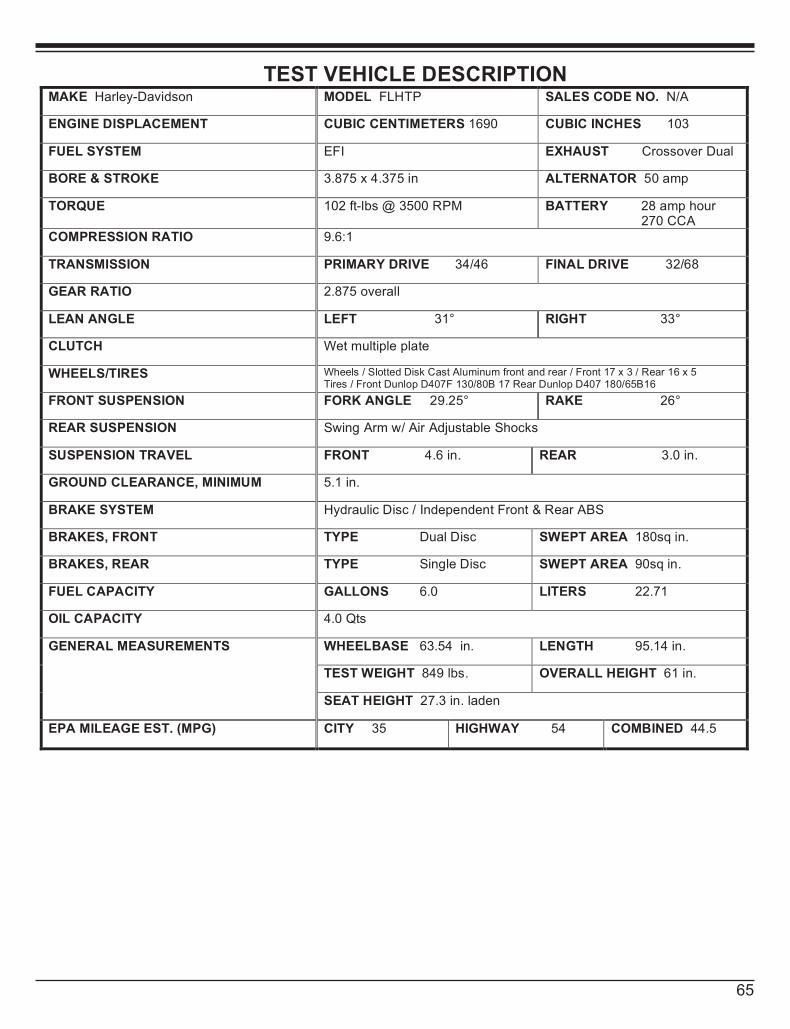
65
65
TEST VEHICLE DESCRIPTION MAKE Harley-Davidson MODEL FLHTP SALES CODE NO. N/A
ENGINE DISPLACEMENT CUBIC CENTIMETERS 1690 CUBIC INCHES 103
FUEL SYSTEM EFI EXHAUST Crossover Dual
BORE & STROKE 3.875 x 4.375 in ALTERNATOR 50 amp
TORQUE 102 ft-lbs @ 3500 RPM BATTERY 28 amp hour 270 CCA
COMPRESSION RATIO 9.6:1
TRANSMISSION PRIMARY DRIVE 34/46 FINAL DRIVE 32/68
GEAR RATIO 2.875 overall
LEAN ANGLE LEFT 31° RIGHT 33°
CLUTCH Wet multiple plate
WHEELS/TIRES Wheels / Slotted Disk Cast Aluminum front and rear / Front 17 x 3 / Rear 16 x 5 Tires / Front Dunlop D407F 130/80B 17 Rear Dunlop D407 180/65B16
FRONT SUSPENSION FORK ANGLE 29.25° RAKE 26°
REAR SUSPENSION Swing Arm w/ Air Adjustable Shocks
SUSPENSION TRAVEL FRONT 4.6 in. REAR 3.0 in.
GROUND CLEARANCE, MINIMUM 5.1 in.
BRAKE SYSTEM Hydraulic Disc / Independent Front & Rear ABS
BRAKES, FRONT TYPE Dual Disc SWEPT AREA 180sq in.
BRAKES, REAR TYPE Single Disc SWEPT AREA 90sq in.
FUEL CAPACITY GALLONS 6.0 LITERS 22.71
OIL CAPACITY 4.0 Qts
WHEELBASE 63.54 in. LENGTH 95.14 in.
TEST WEIGHT 849 lbs. OVERALL HEIGHT 61 in.
GENERAL MEASUREMENTS
SEAT HEIGHT 27.3 in. laden
EPA MILEAGE EST. (MPG) CITY 35 HIGHWAY 54 COMBINED 44.5
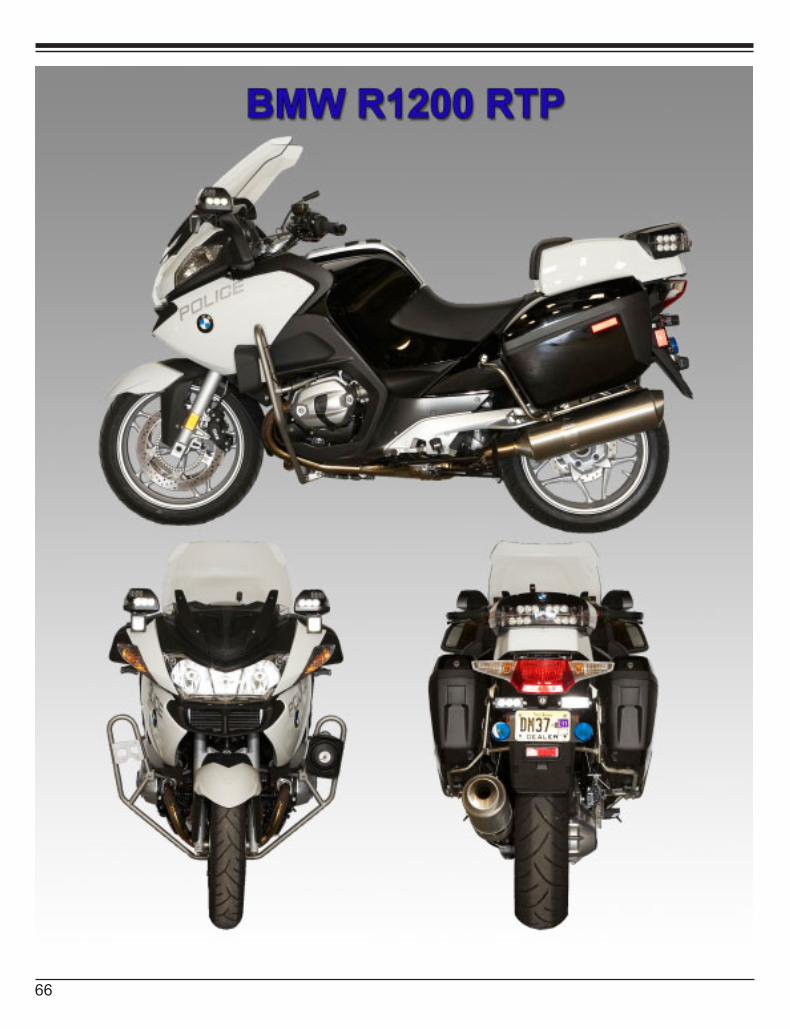
66
67
TEST VEHICLE DESCRIPTION
MAKE BMW MODEL R1200RT-P SALES CODE NO. 08RB
ENGINE DISPLACEMENT CUBIC CENTIMETERS 1170 Engine 2-Cylinder
FUEL SYSTEM BMSK-P Injection EXHAUST Stainless Steel with Catalytic Converter
BORE & STROKE 101 mm. x 73 mm. ALTERNATOR 720 W
TORQUE 85 ft-lbs @ 6,000 rpm. BATTERY 2 19 Amp Ah Gel Maintenance-Free
COMPRESSION RATIO 12.0:1
TRANSMISSION PRIMARY DRIVE Gear 1:1.882 FINAL DRIVE Shaft w/ring & pinion gear
GEAR RATIO 1:2.75 rear drive ratio
LEAN ANGLE LEFT 46° RIGHT 46°
CLUTCH Self-adjusting Hydraulic Actuating Single Plate Dry Clutch
WHEELS/TIRES Die-cast Aluminum MTH2 Rim Profile fitted with Run-Flat Tires(meets California Highway Patrol Run-Flat Protocol)/Tires Dunlop Sport Max F-120/70 ZR17 R-180/55 ZR17
FRONT SUSPENSION FORK ANGLE 63.4 BMW Telelever
RAKE Castor in normal position 4.3 in.
REAR SUSPENSION BMW Evo Paralever
SUSPENSION TRAVEL FRONT 4.7 in. REAR 5.3 in.
GROUND CLEARANCE, MINIMUM 5.125 in.
BRAKE SYSTEM BMW/ABS Partially Integrated Brake System
BRAKES, FRONT TYPE Dual 12.6 in. Disc
SWEPT AREA 186 sq. in.
BRAKES, REAR TYPE Single 10.4in. Disc
SWEPT AREA 62 sq. in.
FUEL CAPACITY GALLONS 7.1 LITERS 27
OIL CAPACITY 4.0 Qts.
WHEELBASE 58.4 in. LENGTH 87.8 in.
TEST WEIGHT 677 OVERALL HEIGHT 56.3 in.
GENERAL MEASUREMENTS
*SEAT HEIGHT 32.2 in.
EPA MILEAGE EST. (MPG) (Based on DIN standard test)
CITY N/A HIGHWAY 48 @ 75mph 65 @ 55mph
COMBINED N/A
*Seat height has two adjustment positions. A low seat is available making the seat height 31”.

67
67
TEST VEHICLE DESCRIPTION
MAKE BMW MODEL R1200RT-P SALES CODE NO. 08RB
ENGINE DISPLACEMENT CUBIC CENTIMETERS 1170 Engine 2-Cylinder
FUEL SYSTEM BMSK-P Injection EXHAUST Stainless Steel with Catalytic Converter
BORE & STROKE 101 mm. x 73 mm. ALTERNATOR 720 W
TORQUE 85 ft-lbs @ 6,000 rpm. BATTERY 2 19 Amp Ah Gel Maintenance-Free
COMPRESSION RATIO 12.0:1
TRANSMISSION PRIMARY DRIVE Gear 1:1.882 FINAL DRIVE Shaft w/ring & pinion gear
GEAR RATIO 1:2.75 rear drive ratio
LEAN ANGLE LEFT 46° RIGHT 46°
CLUTCH Self-adjusting Hydraulic Actuating Single Plate Dry Clutch
WHEELS/TIRES Die-cast Aluminum MTH2 Rim Profile fitted with Run-Flat Tires (meets California Highway Patrol Run-Flat Protocol)/Tires Dunlop Sport Max F-120/70 ZR17 R-180/55 ZR17
FRONT SUSPENSION FORK ANGLE 63.4 BMW Telelever
RAKE Castor in normal position 4.3 in.
REAR SUSPENSION BMW Evo Paralever
SUSPENSION TRAVEL FRONT 4.7 in. REAR 5.3 in.
GROUND CLEARANCE, MINIMUM 5.125 in.
BRAKE SYSTEM BMW/ABS Partially Integrated Brake System
BRAKES, FRONT TYPE Dual 12.6 in. Disc
SWEPT AREA 186 sq. in.
BRAKES, REAR TYPE Single 10.4in. Disc
SWEPT AREA 62 sq. in.
FUEL CAPACITY GALLONS 7.1 LITERS 27
OIL CAPACITY 4.0 Qts.
WHEELBASE 58.4 in. LENGTH 87.8 in.
TEST WEIGHT 677 OVERALL HEIGHT 56.3 in.
GENERAL MEASUREMENTS
*SEAT HEIGHT 32.2 in.
EPA MILEAGE EST. (MPG) (Based on DIN standard test)
CITY N/A HIGHWAY 48 @ 75mph 65 @ 55mph
COMBINED N/A
*Seat height has two adjustment positions. A low seat is available making the seat height 31”.
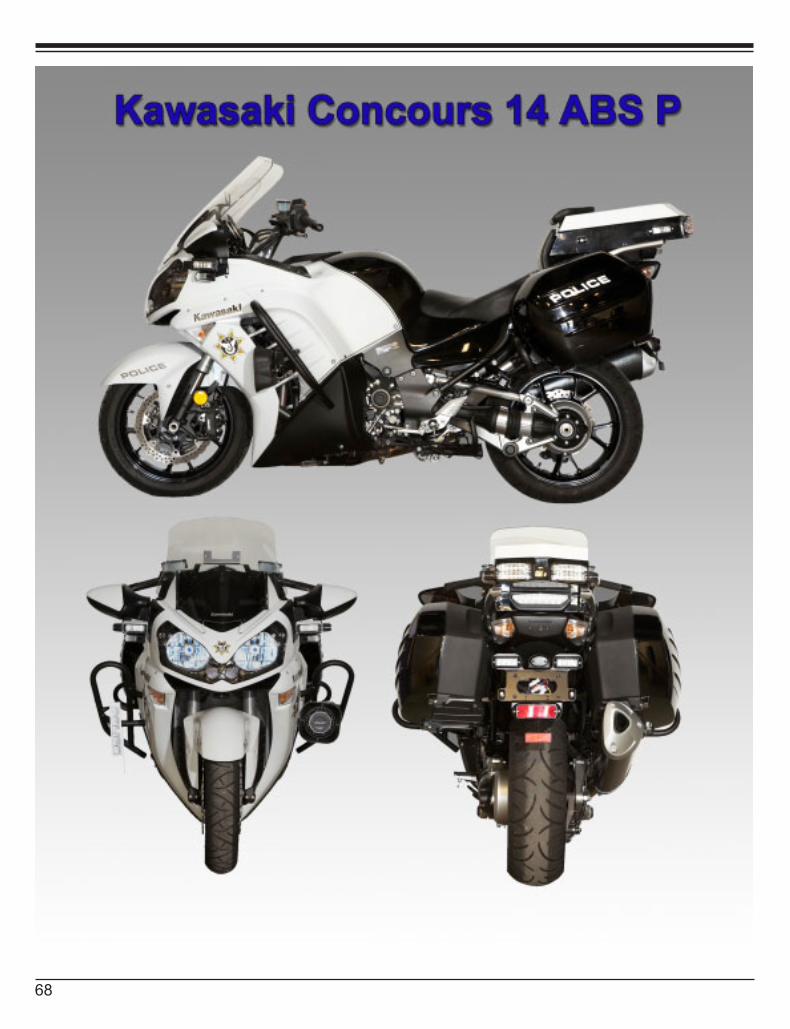
68
69
TEST DESCRIPTION SHEET MAKE Kawasaki MODEL Concours 14 ABS
Police SALES CODE NO.
ENGINE DISPLACEMENT CUBIC CENTIMETERS 1352 ENGINE Inline 4-Cyl.
FUEL SYSTEM FI, Mikuni 40EIDW x 4 EXHAUST 4 into 1
BORE & STROKE 84.0 mm x 61.0 mm ALTERNATOR 581 watts
TORQUE 102 lb/ft @ 6,200 rpm BATTERY 2 x 14 Amp Ah Maintenance-Free
COMPRESSION RATIO 10.7:1
TRANSMISSION PRIMARY DRIVE Gear 1:1.556
FINAL DRIVE Shaft
GEAR RATIO 1 : 2.036 rear drive ratio
LEAN ANGLE LEFT 47 degrees RIGHT 48 degrees
CLUTCH Wet, multi disc
WHEELS/TIRES Cast aluminum rims, Bridgestone BT021 120/70ZR17, 190/50ZR17 (passed California Highway Patrol run flat protocol)
FRONT SUSPENSION FORK ANGLE RAKE 26.1°
REAR SUSPENSION Tetra lever and Uni Trak®
SUSPENSION TRAVEL FRONT 4.4 inches REAR 5.3 inches
GROUND CLEARANCE, MINIMUM 4.92 inches
BRAKE SYSTEM K-ACT ABS – 2 link settings, non-linked below 13 mph
BRAKES, FRONT TYPE Dual floating 310mm petal discs, 4 piston, radial mount calipers
SWEPT AREA 164 in/sq.
BRAKES, REAR TYPE Single 250mm petal disc
SWEPT AREA 65 in/sq.
FUEL CAPACITY GALLONS 5.8 Gal. LITERS 22 L.
OIL CAPACITY 5 qts.
WHEELBASE 59.8 inches LENGTH 87.8 inches
TEST WEIGHT 767. OVERALL HEIGHT 52.9”
GENERAL MEASUREMENTS
SEAT HEIGHT 31.0 inches
EPA MILEAGE EST. (MPG) CITY HIGHWAY COMBINED 36*
Note: * FTP (Federal Test Procedure) mileage figures indicate 36 mpg during exhaust emission test.
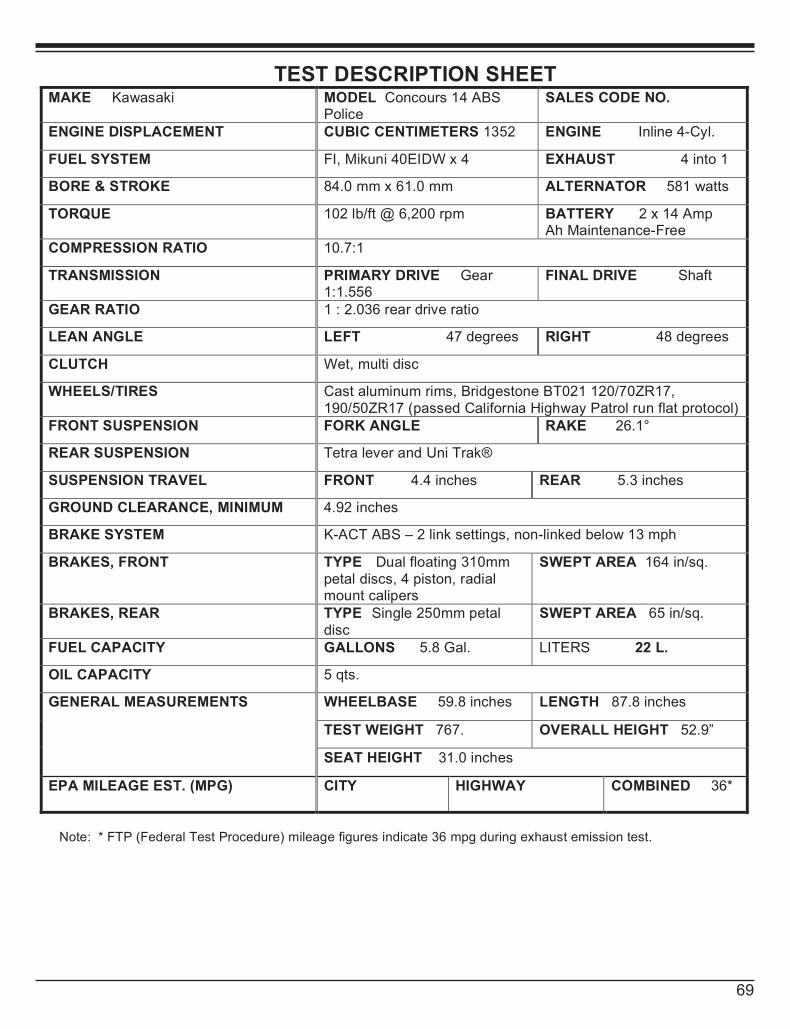
69
69
TEST DESCRIPTION SHEET MAKE Kawasaki MODEL Concours 14 ABS
Police SALES CODE NO.
ENGINE DISPLACEMENT CUBIC CENTIMETERS 1352 ENGINE Inline 4-Cyl.
FUEL SYSTEM FI, Mikuni 40EIDW x 4 EXHAUST 4 into 1
BORE & STROKE 84.0 mm x 61.0 mm ALTERNATOR 581 watts
TORQUE 102 lb/ft @ 6,200 rpm BATTERY 2 x 14 Amp Ah Maintenance-Free
COMPRESSION RATIO 10.7:1
TRANSMISSION PRIMARY DRIVE Gear 1:1.556
FINAL DRIVE Shaft
GEAR RATIO 1 : 2.036 rear drive ratio
LEAN ANGLE LEFT 47 degrees RIGHT 48 degrees
CLUTCH Wet, multi disc
WHEELS/TIRES Cast aluminum rims, Bridgestone BT021 120/70ZR17, 190/50ZR17 (passed California Highway Patrol run flat protocol)
FRONT SUSPENSION FORK ANGLE RAKE 26.1°
REAR SUSPENSION Tetra lever and Uni Trak®
SUSPENSION TRAVEL FRONT 4.4 inches REAR 5.3 inches
GROUND CLEARANCE, MINIMUM 4.92 inches
BRAKE SYSTEM K-ACT ABS – 2 link settings, non-linked below 13 mph
BRAKES, FRONT TYPE Dual floating 310mm petal discs, 4 piston, radial mount calipers
SWEPT AREA 164 in/sq.
BRAKES, REAR TYPE Single 250mm petal disc
SWEPT AREA 65 in/sq.
FUEL CAPACITY GALLONS 5.8 Gal. LITERS 22 L.
OIL CAPACITY 5 qts.
WHEELBASE 59.8 inches LENGTH 87.8 inches
TEST WEIGHT 767. OVERALL HEIGHT 52.9”
GENERAL MEASUREMENTS
SEAT HEIGHT 31.0 inches
EPA MILEAGE EST. (MPG) CITY HIGHWAY COMBINED 36*
Note: * FTP (Federal Test Procedure) mileage figures indicate 36 mpg during exhaust emission test.
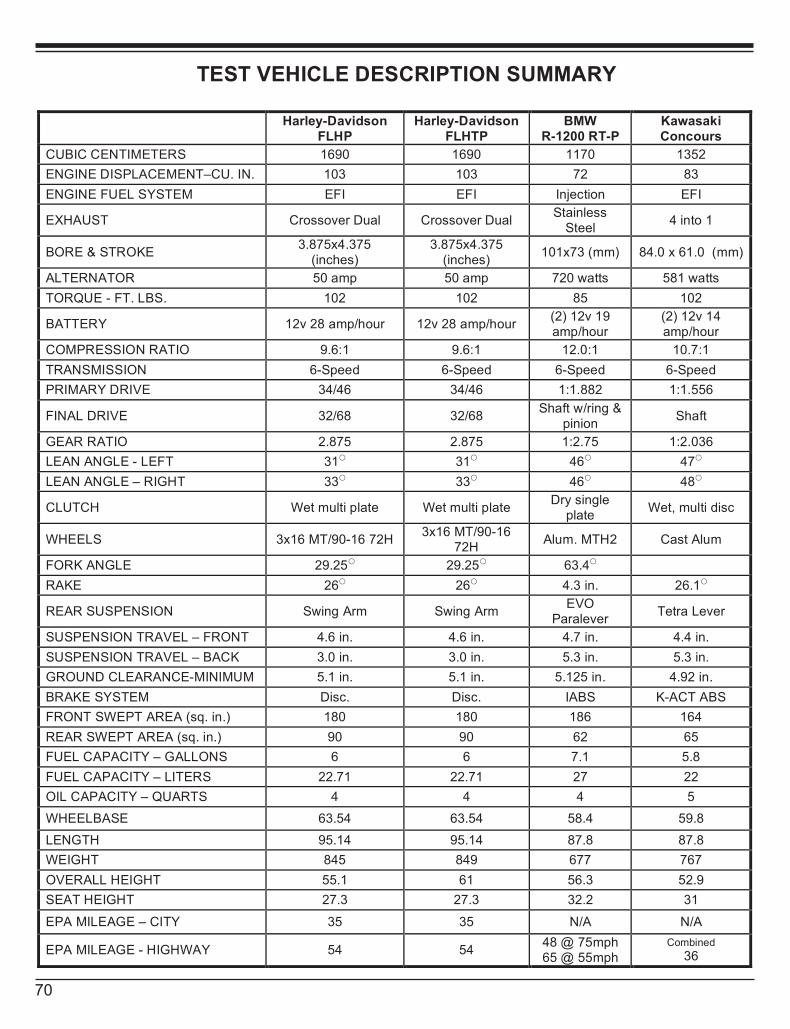
70
70
TEST VEHICLE DESCRIPTION SUMMARY
Harley-Davidson FLHP
Harley-Davidson FLHTP
BMW R-1200 RT-P
Kawasaki Concours
CUBIC CENTIMETERS 1690 1690 1170 1352
ENGINE DISPLACEMENT–CU. IN. 103 103 72 83
ENGINE FUEL SYSTEM EFI EFI Injection EFI
EXHAUST Crossover Dual Crossover Dual Stainless
Steel 4 into 1
BORE & STROKE 3.875x4.375
(inches) 3.875x4.375
(inches) 101x73 (mm) 84.0 x 61.0 (mm)
ALTERNATOR 50 amp 50 amp 720 watts 581 watts
TORQUE - FT. LBS. 102 102 85 102
BATTERY 12v 28 amp/hour 12v 28 amp/hour (2) 12v 19 amp/hour
(2) 12v 14 amp/hour
COMPRESSION RATIO 9.6:1 9.6:1 12.0:1 10.7:1
TRANSMISSION 6-Speed 6-Speed 6-Speed 6-Speed
PRIMARY DRIVE 34/46 34/46 1:1.882 1:1.556
FINAL DRIVE 32/68 32/68 Shaft w/ring &
pinion Shaft
GEAR RATIO 2.875 2.875 1:2.75 1:2.036
LEAN ANGLE - LEFT 31 31 46 47
LEAN ANGLE – RIGHT 33 33 46 48
CLUTCH Wet multi plate Wet multi plate Dry single
plate Wet, multi disc
WHEELS 3x16 MT/90-16 72H 3x16 MT/90-16
72H Alum. MTH2 Cast Alum
FORK ANGLE 29.25 29.25 63.4
RAKE 26 26 4.3 in. 26.1
REAR SUSPENSION Swing Arm Swing Arm EVO
Paralever Tetra Lever
SUSPENSION TRAVEL – FRONT 4.6 in. 4.6 in. 4.7 in. 4.4 in.
SUSPENSION TRAVEL – BACK 3.0 in. 3.0 in. 5.3 in. 5.3 in.
GROUND CLEARANCE-MINIMUM 5.1 in. 5.1 in. 5.125 in. 4.92 in.
BRAKE SYSTEM Disc. Disc. IABS K-ACT ABS
FRONT SWEPT AREA (sq. in.) 180 180 186 164
REAR SWEPT AREA (sq. in.) 90 90 62 65
FUEL CAPACITY – GALLONS 6 6 7.1 5.8
FUEL CAPACITY – LITERS 22.71 22.71 27 22
OIL CAPACITY – QUARTS 4 4 4 5
WHEELBASE 63.54 63.54 58.4 59.8
LENGTH 95.14 95.14 87.8 87.8
WEIGHT 845 849 677 767
OVERALL HEIGHT 55.1 61 56.3 52.9
SEAT HEIGHT 27.3 27.3 32.2 31
EPA MILEAGE – CITY 35 35 N/A N/A
EPA MILEAGE - HIGHWAY 54 54 48 @ 75mph 65 @ 55mph
Combined
36
71
MOTORCYCLE DYNAMICS TESTING
MOTORCYCLE DYNAMICS TEST OBJECTIVE
Determine each motorcycle’s high speed handling characteristics and performance in comparison to other motorcycles. The course used contains 9 turns and curves (including a 90 degree left turn, a switch back, a sweeping turn, a high speed turn and a decreasing radius, with different braking requirements) and is 1 mile in length. The course simulates actual conditions encountered in pursuit or emergency driving situations in the field, with the exception of other traffic. The evaluation is a true test of the vehicle manufacturers in offering balanced packages of acceleration capabilities, suspension components, and braking characteristics.
MOTORCYCLE DYNAMICS TEST METHODOLOGY
Each motorcycle is driven using four separate riders for a six lap series. The best 5 out of six laps for each rider will be totaled for a cumulative time. The cumulative time is the score for each driver. The final score of each motorcycle is the combined average from the four rider’s cumulative times.
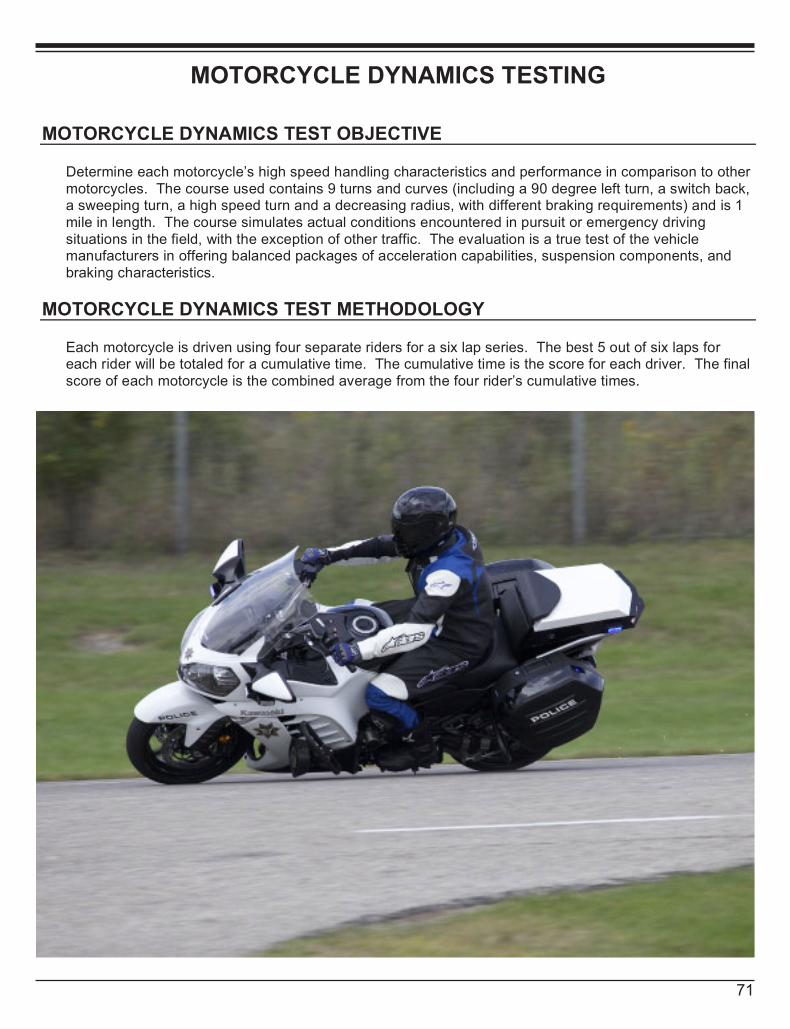
71
71
MOTORCYCLE DYNAMICS TESTING
MOTORCYCLE DYNAMICS TEST OBJECTIVE
Determine each motorcycle’s high speed handling characteristics and performance in comparison to other motorcycles. The course used contains 9 turns and curves (including a 90 degree left turn, a switch back, a sweeping turn, a high speed turn and a decreasing radius, with different braking requirements) and is 1 mile in length. The course simulates actual conditions encountered in pursuit or emergency driving situations in the field, with the exception of other traffic. The evaluation is a true test of the vehicle manufacturers in offering balanced packages of acceleration capabilities, suspension components, and braking characteristics.
MOTORCYCLE DYNAMICS TEST METHODOLOGY
Each motorcycle is driven using four separate riders for a six lap series. The best 5 out of six laps for each rider will be totaled for a cumulative time. The cumulative time is the score for each driver. The final score of each motorcycle is the combined average from the four rider’s cumulative times.
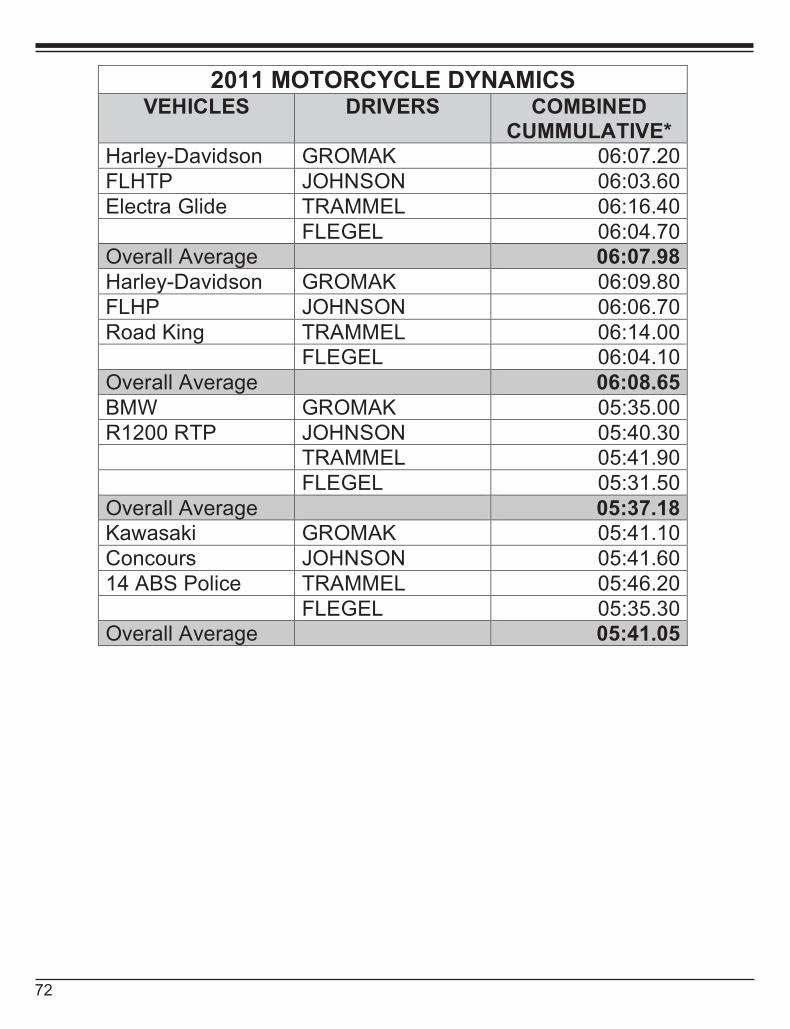
72
72
2011 MOTORCYCLE DYNAMICS VEHICLES DRIVERS COMBINED
CUMMULATIVE* Harley-Davidson GROMAK 06:07.20 FLHTP JOHNSON 06:03.60 Electra Glide TRAMMEL 06:16.40 FLEGEL 06:04.70 Overall Average 06:07.98 Harley-Davidson GROMAK 06:09.80 FLHP JOHNSON 06:06.70 Road King TRAMMEL 06:14.00 FLEGEL 06:04.10 Overall Average 06:08.65 BMW GROMAK 05:35.00 R1200 RTP JOHNSON 05:40.30 TRAMMEL 05:41.90 FLEGEL 05:31.50 Overall Average 05:37.18 Kawasaki GROMAK 05:41.10 Concours JOHNSON 05:41.60 14 ABS Police TRAMMEL 05:46.20 FLEGEL 05:35.30 Overall Average 05:41.05
73
73
MOTORCYCLE ACCELERATION AND TOP SPEED TESTING
ACCELERATION TEST OBJECTIVE
Determine the ability of each test motorcycle to accelerate from a standing start to 60 mph, 80 mph, and 100 mph.
ACCELERATION TEST METHODOLOGY
Using a Correvit L-350 1 Axis Optical Sensor, each motorcycle is driven through four acceleration sequences, two northbound and two southbound, to allow for wind direction. The four resulting times for each target speed are averaged and the average times used to derive scores on the competitive test for acceleration.
TOP SPEED TEST OBJECTIVE
Determine the actual top speed attainable by each test motorcycle within a distance of 10 miles from a standing start.
TOP SPEED TEST METHODOLOGY
Following the fourth acceleration run, each test motorcycle will continue to accelerate to the top speed attainable within 10 miles from the start of the run. The highest speed attained within the 10-mile distance will be the vehicle’s score on the competitive test for top speed.
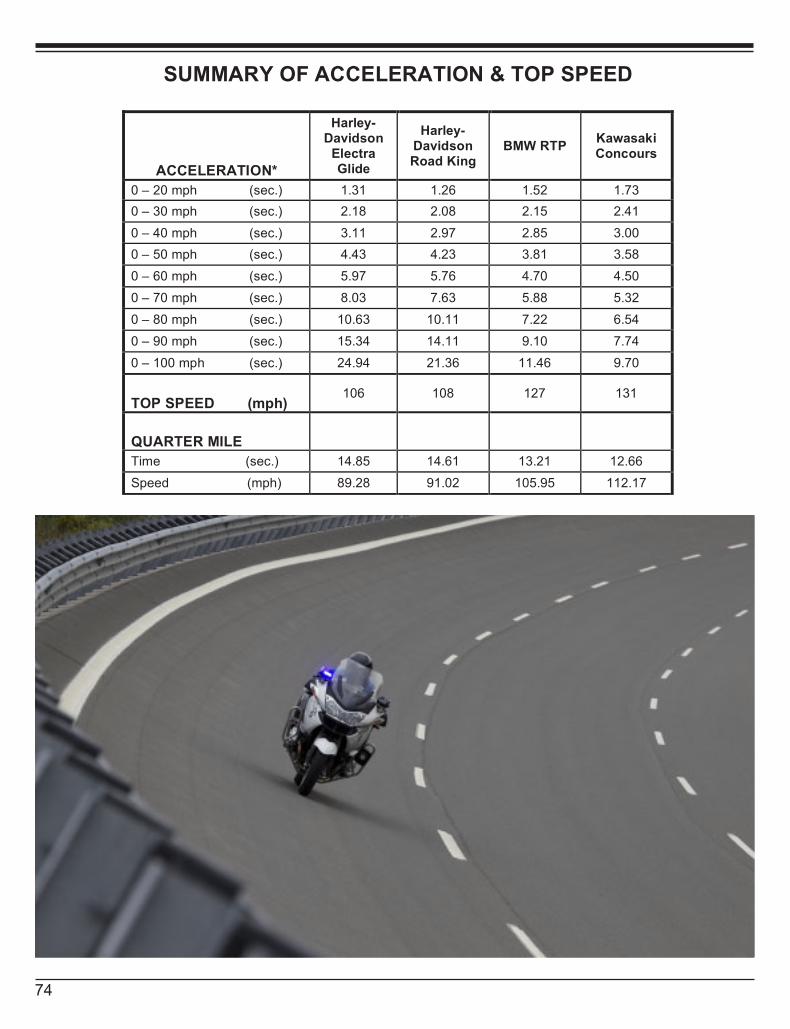
74
74
SUMMARY OF ACCELERATION & TOP SPEED
ACCELERATION*
Harley-Davidson
Electra Glide
Harley-Davidson Road King
BMW RTP Kawasaki Concours
0 – 20 mph (sec.) 1.31 1.26 1.52 1.73
0 – 30 mph (sec.) 2.18 2.08 2.15 2.41
0 – 40 mph (sec.) 3.11 2.97 2.85 3.00
0 – 50 mph (sec.) 4.43 4.23 3.81 3.58
0 – 60 mph (sec.) 5.97 5.76 4.70 4.50
0 – 70 mph (sec.) 8.03 7.63 5.88 5.32
0 – 80 mph (sec.) 10.63 10.11 7.22 6.54
0 – 90 mph (sec.) 15.34 14.11 9.10 7.74
0 – 100 mph (sec.) 24.94 21.36 11.46 9.70
TOP SPEED (mph) 106 108 127 131
QUARTER MILE
Time (sec.) 14.85 14.61 13.21 12.66
Speed (mph) 89.28 91.02 105.95 112.17
(Picture)
75
BRAKE TESTING
BRAKE TEST OBJECTIVE
Determine the deceleration rate attained by each test motorcycle on twenty 60 – 0 mph impending skid (threshold) stops, with ABS in operation if the motorcycle is so equipped. Each bike will be scored on the average deceleration rate it attains.
BRAKE TEST METHODOLOGY
Each motorcycle makes ten measured 60 – 0 mph impending skid (threshold) stops with ABS in operation, if so equipped, at specific predetermined points. After a one-mile lap to cool the brakes, the entire sequence is repeated. The exact initial velocity at the beginning of each of the 60 – 0 mph decelerations, and the exact distance required to make each stop, is recorded by means of a non contact optical sensor in conjunction with electronic speed and distance meters. The data resulting from the twenty total stops is used to calculate the average deceleration rate which is the motorcycle’s score for this test.
DECELERATION RATE FORMULA Initial Velocity*(IV) squared (IV)2
Deceleration Rate (DR) = 2 times Stopping Distance (SD) = 2 (SD)
EXAMPLE: Initial Velocity = 89.175 ft/s (60.8 mph x 1.4667*) Stopping Distance = 171.4 ft. (IV)2 (89.175)2 7952.24
DR = 2(SD) = 2(171.4) = 342.8 = 23.198 ft/s2
Once a motorcycle’s average deceleration rate has been determined, it is possible to calculate the stopping distance from any given speed by utilizing the following formula:
Select a speed; translate that speed into feet per second; square the feet per second figure by multiplying it by itself; divide the resultant figure by 2; divide the remaining figure by the average deceleration rate of the motorcycle in question.
EXAMPLE:
60 mph = 88.002 ft/s x 88.002 = 7744.352 / 2 = 3872.176 / 23.198 ft/s2 = 166.9 ft.
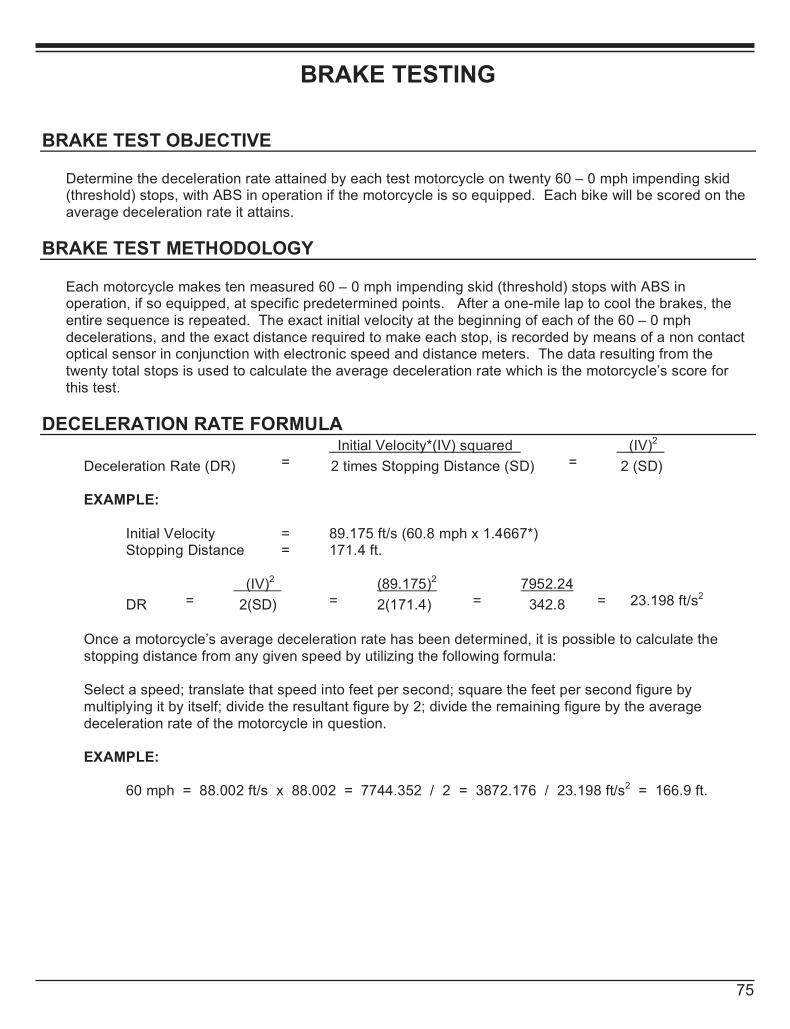
75
75
BRAKE TESTING
BRAKE TEST OBJECTIVE
Determine the deceleration rate attained by each test motorcycle on twenty 60 – 0 mph impending skid (threshold) stops, with ABS in operation if the motorcycle is so equipped. Each bike will be scored on the average deceleration rate it attains.
BRAKE TEST METHODOLOGY
Each motorcycle makes ten measured 60 – 0 mph impending skid (threshold) stops with ABS in operation, if so equipped, at specific predetermined points. After a one-mile lap to cool the brakes, the entire sequence is repeated. The exact initial velocity at the beginning of each of the 60 – 0 mph decelerations, and the exact distance required to make each stop, is recorded by means of a non contact optical sensor in conjunction with electronic speed and distance meters. The data resulting from the twenty total stops is used to calculate the average deceleration rate which is the motorcycle’s score for this test.
DECELERATION RATE FORMULA Initial Velocity*(IV) squared (IV)2
Deceleration Rate (DR) = 2 times Stopping Distance (SD) = 2 (SD)
EXAMPLE: Initial Velocity = 89.175 ft/s (60.8 mph x 1.4667*) Stopping Distance = 171.4 ft. (IV)2 (89.175)2 7952.24
DR = 2(SD) = 2(171.4) = 342.8 = 23.198 ft/s2
Once a motorcycle’s average deceleration rate has been determined, it is possible to calculate the stopping distance from any given speed by utilizing the following formula:
Select a speed; translate that speed into feet per second; square the feet per second figure by multiplying it by itself; divide the resultant figure by 2; divide the remaining figure by the average deceleration rate of the motorcycle in question. EXAMPLE:
60 mph = 88.002 ft/s x 88.002 = 7744.352 / 2 = 3872.176 / 23.198 ft/s2 = 166.9 ft.
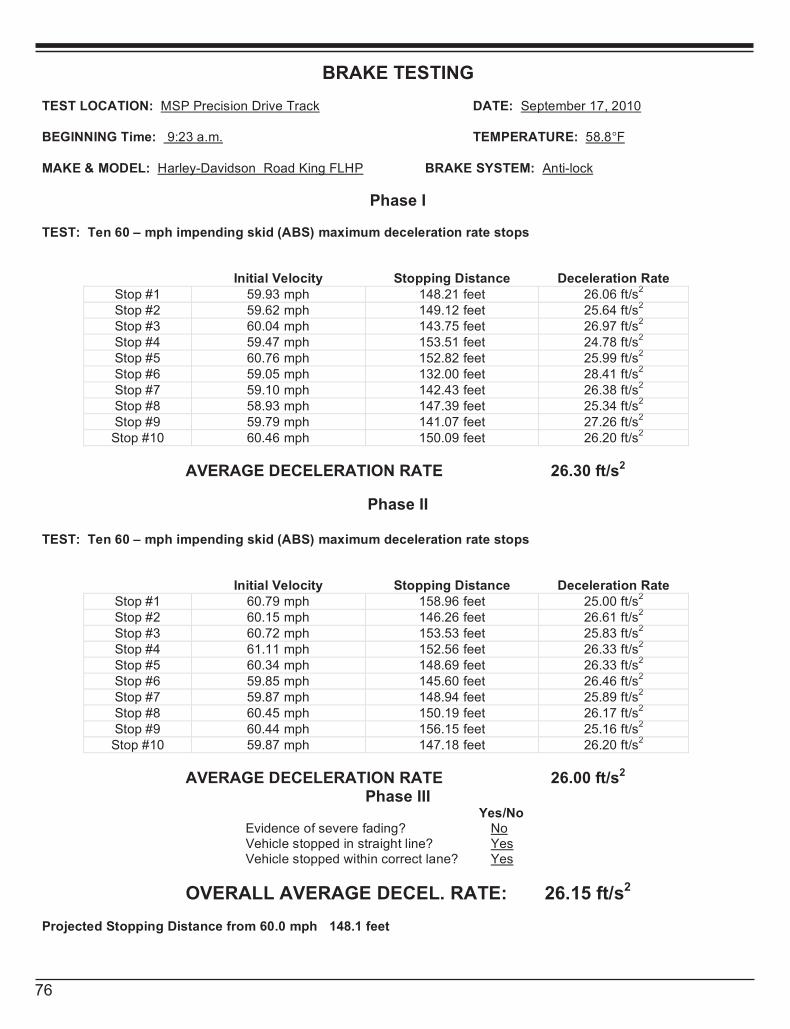
76
76
BRAKE TESTING
TEST LOCATION: MSP Precision Drive Track DATE: September 17, 2010 BEGINNING Time: 9:23 a.m. TEMPERATURE: 58.8°F MAKE & MODEL: Harley-Davidson Road King FLHP BRAKE SYSTEM: Anti-lock
Phase I TEST: Ten 60 – mph impending skid (ABS) maximum deceleration rate stops
Initial Velocity Stopping Distance Deceleration Rate Stop #1 59.93 mph 148.21 feet 26.06 ft/s
2
Stop #2 59.62 mph 149.12 feet 25.64 ft/s2
Stop #3 60.04 mph 143.75 feet 26.97 ft/s2
Stop #4 59.47 mph 153.51 feet 24.78 ft/s2
Stop #5 60.76 mph 152.82 feet 25.99 ft/s2
Stop #6 59.05 mph 132.00 feet 28.41 ft/s2
Stop #7 59.10 mph 142.43 feet 26.38 ft/s2
Stop #8 58.93 mph 147.39 feet 25.34 ft/s2
Stop #9 59.79 mph 141.07 feet 27.26 ft/s2
Stop #10 60.46 mph 150.09 feet 26.20 ft/s2
AVERAGE DECELERATION RATE 26.30 ft/s2
Phase II
TEST: Ten 60 – mph impending skid (ABS) maximum deceleration rate stops
Initial Velocity Stopping Distance Deceleration Rate Stop #1 60.79 mph 158.96 feet 25.00 ft/s
2
Stop #2 60.15 mph 146.26 feet 26.61 ft/s2
Stop #3 60.72 mph 153.53 feet 25.83 ft/s2
Stop #4 61.11 mph 152.56 feet 26.33 ft/s2
Stop #5 60.34 mph 148.69 feet 26.33 ft/s2
Stop #6 59.85 mph 145.60 feet 26.46 ft/s2
Stop #7 59.87 mph 148.94 feet 25.89 ft/s2
Stop #8 60.45 mph 150.19 feet 26.17 ft/s2
Stop #9 60.44 mph 156.15 feet 25.16 ft/s2
Stop #10 59.87 mph 147.18 feet 26.20 ft/s2
AVERAGE DECELERATION RATE 26.00 ft/s2 Phase III
Yes/No Evidence of severe fading? No Vehicle stopped in straight line? Yes Vehicle stopped within correct lane? Yes
OVERALL AVERAGE DECEL. RATE: 26.15 ft/s2 Projected Stopping Distance from 60.0 mph 148.1 feet
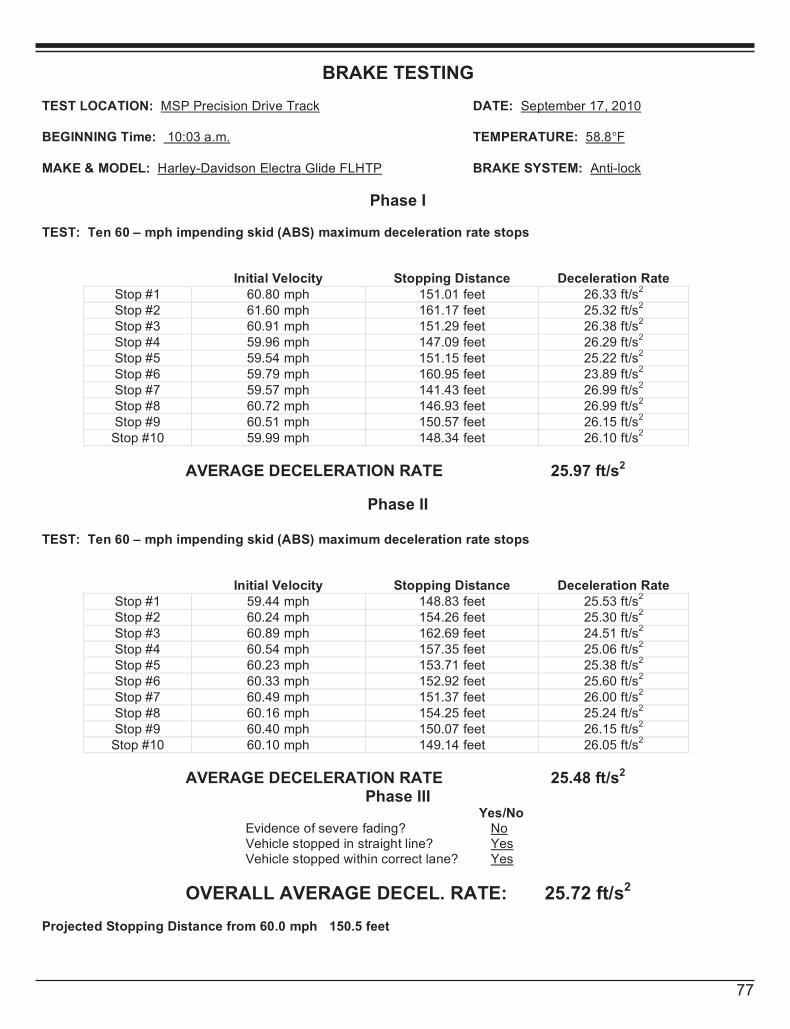
77
77
BRAKE TESTING
TEST LOCATION: MSP Precision Drive Track DATE: September 17, 2010 BEGINNING Time: 10:03 a.m. TEMPERATURE: 58.8°F MAKE & MODEL: Harley-Davidson Electra Glide FLHTP BRAKE SYSTEM: Anti-lock
Phase I TEST: Ten 60 – mph impending skid (ABS) maximum deceleration rate stops
Initial Velocity Stopping Distance Deceleration Rate Stop #1 60.80 mph 151.01 feet 26.33 ft/s
2
Stop #2 61.60 mph 161.17 feet 25.32 ft/s2
Stop #3 60.91 mph 151.29 feet 26.38 ft/s2
Stop #4 59.96 mph 147.09 feet 26.29 ft/s2
Stop #5 59.54 mph 151.15 feet 25.22 ft/s2
Stop #6 59.79 mph 160.95 feet 23.89 ft/s2
Stop #7 59.57 mph 141.43 feet 26.99 ft/s2
Stop #8 60.72 mph 146.93 feet 26.99 ft/s2
Stop #9 60.51 mph 150.57 feet 26.15 ft/s2
Stop #10 59.99 mph 148.34 feet 26.10 ft/s2
AVERAGE DECELERATION RATE 25.97 ft/s2
Phase II
TEST: Ten 60 – mph impending skid (ABS) maximum deceleration rate stops
Initial Velocity Stopping Distance Deceleration Rate Stop #1 59.44 mph 148.83 feet 25.53 ft/s
2
Stop #2 60.24 mph 154.26 feet 25.30 ft/s2
Stop #3 60.89 mph 162.69 feet 24.51 ft/s2
Stop #4 60.54 mph 157.35 feet 25.06 ft/s2
Stop #5 60.23 mph 153.71 feet 25.38 ft/s2
Stop #6 60.33 mph 152.92 feet 25.60 ft/s2
Stop #7 60.49 mph 151.37 feet 26.00 ft/s2
Stop #8 60.16 mph 154.25 feet 25.24 ft/s2
Stop #9 60.40 mph 150.07 feet 26.15 ft/s2
Stop #10 60.10 mph 149.14 feet 26.05 ft/s2
AVERAGE DECELERATION RATE 25.48 ft/s2 Phase III
Yes/No Evidence of severe fading? No Vehicle stopped in straight line? Yes Vehicle stopped within correct lane? Yes
OVERALL AVERAGE DECEL. RATE: 25.72 ft/s2 Projected Stopping Distance from 60.0 mph 150.5 feet
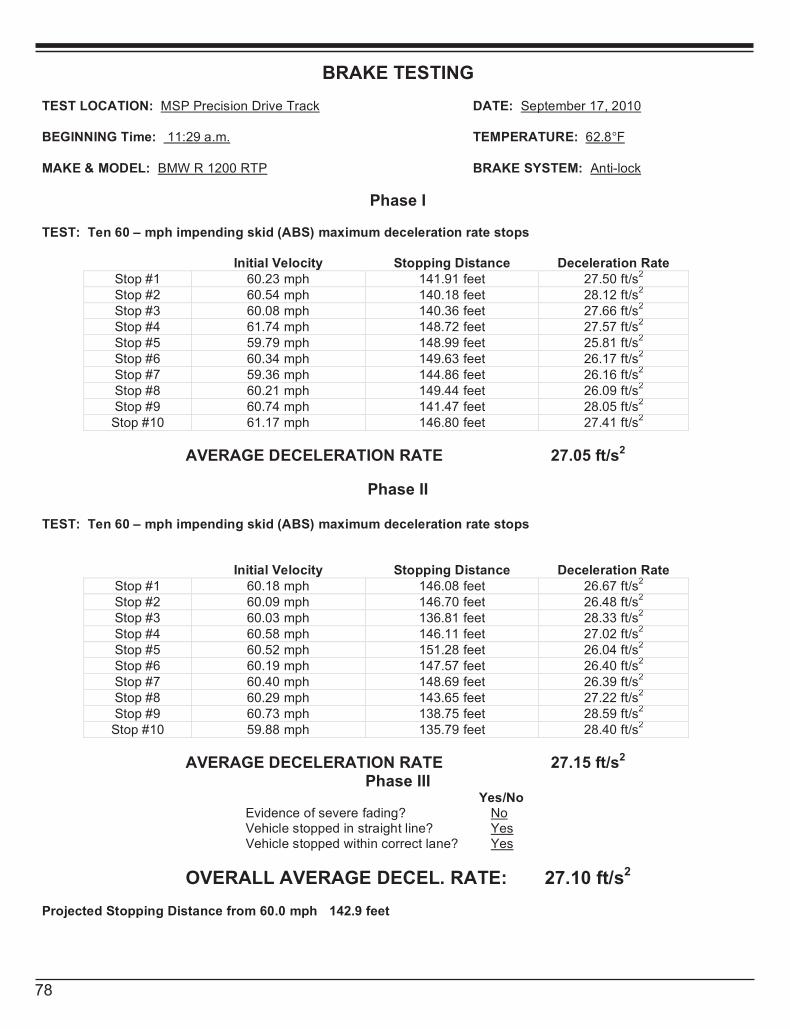
78
78
BRAKE TESTING
TEST LOCATION: MSP Precision Drive Track DATE: September 17, 2010 BEGINNING Time: 11:29 a.m. TEMPERATURE: 62.8°F MAKE & MODEL: BMW R 1200 RTP BRAKE SYSTEM: Anti-lock
Phase I TEST: Ten 60 – mph impending skid (ABS) maximum deceleration rate stops
Initial Velocity Stopping Distance Deceleration Rate Stop #1 60.23 mph 141.91 feet 27.50 ft/s
2
Stop #2 60.54 mph 140.18 feet 28.12 ft/s2
Stop #3 60.08 mph 140.36 feet 27.66 ft/s2
Stop #4 61.74 mph 148.72 feet 27.57 ft/s2
Stop #5 59.79 mph 148.99 feet 25.81 ft/s2
Stop #6 60.34 mph 149.63 feet 26.17 ft/s2
Stop #7 59.36 mph 144.86 feet 26.16 ft/s2
Stop #8 60.21 mph 149.44 feet 26.09 ft/s2
Stop #9 60.74 mph 141.47 feet 28.05 ft/s2
Stop #10 61.17 mph 146.80 feet 27.41 ft/s2
AVERAGE DECELERATION RATE 27.05 ft/s2
Phase II
TEST: Ten 60 – mph impending skid (ABS) maximum deceleration rate stops
Initial Velocity Stopping Distance Deceleration Rate Stop #1 60.18 mph 146.08 feet 26.67 ft/s
2
Stop #2 60.09 mph 146.70 feet 26.48 ft/s2
Stop #3 60.03 mph 136.81 feet 28.33 ft/s2
Stop #4 60.58 mph 146.11 feet 27.02 ft/s2
Stop #5 60.52 mph 151.28 feet 26.04 ft/s2
Stop #6 60.19 mph 147.57 feet 26.40 ft/s2
Stop #7 60.40 mph 148.69 feet 26.39 ft/s2
Stop #8 60.29 mph 143.65 feet 27.22 ft/s2
Stop #9 60.73 mph 138.75 feet 28.59 ft/s2
Stop #10 59.88 mph 135.79 feet 28.40 ft/s2
AVERAGE DECELERATION RATE 27.15 ft/s2 Phase III
Yes/No Evidence of severe fading? No Vehicle stopped in straight line? Yes Vehicle stopped within correct lane? Yes
OVERALL AVERAGE DECEL. RATE: 27.10 ft/s2 Projected Stopping Distance from 60.0 mph 142.9 feet
79
BRAKE TESTING
TEST LOCATION: MSP Precision Drive Track DATE: September 17, 2010 BEGINNING Time: 10:40 a.m. TEMPERATURE: 60.7°F MAKE & MODEL: Kawasaki Concours BRAKE SYSTEM: Anti-lock
Phase I TEST: Ten 60 – mph impending skid (ABS) maximum deceleration rate stops
Initial Velocity Stopping Distance Deceleration Rate Stop #1 59.79 mph 137.28 feet 28.01 ft/s
2
Stop #2 60.21 mph 143.21 feet 27.23 ft/s2
Stop #3 60.69 mph 139.73 feet 28.35 ft/s2
Stop #4 59.99 mph 143.03 feet 27.06 ft/s2
Stop #5 59.17 mph 133.50 feet 28.20 ft/s2
Stop #6 60.68 mph 146.70 feet 26.99 ft/s2
Stop #7 59.65 mph 139.19 feet 27.50 ft/s2
Stop #8 60.60 mph 144.49 feet 27.34 ft/s2
Stop #9 60.49 mph 141.19 feet 27.88 ft/s2
Stop #10 60.62 mph 143.80 feet 27.49 ft/s2
AVERAGE DECELERATION RATE 27.60 ft/s2
Phase II
TEST: Ten 60 – mph impending skid (ABS) maximum deceleration rate stops
Initial Velocity Stopping Distance Deceleration Rate Stop #1 60.89 mph 146.73 feet 27.18 ft/s
2
Stop #2 60.55 mph 143.25 feet 27.52 ft/s2
Stop #3 60.12 mph 146.87 feet 26.47 ft/s2
Stop #4 60.15 mph 138.67 feet 28.06 ft/s2
Stop #5 59.92 mph 145.83 feet 26.48 ft/s2
Stop #6 59.70 mph 135.86 feet 28.21 ft/s2
Stop #7 60.34 mph 147.23 feet 26.60 ft/s2
Stop #8 59.97 mph 141.14 feet 27.41 ft/s2
Stop #9 60.52 mph 142.64 feet 27.62 ft/s2
Stop #10 60.44 mph 142.23 feet 27.62 ft/s2
AVERAGE DECELERATION RATE 27.32 ft/s2 Phase III
Yes/No Evidence of severe fading? No Vehicle stopped in straight line? Yes Vehicle stopped within correct lane? Yes
OVERALL AVERAGE DECEL. RATE: 27.46 ft/s2 Projected Stopping Distance from 60.0 mph 141.0 feet
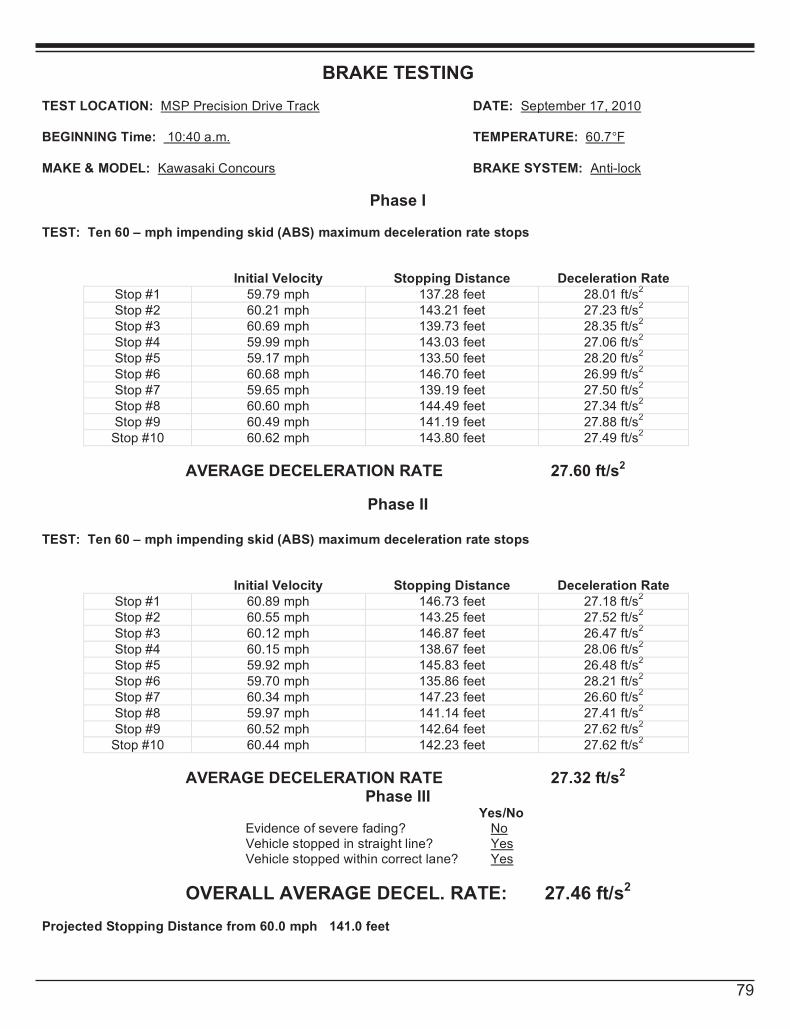
79
79
BRAKE TESTING
TEST LOCATION: MSP Precision Drive Track DATE: September 17, 2010 BEGINNING Time: 10:40 a.m. TEMPERATURE: 60.7°F MAKE & MODEL: Kawasaki Concours BRAKE SYSTEM: Anti-lock
Phase I TEST: Ten 60 – mph impending skid (ABS) maximum deceleration rate stops
Initial Velocity Stopping Distance Deceleration Rate Stop #1 59.79 mph 137.28 feet 28.01 ft/s
2
Stop #2 60.21 mph 143.21 feet 27.23 ft/s2
Stop #3 60.69 mph 139.73 feet 28.35 ft/s2
Stop #4 59.99 mph 143.03 feet 27.06 ft/s2
Stop #5 59.17 mph 133.50 feet 28.20 ft/s2
Stop #6 60.68 mph 146.70 feet 26.99 ft/s2
Stop #7 59.65 mph 139.19 feet 27.50 ft/s2
Stop #8 60.60 mph 144.49 feet 27.34 ft/s2
Stop #9 60.49 mph 141.19 feet 27.88 ft/s2
Stop #10 60.62 mph 143.80 feet 27.49 ft/s2
AVERAGE DECELERATION RATE 27.60 ft/s2
Phase II
TEST: Ten 60 – mph impending skid (ABS) maximum deceleration rate stops
Initial Velocity Stopping Distance Deceleration Rate Stop #1 60.89 mph 146.73 feet 27.18 ft/s
2
Stop #2 60.55 mph 143.25 feet 27.52 ft/s2
Stop #3 60.12 mph 146.87 feet 26.47 ft/s2
Stop #4 60.15 mph 138.67 feet 28.06 ft/s2
Stop #5 59.92 mph 145.83 feet 26.48 ft/s2
Stop #6 59.70 mph 135.86 feet 28.21 ft/s2
Stop #7 60.34 mph 147.23 feet 26.60 ft/s2
Stop #8 59.97 mph 141.14 feet 27.41 ft/s2
Stop #9 60.52 mph 142.64 feet 27.62 ft/s2
Stop #10 60.44 mph 142.23 feet 27.62 ft/s2
AVERAGE DECELERATION RATE 27.32 ft/s2 Phase III
Yes/No Evidence of severe fading? No Vehicle stopped in straight line? Yes Vehicle stopped within correct lane? Yes
OVERALL AVERAGE DECEL. RATE: 27.46 ft/s2 Projected Stopping Distance from 60.0 mph 141.0 feet
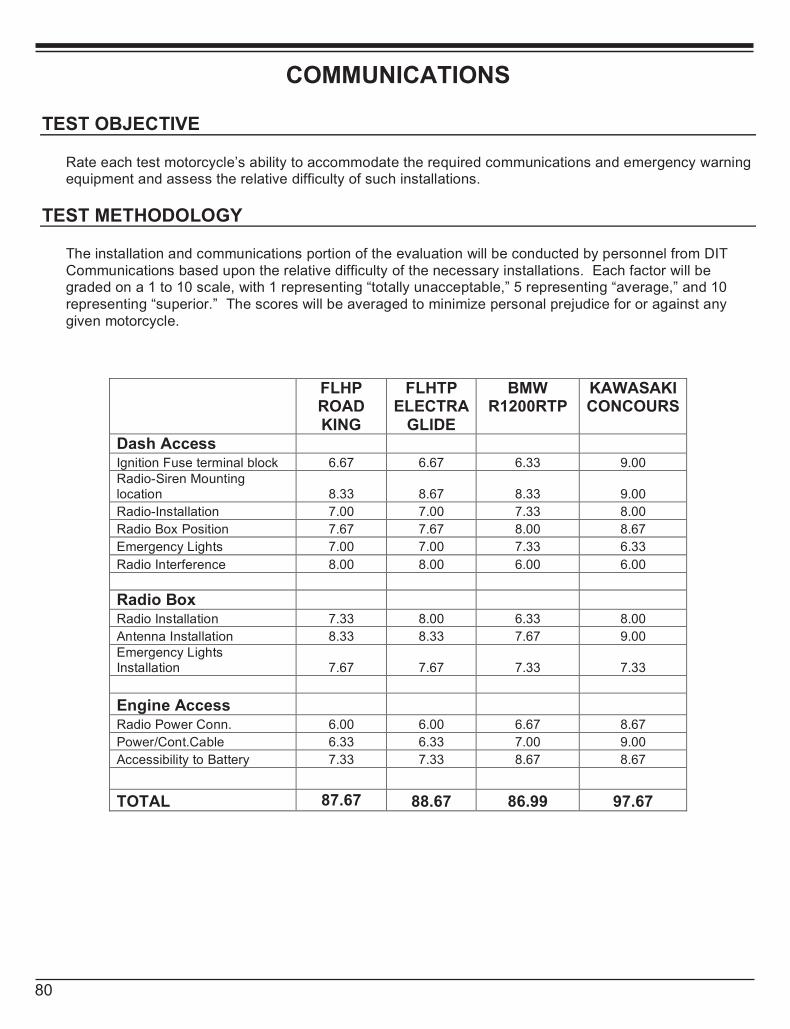
80
80
COMMUNICATIONS
TEST OBJECTIVE
Rate each test motorcycle’s ability to accommodate the required communications and emergency warning equipment and assess the relative difficulty of such installations.
TEST METHODOLOGY
The installation and communications portion of the evaluation will be conducted by personnel from DIT Communications based upon the relative difficulty of the necessary installations. Each factor will be graded on a 1 to 10 scale, with 1 representing “totally unacceptable,” 5 representing “average,” and 10 representing “superior.” The scores will be averaged to minimize personal prejudice for or against any given motorcycle.
FLHP ROAD KING
FLHTP ELECTRA
GLIDE
BMW R1200RTP
KAWASAKI CONCOURS
Dash Access
Ignition Fuse terminal block 6.67 6.67 6.33 9.00 Radio-Siren Mounting location 8.33 8.67 8.33 9.00
Radio-Installation 7.00 7.00 7.33 8.00
Radio Box Position 7.67 7.67 8.00 8.67
Emergency Lights 7.00 7.00 7.33 6.33
Radio Interference 8.00 8.00 6.00 6.00
Radio Box
Radio Installation 7.33 8.00 6.33 8.00
Antenna Installation 8.33 8.33 7.67 9.00 Emergency Lights Installation 7.67 7.67 7.33 7.33
Engine Access Radio Power Conn. 6.00 6.00 6.67 8.67
Power/Cont.Cable 6.33 6.33 7.00 9.00
Accessibility to Battery 7.33 7.33 8.67 8.67
TOTAL 87.67 88.67 86.99 97.67
81
81
For Your Information
About the National Institute of Justice A component of the Office of Justice Programs, NIJ is the research, development and evaluation agency of the U.S. Department of Justice. NIJ’s mission is to advance scientific research, development and evaluation to enhance the administration of justice and public safety. NIJ’s principal authorities are derived from the Omnibus Crime Control and Safe Streets Act of 1968, as amended (see 42 USC §§ 3721–3723). The NIJ Director is appointed by the President and confirmed by the Senate. The Director establishes the Institute’s objectives, guided by the priorities of the Office of Justice Programs, the U.S. Department of Justice, and the needs of the field. The Institute actively solicits the views of criminal justice and other professionals and researchers to inform its search for the knowledge and tools to guide policy and practice. Strategic Goals NIJ has seven strategic goals grouped into three categories: Creating relevant knowledge and tools 1. Partner with state and local practitioners and policymakers to identify social science research and technology needs. 2. Create scientific, relevant and reliable knowledge — with a particular emphasis on terrorism, violent crime, drugs and
crime, cost-effectiveness and community-based efforts — to enhance the administration of justice and public safety. 3. Develop affordable and effective tools and technologies to enhance the administration of justice and public safety. Dissemination 4. Disseminate relevant knowledge and information to practitioners and policymakers in an understandable, timely and
concise manner. 5. Act as an honest broker to identify the information, tools and technologies that respond to the needs of stakeholders. Agency management 6. Practice fairness and openness in the research and development process. 7. Ensure professionalism, excellence, accountability, cost-effectiveness and integrity in the management and conduct
of NIJ activities and programs. Program Areas In addressing these strategic challenges, the Institute is involved in the following program areas: crime control and prevention, including policing; drugs and crime; justice systems and offender behavior, including corrections; violence and victimization; communications and information technologies; critical incident response; investigative and forensic sciences, including DNA; less lethal technologies; officer protection; education and training technologies; testing and standards; technology assistance to law enforcement and corrections agencies; field testing of promising programs; and international crime control. In addition to sponsoring research and development and technology assistance, NIJ evaluates programs, policies and technologies. NIJ communicates its research and evaluation findings through conferences and print and electronic media.
82
82
About the Law Enforcement and Corrections Standards and Testing Program The Law Enforcement and Corrections Standards and Testing Program is sponsored by the Office of Science and Technology of the National Institute of Justice (NIJ), Office of Justice Programs, U.S. Department of Justice. The program responds to the mandate of the Justice System Improvement Act of 1979, which directed NIJ to encourage research and development to improve the criminal justice system and to disseminate the results to federal, state and local agencies. The Law Enforcement and Corrections Standards and Testing Program is an applied research effort that determines the technological needs of justice system agencies, sets minimum performance standards for specific devices, tests commercially available equipment against those standards, and disseminates the standards and the test results to criminal justice agencies nationwide and internationally. The program operates through the following: • The Law Enforcement and Corrections Technology Advisory Council (LECTAC), consisting of nationally
recognized criminal justice practitioners from federal, state and local agencies, assesses technological needs and sets priorities for research programs and items to be evaluated and tested.
• The Office of Law Enforcement Standards (OLES) at the National Institute of Standards and Technology
develops voluntary national performance standards for compliance testing to ensure that individual items of equipment are suitable for use by criminal justice agencies. The equipment standards developed by OLES are based on laboratory evaluation of commercially available products in order to devise precise test methods that can be universally applied by any qualified testing laboratory and to establish minimum performance requirements for each attribute of a piece of equipment that is essential to how it functions. OLES-developed standards can serve as design criteria for manufacturers or as the basis for equipment evaluation. The application of the standards, which are highly technical in nature, is augmented through the publication of equipment performance reports and user guides. Individual jurisdictions may use the standards in their own laboratories to test equipment, have equipment tested on their behalf using the standards, or cite the standards in procurement specifications.
• The National Law Enforcement and Corrections Technology Center (NLECTC)-National, operated by a
grantee, supervises a national compliance testing program conducted by independent laboratories. The standards developed by OLES serve as performance benchmarks against which commercial equipment is measured. In addition, NIJ has begun a new process for developing some standards using Special Technical Committees (STCs), which include practitioners, scientists and subject matter experts. OLES participates in the STC process. The facilities, personnel and testing capabilities of the independent laboratories are evaluated by OLES prior to testing each item of equipment. In addition, OLES helps NLECTC staff review and analyze data. Test results are published in consumer product reports designed to help justice system procurement officials make informed purchasing decisions.
Publications are available at no charge through NLECTC. Some documents are also available online through the Justice Technology Information Network (JUSTNET), the center’s World Wide Web site. To request a document or additional information, call (800) 248-2742 or (301) 519-5069 or write: National Law Enforcement and Corrections Technology Center-National 2277 Research Boulevard Mail Stop 8J Rockville, MD 20850 E-mail: [email protected] World Wide Web address: http://www.justnet.org
83
83
About the National Law Enforcement and Corrections Technology Center System The National Law Enforcement and Corrections Technology Center (NLECTC) system recently completed a reorganization that will better enable the system to carry out its critical mission to assist state, major city and county, rural, tribal and border, as well as federal law enforcement, corrections and other criminal justice agencies in addressing their technology needs and challenges. Originally created in 1994 as a program of the National Institute of Justice’s (NIJ’s) Office of Science and Technology, the NLECTC system has realigned its outreach efforts into three new centers: the States, Major Cities and Counties Regional Center; the Small, Rural, Tribal and Border Regional Center; and the Alaska Regional Center. The States, Major Cities and Counties Regional Center offers a resource and outreach mechanism for state, major city and county criminal justice system partners, with a mission of ensuring that larger criminal justice agencies (those having 50 or more sworn personnel) have unbiased access to a full range of relevant scientific and technology-related information. The Small, Rural, Tribal and Border Regional Center publicizes its programs and services to small, rural, tribal and border agencies across the country. The Alaska Regional Center serves as a conduit for agencies in Alaska. The efforts of these centers complement those of NLECTC-National, which coordinates NIJ’s Compliance Testing program and standards development efforts for a variety of equipment used in the public safety arena, and the Centers of Excellence (CoEs), which support NIJ’s research, development, testing and evaluation (RDT&E) efforts in specific portfolio areas. The CoEs focus on the following topic areas: Communications Technologies; Electronic Crime Technology; Forensics Technology; Information and Sensor Systems; and Weapons and Protective Systems. The National Institute of Standards and Technology’s Office of Law Enforcement Standards provides scientific and research support to these efforts. As a whole, the NLECTC system provides: • Scientific and technical support to NIJ’s RDT&E projects. • Support for the transfer and adoption of technology into practice by law enforcement and corrections agencies,
courts and crime laboratories. • Assistance in developing and disseminating equipment performance standards and technology guides. • Assistance in the demonstration, testing and evaluation of criminal justice tools and technologies. • Technology information and general and specialized technology assistance. • Assistance in setting NIJ’s research agenda by convening practitioner-based advisory groups to help identify
criminal justice technology needs and gaps. The NLECTC system supports NIJ’s RDT&E process and goal of setting research priorities based on practitioner needs by sponsoring a series of Technology Working Groups and Constituent Advisory Groups, who provide input to the Law Enforcement and Corrections Technology Advisory Council. Together, these groups form a bridge between the criminal justice community and the NIJ Office of Science and Technology. For more information, call (800) 248-2742, e-mail [email protected] or visit http://www.justnet.org.
84
84
About the Office of Law Enforcement Standards The Office of Law Enforcement Standards (OLES) was established as a matrix management organization in 1971 through a Memorandum of Understanding between the U.S. Departments of Justice and Commerce based on the recommendations of the President’s Commission on Crime. OLES’ mission is to apply science and technology to the needs of the criminal justice community, including law enforcement, corrections, forensic science and the fire service. While its major objective is to develop minimum performance standards, which are promulgated as voluntary national standards, OLES also undertakes studies leading to the publication of technical reports and user guides. The areas of research investigated by OLES include clothing, communication systems, emergency equipment, investigative aids, protective equipment, security systems, vehicles, weapons, and analytical techniques and standard reference materials used by the forensic science community. The composition of OLES’ projects varies depending on priorities of the criminal justice community at any given time and, as necessary, draws on the resources of the National Institute of Standards and Technology. OLES assists law enforcement and criminal justice agencies in acquiring, on a cost-effective basis, the high-quality resources they need to do their jobs. To accomplish this, OLES: • Develops methods for testing equipment performance and examining evidentiary materials. • Develops standards for equipment and operating procedures. • Develops standard reference materials. • Performs other scientific and engineering research as required. Since the program began in 1971, OLES has coordinated the development of standards, user guides and advisory reports on topics that range from performance parameters of police patrol vehicles, to performance reports on various speed-measuring devices, to soft body armor testing, to analytical procedures for developing DNA profiles. The application of technology to enhance the efficiency and effectiveness of the criminal justice community continues to increase. The proper adoption of the products resulting from emerging technologies and the assessment of equipment performance, systems, methodologies, etc., used by criminal justice practitioners constitute critical issues having safety and legal ramifications. The consequences of inadequate equipment performance or inadequate test methods can range from inconvenient to catastrophic. In addition, these deficiencies can adversely affect the general population when they increase public safety costs, preclude arrest or result in evidence found to be inadmissible in court.

85
84
About the Office of Law Enforcement Standards The Office of Law Enforcement Standards (OLES) was established as a matrix management organization in 1971 through a Memorandum of Understanding between the U.S. Departments of Justice and Commerce based on the recommendations of the President’s Commission on Crime. OLES’ mission is to apply science and technology to the needs of the criminal justice community, including law enforcement, corrections, forensic science and the fire service. While its major objective is to develop minimum performance standards, which are promulgated as voluntary national standards, OLES also undertakes studies leading to the publication of technical reports and user guides. The areas of research investigated by OLES include clothing, communication systems, emergency equipment, investigative aids, protective equipment, security systems, vehicles, weapons, and analytical techniques and standard reference materials used by the forensic science community. The composition of OLES’ projects varies depending on priorities of the criminal justice community at any given time and, as necessary, draws on the resources of the National Institute of Standards and Technology. OLES assists law enforcement and criminal justice agencies in acquiring, on a cost-effective basis, the high-quality resources they need to do their jobs. To accomplish this, OLES: • Develops methods for testing equipment performance and examining evidentiary materials. • Develops standards for equipment and operating procedures. • Develops standard reference materials. • Performs other scientific and engineering research as required. Since the program began in 1971, OLES has coordinated the development of standards, user guides and advisory reports on topics that range from performance parameters of police patrol vehicles, to performance reports on various speed-measuring devices, to soft body armor testing, to analytical procedures for developing DNA profiles. The application of technology to enhance the efficiency and effectiveness of the criminal justice community continues to increase. The proper adoption of the products resulting from emerging technologies and the assessment of equipment performance, systems, methodologies, etc., used by criminal justice practitioners constitute critical issues having safety and legal ramifications. The consequences of inadequate equipment performance or inadequate test methods can range from inconvenient to catastrophic. In addition, these deficiencies can adversely affect the general population when they increase public safety costs, preclude arrest or result in evidence found to be inadmissible in court.

86