Embed Size (px)
Citation preview
1
Michigan State Police 2019 Tire Testing
2
STATE OF MICHIGAN
Department of State Police and
Department of Technology, Management and Budget
2019 Tire Testing
Published by: Michigan State Police Precision Driving Unit
September 2020
3
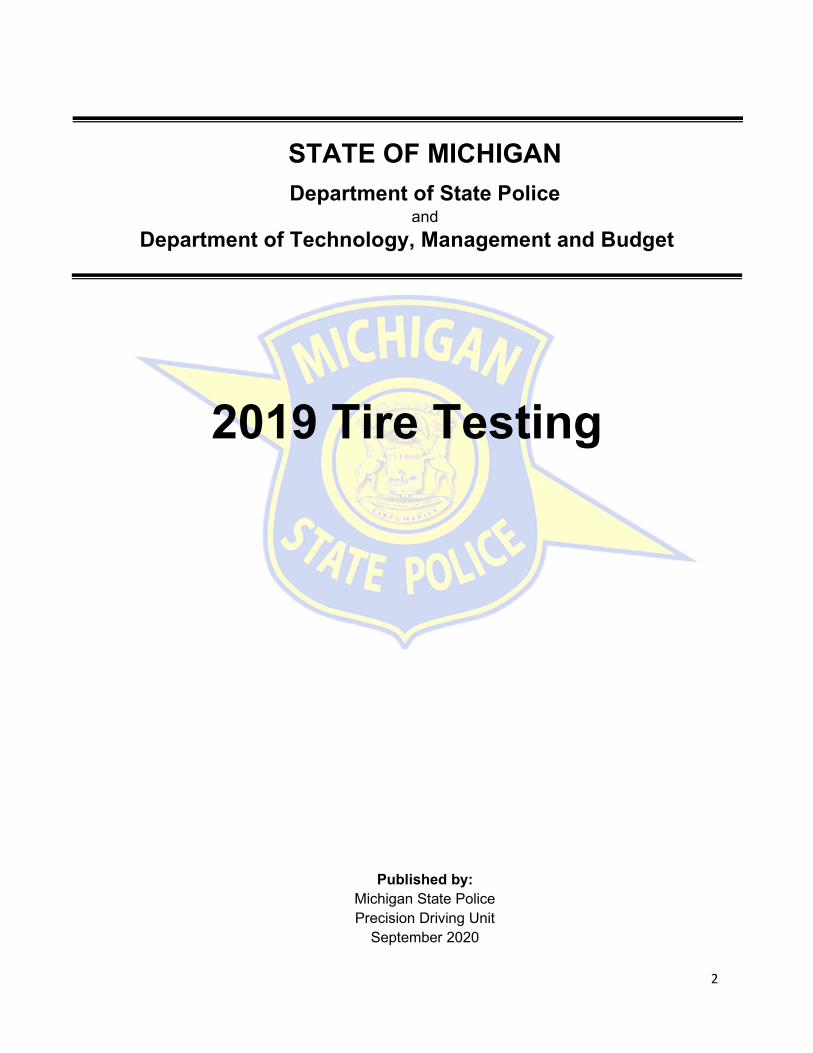
TABLE OF CONTENTS
Test Overview ……………………………………………………………………………………………………….4
Tire Photos ………………………………………………………………………………………………………..5-7
Dodge Charger ……………………...…………………………………………………………………...….……..8
Goodyear RS-A ……………………………………………………………………………………………….…9-11
Goodyear Eagle Enforcer All Weather ……………………………………………………………………...12-14
Nokian WRG3 ………………………………………………………………………………………………….15-17
Nokian WRG4 …………………………………………………………………..……………..…………...….18-20
TOYO Celsius AW …………………………………………………………………………………………….21-23
TOYO Observe Winter GSi-6 HP ……………………………………………………………………………24-26
Dodge Charger Acceleration Comparison ……………………………………………………………….……..27
Dodge Charger Deceleration Comparison …………………………...………………………………….……..28
Chevrolet Tahoe …………………………………………………………………………………………….……29
Goodyear RS-A ………………………………………………………………………………...……..……….30-32
Goodyear Eagle Enforcer All Weather ………………………………………………...……….…….……..33-35
Nokian WRG3 ………………………………………………………………………………………………….36-38
Nokian WRG4 ……………………………………………………………………………………………….…39-41
Chevrolet Tahoe Acceleration Comparison ………………………………………………………………….…42
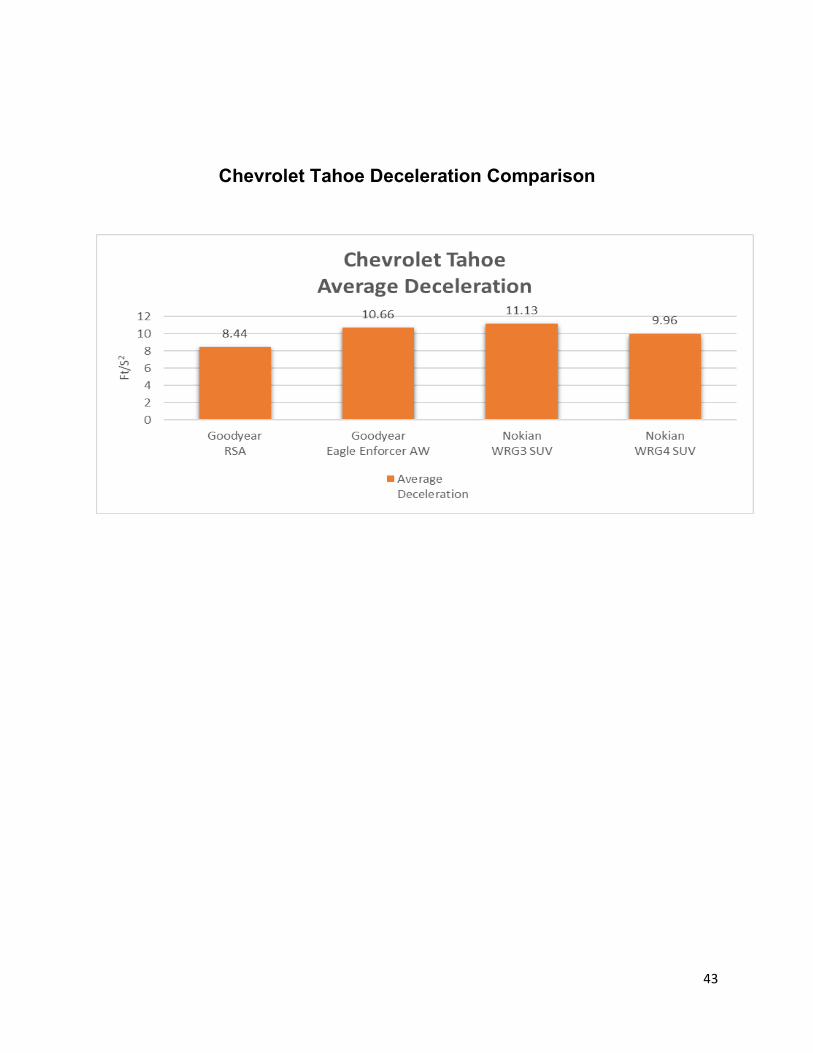
Chevrolet Tahoe Deceleration Comparison ………………………………………………………………....…43
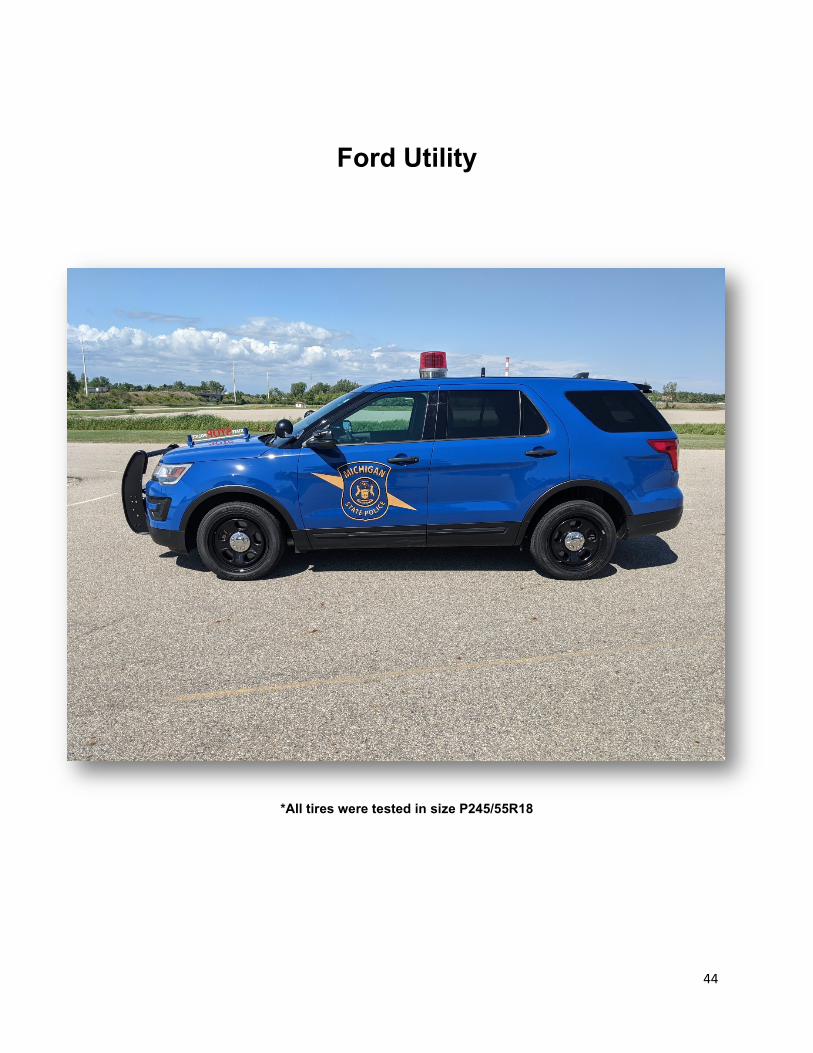
Ford Utility ..……………………………………………………………………………………………………….44
Goodyear RS-A ………………………………………………………………………………………………..45-46
Goodyear Eagle Enforcer All Weather ……………………………………………………………………...47-48
Nokian WRG3 ………………………………………………………………………………………………….49-50
Nokian WRG4 ………………………………………………………………………………………………….51-52
TOYO Celsius AW …………………………………………………………………………………………….53-54
TOYO Observe Winter GSi-6 HP …………………………………………………………..…………..……55-56
Ford Utility Acceleration Comparison …………………………………………………………………………...57
Ford Utility Deceleration Comparison …………………………………………………………………………..58
4
Test Overview General Information
The Michigan State Police maintain a patrol fleet of approximately 1350 vehicles. In May of 2013, the decision was made to move from dedicated summer and winter tires, to running an all-weather tire on the vehicles year-round. This decision was based on the financial benefits of replacing tires only when worn out, and the discovery of an all-weather tire that performed well in both summer and winter conditions. Since the move to an all-weather tire was made, the Michigan State Police Precision Driving Unit has performed an annual winter tire testing program to confirm that our choice of tires provides the best combination of traction and handling for our road patrol officers. This year’s testing included all season tires, all weather tires, and dedicated winter tires. The testing was performed on tires available for all three of our patrol vehicle platforms (Chevrolet Tahoe, Dodge Charger, and Ford Utility). It should be noted that we utilize the optional P245/55R18 tire size on the Dodge Charger as that allows us to stock only one tire size for both it and the Ford Utility.
Winter Testing
The testing was performed at the Keweenaw Research Center in Hancock, Michigan on January 29 - 31, 2019. This year’s testing was focused on acceleration, deceleration, and lateral acceleration. The Vehicle Dynamics Area One was used for the acceleration and deceleration testing. Lateral acceleration testing was performed on the 300-foot circle. Both areas provide hard packed snow surfaces which are groomed every four hours by the Keweenaw Research Center employees. Coefficient of friction measurement equipment was not available during this testing; therefore, each test day was benchmarked using the Goodyear Eagle RSA tire that comes standard on each vehicle. Temperatures during testing were as follows:
Day 8 a.m. Midday High/Low 5 p.m. January 29, 2019 5° F 8° F 3° F January 30, 2019 -6° F -8° F 0° F January 31, 2019 -9° F -3° F -4° F
Light snow was the predominate weather condition on January 29, 2019. January 30, 2019 saw heavy and blowing snow. January 31, 2019, was mostly cloudy with periods of sunshine. Acceleration values were captured using Race Logic VBox 3i GPS based equipment.
Summer Wear Testing
Tire wear durability testing was completed on August 13 and 14, 2019, at the Michigan State Police Precision Driving Unit. Each tire completed ten laps counterclockwise, then ten laps clockwise at limit handling speeds. Track temperature and tread depth were measured after each 20-lap session. Durability testing for the P245/55R18 sized tires was performed only on the Dodge Charger AWD platform as we had only one set of tires from each manufacturer. Temperatures during testing were as follows:
Day 8 a.m. Midday High/Low 5 p.m. August 13, 2019 69° F 78° F 84° F August 14, 2019 64° F 75° F 79° F
5
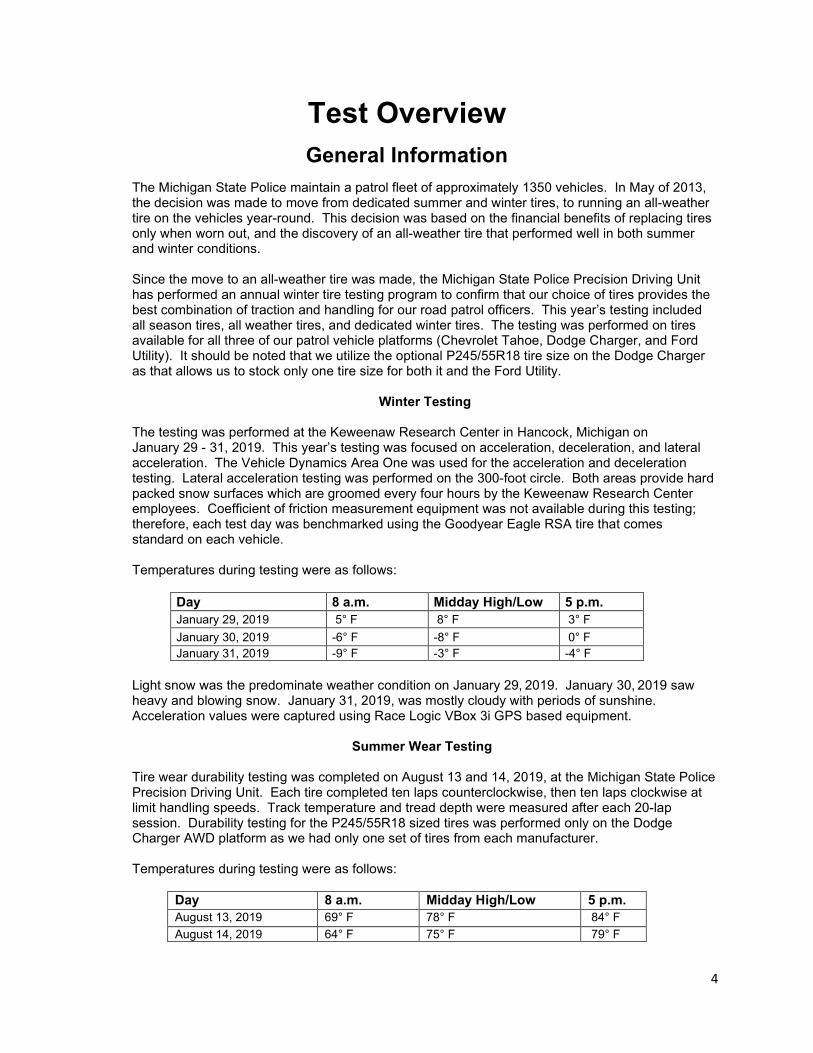
Tires Tested
Goodyear Eagle RS-A Platforms Tested: Dodge Charger, Chevrolet Tahoe, and Ford Utility
Goodyear Eagle Enforcer All Weather Platforms Tested: Dodge Charger, Chevrolet Tahoe, and Ford Utility
6
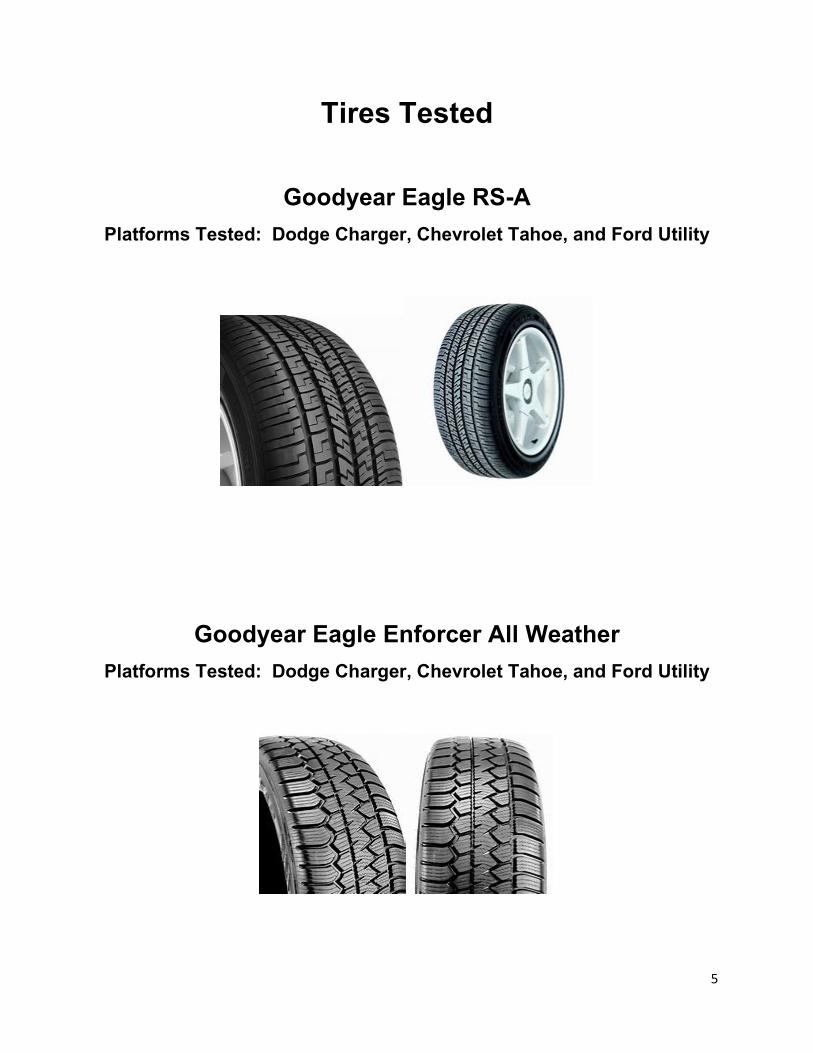
Nokian WRG3
Platforms Tested: Dodge Charger, Chevrolet Tahoe, and Ford Utility
Nokian WRG4 Platforms Tested: Dodge Charger, Chevrolet Tahoe, and Ford Utility
7
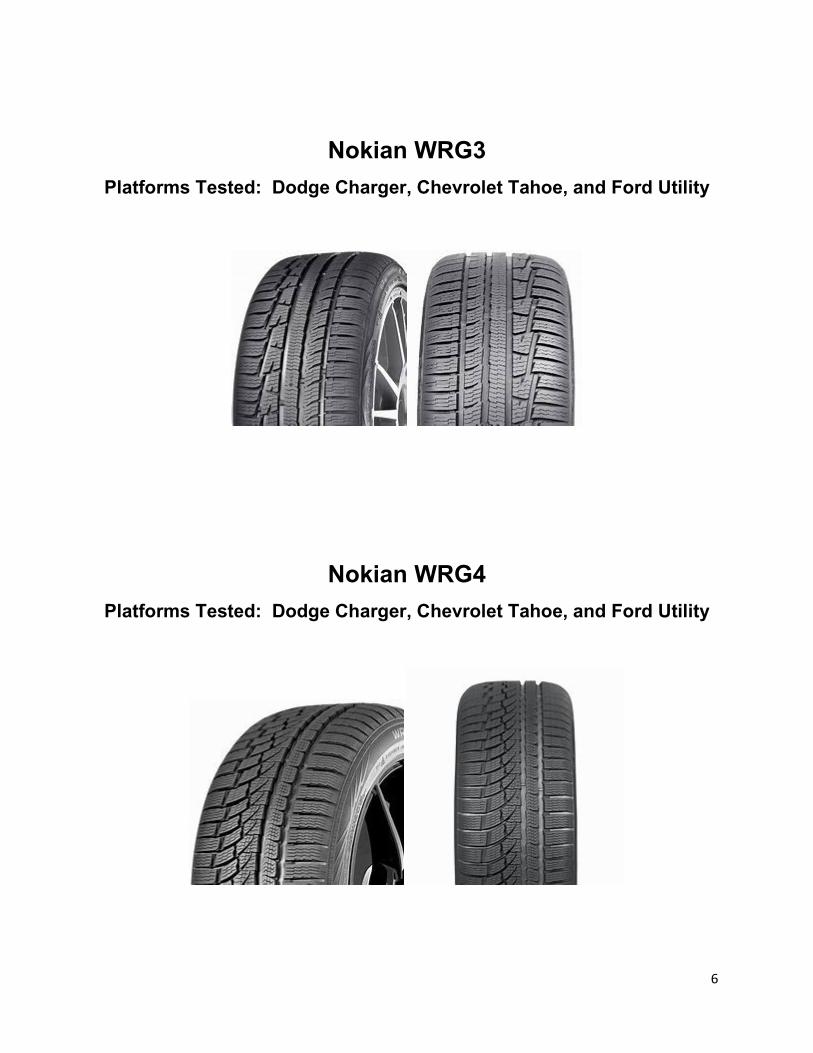
TOYO Celsius AW
Platforms Tested: Dodge Charger and Ford Utility
TOYO Observe Winter GSi-6 HP Platforms Tested: Dodge Charger and Ford Utility
8
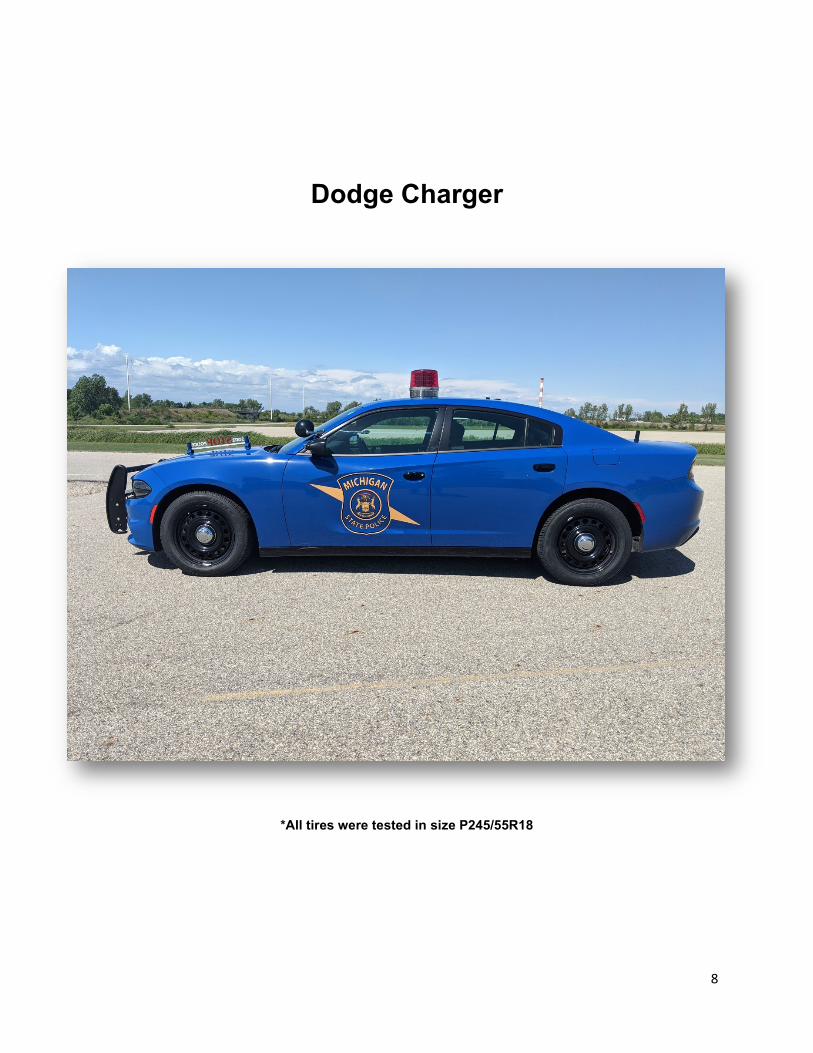
Dodge Charger
*All tires were tested in size P245/55R18
9
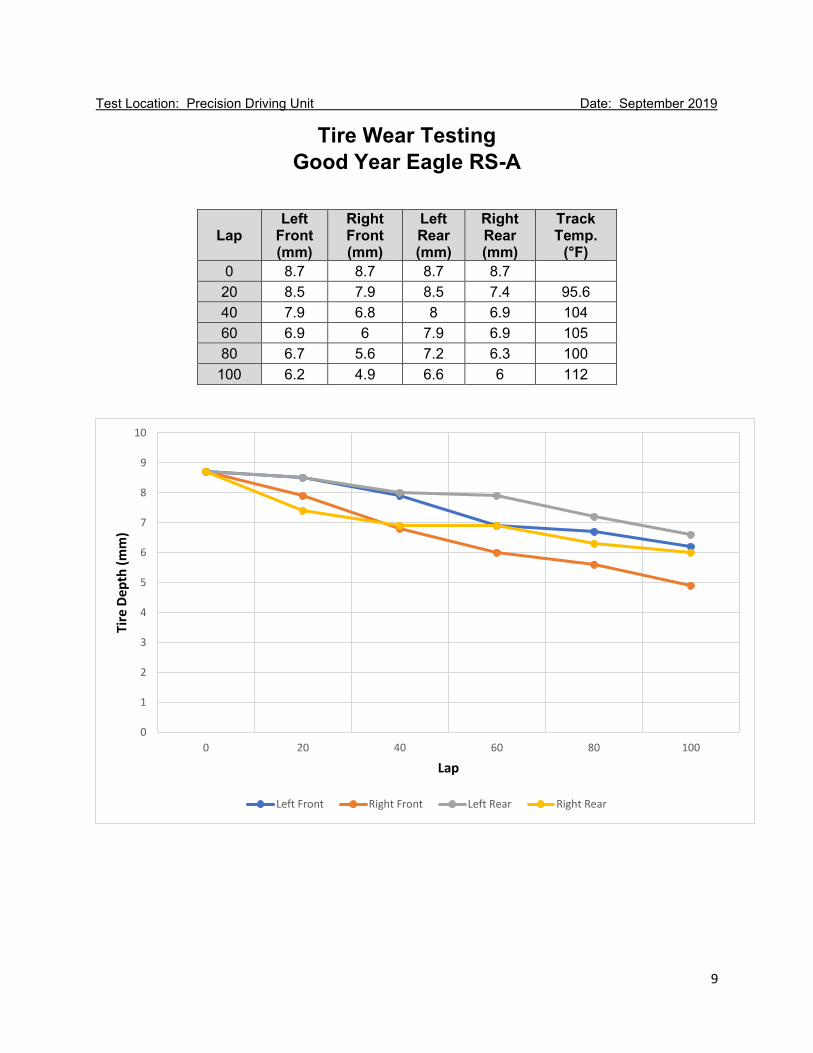
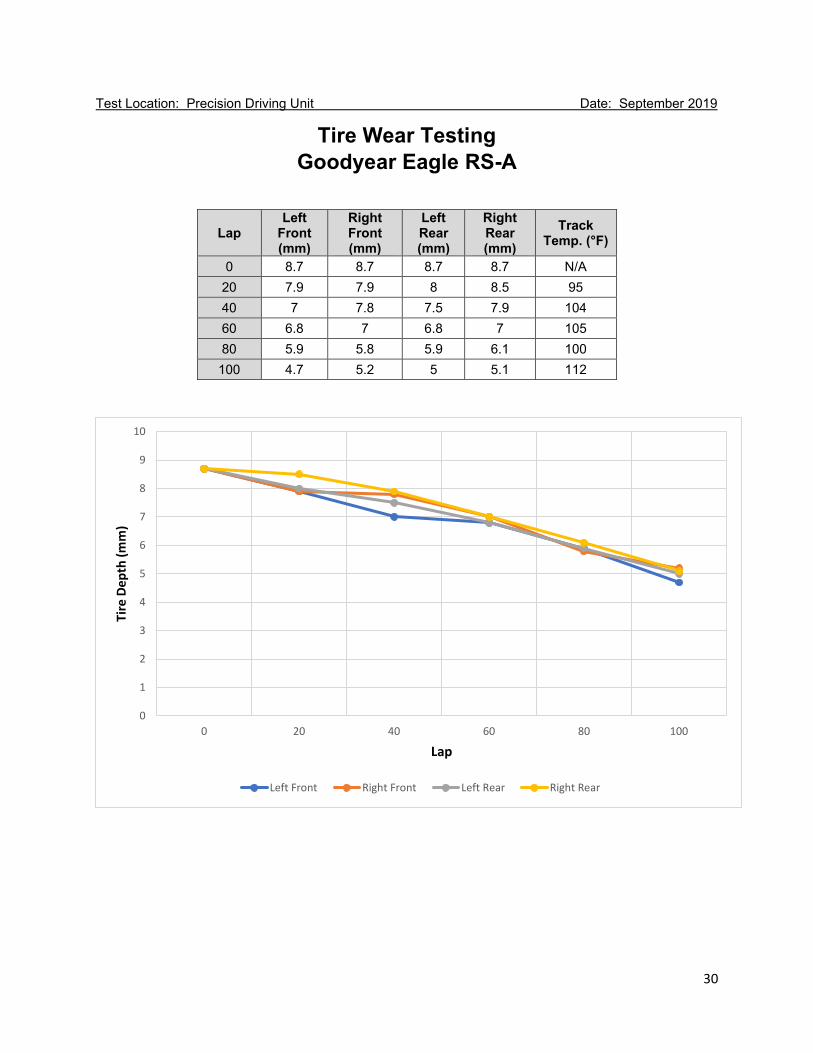
Test Location: Precision Driving Unit Date: September 2019
Tire Wear Testing Good Year Eagle RS-A
Lap Left
Front (mm)
Right Front (mm)
Left Rear (mm)
Right Rear (mm)
Track Temp.
(°F) 0 8.7 8.7 8.7 8.7 20 8.5 7.9 8.5 7.4 95.6 40 7.9 6.8 8 6.9 104 60 6.9 6 7.9 6.9 105 80 6.7 5.6 7.2 6.3 100
100 6.2 4.9 6.6 6 112
0
1
2
3
4
5
6
7
8
9
10
0 20 40 60 80 100
Tire
Dep
th (m
m)
Lap
Left Front Right Front Left Rear Right Rear
10
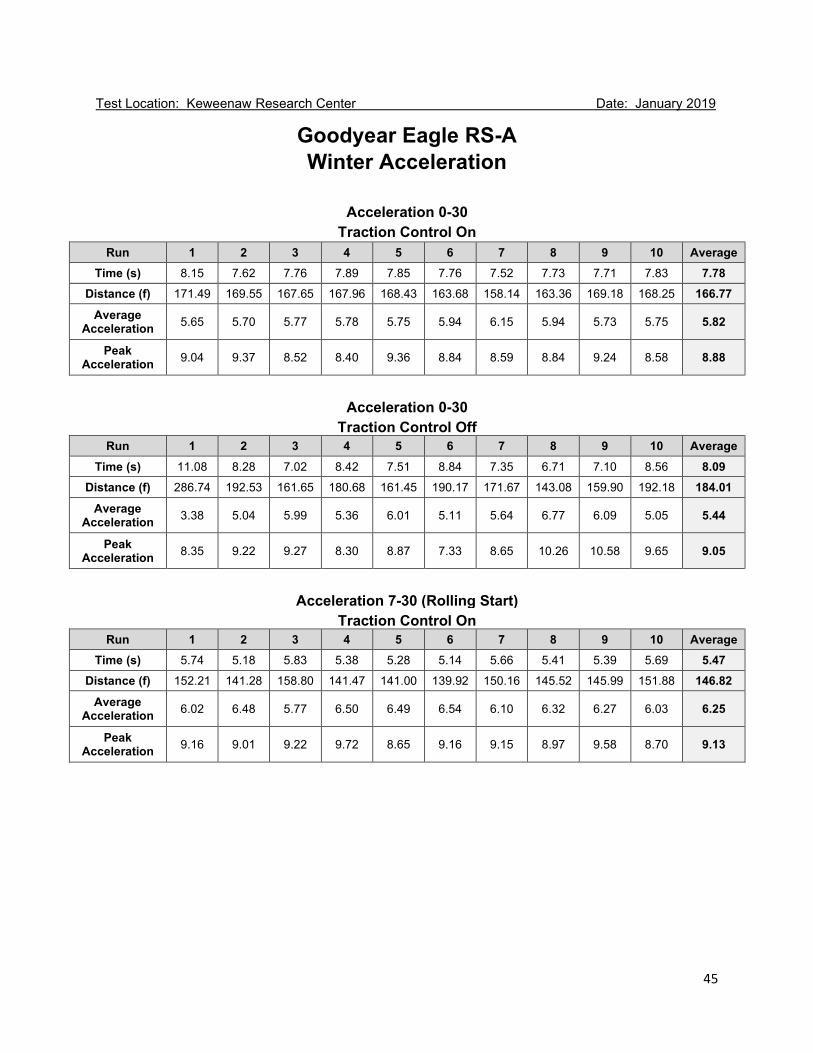
Test Location: Keweenaw Research Center Date: January 2019
Goodyear Eagle RS-A Winter Acceleration
Acceleration 0-30
Traction Control On Run 1 2 3 4 5 6 7 8 9 10 Average
Time (s) 11.31 8.98 10.41 8.78 8.18 8.94 8.83 8.32 9.52 8.55 9.18 Distance (f) 252.76 192.28 242.27 185.85 171.81 182.01 193.00 174.35 208.33 180.63 198.33
Average Acceleration 3.83 5.03 4.00 5.21 5.64 5.32 5.02 5.55 4.65 5.36 4.96
Peak Acceleration 5.62 6.36 6.57 6.90 6.58 6.42 5.84 7.16 5.27 6.44 6.32
Acceleration 0-30
Traction Control Off Run 1 2 3 4 5 6 7 8 9 10 Average
Time (s) 9.21 8.51 9.77 8.53 8.95 9.09 9.69 8.45 10.64 10.27 9.31 Distance (f) 215.42 196.48 220.51 179.98 198.77 180.19 211.18 191.96 202.58 183.07 198.01
Average Acceleration 4.49 4.92 4.39 5.38 4.87 5.37 4.58 5.04 4.78 5.29 4.91
Peak Acceleration 6.85 7.31 5.98 7.34 6.42 7.38 6.36 6.80 6.49 7.63 6.86
Acceleration 7-30 (Rolling Start)
Traction Control On Run 1 2 3 4 5 6 7 8 9 10 Average
Time (s) 6.86 6.28 7.26 6.50 6.25 6.59 6.65 6.55 6.34 N/A 6.59 Distance (f) 187.51 166.31 204.67 177.70 168.07 173.65 182.24 176.86 172.45 N/A 178.83
Average Acceleration 4.88 5.50 4.48 5.15 5.45 5.27 5.02 5.17 5.31 N/A 5.14
Peak Acceleration 6.49 7.63 5.78 5.98 6.20 7.58 5.99 5.84 5.92 N/A 6.38
11
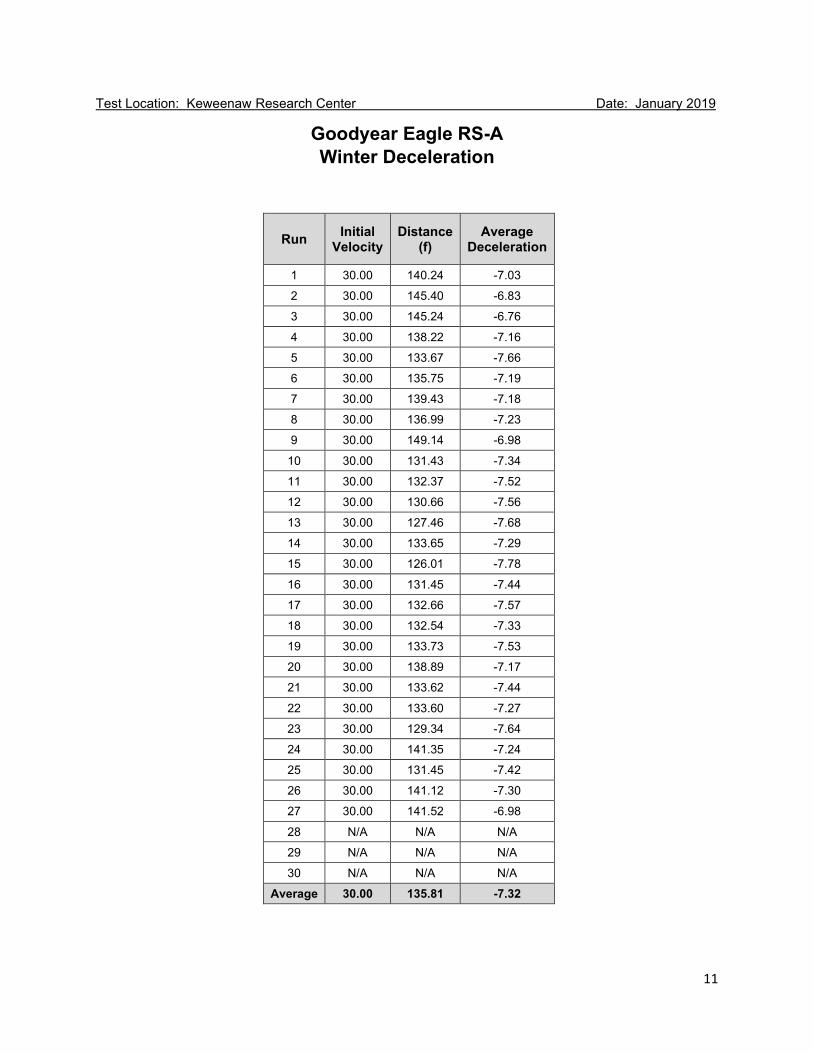
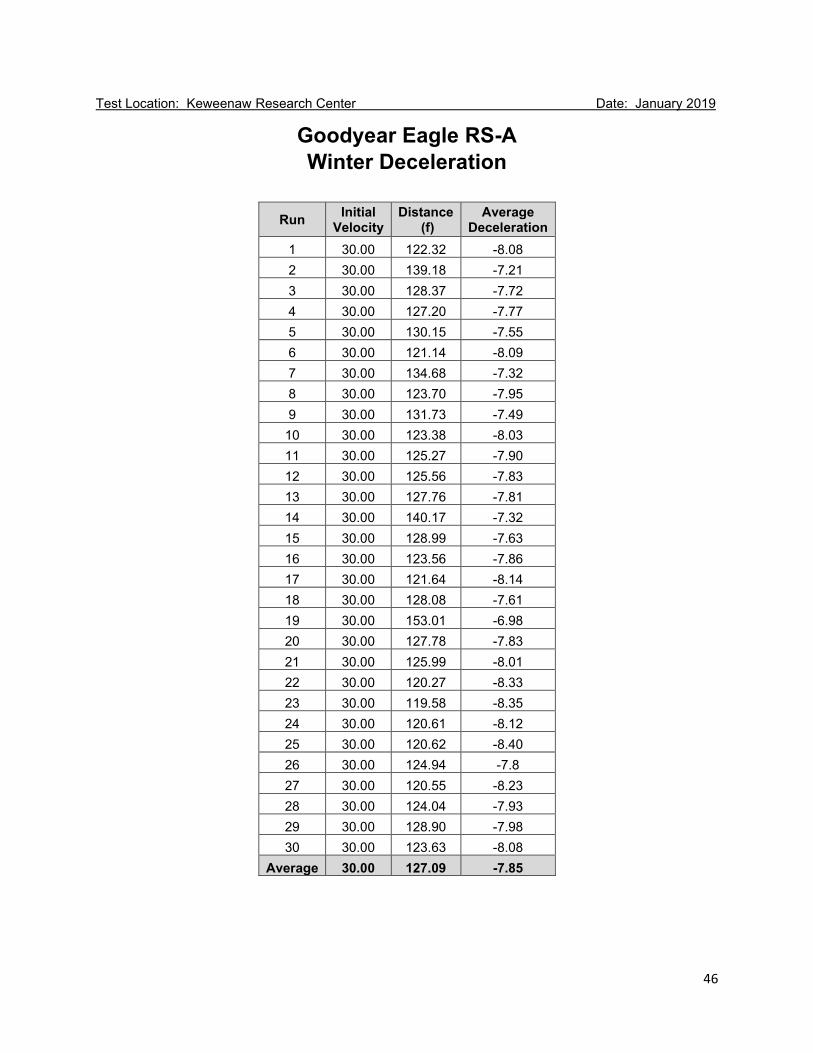
Test Location: Keweenaw Research Center Date: January 2019
Goodyear Eagle RS-A Winter Deceleration
Run Initial Velocity
Distance (f)
Average Deceleration
1 30.00 140.24 -7.03
2 30.00 145.40 -6.83
3 30.00 145.24 -6.76
4 30.00 138.22 -7.16
5 30.00 133.67 -7.66
6 30.00 135.75 -7.19
7 30.00 139.43 -7.18
8 30.00 136.99 -7.23
9 30.00 149.14 -6.98
10 30.00 131.43 -7.34
11 30.00 132.37 -7.52
12 30.00 130.66 -7.56
13 30.00 127.46 -7.68
14 30.00 133.65 -7.29
15 30.00 126.01 -7.78
16 30.00 131.45 -7.44
17 30.00 132.66 -7.57
18 30.00 132.54 -7.33
19 30.00 133.73 -7.53
20 30.00 138.89 -7.17
21 30.00 133.62 -7.44
22 30.00 133.60 -7.27
23 30.00 129.34 -7.64
24 30.00 141.35 -7.24
25 30.00 131.45 -7.42
26 30.00 141.12 -7.30
27 30.00 141.52 -6.98
28 N/A N/A N/A
29 N/A N/A N/A
30 N/A N/A N/A
Average 30.00 135.81 -7.32
12
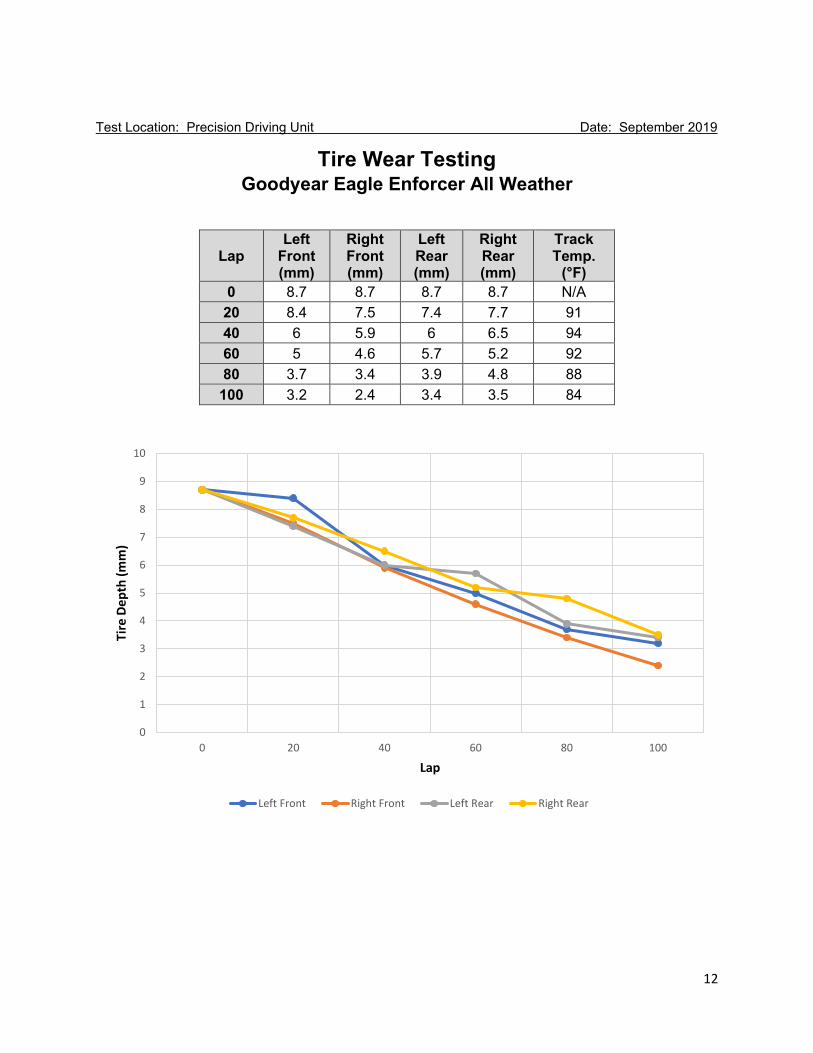
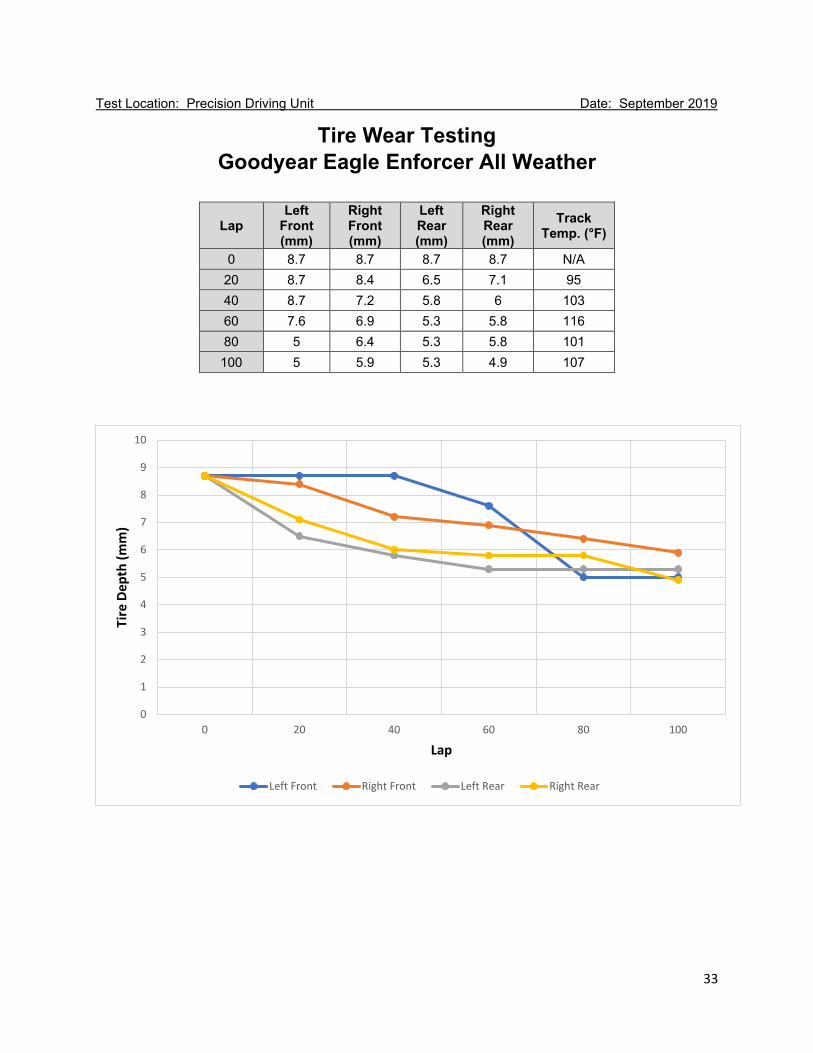
Test Location: Precision Driving Unit Date: September 2019
Tire Wear Testing Goodyear Eagle Enforcer All Weather
Lap Left
Front (mm)
Right Front (mm)
Left Rear (mm)
Right Rear (mm)
Track Temp.
(°F) 0 8.7 8.7 8.7 8.7 N/A 20 8.4 7.5 7.4 7.7 91 40 6 5.9 6 6.5 94 60 5 4.6 5.7 5.2 92 80 3.7 3.4 3.9 4.8 88
100 3.2 2.4 3.4 3.5 84
0
1
2
3
4
5
6
7
8
9
10
0 20 40 60 80 100
Tire
Dep
th (m
m)
Lap
Left Front Right Front Left Rear Right Rear
13
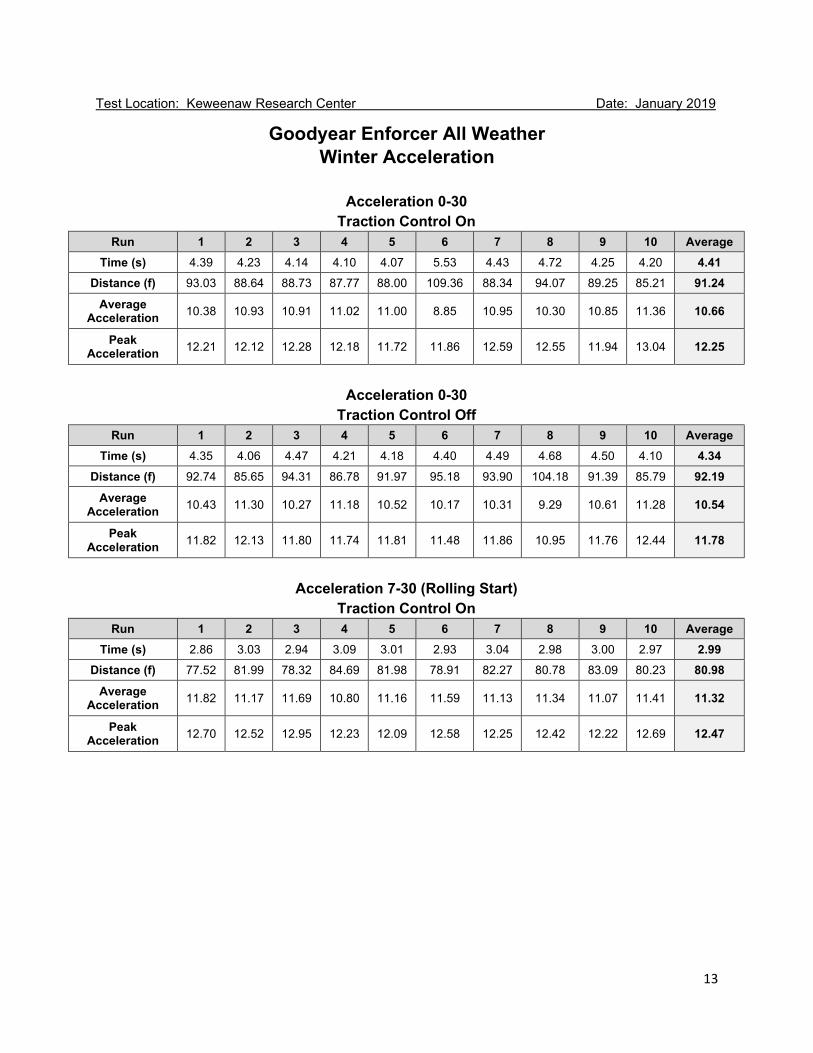
Test Location: Keweenaw Research Center Date: January 2019
Goodyear Enforcer All Weather Winter Acceleration
Acceleration 0-30 Traction Control On
Run 1 2 3 4 5 6 7 8 9 10 Average Time (s) 4.39 4.23 4.14 4.10 4.07 5.53 4.43 4.72 4.25 4.20 4.41
Distance (f) 93.03 88.64 88.73 87.77 88.00 109.36 88.34 94.07 89.25 85.21 91.24 Average
Acceleration 10.38 10.93 10.91 11.02 11.00 8.85 10.95 10.30 10.85 11.36 10.66
Peak Acceleration 12.21 12.12 12.28 12.18 11.72 11.86 12.59 12.55 11.94 13.04 12.25
Acceleration 0-30 Traction Control Off
Run 1 2 3 4 5 6 7 8 9 10 Average Time (s) 4.35 4.06 4.47 4.21 4.18 4.40 4.49 4.68 4.50 4.10 4.34
Distance (f) 92.74 85.65 94.31 86.78 91.97 95.18 93.90 104.18 91.39 85.79 92.19 Average
Acceleration 10.43 11.30 10.27 11.18 10.52 10.17 10.31 9.29 10.61 11.28 10.54
Peak Acceleration 11.82 12.13 11.80 11.74 11.81 11.48 11.86 10.95 11.76 12.44 11.78
Acceleration 7-30 (Rolling Start) Traction Control On
Run 1 2 3 4 5 6 7 8 9 10 Average Time (s) 2.86 3.03 2.94 3.09 3.01 2.93 3.04 2.98 3.00 2.97 2.99
Distance (f) 77.52 81.99 78.32 84.69 81.98 78.91 82.27 80.78 83.09 80.23 80.98 Average
Acceleration 11.82 11.17 11.69 10.80 11.16 11.59 11.13 11.34 11.07 11.41 11.32
Peak Acceleration 12.70 12.52 12.95 12.23 12.09 12.58 12.25 12.42 12.22 12.69 12.47
14
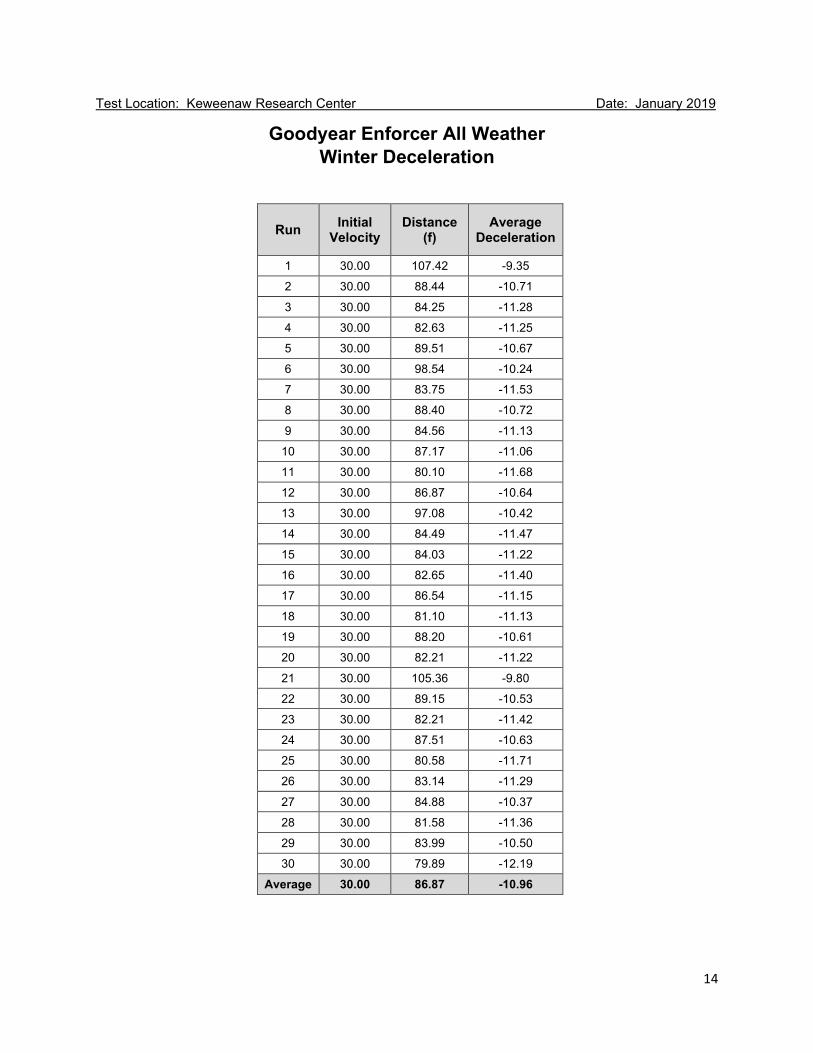
Test Location: Keweenaw Research Center Date: January 2019
Goodyear Enforcer All Weather Winter Deceleration
Run Initial Velocity
Distance (f)
Average Deceleration
1 30.00 107.42 -9.35
2 30.00 88.44 -10.71
3 30.00 84.25 -11.28
4 30.00 82.63 -11.25
5 30.00 89.51 -10.67
6 30.00 98.54 -10.24
7 30.00 83.75 -11.53
8 30.00 88.40 -10.72
9 30.00 84.56 -11.13
10 30.00 87.17 -11.06
11 30.00 80.10 -11.68
12 30.00 86.87 -10.64
13 30.00 97.08 -10.42
14 30.00 84.49 -11.47
15 30.00 84.03 -11.22
16 30.00 82.65 -11.40
17 30.00 86.54 -11.15
18 30.00 81.10 -11.13
19 30.00 88.20 -10.61
20 30.00 82.21 -11.22
21 30.00 105.36 -9.80
22 30.00 89.15 -10.53
23 30.00 82.21 -11.42
24 30.00 87.51 -10.63
25 30.00 80.58 -11.71
26 30.00 83.14 -11.29
27 30.00 84.88 -10.37
28 30.00 81.58 -11.36
29 30.00 83.99 -10.50
30 30.00 79.89 -12.19
Average 30.00 86.87 -10.96
15
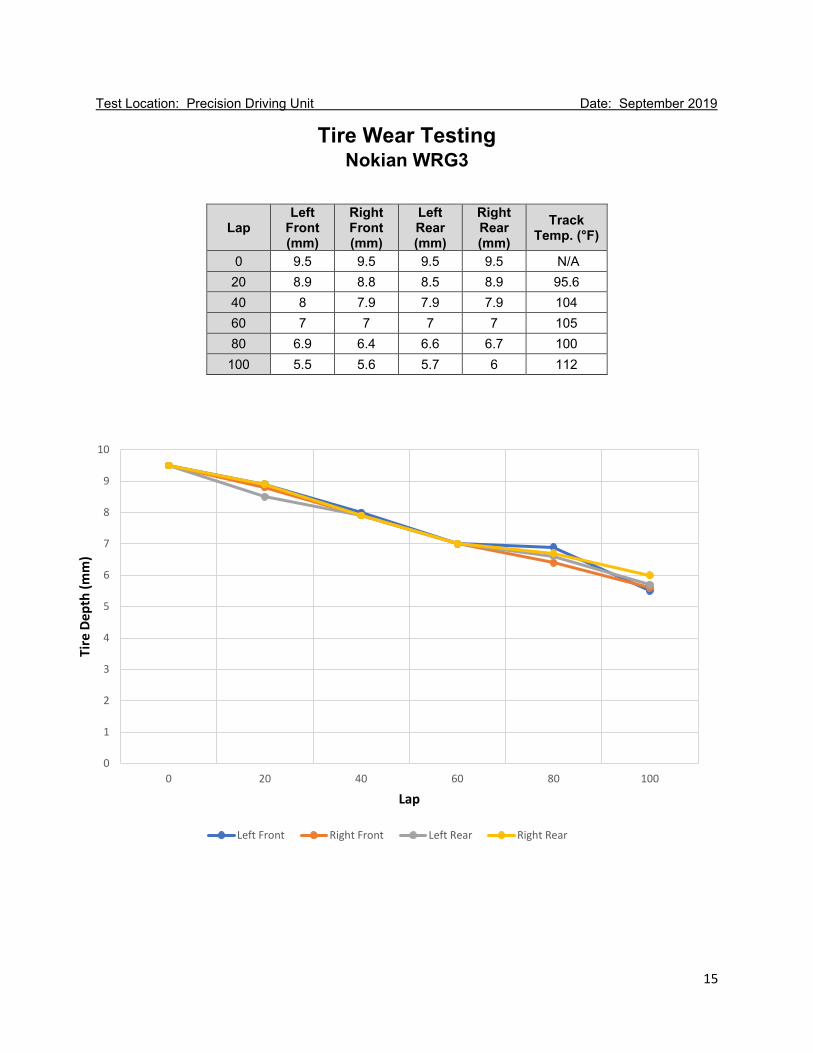
Test Location: Precision Driving Unit Date: September 2019
Tire Wear Testing Nokian WRG3
Lap Left
Front (mm)
Right Front (mm)
Left Rear (mm)
Right Rear (mm)
Track Temp. (°F)
0 9.5 9.5 9.5 9.5 N/A 20 8.9 8.8 8.5 8.9 95.6 40 8 7.9 7.9 7.9 104 60 7 7 7 7 105 80 6.9 6.4 6.6 6.7 100 100 5.5 5.6 5.7 6 112
0
1
2
3
4
5
6
7
8
9
10
0 20 40 60 80 100
Tire
Dep
th (m
m)
Lap
Left Front Right Front Left Rear Right Rear
16
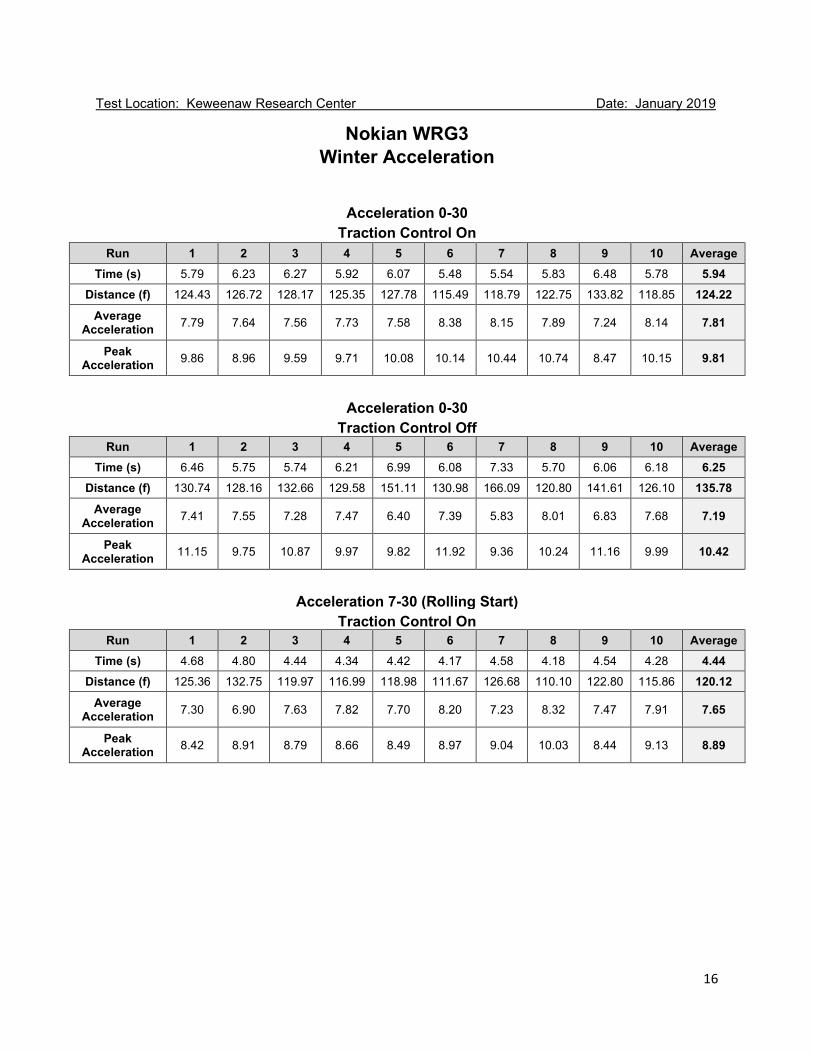
Test Location: Keweenaw Research Center Date: January 2019
Nokian WRG3 Winter Acceleration
Acceleration 0-30
Traction Control On Run 1 2 3 4 5 6 7 8 9 10 Average
Time (s) 5.79 6.23 6.27 5.92 6.07 5.48 5.54 5.83 6.48 5.78 5.94 Distance (f) 124.43 126.72 128.17 125.35 127.78 115.49 118.79 122.75 133.82 118.85 124.22
Average Acceleration 7.79 7.64 7.56 7.73 7.58 8.38 8.15 7.89 7.24 8.14 7.81
Peak Acceleration 9.86 8.96 9.59 9.71 10.08 10.14 10.44 10.74 8.47 10.15 9.81
Acceleration 0-30
Traction Control Off Run 1 2 3 4 5 6 7 8 9 10 Average
Time (s) 6.46 5.75 5.74 6.21 6.99 6.08 7.33 5.70 6.06 6.18 6.25 Distance (f) 130.74 128.16 132.66 129.58 151.11 130.98 166.09 120.80 141.61 126.10 135.78
Average Acceleration 7.41 7.55 7.28 7.47 6.40 7.39 5.83 8.01 6.83 7.68 7.19
Peak Acceleration 11.15 9.75 10.87 9.97 9.82 11.92 9.36 10.24 11.16 9.99 10.42
Acceleration 7-30 (Rolling Start)
Traction Control On Run 1 2 3 4 5 6 7 8 9 10 Average
Time (s) 4.68 4.80 4.44 4.34 4.42 4.17 4.58 4.18 4.54 4.28 4.44 Distance (f) 125.36 132.75 119.97 116.99 118.98 111.67 126.68 110.10 122.80 115.86 120.12
Average Acceleration 7.30 6.90 7.63 7.82 7.70 8.20 7.23 8.32 7.47 7.91 7.65
Peak Acceleration 8.42 8.91 8.79 8.66 8.49 8.97 9.04 10.03 8.44 9.13 8.89
17
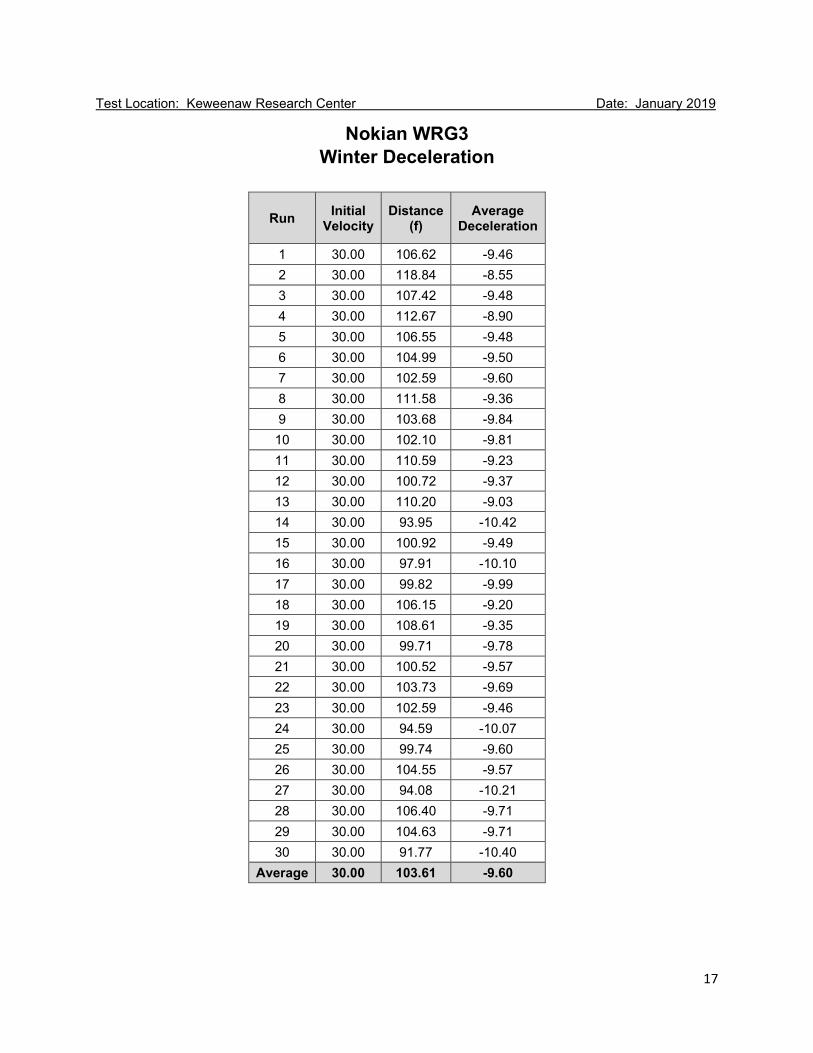
Test Location: Keweenaw Research Center Date: January 2019
Nokian WRG3 Winter Deceleration
Run Initial Velocity
Distance (f)
Average Deceleration
1 30.00 106.62 -9.46 2 30.00 118.84 -8.55 3 30.00 107.42 -9.48 4 30.00 112.67 -8.90 5 30.00 106.55 -9.48 6 30.00 104.99 -9.50 7 30.00 102.59 -9.60 8 30.00 111.58 -9.36 9 30.00 103.68 -9.84 10 30.00 102.10 -9.81 11 30.00 110.59 -9.23 12 30.00 100.72 -9.37 13 30.00 110.20 -9.03 14 30.00 93.95 -10.42 15 30.00 100.92 -9.49 16 30.00 97.91 -10.10 17 30.00 99.82 -9.99 18 30.00 106.15 -9.20 19 30.00 108.61 -9.35 20 30.00 99.71 -9.78 21 30.00 100.52 -9.57 22 30.00 103.73 -9.69 23 30.00 102.59 -9.46 24 30.00 94.59 -10.07 25 30.00 99.74 -9.60 26 30.00 104.55 -9.57 27 30.00 94.08 -10.21 28 30.00 106.40 -9.71 29 30.00 104.63 -9.71 30 30.00 91.77 -10.40
Average 30.00 103.61 -9.60
18
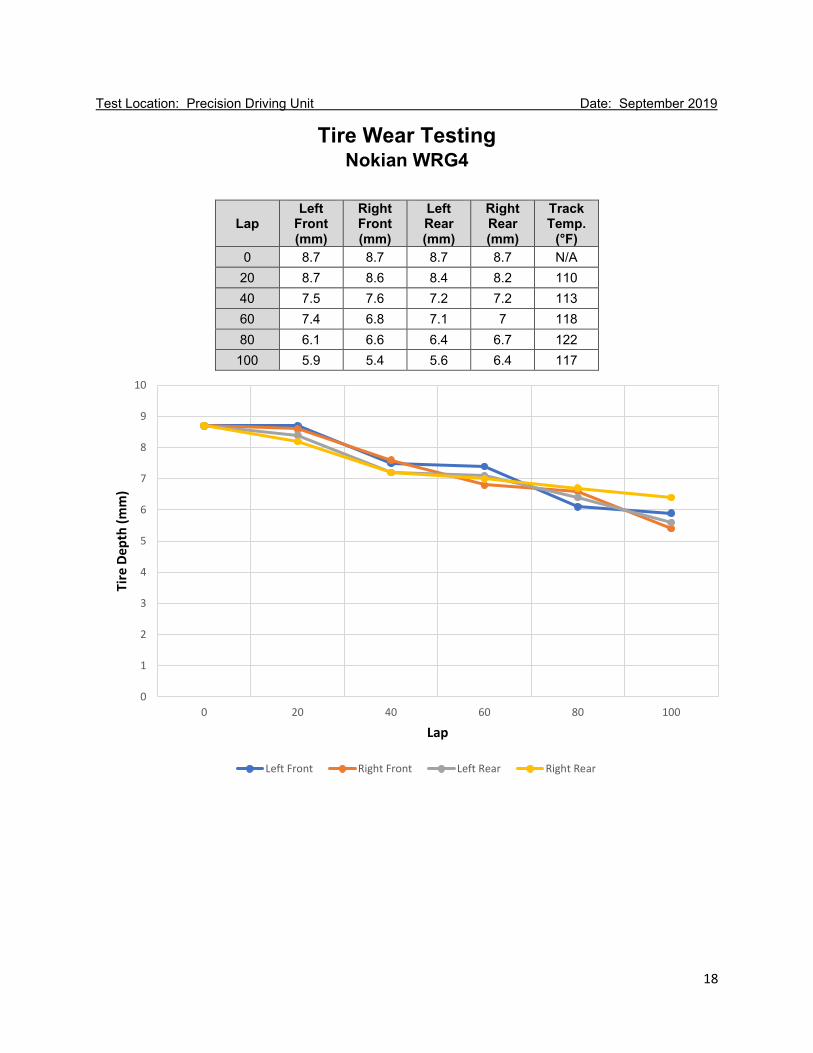
Test Location: Precision Driving Unit Date: September 2019
Tire Wear Testing Nokian WRG4
0
1
2
3
4
5
6
7
8
9
10
0 20 40 60 80 100
Tire
Dep
th (m
m)
Lap
Left Front Right Front Left Rear Right Rear
Lap Left
Front (mm)
Right Front (mm)
Left Rear (mm)
Right Rear (mm)
Track Temp.
(°F) 0 8.7 8.7 8.7 8.7 N/A
20 8.7 8.6 8.4 8.2 110 40 7.5 7.6 7.2 7.2 113 60 7.4 6.8 7.1 7 118 80 6.1 6.6 6.4 6.7 122 100 5.9 5.4 5.6 6.4 117

19
Test Location: Keweenaw Research Center Date: January 2019
Nokian WRG4 Winter Acceleration
Acceleration 0-30
Traction Control On Run 1 2 3 4 5 6 7 8 9 10 Average
Time (s) 5.09 4.81 4.85 4.54 4.68 4.70 4.58 4.60 4.53 4.77 4.72 Distance (f) 109.82 103.22 98.13 97.72 97.07 101.33 97.55 97.43 95.22 100.10 99.76
Average Acceleration 8.82 9.38 9.87 9.90 9.97 9.55 9.92 9.93 10.17 9.67 9.72
Peak Acceleration 9.54 10.57 10.59 10.66 10.94 10.76 10.80 10.67 11.21 10.73 10.65
Acceleration 0-30
Traction Control Off Run 1 2 3 4 5 6 7 8 9 10 Average
Time (s) 5.07 4.85 4.77 4.92 5.14 5.28 5.89 6.51 7.89 4.93 5.53 Distance (f) 110.79 105.63 107.02 108.69 112.82 117.90 138.66 147.72 202.49 109.56 126.13
Average Acceleration 8.73 9.16 9.05 8.91 8.59 8.21 6.98 6.55 4.78 8.83 7.98
Peak Acceleration 10.39 10.77 10.49 11.63 10.62 10.35 10.09 10.23 9.12 10.64 10.43
Acceleration 7-30 (Rolling Start)
Traction Control On Run 1 2 3 4 5 6 7 8 9 10 Average
Time (s) 3.45 3.45 3.57 3.27 3.46 3.35 3.22 3.51 3.24 N/A 3.39 Distance (f) 91.95 92.94 95.48 88.26 93.18 91.37 85.51 93.01 87.32 N/A 91.00
Average Acceleration 9.95 9.85 9.60 10.37 9.81 10.02 10.70 9.84 10.47 N/A 10.07
Peak Acceleration 10.83 10.72 10.74 11.50 10.68 10.66 11.60 10.96 11.07 N/A 10.97
20
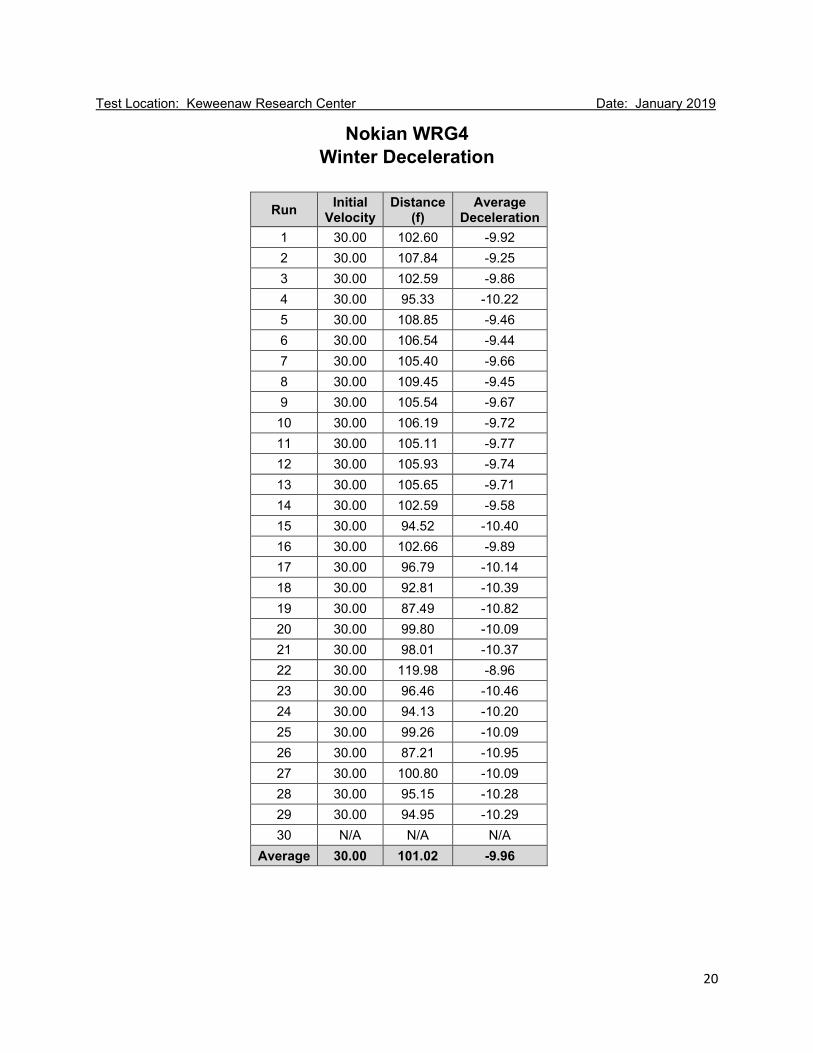
Test Location: Keweenaw Research Center Date: January 2019
Nokian WRG4
Winter Deceleration
Run Initial Velocity
Distance (f)
Average Deceleration
1 30.00 102.60 -9.92 2 30.00 107.84 -9.25 3 30.00 102.59 -9.86 4 30.00 95.33 -10.22 5 30.00 108.85 -9.46 6 30.00 106.54 -9.44 7 30.00 105.40 -9.66 8 30.00 109.45 -9.45 9 30.00 105.54 -9.67 10 30.00 106.19 -9.72 11 30.00 105.11 -9.77 12 30.00 105.93 -9.74 13 30.00 105.65 -9.71 14 30.00 102.59 -9.58 15 30.00 94.52 -10.40 16 30.00 102.66 -9.89 17 30.00 96.79 -10.14 18 30.00 92.81 -10.39 19 30.00 87.49 -10.82 20 30.00 99.80 -10.09 21 30.00 98.01 -10.37 22 30.00 119.98 -8.96 23 30.00 96.46 -10.46 24 30.00 94.13 -10.20 25 30.00 99.26 -10.09 26 30.00 87.21 -10.95 27 30.00 100.80 -10.09 28 30.00 95.15 -10.28 29 30.00 94.95 -10.29 30 N/A N/A N/A
Average 30.00 101.02 -9.96
21
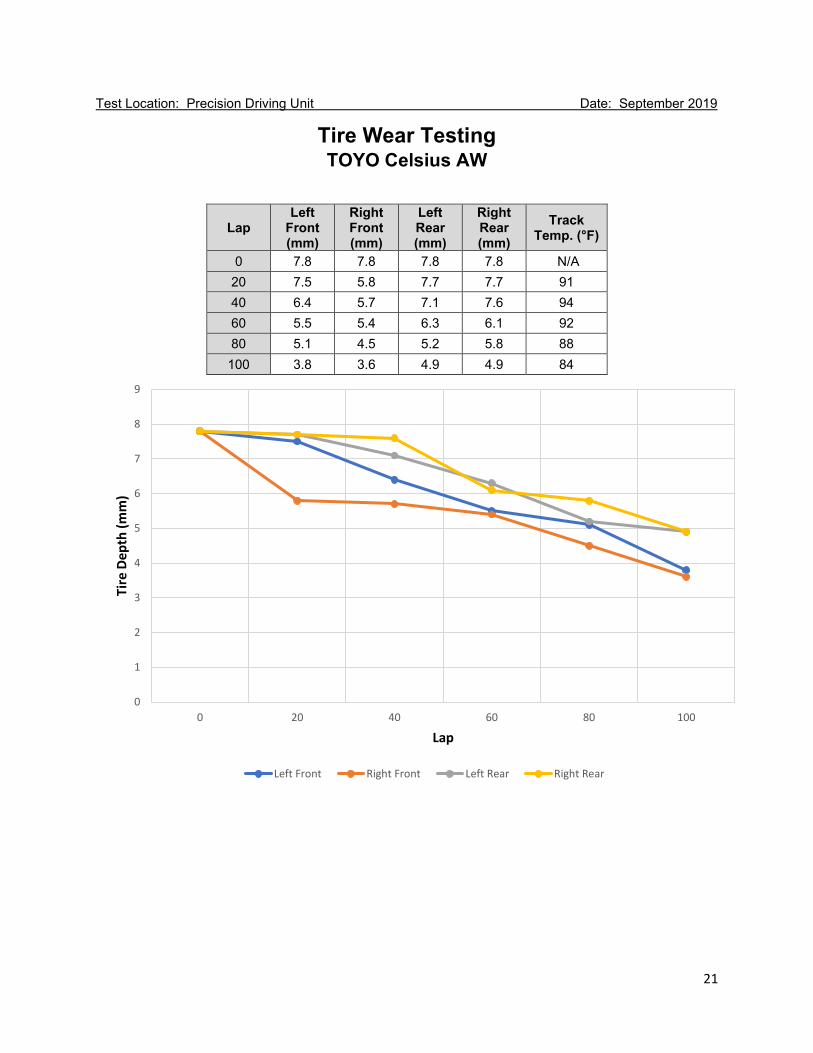
Test Location: Precision Driving Unit Date: September 2019
Tire Wear Testing TOYO Celsius AW
0
1
2
3
4
5
6
7
8
9
0 20 40 60 80 100
Tire
Dep
th (m
m)
Lap
Left Front Right Front Left Rear Right Rear
Lap Left
Front (mm)
Right Front (mm)
Left Rear (mm)
Right Rear (mm)
Track Temp. (°F)
0 7.8 7.8 7.8 7.8 N/A 20 7.5 5.8 7.7 7.7 91 40 6.4 5.7 7.1 7.6 94 60 5.5 5.4 6.3 6.1 92 80 5.1 4.5 5.2 5.8 88 100 3.8 3.6 4.9 4.9 84
22
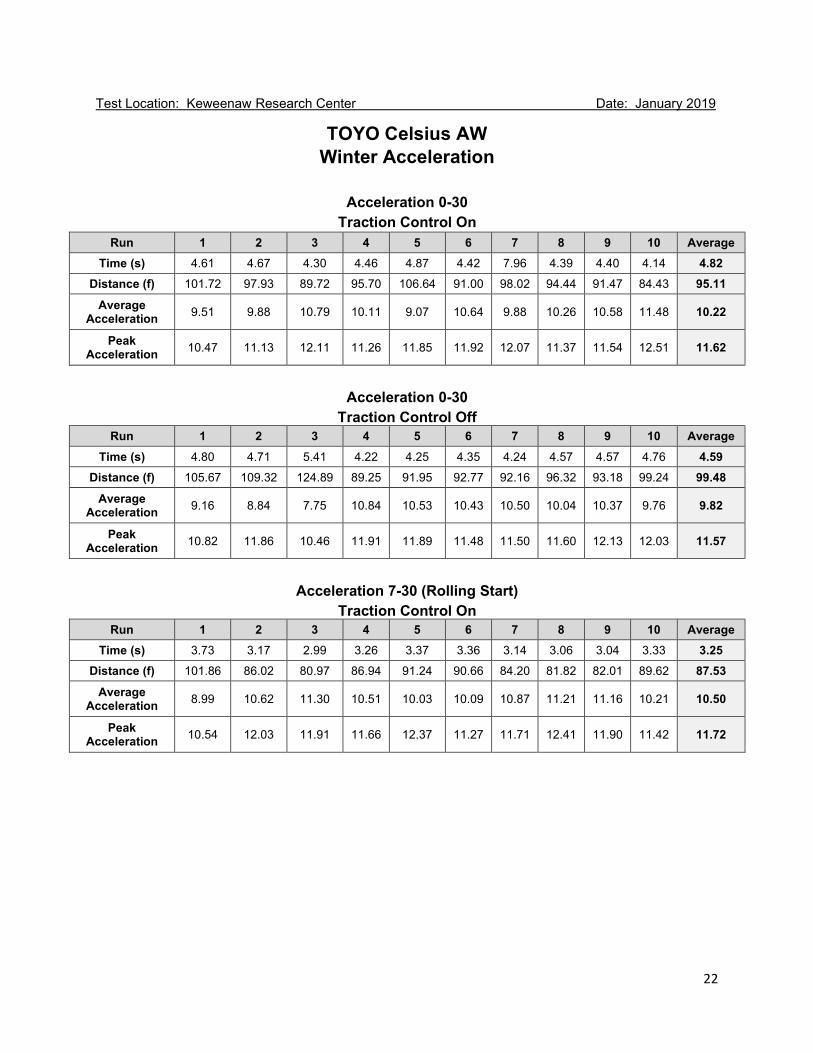
Test Location: Keweenaw Research Center Date: January 2019
TOYO Celsius AW Winter Acceleration
Acceleration 0-30
Traction Control On Run 1 2 3 4 5 6 7 8 9 10 Average
Time (s) 4.61 4.67 4.30 4.46 4.87 4.42 7.96 4.39 4.40 4.14 4.82 Distance (f) 101.72 97.93 89.72 95.70 106.64 91.00 98.02 94.44 91.47 84.43 95.11
Average Acceleration 9.51 9.88 10.79 10.11 9.07 10.64 9.88 10.26 10.58 11.48 10.22
Peak Acceleration 10.47 11.13 12.11 11.26 11.85 11.92 12.07 11.37 11.54 12.51 11.62
Acceleration 0-30
Traction Control Off Run 1 2 3 4 5 6 7 8 9 10 Average
Time (s) 4.80 4.71 5.41 4.22 4.25 4.35 4.24 4.57 4.57 4.76 4.59 Distance (f) 105.67 109.32 124.89 89.25 91.95 92.77 92.16 96.32 93.18 99.24 99.48
Average Acceleration 9.16 8.84 7.75 10.84 10.53 10.43 10.50 10.04 10.37 9.76 9.82
Peak Acceleration 10.82 11.86 10.46 11.91 11.89 11.48 11.50 11.60 12.13 12.03 11.57
Acceleration 7-30 (Rolling Start)
Traction Control On Run 1 2 3 4 5 6 7 8 9 10 Average
Time (s) 3.73 3.17 2.99 3.26 3.37 3.36 3.14 3.06 3.04 3.33 3.25 Distance (f) 101.86 86.02 80.97 86.94 91.24 90.66 84.20 81.82 82.01 89.62 87.53
Average Acceleration 8.99 10.62 11.30 10.51 10.03 10.09 10.87 11.21 11.16 10.21 10.50
Peak Acceleration 10.54 12.03 11.91 11.66 12.37 11.27 11.71 12.41 11.90 11.42 11.72
23
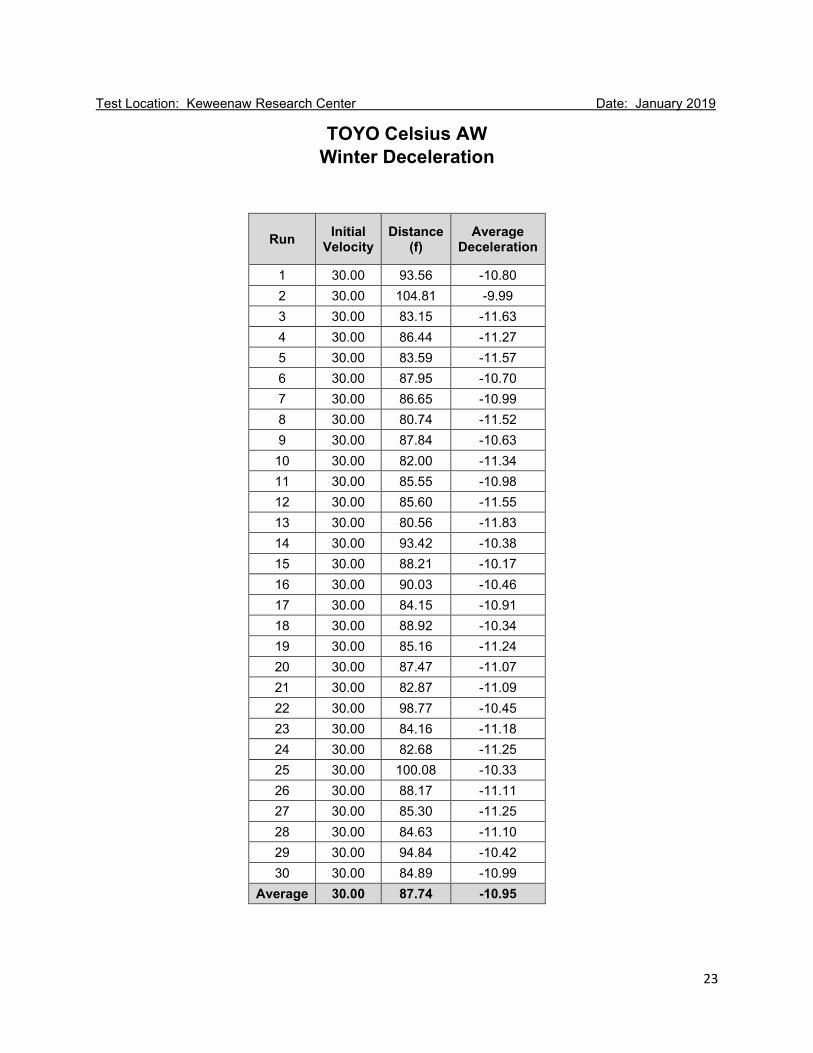
Test Location: Keweenaw Research Center Date: January 2019
TOYO Celsius AW Winter Deceleration
Run Initial Velocity
Distance (f)
Average Deceleration
1 30.00 93.56 -10.80 2 30.00 104.81 -9.99 3 30.00 83.15 -11.63 4 30.00 86.44 -11.27 5 30.00 83.59 -11.57 6 30.00 87.95 -10.70 7 30.00 86.65 -10.99 8 30.00 80.74 -11.52 9 30.00 87.84 -10.63 10 30.00 82.00 -11.34 11 30.00 85.55 -10.98 12 30.00 85.60 -11.55 13 30.00 80.56 -11.83 14 30.00 93.42 -10.38 15 30.00 88.21 -10.17 16 30.00 90.03 -10.46 17 30.00 84.15 -10.91 18 30.00 88.92 -10.34 19 30.00 85.16 -11.24 20 30.00 87.47 -11.07 21 30.00 82.87 -11.09 22 30.00 98.77 -10.45 23 30.00 84.16 -11.18 24 30.00 82.68 -11.25 25 30.00 100.08 -10.33 26 30.00 88.17 -11.11 27 30.00 85.30 -11.25 28 30.00 84.63 -11.10 29 30.00 94.84 -10.42 30 30.00 84.89 -10.99
Average 30.00 87.74 -10.95
24
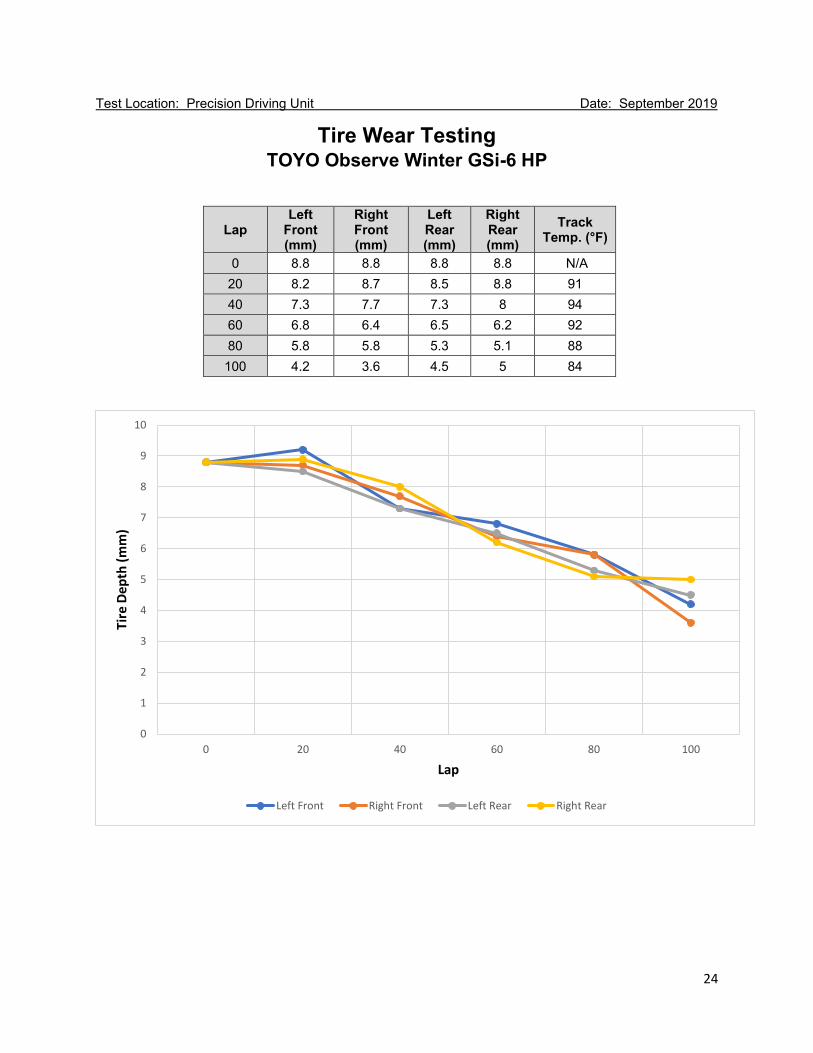
Test Location: Precision Driving Unit Date: September 2019
Tire Wear Testing TOYO Observe Winter GSi-6 HP
Lap Left
Front (mm)
Right Front (mm)
Left Rear (mm)
Right Rear (mm)
Track Temp. (°F)
0 8.8 8.8 8.8 8.8 N/A 20 8.2 8.7 8.5 8.8 91 40 7.3 7.7 7.3 8 94 60 6.8 6.4 6.5 6.2 92 80 5.8 5.8 5.3 5.1 88 100 4.2 3.6 4.5 5 84
0
1
2
3
4
5
6
7
8
9
10
0 20 40 60 80 100
Tire
Dep
th (m
m)
Lap
Left Front Right Front Left Rear Right Rear
25
Test Location: Keweenaw Research Center Date: January 2019
TOYO Observe Winter GSi-6 HP Winter Acceleration
Acceleration 0-30
Traction Control On Run 1 2 3 4 5 6 7 8 9 10 Average
Time (s) 4.13 4.51 4.24 4.37 4.46 4.20 4.24 4.69 3.88 4.39 4.31 Distance (f) 86.70 88.00 91.03 88.49 95.62 89.03 90.54 88.91 82.29 87.79 88.84
Average Acceleration 11.15 11.02 10.64 10.94 10.12 10.87 10.69 10.89 11.75 11.02 10.91
Peak Acceleration 12.19 12.36 11.72 11.87 12.00 11.91 12.16 11.88 13.44 12.01 12.15
Acceleration 0-30
Traction Control Off Run 1 2 3 4 5 6 7 8 9 10 Average
Time (s) 5.38 5.37 4.97 5.10 5.32 5.23 5.62 5.52 5.39 4.70 5.26 Distance (f) 127.33 117.14 108.62 119.91 126.02 107.09 125.10 124.29 116.98 108.62 118.11
Average Acceleration 7.60 8.26 8.91 8.06 7.68 9.04 7.74 7.79 8.29 8.90 8.23
Peak Acceleration 11.32 11.02 11.02 11.75 11.65 10.93 11.25 10.83 10.50 11.84 11.21
Acceleration 7-30 (Rolling Start)
Traction Control On Run 1 2 3 4 5 6 7 8 9 10 Average
Time (s) 3.30 2.94 3.11 2.87 3.00 2.91 3.01 3.16 3.11 3.42 3.08 Distance (f) 91.37 80.49 83.27 77.07 80.03 80.02 81.71 84.06 84.49 93.70 83.62
Average Acceleration 10.02 11.38 11.00 11.89 11.46 11.44 11.20 10.89 10.83 9.77 10.99
Peak Acceleration 11.81 12.25 12.08 12.85 12.74 12.88 12.29 12.01 12.24 11.00 12.22
26
Test Location: Keweenaw Research Center Date: January 2019
TOYO Observe Winter GSi-6 HP Winter Deceleration
Run Initial Velocity
Distance (f)
Average Deceleration
1 30.00 87.30 -10.56 2 30.00 84.08 -11.56 3 30.00 85.03 -11.41 4 30.00 92.95 -10.07 5 30.00 98.25 -10.37 6 30.00 102.12 -9.58 7 30.00 97.66 -10.13 8 30.00 92.61 -10.55 9 30.00 103.86 -9.60 10 30.00 106.52 -9.56 11 30.00 100.07 -10.07 12 30.00 102.16 -9.64 13 30.00 97.32 -10.27 14 30.00 102.53 -9.70 15 30.00 93.51 -10.66 16 30.00 97.41 -10.16 17 30.00 95.72 -9.89 18 30.00 89.08 -10.76 19 30.00 88.75 -11.14 20 30.00 95.88 -10.26 21 30.00 92.94 -10.67 22 30.00 94.40 -10.50 23 30.00 95.86 -10.35 24 30.00 92.01 -10.58 25 30.00 90.75 -10.96 26 30.00 87.89 -10.91 27 30.00 86.41 -11.16 28 30.00 100.17 -10.07 29 30.00 88.83 -11.02 30 30.00 98.32 -9.99
Average 30.00 94.68 -10.41
27
Dodge Charger Acceleration Comparison
4.96
10.66 10.91 10.227.81
9.72
6.32
12.25 12.15 11.629.81 10.65
0.002.004.006.008.00
10.0012.0014.00
GoodyearRSA
GoodyearEagle Enforcer
AW
ToyoObserve Winter
ToyoCelsius AW
NokianWRG3
NokianWRG4
Ft/S
2
Dodge ChargerAcceleration 0-30 Traction Control On
Average Acceleration Peak Acceleration
4.91
10.548.23
9.82
7.19 7.986.86
11.78 11.21 11.5710.42 10.43
0.002.004.006.008.00
10.0012.0014.00
GoodyearRSA
GoodyearEagle Enforcer
AW
ToyoObserve Winter
ToyoCelsius AW
NokianWRG3
NokianWRG4
Ft/S
2
Dodge ChargerAcceleration 0-30 Traction Control Off
Average Acceleration Peak Acceleration
5.14
11.32 10.99 10.50
7.6510.07
6.38
12.47 12.22 11.72
8.8910.97
0.002.004.006.008.00
10.0012.0014.00
GoodyearRSA
GoodyearEagle Enforcer
AW
ToyoObserve Winter
ToyoCelsius AW
NokianWRG3
NokianWRG4
Ft/S
2
Dodge ChargerAcceleration 7-30 Traction Control On
Average Acceleration Peak Acceleration
28
Dodge Charger Deceleration Comparison
7.32
10.96 10.41 10.959.6 9.96
02468
1012
GoodyearRSA
GoodyearEagle Enforcer
AW
ToyoObserve Winter
ToyoCelsius AW
NokianWRG3
NokianWRG4
Ft/S
2
Dodge ChargerAverage Deceleration
AverageDeceleration
29
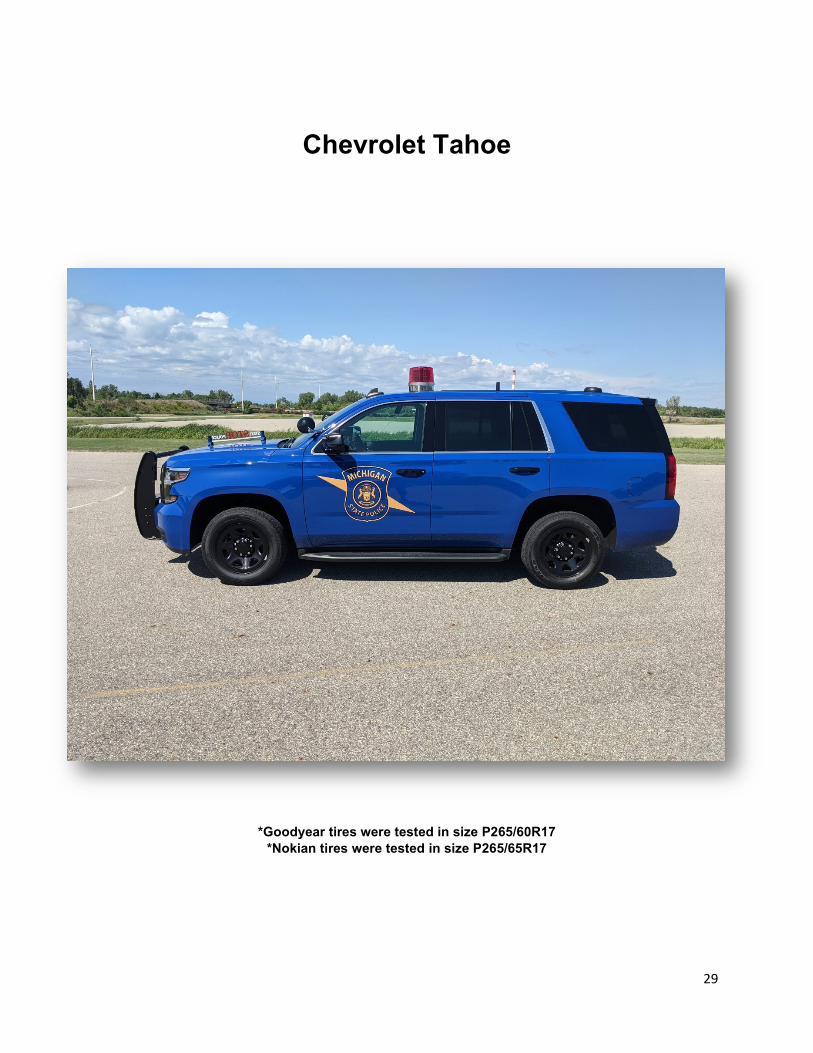
Chevrolet Tahoe
*Goodyear tires were tested in size P265/60R17
*Nokian tires were tested in size P265/65R17
30
Test Location: Precision Driving Unit Date: September 2019
Tire Wear Testing Goodyear Eagle RS-A
Lap Left
Front (mm)
Right Front (mm)
Left Rear (mm)
Right Rear (mm)
Track Temp. (°F)
0 8.7 8.7 8.7 8.7 N/A 20 7.9 7.9 8 8.5 95 40 7 7.8 7.5 7.9 104 60 6.8 7 6.8 7 105 80 5.9 5.8 5.9 6.1 100 100 4.7 5.2 5 5.1 112
0
1
2
3
4
5
6
7
8
9
10
0 20 40 60 80 100
Tire
Dep
th (m
m)
Lap
Left Front Right Front Left Rear Right Rear

31
Test Location: Keweenaw Research Center Date: January 2019
Goodyear Eagle RS-A Winter Acceleration
Acceleration 0-30
Traction Control On Run 1 2 3 4 5 6 7 8 9 10 Average
Time (s) 6.10 5.86 6.63 6.05 6.09 5.90 6.39 6.17 6.16 6.32 6.17 Distance (f) 128.67 120.90 136.43 128.80 125.80 125.74 131.55 124.22 131.17 133.81 128.71
Average Acceleration 7.54 8.00 7.10 7.57 7.84 7.75 7.36 7.82 7.43 7.23 7.56
Peak Acceleration 12.00 11.83 12.78 12.60 14.03 12.68 12.86 11.50 11.87 11.78 12.39
Acceleration 0-30
Traction Control Off Run 1 2 3 4 5 6 7 8 9 10 Average
Time (s) 5.39 6.33 6.48 7.08 5.70 7.21 6.26 6.38 6.48 5.75 6.31 Distance (f) 129.97 139.11 154.73 149.44 132.49 154.53 147.31 153.61 146.31 129.43 143.69
Average Acceleration 7.45 6.98 6.26 6.48 7.31 6.27 6.60 6.35 6.63 7.49 6.78
Peak Acceleration 11.96 10.49 10.15 12.59 11.88 9.77 10.39 10.25 10.74 14.18 11.24
Acceleration 7-30 (Rolling Start)
Traction Control On Run 1 2 3 4 5 6 7 8 9 10 Average
Time (s) 4.59 4.62 4.36 4.80 4.24 4.69 4.63 4.92 4.56 4.92 4.63 Distance (f) 130.20 124.85 120.47 127.24 114.04 131.33 122.33 136.84 122.24 132.83 126.24
Average Acceleration 7.04 7.35 7.62 7.23 8.08 6.97 7.49 6.73 7.52 6.90 7.29
Peak Acceleration 14.42 16.45 11.75 13.37 11.90 12.26 11.04 15.06 14.88 12.88 13.40
32
Test Location: Keweenaw Research Center Date: January 2019
Goodyear Eagle RS-A Winter Deceleration
Run Initial
Velocity Distance
(f) Average
Deceleration 1 30.00 119.10 -7.94 2 30.00 114.26 -8.24 3 30.00 119.28 -8.38 4 30.00 119.34 -8.23 5 30.00 116.87 -8.37 6 30.00 111.25 -8.61 7 30.00 128.67 -7.99 8 30.00 110.62 -8.73 9 30.00 114.14 -8.55 10 30.00 112.94 -8.58 11 30.00 117.48 -8.70 12 30.00 107.67 -8.81 13 30.00 116.79 -8.58 14 30.00 127.36 -8.02 15 30.00 115.91 -8.50 16 30.00 132.13 -8.09 17 30.00 107.43 -9.06 18 30.00 114.47 -8.27 19 30.00 125.87 -8.29 20 30.00 117.03 -8.25 21 30.00 126.48 -8.33 22 30.00 132.03 -7.80 23 30.00 112.05 -9.05 24 30.00 112.38 -8.60 25 30.00 122.46 -8.39 26 30.00 122.62 -8.06 27 30.00 108.66 -8.70 28 30.00 121.07 -8.21 29 30.00 101.42 -9.03 30 30.00 109.18 -8.97
Average 30.00 117.23 -8.44
33
Test Location: Precision Driving Unit Date: September 2019
Tire Wear Testing Goodyear Eagle Enforcer All Weather
Lap
Left Front (mm)
Right Front (mm)
Left Rear (mm)
Right Rear (mm)
Track Temp. (°F)
0 8.7 8.7 8.7 8.7 N/A 20 8.7 8.4 6.5 7.1 95 40 8.7 7.2 5.8 6 103 60 7.6 6.9 5.3 5.8 116 80 5 6.4 5.3 5.8 101 100 5 5.9 5.3 4.9 107
0
1
2
3
4
5
6
7
8
9
10
0 20 40 60 80 100
Tire
Dep
th (m
m)
Lap
Left Front Right Front Left Rear Right Rear
34
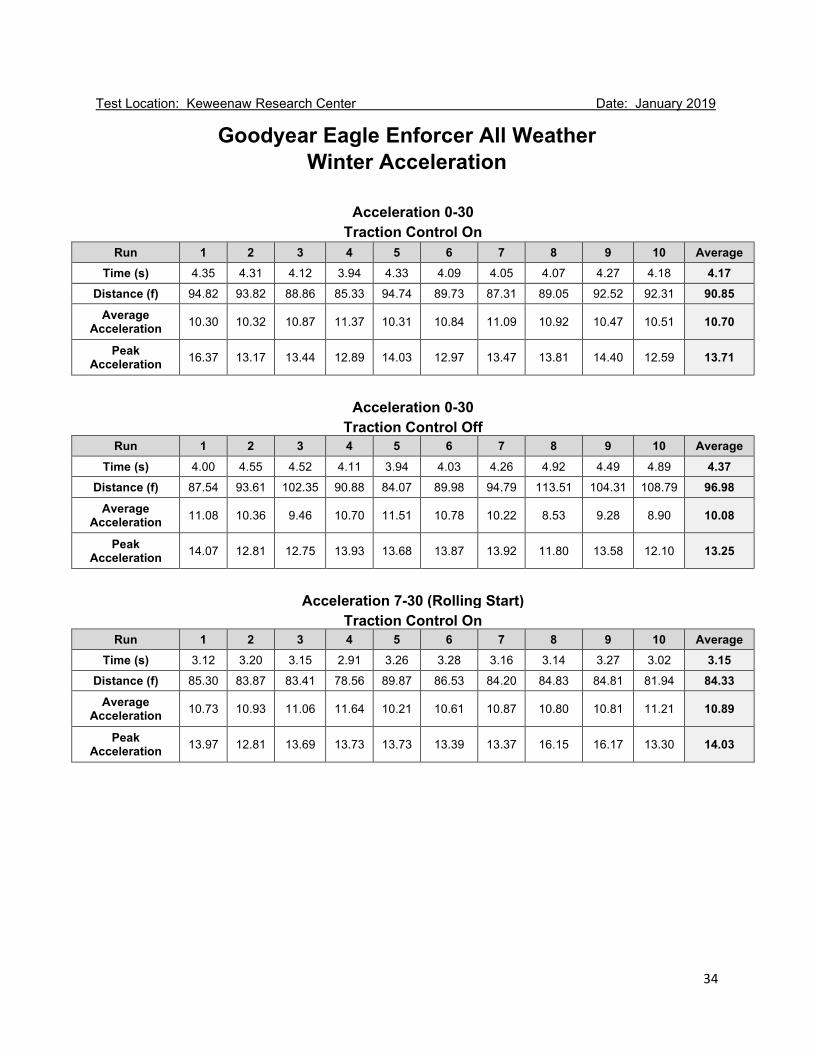
Test Location: Keweenaw Research Center Date: January 2019
Goodyear Eagle Enforcer All Weather Winter Acceleration
Acceleration 0-30
Traction Control On Run 1 2 3 4 5 6 7 8 9 10 Average
Time (s) 4.35 4.31 4.12 3.94 4.33 4.09 4.05 4.07 4.27 4.18 4.17 Distance (f) 94.82 93.82 88.86 85.33 94.74 89.73 87.31 89.05 92.52 92.31 90.85
Average Acceleration 10.30 10.32 10.87 11.37 10.31 10.84 11.09 10.92 10.47 10.51 10.70
Peak Acceleration 16.37 13.17 13.44 12.89 14.03 12.97 13.47 13.81 14.40 12.59 13.71
Acceleration 0-30
Traction Control Off Run 1 2 3 4 5 6 7 8 9 10 Average
Time (s) 4.00 4.55 4.52 4.11 3.94 4.03 4.26 4.92 4.49 4.89 4.37 Distance (f) 87.54 93.61 102.35 90.88 84.07 89.98 94.79 113.51 104.31 108.79 96.98
Average Acceleration 11.08 10.36 9.46 10.70 11.51 10.78 10.22 8.53 9.28 8.90 10.08
Peak Acceleration 14.07 12.81 12.75 13.93 13.68 13.87 13.92 11.80 13.58 12.10 13.25
Acceleration 7-30 (Rolling Start)
Traction Control On Run 1 2 3 4 5 6 7 8 9 10 Average
Time (s) 3.12 3.20 3.15 2.91 3.26 3.28 3.16 3.14 3.27 3.02 3.15 Distance (f) 85.30 83.87 83.41 78.56 89.87 86.53 84.20 84.83 84.81 81.94 84.33
Average Acceleration 10.73 10.93 11.06 11.64 10.21 10.61 10.87 10.80 10.81 11.21 10.89
Peak Acceleration 13.97 12.81 13.69 13.73 13.73 13.39 13.37 16.15 16.17 13.30 14.03
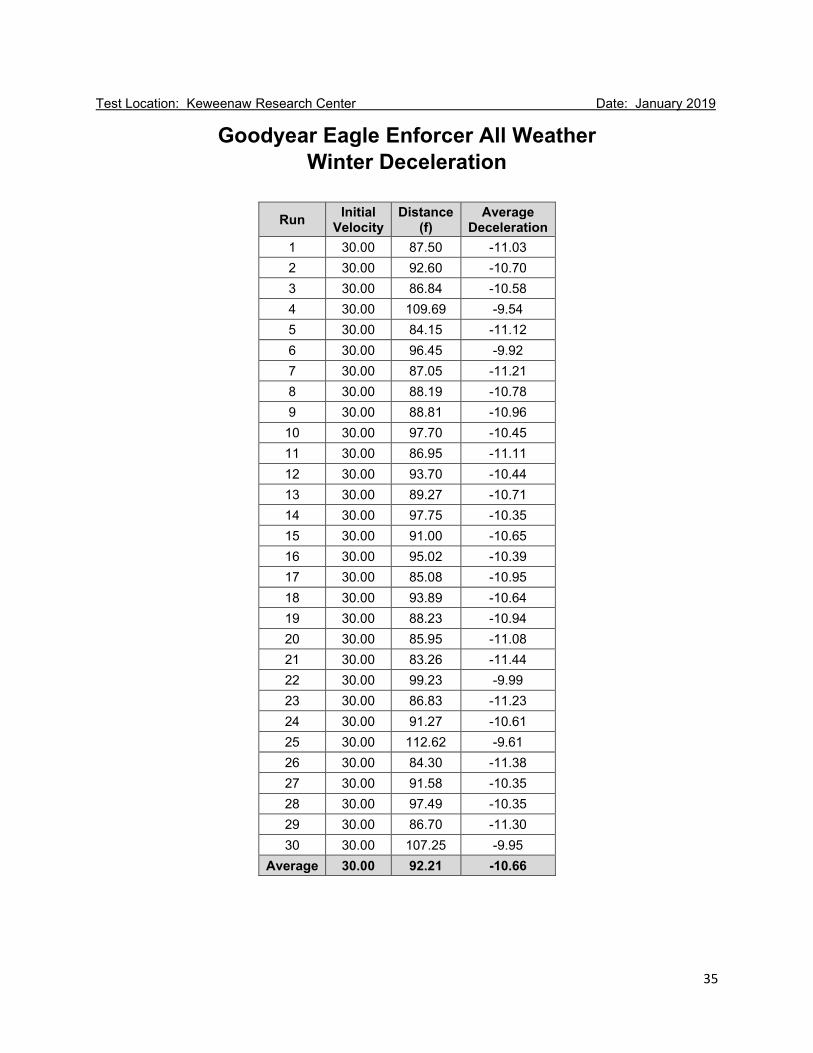
35
Test Location: Keweenaw Research Center Date: January 2019 Goodyear Eagle Enforcer All Weather
Winter Deceleration
Run Initial Velocity
Distance (f)
Average Deceleration
1 30.00 87.50 -11.03 2 30.00 92.60 -10.70 3 30.00 86.84 -10.58 4 30.00 109.69 -9.54 5 30.00 84.15 -11.12 6 30.00 96.45 -9.92 7 30.00 87.05 -11.21 8 30.00 88.19 -10.78 9 30.00 88.81 -10.96 10 30.00 97.70 -10.45 11 30.00 86.95 -11.11 12 30.00 93.70 -10.44 13 30.00 89.27 -10.71 14 30.00 97.75 -10.35 15 30.00 91.00 -10.65 16 30.00 95.02 -10.39 17 30.00 85.08 -10.95 18 30.00 93.89 -10.64 19 30.00 88.23 -10.94 20 30.00 85.95 -11.08 21 30.00 83.26 -11.44 22 30.00 99.23 -9.99 23 30.00 86.83 -11.23 24 30.00 91.27 -10.61 25 30.00 112.62 -9.61 26 30.00 84.30 -11.38 27 30.00 91.58 -10.35 28 30.00 97.49 -10.35 29 30.00 86.70 -11.30 30 30.00 107.25 -9.95
Average 30.00 92.21 -10.66
36
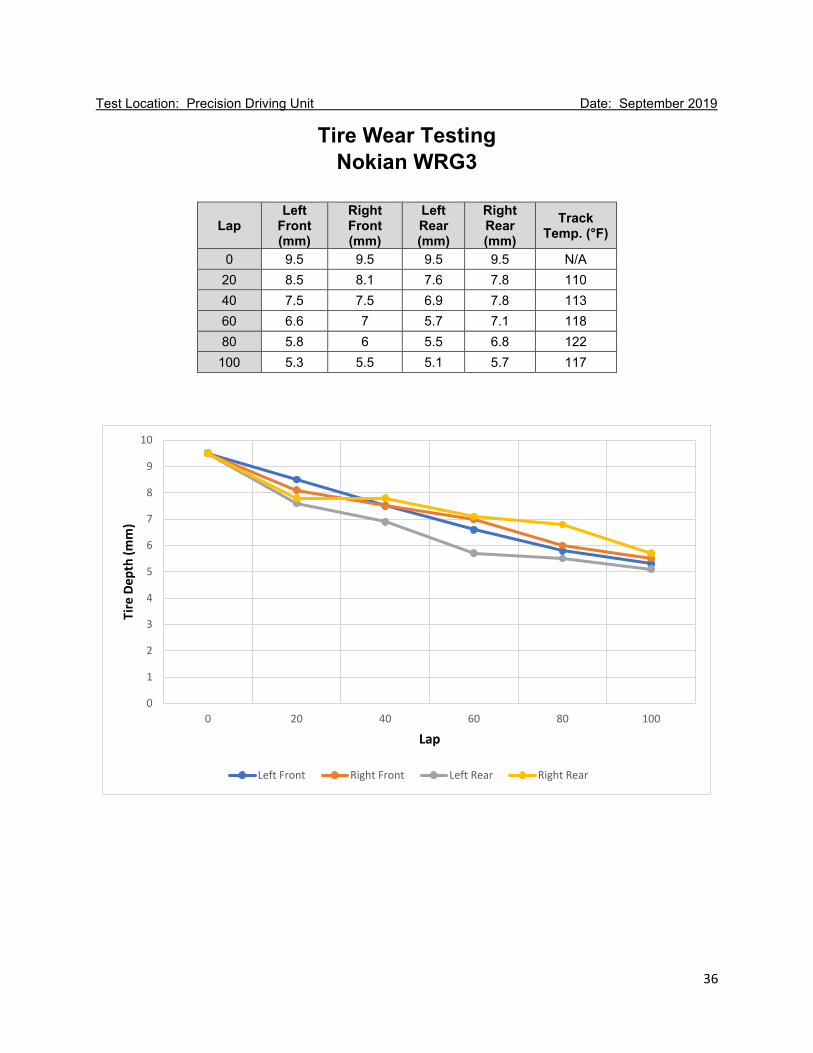
Test Location: Precision Driving Unit Date: September 2019
Tire Wear Testing Nokian WRG3
Lap
Left Front (mm)
Right Front (mm)
Left Rear (mm)
Right Rear (mm)
Track Temp. (°F)
0 9.5 9.5 9.5 9.5 N/A 20 8.5 8.1 7.6 7.8 110 40 7.5 7.5 6.9 7.8 113 60 6.6 7 5.7 7.1 118 80 5.8 6 5.5 6.8 122 100 5.3 5.5 5.1 5.7 117
0
1
2
3
4
5
6
7
8
9
10
0 20 40 60 80 100
Tire
Dep
th (m
m)
Lap
Left Front Right Front Left Rear Right Rear
37
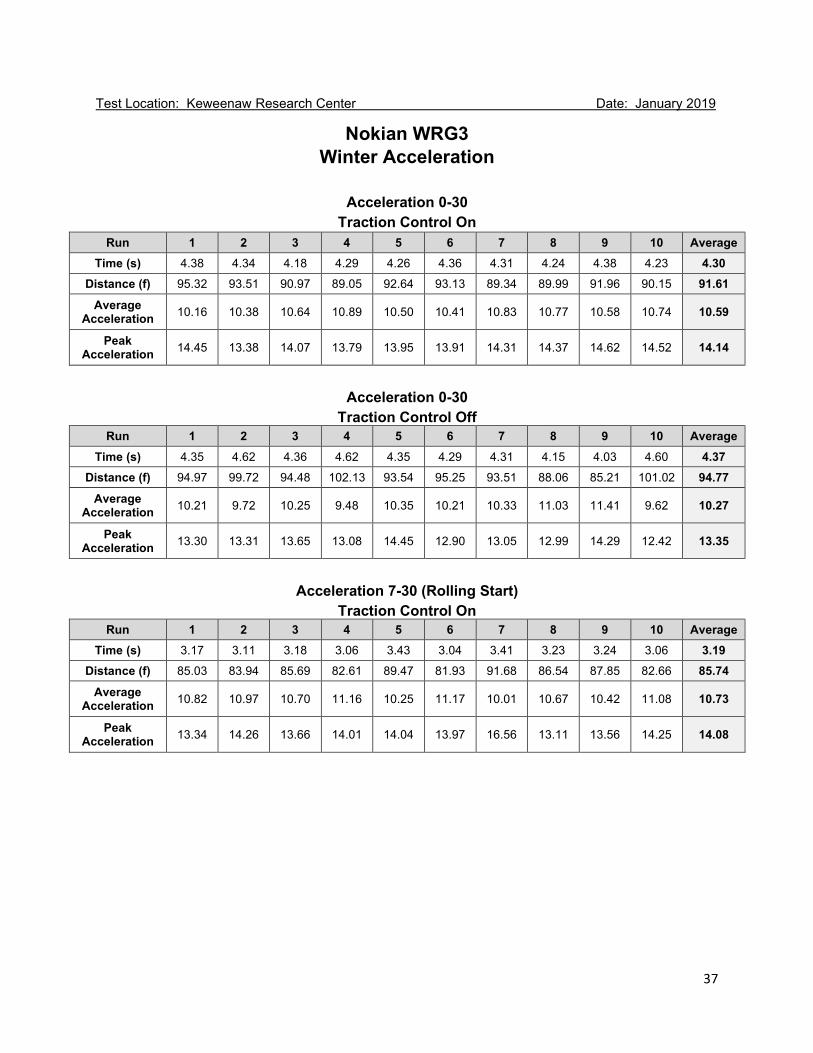
Test Location: Keweenaw Research Center Date: January 2019
Nokian WRG3 Winter Acceleration
Acceleration 0-30
Traction Control On Run 1 2 3 4 5 6 7 8 9 10 Average
Time (s) 4.38 4.34 4.18 4.29 4.26 4.36 4.31 4.24 4.38 4.23 4.30 Distance (f) 95.32 93.51 90.97 89.05 92.64 93.13 89.34 89.99 91.96 90.15 91.61
Average Acceleration 10.16 10.38 10.64 10.89 10.50 10.41 10.83 10.77 10.58 10.74 10.59
Peak Acceleration 14.45 13.38 14.07 13.79 13.95 13.91 14.31 14.37 14.62 14.52 14.14
Acceleration 0-30
Traction Control Off Run 1 2 3 4 5 6 7 8 9 10 Average
Time (s) 4.35 4.62 4.36 4.62 4.35 4.29 4.31 4.15 4.03 4.60 4.37 Distance (f) 94.97 99.72 94.48 102.13 93.54 95.25 93.51 88.06 85.21 101.02 94.77
Average Acceleration 10.21 9.72 10.25 9.48 10.35 10.21 10.33 11.03 11.41 9.62 10.27
Peak Acceleration 13.30 13.31 13.65 13.08 14.45 12.90 13.05 12.99 14.29 12.42 13.35
Acceleration 7-30 (Rolling Start)
Traction Control On Run 1 2 3 4 5 6 7 8 9 10 Average
Time (s) 3.17 3.11 3.18 3.06 3.43 3.04 3.41 3.23 3.24 3.06 3.19 Distance (f) 85.03 83.94 85.69 82.61 89.47 81.93 91.68 86.54 87.85 82.66 85.74
Average Acceleration 10.82 10.97 10.70 11.16 10.25 11.17 10.01 10.67 10.42 11.08 10.73
Peak Acceleration 13.34 14.26 13.66 14.01 14.04 13.97 16.56 13.11 13.56 14.25 14.08
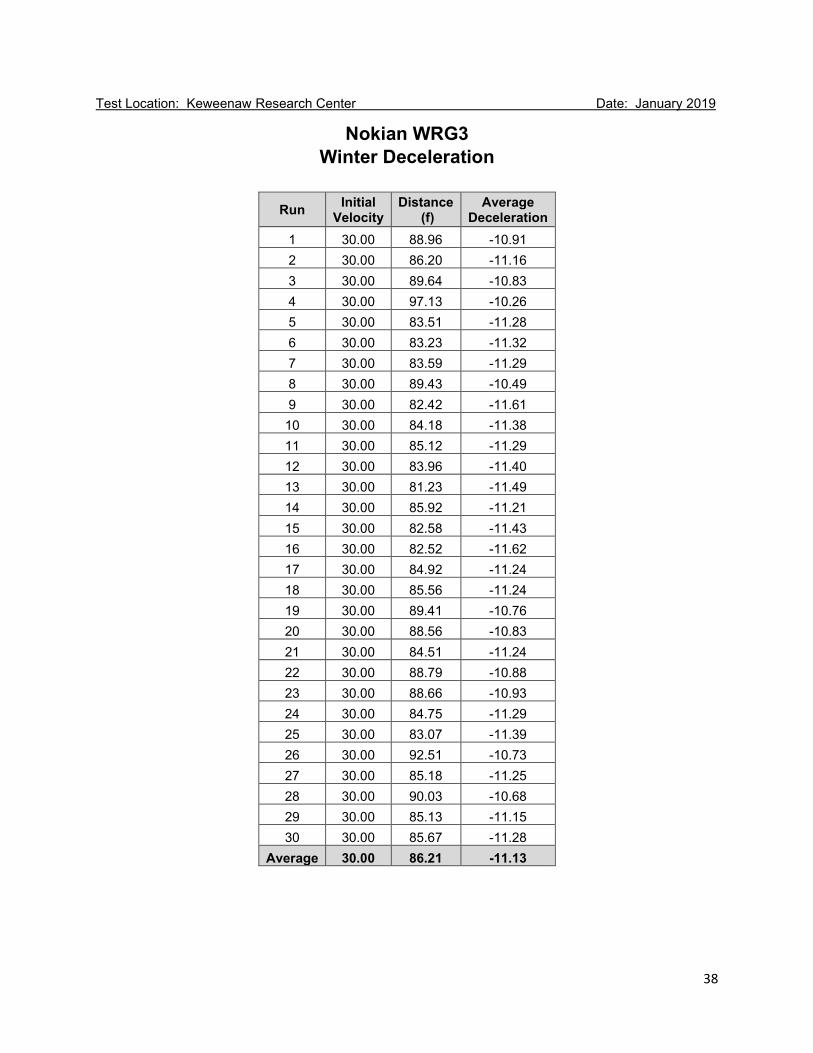
38
Test Location: Keweenaw Research Center Date: January 2019
Nokian WRG3 Winter Deceleration
Run Initial
Velocity Distance
(f) Average
Deceleration 1 30.00 88.96 -10.91 2 30.00 86.20 -11.16 3 30.00 89.64 -10.83 4 30.00 97.13 -10.26 5 30.00 83.51 -11.28 6 30.00 83.23 -11.32 7 30.00 83.59 -11.29 8 30.00 89.43 -10.49 9 30.00 82.42 -11.61 10 30.00 84.18 -11.38 11 30.00 85.12 -11.29 12 30.00 83.96 -11.40 13 30.00 81.23 -11.49 14 30.00 85.92 -11.21 15 30.00 82.58 -11.43 16 30.00 82.52 -11.62 17 30.00 84.92 -11.24 18 30.00 85.56 -11.24 19 30.00 89.41 -10.76 20 30.00 88.56 -10.83 21 30.00 84.51 -11.24 22 30.00 88.79 -10.88 23 30.00 88.66 -10.93 24 30.00 84.75 -11.29 25 30.00 83.07 -11.39 26 30.00 92.51 -10.73 27 30.00 85.18 -11.25 28 30.00 90.03 -10.68 29 30.00 85.13 -11.15 30 30.00 85.67 -11.28
Average 30.00 86.21 -11.13
39
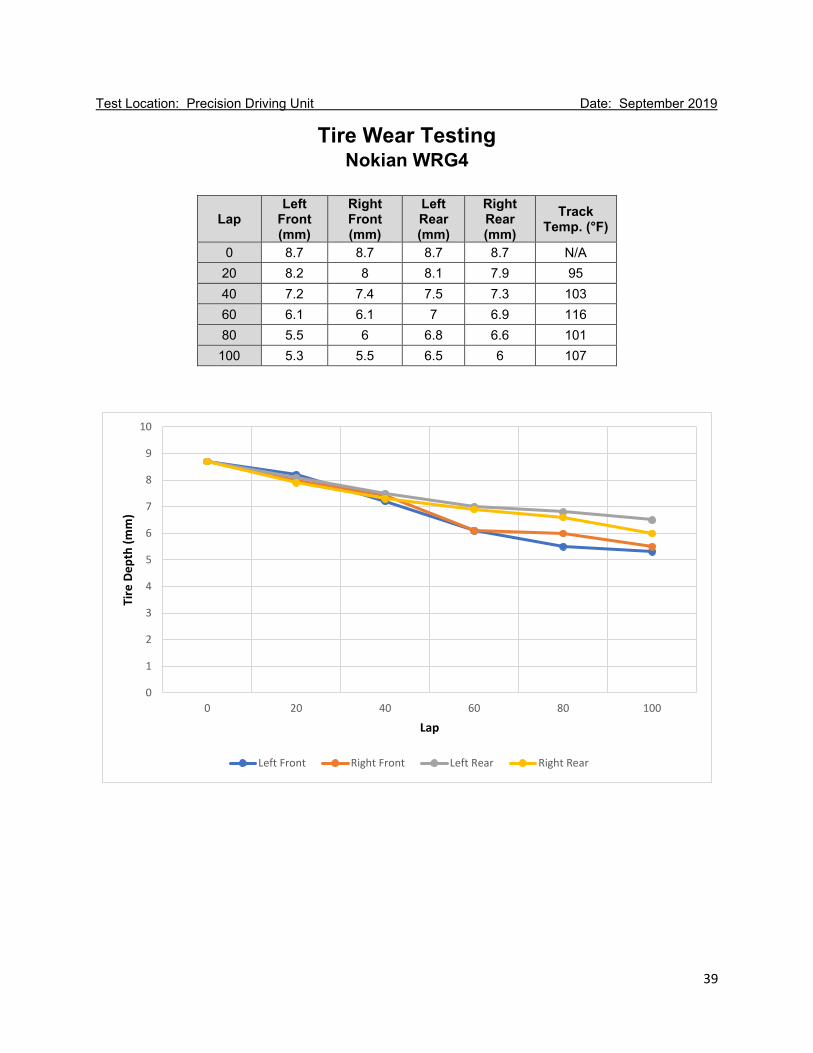
Test Location: Precision Driving Unit Date: September 2019
Tire Wear Testing Nokian WRG4
Lap Left
Front (mm)
Right Front (mm)
Left Rear (mm)
Right Rear (mm)
Track Temp. (°F)
0 8.7 8.7 8.7 8.7 N/A 20 8.2 8 8.1 7.9 95 40 7.2 7.4 7.5 7.3 103 60 6.1 6.1 7 6.9 116 80 5.5 6 6.8 6.6 101 100 5.3 5.5 6.5 6 107
0
1
2
3
4
5
6
7
8
9
10
0 20 40 60 80 100
Tire
Dep
th (m
m)
Lap
Left Front Right Front Left Rear Right Rear
40
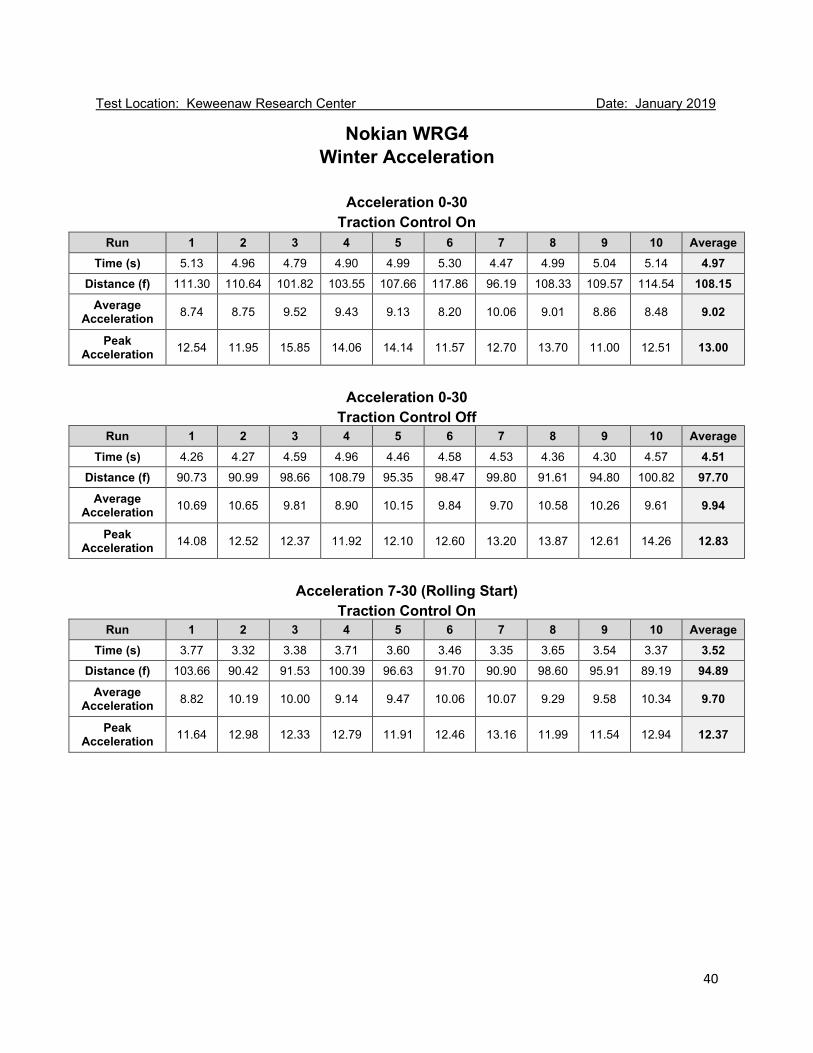
Test Location: Keweenaw Research Center Date: January 2019
Nokian WRG4 Winter Acceleration
Acceleration 0-30
Traction Control On Run 1 2 3 4 5 6 7 8 9 10 Average
Time (s) 5.13 4.96 4.79 4.90 4.99 5.30 4.47 4.99 5.04 5.14 4.97 Distance (f) 111.30 110.64 101.82 103.55 107.66 117.86 96.19 108.33 109.57 114.54 108.15
Average Acceleration 8.74 8.75 9.52 9.43 9.13 8.20 10.06 9.01 8.86 8.48 9.02
Peak Acceleration 12.54 11.95 15.85 14.06 14.14 11.57 12.70 13.70 11.00 12.51 13.00
Acceleration 0-30
Traction Control Off Run 1 2 3 4 5 6 7 8 9 10 Average
Time (s) 4.26 4.27 4.59 4.96 4.46 4.58 4.53 4.36 4.30 4.57 4.51 Distance (f) 90.73 90.99 98.66 108.79 95.35 98.47 99.80 91.61 94.80 100.82 97.70
Average Acceleration 10.69 10.65 9.81 8.90 10.15 9.84 9.70 10.58 10.26 9.61 9.94
Peak Acceleration 14.08 12.52 12.37 11.92 12.10 12.60 13.20 13.87 12.61 14.26 12.83
Acceleration 7-30 (Rolling Start)
Traction Control On Run 1 2 3 4 5 6 7 8 9 10 Average
Time (s) 3.77 3.32 3.38 3.71 3.60 3.46 3.35 3.65 3.54 3.37 3.52 Distance (f) 103.66 90.42 91.53 100.39 96.63 91.70 90.90 98.60 95.91 89.19 94.89
Average Acceleration 8.82 10.19 10.00 9.14 9.47 10.06 10.07 9.29 9.58 10.34 9.70
Peak Acceleration 11.64 12.98 12.33 12.79 11.91 12.46 13.16 11.99 11.54 12.94 12.37

41
Test Location: Keweenaw Research Center Date: January 2019
Nokian WRG4 Winter Deceleration
Run Initial
Velocity
Distance (f)
Average Deceleration
1 30.00 99.16 -9.64 2 30.00 98.06 -9.68 3 30.00 99.52 -9.40 4 30.00 100.40 -9.37 5 30.00 93.27 -10.46 6 30.00 92.40 -10.32 7 30.00 98.37 -9.90 8 30.00 100.31 -9.29 9 30.00 93.20 -10.05 10 30.00 96.73 -10.15 11 30.00 96.42 -9.96 12 30.00 104.61 -9.19 13 30.00 93.49 -10.15 14 30.00 91.02 -10.44 15 30.00 95.32 -10.07 16 30.00 93.93 -10.23 17 30.00 92.78 -10.35 18 30.00 95.37 -10.25 19 30.00 97.83 -9.56 20 30.00 93.61 -10.32 21 30.00 94.09 -10.20 22 30.00 98.01 -9.44 23 30.00 96.35 -9.96 24 30.00 92.28 -10.42 25 30.00 92.85 -10.21 26 30.00 97.67 -9.91 27 30.00 101.11 -9.55 28 30.00 93.62 -10.08 29 30.00 96.18 -9.78 30 30.00 93.57 -10.44
Average 30.00 96.05 -9.96
42
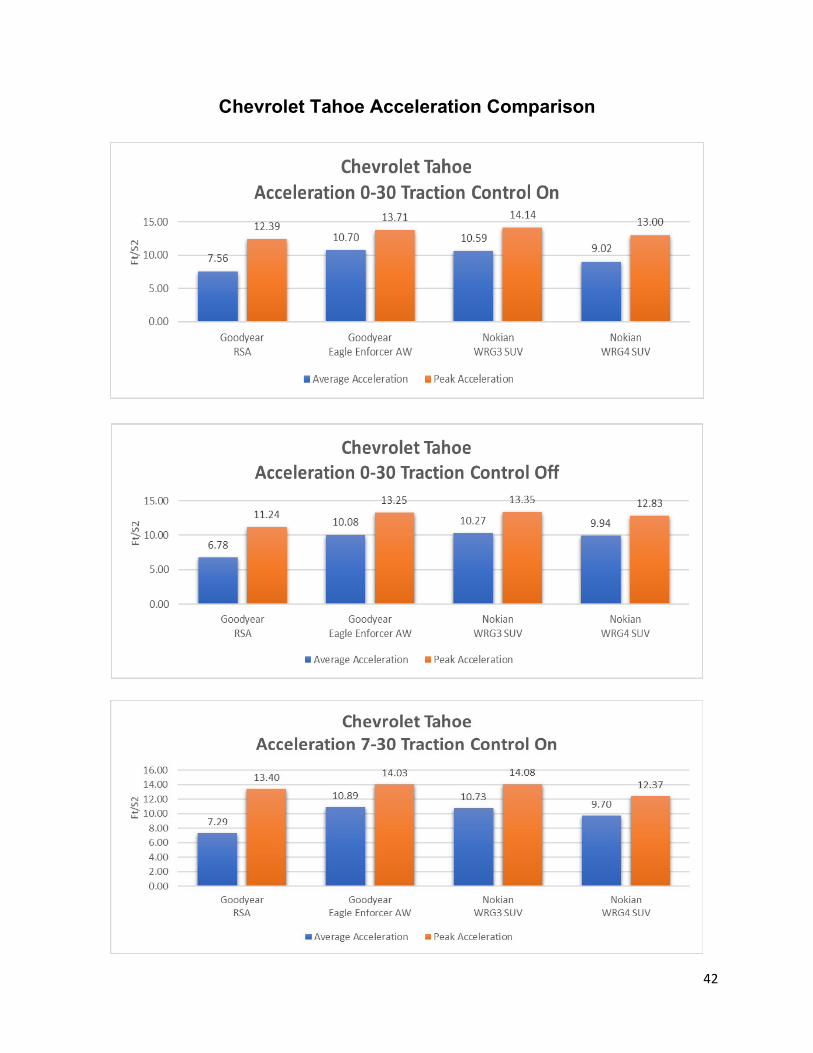
Chevrolet Tahoe Acceleration Comparison
43
Chevrolet Tahoe Deceleration Comparison
44
Ford Utility
*All tires were tested in size P245/55R18
45
Test Location: Keweenaw Research Center Date: January 2019
Goodyear Eagle RS-A Winter Acceleration
Acceleration 0-30
Traction Control On Run 1 2 3 4 5 6 7 8 9 10 Average
Time (s) 8.15 7.62 7.76 7.89 7.85 7.76 7.52 7.73 7.71 7.83 7.78 Distance (f) 171.49 169.55 167.65 167.96 168.43 163.68 158.14 163.36 169.18 168.25 166.77
Average Acceleration 5.65 5.70 5.77 5.78 5.75 5.94 6.15 5.94 5.73 5.75 5.82
Peak Acceleration 9.04 9.37 8.52 8.40 9.36 8.84 8.59 8.84 9.24 8.58 8.88
Acceleration 0-30
Traction Control Off Run 1 2 3 4 5 6 7 8 9 10 Average
Time (s) 11.08 8.28 7.02 8.42 7.51 8.84 7.35 6.71 7.10 8.56 8.09 Distance (f) 286.74 192.53 161.65 180.68 161.45 190.17 171.67 143.08 159.90 192.18 184.01
Average Acceleration 3.38 5.04 5.99 5.36 6.01 5.11 5.64 6.77 6.09 5.05 5.44
Peak Acceleration 8.35 9.22 9.27 8.30 8.87 7.33 8.65 10.26 10.58 9.65 9.05
Acceleration 7-30 (Rolling Start)
Traction Control On Run 1 2 3 4 5 6 7 8 9 10 Average
Time (s) 5.74 5.18 5.83 5.38 5.28 5.14 5.66 5.41 5.39 5.69 5.47 Distance (f) 152.21 141.28 158.80 141.47 141.00 139.92 150.16 145.52 145.99 151.88 146.82
Average Acceleration 6.02 6.48 5.77 6.50 6.49 6.54 6.10 6.32 6.27 6.03 6.25
Peak Acceleration 9.16 9.01 9.22 9.72 8.65 9.16 9.15 8.97 9.58 8.70 9.13
46
Test Location: Keweenaw Research Center Date: January 2019
Goodyear Eagle RS-A Winter Deceleration
Run Initial
Velocity Distance
(f) Average
Deceleration 1 30.00 122.32 -8.08 2 30.00 139.18 -7.21 3 30.00 128.37 -7.72 4 30.00 127.20 -7.77 5 30.00 130.15 -7.55 6 30.00 121.14 -8.09 7 30.00 134.68 -7.32 8 30.00 123.70 -7.95 9 30.00 131.73 -7.49 10 30.00 123.38 -8.03 11 30.00 125.27 -7.90 12 30.00 125.56 -7.83 13 30.00 127.76 -7.81 14 30.00 140.17 -7.32 15 30.00 128.99 -7.63 16 30.00 123.56 -7.86 17 30.00 121.64 -8.14 18 30.00 128.08 -7.61 19 30.00 153.01 -6.98 20 30.00 127.78 -7.83 21 30.00 125.99 -8.01 22 30.00 120.27 -8.33 23 30.00 119.58 -8.35 24 30.00 120.61 -8.12 25 30.00 120.62 -8.40 26 30.00 124.94 -7.8 27 30.00 120.55 -8.23 28 30.00 124.04 -7.93 29 30.00 128.90 -7.98 30 30.00 123.63 -8.08
Average 30.00 127.09 -7.85
47
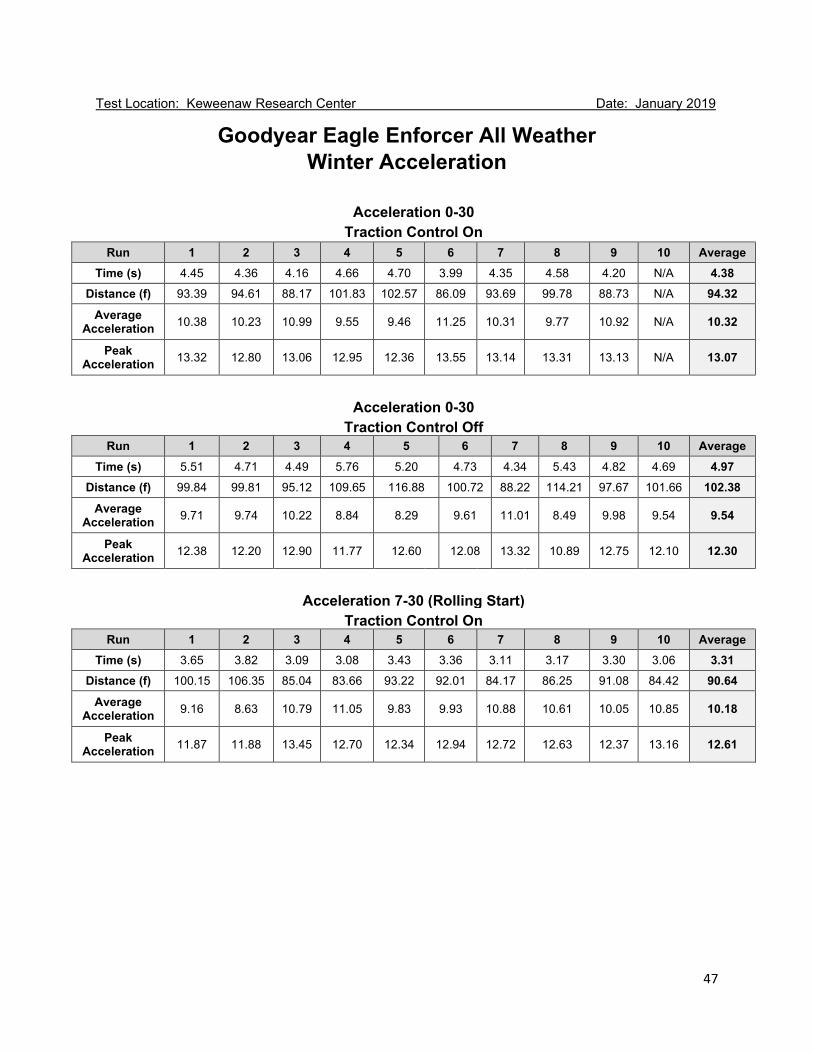
Test Location: Keweenaw Research Center Date: January 2019
Goodyear Eagle Enforcer All Weather Winter Acceleration
Acceleration 0-30
Traction Control On Run 1 2 3 4 5 6 7 8 9 10 Average
Time (s) 4.45 4.36 4.16 4.66 4.70 3.99 4.35 4.58 4.20 N/A 4.38 Distance (f) 93.39 94.61 88.17 101.83 102.57 86.09 93.69 99.78 88.73 N/A 94.32
Average Acceleration 10.38 10.23 10.99 9.55 9.46 11.25 10.31 9.77 10.92 N/A 10.32
Peak Acceleration 13.32 12.80 13.06 12.95 12.36 13.55 13.14 13.31 13.13 N/A 13.07
Acceleration 0-30
Traction Control Off Run 1 2 3 4 5 6 7 8 9 10 Average
Time (s) 5.51 4.71 4.49 5.76 5.20 4.73 4.34 5.43 4.82 4.69 4.97 Distance (f) 99.84 99.81 95.12 109.65 116.88 100.72 88.22 114.21 97.67 101.66 102.38
Average Acceleration 9.71 9.74 10.22 8.84 8.29 9.61 11.01 8.49 9.98 9.54 9.54
Peak Acceleration 12.38 12.20 12.90 11.77 12.60 12.08 13.32 10.89 12.75 12.10 12.30
Acceleration 7-30 (Rolling Start)
Traction Control On Run 1 2 3 4 5 6 7 8 9 10 Average
Time (s) 3.65 3.82 3.09 3.08 3.43 3.36 3.11 3.17 3.30 3.06 3.31 Distance (f) 100.15 106.35 85.04 83.66 93.22 92.01 84.17 86.25 91.08 84.42 90.64
Average Acceleration 9.16 8.63 10.79 11.05 9.83 9.93 10.88 10.61 10.05 10.85 10.18
Peak Acceleration 11.87 11.88 13.45 12.70 12.34 12.94 12.72 12.63 12.37 13.16 12.61
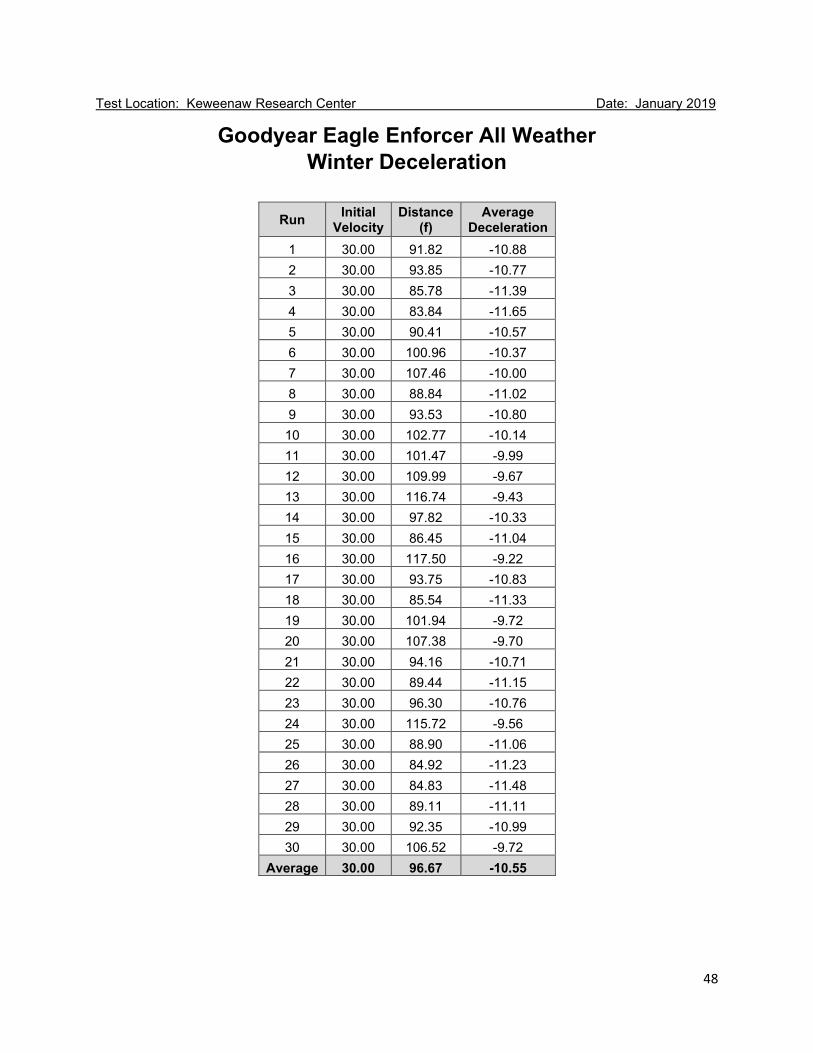
48
Test Location: Keweenaw Research Center Date: January 2019 Goodyear Eagle Enforcer All Weather
Winter Deceleration
Run Initial Velocity
Distance (f)
Average Deceleration
1 30.00 91.82 -10.88 2 30.00 93.85 -10.77 3 30.00 85.78 -11.39 4 30.00 83.84 -11.65 5 30.00 90.41 -10.57 6 30.00 100.96 -10.37 7 30.00 107.46 -10.00 8 30.00 88.84 -11.02 9 30.00 93.53 -10.80 10 30.00 102.77 -10.14 11 30.00 101.47 -9.99 12 30.00 109.99 -9.67 13 30.00 116.74 -9.43 14 30.00 97.82 -10.33 15 30.00 86.45 -11.04 16 30.00 117.50 -9.22 17 30.00 93.75 -10.83 18 30.00 85.54 -11.33 19 30.00 101.94 -9.72 20 30.00 107.38 -9.70 21 30.00 94.16 -10.71 22 30.00 89.44 -11.15 23 30.00 96.30 -10.76 24 30.00 115.72 -9.56 25 30.00 88.90 -11.06 26 30.00 84.92 -11.23 27 30.00 84.83 -11.48 28 30.00 89.11 -11.11 29 30.00 92.35 -10.99 30 30.00 106.52 -9.72
Average 30.00 96.67 -10.55
49
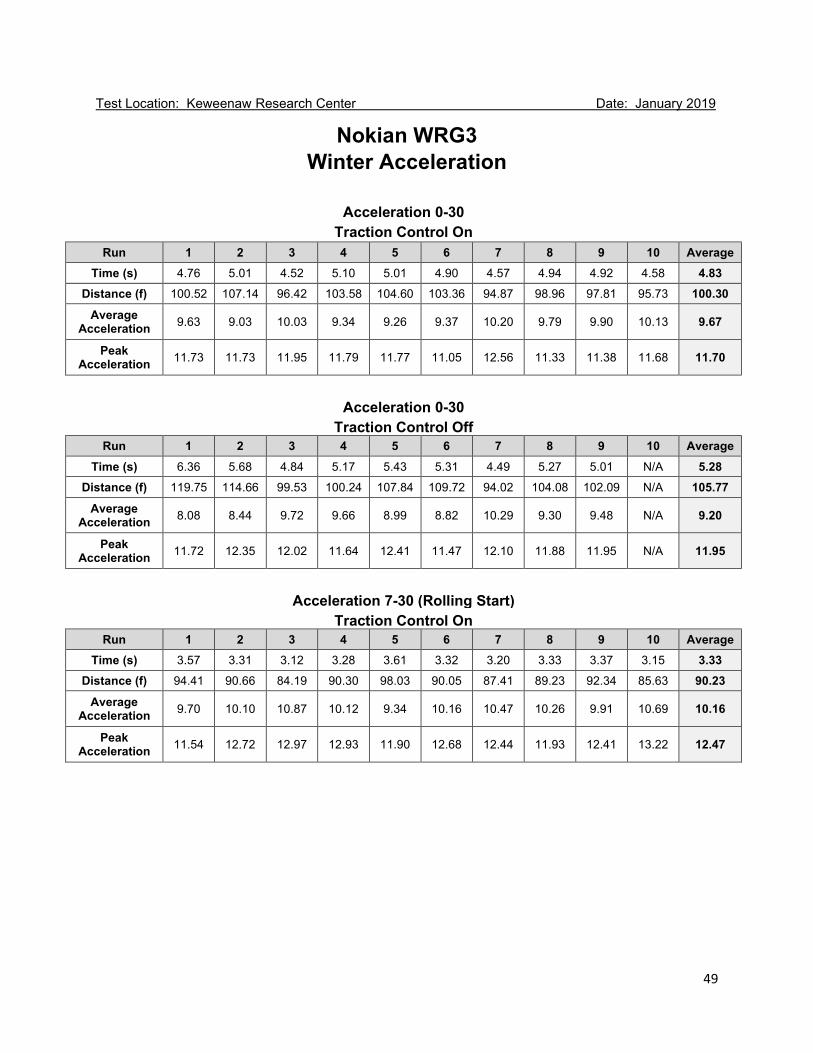
Test Location: Keweenaw Research Center Date: January 2019
Nokian WRG3 Winter Acceleration
Acceleration 0-30
Traction Control On Run 1 2 3 4 5 6 7 8 9 10 Average
Time (s) 4.76 5.01 4.52 5.10 5.01 4.90 4.57 4.94 4.92 4.58 4.83 Distance (f) 100.52 107.14 96.42 103.58 104.60 103.36 94.87 98.96 97.81 95.73 100.30
Average Acceleration 9.63 9.03 10.03 9.34 9.26 9.37 10.20 9.79 9.90 10.13 9.67
Peak Acceleration 11.73 11.73 11.95 11.79 11.77 11.05 12.56 11.33 11.38 11.68 11.70
Acceleration 0-30
Traction Control Off Run 1 2 3 4 5 6 7 8 9 10 Average
Time (s) 6.36 5.68 4.84 5.17 5.43 5.31 4.49 5.27 5.01 N/A 5.28 Distance (f) 119.75 114.66 99.53 100.24 107.84 109.72 94.02 104.08 102.09 N/A 105.77
Average Acceleration 8.08 8.44 9.72 9.66 8.99 8.82 10.29 9.30 9.48 N/A 9.20
Peak Acceleration 11.72 12.35 12.02 11.64 12.41 11.47 12.10 11.88 11.95 N/A 11.95
Acceleration 7-30 (Rolling Start)
Traction Control On Run 1 2 3 4 5 6 7 8 9 10 Average
Time (s) 3.57 3.31 3.12 3.28 3.61 3.32 3.20 3.33 3.37 3.15 3.33 Distance (f) 94.41 90.66 84.19 90.30 98.03 90.05 87.41 89.23 92.34 85.63 90.23
Average Acceleration 9.70 10.10 10.87 10.12 9.34 10.16 10.47 10.26 9.91 10.69 10.16
Peak Acceleration 11.54 12.72 12.97 12.93 11.90 12.68 12.44 11.93 12.41 13.22 12.47
50
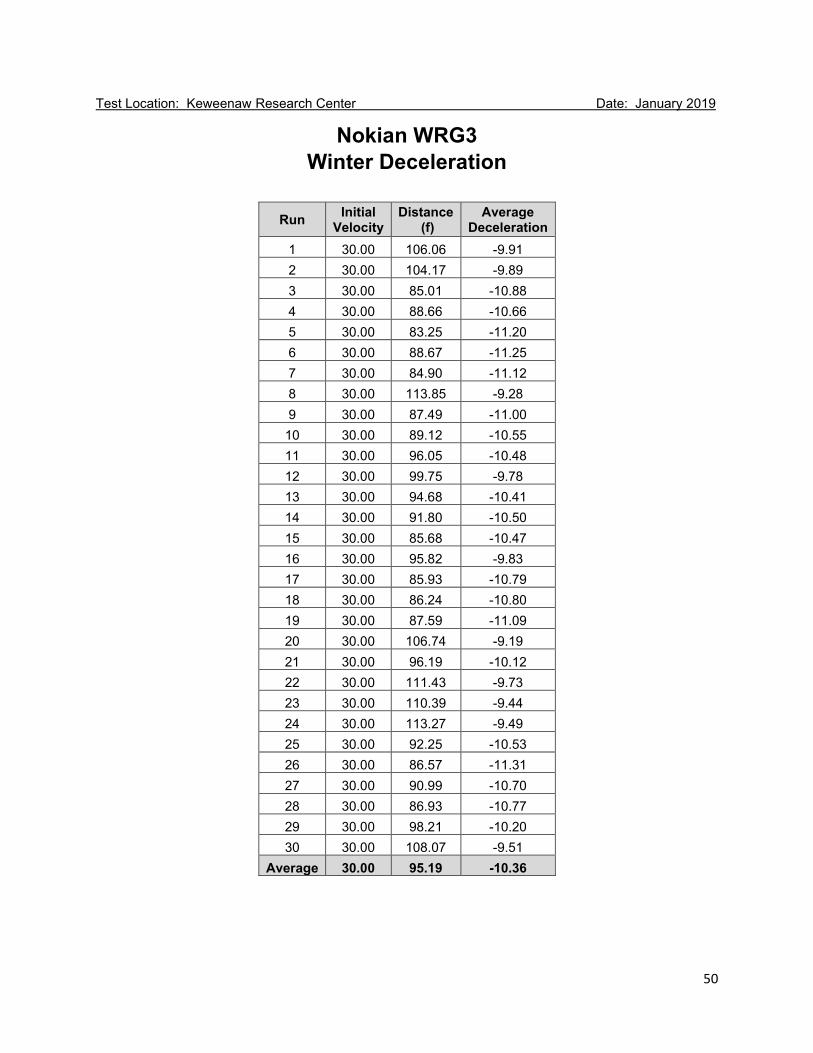
Test Location: Keweenaw Research Center Date: January 2019
Nokian WRG3 Winter Deceleration
Run Initial
Velocity Distance
(f) Average
Deceleration 1 30.00 106.06 -9.91 2 30.00 104.17 -9.89 3 30.00 85.01 -10.88 4 30.00 88.66 -10.66 5 30.00 83.25 -11.20 6 30.00 88.67 -11.25 7 30.00 84.90 -11.12 8 30.00 113.85 -9.28 9 30.00 87.49 -11.00 10 30.00 89.12 -10.55 11 30.00 96.05 -10.48 12 30.00 99.75 -9.78 13 30.00 94.68 -10.41 14 30.00 91.80 -10.50 15 30.00 85.68 -10.47 16 30.00 95.82 -9.83 17 30.00 85.93 -10.79 18 30.00 86.24 -10.80 19 30.00 87.59 -11.09 20 30.00 106.74 -9.19 21 30.00 96.19 -10.12 22 30.00 111.43 -9.73 23 30.00 110.39 -9.44 24 30.00 113.27 -9.49 25 30.00 92.25 -10.53 26 30.00 86.57 -11.31 27 30.00 90.99 -10.70 28 30.00 86.93 -10.77 29 30.00 98.21 -10.20 30 30.00 108.07 -9.51
Average 30.00 95.19 -10.36

51
Test Location: Keweenaw Research Center Date: January 2019
Nokian WRG4 Winter Acceleration
Acceleration 0-30
Traction Control On Run 1 2 3 4 5 6 7 8 9 10 Average
Time (s) 4.74 4.52 4.61 4.56 4.38 4.22 4.76 4.69 4.01 N/A 4.50 Distance (f) 96.25 97.04 92.93 97.65 94.82 89.47 89.46 102.44 85.57 N/A 93.96
Average Acceleration 10.05 9.96 10.41 9.90 10.21 10.82 10.83 9.45 11.31 N/A 10.33
Peak Acceleration 12.29 12.17 12.64 12.34 12.63 12.92 12.96 12.43 13.26 N/A 12.63
Acceleration 0-30
Traction Control Off Run 1 2 3 4 5 6 7 8 9 10 Average
Time (s) 5.63 5.93 4.27 4.98 4.48 4.56 4.54 4.68 5.21 4.64 4.81 Distance (f) 114.35 118.25 87.04 109.44 95.77 96.69 89.04 95.15 113.32 93.29 99.78
Average Acceleration 8.47 8.18 11.14 8.85 10.11 10.01 10.87 10.18 8.54 10.39 9.81
Peak Acceleration 12.23 12.06 12.59 11.57 13.62 13.39 13.41 12.75 12.55 13.07 12.78
Acceleration 7-30 (Rolling Start)
Traction Control On Run 1 2 3 4 5 6 7 8 9 10 Average
Time (s) 3.42 3.11 3.11 2.94 3.45 3.07 3.02 3.21 3.29 N/A 3.18 Distance (f) 95.61 84.87 84.07 80.79 92.20 82.12 83.29 90.34 88.10 N/A 86.82
Average Acceleration 9.58 10.78 10.89 11.33 9.93 11.15 10.99 10.12 10.40 N/A 10.57
Peak Acceleration 13.28 13.73 12.86 14.45 13.43 13.20 13.53 13.37 13.46 N/A 13.48

52
Test Location: Keweenaw Research Center Date: January 2019
Nokian WRG4 Winter Deceleration
Run Initial
Velocity Distance
(f) Average
Deceleration 1 30.00 90.30 -10.91 2 30.00 111.65 -9.76 3 30.00 95.47 -10.34 4 30.00 86.06 -11.10 5 30.00 80.65 -11.84 6 30.00 87.32 -11.20 7 30.00 89.80 -10.49 8 30.00 108.10 -9.92 9 30.00 95.79 -10.83 10 30.00 85.70 -11.20 11 30.00 80.94 -11.13 12 30.00 82.90 -10.98 13 30.00 83.62 -11.12 14 30.00 95.40 -9.99 15 30.00 83.41 -11.10 16 30.00 79.86 -11.62 17 30.00 98.05 -10.38 18 30.00 105.12 -9.99 19 30.00 109.15 -9.56 20 30.00 106.09 -9.61 21 30.00 102.24 -9.75 22 30.00 128.90 -9.03 23 30.00 110.07 -9.28 24 30.00 92.66 -10.85 25 30.00 78.01 -11.41 26 30.00 96.23 -10.49 27 30.00 120.14 -9.06 28 30.00 91.50 -10.94 29 30.00 92.68 -10.69 30 N/A N/A N/A
Average 30.00 95.44 -10.50
53
Test Location: Keweenaw Research Center Date: January 2019
TOYO Celsius AW Winter Acceleration
Acceleration 0-30
Traction Control On Run 1 2 3 4 5 6 7 8 9 10 Average
Time (s) 5.03 4.80 5.03 4.43 4.67 4.44 4.76 4.37 4.73 4.42 4.67 Distance (f) 103.42 102.92 110.19 94.84 100.60 94.17 103.84 93.56 103.27 93.59 100.04
Average Acceleration 9.36 9.40 8.79 10.21 9.64 10.28 9.32 10.36 9.38 10.34 9.71
Peak Acceleration 11.43 11.47 11.17 12.86 12.31 12.56 11.04 12.68 11.37 12.35 11.92
Acceleration 0-30
Traction Control Off Run 1 2 3 4 5 6 7 8 9 10 Average
Time (s) 5.48 5.48 5.12 5.03 5.89 5.39 5.10 4.94 6.32 5.92 5.47 Distance (f) 117.33 116.64 116.82 107.69 115.17 114.07 107.66 104.46 131.88 133.64 116.54
Average Acceleration 8.26 8.30 8.30 9.00 8.41 8.55 9.00 9.28 7.34 7.29 8.37
Peak Acceleration 12.16 11.73 12.57 11.79 11.87 12.11 11.82 11.71 11.11 11.19 11.81
Acceleration 7-30 (Rolling Start)
Traction Control On Run 1 2 3 4 5 6 7 8 9 10 Average
Time (s) 3.70 3.10 3.45 3.20 3.25 3.05 3.53 3.27 3.26 3.14 3.30 Distance (f) 99.10 83.98 95.71 87.99 88.60 82.62 96.06 88.60 89.35 85.77 89.78
Average Acceleration 9.26 10.90 9.61 10.46 10.37 11.08 9.53 10.36 10.26 10.67 10.25
Peak Acceleration 11.92 12.32 12.15 12.69 11.99 12.49 11.67 12.84 12.55 12.58 12.32
54
Test Location: Keweenaw Research Center Date: January 2019
TOYO Celsius AW Winter Deceleration
Run Initial
Velocity Distance
(f) Average
Deceleration 1 30.00 90.49 -10.89 2 30.00 88.70 -11.26 3 30.00 100.76 -10.21 4 30.00 92.53 -10.61 5 30.00 95.70 -10.31 6 30.00 90.24 -10.56 7 30.00 87.02 -11.32 8 30.00 93.64 -10.68 9 30.00 85.44 -11.14 10 30.00 88.58 -10.72 11 30.00 97.14 -10.41 12 30.00 88.45 -10.46 13 30.00 97.26 -10.30 14 30.00 87.44 -10.98 15 30.00 86.23 -10.89 16 30.00 90.19 -10.45 17 30.00 86.44 -11.04 18 30.00 87.63 -11.03 19 30.00 86.58 -10.80 20 30.00 90.90 -10.97 21 30.00 93.86 -10.83 22 30.00 99.20 -10.35 23 30.00 90.07 -11.12 24 30.00 85.09 -11.45 25 30.00 87.70 -11.45 26 30.00 90.40 -10.75 27 30.00 101.72 -10.34 28 30.00 84.61 -11.44 29 30.00 93.81 -10.55 30 30.00 85.45 -11.36
Average 30.00 90.78 -10.82

55
Test Location: Keweenaw Research Center Date: January 2019
TOYO Observe Winter GSi-6 HP Winter Acceleration
Acceleration 0-30
Traction Control On Run 1 2 3 4 5 6 7 8 9 10 Average
Time (s) 4.06 3.84 4.11 4.16 3.89 4.25 4.13 4.09 3.81 4.17 4.05 Distance (f) 88.85 82.49 84.30 92.68 82.12 92.88 85.83 88.96 81.93 91.35 87.14
Average Acceleration 10.91 11.74 11.52 10.44 11.78 10.45 11.28 10.88 11.87 10.65 11.15
Peak Acceleration 14.19 13.81 14.18 13.90 14.02 12.99 15.21 14.07 14.52 13.08 14.00
Acceleration 0-30
Traction Control Off Run 1 2 3 4 5 6 7 8 9 10 Average
Time (s) 3.93 4.52 5.04 4.17 4.51 4.82 4.49 4.17 4.61 5.13 4.54 Distance (f) 82.32 98.25 103.22 86.44 96.88 103.49 94.86 83.68 97.46 102.06 94.87
Average Acceleration 11.79 9.88 9.39 11.20 9.99 9.37 10.21 11.57 10.02 9.49 10.29
Peak Acceleration 15.15 12.90 12.52 14.27 13.17 12.46 11.90 14.77 11.80 11.97 13.09
Acceleration 7-30 (Rolling Start)
Traction Control On Run 1 2 3 4 5 6 7 8 9 10 Average
Time (s) 3.18 3.11 2.93 3.09 3.42 3.49 2.97 2.89 3.34 2.90 3.13 Distance (f) 86.12 84.17 79.62 84.59 95.01 92.40 80.19 78.44 91.77 78.52 85.08
Average Acceleration 10.68 10.88 11.49 10.81 9.61 9.92 11.42 11.67 9.96 11.67 10.81
Peak Acceleration 13.17 13.93 13.73 13.16 13.73 12.31 14.38 14.05 12.42 14.10 13.50
56
Test Location: Keweenaw Research Center Date: January 2019
TOYO Observe Winter GSi-6 HP Winter Deceleration
Run Initial
Velocity Distance
(f) Average
Deceleration 1 30.00 85.96 -11.57 2 30.00 85.46 -11.52 3 30.00 92.48 -11.17 4 30.00 96.25 -10.88 5 30.00 78.84 -12.27 6 30.00 94.17 -10.93 7 30.00 109.73 -10.08 8 30.00 81.46 -11.94 9 30.00 82.49 -11.90 10 30.00 81.23 -11.88 11 30.00 83.30 -10.99 12 30.00 77.17 -12.39 13 30.00 82.51 -11.58 14 30.00 81.88 -11.93 15 30.00 76.96 -12.23 16 30.00 80.38 -11.92 17 30.00 100.07 -10.74 18 30.00 86.79 -11.34 19 30.00 81.61 -11.23 20 30.00 80.26 -12.02 21 30.00 97.60 -10.83 22 30.00 106.56 -10.44 23 30.00 83.01 -11.41 24 30.00 83.35 -11.75 25 30.00 83.34 -11.43 26 30.00 74.07 -12.84 27 30.00 95.94 -10.64 28 30.00 96.92 -10.66 29 30.00 103.73 -10.06 30 30.00 102.05 -10.05
Average 30.00 88.19 -11.35
57
Ford Utility Acceleration Comparison
5.82
10.32 11.159.71 9.67 10.33
8.88
13.07 14.0011.92 11.70 12.63
0.00
5.00
10.00
15.00
GoodyearRSA
GoodyearEagle Enforcer
AW
ToyoObserve Winter
ToyoCelsius AW
NokianWRG3
NokianWRG4
Ft/S
2
Ford UtilityAcceleration 0-30 Traction Control On
Average Acceleration Peak Acceleration
5.44
9.54 10.298.37 9.20 9.819.05
12.30 13.0911.81 11.95 12.78
0.002.004.006.008.00
10.0012.0014.00
GoodyearRSA
GoodyearEagle Enforcer
AW
ToyoObserve Winter
ToyoCelsius AW
NokianWRG3
NokianWRG4
Ft/S
2
Ford UtilityAcceleration 0-30 Traction Control Off
Average Acceleration Peak Acceleration
6.25
10.18 10.81 10.25 10.16 10.579.13
12.61 13.5012.32 12.47 13.48
0.002.004.006.008.00
10.0012.0014.0016.00
GoodyearRSA
GoodyearEagle Enforcer
AW
ToyoObserve Winter
ToyoCelsius AW
NokianWRG3
NokianWRG4
Ft/S
2
Ford UtilityAcceleration 7-30 Traction Control On
Average Acceleration Peak Acceleration
58
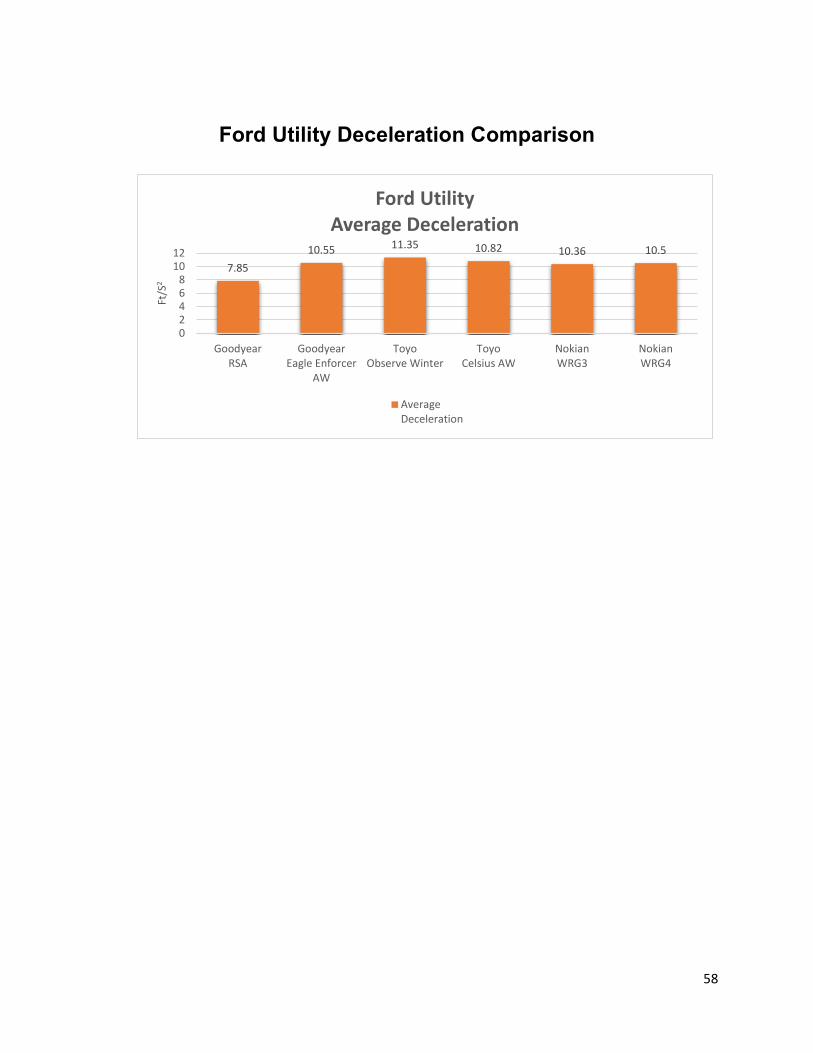
Ford Utility Deceleration Comparison
7.8510.55 11.35 10.82 10.36 10.5
02468
1012
GoodyearRSA
GoodyearEagle Enforcer
AW
ToyoObserve Winter
ToyoCelsius AW
NokianWRG3
NokianWRG4
Ft/S
2
Ford UtilityAverage Deceleration
AverageDeceleration