Embed Size (px)
Citation preview
5/23/2017
1
Continuous Improvement: Process Improvement MeasurementSolving Problems That Change Lives
Minnesota Department of Administration | mn.gov/admin
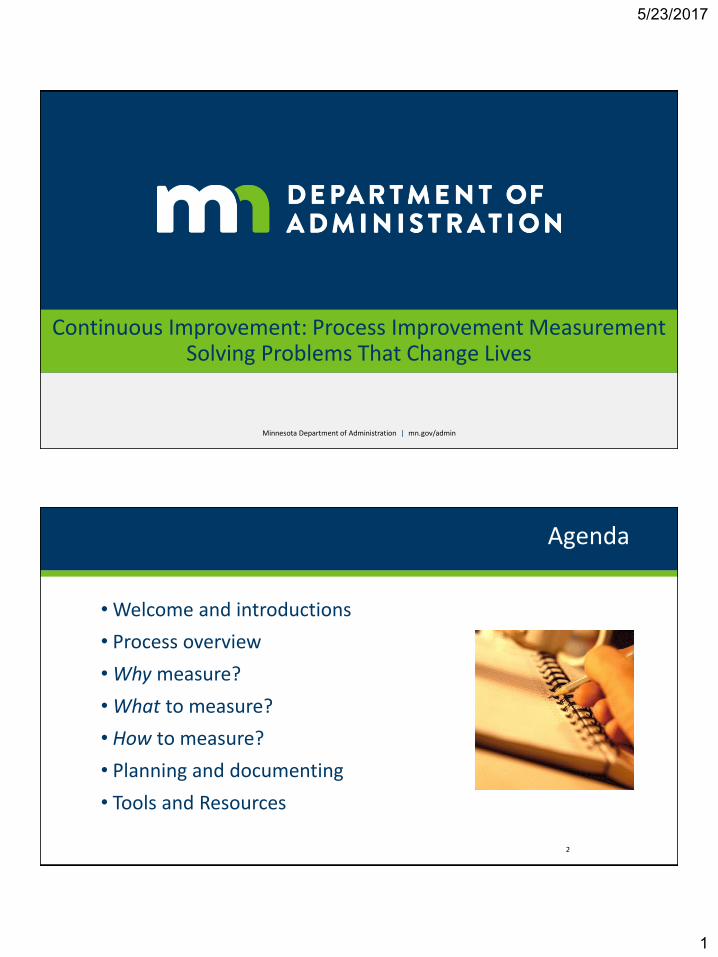
• Welcome and introductions
• Process overview
• Why measure?
• What to measure?
• How to measure?
• Planning and documenting
• Tools and Resources
Agenda
2
5/23/2017
2
• Understand where measures fit in the improvement cycle
• Describe the importance of process measurement
• Understand how to use data to guide and sustain improvements
• Identify tools for collecting and displaying data to use for continuous improvement
Learning Objectives
3
The Reality: Where are we now?
4
5/23/2017
3
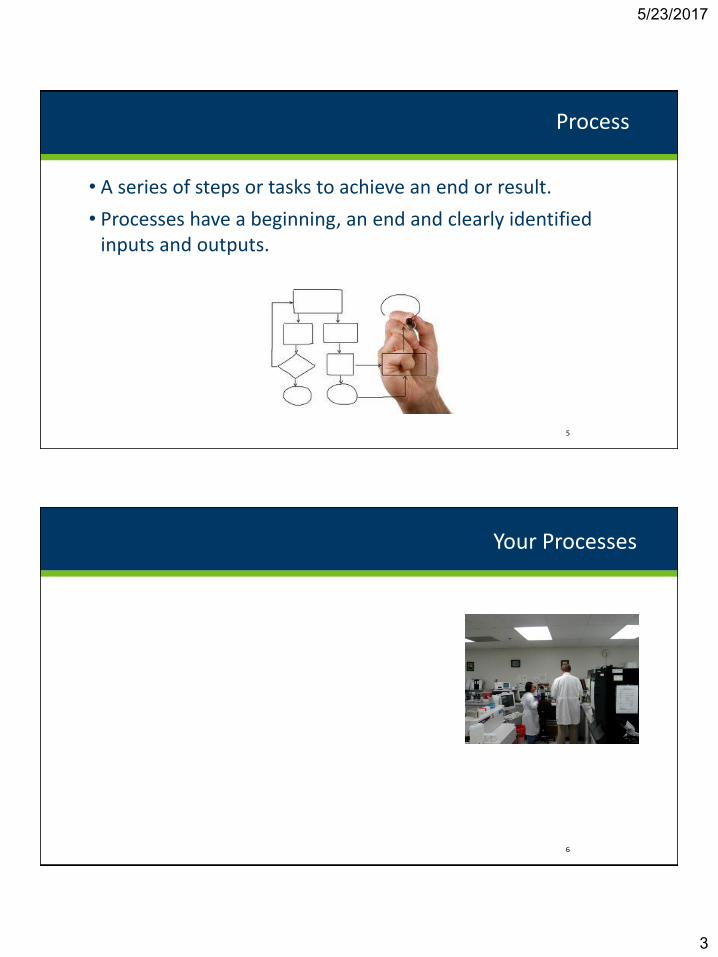
• A series of steps or tasks to achieve an end or result.
• Processes have a beginning, an end and clearly identified inputs and outputs.
Process
5
Your Processes
6
5/23/2017
4
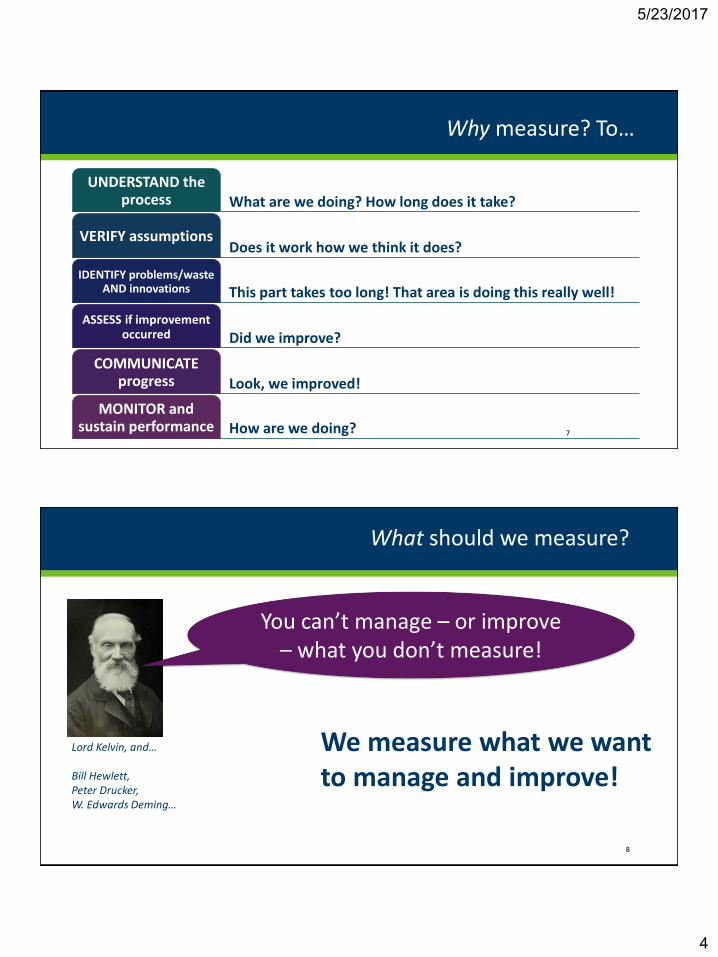
Why measure? To…
UNDERSTAND the process
VERIFY assumptions
IDENTIFY problems/waste AND innovations
ASSESS if improvement occurred
COMMUNICATE progress
MONITOR and sustain performance
7
What are we doing? How long does it take?
Does it work how we think it does?
This part takes too long! That area is doing this really well!
Did we improve?
Look, we improved!
How are we doing?
What should we measure?
8
Lord Kelvin, and…
Bill Hewlett,Peter Drucker,W. Edwards Deming…
You can’t manage – or improve – what you don’t measure!
We measure what we want to manage and improve!
5/23/2017
5
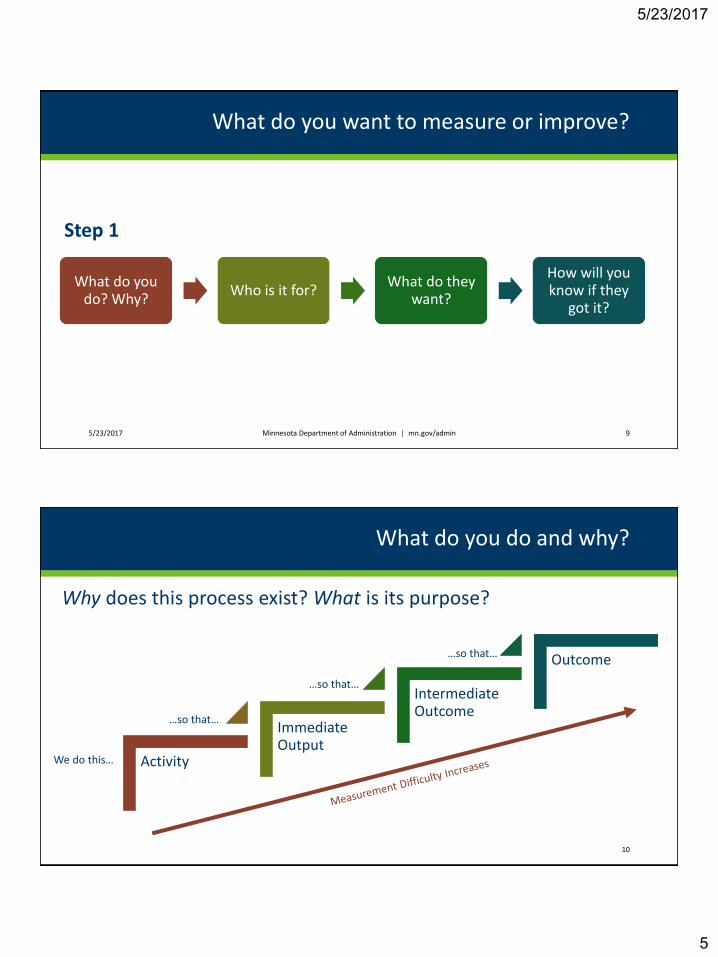
What do you want to measure or improve?
What do you do? Why?
Who is it for?What do they
want?
How will you know if they
got it?
5/23/2017 Minnesota Department of Administration | mn.gov/admin 9
Step 1
What do you do and why?
Why does this process exist? What is its purpose?
10
Activity
Immediate Output
Intermediate Outcome
Outcome
We do this…
…so that…
…so that…
…so that…
5/23/2017
6
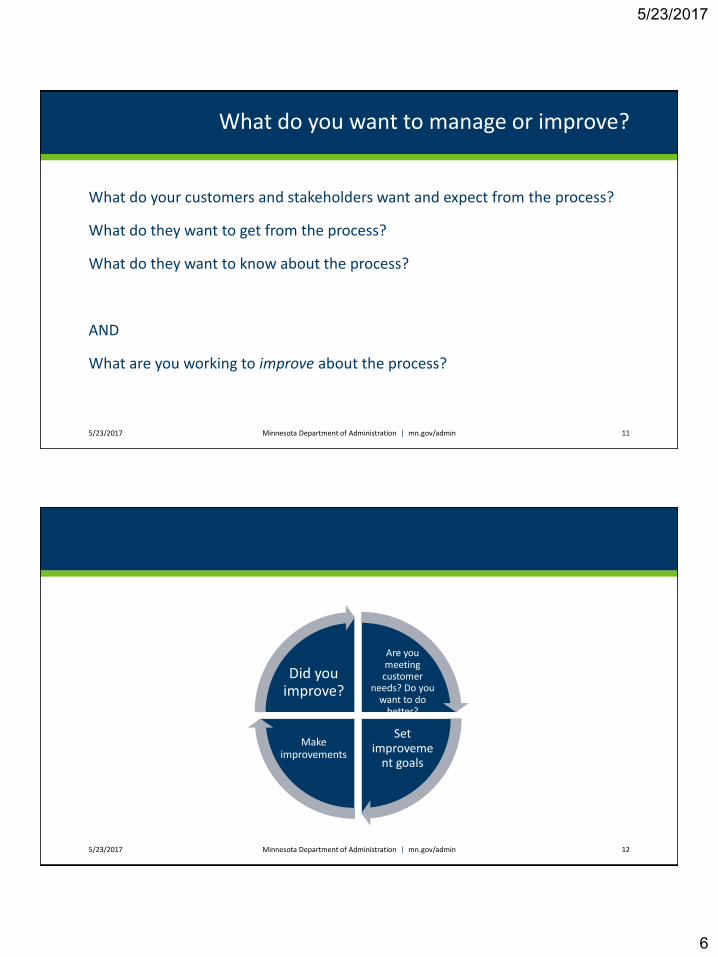
What do you want to manage or improve?
What do your customers and stakeholders want and expect from the process?
What do they want to get from the process?
What do they want to know about the process?
AND
What are you working to improve about the process?
5/23/2017 Minnesota Department of Administration | mn.gov/admin 11
5/23/2017 Minnesota Department of Administration | mn.gov/admin 12
Are you meeting customer
needs? Do you want to do
better?
Set improveme
nt goals
Make improvements
Did you improve?
5/23/2017
7
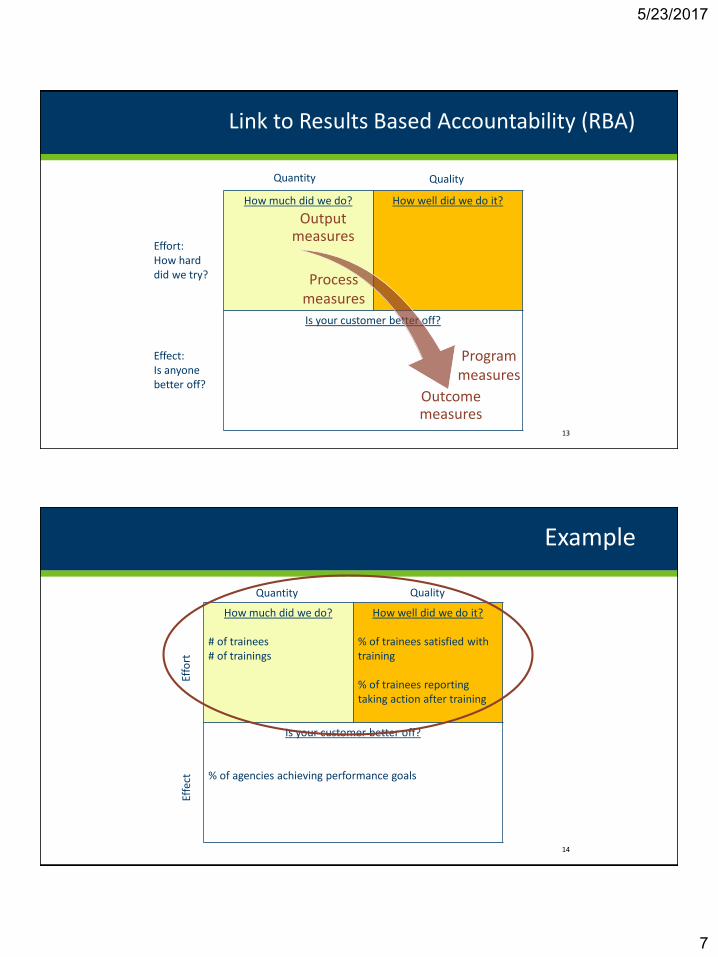
Link to Results Based Accountability (RBA)
How much did we do? How well did we do it?
Is your customer better off?
Quantity Quality
Effort:How hard did we try?
Effect:Is anyone better off?
13
Output measures
Outcome measures
Process measures
Program measures
Example
How much did we do?
# of trainees# of trainings
How well did we do it?
% of trainees satisfied with training
% of trainees reporting taking action after training
Is your customer better off?
% of agencies achieving performance goals
Quantity Quality
Effo
rtEf
fect
14
5/23/2017
8
15
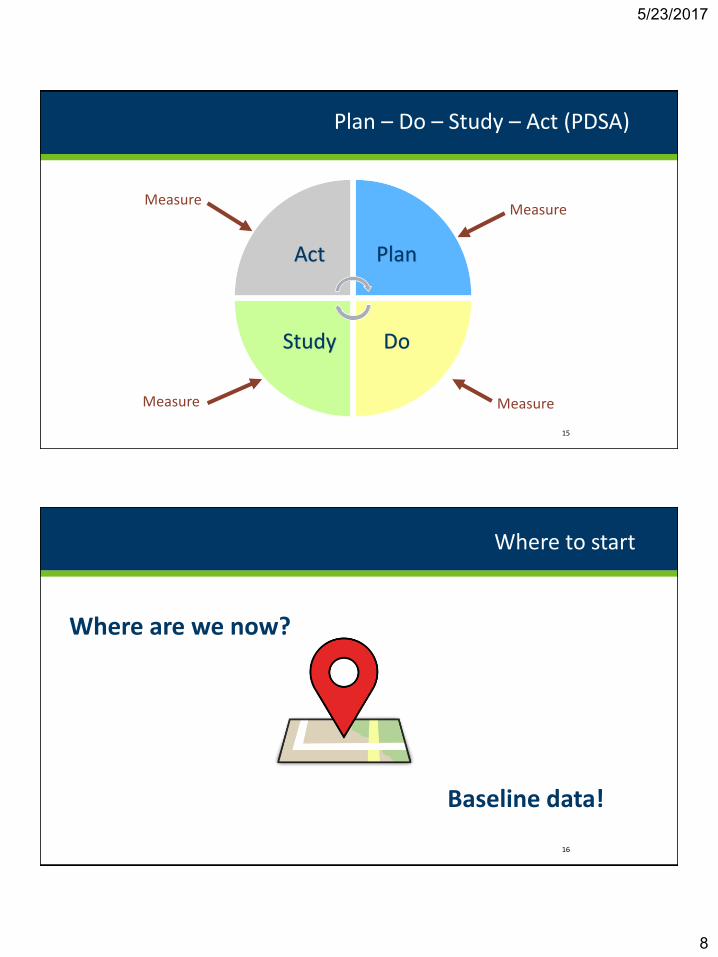
Plan – Do – Study – Act (PDSA)
Act Plan
DoStudy
Measure
Measure Measure
Measure
Where to start
Where are we now?
16
Baseline data!
5/23/2017
9
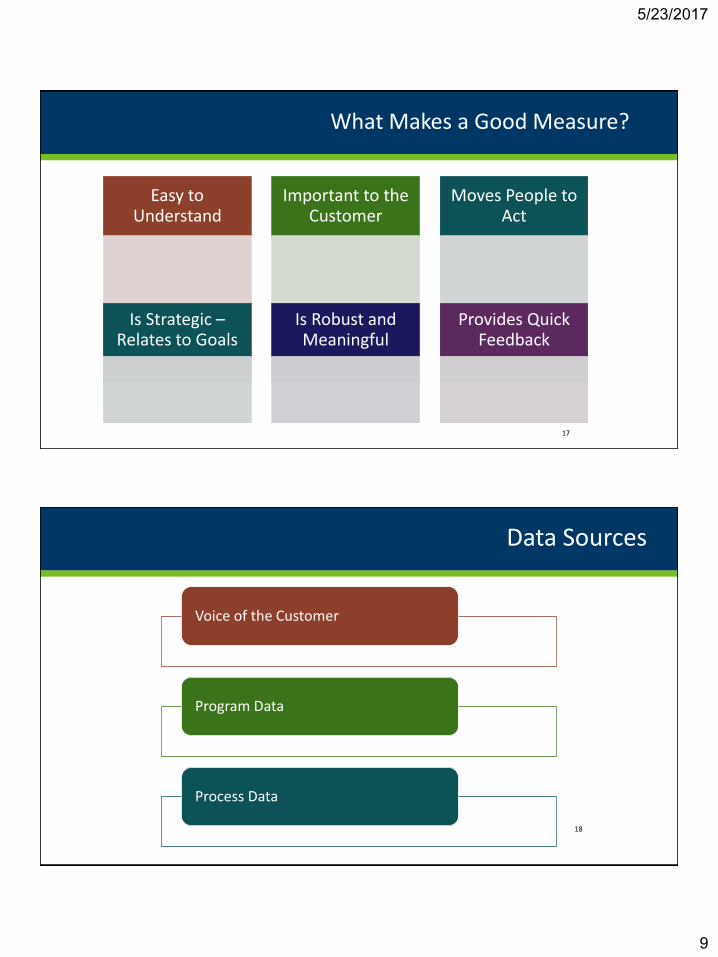
Easy to Understand
Important to the Customer
Moves People to Act
What Makes a Good Measure?
Is Strategic –Relates to Goals
Is Robust and Meaningful
Provides Quick Feedback
17
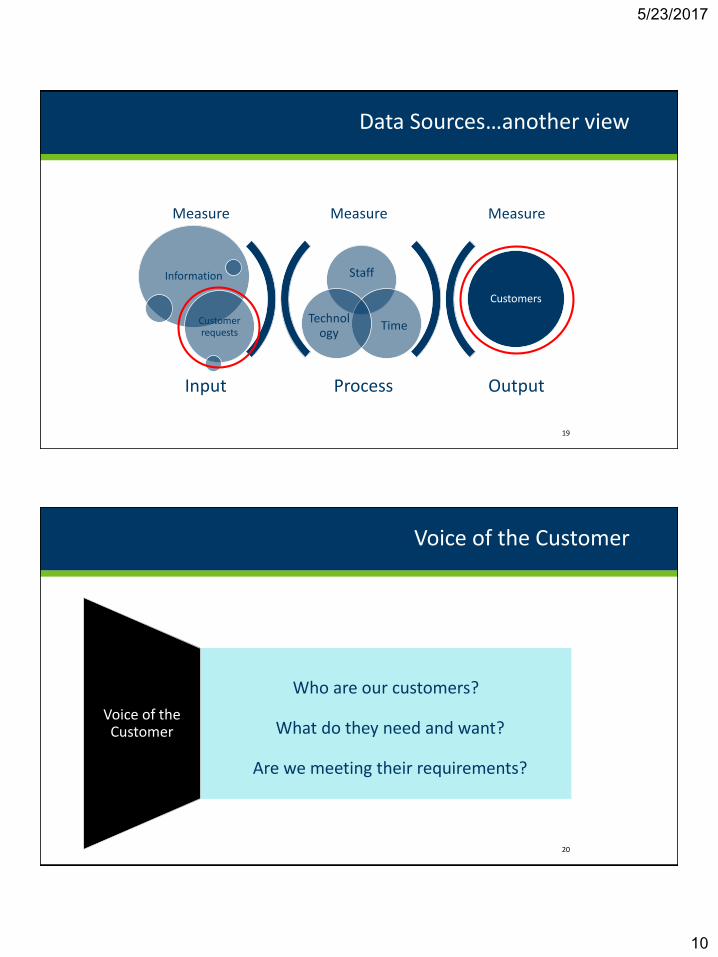
Data Sources
Voice of the Customer
Program Data
Process Data
18
5/23/2017
10
Process Output
Staff
TimeTechnol
ogy
Information
Customer requests
Customers
Input
19
Data Sources…another view
Measure MeasureMeasure
Who are our customers?
What do they need and want?
Are we meeting their requirements?
Voice of the Customer
Voice of the Customer
20
5/23/2017
11
How do you know if you are meeting customer requirements?
21
REMINDER: What do you want to manage or improve? Step 2
What do your customers and stakeholders want and expect from the process?
What do they want to get from the process?
What do they want to know about the process?
AND
What are you working to improve about the process?
5/23/2017 Minnesota Department of Administration | mn.gov/admin 22
5/23/2017
12
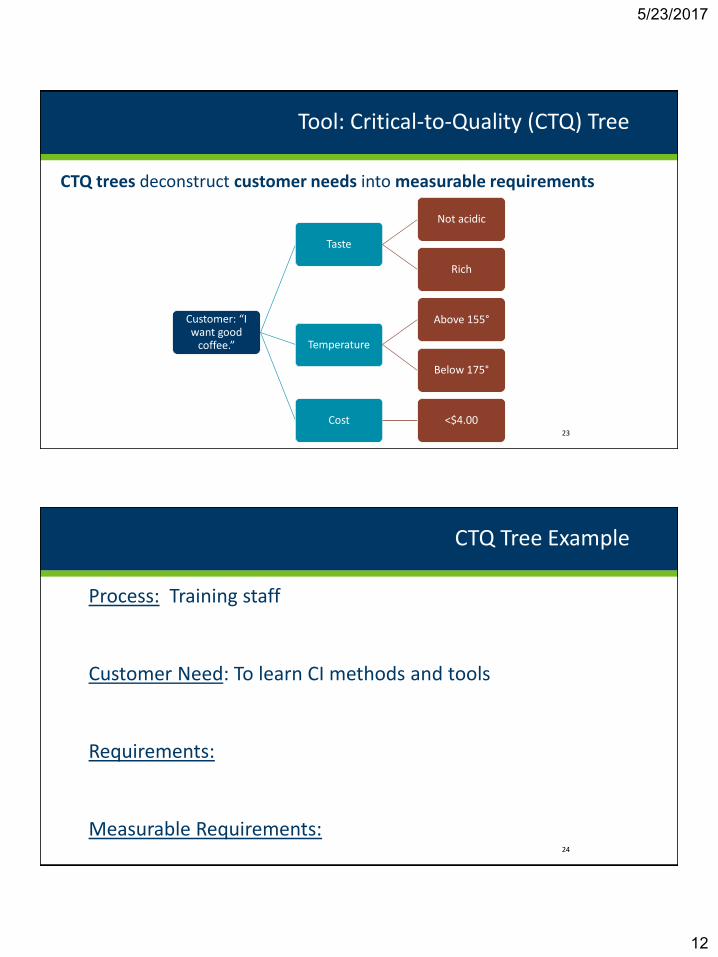
CTQ trees deconstruct customer needs into measurable requirements
Tool: Critical-to-Quality (CTQ) Tree
23
Customer: “I want good
coffee.”
Taste
Not acidic
Rich
Temperature
Above 155°
Below 175°
Cost <$4.00
Process: Training staff
Customer Need: To learn CI methods and tools
Requirements:
Measurable Requirements:
CTQ Tree Example
24
5/23/2017
13
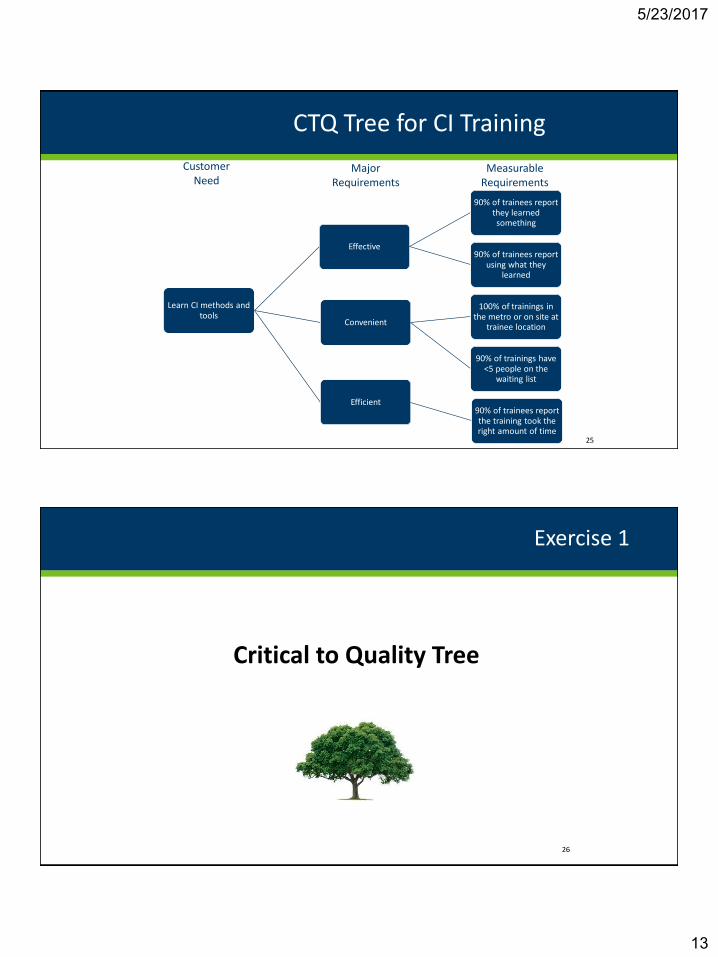
Learn CI methods and tools
Effective
90% of trainees report they learned something
90% of trainees report using what they
learned
Convenient
100% of trainings in the metro or on site at
trainee location
90% of trainings have <5 people on the
waiting list
Efficient90% of trainees report the training took the right amount of time
CTQ Tree for CI Training
Customer Need
Major Requirements
Measurable Requirements
25
Critical to Quality Tree
Exercise 1
26
5/23/2017
14
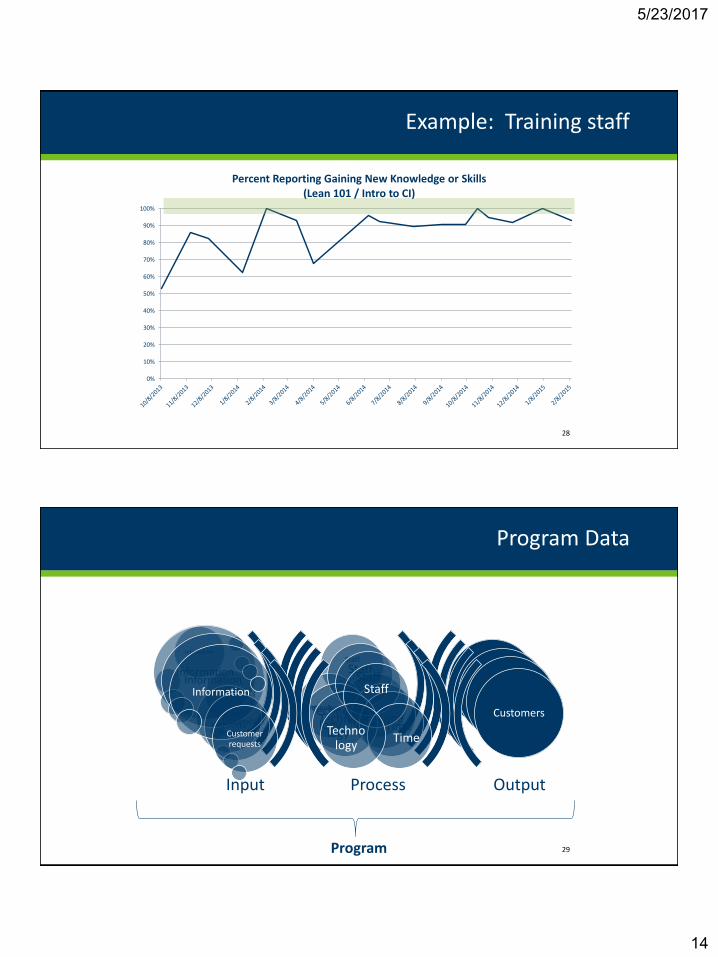
Example: Training staff
28
0%
10%
20%
30%
40%
50%
60%
70%
80%
90%
100%
Percent Reporting Gaining New Knowledge or Skills(Lean 101 / Intro to CI)
Staff
TimeTechnology
Information
Customer requests
Customers
29
Program Data
Staff
TimeTechno
logy
Information
Customer requests
Customers
Staff
TimeTechno
logy
Information
Customer requests
Customers
Process Output
Staff
TimeTechno
logy
Information
Customer requests
Customers
Input
Program
5/23/2017
15
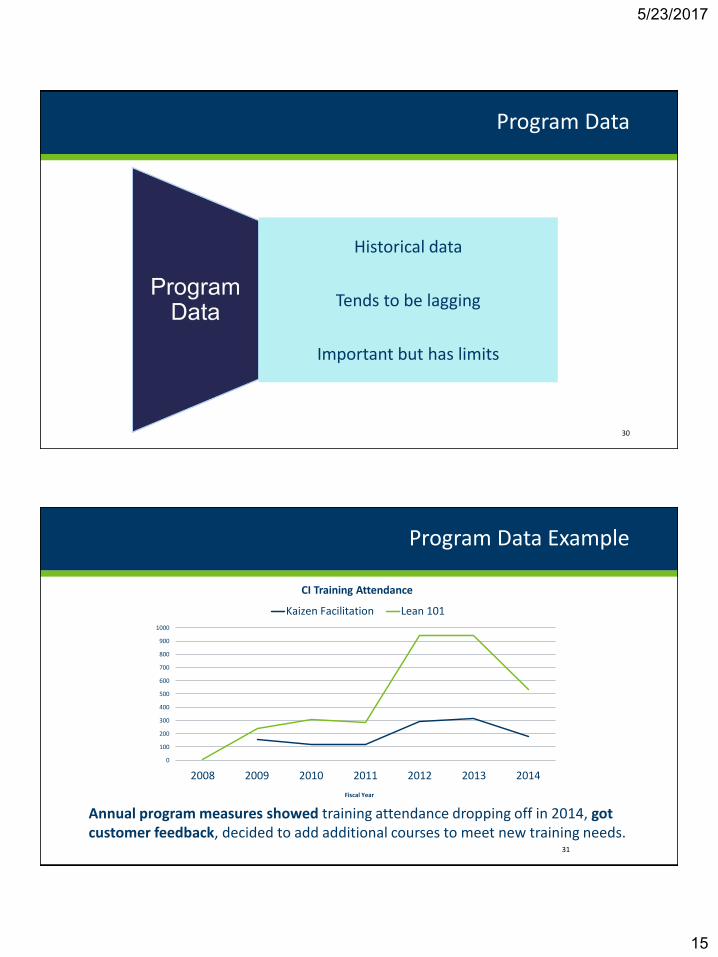
Program Data
30
Historical data
Tends to be lagging
Important but has limits
Annual program measures showed training attendance dropping off in 2014, got customer feedback, decided to add additional courses to meet new training needs.
Program Data Example
31
0
100
200
300
400
500
600
700
800
900
1000
2008 2009 2010 2011 2012 2013 2014
Fiscal Year
CI Training Attendance
Kaizen Facilitation Lean 101
5/23/2017
16
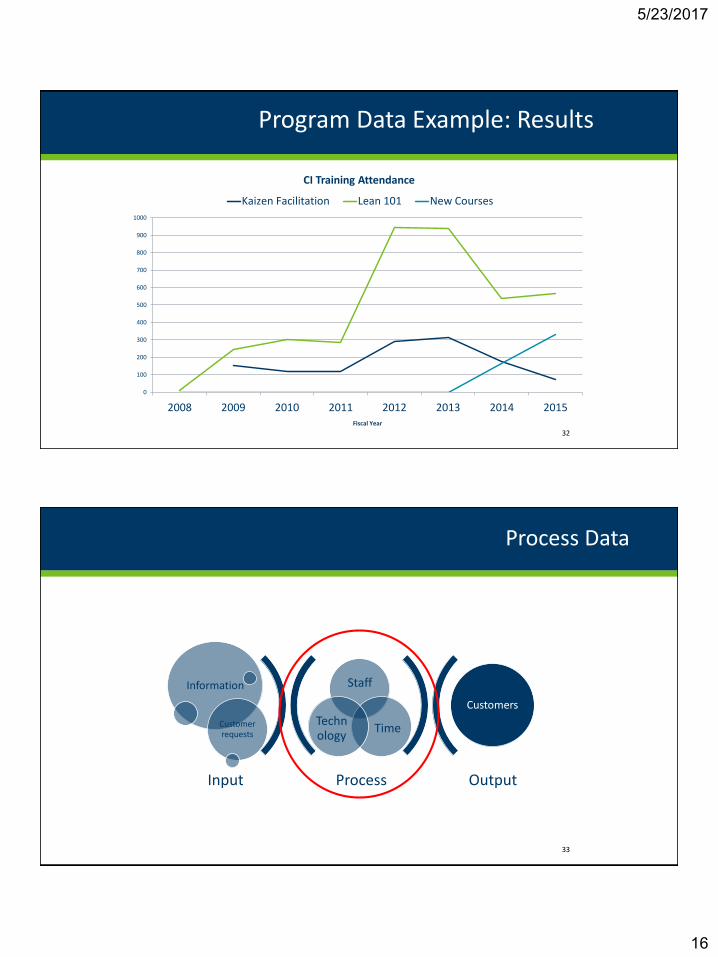
Program Data Example: Results
32
0
100
200
300
400
500
600
700
800
900
1000
2008 2009 2010 2011 2012 2013 2014 2015Fiscal Year
CI Training Attendance
Kaizen Facilitation Lean 101 New Courses
Process Output
Staff
TimeTechnology
Information
Customer requests
Customers
Input
33
Process Data
5/23/2017
17
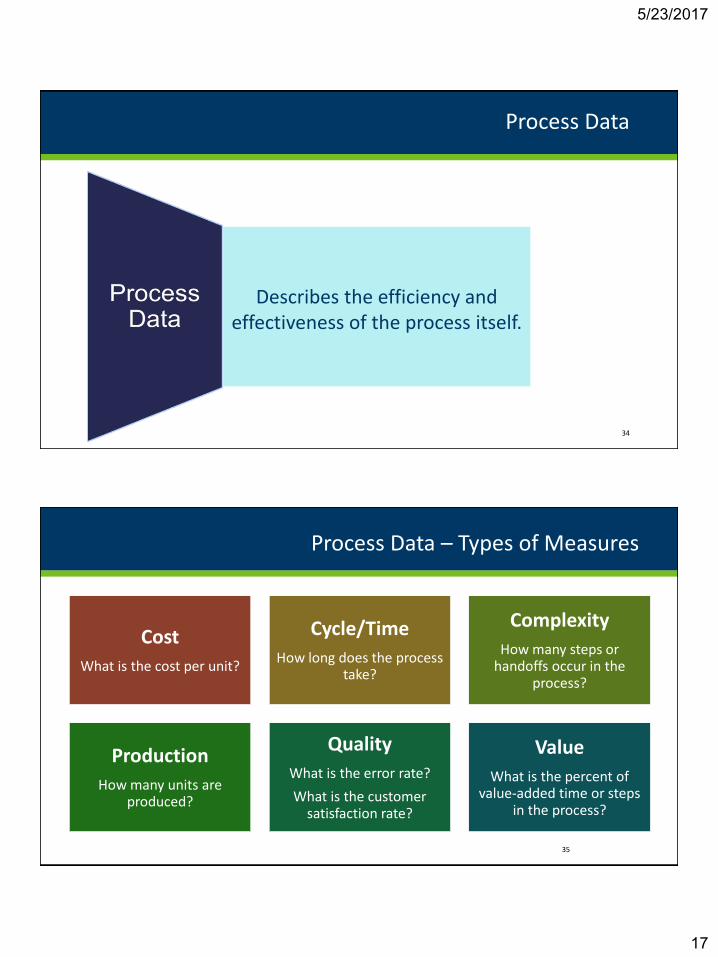
Process Data
34
Describes the efficiency and effectiveness of the process itself.
Process Data – Types of Measures
Cost
What is the cost per unit?
Cycle/Time
How long does the process take?
Complexity
How many steps or handoffs occur in the
process?
Production
How many units are produced?
Quality
What is the error rate?
What is the customer satisfaction rate?
Value
What is the percent of value-added time or steps
in the process?
35
5/23/2017
18
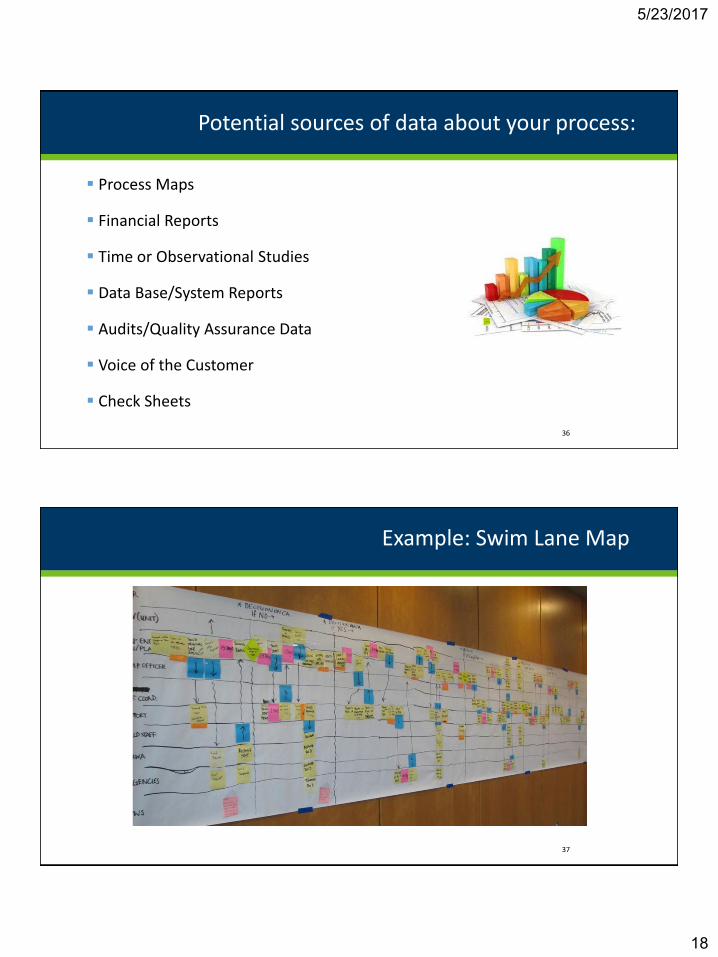
Process Maps
Financial Reports
Time or Observational Studies
Data Base/System Reports
Audits/Quality Assurance Data
Voice of the Customer
Check Sheets
Potential sources of data about your process:
36
Example: Swim Lane Map
37
5/23/2017
19
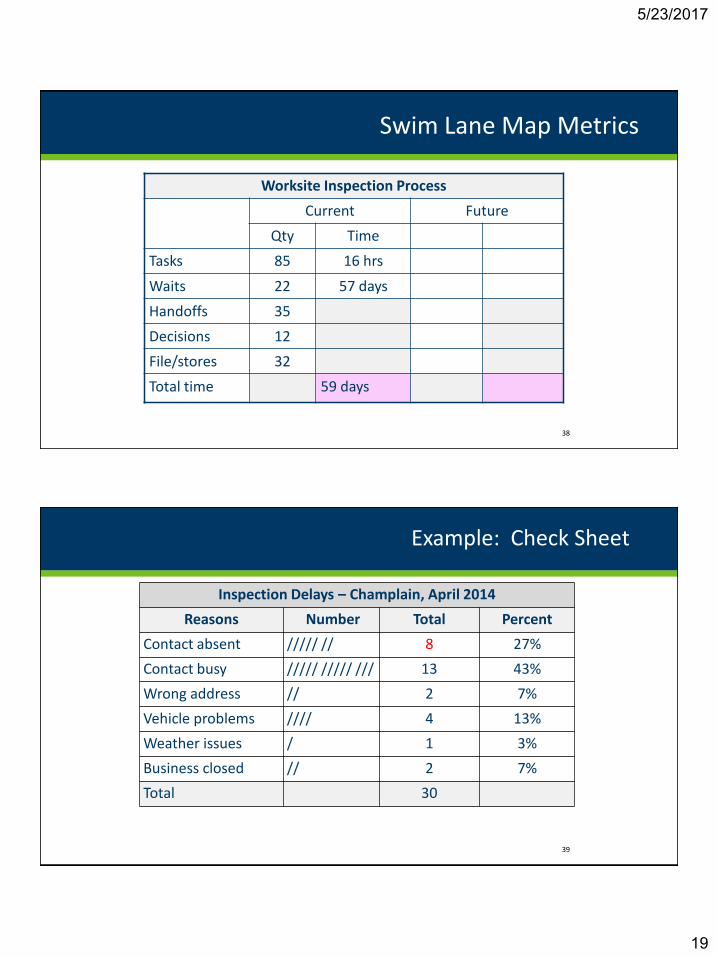
Swim Lane Map Metrics
Worksite Inspection Process
Current Future
Qty Time
Tasks 85 16 hrs
Waits 22 57 days
Handoffs 35
Decisions 12
File/stores 32
Total time 59 days
38
Example: Check Sheet
Inspection Delays – Champlain, April 2014
Reasons Number Total Percent
Contact absent ///// // 8 27%
Contact busy ///// ///// /// 13 43%
Wrong address // 2 7%
Vehicle problems //// 4 13%
Weather issues / 1 3%
Business closed // 2 7%
Total 30
39
5/23/2017
20
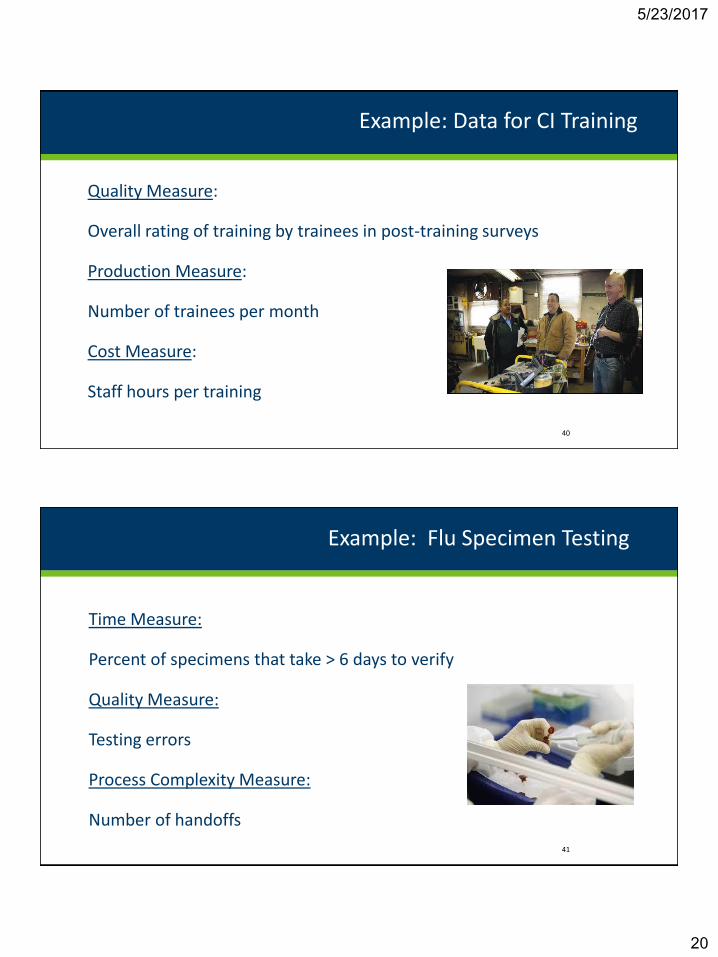
Quality Measure:
Overall rating of training by trainees in post-training surveys
Production Measure:
Number of trainees per month
Cost Measure:
Staff hours per training
Example: Data for CI Training
40
Time Measure:
Percent of specimens that take > 6 days to verify
Quality Measure:
Testing errors
Process Complexity Measure:
Number of handoffs
Example: Flu Specimen Testing
41
5/23/2017
21
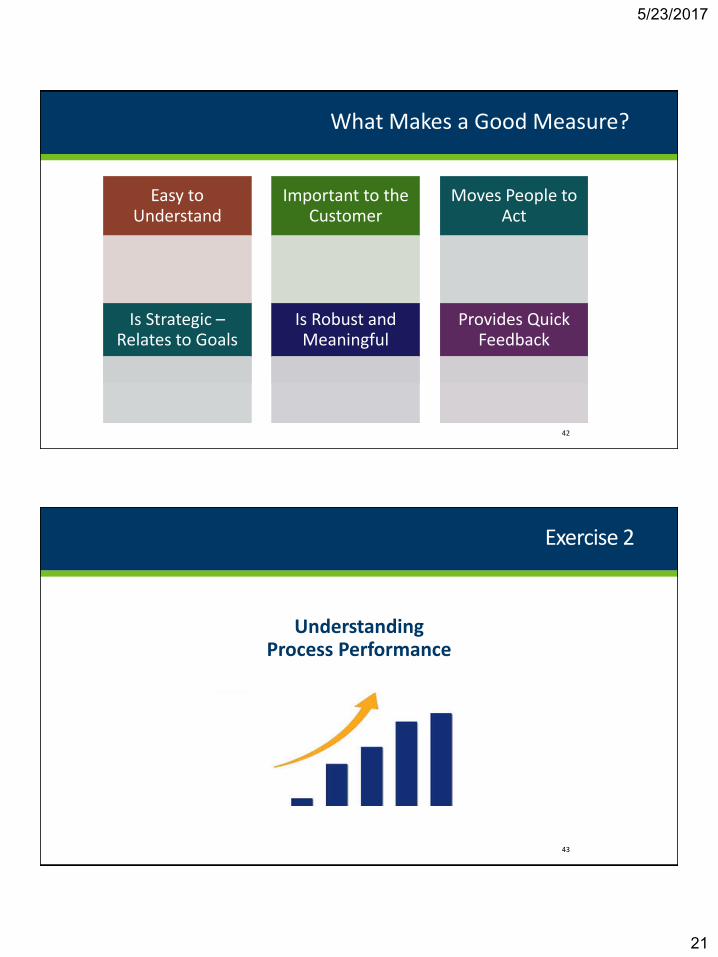
Easy to Understand
Important to the Customer
Moves People to Act
What Makes a Good Measure?
Is Strategic –Relates to Goals
Is Robust and Meaningful
Provides Quick Feedback
42
UnderstandingProcess Performance
Exercise 2
43
5/23/2017
22
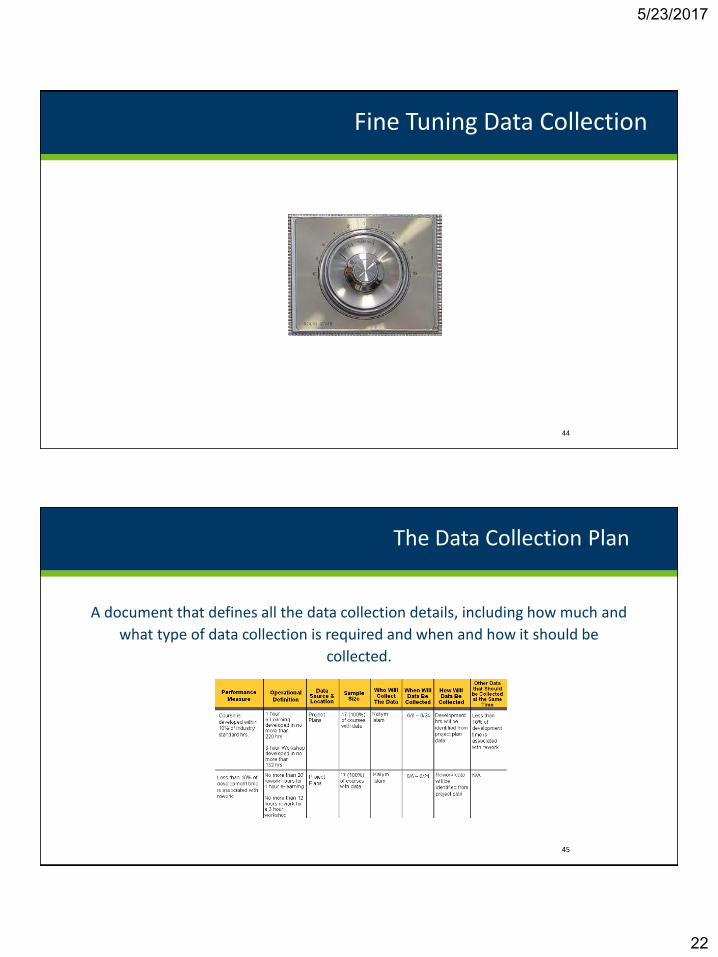
Fine Tuning Data Collection
44
A document that defines all the data collection details, including how much and
what type of data collection is required and when and how it should be
collected.
The Data Collection Plan
45
5/23/2017
23
46
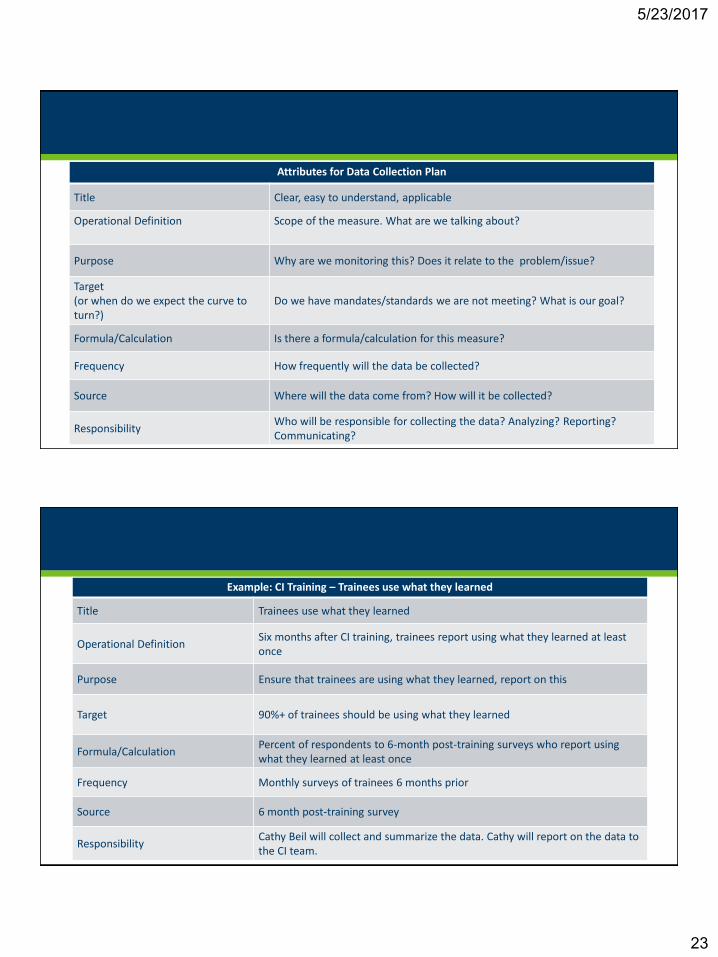
Attributes for Data Collection Plan
Title Clear, easy to understand, applicable
Operational Definition Scope of the measure. What are we talking about?
Purpose Why are we monitoring this? Does it relate to the problem/issue?
Target (or when do we expect the curve to turn?)
Do we have mandates/standards we are not meeting? What is our goal?
Formula/Calculation Is there a formula/calculation for this measure?
Frequency How frequently will the data be collected?
Source Where will the data come from? How will it be collected?
ResponsibilityWho will be responsible for collecting the data? Analyzing? Reporting?Communicating?
47
Example: CI Training – Trainees use what they learned
Title Trainees use what they learned
Operational DefinitionSix months after CI training, trainees report using what they learned at least once
Purpose Ensure that trainees are using what they learned, report on this
Target 90%+ of trainees should be using what they learned
Formula/CalculationPercent of respondents to 6-month post-training surveys who report using what they learned at least once
Frequency Monthly surveys of trainees 6 months prior
Source 6 month post-training survey
ResponsibilityCathy Beil will collect and summarize the data. Cathy will report on the data to the CI team.
5/23/2017
24
Data Collection Plan Exercise
48
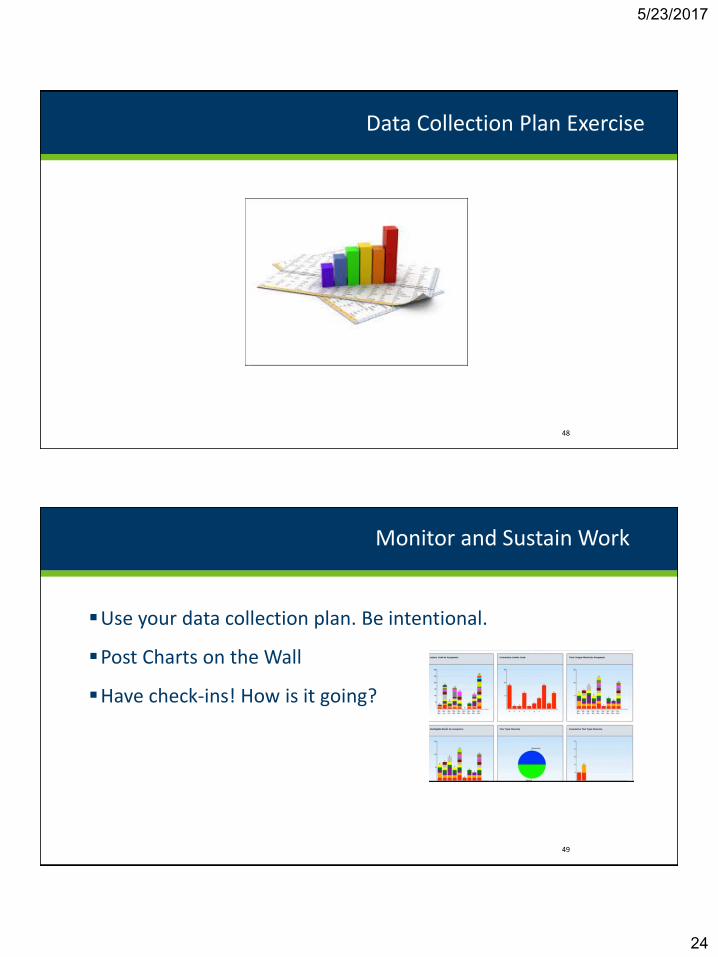
Use your data collection plan. Be intentional.
Post Charts on the Wall
Have check-ins! How is it going?
Monitor and Sustain Work
49
5/23/2017
25
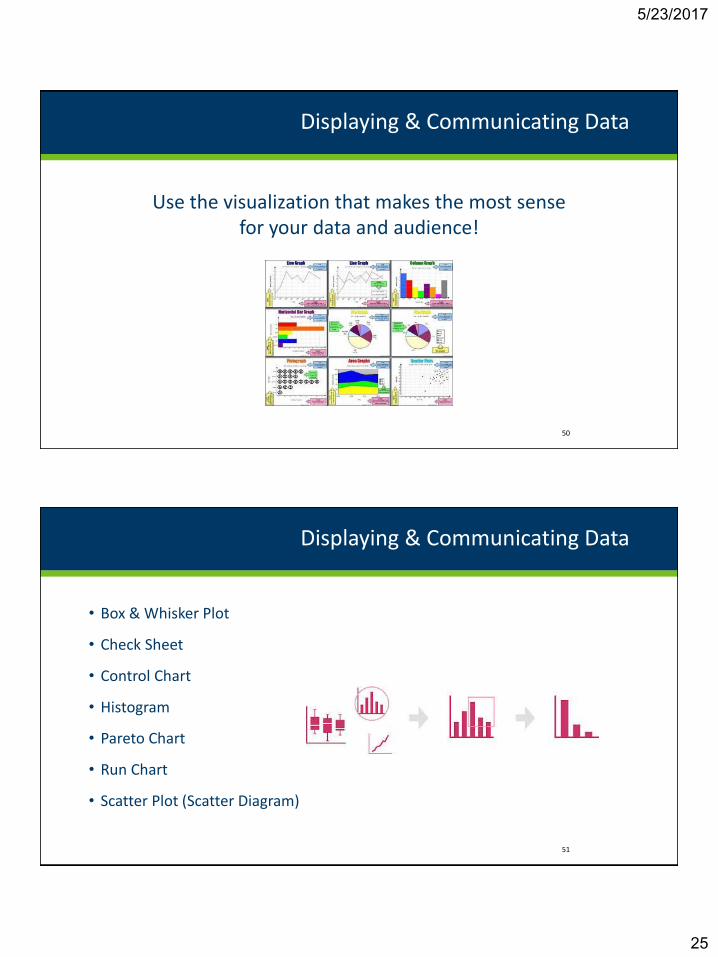
Use the visualization that makes the most sense for your data and audience!
Displaying & Communicating Data
50
• Box & Whisker Plot
• Check Sheet
• Control Chart
• Histogram
• Pareto Chart
• Run Chart
• Scatter Plot (Scatter Diagram)
Displaying & Communicating Data
51
5/23/2017
26
Displaying Measures - Guidelines
52
• Simplify, simplify, simplify
• Consider when charts or tables are more appropriate
• Include a title and label both the x and y axis
• Do not use 3D
• Use the right chart for the right message
• Charts should be self-explanatory – test them!
• Be intentional about selecting measures.
• Measures should focus on the process, not people
• Engage process owners
Tips for Successful Measurement
53
5/23/2017
27
• Share data with the group
• Define the measure
• Analyze and use the data
Tips for Successful Measurement
54
What does the process look like?
What are the steps?
How long is it taking?
Where is the waste?
What are my customer requirements?
Understand your process
55
5/23/2017
28
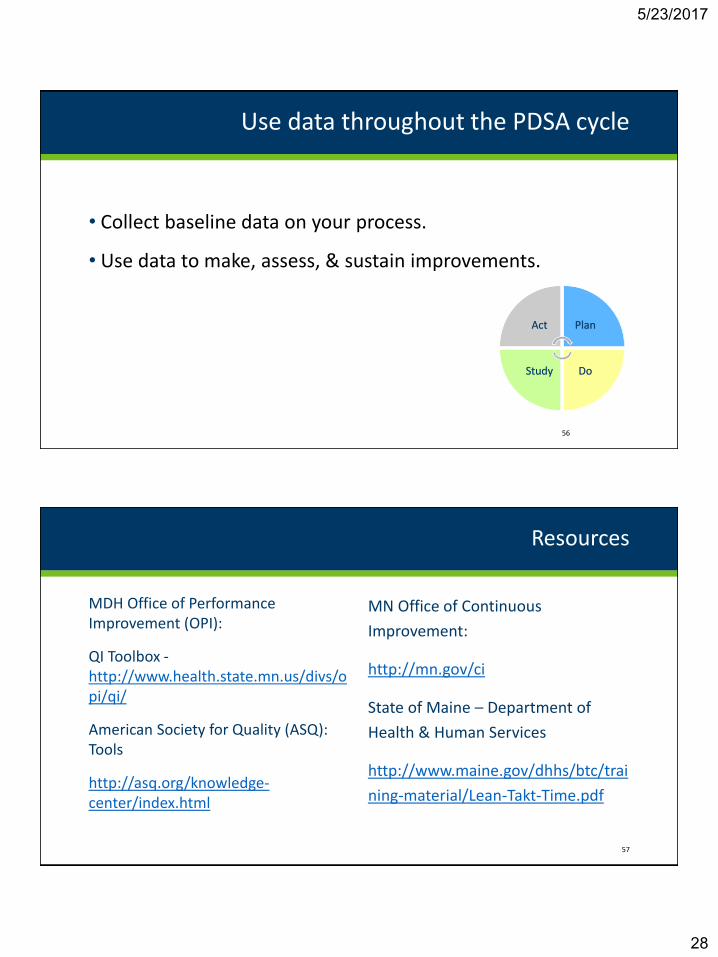
• Collect baseline data on your process.
• Use data to make, assess, & sustain improvements.
Use data throughout the PDSA cycle
56
Act Plan
DoStudy
Resources
MDH Office of Performance Improvement (OPI):
QI Toolbox -http://www.health.state.mn.us/divs/opi/qi/
American Society for Quality (ASQ): Tools
http://asq.org/knowledge-center/index.html
MN Office of Continuous
Improvement:
http://mn.gov/ci
State of Maine – Department of
Health & Human Services
http://www.maine.gov/dhhs/btc/trai
ning-material/Lean-Takt-Time.pdf
57