Embed Size (px)
DESCRIPTION
The Metropolitan Housing Coalition's annual report.
Citation preview
METROPOLITAN HOUSING COALITION
2015 A Year of Change | Metropolitan Housing Coalitioni
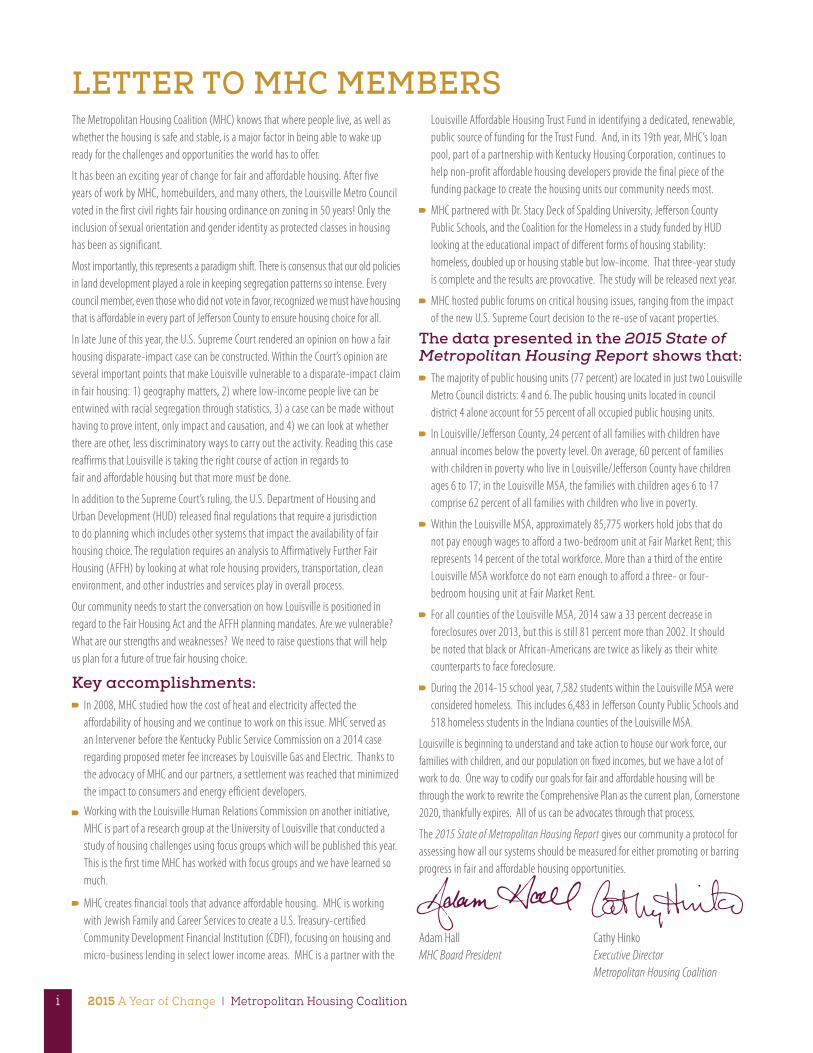
LETTER TO MHC MEMBERSThe Metropolitan Housing Coalition (MHC) knows that where people live, as well as whether the housing is safe and stable, is a major factor in being able to wake up ready for the challenges and opportunities the world has to offer.
It has been an exciting year of change for fair and affordable housing. After five years of work by MHC, homebuilders, and many others, the Louisville Metro Council voted in the first civil rights fair housing ordinance on zoning in 50 years! Only the inclusion of sexual orientation and gender identity as protected classes in housing has been as significant.
Most importantly, this represents a paradigm shift. There is consensus that our old policies in land development played a role in keeping segregation patterns so intense. Every council member, even those who did not vote in favor, recognized we must have housing that is affordable in every part of Jefferson County to ensure housing choice for all.
In late June of this year, the U.S. Supreme Court rendered an opinion on how a fair housing disparate-impact case can be constructed. Within the Court’s opinion are several important points that make Louisville vulnerable to a disparate-impact claim in fair housing: 1) geography matters, 2) where low-income people live can be entwined with racial segregation through statistics, 3) a case can be made without having to prove intent, only impact and causation, and 4) we can look at whether there are other, less discriminatory ways to carry out the activity. Reading this case reaffirms that Louisville is taking the right course of action in regards to fair and affordable housing but that more must be done.
In addition to the Supreme Court’s ruling, the U.S. Department of Housing and Urban Development (HUD) released final regulations that require a jurisdiction to do planning which includes other systems that impact the availability of fair housing choice. The regulation requires an analysis to Affirmatively Further Fair Housing (AFFH) by looking at what role housing providers, transportation, clean environment, and other industries and services play in overall process.
Our community needs to start the conversation on how Louisville is positioned in regard to the Fair Housing Act and the AFFH planning mandates. Are we vulnerable? What are our strengths and weaknesses? We need to raise questions that will help us plan for a future of true fair housing choice.
Key accomplishments: In 2008, MHC studied how the cost of heat and electricity affected the
affordability of housing and we continue to work on this issue. MHC served as an Intervener before the Kentucky Public Service Commission on a 2014 case regarding proposed meter fee increases by Louisville Gas and Electric. Thanks to the advocacy of MHC and our partners, a settlement was reached that minimized the impact to consumers and energy efficient developers.
Working with the Louisville Human Relations Commission on another initiative, MHC is part of a research group at the University of Louisville that conducted a study of housing challenges using focus groups which will be published this year. This is the first time MHC has worked with focus groups and we have learned so much.
MHC creates financial tools that advance affordable housing. MHC is working with Jewish Family and Career Services to create a U.S. Treasury-certified Community Development Financial Institution (CDFI), focusing on housing and micro-business lending in select lower income areas. MHC is a partner with the
Louisville Affordable Housing Trust Fund in identifying a dedicated, renewable, public source of funding for the Trust Fund. And, in its 19th year, MHC’s loan pool, part of a partnership with Kentucky Housing Corporation, continues to help non-profit affordable housing developers provide the final piece of the funding package to create the housing units our community needs most.
MHC partnered with Dr. Stacy Deck of Spalding University, Jefferson County Public Schools, and the Coalition for the Homeless in a study funded by HUD looking at the educational impact of different forms of housing stability: homeless, doubled up or housing stable but low-income. That three-year study is complete and the results are provocative. The study will be released next year.
MHC hosted public forums on critical housing issues, ranging from the impact of the new U.S. Supreme Court decision to the re-use of vacant properties.
The data presented in the 2015 State of Metropolitan Housing Report shows that:
The majority of public housing units (77 percent) are located in just two Louisville Metro Council districts: 4 and 6. The public housing units located in council district 4 alone account for 55 percent of all occupied public housing units.
In Louisville/Jefferson County, 24 percent of all families with children have annual incomes below the poverty level. On average, 60 percent of families with children in poverty who live in Louisville/Jefferson County have children ages 6 to 17; in the Louisville MSA, the families with children ages 6 to 17 comprise 62 percent of all families with children who live in poverty.
Within the Louisville MSA, approximately 85,775 workers hold jobs that do not pay enough wages to afford a two-bedroom unit at Fair Market Rent; this represents 14 percent of the total workforce. More than a third of the entire Louisville MSA workforce do not earn enough to afford a three- or four-bedroom housing unit at Fair Market Rent.
For all counties of the Louisville MSA, 2014 saw a 33 percent decrease in foreclosures over 2013, but this is still 81 percent more than 2002. It should be noted that black or African-Americans are twice as likely as their white counterparts to face foreclosure.
During the 2014-15 school year, 7,582 students within the Louisville MSA were considered homeless. This includes 6,483 in Jefferson County Public Schools and 518 homeless students in the Indiana counties of the Louisville MSA.
Louisville is beginning to understand and take action to house our work force, our families with children, and our population on fixed incomes, but we have a lot of work to do. One way to codify our goals for fair and affordable housing will be through the work to rewrite the Comprehensive Plan as the current plan, Cornerstone 2020, thankfully expires. All of us can be advocates through that process.
The 2015 State of Metropolitan Housing Report gives our community a protocol for assessing how all our systems should be measured for either promoting or barring progress in fair and affordable housing opportunities.
Cathy Hinko Executive Director Metropolitan Housing Coalition
Adam Hall MHC Board President
metropolitanhousing.org | 2015 State of Metropolitan Housing Report ii
CONTENTSLetter to MHC Members .................................................................................................................................................. i
Louisville Metro Fair Housing Legal Landscape Update .....................................................................1
A Landmark Court Decision ............................................................................................................................................. 2
Summary of the Affirmatively Furthering Fair Housing Rule ........................................................................ 3
Broader Institutional Impacts ......................................................................................................................................... 5
Louisville at a Planning Crossroads .............................................................................................................................6
Measures of Housing Affordability ..........................................................................................................1 1
Measure 1: Concentration of Subsidized Housing .................................................................................1 1
Measure 2: Housing Segregation ......................................................................................................................15
Measure 3: Fair Market Rents ................................................................................................................................19
Measure 4: Production And Rehabilitation of Affordable Housing.......................................... 2 1
Measure 5: Homeownership ................................................................................................................................23
Measure 6: Affordability ..........................................................................................................................................24
Measure 7: Foreclosures ..........................................................................................................................................26
Measure 8: Homelessness ..................................................................................................................................... 28
Measure 9: Community Development Block Grants (CDBG) and HOME Funds ...................30
Appendix ..................................................................................................................................................................................33
Data Sources .........................................................................................................................................................................33
References ..............................................................................................................................................................................34
2015 Annual Meeting Sponsors .................................................................................................................................35
State of Metropolitan Housing Report Sponsors ..............................................................................................35
2014–2015 MHC Board of Directors ....................................................................................................................... 36
Foundations and Grant-Making Institutions ...................................................................................................... 36
MHC Staff ............................................................................................................................................................................... 36
Acknowledgements ......................................................................................................................................................... 36
MHC Individual Members ..............................................................................................................................................37
MHC Organizational Members .................................................................................................................................. 39
2015 A Year of Change | Metropolitan Housing Coalition1
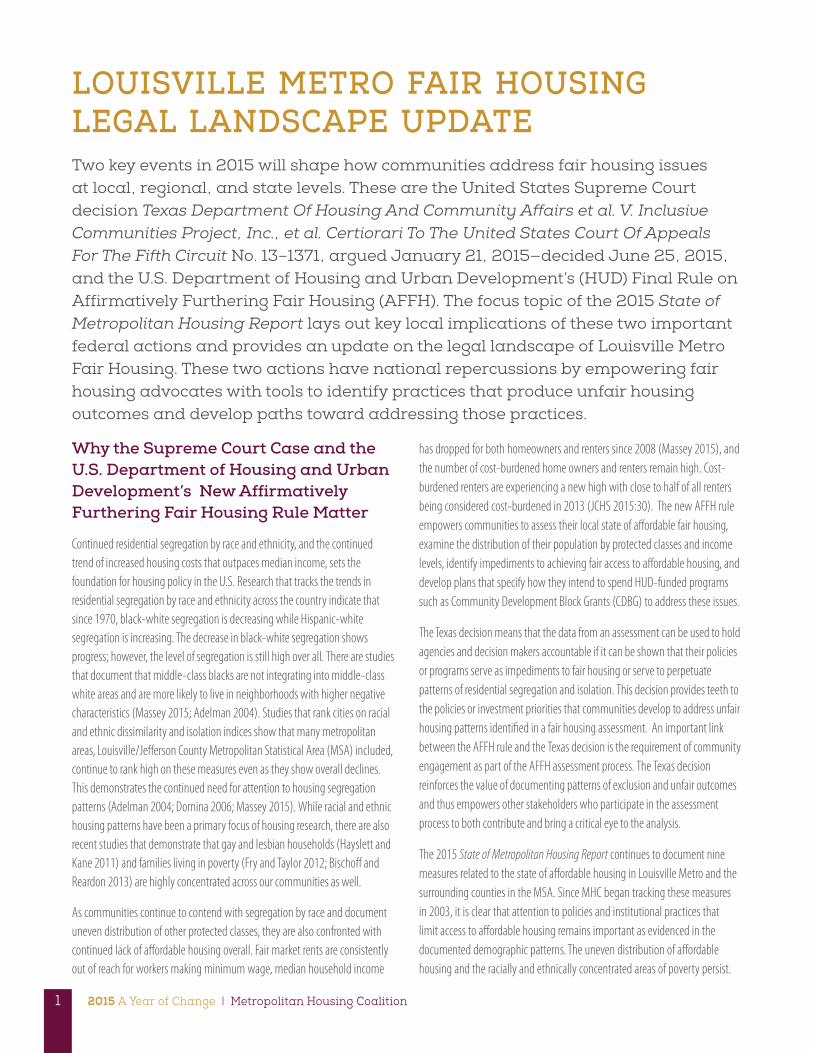
LOUISVILLE METRO FAIR HOUSING LEGAL LANDSCAPE UPDATETwo key events in 2015 will shape how communities address fair housing issues at local, regional, and state levels. These are the United States Supreme Court decision Texas Department Of Housing And Community Affairs et al. V. Inclusive Communities Project, Inc., et al. Certiorari To The United States Court Of Appeals For The Fifth Circuit No. 13–1371, argued January 21, 2015—decided June 25, 2015, and the U.S. Department of Housing and Urban Development’s (HUD) Final Rule on Affirmatively Furthering Fair Housing (AFFH). The focus topic of the 2015 State of Metropolitan Housing Report lays out key local implications of these two important federal actions and provides an update on the legal landscape of Louisville Metro Fair Housing. These two actions have national repercussions by empowering fair housing advocates with tools to identify practices that produce unfair housing outcomes and develop paths toward addressing those practices.
Why the Supreme Court Case and the U.S. Department of Housing and Urban Development’s New Affirmatively Furthering Fair Housing Rule Matter
Continued residential segregation by race and ethnicity, and the continued trend of increased housing costs that outpaces median income, sets the foundation for housing policy in the U.S. Research that tracks the trends in residential segregation by race and ethnicity across the country indicate that since 1970, black-white segregation is decreasing while Hispanic-white segregation is increasing. The decrease in black-white segregation shows progress; however, the level of segregation is still high over all. There are studies that document that middle-class blacks are not integrating into middle-class white areas and are more likely to live in neighborhoods with higher negative characteristics (Massey 2015; Adelman 2004). Studies that rank cities on racial and ethnic dissimilarity and isolation indices show that many metropolitan areas, Louisville/Jefferson County Metropolitan Statistical Area (MSA) included, continue to rank high on these measures even as they show overall declines. This demonstrates the continued need for attention to housing segregation patterns (Adelman 2004; Domina 2006; Massey 2015). While racial and ethnic housing patterns have been a primary focus of housing research, there are also recent studies that demonstrate that gay and lesbian households (Hayslett and Kane 2011) and families living in poverty (Fry and Taylor 2012; Bischoff and Reardon 2013) are highly concentrated across our communities as well.
As communities continue to contend with segregation by race and document uneven distribution of other protected classes, they are also confronted with continued lack of affordable housing overall. Fair market rents are consistently out of reach for workers making minimum wage, median household income
has dropped for both homeowners and renters since 2008 (Massey 2015), and the number of cost-burdened home owners and renters remain high. Cost-burdened renters are experiencing a new high with close to half of all renters being considered cost-burdened in 2013 (JCHS 2015:30). The new AFFH rule empowers communities to assess their local state of affordable fair housing, examine the distribution of their population by protected classes and income levels, identify impediments to achieving fair access to affordable housing, and develop plans that specify how they intend to spend HUD-funded programs such as Community Development Block Grants (CDBG) to address these issues.
The Texas decision means that the data from an assessment can be used to hold agencies and decision makers accountable if it can be shown that their policies or programs serve as impediments to fair housing or serve to perpetuate patterns of residential segregation and isolation. This decision provides teeth to the policies or investment priorities that communities develop to address unfair housing patterns identified in a fair housing assessment. An important link between the AFFH rule and the Texas decision is the requirement of community engagement as part of the AFFH assessment process. The Texas decision reinforces the value of documenting patterns of exclusion and unfair outcomes and thus empowers other stakeholders who participate in the assessment process to both contribute and bring a critical eye to the analysis.
The 2015 State of Metropolitan Housing Report continues to document nine measures related to the state of affordable housing in Louisville Metro and the surrounding counties in the MSA. Since MHC began tracking these measures in 2003, it is clear that attention to policies and institutional practices that limit access to affordable housing remains important as evidenced in the documented demographic patterns. The uneven distribution of affordable housing and the racially and ethnically concentrated areas of poverty persist.
metropolitanhousing.org | 2015 State of Metropolitan Housing Report 2
The Texas decision affirms that disparate impacts of a policy or practice can be documented using statistical data analysis. Demonstrating intent is not required. The causal link between the policy or program and the unequal outcomes for protected classes can be done using statistical analysis. The AFFH rule provides a community with direction for how to understand data that documents unfair housing outcomes that might be shown through documentation of residential housing patterns, lending patterns, appraisal and assessment data, rental application processes, access to transportation, employment, healthy food, schools, services, and environmental benefits. In sum, the Texas decision reaffirms that data can be used to demonstrate disparate impact and the AFFH rule provides a path for how a community, agency, or region can address that problem.
What follows is a brief summary of the Texas decision and a description of key elements of the AFFH rule with particular emphasis on how these two federal actions impact Louisville Metro and the surrounding area.
A Landmark Court DecisionOn June 25, 2015, the U.S. Supreme Court issued an opinion in Texas Department of Housing and Community Affairs, et al. v. Inclusive Communities Project, Inc., et al., confirming the way disparate-impact fair housing cases can be proved. The original allegation was that the state of Texas allocated federal Low-Income Housing Tax Credits (LIHTC) in a manner which continued segregated housing in poor, black, inner-city areas. The case relied on statistical evidence to establish that there was a disparate impact on a protected class.
Quoting the opinion of the Court, “[t]he underlying dispute in this case concerns where housing for low-income persons should be constructed in Dallas, Texas – that is, whether the housing should be built in the inner city or in the suburbs” (Texas Department of Housing and Community Affairs v. Inclusive Communities Project, Inc. 2015).
The critical legal point that the Court affirmed is that disparate-impact claims are cognizable under the Fair Housing Act. The proof may be statistical and does not require proving motive. The proof must show that the activity causes the fair housing violation and that it has a disparate, negative impact on fair-housing protected classes. Once that is established, a second consideration is whether there are other less discriminatory practices that can be used.
Within the Court’s opinion are several important points that make a policy vulnerable to a disparate-impact claim in fair housing: 1) geography matters; 2) where low-income people live can be entwined with racial segregation through statistics; 3) a case can be made without having to prove intent, only impact and causation; and 4) other, less discriminatory ways to carry out the activity or policy in question can be considered.
Also important to note is that the Low-Income Housing Tax Credit Program (LIHTC) that was the subject of the case, is under the U.S. Treasury; it is not a HUD program. Nor is it a fair housing specific program; the intended
beneficiaries are low-income households. This means that policies that are used to assist in housing or shape access to housing regardless of the agency, are subject to the Fair Housing Act. It highlights the fact that there is a link between where we place low-income housing and how we create fair housing opportunities and that link is important. The decision supports the use of research to demonstrate disparate impact that results from a policy or practice. For example, research such as Oakley (2008) documented that the Qualifying Census Tract (QCT) bonus within LIHTC served to concentrate LIHTC projects in areas of high poverty and concentrated minority populations by providing incentives to investors who develop low-income housing in areas defined as difficult to develop.
To understand their potential liability and responsibilities under this ruling, communities must ask what other housing-related policies have disparate impact and sustain or create isolated low-income and /or racially segregated residential areas. Key topics communities and states must examine in their policies and program implementation include: zoning laws that outright prohibit or discourage multi-family housing or condensed smaller units in wealthy, predominantly white areas; lack of housing choice or protections for Section 8 Housing Voucher recipients; uneven distribution of investments or incentives to build affordable housing; and regulation of predatory or unfair lending practices. One could also argue that agencies that make decisions about investments in transportation and other types of public infrastructure need to pay attention to how those public investments contribute to perpetuating segregated neighborhoods and areas of concentrated poverty.
2015 A Year of Change | Metropolitan Housing Coalition3
Summary of the Affirmatively Furthering Fair Housing RuleHistory
The Fair Housing Act (Title VIII of the Civil Rights Act of 1968) requires HUD to administer its programs in ways that affirmatively furthers fair housing. This has meant that agencies who receive HUD funding have been required to justify their activities by assessing impediments to fair housing (AI) and reporting to HUD progress made in addressing those impediments. The AI has never had consistent standards or guidelines. Furthermore, what AFFH actually means has been contested. However, over the years, case law has helped to specify what AFFH means, and amendments to the act, notably amendments of 1988, have provided HUD with more support for enforcement and justification for empowering program recipients with tools to meet fair housing goals. Now with the new AFFH rule comes better definitions of what constitutes actions HUD-funded agencies can and should take to actively encourage fair housing.
An initial pilot that was a precursor to the new rule and encouraged communities to integrate fair housing into regional planning processes was implemented through the HUD Sustainable Communities Initiative in 2010 and 2011. Regional planning grant recipients under this program were asked to complete a Fair Housing Equity Assessment (FHEA) that would be used to inform their regional planning process and final plan. This process was new on many levels as it required that broad consortiums across jurisdictional boundaries participate in the FHEA and ensured the inclusion of meaningful community engagement with groups that were often underrepresented in regional planning activities. Additionally, it asked agencies that may not have had experience with or willingness to do so, to examine the ways in which their historical practices contributed to residential segregation and the creation of areas of racially and ethnically concentrated poverty. Finally, it was intended to encourage grantees to engage in a Regional Analysis of Impediments (RAI) rather than AIs for individual jurisdictions by outlining the few extra elements beyond the FHEA that would be required to forgo separate jurisdiction AIs. The analysis grantees were asked to perform was framed as an understanding of access to opportunity. The grantees provided significant feedback to HUD regarding the FHEA that assisted in the refining of the AFFH rule.
What is Affirmatively Furthering Fair Housing in a Nutshell?
The AFFH rule empowers states and municipalities who receive funding from HUD to perform an assessment of fair housing and set goals for achieving fair housing. Progress toward those goals are measured in four areas: 1) overcoming historic segregation by improving integration; 2) reducing concentrated poverty in minority neighborhoods; 3) reduction of uneven distribution of neighborhood quality by race and/or ethnicity; and 4) better responses to the housing needs of those with mental and physical disabilities (Massey 2015:583). The rule is intended to help communities use their HUD funds from CDBG, HOME Investment Partnership Program, and public housing allocations in ways that are directly aligned with their Consolidated Plans.
Two Key Measures Required by the Assessment of Fair Housing
Racially/ethnically concentrated areas of poverty (RCAPs/ECAPs)
The Assessment of Fair Housing (AFH) Tool requires that local programs measure and map racially/ethnically-concentrated areas of poverty (RCAPs/ECAPs). HUD defines RCAP/ECAP areas as those where one or more census tracts contain either (1) a family poverty rate that is greater than or equal to 40 percent or (2) a family poverty rate that is greater than or equal to three times the metropolitan/micropolitan statistical area’s tract average, whichever threshold is lower. Additionally, RCAP/ECAP also includes the census tracts where the non-white population is greater than 50 percent. Communities use the interactive mapping tool and table generator to identify these areas and then must discuss determinants that produce and maintain these concentrations and develop plans to address those determinants.
Dissimilarity Index: Measuring Residential Segregation
The AFH Tool asks communities to use a Racial/Ethnic Dissimilarity Index as a measure of residential segregation for a jurisdiction or region. This index uses U.S. Census data to calculate the percentage of people in any one racial or ethnic category who would need to move into another census tract to reach a representative distribution of that racial or ethnic category across all census tracts in the area under consideration.
The index only measures the relative degree of segregation between two groups; examples include Non-White and White, or Black and White, or Hispanic and White. A typical use would be as a benchmark to compare to other communities or to see if there have been changes over time. The table the AFH Tool generates provides measures for decennial census years 1990, 2000, and 2010, allowing a longitudinal measure of change over time. It does not represent spatial patterns of segregation but provides an overall picture of segregation in a specific geographic area.
metropolitanhousing.org | 2015 State of Metropolitan Housing Report 4
AFFH Community Resources:HUD
HUD Summary of AFFH Final Rule and associated resources https://www.hudexchange.info/programs/affh/
HUD AFH Beta Test Mapping Tool http://affht.vsolvit.com/
PolicyLink Advancement for Equity: The Game Changing Rule Coming from
HUD https://www.youtube.com/watch?v=1pesQyN8Bfo
A Pivotal Step Toward Opportunity: The Affirmatively Furthering Fair Housing Rule https://www.youtube.com/watch?v=LjL8E9eJSO4
with Kirwan Institute Implementing the Fair Housing and Equity Assessment: Advancing Opportunity Through the Low-Income Housing Tax Credit http://kirwaninstitute.osu.edu/wp-content/uploads/2015/06/01_2014_LIHTC_FHEA-Policy-Brief-for-SCI-Grantees.pdf
Key Requirements and Guidance
HUD’s AFFH rule has five key elements:
1. It replaces the previously required Assessment of Impediments to Fair Housing (AI) that was not well defined or standardized with an Assessment of Fair Housing (AFH) that is more standardized.
2. HUD now provides data to funded agencies that they are asked to consider in their assessment of the state of fair housing and in establishing goals toward achieving fair housing.
3. Planning processes, such as state and local Consolidated Plans and public housing authority plans required by HUD program recipients, now explicitly incorporate fair housing planning.
4. The rule encourages regional approaches and allows for cross-jurisdictional and cross-public housing authority collaboration.
5. Importantly it requires community participation in the fair housing assessment process in order to ensure the inclusion of voices from those in the protected classes.
What does not change are rules and guidance about how HUD program monies, such as Community Development Block Grant (CBDG), can be spent, but the spending plans must now be directly connected to plans developed in the AFH and use a fair housing lens.
What is the Affirmatively Furthering Fair Housing Tool?
These new requirements are undoubtedly daunting for those agencies who have never had to engage in a fair housing assessment or who have done the minimum required to report the status of fair housing in the areas they serve. The AFFH Assessment Tool that accompanies the rule is intended to guide program recipients through the required Assessment of Fair Housing (AFH), the national uniform data they must consider in that assessment, and suggests a clear method for how to connect their planning documents to fair housing goals by requiring specificity on how their HUD resources will be used to achieve those goals. Finally, the new rule is intended to clarify HUD review standards of the AFH and make technical assistance available (“Final Rule on Affirmatively Furthering Fair Housing” U.S. Department of Housing and Urban Development 2015 p.14). Separate tools for States and Insular Areas will be developed by HUD. The Assessment Tool HUD currently provides is for entitlement jurisdictions and collaborations between entitlement jurisdictions and PHAs where the entitlement jurisdiction is the lead entity in the collaboration.
Who Submits an Assessment of Fair Housing and when is it Submitted?
Jurisdictions who submit Consolidated Plans for CDBG, Emergency Solutions Grants (ESG), HOME, and Housing Opportunities for Persons With AIDS (HOPWA) programs and for PHAs will be required to submit an AFH. Eventually all communities and nonprofits who administer CDBG funds will have to submit an AFH. This encompasses entitlement communities1, non-entitlement2, and rural communities, who as CDBG recipients received $500,000 or less in fiscal year 2015, both qualified and non-qualified PHAs3, and states and insular areas. The deadline for the initial submission will be delayed in some cases and phased in for others. Not until 30 days after the federal Office of Management and Budget (OMB) has approved the AFH tools and published them in the Federal Register will the deadlines be officially set. The earliest deadline for submissions will be 270 days prior to the start of a program year. Since HUD will develop separate AFH tools for states and insular areas that will need their own approval process, these entities will have a later submission deadline for their first AFH.
2015 A Year of Change | Metropolitan Housing Coalition5
Louisville MSA Government Agencies and Entities Obligated under the new Affirmatively Furthering Fair Housing Rule
Entities in the Louisville MSA4 who will need to comply with the new AFFH rule are listed below. The exact deadlines for each will depend on when the AFH Tool is approved by OMB and published in the Federal Register. The rule states that consolidated plan participants should submit their first AFH 270 days prior to the program year that begins on or after January 1, 2017 for which a new consolidated plan is due (AFFH Rule 2015: 321). For instance, because Louisville Metro Government recently submitted their 2015-2019 Consolidated Plan and completed an AI in 2015, the first AFH will not be required until 2020. There are also phase-in dates for small CDBG grant recipients, states, insular areas and PHAs.
Kentucky Louisville Jefferson County Metropolitan Government (Entitlement Community) Louisville Metro Housing Authority (Non-Qualified PHA) Eminence Housing Authority (Qualified PHA) Shelbyville Housing Authority (Qualified PHA) Kentucky Housing Corporation (for the State) The Kentucky Department for Local Government would submit an AFH to
cover Kentucky non-entitlement cities/towns and counties awarded CDBG funds through that department.
Indiana
City of New Albany (Entitlement Community)
New Albany Housing Authority (Non-Qualified PHA)
Charlestown Housing Authority (Qualified PHA)
Jeffersonville Housing Authority (Qualified PHA)
Indiana Office of Community and Rural Affairs (OCRA) would submit an AFH to cover Indiana non-entitlement cities/towns and counties awarded CDBG funds through that department.
Broader Institutional ImpactsThe impacts of the court case and the new AFFH rule will be felt by governmental and non-governmental agencies and organizations because many have direct and indirect impacts on access to fair housing. Numerous agencies at the state and local levels have control over the distribution of federal program funds or incentives that shape access to fair housing. Localities that are entitlement communities also have a certain amount of control over how their allocations beyond CBDG funds contribute to fair housing initiatives in an affirmative manner as required by HUD. In Kentucky, local governments have limited control over many funds since their taxing authority comes from the state legislature. They do, however, have control over items such as bond issues and tax increment financing once enabled by the state and, of course, allocations from their general funds. There are also many non-governmental and private organizations whose policies and practices impact fair housing outcomes. All are now empowered to examine whether those practices and policies have disparate impacts. Some are closely monitored by HUD such as the entitlement communities and public housing authorities, others are not such as real-estate agencies, mortgage lenders and underwriters, and insurance companies. The Texas case and the new AFFH rule empower communities and agencies to regularly review overall trends in the use of any tool used to create or provide access to housing and ensure that it meets fair housing review. A few examples of relevant policy and professional practices and the appropriate decision-making bodies are discussed below to demonstrate areas that deserve ongoing oversight or raise questions for further research.
Louisville Metro Government
The Louisville Metro Government (LMG) 2015 AI contractually promises HUD that a Fair Housing Assessment will be used to “review all actions by all parts of government”(Louisville Metro Government 2015: 31). Therefore, in addition to requirements under the AFFH Rule and the Texas decision, Louisville Metro, through its 2015 AI, makes it advisable that agencies assess the value of each project using a fair housing lens. Louisville Metro’s Develop Louisville agency houses many but not all government agencies and decision makers who can support this requirement to use a fair housing lens in decision making.
metropolitanhousing.org | 2015 State of Metropolitan Housing Report 6
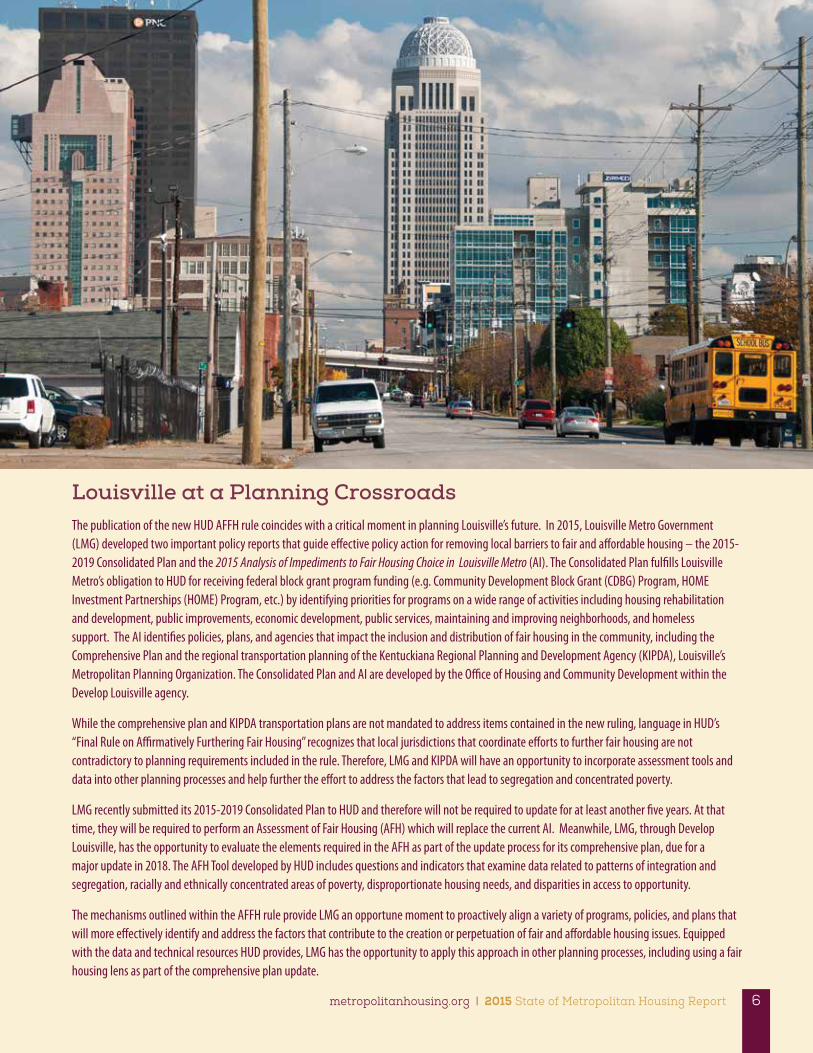
Louisville at a Planning Crossroads The publication of the new HUD AFFH rule coincides with a critical moment in planning Louisville’s future. In 2015, Louisville Metro Government (LMG) developed two important policy reports that guide effective policy action for removing local barriers to fair and affordable housing – the 2015-2019 Consolidated Plan and the 2015 Analysis of Impediments to Fair Housing Choice in Louisville Metro (AI). The Consolidated Plan fulfills Louisville Metro’s obligation to HUD for receiving federal block grant program funding (e.g. Community Development Block Grant (CDBG) Program, HOME Investment Partnerships (HOME) Program, etc.) by identifying priorities for programs on a wide range of activities including housing rehabilitation and development, public improvements, economic development, public services, maintaining and improving neighborhoods, and homeless support. The AI identifies policies, plans, and agencies that impact the inclusion and distribution of fair housing in the community, including the Comprehensive Plan and the regional transportation planning of the Kentuckiana Regional Planning and Development Agency (KIPDA), Louisville’s Metropolitan Planning Organization. The Consolidated Plan and AI are developed by the Office of Housing and Community Development within the Develop Louisville agency.
While the comprehensive plan and KIPDA transportation plans are not mandated to address items contained in the new ruling, language in HUD’s “Final Rule on Affirmatively Furthering Fair Housing” recognizes that local jurisdictions that coordinate efforts to further fair housing are not contradictory to planning requirements included in the rule. Therefore, LMG and KIPDA will have an opportunity to incorporate assessment tools and data into other planning processes and help further the effort to address the factors that lead to segregation and concentrated poverty.
LMG recently submitted its 2015-2019 Consolidated Plan to HUD and therefore will not be required to update for at least another five years. At that time, they will be required to perform an Assessment of Fair Housing (AFH) which will replace the current AI. Meanwhile, LMG, through Develop Louisville, has the opportunity to evaluate the elements required in the AFH as part of the update process for its comprehensive plan, due for a major update in 2018. The AFH Tool developed by HUD includes questions and indicators that examine data related to patterns of integration and segregation, racially and ethnically concentrated areas of poverty, disproportionate housing needs, and disparities in access to opportunity.
The mechanisms outlined within the AFFH rule provide LMG an opportune moment to proactively align a variety of programs, policies, and plans that will more effectively identify and address the factors that contribute to the creation or perpetuation of fair and affordable housing issues. Equipped with the data and technical resources HUD provides, LMG has the opportunity to apply this approach in other planning processes, including using a fair housing lens as part of the comprehensive plan update.
2015 A Year of Change | Metropolitan Housing Coalition7
What is the Role of the Comprehensive Plan? Comprehensive planning is a process and policy tool city governments use to combine their long-range aspirations and actions to create a livable, just, and sustainable future for their jurisdictions. The Comprehensive Plan is the official instrument local governments develop, adopt, and update through legislative action that integrates long- and short-range perspectives on functional elements such as land use, transportation, housing, economic development, public health, and sustainability. Through the integration of these items into a single accessible document, the plan officially serves to guide and coordinate subsequent policies, plans, and programs developed by community leaders and decision makers.
In Kentucky, K.R.S. § 100 is the official state statute that provides the legal authority and minimum requirements for local governments and their planning commissions in developing the contents of a Comprehensive Plan. Local jurisdictions vested with this authority must develop a series of studies analyzing the trends and conditions of a community and a statement of official goals, objectives, and policies addressing the required plan elements. This plan typically serves a 20-year period of guidance, however they must be reviewed and amended every five years by the local planning commission to be current under state law. During that time, Comprehensive Plans guide decisions on public and private land development proposals, public fund (capital) expenditures on infrastructure, and issues of pressing concern such as affordable housing, farmland preservation, and more recently, issues such as sustainability, public health, and climate change adaptation.
Develop Louisville
Louisville Metro’s current Comprehensive Plan is Cornerstone 2020. Adopted in June 2000, the plan articulates the vision and direction for the community’s future growth through its goals and objectives. The plan directs the way the built environment emerges, plot by plot and area by area. The current Cornerstone 2020 plan excluded fair housing, affordable housing and sustainability as specific goals. Cornerstone 2020 had limited vision for transit and for environmental amenities. Louisville Metro will begin the public process of updating the Comprehensive Plan soon and participation is open to all residents and organizations. The Office of Advanced Planning and other agencies who will approve this plan are now empowered to make fair housing needs a top priority given the Texas decision and the AFFH rule.
Zoning
Zoning ordinances shape what gets built and where things get built. Louisville Metro’s Land Development Code can be audited for regulations that impede the fair distribution of affordable housing and revised to address identified obstacles. If a zoning ordinance has a disparate impact on a protected class, that ordinance should be addressed in light of the Texas decision. Louisville has begun this task. See the discussion below regarding new incentives to build multi-unit housing in areas where it was previously prohibited.
Public Infrastructure Investments
As Louisville Metro and associated agencies make infrastructure investments in areas such as transportation, drinking, waste and stormwater systems, and green space, they are now empowered to examine what impacts those investments have on housing accessibility and whether those impacts are disparate. They are also empowered to examine if they assist or hinder Louisville Metro in meeting the requirement to affirmatively further fair housing.
Use of Tax Increment Financing
The Kentucky Cabinet for Economic Development describes Tax Increment Financing (TIF), as enabled under K.R.S. § 424.130, 65.7041 to 7083 and 154.30, as a tool to finance needed infrastructure improvements by capturing the future value of an improved property to pay for the current costs of those improvements. Typically used for commercial development for businesses, a TIF can finance residential development. Even though there is no mandate built into the TIF law to focus on affordable or fair housing, a question can be raised about whether the ways in which TIFs are implemented have disparate impact on classes protected by the Fair Housing Act. Furthermore, the AFH identifies patterns of investment (public or private) in affordable housing as possible determinants of segregation that communities should examine. If Tax Increment Financing is a funding mechanism that funds, among other things, construction of some residences, questions should be asked that reveal how often this has been used to generate affordable housing of the times that it has been used to generate housing. In Louisville, there are no elements of affordable housing included in the over $2 billion on the 2015 list of Louisville Metro TIF projects that have state participation. If Louisville continues to use TIF as a development tool, it is now empowered to call for a careful study as to whether the projects create impediments to affordable housing or if there are disparate impacts that are tied to each project.
The Kentucky Housing Corporation and The Indiana Housing and Community Development Authority
The Kentucky Housing Corporation oversees the allocation of LIHTCs and controls the state Affordable Housing Trust Fund allocations. The Indiana Housing and Community Development Authority administers LIHTC in Indiana.
metropolitanhousing.org | 2015 State of Metropolitan Housing Report 8
As mentioned previously, attention to LIHTC outcomes is necessary to ensure there are not unintentional disparate impacts occurring as a result of how those tax credits and other resources get distributed. Because LIHTC allocations are based on applications and are project based, any review of the outcomes must be multi-year since some areas may put in applications some years but not others, and some may get priority after a year or so of not receiving any distributions. The questions that the Texas case raises about how distributions of these tax credits have the potential to perpetuate concentration of minorities and low-income residents means the process for allocation needs continual oversight and review.
Real Estate Practitioners
Appraisers
Appraisals are used when people are looking to sell, buy, and refinance their homes. It is common knowledge that appraisal values are lower in some areas for reasons that are not always transparent and are thus difficult to evaluate. Commissioned by LMG, the Vacant and Abandoned Property Neighborhood Revitalization Study, published in 2013, looked at challenges to increasing real estate value through reuse of vacant properties in segregated neighborhoods in West Louisville. The study notes that establishing value has been a challenge for several reasons. The study states: “With the highest proportion of non-arm’s length sales since 2009 and the lowest sales price per square foot before or after the recession, the West Louisville neighborhoods have the most notable real estate market challenges in Jefferson County“(pp. 6-17). This poses a unique challenge for appraisers, yet there has not been an intentional response to ensure proper valuation of real estate in these neighborhoods. The Texas decision opens the door to ask the appraisal industries to be more transparent in their valuation process. This would require an answer from the appraisal industry to account for why appraisals are substantively lower in certain neighborhoods,
such as West Louisville, and develop an intentional process to address this disparate outcome.
Mortgage Lenders and Underwriters
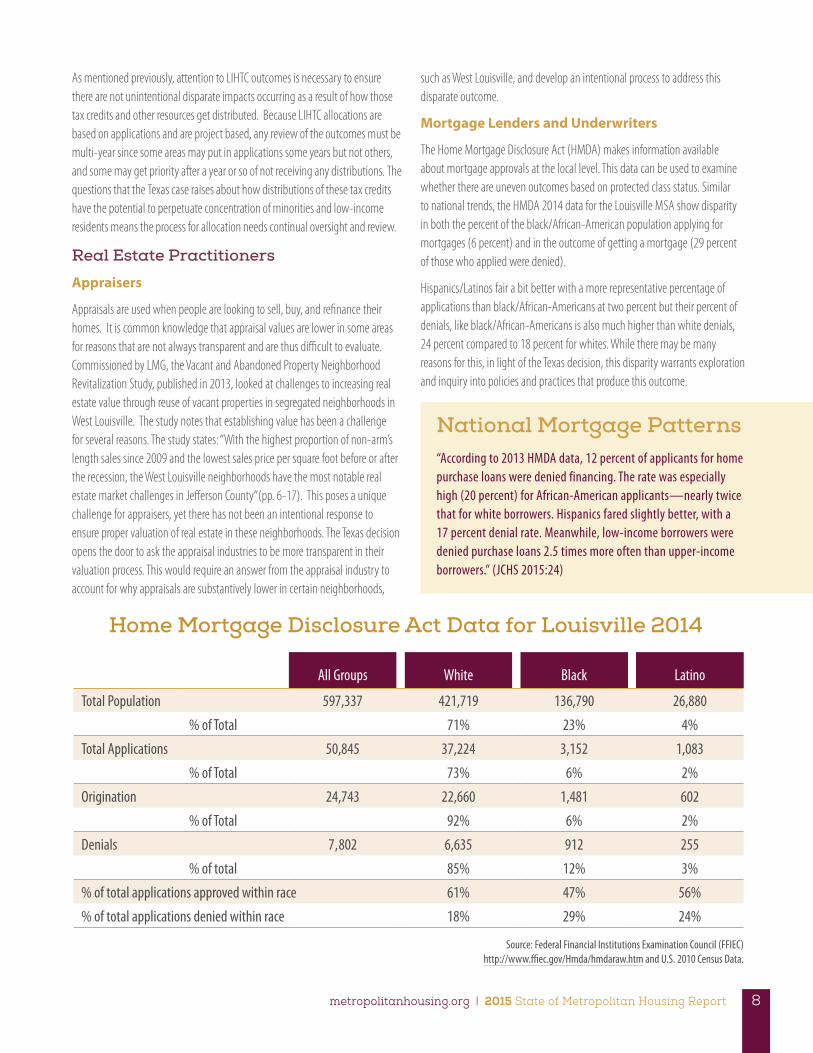
The Home Mortgage Disclosure Act (HMDA) makes information available about mortgage approvals at the local level. This data can be used to examine whether there are uneven outcomes based on protected class status. Similar to national trends, the HMDA 2014 data for the Louisville MSA show disparity in both the percent of the black/African-American population applying for mortgages (6 percent) and in the outcome of getting a mortgage (29 percent of those who applied were denied).
Hispanics/Latinos fair a bit better with a more representative percentage of applications than black/African-Americans at two percent but their percent of denials, like black/African-Americans is also much higher than white denials, 24 percent compared to 18 percent for whites. While there may be many reasons for this, in light of the Texas decision, this disparity warrants exploration and inquiry into policies and practices that produce this outcome.
Home Mortgage Disclosure Act Data for Louisville 2014
All Groups White Black Latino
Total Population 597,337 421,719 136,790 26,880
% of Total 71% 23% 4%
Total Applications 50,845 37,224 3,152 1,083
% of Total 73% 6% 2%
Origination 24,743 22,660 1,481 602
% of Total 92% 6% 2%
Denials 7,802 6,635 912 255
% of total 85% 12% 3%
% of total applications approved within race 61% 47% 56%
% of total applications denied within race 18% 29% 24%
Source: Federal Financial Institutions Examination Council (FFIEC)http://www.ffiec.gov/Hmda/hmdaraw.htm and U.S. 2010 Census Data.
National Mortgage Patterns “According to 2013 HMDA data, 12 percent of applicants for home purchase loans were denied financing. The rate was especially high (20 percent) for African-American applicants—nearly twice that for white borrowers. Hispanics fared slightly better, with a 17 percent denial rate. Meanwhile, low-income borrowers were denied purchase loans 2.5 times more often than upper-income borrowers.” (JCHS 2015:24)
2015 A Year of Change | Metropolitan Housing Coalition9
Lenders might also examine if their policies related to fees for required services have a disparate impact. For instance, do they require all prospective borrowers to pay for a parcel survey and, if not, under what circumstances is that requirement waived? Are there geographic variations in the determination of which fees the borrower must pay? These are difficult for outsiders to the industry to monitor, thus it is the industry that must demonstrate that their internal practices and policies are not perpetuating segregated housing.
Insurance Industry
The rates for insurance in geographic areas with high concentrations of people in protected classes under the Fair Housing Act can slip into a de facto red line increasing rates in areas. A challenge to the insurance industry is to examine the actuarial factors to determine if there is any adjustment possible. For instance, intense home ownership counseling has decades of proven effectiveness in lowering default rates (Smith et. al. 2014). Yet the insurance industry has not recognized this effect in lowering rates.
Homeowners or renters insurance programs and requirements can be examined to identify any geographic concentrations of higher rates that indicate a disparate impact on those living in areas with higher concentrations of minorities and those living in poverty. If there is an alternative measure of risk assessment that the industries can use that would decouple geographic variables, the Texas case makes that a viable option to implement.
Examples of How Louisville Agencies are Currently Addressing Their Obligations
The Louisville Metro Human Relations Commission funded two recent projects that provide considerable relevant information that could be included in a future AFH, the 20-Year Action Plan published in 2014 and Searching for Safe, Fair, and Affordable Housing: Learning from Experiences, An Analysis of Housing Challenges in Louisville Metro released in 2015. The 20-Year Action Plan provides a robust history of housing segregation in Louisville along with a set of clear steps that need to be taken to address current obstacles to furthering fair housing. The new AFFH rule specifically requires communities to address their specific history and develop clear goals related to furthering fair housing and strategies to meet those goals. That this plan has been adopted means that Louisville is a step ahead in fulfilling the requirements of the new AFH Tool. The Analysis of Housing Challenges fills a gap in our knowledge about specific obstacles individuals face in accessing fair and affordable housing. A key finding in that report is that most people interviewed like their current neighborhoods but would like to feel safer and have better access to amenities, schools, and work. This connects to the portions of the AFH Tool that require communities to examine determinants of access such as public transportation, proximity to grocery stores, schools, and safe infrastructure. The report empowers Louisville with justification to link planning for these amenities and needed services to planning for investments in fair housing.
Louisville Metro’s 2015 Analysis of Impediments5 was submitted to and approved by HUD as part of the Consolidated Plan. This HUD-mandated
document is part of a series of promises to HUD to govern spending of federal housing dollars in Louisville. This AI is what will be replaced by the new AFH. The usual term of the AI is five years, which means it expires in 2020. Louisville Metro is already ahead of the curve with their 2015 AI as it contains similar analyses required by the new AFH and has clear recommendations to AFFH. Since it was recently submitted, this gives Louisville Metro time to plan ahead for the new requirements that might not be easy to implement, especially those related to community engagement that move beyond the typical public hearing/notice/request for feedback, one-way communication model.
Changes to Louisville Metro Land Development Code
The Louisville Metro Land Development Code, or the zoning code as it is referred to, is a series of laws governing how every parcel of land in Louisville Metro can be used. This control has led to the exclusion of techniques (i.e. limiting small lot sizes or multi-family) that concentrate affordable housing in over 70 percent of the land that is zoned for residential use. In August 2015, the Louisville Metro Council approved the first step to removing the remaining legal barriers to fair housing opportunities in zoning. The ordinance allows, and provides incentives to encourage, mixed housing types and mixed-income levels in the over 60 percent of acreage zoned for single-family homes on large lot sizes, a barrier to affordable housing techniques. The zoning districts are R-4 which requires 9,000 square feet per single-family lot and R-5 which requires 6,000 square feet per lot. The incentive provides a modestly increased allowable density (i.e. in R-4 a density of 4.84 units per acre could increase to 6.05 units per acre) in exchange for allowing a mix of multi-family and single-family housing units and requires that some of the units be affordable for those in the lowest 40th percentile of medium household income levels in Louisville. The ordinance also allows smaller lot sizes for single-family homes and requires compatibility of design.
The Louisville CARES program6 was proposed in 2015 as a vehicle administered by Louisville Metro’s Office of Housing and Community Development to provide gap financing for the development of multi-family rental properties that are affordable to households making 80 percent or less of area median income. Developers will often not see the benefit of including affordable housing in the projects they design. This incentive is intended to get them past that obstacle. The proposed manual and guidelines were open for community comment until November 4, 2015. Once launched, the program intends to assist in financing up to 750 units.
Louisville Affordable Housing Trust Fund
Created in 2008, the Louisville Affordable Housing Trust Fund makes grants, loans and technical assistance available to builders and developers to construct affordable housing when other lending options are not available or do not make up for the risks. They currently administer a revolving loan fund and the HOMEBuyer Program7. The funds for their activities come from Louisville Metro Government, the 2012 National Mortgage Settlement fund, corporations, and individual donors. The agency continues to seek a source of ongoing dedicated revenue.
metropolitanhousing.org | 2015 State of Metropolitan Housing Report 10
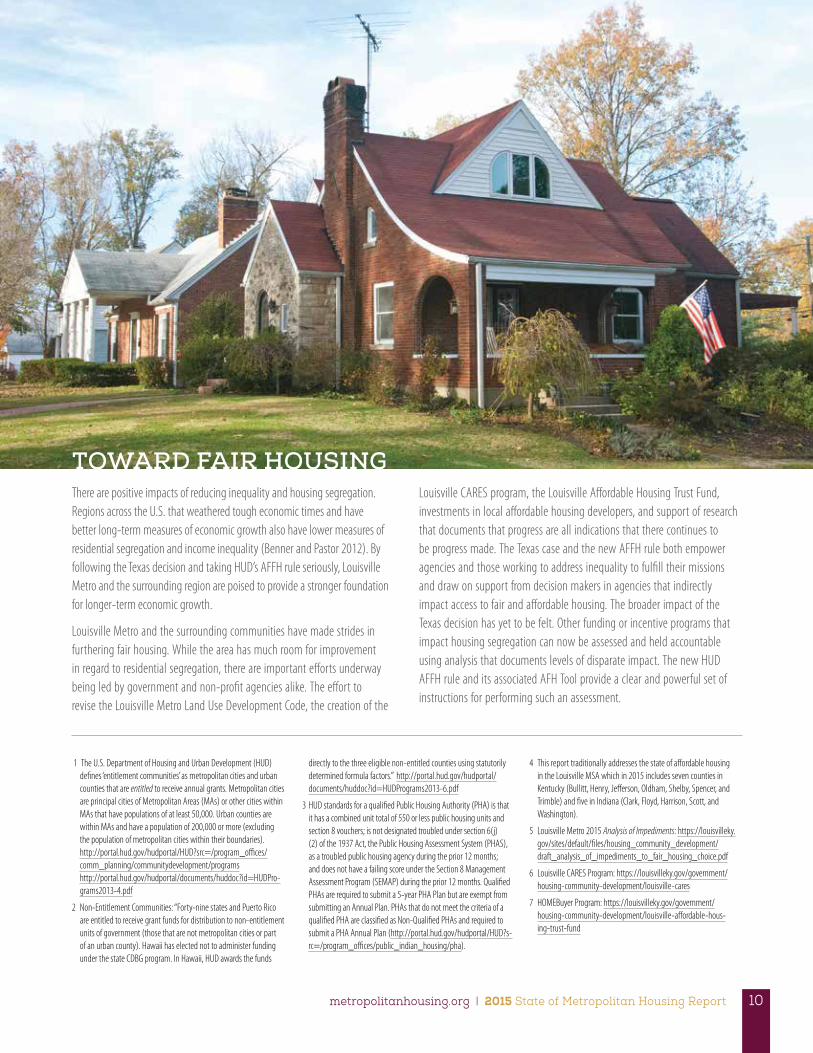
TOWARD FAIR HOUSINGThere are positive impacts of reducing inequality and housing segregation. Regions across the U.S. that weathered tough economic times and have better long-term measures of economic growth also have lower measures of residential segregation and income inequality (Benner and Pastor 2012). By following the Texas decision and taking HUD’s AFFH rule seriously, Louisville Metro and the surrounding region are poised to provide a stronger foundation for longer-term economic growth.
Louisville Metro and the surrounding communities have made strides in furthering fair housing. While the area has much room for improvement in regard to residential segregation, there are important efforts underway being led by government and non-profit agencies alike. The effort to revise the Louisville Metro Land Use Development Code, the creation of the
1 The U.S. Department of Housing and Urban Development (HUD) defines ‘entitlement communities’ as metropolitan cities and urban counties that are entitled to receive annual grants. Metropolitan cities are principal cities of Metropolitan Areas (MAs) or other cities within MAs that have populations of at least 50,000. Urban counties are within MAs and have a population of 200,000 or more (excluding the population of metropolitan cities within their boundaries). http://portal.hud.gov/hudportal/HUD?src=/program_offices/comm_planning/communitydevelopment/programs http://portal.hud.gov/hudportal/documents/huddoc?id=HUDPro-grams2013-4.pdf
2 Non-Entitlement Communities: “Forty-nine states and Puerto Rico are entitled to receive grant funds for distribution to non-entitlement units of government (those that are not metropolitan cities or part of an urban county). Hawaii has elected not to administer funding under the state CDBG program. In Hawaii, HUD awards the funds
directly to the three eligible non-entitled counties using statutorily determined formula factors.” http://portal.hud.gov/hudportal/documents/huddoc?id=HUDPrograms2013-6.pdf
3 HUD standards for a qualified Public Housing Authority (PHA) is that it has a combined unit total of 550 or less public housing units and section 8 vouchers; is not designated troubled under section 6(j)(2) of the 1937 Act, the Public Housing Assessment System (PHAS), as a troubled public housing agency during the prior 12 months; and does not have a failing score under the Section 8 Management Assessment Program (SEMAP) during the prior 12 months. Qualified PHAs are required to submit a 5-year PHA Plan but are exempt from submitting an Annual Plan. PHAs that do not meet the criteria of a qualified PHA are classified as Non-Qualified PHAs and required to submit a PHA Annual Plan (http://portal.hud.gov/hudportal/HUD?s-rc=/program_offices/public_indian_housing/pha).
4 This report traditionally addresses the state of affordable housing in the Louisville MSA which in 2015 includes seven counties in Kentucky (Bullitt, Henry, Jefferson, Oldham, Shelby, Spencer, and Trimble) and five in Indiana (Clark, Floyd, Harrison, Scott, and Washington).
5 Louisville Metro 2015 Analysis of Impediments: https://louisvilleky.gov/sites/default/files/housing_community_development/draft_analysis_of_impediments_to_fair_housing_choice.pdf
6 Louisville CARES Program: https://louisvilleky.gov/government/housing-community-development/louisville-cares
7 HOMEBuyer Program: https://louisvilleky.gov/government/housing-community-development/louisville-affordable-hous-ing-trust-fund
Louisville CARES program, the Louisville Affordable Housing Trust Fund, investments in local affordable housing developers, and support of research that documents that progress are all indications that there continues to be progress made. The Texas case and the new AFFH rule both empower agencies and those working to address inequality to fulfill their missions and draw on support from decision makers in agencies that indirectly impact access to fair and affordable housing. The broader impact of the Texas decision has yet to be felt. Other funding or incentive programs that impact housing segregation can now be assessed and held accountable using analysis that documents levels of disparate impact. The new HUD AFFH rule and its associated AFH Tool provide a clear and powerful set of instructions for performing such an assessment.
CONCENTRATION OF SUBSIDIZED HOUSING
Measure One
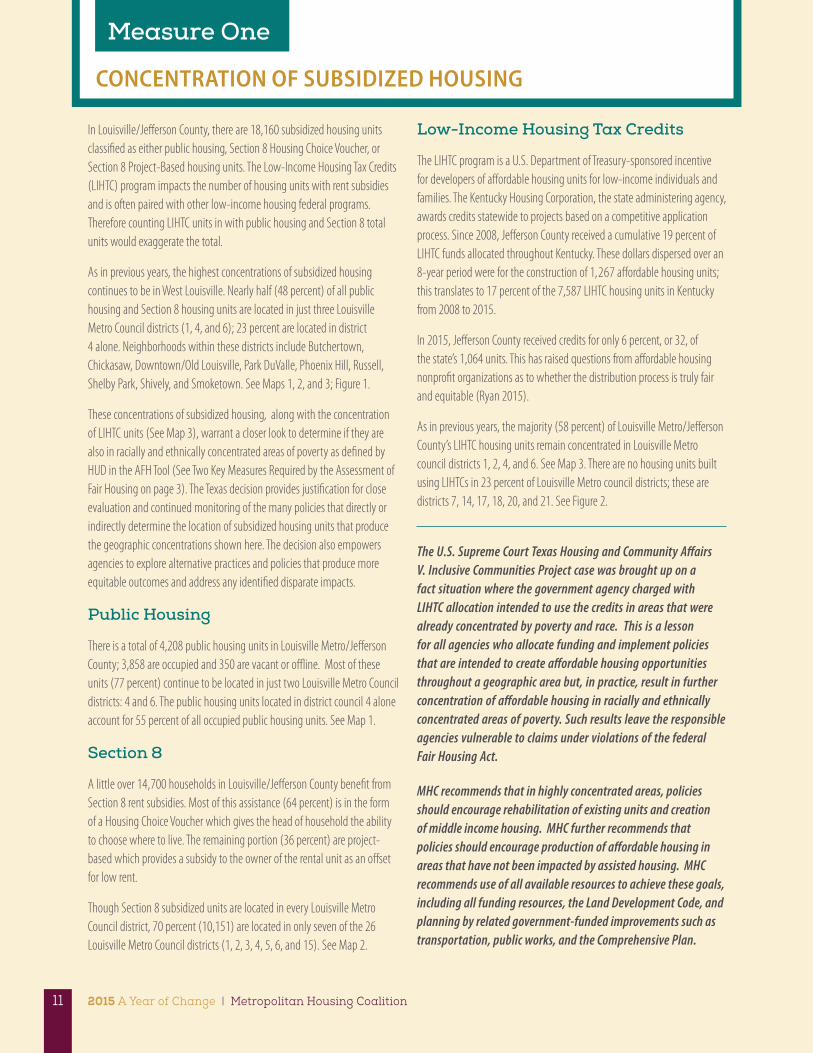
In Louisville/Jefferson County, there are 18,160 subsidized housing units classified as either public housing, Section 8 Housing Choice Voucher, or Section 8 Project-Based housing units. The Low-Income Housing Tax Credits (LIHTC) program impacts the number of housing units with rent subsidies and is often paired with other low-income housing federal programs. Therefore counting LIHTC units in with public housing and Section 8 total units would exaggerate the total.
As in previous years, the highest concentrations of subsidized housing continues to be in West Louisville. Nearly half (48 percent) of all public housing and Section 8 housing units are located in just three Louisville Metro Council districts (1, 4, and 6); 23 percent are located in district 4 alone. Neighborhoods within these districts include Butchertown, Chickasaw, Downtown/Old Louisville, Park DuValle, Phoenix Hill, Russell, Shelby Park, Shively, and Smoketown. See Maps 1, 2, and 3; Figure 1.
These concentrations of subsidized housing, along with the concentration of LIHTC units (See Map 3), warrant a closer look to determine if they are also in racially and ethnically concentrated areas of poverty as defined by HUD in the AFH Tool (See Two Key Measures Required by the Assessment of Fair Housing on page 3). The Texas decision provides justification for close evaluation and continued monitoring of the many policies that directly or indirectly determine the location of subsidized housing units that produce the geographic concentrations shown here. The decision also empowers agencies to explore alternative practices and policies that produce more equitable outcomes and address any identified disparate impacts.
Public Housing
There is a total of 4,208 public housing units in Louisville Metro/Jefferson County; 3,858 are occupied and 350 are vacant or offline. Most of these units (77 percent) continue to be located in just two Louisville Metro Council districts: 4 and 6. The public housing units located in district council 4 alone account for 55 percent of all occupied public housing units. See Map 1.
Section 8
A little over 14,700 households in Louisville/Jefferson County benefit from Section 8 rent subsidies. Most of this assistance (64 percent) is in the form of a Housing Choice Voucher which gives the head of household the ability to choose where to live. The remaining portion (36 percent) are project-based which provides a subsidy to the owner of the rental unit as an offset for low rent.
Though Section 8 subsidized units are located in every Louisville Metro Council district, 70 percent (10,151) are located in only seven of the 26 Louisville Metro Council districts (1, 2, 3, 4, 5, 6, and 15). See Map 2.
Low-Income Housing Tax Credits
The LIHTC program is a U.S. Department of Treasury-sponsored incentive for developers of affordable housing units for low-income individuals and families. The Kentucky Housing Corporation, the state administering agency, awards credits statewide to projects based on a competitive application process. Since 2008, Jefferson County received a cumulative 19 percent of LIHTC funds allocated throughout Kentucky. These dollars dispersed over an 8-year period were for the construction of 1,267 affordable housing units; this translates to 17 percent of the 7,587 LIHTC housing units in Kentucky from 2008 to 2015.
In 2015, Jefferson County received credits for only 6 percent, or 32, of the state’s 1,064 units. This has raised questions from affordable housing nonprofit organizations as to whether the distribution process is truly fair and equitable (Ryan 2015).
As in previous years, the majority (58 percent) of Louisville Metro/Jefferson County’s LIHTC housing units remain concentrated in Louisville Metro council districts 1, 2, 4, and 6. See Map 3. There are no housing units built using LIHTCs in 23 percent of Louisville Metro council districts; these are districts 7, 14, 17, 18, 20, and 21. See Figure 2.
The U.S. Supreme Court Texas Housing and Community Affairs V. Inclusive Communities Project case was brought up on a fact situation where the government agency charged with LIHTC allocation intended to use the credits in areas that were already concentrated by poverty and race. This is a lesson for all agencies who allocate funding and implement policies that are intended to create affordable housing opportunities throughout a geographic area but, in practice, result in further concentration of affordable housing in racially and ethnically concentrated areas of poverty. Such results leave the responsible agencies vulnerable to claims under violations of the federal Fair Housing Act.
MHC recommends that in highly concentrated areas, policies should encourage rehabilitation of existing units and creation of middle income housing. MHC further recommends that policies should encourage production of affordable housing in areas that have not been impacted by assisted housing. MHC recommends use of all available resources to achieve these goals, including all funding resources, the Land Development Code, and planning by related government-funded improvements such as transportation, public works, and the Comprehensive Plan.
2015 A Year of Change | Metropolitan Housing Coalition11
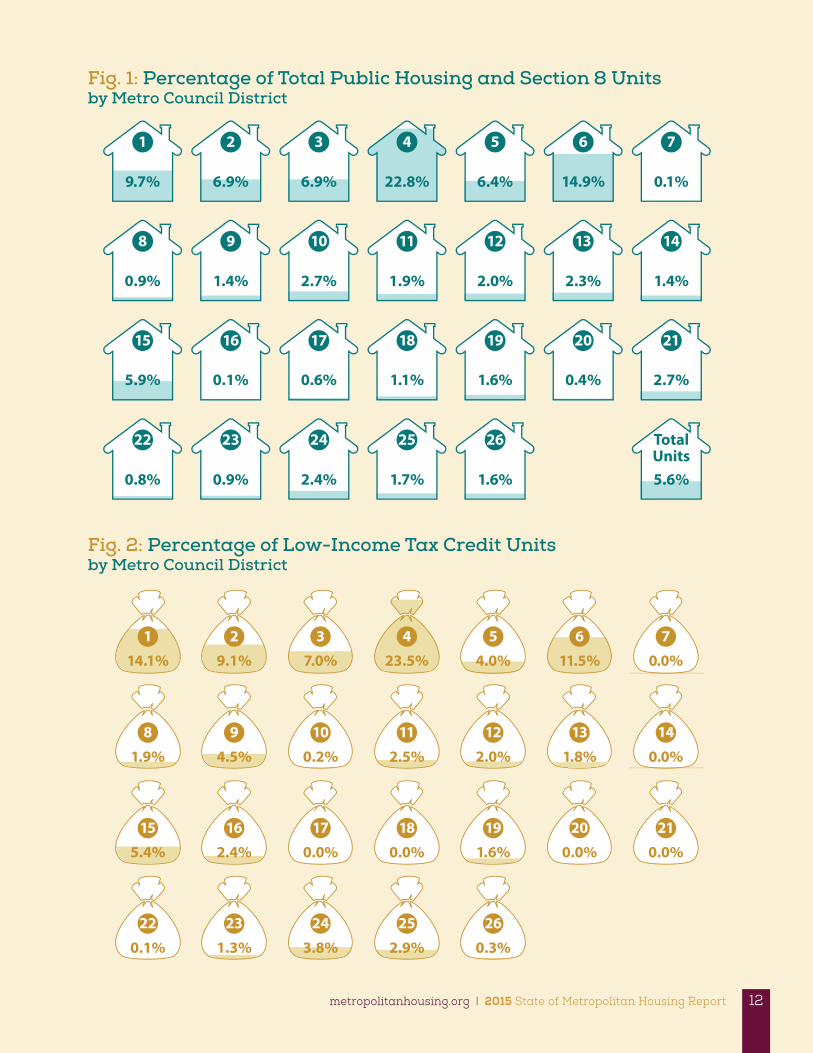
Fig. 1: Percentage of Total Public Housing and Section 8 Units by Metro Council District
Fig. 2: Percentage of Low-Income Tax Credit Units by Metro Council District
1 2 3 4 5 6 7
8 9 10 11 12 13 14
15 16 17 18 19 20 21
22 23 24 25 26
9.7% 6.9% 6.9% 22.8% 6.4% 14.9% 0.1%
0.9% 1.4% 2.7% 1.9% 2.0% 2.3% 1.4%
5.9% 0.1% 0.6% 1.1% 1.6% 0.4% 2.7%
0.8% 0.9% 2.4% 1.7% 1.6%
TotalUnits5.6%
1 2 3 4 5 6 7
14.1% 9.1% 7.0% 23.5% 4.0% 11.5% 0.0%
1.9% 4.5% 0.2% 2.5% 2.0% 1.8% 0.0%
5.4% 2.4% 0.0% 0.0% 1.6% 0.0% 0.0%
0.1% 1.3% 3.8% 2.9% 0.3%
22 23 24 25 26
8 9 10 11 12 13 14
15 16 17 18 19 20 21
metropolitanhousing.org | 2015 State of Metropolitan Housing Report 12
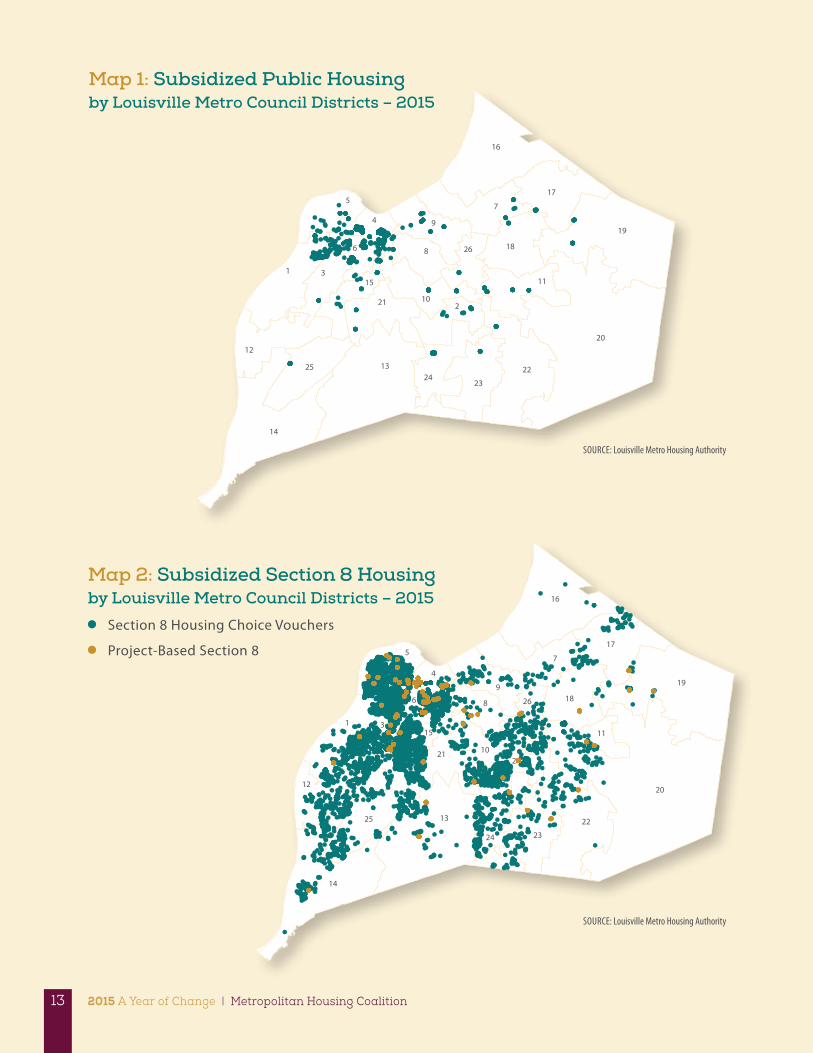
SOURCE: Louisville Metro Housing Authority
SOURCE: Louisville Metro Housing Authority
Map 2: Subsidized Section 8 Housing by Louisville Metro Council Districts – 2015
20
13
19
1
14
16
7
9
22
5
2
3
17
8
12
4
23
25
11
18
21
24
6
10
15
26
Section 8 Housing Choice Vouchers
Project-Based Section 8
20
13
19
1
14
16
7
9
22
5
2
3
17
8
12
4
23
25
11
18
21
24
6
10
15
26
Map 1: Subsidized Public Housing by Louisville Metro Council Districts – 2015
2015 A Year of Change | Metropolitan Housing Coalition13
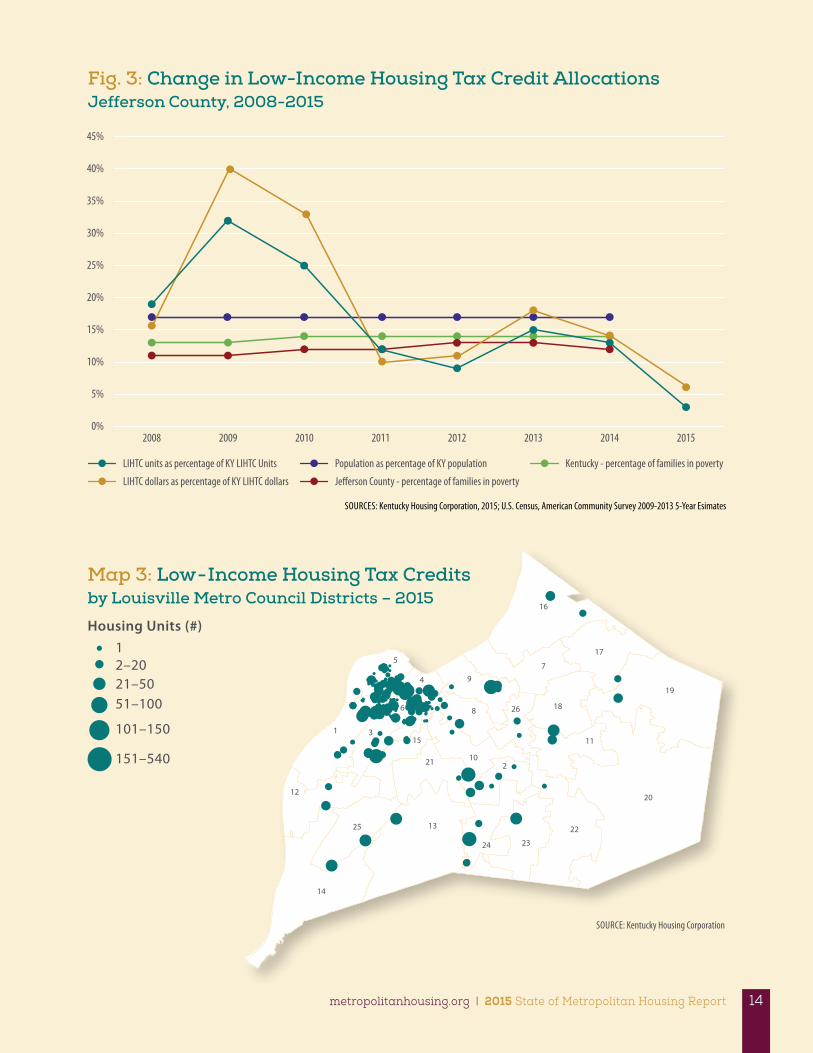
Fig. 3: Change in Low-Income Housing Tax Credit Allocations Jefferson County, 2008-2015
Map 3: Low-Income Housing Tax Credits by Louisville Metro Council Districts – 2015
20
13
19
1
14
16
79
22
5
2
3
17
8
12
4
23
25
11
18
21
24
6
10
15
26
0%
5%
10%
15%
20%
25%
30%
35%
40%
45%
2008 2009 2010 2011 2012 2013 2014 2015
LIHTC units as percentage of KY LIHTC Units
LIHTC dollars as percentage of KY LIHTC dollars
Population as percentage of KY population
Jefferson County - percentage of families in poverty
Kentucky - percentage of families in poverty
SOURCES: Kentucky Housing Corporation, 2015; U.S. Census, American Community Survey 2009-2013 5-Year Esimates
SOURCE: Kentucky Housing Corporation
Housing Units (#) 1 2–20 21–50
51–100
101–150
151–540
metropolitanhousing.org | 2015 State of Metropolitan Housing Report 14
HOUSING SEGREGATION
Measure Two
Poverty
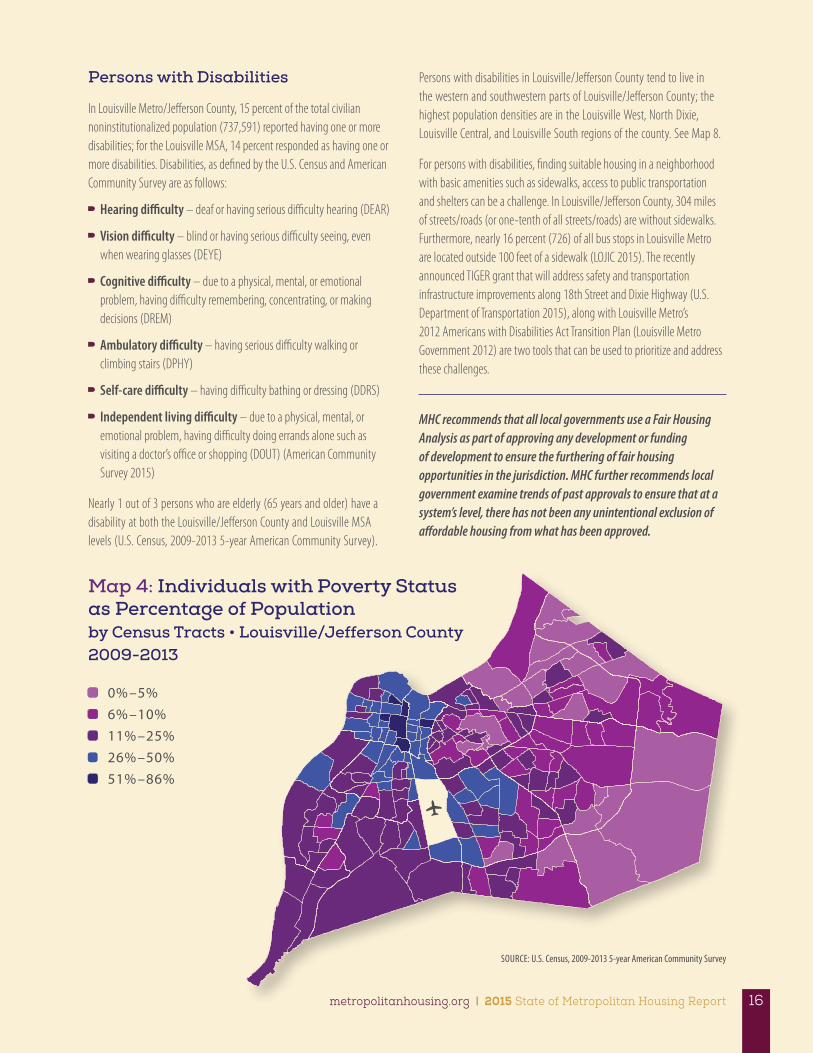
In both Louisville/Jefferson County and in the Louisville MSA, 16 percent of individuals reported income below the federal poverty level. Furthermore, the annual income for 15 percent of all households in Louisville/Jefferson County is less than $15,000; for the Louisville MSA, 13 percent have household incomes of less than $15,000.
The poverty rate (12 percent) for those who are white in Louisville/Jefferson County and the Louisville MSA continues to be significantly lower than black/African-Americans (32 percent in Louisville/Jefferson County and 31 percent in the Louisville MSA). Individuals of Hispanic or Latino origin have poverty rates in Louisville/Jefferson County of 29 percent and in the Louisville MSA, 30 percent. Poverty rates for individuals who are black/African-American and/or Hispanic/Latino continue to be more than twice the rate than white individuals in both Louisville/Jefferson County and the Louisville MSA.
Poverty rates for both seniors 65 and older and for persons with disabilities who are 16 and older remains the same as reported in the 2014 State of Metropolitan Housing Report. The poverty rate for seniors 65 and older in both Louisville/Jefferson County and the Louisville MSA is 9 percent. For persons with disabilities who are 16 and older, the poverty rate is 25 percent for those who live in Louisville Metro/Jefferson County, and for the entire Louisville MSA, 23 percent of persons with disabilities who are 16 and older have 12-month incomes below the poverty level (American Community Survey, 2013 5-year estimates).
When it comes to facing poverty, families with children are at the greatest risk. In Louisville/Jefferson County, 24 percent of all families with children have annual incomes below the poverty level. Of these families, 24 percent are married couples, 8 percent are families headed by a male-householder, and 68 percent are single mothers. Data for the broader Louisville MSA show, 21 percent of all families with children live in poverty; of this group, 26 percent are married-couples, 9 percent are single fathers, and 65 percent are headed by a single female. On average, 60 percent of families with children in poverty who live in Louisville/Jefferson County have children ages 6 to 17; in the Louisville MSA, the families with children ages 6 to 17 comprise 62 percent of all families with children who live in poverty.
Race and Ethnicity
Louisville/Jefferson County continues to be a highly segregated community. The black/African-American population in Louisville/Jefferson County is largely concentrated in neighborhoods in West Louisville, Smoketown/Shelby Park, and Buechel/Indian Trail/Newburg. Areas with the lowest concentrations of Louisville/Jefferson County’s black/African-American
residents include Louisville East, East Jefferson, Northeast Jefferson, Floyd’s Fork, and Pond Creek; with the exception of Louisville East, these areas are outside the urban service district (the former Louisville city limits). See Map 5.
The population in Louisville/Jefferson County and the surrounding counties that form the Louisville MSA continues to be predominantly white, 74 percent and 81 percent respectively. The population of either white or black/African-American accounts for 94 percent of the population in both Louisville/Jefferson County and in the Louisville MSA, it is 95 percent.
Those who are black/African-American represent 21 percent of the population in Louisville/Jefferson County and 14 percent in the other Louisville MSA counties. The black/African-American residents in Louisville/Jefferson County represent 45 percent of all black/ African Americans who reside in Kentucky.
The Hispanic/Latino representation in Louisville/Jefferson County and the Louisville MSA is 5 percent and 4 percent respectively. This is a 1 percent increase from 2014 at both the county and MSA level. Hispanic/Latino population in Louisville/Jefferson County comprises one-fourth of the entire Hispanic/Latino population in Kentucky.
Most Hispanics/Latinos in Louisville/Jefferson County live in the Louisville South, Central Jefferson, and Pond Creek regions. The highest concentrations of Hispanic/Latinos are in census tracts located in Pond Creek just south of the Louisville International Airport and in Central Jefferson in neighborhoods located along Preston Highway (U.S. Census, 2009-2013 5-year American Community Survey). See Map 6.
Household Type
In Louisville/Jefferson County, 61 percent of households are classified as family households; the Louisville MSA shows a higher percentage (66 percent). Of the 187,930 family households in Louisville/Jefferson County, 42 percent are married-couple households, 15 percent are female-headed family households (no husband present), and 7 percent are male-headed family households (no wife present). For the Louisville MSA, 47 percent are married-couple family households, 14 percent are female-headed family households, and 7 percent single-male head of household.
Female-headed households with children with ages under 18 years in Louisville/Jefferson County are concentrated in the western, central, and southeast central regions. Neighborhoods include Russell, California, Park Hill, Park DuValle, Portland, Shawnee, Smoketown, Butchertown, Newburg, and Buechel. In these neighborhoods, 30 percent to 78 percent of all households are female-headed with children with ages under 18 years (American Community Survey, 2013 5-year estimates). See Map 7.
2015 A Year of Change | Metropolitan Housing Coalition15
Persons with Disabilities
In Louisville Metro/Jefferson County, 15 percent of the total civilian noninstitutionalized population (737,591) reported having one or more disabilities; for the Louisville MSA, 14 percent responded as having one or more disabilities. Disabilities, as defined by the U.S. Census and American Community Survey are as follows:
Hearing difficulty – deaf or having serious difficulty hearing (DEAR)
Vision difficulty – blind or having serious difficulty seeing, even when wearing glasses (DEYE)
Cognitive difficulty – due to a physical, mental, or emotional problem, having difficulty remembering, concentrating, or making decisions (DREM)
Ambulatory difficulty – having serious difficulty walking or climbing stairs (DPHY)
Self-care difficulty – having difficulty bathing or dressing (DDRS)
Independent living difficulty – due to a physical, mental, or emotional problem, having difficulty doing errands alone such as visiting a doctor’s office or shopping (DOUT) (American Community Survey 2015)
Nearly 1 out of 3 persons who are elderly (65 years and older) have a disability at both the Louisville/Jefferson County and Louisville MSA levels (U.S. Census, 2009-2013 5-year American Community Survey).
Persons with disabilities in Louisville/Jefferson County tend to live in the western and southwestern parts of Louisville/Jefferson County; the highest population densities are in the Louisville West, North Dixie, Louisville Central, and Louisville South regions of the county. See Map 8.
For persons with disabilities, finding suitable housing in a neighborhood with basic amenities such as sidewalks, access to public transportation and shelters can be a challenge. In Louisville/Jefferson County, 304 miles of streets/roads (or one-tenth of all streets/roads) are without sidewalks. Furthermore, nearly 16 percent (726) of all bus stops in Louisville Metro are located outside 100 feet of a sidewalk (LOJIC 2015). The recently announced TIGER grant that will address safety and transportation infrastructure improvements along 18th Street and Dixie Highway (U.S. Department of Transportation 2015), along with Louisville Metro’s 2012 Americans with Disabilities Act Transition Plan (Louisville Metro Government 2012) are two tools that can be used to prioritize and address these challenges.
MHC recommends that all local governments use a Fair Housing Analysis as part of approving any development or funding of development to ensure the furthering of fair housing opportunities in the jurisdiction. MHC further recommends local government examine trends of past approvals to ensure that at a system’s level, there has not been any unintentional exclusion of affordable housing from what has been approved.
Map 4: Individuals with Poverty Status as Percentage of Population by Census Tracts • Louisville/Jefferson County 2009-2013
0% –5%
6% –10%
11% –25%
26% –50%
51% –86%
SOURCE: U.S. Census, 2009-2013 5-year American Community Survey
metropolitanhousing.org | 2015 State of Metropolitan Housing Report 16
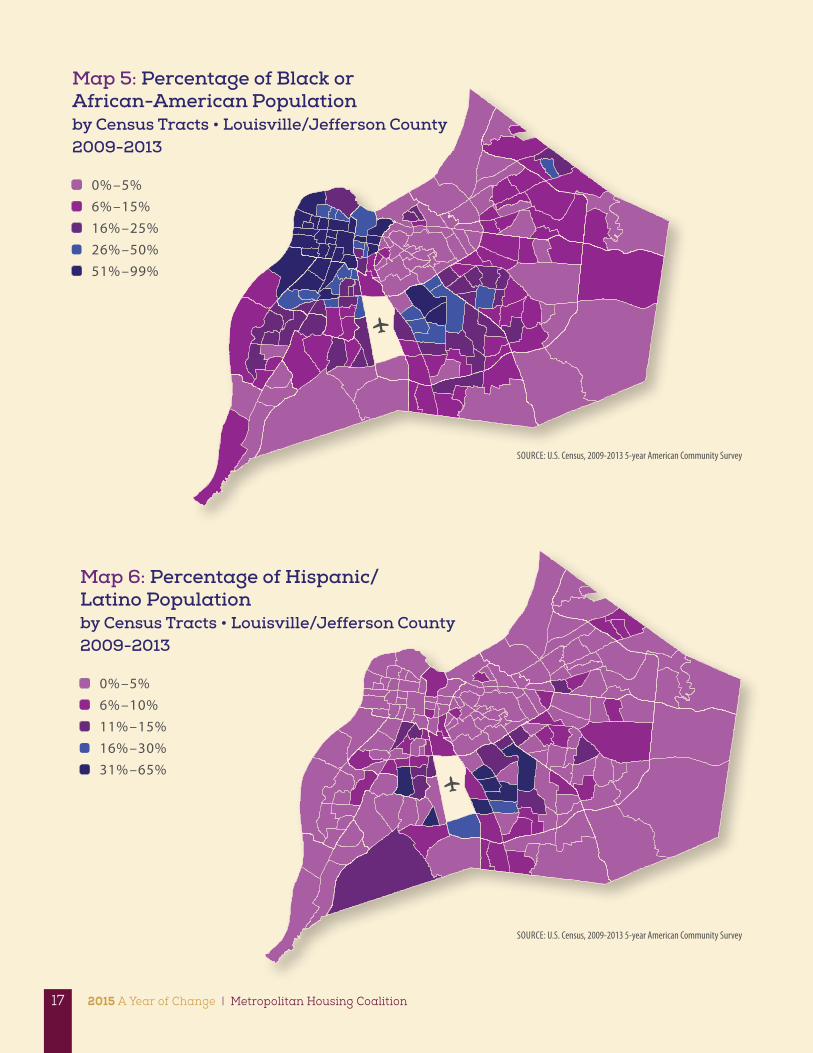
Map 6: Percentage of Hispanic/ Latino Population by Census Tracts • Louisville/Jefferson County 2009-2013
Map 5: Percentage of Black or African-American Population by Census Tracts • Louisville/Jefferson County 2009-2013
0% –5%
6% –10%
11% –15%
16% –30%
31% –65%
0% –5%
6% –15%
16% –25%
26% –50%
51% –99%
SOURCE: U.S. Census, 2009-2013 5-year American Community Survey
SOURCE: U.S. Census, 2009-2013 5-year American Community Survey
2015 A Year of Change | Metropolitan Housing Coalition17
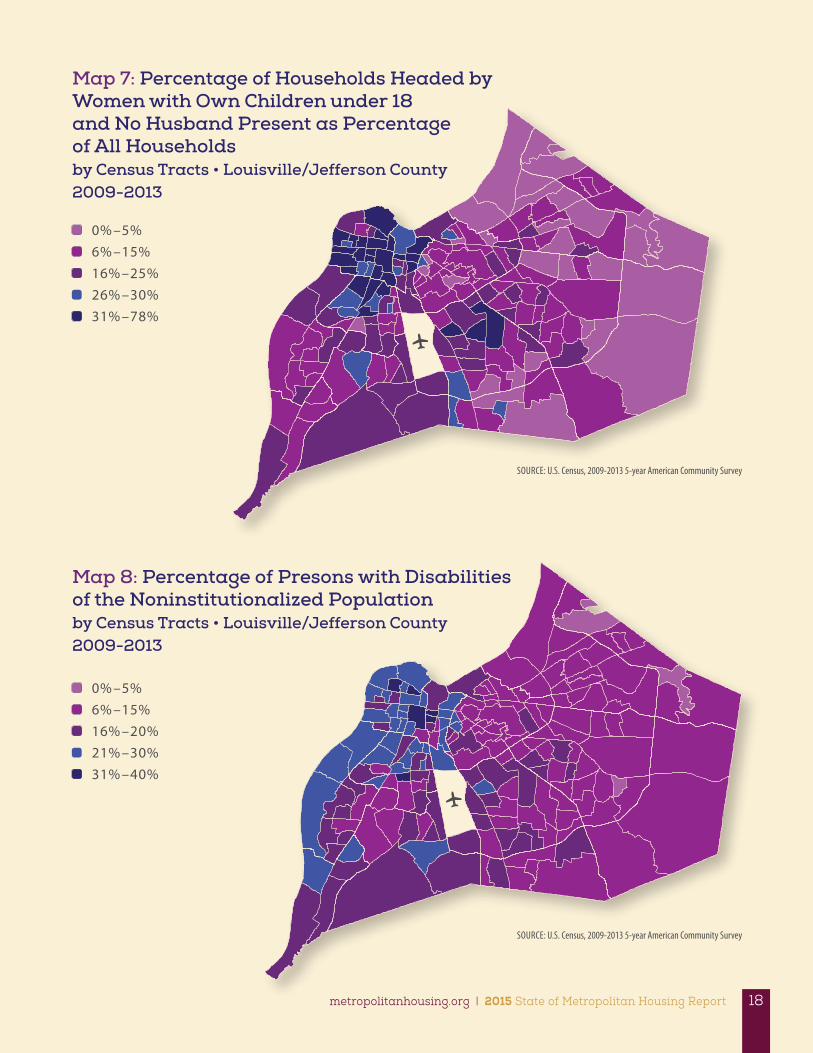
Map 8: Percentage of Presons with Disabilities of the Noninstitutionalized Population by Census Tracts • Louisville/Jefferson County 2009-2013
Map 7: Percentage of Households Headed by Women with Own Children under 18 and No Husband Present as Percentage of All Households by Census Tracts • Louisville/Jefferson County 2009-2013
0% –5%
6% –15%
16% –20%
21% –30%
31% –40%
0% –5%
6% –15%
16% –25%
26% –30%
31% –78%
SOURCE: U.S. Census, 2009-2013 5-year American Community Survey
SOURCE: U.S. Census, 2009-2013 5-year American Community Survey
metropolitanhousing.org | 2015 State of Metropolitan Housing Report 18
FAIR MARKET RENTS
Measure Three
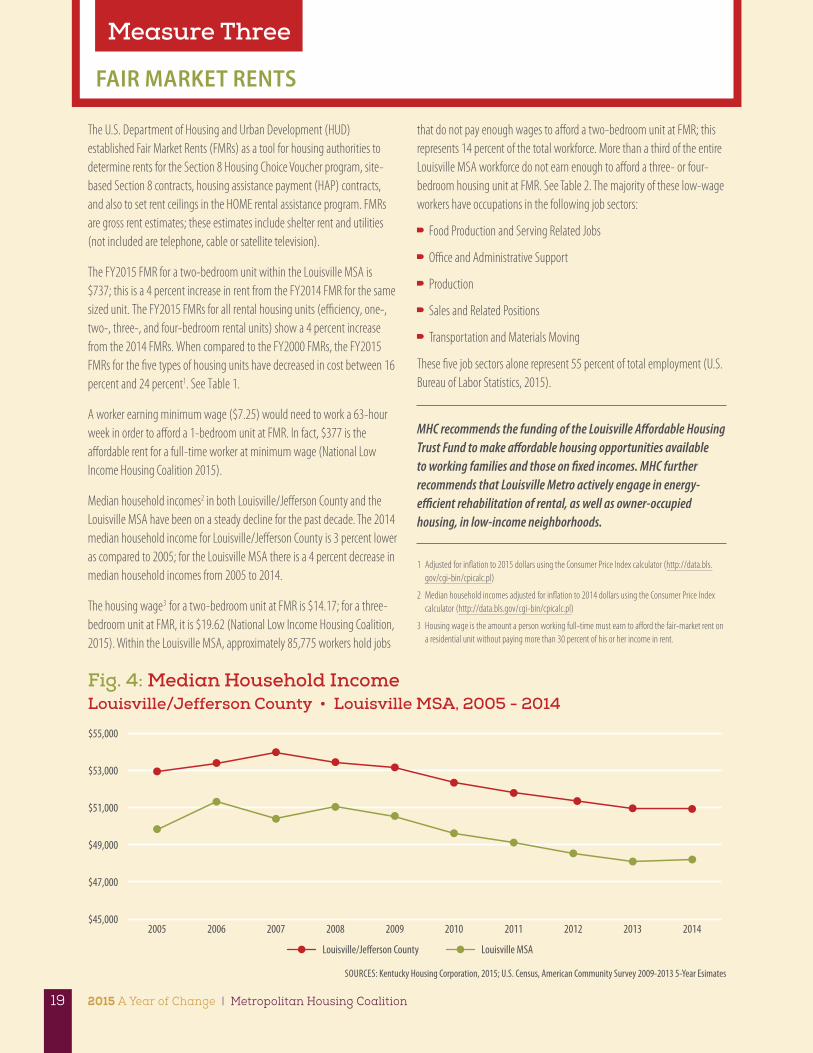
The U.S. Department of Housing and Urban Development (HUD) established Fair Market Rents (FMRs) as a tool for housing authorities to determine rents for the Section 8 Housing Choice Voucher program, site-based Section 8 contracts, housing assistance payment (HAP) contracts, and also to set rent ceilings in the HOME rental assistance program. FMRs are gross rent estimates; these estimates include shelter rent and utilities (not included are telephone, cable or satellite television).
The FY2015 FMR for a two-bedroom unit within the Louisville MSA is $737; this is a 4 percent increase in rent from the FY2014 FMR for the same sized unit. The FY2015 FMRs for all rental housing units (efficiency, one-, two-, three-, and four-bedroom rental units) show a 4 percent increase from the 2014 FMRs. When compared to the FY2000 FMRs, the FY2015 FMRs for the five types of housing units have decreased in cost between 16 percent and 24 percent1. See Table 1.
A worker earning minimum wage ($7.25) would need to work a 63-hour week in order to afford a 1-bedroom unit at FMR. In fact, $377 is the affordable rent for a full-time worker at minimum wage (National Low Income Housing Coalition 2015).
Median household incomes2 in both Louisville/Jefferson County and the Louisville MSA have been on a steady decline for the past decade. The 2014 median household income for Louisville/Jefferson County is 3 percent lower as compared to 2005; for the Louisville MSA there is a 4 percent decrease in median household incomes from 2005 to 2014.
The housing wage3 for a two-bedroom unit at FMR is $14.17; for a three-bedroom unit at FMR, it is $19.62 (National Low Income Housing Coalition, 2015). Within the Louisville MSA, approximately 85,775 workers hold jobs
that do not pay enough wages to afford a two-bedroom unit at FMR; this represents 14 percent of the total workforce. More than a third of the entire Louisville MSA workforce do not earn enough to afford a three- or four-bedroom housing unit at FMR. See Table 2. The majority of these low-wage workers have occupations in the following job sectors:
Food Production and Serving Related Jobs
Office and Administrative Support
Production
Sales and Related Positions
Transportation and Materials Moving
These five job sectors alone represent 55 percent of total employment (U.S. Bureau of Labor Statistics, 2015).
MHC recommends the funding of the Louisville Affordable Housing Trust Fund to make affordable housing opportunities available to working families and those on fixed incomes. MHC further recommends that Louisville Metro actively engage in energy-efficient rehabilitation of rental, as well as owner-occupied housing, in low-income neighborhoods.
1 Adjusted for inflation to 2015 dollars using the Consumer Price Index calculator (http://data.bls.gov/cgi-bin/cpicalc.pl)
2 Median household incomes adjusted for inflation to 2014 dollars using the Consumer Price Index calculator (http://data.bls.gov/cgi-bin/cpicalc.pl)
3 Housing wage is the amount a person working full-time must earn to afford the fair-market rent on a residential unit without paying more than 30 percent of his or her income in rent.
Fig. 4: Median Household Income Louisville/Jefferson County • Louisville MSA, 2005 - 2014
2008200720062005 2009 2010 2011 2012 2013 2014$45,000
$47,000
$49,000
$51,000
$53,000
$55,000
Louisville/Jefferson County Louisville MSA
SOURCES: Kentucky Housing Corporation, 2015; U.S. Census, American Community Survey 2009-2013 5-Year Esimates
2015 A Year of Change | Metropolitan Housing Coalition19
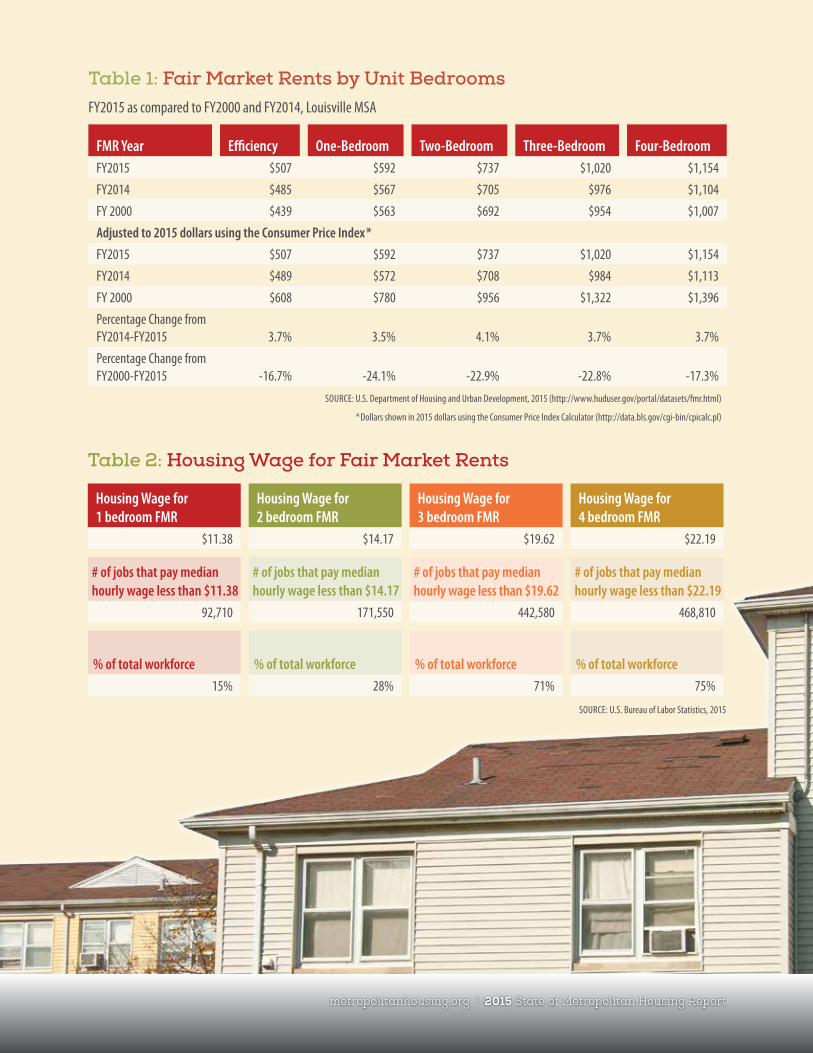
Table 2: Housing Wage for Fair Market Rents
Housing Wage for 1 bedroom FMR
Housing Wage for2 bedroom FMR
Housing Wage for3 bedroom FMR
Housing Wage for4 bedroom FMR
$11.38 $14.17 $19.62 $22.19
# of jobs that pay median hourly wage less than $11.38
# of jobs that pay median hourly wage less than $14.17
# of jobs that pay median hourly wage less than $19.62
# of jobs that pay median hourly wage less than $22.19
92,710 171,550 442,580 468,810
% of total workforce % of total workforce % of total workforce % of total workforce
15% 28% 71% 75%
SOURCE: U.S. Bureau of Labor Statistics, 2015
Table 1: Fair Market Rents by Unit BedroomsFY2015 as compared to FY2000 and FY2014, Louisville MSA
FMR Year Efficiency One-Bedroom Two-Bedroom Three-Bedroom Four-BedroomFY2015 $507 $592 $737 $1,020 $1,154
FY2014 $485 $567 $705 $976 $1,104
FY 2000 $439 $563 $692 $954 $1,007
Adjusted to 2015 dollars using the Consumer Price Index*
FY2015 $507 $592 $737 $1,020 $1,154
FY2014 $489 $572 $708 $984 $1,113
FY 2000 $608 $780 $956 $1,322 $1,396
Percentage Change from FY2014-FY2015 3.7% 3.5% 4.1% 3.7% 3.7%
Percentage Change from FY2000-FY2015 -16.7% -24.1% -22.9% -22.8% -17.3%
SOURCE: U.S. Department of Housing and Urban Development, 2015 (http://www.huduser.gov/portal/datasets/fmr.html)
* Dollars shown in 2015 dollars using the Consumer Price Index Calculator (http://data.bls.gov/cgi-bin/cpicalc.pl)
20metropolitanhousing.org | 2015 State of Metropolitan Housing Report
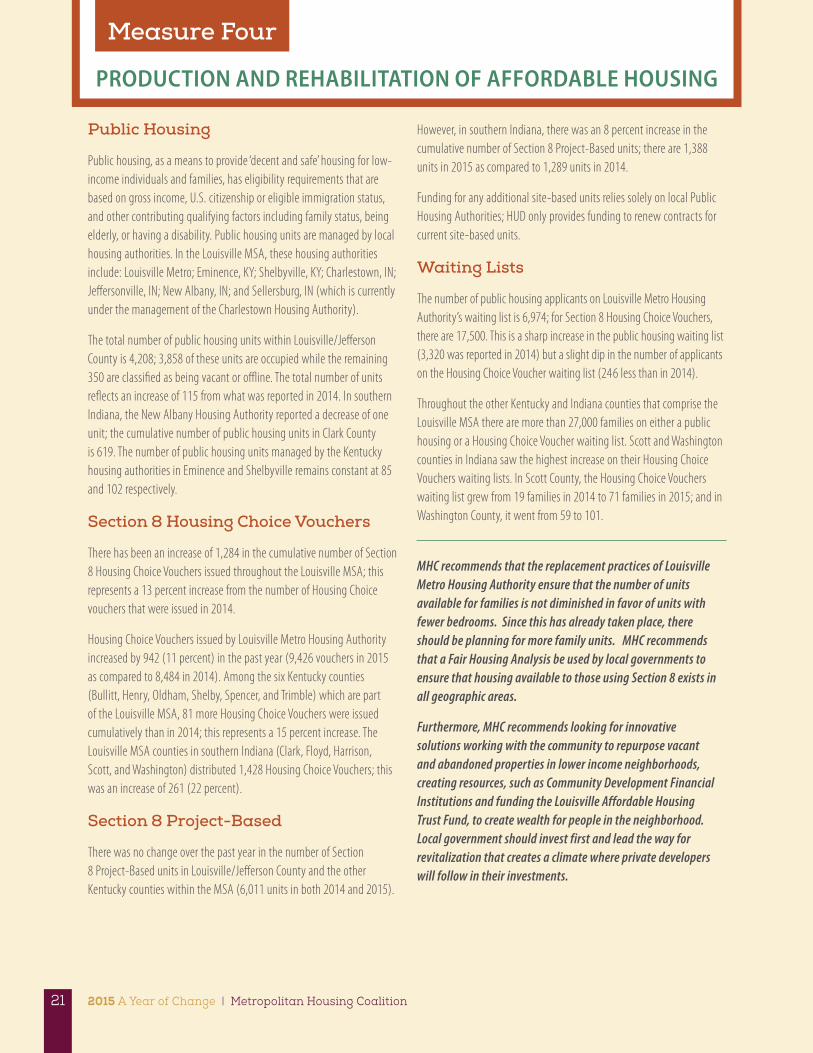
PRODUCTION AND REHABILITATION OF AFFORDABLE HOUSING
Measure Four
Public Housing
Public housing, as a means to provide ‘decent and safe’ housing for low-income individuals and families, has eligibility requirements that are based on gross income, U.S. citizenship or eligible immigration status, and other contributing qualifying factors including family status, being elderly, or having a disability. Public housing units are managed by local housing authorities. In the Louisville MSA, these housing authorities include: Louisville Metro; Eminence, KY; Shelbyville, KY; Charlestown, IN; Jeffersonville, IN; New Albany, IN; and Sellersburg, IN (which is currently under the management of the Charlestown Housing Authority).
The total number of public housing units within Louisville/Jefferson County is 4,208; 3,858 of these units are occupied while the remaining 350 are classified as being vacant or offline. The total number of units reflects an increase of 115 from what was reported in 2014. In southern Indiana, the New Albany Housing Authority reported a decrease of one unit; the cumulative number of public housing units in Clark County is 619. The number of public housing units managed by the Kentucky housing authorities in Eminence and Shelbyville remains constant at 85 and 102 respectively.
Section 8 Housing Choice Vouchers
There has been an increase of 1,284 in the cumulative number of Section 8 Housing Choice Vouchers issued throughout the Louisville MSA; this represents a 13 percent increase from the number of Housing Choice vouchers that were issued in 2014.
Housing Choice Vouchers issued by Louisville Metro Housing Authority increased by 942 (11 percent) in the past year (9,426 vouchers in 2015 as compared to 8,484 in 2014). Among the six Kentucky counties (Bullitt, Henry, Oldham, Shelby, Spencer, and Trimble) which are part of the Louisville MSA, 81 more Housing Choice Vouchers were issued cumulatively than in 2014; this represents a 15 percent increase. The Louisville MSA counties in southern Indiana (Clark, Floyd, Harrison, Scott, and Washington) distributed 1,428 Housing Choice Vouchers; this was an increase of 261 (22 percent).
Section 8 Project-Based
There was no change over the past year in the number of Section 8 Project-Based units in Louisville/Jefferson County and the other Kentucky counties within the MSA (6,011 units in both 2014 and 2015).
However, in southern Indiana, there was an 8 percent increase in the cumulative number of Section 8 Project-Based units; there are 1,388 units in 2015 as compared to 1,289 units in 2014.
Funding for any additional site-based units relies solely on local Public Housing Authorities; HUD only provides funding to renew contracts for current site-based units.
Waiting Lists
The number of public housing applicants on Louisville Metro Housing Authority’s waiting list is 6,974; for Section 8 Housing Choice Vouchers, there are 17,500. This is a sharp increase in the public housing waiting list (3,320 was reported in 2014) but a slight dip in the number of applicants on the Housing Choice Voucher waiting list (246 less than in 2014).
Throughout the other Kentucky and Indiana counties that comprise the Louisville MSA there are more than 27,000 families on either a public housing or a Housing Choice Voucher waiting list. Scott and Washington counties in Indiana saw the highest increase on their Housing Choice Vouchers waiting lists. In Scott County, the Housing Choice Vouchers waiting list grew from 19 families in 2014 to 71 families in 2015; and in Washington County, it went from 59 to 101.
MHC recommends that the replacement practices of Louisville Metro Housing Authority ensure that the number of units available for families is not diminished in favor of units with fewer bedrooms. Since this has already taken place, there should be planning for more family units. MHC recommends that a Fair Housing Analysis be used by local governments to ensure that housing available to those using Section 8 exists in all geographic areas.
Furthermore, MHC recommends looking for innovative solutions working with the community to repurpose vacant and abandoned properties in lower income neighborhoods, creating resources, such as Community Development Financial Institutions and funding the Louisville Affordable Housing Trust Fund, to create wealth for people in the neighborhood. Local government should invest first and lead the way for revitalization that creates a climate where private developers will follow in their investments.
2015 A Year of Change | Metropolitan Housing Coalition21
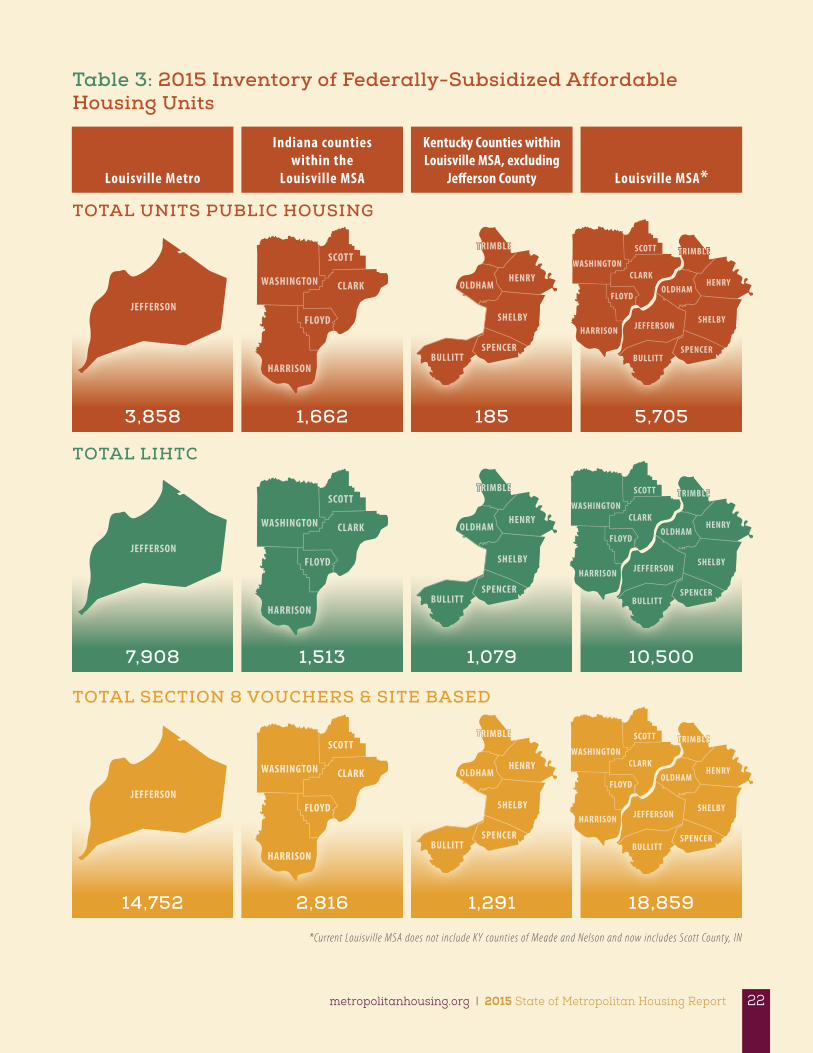
7,908 1,513 1,079 10,500
14,752 2,816 1,291 18,859
3,858 1,662 185 5,705
Table 3: 2015 Inventory of Federally-Subsidized Affordable Housing Units
TOTAL UNITS PUBLIC HOUSING
*Current Louisville MSA does not include KY counties of Meade and Nelson and now includes Scott County, IN
TOTAL LIHTC
TOTAL SECTION 8 VOUCHERS & SITE BASED
Louisville Metro
Indiana counties within the
Louisville MSA
Kentucky Counties within Louisville MSA, excluding
Jefferson County Louisville MSA*
JEFFERSON
JEFFERSON
JEFFERSON
WASHINGTON
SCOTT
CLARK
FLOYD
HARRISON
WASHINGTON
SCOTT
CLARK
FLOYD
HARRISON
WASHINGTON
SCOTT
CLARK
FLOYD
HARRISON
TRIMBLETRIMBLE
HENRYOLDHAM
SHELBY
SPENCERBULLITT
TRIMBLETRIMBLETRIMBLE
HENRYOLDHAM
SHELBY
SPENCERBULLITT
TRIMBLETRIMBLETRIMBLE
HENRYOLDHAM
SHELBY
SPENCERBULLITT
TRIMBLEWASHINGTONWASHINGTON
SCOTT
HENRYOLDHAM
SHELBYJEFFERSON
CLARK
FLOYD
HARRISON
SPENCERBULLITT
TRIMBLE
TRIMBLEWASHINGTONWASHINGTON
TRIMBLESCOTT
HENRYOLDHAM
SHELBYJEFFERSON
CLARK
FLOYD
HARRISON
SPENCERBULLITT
TRIMBLEWASHINGTONWASHINGTON
TRIMBLESCOTT
HENRYOLDHAM
SHELBYJEFFERSON
CLARK
FLOYD
HARRISON
SPENCERBULLITT
metropolitanhousing.org | 2015 State of Metropolitan Housing Report 22
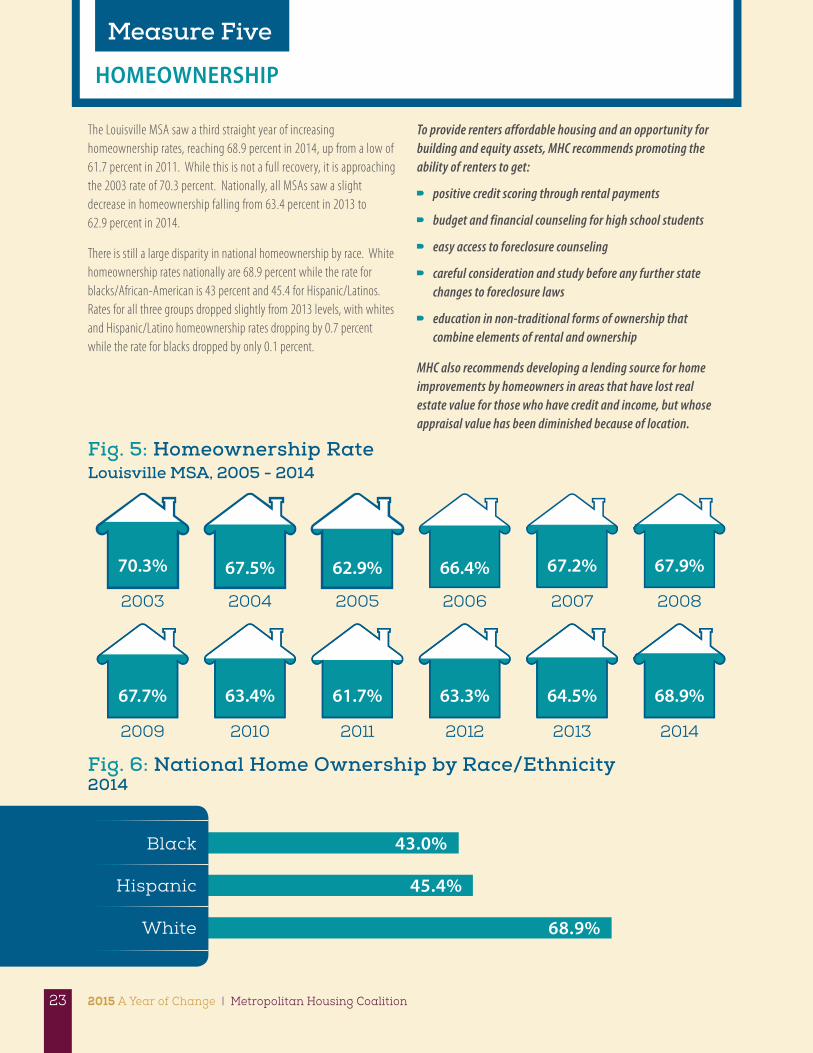
HOMEOWNERSHIP
Measure Five
The Louisville MSA saw a third straight year of increasing homeownership rates, reaching 68.9 percent in 2014, up from a low of 61.7 percent in 2011. While this is not a full recovery, it is approaching the 2003 rate of 70.3 percent. Nationally, all MSAs saw a slight decrease in homeownership falling from 63.4 percent in 2013 to 62.9 percent in 2014.
There is still a large disparity in national homeownership by race. White homeownership rates nationally are 68.9 percent while the rate for blacks/African-American is 43 percent and 45.4 for Hispanic/Latinos. Rates for all three groups dropped slightly from 2013 levels, with whites and Hispanic/Latino homeownership rates dropping by 0.7 percent while the rate for blacks dropped by only 0.1 percent.
To provide renters affordable housing and an opportunity for building and equity assets, MHC recommends promoting the ability of renters to get:
positive credit scoring through rental payments
budget and financial counseling for high school students
easy access to foreclosure counseling
careful consideration and study before any further state changes to foreclosure laws
education in non-traditional forms of ownership that combine elements of rental and ownership
MHC also recommends developing a lending source for home improvements by homeowners in areas that have lost real estate value for those who have credit and income, but whose appraisal value has been diminished because of location.
70.3%
67.7%
67.5%
63.4%
62.9%
61.7%
66.4%
63.3%
67.2%
64.5%
67.9%
68.9%
2003
2009
2004
2010
2005
2011
2006
2012
2007
2013
2008
2014
Fig. 5: Homeownership Rate Louisville MSA, 2005 - 2014
Fig. 6: National Home Ownership by Race/Ethnicity 2014
Black 43.0%
Hispanic 45.4%
White 68.9%
2015 A Year of Change | Metropolitan Housing Coalition23
HOUSING AFFORDABILITY
Measure Six
Measures of homeownership affordability are difficult to calculate in a manner that captures the complexity of costs and variations by markets. The Joint Center for Housing Studies of Harvard University (JCHS)’s measure of affordability for 168 MSAs across the country documents the percentage of renters within each MSA who could instead afford to own if they desired to do so. The measure is based on a total of monthly mortgage payments, insurance, and taxes that do not exceed 35 percent of income. It assumes a 5 percent down payment on a 30-year fixed-rate mortgage at 2014 interest rates on the median price of a home in each MSA. In the Louisville/Jefferson County MSA, 49.5 percent of renters can afford to own according to this measure. This measure speaks to the potential market of homebuyers on a very broad level.
This, in combination with the fact that homeownership rates in the Louisville MSA continue to increase despite the national trend of decline (JCHS, 2015), and that interest rates continue to be low, serve as positive indicators. However there continue to be disparities in homeownership rates (see Measure 5) that speak to the complex variety of elements that impact one’s ability to purchase a home. While a useful indicator, the JCHS indicator assumes that all renters within the MSA have the same debt burden, access to a down payment in a form lenders will accept, have a credit score that can get them the median interest rate or access to discounts on closing cost fees, and are not buying a home in a high risk area that might carry a higher insurance rate.
Just looking at mortgage lending rates by race and ethnicity demonstrate that there are inequities in who applies for and succeeds in securing a mortgage loan. Local Home Mortgage Disclosure Act data presented on page 8 of this report show that only six percent of the black/African-American population in the Louisville MSA even applied for a mortgage and only two percent of Latinos applied. In the context of affordability, these data, along with the lower percentages of approvals as compared to whites, raise questions about whether there are practices in the mortgage industry that put homeownership out of the reach of populations of color. If close to 50 percent of the Louisville MSA renters could afford the general terms of an average mortgage, there are other costs and obstacles that are in play and deserve further exploration.
Shifting to examining affordability for current homeowners that speaks to their ability to maintain and keep their homes, we find the median homeowner mortgage in Louisville/Jefferson County is $152,300 and $150,900 in the Louisville MSA. In both Louisville/Jefferson County
and Louisville MSA, a little more than one in five (22 percent) of all mortgages have either a second mortgage or a home equity loan. The financial responsibilities of owning a home also include housing costs that include real estate taxes, utilities, insurances, and condominium and homeowner association fees. Housing affordability is calculated by factoring these costs with income; a monthly owner cost in excess of 30 percent is considered “excessive sheltered costs” (U.S. Census 2015). Owner-occupied households with an annual income less than $35,000 are at risk of not being able to meet household expenses; the majority of these households have excessive sheltered costs. Nearly half (48 percent) of all Louisville/Jefferson County and Louisville MSA homeowners with incomes $35,000–$49,999 have excessive sheltered costs. See Table 4.
MHC recommends a comprehensive look at all the elements that help people qualify for homeownership: policies on granting mortgages that have an impact of excluding blacks/African Americans; insurance practices that result in de facto red lining of neighborhoods with concentrations of people in protected fair housing classes; realtor practices that unintentionally steer people into certain neighborhoods; appraisal practices that unintentionally under value homes in neighborhoods with high concentrations of people in protected classes. Practical programs such as the ability to build good credit scores through rent payments or including graduation from intense homeownership counseling programs are available and should be mandatory for use of public funds or intervention.
MHC further recommends Louisville Metro establish a loan pool for improvements and repairs for owner occupied housing in neighborhoods that have lost real estate value using the ability to repay as the lead criteria because loss of real estate value had undercut the homeowner’s equity, making the asset under water.
metropolitanhousing.org | 2015 State of Metropolitan Housing Report 24
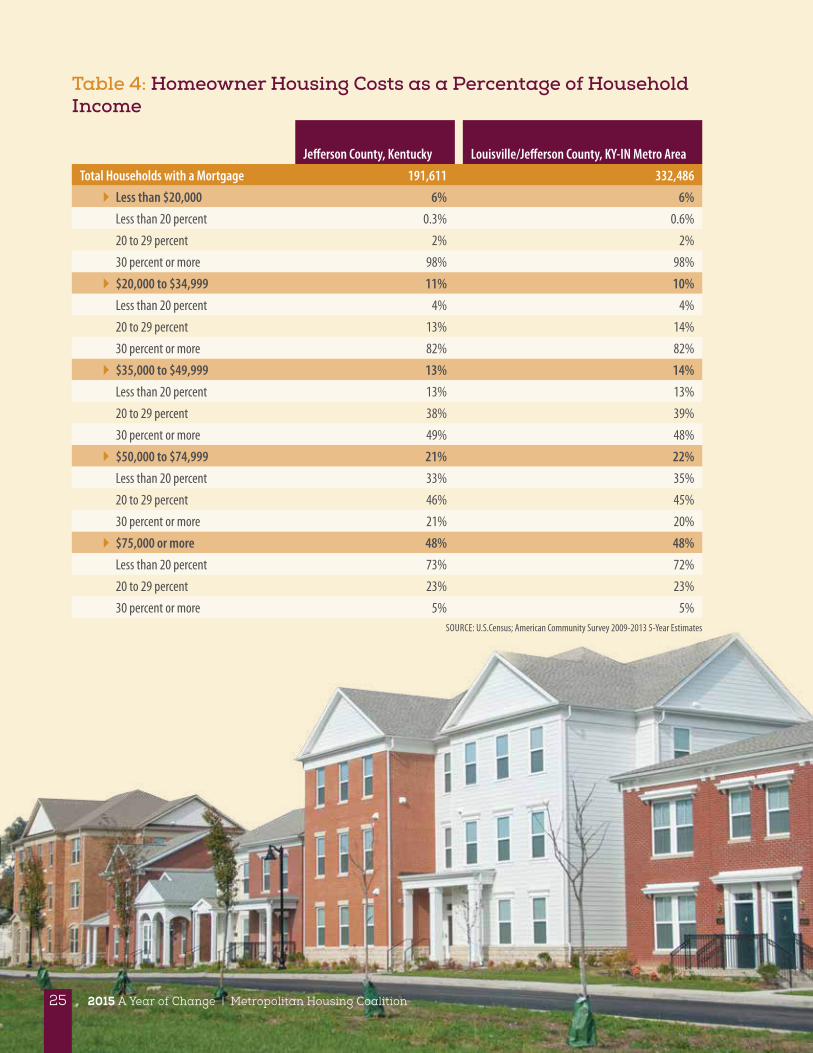
Table 4: Homeowner Housing Costs as a Percentage of Household Income
Jefferson County, Kentucky Louisville/Jefferson County, KY-IN Metro Area
Total Households with a Mortgage 191,611 332,486
Less than $20,000 6% 6%
Less than 20 percent 0.3% 0.6%
20 to 29 percent 2% 2%
30 percent or more 98% 98%
$20,000 to $34,999 11% 10%
Less than 20 percent 4% 4%
20 to 29 percent 13% 14%
30 percent or more 82% 82%
$35,000 to $49,999 13% 14%
Less than 20 percent 13% 13%
20 to 29 percent 38% 39%
30 percent or more 49% 48%
$50,000 to $74,999 21% 22%
Less than 20 percent 33% 35%
20 to 29 percent 46% 45%
30 percent or more 21% 20%
$75,000 or more 48% 48%
Less than 20 percent 73% 72%
20 to 29 percent 23% 23%
30 percent or more 5% 5%SOURCE: U.S.Census; American Community Survey 2009-2013 5-Year Estimates
25 2015 A Year of Change | Metropolitan Housing Coalition
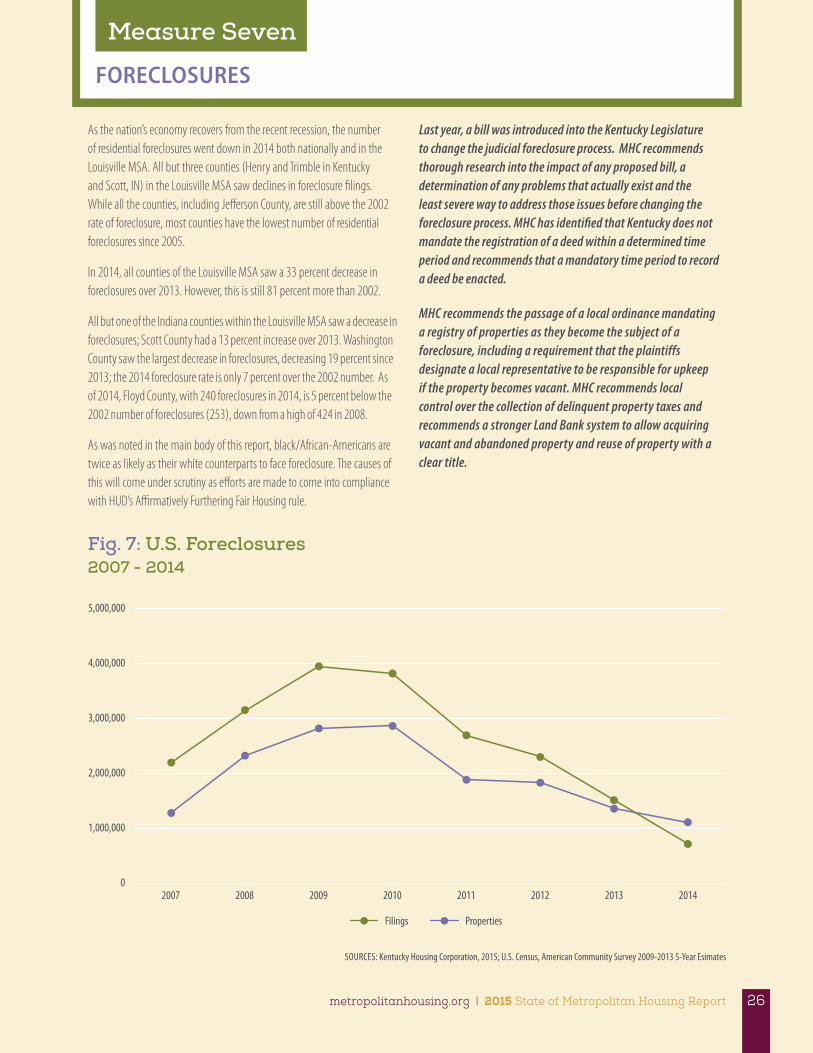
FORECLOSURES
Measure Seven
As the nation’s economy recovers from the recent recession, the number of residential foreclosures went down in 2014 both nationally and in the Louisville MSA. All but three counties (Henry and Trimble in Kentucky and Scott, IN) in the Louisville MSA saw declines in foreclosure filings. While all the counties, including Jefferson County, are still above the 2002 rate of foreclosure, most counties have the lowest number of residential foreclosures since 2005.
In 2014, all counties of the Louisville MSA saw a 33 percent decrease in foreclosures over 2013. However, this is still 81 percent more than 2002.
All but one of the Indiana counties within the Louisville MSA saw a decrease in foreclosures; Scott County had a 13 percent increase over 2013. Washington County saw the largest decrease in foreclosures, decreasing 19 percent since 2013; the 2014 foreclosure rate is only 7 percent over the 2002 number. As of 2014, Floyd County, with 240 foreclosures in 2014, is 5 percent below the 2002 number of foreclosures (253), down from a high of 424 in 2008.
As was noted in the main body of this report, black/African-Americans are twice as likely as their white counterparts to face foreclosure. The causes of this will come under scrutiny as efforts are made to come into compliance with HUD’s Affirmatively Furthering Fair Housing rule.
Last year, a bill was introduced into the Kentucky Legislature to change the judicial foreclosure process. MHC recommends thorough research into the impact of any proposed bill, a determination of any problems that actually exist and the least severe way to address those issues before changing the foreclosure process. MHC has identified that Kentucky does not mandate the registration of a deed within a determined time period and recommends that a mandatory time period to record a deed be enacted.
MHC recommends the passage of a local ordinance mandating a registry of properties as they become the subject of a foreclosure, including a requirement that the plaintiffs designate a local representative to be responsible for upkeep if the property becomes vacant. MHC recommends local control over the collection of delinquent property taxes and recommends a stronger Land Bank system to allow acquiring vacant and abandoned property and reuse of property with a clear title.
Fig. 7: U.S. Foreclosures 2007 - 2014
0
1,000,000
2,000,000
3,000,000
4,000,000
5,000,000
20082007 2009 2010 2011 2012 2013 2014
Filings Properties
SOURCES: Kentucky Housing Corporation, 2015; U.S. Census, American Community Survey 2009-2013 5-Year Esimates
metropolitanhousing.org | 2015 State of Metropolitan Housing Report 26
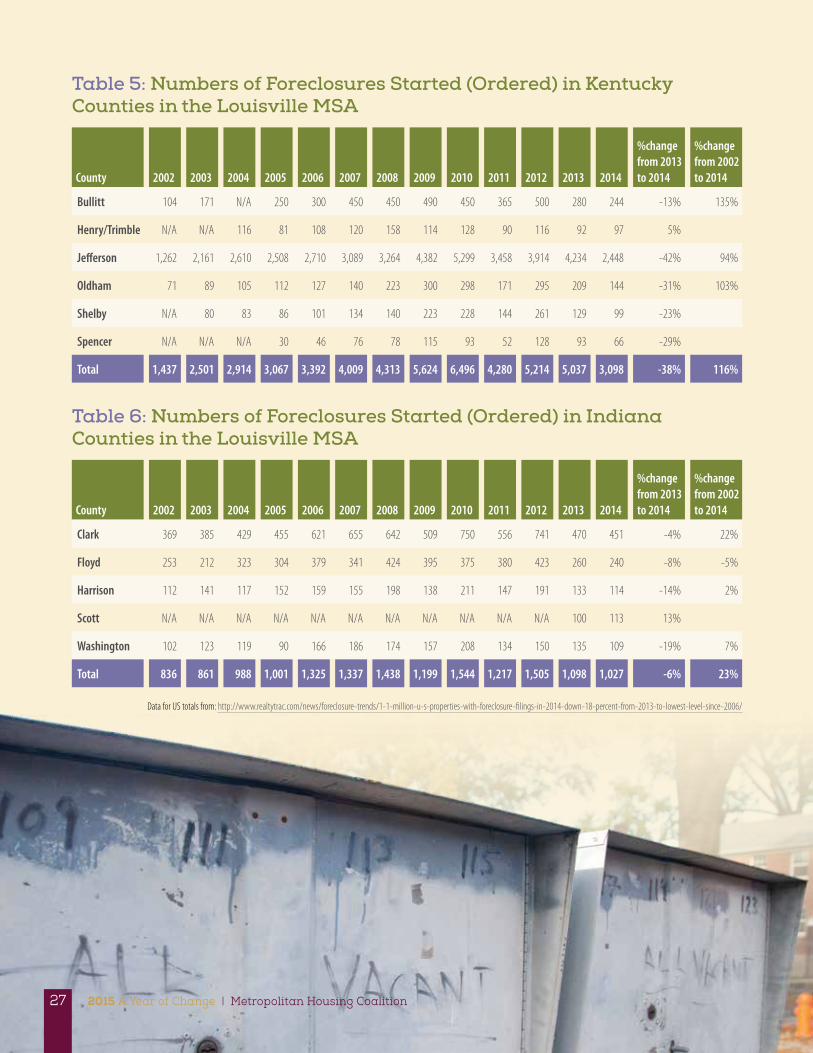
Table 5: Numbers of Foreclosures Started (Ordered) in Kentucky Counties in the Louisville MSA
County 2002 2003 2004 2005 2006 2007 2008 2009 2010 2011 2012 2013 2014
%change from 2013 to 2014
%change from 2002 to 2014
Bullitt 104 171 N/A 250 300 450 450 490 450 365 500 280 244 -13% 135%
Henry/Trimble N/A N/A 116 81 108 120 158 114 128 90 116 92 97 5%
Jefferson 1,262 2,161 2,610 2,508 2,710 3,089 3,264 4,382 5,299 3,458 3,914 4,234 2,448 -42% 94%
Oldham 71 89 105 112 127 140 223 300 298 171 295 209 144 -31% 103%
Shelby N/A 80 83 86 101 134 140 223 228 144 261 129 99 -23%
Spencer N/A N/A N/A 30 46 76 78 115 93 52 128 93 66 -29%
Total 1,437 2,501 2,914 3,067 3,392 4,009 4,313 5,624 6,496 4,280 5,214 5,037 3,098 -38% 116%
Table 6: Numbers of Foreclosures Started (Ordered) in Indiana Counties in the Louisville MSA
County 2002 2003 2004 2005 2006 2007 2008 2009 2010 2011 2012 2013 2014
%change from 2013 to 2014
%change from 2002 to 2014
Clark 369 385 429 455 621 655 642 509 750 556 741 470 451 -4% 22%
Floyd 253 212 323 304 379 341 424 395 375 380 423 260 240 -8% -5%
Harrison 112 141 117 152 159 155 198 138 211 147 191 133 114 -14% 2%
Scott N/A N/A N/A N/A N/A N/A N/A N/A N/A N/A N/A 100 113 13%
Washington 102 123 119 90 166 186 174 157 208 134 150 135 109 -19% 7%
Total 836 861 988 1,001 1,325 1,337 1,438 1,199 1,544 1,217 1,505 1,098 1,027 -6% 23%
Data for US totals from: http://www.realtytrac.com/news/foreclosure-trends/1-1-million-u-s-properties-with-foreclosure-filings-in-2014-down-18-percent-from-2013-to-lowest-level-since-2006/
2015 A Year of Change | Metropolitan Housing Coalition27
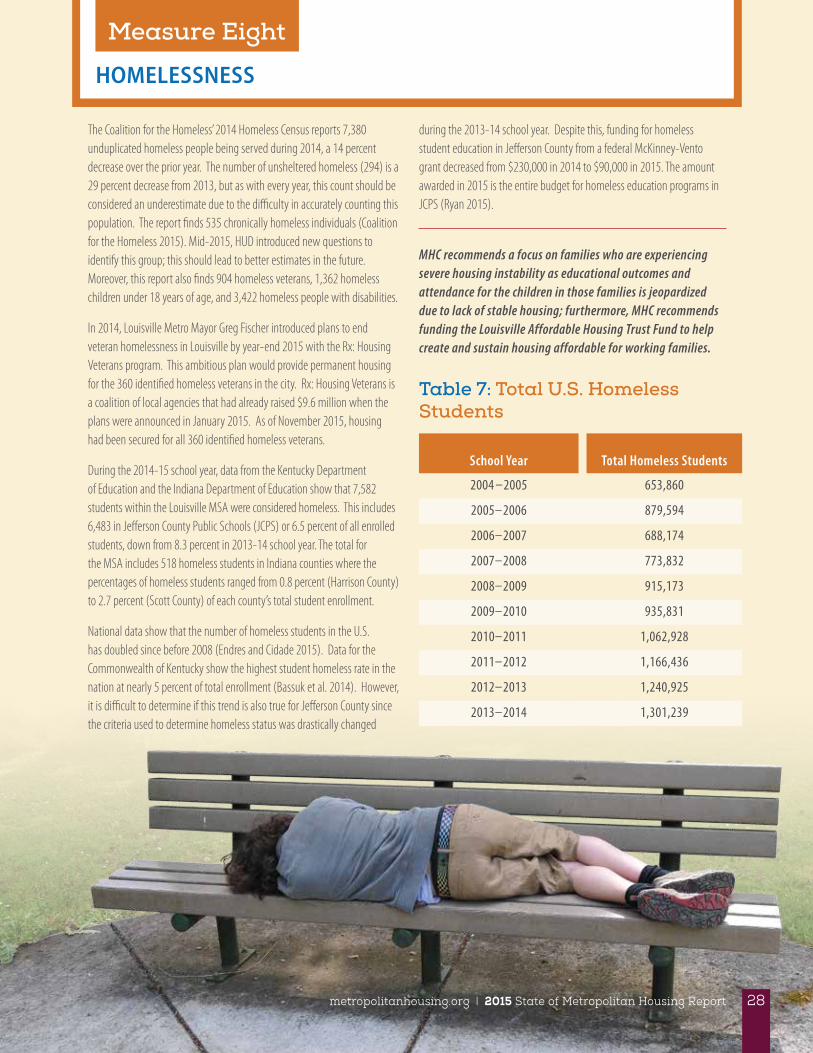
HOMELESSNESS
Measure Eight
during the 2013-14 school year. Despite this, funding for homeless student education in Jefferson County from a federal McKinney-Vento grant decreased from $230,000 in 2014 to $90,000 in 2015. The amount awarded in 2015 is the entire budget for homeless education programs in JCPS (Ryan 2015).
MHC recommends a focus on families who are experiencing severe housing instability as educational outcomes and attendance for the children in those families is jeopardized due to lack of stable housing; furthermore, MHC recommends funding the Louisville Affordable Housing Trust Fund to help create and sustain housing affordable for working families.
The Coalition for the Homeless’ 2014 Homeless Census reports 7,380 unduplicated homeless people being served during 2014, a 14 percent decrease over the prior year. The number of unsheltered homeless (294) is a 29 percent decrease from 2013, but as with every year, this count should be considered an underestimate due to the difficulty in accurately counting this population. The report finds 535 chronically homeless individuals (Coalition for the Homeless 2015). Mid-2015, HUD introduced new questions to identify this group; this should lead to better estimates in the future. Moreover, this report also finds 904 homeless veterans, 1,362 homeless children under 18 years of age, and 3,422 homeless people with disabilities.
In 2014, Louisville Metro Mayor Greg Fischer introduced plans to end veteran homelessness in Louisville by year-end 2015 with the Rx: Housing Veterans program. This ambitious plan would provide permanent housing for the 360 identified homeless veterans in the city. Rx: Housing Veterans is a coalition of local agencies that had already raised $9.6 million when the plans were announced in January 2015. As of November 2015, housing had been secured for all 360 identified homeless veterans.
During the 2014-15 school year, data from the Kentucky Department of Education and the Indiana Department of Education show that 7,582 students within the Louisville MSA were considered homeless. This includes 6,483 in Jefferson County Public Schools (JCPS) or 6.5 percent of all enrolled students, down from 8.3 percent in 2013-14 school year. The total for the MSA includes 518 homeless students in Indiana counties where the percentages of homeless students ranged from 0.8 percent (Harrison County) to 2.7 percent (Scott County) of each county’s total student enrollment.
National data show that the number of homeless students in the U.S. has doubled since before 2008 (Endres and Cidade 2015). Data for the Commonwealth of Kentucky show the highest student homeless rate in the nation at nearly 5 percent of total enrollment (Bassuk et al. 2014). However, it is difficult to determine if this trend is also true for Jefferson County since the criteria used to determine homeless status was drastically changed
School Year Total Homeless Students
2004 –2005 653,860
2005–2006 879,594
2006–2007 688,174
2007–2008 773,832
2008–2009 915,173
2009–2010 935,831
2010–2011 1,062,928
2011–2012 1,166,436
2012–2013 1,240,925
2013–2014 1,301,239
Table 7: Total U.S. Homeless Students
28metropolitanhousing.org | 2015 State of Metropolitan Housing Report
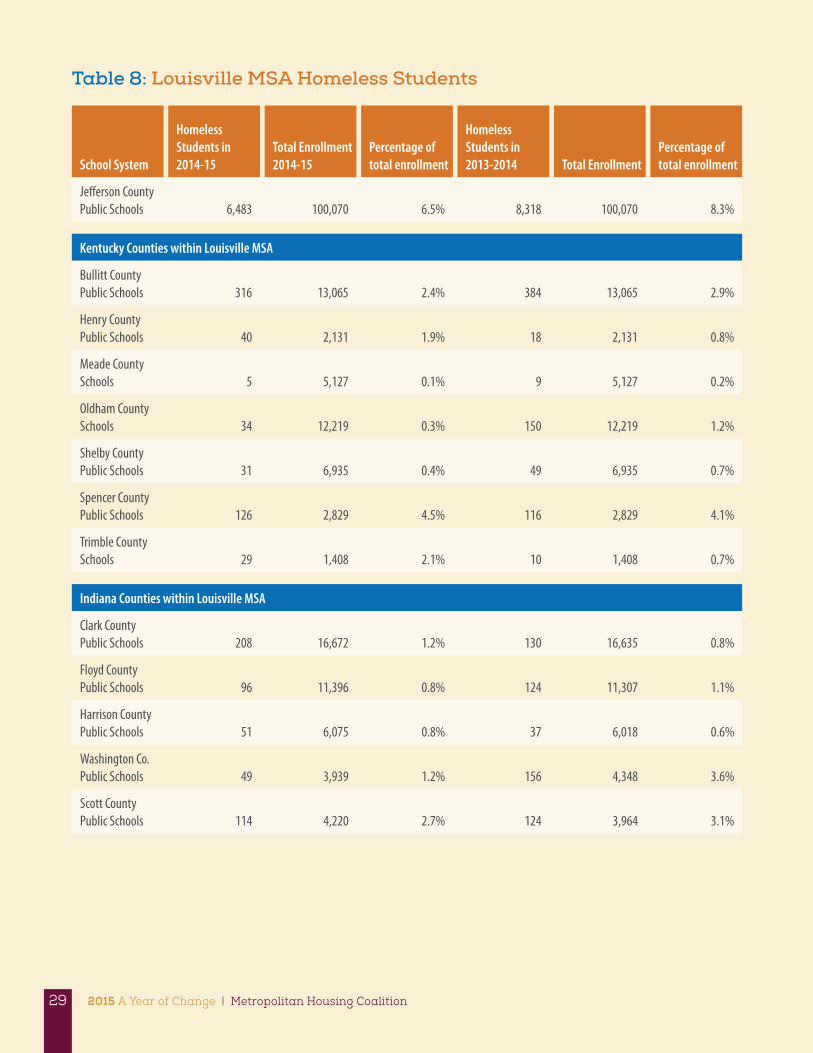
School System
Homeless Students in 2014-15
Total Enrollment 2014-15
Percentage of total enrollment
Homeless Students in 2013-2014 Total Enrollment
Percentage of total enrollment
Jefferson County Public Schools 6,483 100,070 6.5% 8,318 100,070 8.3%
Kentucky Counties within Louisville MSA
Bullitt County Public Schools 316 13,065 2.4% 384 13,065 2.9%
Henry County Public Schools 40 2,131 1.9% 18 2,131 0.8%
Meade County Schools 5 5,127 0.1% 9 5,127 0.2%
Oldham County Schools 34 12,219 0.3% 150 12,219 1.2%
Shelby County Public Schools 31 6,935 0.4% 49 6,935 0.7%
Spencer County Public Schools 126 2,829 4.5% 116 2,829 4.1%
Trimble County Schools 29 1,408 2.1% 10 1,408 0.7%
Indiana Counties within Louisville MSA
Clark County Public Schools 208 16,672 1.2% 130 16,635 0.8%
Floyd County Public Schools 96 11,396 0.8% 124 11,307 1.1%
Harrison County Public Schools 51 6,075 0.8% 37 6,018 0.6%
Washington Co. Public Schools 49 3,939 1.2% 156 4,348 3.6%
Scott County Public Schools 114 4,220 2.7% 124 3,964 3.1%
Table 8: Louisville MSA Homeless Students
2015 A Year of Change | Metropolitan Housing Coalition29
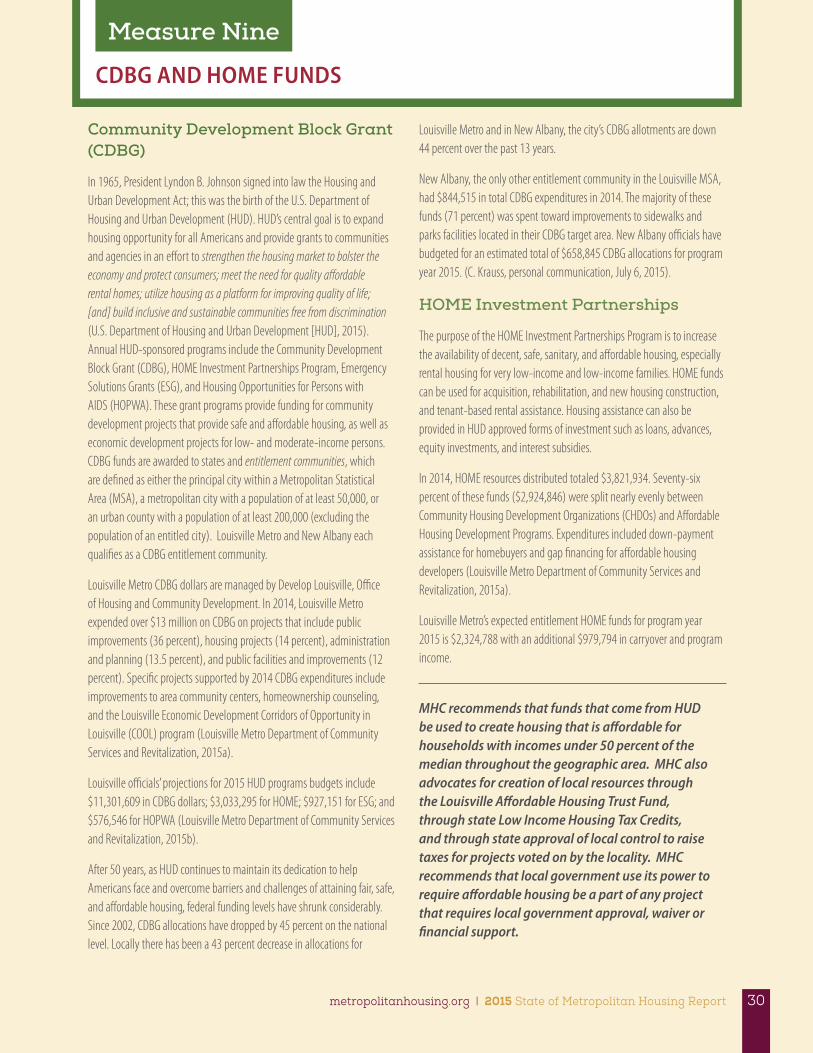
CDBG AND HOME FUNDS
Measure Nine
Community Development Block Grant (CDBG)
In 1965, President Lyndon B. Johnson signed into law the Housing and Urban Development Act; this was the birth of the U.S. Department of Housing and Urban Development (HUD). HUD’s central goal is to expand housing opportunity for all Americans and provide grants to communities and agencies in an effort to strengthen the housing market to bolster the economy and protect consumers; meet the need for quality affordable rental homes; utilize housing as a platform for improving quality of life; [and] build inclusive and sustainable communities free from discrimination (U.S. Department of Housing and Urban Development [HUD], 2015). Annual HUD-sponsored programs include the Community Development Block Grant (CDBG), HOME Investment Partnerships Program, Emergency Solutions Grants (ESG), and Housing Opportunities for Persons with AIDS (HOPWA). These grant programs provide funding for community development projects that provide safe and affordable housing, as well as economic development projects for low- and moderate-income persons. CDBG funds are awarded to states and entitlement communities, which are defined as either the principal city within a Metropolitan Statistical Area (MSA), a metropolitan city with a population of at least 50,000, or an urban county with a population of at least 200,000 (excluding the population of an entitled city). Louisville Metro and New Albany each qualifies as a CDBG entitlement community.
Louisville Metro CDBG dollars are managed by Develop Louisville, Office of Housing and Community Development. In 2014, Louisville Metro expended over $13 million on CDBG on projects that include public improvements (36 percent), housing projects (14 percent), administration and planning (13.5 percent), and public facilities and improvements (12 percent). Specific projects supported by 2014 CDBG expenditures include improvements to area community centers, homeownership counseling, and the Louisville Economic Development Corridors of Opportunity in Louisville (COOL) program (Louisville Metro Department of Community Services and Revitalization, 2015a).
Louisville officials’ projections for 2015 HUD programs budgets include $11,301,609 in CDBG dollars; $3,033,295 for HOME; $927,151 for ESG; and $576,546 for HOPWA (Louisville Metro Department of Community Services and Revitalization, 2015b).
After 50 years, as HUD continues to maintain its dedication to help Americans face and overcome barriers and challenges of attaining fair, safe, and affordable housing, federal funding levels have shrunk considerably. Since 2002, CDBG allocations have dropped by 45 percent on the national level. Locally there has been a 43 percent decrease in allocations for
Louisville Metro and in New Albany, the city’s CDBG allotments are down 44 percent over the past 13 years.
New Albany, the only other entitlement community in the Louisville MSA, had $844,515 in total CDBG expenditures in 2014. The majority of these funds (71 percent) was spent toward improvements to sidewalks and parks facilities located in their CDBG target area. New Albany officials have budgeted for an estimated total of $658,845 CDBG allocations for program year 2015. (C. Krauss, personal communication, July 6, 2015).
HOME Investment Partnerships
The purpose of the HOME Investment Partnerships Program is to increase the availability of decent, safe, sanitary, and affordable housing, especially rental housing for very low-income and low-income families. HOME funds can be used for acquisition, rehabilitation, and new housing construction, and tenant-based rental assistance. Housing assistance can also be provided in HUD approved forms of investment such as loans, advances, equity investments, and interest subsidies.
In 2014, HOME resources distributed totaled $3,821,934. Seventy-six percent of these funds ($2,924,846) were split nearly evenly between Community Housing Development Organizations (CHDOs) and Affordable Housing Development Programs. Expenditures included down-payment assistance for homebuyers and gap financing for affordable housing developers (Louisville Metro Department of Community Services and Revitalization, 2015a).
Louisville Metro’s expected entitlement HOME funds for program year 2015 is $2,324,788 with an additional $979,794 in carryover and program income.
MHC recommends that funds that come from HUD be used to create housing that is affordable for households with incomes under 50 percent of the median throughout the geographic area. MHC also advocates for creation of local resources through the Louisville Affordable Housing Trust Fund, through state Low Income Housing Tax Credits, and through state approval of local control to raise taxes for projects voted on by the locality. MHC recommends that local government use its power to require affordable housing be a part of any project that requires local government approval, waiver or financial support.
metropolitanhousing.org | 2015 State of Metropolitan Housing Report 30
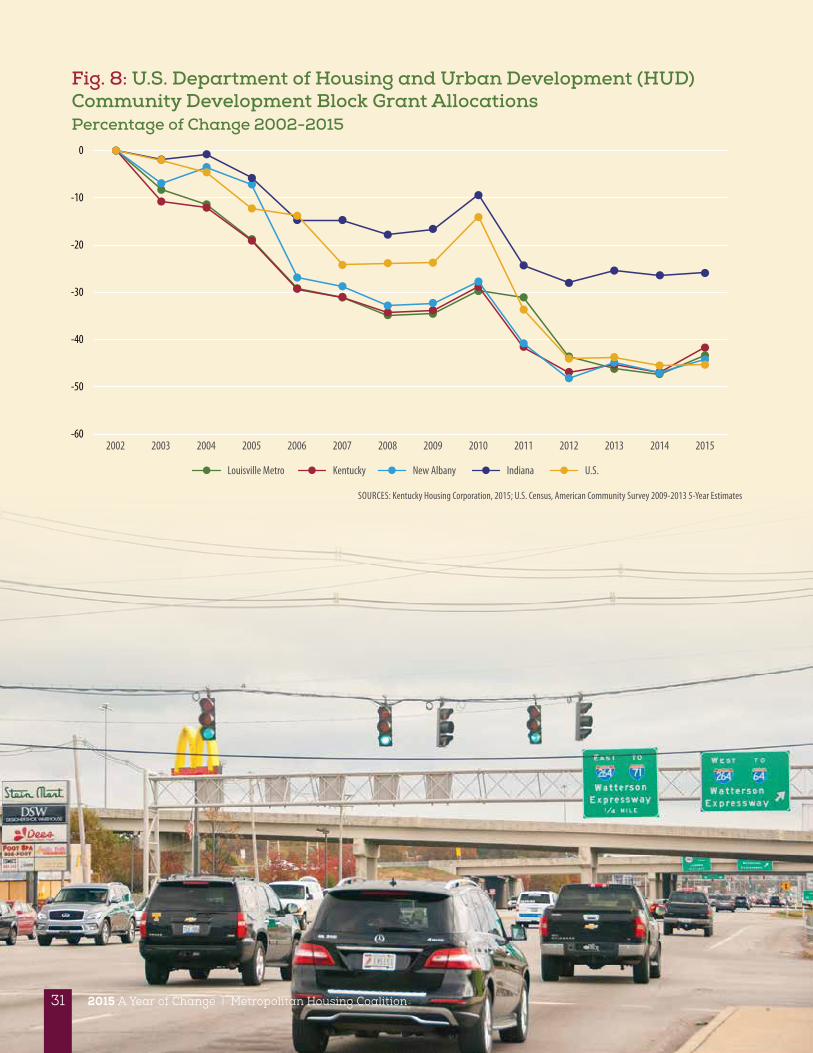
Fig. 8: U.S. Department of Housing and Urban Development (HUD) Community Development Block Grant Allocations Percentage of Change 2002-2015
2008200720062002 200520042003 2009 2010 2011 2012 2013 2014 2015-60
-50
-40
-30
-20
-10
0
Louisville Metro Kentucky New Albany Indiana U.S.
SOURCES: Kentucky Housing Corporation, 2015; U.S. Census, American Community Survey 2009-2013 5-Year Estimates
31 2015 A Year of Change | Metropolitan Housing Coalition
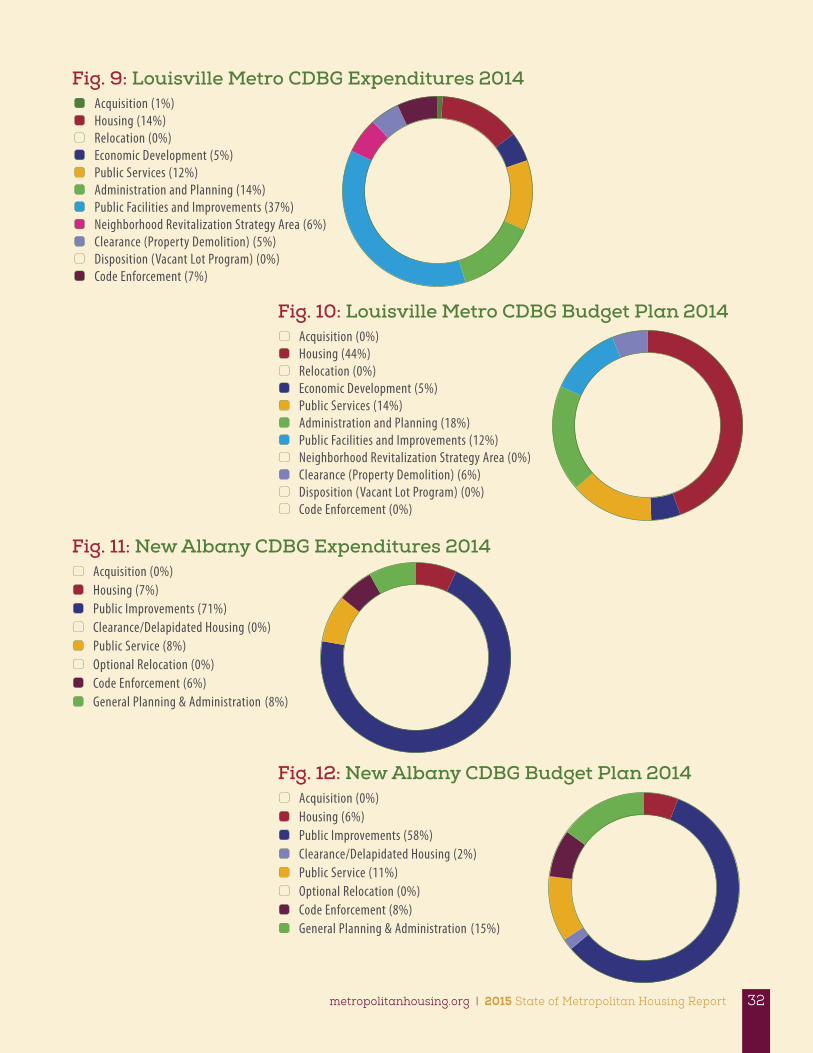
Fig. 9: Louisville Metro CDBG Expenditures 2014
Fig. 11: New Albany CDBG Expenditures 2014
Fig. 12: New Albany CDBG Budget Plan 2014
Fig. 10: Louisville Metro CDBG Budget Plan 2014
Acquisition (1%) Housing (14%) Relocation (0%) Economic Development (5%) Public Services (12%) Administration and Planning (14%) Public Facilities and Improvements (37%) Neighborhood Revitalization Strategy Area (6%) Clearance (Property Demolition) (5%) Disposition (Vacant Lot Program) (0%) Code Enforcement (7%)
Acquisition (0%) Housing (7%) Public Improvements (71%) Clearance/Delapidated Housing (0%) Public Service (8%) Optional Relocation (0%) Code Enforcement (6%) General Planning & Administration (8%)
Acquisition (0%) Housing (6%) Public Improvements (58%) Clearance/Delapidated Housing (2%) Public Service (11%) Optional Relocation (0%) Code Enforcement (8%) General Planning & Administration (15%)
Acquisition (0%) Housing (44%) Relocation (0%) Economic Development (5%) Public Services (14%) Administration and Planning (18%) Public Facilities and Improvements (12%) Neighborhood Revitalization Strategy Area (0%) Clearance (Property Demolition) (6%) Disposition (Vacant Lot Program) (0%) Code Enforcement (0%)
metropolitanhousing.org | 2015 State of Metropolitan Housing Report 32
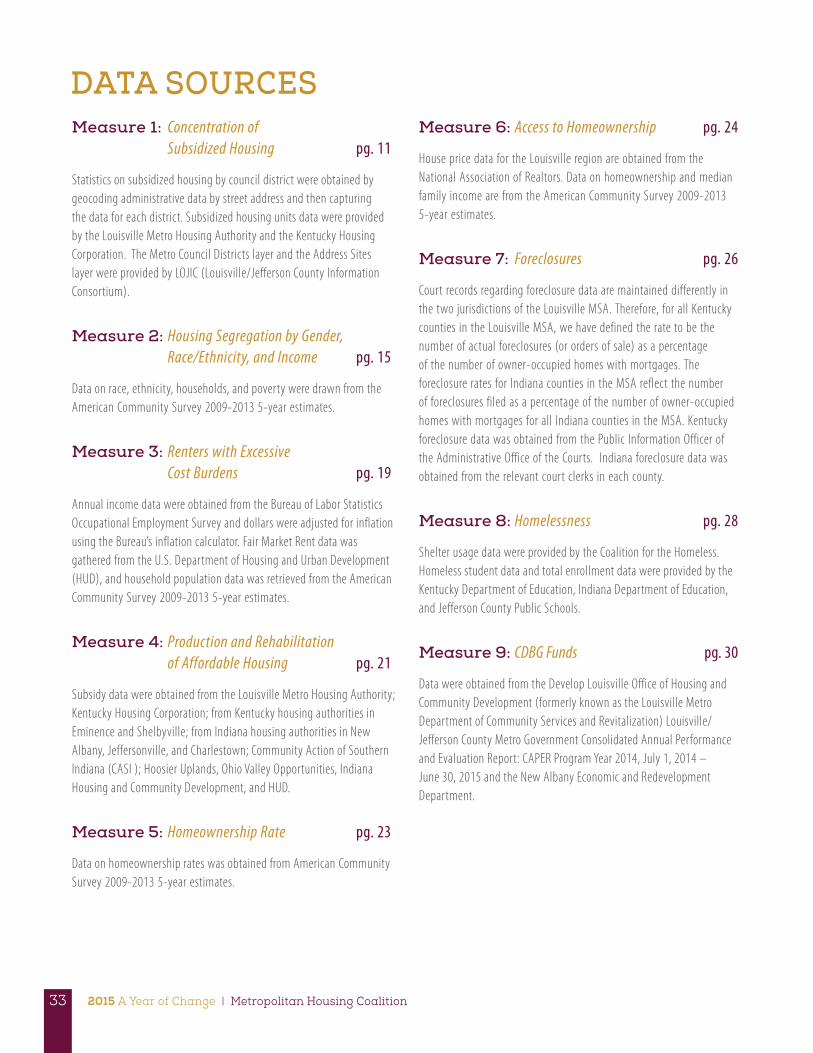
2015 A Year of Change | Metropolitan Housing Coalition33
DATA SOURCESMeasure 1: Concentration of
Subsidized Housing pg. 11
Statistics on subsidized housing by council district were obtained by geocoding administrative data by street address and then capturing the data for each district. Subsidized housing units data were provided by the Louisville Metro Housing Authority and the Kentucky Housing Corporation. The Metro Council Districts layer and the Address Sites layer were provided by LOJIC (Louisville/Jefferson County Information Consortium).
Measure 2: Housing Segregation by Gender, Race/Ethnicity, and Income pg. 15
Data on race, ethnicity, households, and poverty were drawn from the American Community Survey 2009-2013 5-year estimates.
Measure 3: Renters with Excessive Cost Burdens pg. 19
Annual income data were obtained from the Bureau of Labor Statistics Occupational Employment Survey and dollars were adjusted for inflation using the Bureau’s inflation calculator. Fair Market Rent data was gathered from the U.S. Department of Housing and Urban Development (HUD), and household population data was retrieved from the American Community Survey 2009-2013 5-year estimates.
Measure 4: Production and Rehabilitation of Affordable Housing pg. 21
Subsidy data were obtained from the Louisville Metro Housing Authority; Kentucky Housing Corporation; from Kentucky housing authorities in Eminence and Shelbyville; from Indiana housing authorities in New Albany, Jeffersonville, and Charlestown; Community Action of Southern Indiana (CASI ); Hoosier Uplands, Ohio Valley Opportunities, Indiana Housing and Community Development, and HUD.
Measure 5: Homeownership Rate pg. 23
Data on homeownership rates was obtained from American Community Survey 2009-2013 5-year estimates.
Measure 6: Access to Homeownership pg. 24
House price data for the Louisville region are obtained from the National Association of Realtors. Data on homeownership and median family income are from the American Community Survey 2009-2013 5-year estimates.
Measure 7: Foreclosures pg. 26
Court records regarding foreclosure data are maintained differently in the two jurisdictions of the Louisville MSA. Therefore, for all Kentucky counties in the Louisville MSA, we have defined the rate to be the number of actual foreclosures (or orders of sale) as a percentage of the number of owner-occupied homes with mortgages. The foreclosure rates for Indiana counties in the MSA reflect the number of foreclosures filed as a percentage of the number of owner-occupied homes with mortgages for all Indiana counties in the MSA. Kentucky foreclosure data was obtained from the Public Information Officer of the Administrative Office of the Courts. Indiana foreclosure data was obtained from the relevant court clerks in each county.
Measure 8: Homelessness pg. 28
Shelter usage data were provided by the Coalition for the Homeless. Homeless student data and total enrollment data were provided by the Kentucky Department of Education, Indiana Department of Education, and Jefferson County Public Schools.
Measure 9: CDBG Funds pg. 30
Data were obtained from the Develop Louisville Office of Housing and Community Development (formerly known as the Louisville Metro Department of Community Services and Revitalization) Louisville/Jefferson County Metro Government Consolidated Annual Performance and Evaluation Report: CAPER Program Year 2014, July 1, 2014 – June 30, 2015 and the New Albany Economic and Redevelopment Department.
metropolitanhousing.org | 2015 State of Metropolitan Housing Report 34
REFERENCESAdelman, Robert M. (2004). “Neighborhood Opportunities, Race, and Class: The Black Middle Class and Residential Segregation.” City and Community 3 (1): 43-64.
Affirmatively Furthering Fair Housing, 8 Federal Register 136 (2015, July 16) (to be codified at 24 CFR Parts 5, 91, 92, 570, 574, 576, and 903).
American Community Survey. Retrieved on June 14, 2015 from https://www.census.gov/people/disability/methodology/acs.html.
Bischoff, K. and S. Reardon. (2013). “Residential Segregation by Income, 1970-2009.” US2010 Discover America in a New Century. Retrieved on October 15, 2015 from http://www.s4.brown.edu/us2010/Data/Report/report10162013.pdf.
Bussuk, E.L. et al. (2014) America’s Youngest Outcasts: A Report Card on Child Homelessness. The National Center on Family Homelessness. Retrieved on November 20, 2015 from http://www.homelesschildrenamerica.org.
Commonwealth of Kentucky Cabinet for Economic Development. (2015). “Tax Increment Financing Projects with State Participation.” Retrieved on November 3, 2015 from http://thinkkentucky.com/kyedc/pdfs/TIFProjects.pdf?08052015.
Domina, Thurston. (2006). “Brain Drain and Brain Gain: Rising Educational Segregation in the United States, 1940-2000.” City and Community 5 (4): 387-407.
Endres, C. and Cidade, M. (2015) Federal Data Summary School Years 2011-12 to 2013-14. National Center for Homeless Education. Retrieved on November 20, 2015 from http://center.serve.org/nche/ibt/sc_data.php.
The Fair Housing Act 42 U.S.C. §§ 3601 – 3619 Retrieved on October 23, 2015 from http://www.justice.gov/crt/fair-housing-act-2.
Federal Financial Institutions Examination Council (FFIEC) 2014 Home Mortgage Disclosure Act. Retrieved on October 21, 2015 from http://www.ffiec.gov/Hmda/hmdaraw.htm.
Fry, R. and P. Taylor. (2012). “The Rise of Residential Segregation by Income”. Pew Research Center. Social and Demographic Trends. Retrieved on October 28, 2015 from http://www.pewsocialtrends.org/files/2012/08/Rise-of-Residential-Income-Segregation-2012.2.pdf.
Hayslett, Karen L. and Melinda D. Kane. (2011). “’Out’ in Columbus: A Geospatial Analysis of the Neighborhood-Level Distribution of Gay and Lesbian Households.” City and Community 10 (2): 131-156.
Joint Center for Housing Studies of Harvard University, JCHS (2015). “The State of the Nation’s Housing 2015”. Retrieved on November 12, 2015 from http://www.jchs.harvard.edu/research/state_nations_housing.
Layton, Lynsey and Emma Brown. (2015, September 14). “Number of Homeless Students in U.S. Has Doubled Since Before the Recession,” Washington Post. Retrieved on September 24, 2015 from https://www.washingtonpost.com/local/education/number-of-us-homeless-students-has-doubled-since-before-the-recession/2015/09/14/0c1fadb6-58c2-11e5-8bb1-b488d231bba2_story.html.
Louisville/Jefferson County Information Consortium (LOJIC). http://www.lojic.org/main/index.htm.
Louisville Metro Department of Community Services and Revitalization. (2015a). Louisville/Jefferson County Metro Government Consolidated Annual Performance and Evaluation Report – CAPER Program Year 2014. Retrieved on October 14, 2015 from http://louisvilleky.gov/sites/default/files/housing_community_development/programyear2014caper.pdf.
Louisville Metro Government. (2015). Louisville Metro/Jefferson County Metro Government 2015-2019 Consolidated Plan: Submitted to the United States Department of Housing and Urban Development for Approval on May 15, 2015. Louisville: Develop Louisville, Office of Housing and Community Development.
Louisville Metro Government. (2015). 2015 Analysis of Impediments to Fair Housing Choice in Louisville Metro, KY DRAFT. Retrieved on November 4, 2015 from https://louisvilleky.gov/sites/default/files/housing_community_development/draft_analysis_of_impediments_to_fair_housing_choice.pdf.
Louisville Metro Human Relations Commission. (Forthcoming 2015). Searching for Safe, Fair, and Affordable Housing: Learning from Experiences, An Analysis of Housing Challenges in Louisville Metro. University of Louisville Center for Environmental Policy and Management and the Anne Braden Institute for Social Justice.
Massey, Douglas S. (2015). “The Legacy of the 1968 Fair Housing Act.” Sociological Forum, Special Issue: Commemorating the Fiftieth Anniversary of the Civil Rights Laws Volume 30, Issue Supplement S1, pages 571–588.
National Low Income Housing Coalition. (2015). Out of Reach 2015: Kentucky. Washington, DC. Retrieved on September 2, 2015 from http://nlihc.org/oor/kentucky.
Oakley, D. (2008). “Locational Patterns of Low-Income Housing Tax Credit Developments.” Urban Affairs Review, 43(5), 599-628.
Ryan, J. (Narrator). (2015, September 1). “JCPS Is Addressing Student Homelessness Despite Dwindling Funds,” Louisville, KY: WFPL Radio. Retrieved on September 3, 2015 from http://wfpl.org/jcps-addressing-student-homelessness-despite-dwindling-funds/.
Ryan, J. (Narrator). (2015, September 8). “Louisville Gets Less Affordable Housing Funding Than Other Parts of Kentucky,” Louisville, KY: WFPL Radio. Retrieved on October 27, 2015 from http://wfpl.org/louisville-gets-far-less-affordable-housing-funding-parts-kentucky/.
Shafer, S. and P. Bailey. (2015, November 2). “City Finds Housing for 360 Needy Veterans,” Courier-Journal, November 2, 2015. Retrieved on November 3, 2015 from http://www.courier-journal.com/story/news/local/2015/11/02/city-finds-housing-360-needy-veterans/75045926/.
Smith, M., D. Hochberg and W. Greene (2014). “The Effectiveness of Pre-Purchase Homeownership Counseling and Financial Management Skills: A Special Report by the Community Development Studies and Education Department.” Federal Reserve Bank of Philadelphia. https://www.philadelphiafed.org/community-development/homeownership-counseling-study.
Texas Department of Housing and Community Affairs v. Inclusive Communities Project, Inc., 576 U.S. ___, 2015 WL 2473449 (Jun. 25, 2015)
U.S. Bureau of Labor Statistics. (May 2014). Metropolitan and Nonmetropolitan Area Occupational Employment and Wage Estimates, Louisville-Jefferson County, KY-IN. Retrieved on Aug 11, 2015 from http://www.bls.gov/oes/current/oes_31140.htm#00-0000.
U.S. Census. (2015) Glossary. Retrieved on November 13, 2015 from http://factfinder.census.gov/help/en/index.htm#glossary.htm.
U.S. Department of Housing and Urban Development. (2015). Retrieved on October 21, 2015 from http://portal.hud.gov/hudportal/HUD?src=/about/mission.
U.S. Department of Housing and Urban Development (2015) Final Rule on Affirmatively Furthering Fair Housing Department Of Housing And Urban Development 24 CFR Parts 5, 91, 92, 570, 574, 576, and 903 [Docket No. FR-5173-F-04] RIN No. 2501-AD33.
2015 A Year of Change | Metropolitan Housing Coalition35
STATE OF METROPOLITAN HOUSING REPORT SPONSORS
MHC wishes to thank these organizations for their generous sponsorship of our 2015 Annual Meeting, held on May 21st, 2015 at The Olmsted.
Keynote Sponsor
Federal Reserve Bank of St. Louis, Louisville Branch
Groundbreaking Sponsors ($1,000-$5,000)
American Founders Bank
Fifth Third Bank
Kentucky Commission on Human Rights
Kentucky Housing Corporation
Louisville Metro Housing Authority
Louisville Urban League
New Directions Housing Corporation
PBI Bank
PNC Bank
Stites and Harbison
Tyler Park Neighborhood Association
Advocate Sponsors ($500-$999)
Craig Henry PLC
Greater Louisville Association of Realtors
Habitat for Humanity of Metro Louisville
LDG Development LLC
Louisville Metro Department of Community
Services & Revitalization
Louisville Metro Human Relations Commission
River City Housing
Volunteers of America
Woodforest National Bank
Louisville Metro Governement
2015 MHC ANNUAL MEETING SPONSORS
metropolitanhousing.org | 2015 State of Metropolitan Housing Report 36
2015 BOARD OF DIRECTORS
FOUNDATIONS AND GRANT-MAKING INSTITUTIONS
MHC STAFF ACKNOWLEDGEMENTS
MHC Board Chair Adam Hall Fifth Third Bank
MHC Board Vice Chair Everett Hoffman Priddy, Cutler, Miller, & Meade
MHC Treasurer James Craig Craig Henry, PLC
John Cullen LockUpLead
Janet Dakan Tyler Park Neighborhood Association
John Davis PNC Bank
Jeana Dunlap Louisville Metro Department of Vacant & Public Property Adminsitration
Kevin Dunlap REBOUND, Inc.
Michael Gross LDG Multifamily LLC
Lisa J. Houston LJH Infinity Realtors
Nicole Maddox Stites and Harbison
Carolyn Miller- Cooper Louisville Metro Human Relations Commission
John Nevitt Metro United Way
Tammy Nichols KBA Convention Coordinator HOPE of KY
Joe Stennis Wyatt Tarrant and Combs
Lisa Thompson New Directions Housing Corp
Jim Watkins PBI Bank, Inc.
Pat Yense-Woosley Jeffersonville Housing Services Corporation
Arthur K Smith Family Foundation
Church of the Epiphany
Department, Louisville Metro Health
Gannett Foundation
Kentucky Housing Corporation
Lexington Fair Housing Council
Executive Director Cathy Hinko
Development Director Michael Kolodziej
The 2015 State of Metropolitan Housing Report is a product of the Center for Environmental Policy and Management (CEPM) at the University of Louisville. The main body of the report was co-authored by Lauren Heberle, Director, CEPM, and Cathy Hinko, Executive Director of the Metropolitan Housing Coalition. Other contributors include CEPM staff Carol Norton, Allison Smith, Steve Sizemore, Adam Sizemore and U of L Anne Braden Institute staff member Jamie Beard. The maps for this report were produced by Kent Pugh.
Graphic Design: Rob Gorstein Design | Photos: Dana Loustalot Duncan
Lexington-Fayette Urban County Human Relations Commission
Louisville Metro Council
Louisville Metro Family Services Fund
Louisville Metro Human Relations Commission
Louisville Urban League
Sam Swope Family Foundation
2015 A Year of Change | Metropolitan Housing Coalition37
STATE OF METROPOLITAN HOUSING REPORT SPONSORSThanks to these families and individuals for their support of MHC’s work!Sponsoring Members ($1,000 and above)
Carl Batlin & Susan Hinko
Janet Dakan
Cathy Hinko
Everett Hoffman & Cathy Ford
Cher Lewis
Bob & Felice Sachs
Carla Wallace
Sustaining Members ($500-$999)
Jeana Dunlap
Jane Emke
Steve Giles
Andrea Levere
Katie & Mazen Masri
Lisa Osanka
Curtis A. Stauffer & Rachel Cutler
Lisa Thompson & Tom Johnson
Juli Wagner
Anchoring Members ($200 – 499)
Tim & Melissa Barry
Steve Bogus
Bethany Breetz & Ron Loughry
Mary Gail Bryan
John Bugbee & Huyett Hurley
Nefertiti Burton
Arthur Crosby
John Cullen
Irwin & Carol Cutler
Kevin Dunlap
Adam Hall
Paula Huffman
Mary Margaret Mulvihill
John Nevitt
Virginia Peck
Stephanie Reese
David Ritchay
Marty Rosen & Mary Bryan
Rich Seckel
Sue Speed
Robert Surcliff
Ellen Weiss
John & Janet Wilborn
Johanna Wit van Wijk-Bos
Supporting Members ($75 – $199)
Garrett & Lane Adams
Ann Allen
John & Natalie Bajandas
Barbara Banaszynski
Paula Barmore
Susan Barry
Theresa Boyd
Pat Bricking
Bill Carner
Jan Cieremans
Stacy Deck
Dolores Delahanty
Debra DeLor
Amber Duke
Alan Engel
William Friedlander
Jenifer Frommeyer
Michael Gardner
Gordon and Joyce Garner
Rob & Tiffanie Gorstein
Joseph Graffis
Michael Gross
Christopher Harmer
Natalie & John Harris
James Haswell
Lauren Heberle
Tom Herman
Geoffrey Hobin & Jennifer Hubbard
Terrell Holder
Tawana Hughes
Janet Jernigan
Lauren Kehr
Paul Robert Kiger
Natalie Kline
Forrest S. Kuhn
Nancy Leach
Jonathan Lowe
Lynn & Crit Luallen
Catherine Nicole Maddox
Beverley Marmion
Carolyn Miller-Cooper
Krista Mills
Gregory Moore
Agnes & Patrick Noonan
Andy Patterson
Robin Penick
Suzy Post
Maria Price
Kathleen O’Neil
Deborah Rattle
Phil and Pat Reinhart
Susan Rostov
David Ruccio & Lisa Markowitz
Andrea J. Russell
Ron Schneider
Bill & Rose Schreck
Frank Schwartz
Diane Shott
Barbara & John Sinai
Joe & Karen Stevenson
Jack & Patti Clare
Debra Voyles
Brenda Walker
Jim Wayne
Peter H. Wayne
Deborah Williams
Jessica Whitish
Travis Yates
Pat Yense-Woosley
Anthony Zipple
Anchoring Members (continued) ($200 – 499)
Supporting Members (continued) ($75 – $199)

metropolitanhousing.org | 2015 State of Metropolitan Housing Report 38
Kenneth Lanham, Jr., a former MHC board member and great advocate for fair and affordable housing passed away on November 7, 2015. The donations made in Kenny’s honor will be listed in full in the 2016 State of Metropolitan Housing Report and also in the MHC newsletters throughout the year.
Assisting Members ($1 – $74)
Jeff Been
Beth Bissmeyer
Emily Boone
Nick Braden
Beverly Bromley
Trent Burdick
Ashley Campbell
Barbara Carter
Ben Carter
Ashley & Christopher Cassetty
Mary Ceridan
Jennifer Clark
Ed Cortas
David Coyte
James Craig
Cassandra Culin
Kate Cunningham
Sarah Lynn Cunningham
Katherine Davidson
Lisa DeSpain
Gary Drehmel
Julie Driscoll
David Dutschke
Jean Edwards
Meiya L Ferrell
Elizabeth Fick-Koppen
John Fitzgerald
Drew Foley
Dan Forbis
Cate Fosl
Ellen Friedman & Jim Birmingham
Amanda Fuller
Ted Fulmore
Nancy Gall-Clayton
Jessica George
Tom & Judith Gerdis
LiAndrea Goatley
Beth Green
Cheri Bryant Hamilton
Lisa Hammonds
Muriel Handmaker
John Hawkins
Roz Heinz
Colette Henderson
Latanya Henry
Steve G Hickerson
Tabitha Hodges
Matthew Holdzkom
Bill Hollander
David & Mary Horvath
Lisa J. Houston
Alicia Hurle
Rachel Hurst
Karen Kartholl
Stephanie Kaufman
Frank and Donna Kiley
Lisa Kilkelly
Maria & Brian Koetter
Christopher Kolb
Michael Kolodziej
Valerie Kolodziej
Joe & Kathy Kremer
Vicki W Larmee
Dana Loustalot Duncan
Amy Lowen
Doug Magee & Anne Marie Regan
Victoria Markell
Christie McCravy
David Metzler
Susan Miller
Jim Mims
Rhonda Mitchell
Beverly Moore
Jonathan Musselwhite
Carolyn Neustadt
Tammy Nichols
Carol Norton & Stephen Rausch
Mary O’Doherty
Tandee Ogburn
Sandra A ONeal
Eileen Ordover
Darryl Owens
Anne Peak
Becky Peak
Mollie Phukan
Nancy Reinhart & David Mitchell
John Rippy
Stephen Rose
J Martin Schindler
Erwin Sherman
David Simcox
Terry & Nancy Singer
Carol Smith
Al Spotts & Maggie Steptoe
Eric & Jane Stauffer
Elizabeth Stith
Susan Stokes
Elwood Sturtevant
David Tandy
Janel Temple
Judy Tiell
Donna Trabue
Drew Tucker
Billie Wade
Bill Walsh
Tina Ward-Pugh
Sally Wax
Faith Weekly
Jessica B Whitish
Caitlin Willenbrink
Thomas Williams
Lisa Willner & John Scruton
Barry Zalph & Katie Whiteside
Assisting Members (continued) ($1 – $74)
Assisting Members (continued) ($1 – $74)
2015 A Year of Change | Metropolitan Housing Coalition39
Institutional Members ($1,000 and above)
American Founders Bank
Arthur K. Smith Family Foundation
BB&T
Church of the Epiphany
Commonwealth Bank & Trust
Fifth Third Bank
Kentucky Commission on Human Rights
Kentucky Housing Corporation
Louisville Metro Housing Authority
Louisville Urban League
New Directions Housing Corporation
Norton Healthcare
PBI Bank
PNC Bank
Stites & Harbison
Sam Swope Family Foundation
Tyler Park Neighborhood Association
Sponsoring Members ($500-$999)
AARP Kentucky State Office
Beacon Property Management
Center for Women & Families
Craig Henry PLC
ELCA-South Central Conference of Lutherans
First Capital Bank of Kentucky
First Federal Savings Bank
Housing Authority of New Albany
Indiana/Kentucky South-Central Conference Council
Kroger Mid-South
LDG Development, LLC
Louisville Metro Department of Community Services & Revitalization
Oracle Design Group, Inc.
REBOUND, Inc.
Regional First Title Group
Republic Bank
River City Housing
Sisters of Charity of Nazareth
Volunteers of America
Wyatt Tarrant & Combs LLP
Your Community Bank
Supporting Members ($200 – $499)
Bike & Build
Center for Nonprofit Excellence
City of New Albany
Dental Care Plus Group
Dreams With Wings, Inc.
Fuller Center for Housing
Group Inc, Weber
Habitat for Humanity of Metro Louisville
Housing Partnership, Inc.
Jewish Family and Career Services
Kentucky Bankers Association
Kentucky Equal Justice Center
Kentucky State AFL-CIO
KIPDA Area Agency on Aging
LJH Infinity Realtors
Louisville Central Community Center
Louisville Metro Human Relations Commission
Metro Bank
New Albany Department of Redevelopment
New Hope Services
Spalding University
St. Boniface Church
St. John Center, Inc.
St. Williams Church
U of L School of Public Health
Valbridge Property Advisors | Allgeier
Weber Group, Inc.
Wellspring
Sustaining Members ($75 – $199)
ACLU of Kentucky
AU Associates
Cedar Lake Residences, Inc.
Coalition for the Homeless
Downtown Development Corporation
Family & Children’s Place
Federal Reserve Bank of St. Louis
Fitzio, Inc.
Harbor House
Highland Presbyterian Church
Holy Trinity Parish
Jefferson County Teachers Association
Kentucky State AFL-CIO
League of Women Voters of Louisville
Metro Bank
Metro United Way
Rodman Agency
Seven Counties Services
Thomas Jefferson Unitarian Church
Vision Homes LLC
Neighborhood Members ($1 – $74)
Americana Community Center
Anne Braden Institute for Social Justice Research
AU Associates
Family Scholar House
Jeffersonville Housing Authority
Kentucky Resources Council
LCCC
Lexington-Fayette Urban County Human Relations Commission
Lock Up Lead
Preservation Louisville
Watrous Associates Architects, PSC
Sponsoring Members (continued) ($500-$999)
MHC ORGANIZATIONAL MEMBERSThanks to our organizational members for their partnership and support!
metropolitanhousing.org | 2015 State of Metropolitan Housing Report 40
The Metropolitan Housing Coalition exists to bring together this community’s private and public resources to provide equitable, accessible housing opportunities for all people through advocacy, public education
and support for affordable housing providers.
Metropolitan Housing CoalitionP.O. Box 4533 Louisville, KY 40204
(502) 584-6858 www.metropolitanhousing.org
NON-PROFIT ORG. US POSTAGE
PAIDLOUISVILLE, KY PERMIT #1878