Embed Size (px)
Citation preview

STATE OF DELAWAREDEPARTMENT OF TRANSPORTATION
Financial StatementsJune 30, 2015
(With summarized financial information for the year ended June 30, 2014)
(With Independent Auditors' Report Thereon)

State of DelawareDepartment of Transportation
Table of Contents
Page
Independent Auditors' Report 3
Management's Discussion and Analysis 6
Basic Financial Statements
Statement of Net Position 11
Statement of Revenues, Expenses, and Changes in Fund Net Position 13
Statement of Cash Flows 15
Notes to Financial Statements 17
Required Supplementary Information
Required Supplementary Information - Governments That Use theModified Approach for Infrastructure Assets 59
Required Supplementary Information - DelDOT/Trust Fund Pension -Schedule of Proportionate Share of Net Pension Liability 61
Required Supplementary Information - DTC Pensions - Statement ofChanges in Net Pension Liability (Asset) and Related Ratios 62
Required Supplementary Information - DTC Pensions - Schedule ofContributions 63
Required Supplementary Information - DTC OPEB Trust - Schedule ofFunding Status and Progress 64
Supplementary Information
Delaware Transportation Authority Transportation Trust Fund
Statement of Net Position in Accordance with Trust Agreement 66
Statement of Revenues, Expenses, and Changes in Net Position inAccordance with Trust Agreement 68
Schedule of Revenue Bonds Outstanding 70
Schedule of Revenue Bond Coverage 71
Report on Internal Control Over Financial Reporting and onCompliance and Other Matters Based on an Audit of FinancialStatements Performed in Accordance with Government AuditingStandards 72
Schedule of Findings 74

William A. Santora, CPA
John A. D'Agostino, CPA, MST
Heath N. Kahrs, CPA
Robert S. Smith, CPA
Stacey A. Powell, CPA, CFE, CICA
Robert Freed, Principal
Linda A. Pappajohn, Principal
Christiana Executive Campus 220 Continental Drive Suite 112 Newark, DE 19713-4309
Phone: (302) 737-6200 (800) 347-0116 Fax: (302) 737-3362
E-Mail: [email protected] www.santoracpagroup.com
Independent Auditors' Report
State of Delaware Department of TransportationDover, Delaware
Report on the Financial Statements
We have audited the accompanying financial statements, as listed in the table of contents, of the business-type activities and each major fund of the State of Delaware Department of Transportation (theDepartment), which is an enterprise fund of the State (the State) as of and for the year ended June 30,2015, and the related notes to financial statements, which collectively comprise the Department's basicfinancial statements.
Management's Responsibility for the Financial Statements
Management is responsible for the preparation and fair presentation of these financial statements inaccordance with accounting principles generally accepted in the United States of America; this includesthe design, implementation, and maintenance of internal control relevant to the preparation and fairpresentation of financial statements that are free from material misstatement, whether due to fraud orerror.
Auditors' Responsibility
Our responsibility is to express opinions on these financial statements based on our audit. We conductedour audit in accordance with auditing standards generally accepted in the United States of America andthe standards applicable to financial audits contained in Government Auditing Standards, issued by theComptroller General of the United States. Those standards require that we plan and perform the audit toobtain reasonable assurance about whether the financial statements are free from material misstatement.
An audit involves performing procedures to obtain audit evidence about the amounts and disclosures inthe financial statements. The procedures selected depend on the auditors' judgment, including theassessment of the risks of material misstatement of the financial statements, whether due to fraud or error.In making those risk assessments, the auditor considers internal control relevant to the entity's preparationand fair presentation of the financial statements in order to design audit procedures that are appropriate inthe circumstances, but not for the purpose of expressing an opinion on the effectiveness of the entity'sinternal control. Accordingly, we express no such opinion. An audit also includes evaluating theappropriateness of accounting policies used and the reasonableness of significant accounting estimatesmade by management, as well as evaluating the overall presentation of the financial statements.
We believe that the audit evidence we have obtained is sufficient and appropriate to provide a basis forour audit opinions.
3

State of Delaware Department of Transportation
Opinion
In our opinion, the financial statements referred to above present fairly, in all material respects, therespective financial position of the business-type activities and each major fund of the Department as ofJune 30, 2015, and the respective changes in financial position and cash flows thereof for the year thenended, in accordance with accounting principles generally accepted in the United States of America.
Emphasis of Matter
Change in Accounting Princple Resulting from the Adoption of New Accounting Pronouncements
As discussed in Note 2(n) to the financial statements, during the Fiscal Year Ended June 30, 2015, theDepartment adopted the provisions of Governmental Accounting Standards Board (GASB) Statement No.68, Accounting and Financial Reporting for Pensions; and Statement No. 71, Pension Transition forContributions Made Subsequent to the Measurement Date. Our opinions are not modified with respect tothis matter.
Financial Statement Presentation
As discussed in Note 1, the financial statements of the Department are intended to present the financialposition, changes in financial position, and cash flows of only that portion of the business-type activitiesand major funds of the State that is attributable to the transactions of the Department. They do notpurport to, and do not, present fairly the financial position of the State as of June 30, 2015, the changes inits financial position, or where applicable, its cash flows for the year then ended, in conformity withaccounting principles generally accepted in the United States of America. Our opinions are not modifiedwith respect to this matter.
Other Matters
Prior Year Comparative Information
The financial statements include partial prior year comparative information. Such information does notinclude all of the information required or sufficient detail to constitute a presentation in conformity withaccounting principles generally accepted in the United States of America. Accordingly, such informationshould be read in conjunction with the Department's financial statements for the year ended June 30,2014, from which such partial information was derived. The financial statements for the year ended June30, 2014 were audited by other auditors whose report, dated December 10, 2014, expressed unmodifiedopinions on those financial statements.
Required Supplementary Information
Accounting principles generally accepted in the United States of America require that management'sdiscussion and analysis and required supplementary information, as listed in the table of contents, bepresented to supplement the basic financial statements. Such information, although not a part of the basicfinancial statements, is required by GASB who consider it to be an essential part of financial reporting forplacing the basic financial statements in an appropriate operational, economic, or historical context. Wehave applied certain limited procedures to the required supplementary information in accordance withauditing standards generally accepted in the United States of America, which consisted
4

State of Delaware Department of Transportation
of inquiries of management about the methods of preparing the information and comparing theinformation for consistency with management's responses to our inquiries, the basic financial statements,and other knowledge we obtained during our audit of the basic financial statements. We do not expressan opinion or provide any assurance on the information because the limited procedures do not provide uswith sufficient evidence to express an opinion or provide any assurance.
Supplementary Information
Our audit was conducted for the purpose of forming an opinion on the financial statements thatcollectively comprise the Department's basic financial statements. The supplementary information, aslisted in the table of contents, is presented for purposes of additional analysis and is not a required part ofthe basic financial statements. The supplementary information is the responsibility of management andwas derived from and relates directly to the underlying accounting and other records used to prepare thebasic financial statements. Such information has been subjected to the auditing procedures applied in theaudit of the basic financial statements and certain additional procedures, including comparing andreconciling such information directly to the underlying accounting and other records used to prepare thebasic financial statements or to the basic financial statements themselves, and other additional proceduresin accordance with auditing standards generally accepted in the United States of America. In our opinion,the supplementary information is fairly stated, in all material respects, in relation to the basic financialstatements as a whole.
Other Reporting Required by Government Auditing Standards
In accordance with Government Auditing Standards, we also have issued our report dated November 23,2015, on our consideration of the Department's internal control over financial reporting and on our testsof its compliance with certain provisions of laws, regulations, contracts, grant agreements, and othermatters. The purpose of that report is to describe the scope of our testing of internal control over financialreporting and compliance and the results of that testing, and not to provide an opinion on the internalcontrol over financial reporting or on compliance. That report is an integral part of an audit performed inaccordance with Government Auditing Standards in considering the Department's internal control overfinancial reporting and compliance.
____________________________________
November 23, 2015Newark, Delaware
5

State of DelawareDepartment of Transportation
Management’s Discussion and AnalysisJune 30, 2015
This section of the State of Delaware Department of Transportation’s (the Department) annual financialstatements presents our discussion and analysis of the Department’s financial performance during theFiscal Year Ended June 30, 2015.
Background
The mission of the Department is to provide a safe, efficient, and environmentally sensitive transportationnetwork that offers a variety of convenient, cost-effective mobility opportunities for the movement ofpeople and goods. The Department is responsible for the construction and maintenance of the State ofDelaware’s (the State) roadways, bridges, and public transportation systems, and for the coordination anddevelopment of the State’s comprehensive, balanced transportation planning and policies.
Financial Highlights
Outstanding revenue bonds payable continued to decrease as the Department continues to limit long-term borrowing and decrease debt-service costs. Revenue bonds payable decreased to $861.4 millionat June 30, 2015 from $939.1 million at June 30, 2014.
Operating revenues increased by $26.6 million to $510.9 million during the Fiscal Year Ended June30, 2015, primarily from 1) increased motor vehicle related revenues as a result of continued strongauto sales, 2) increases in SR-1 toll revenues due to implementation of weekend toll increase, and 3)increased motor fuel taxes as a result of lower fuel prices.
Operating expenses increased by $33.3 million to $601.0 million during the Fiscal Year Ended June30, 2015, primarily as a result of increases in road maintenance, preservation, and repair expenses dueto an increased focus on maintaining the State's transportation infrastructure in a state of good repair.
Total capital assets (net of depreciation) increased $49.0 million to $4,321.3 million during FiscalYear 2015, primarily as a result of the following infrastructure and equipment spending: West DoverConnector - $6.7 million; US 301 - $12.8 million; Wilmington Riverfront/Christina River Bridge -$5.3 million; SR-1/I-95 Interchange - $5.8 million; and truck and tractor purchases - $7.5 million.
Overview of the Financial Statements
The Department is an agency of the State and operates as an enterprise fund. Included within theDepartment is the Delaware Transportation Authority (the Authority), which is a blended component unitof the Department. The Authority is made up of the activities of the Transportation Trust Fund (the TrustFund) and the Delaware Transit Corporation (DTC).
The financial section of this annual report consists of five parts: (1) management’s discussion andanalysis, (2) the basic financial statements, (3) notes to the financial statements, (4) requiredsupplementary information, and (5) supplementary information.
6

State of DelawareDepartment of Transportation
Management’s Discussion and AnalysisJune 30, 2015
The financial statements provide both long- and short-term information about the Department’s overallfinancial status.
The financial statements also include notes that explain some of the information in the financialstatements and provide more detailed data. The statements are followed by required supplementaryinformation and supplementary information that further explain and support the information in thefinancial statements.
The Department’s financial statements are prepared in conformity with accounting principles generallyaccepted in the United States of America (GAAP) as applied to government units on an accrual basis.Under this basis, revenues are recognized in the period in which they are earned, expenses are recognizedin the period in which they are incurred, and depreciation of assets is recognized in the statement ofrevenues, expenses, and changes in fund net position. All assets and liabilities associated with theoperation of the Department are included in the statement of net position.
Financial Analysis of the Department
Net Position
The Department's total assets were $4,705.8 million at June 30, 2015, compared to $4,675.4 million atJune 30, 2014. Total liabilities were $1,252.4 million at June 30, 2015, compared to $1,316.8 million atJune 30, 2014. Net position at June 30, 2015 was $3,440.7 million, compared to $3,361.9 million at June30, 2014.
Condensed Financial Information - Department of TransportationNet Position as of June 30
(Dollars expressed in millions)
Change
2015 2014 ($) (%)
Current assets $ 309.2 $ 313.2 $ (4.0) (1.3)Capital assets 4,321.3 4,272.3 49.0 1.1Other noncurrent assets 75.3 89.9 (14.6) (16.2)
Total assets 4,705.8 4,675.4 30.4 0.7
Deferred outflows of resources 29.4 22.8 6.6 28.9
Current liabilities 181.1 179.7 1.4 0.8Noncurrent liabilities 1,071.3 1,137.1 (65.8) (5.8)
Total liabilities 1,252.4 1,316.8 (64.4) (4.9)
Deferred inflows of resources 42.1 19.6 22.5 114.8
Net positionNet investment in capital assets 3,445.9 3,267.4 178.5 5.5Restricted 153.1 160.5 (7.4) (4.6)Unrestricted (158.3) (66.0) (92.3) 139.8
Total net position $ 3,440.7 $ 3,361.9 $ 78.8 2.3
7

State of DelawareDepartment of Transportation
Management’s Discussion and AnalysisJune 30, 2015
The increase in capital assets is primarily a result of the following infrastructure and equipment spending:West Dover Connector - $6.7 million; US 301 - $12.8 million; Wilmington Riverfront/Christina RiverBridge - $5.3 million; SR-1/I-95 Interchange - $5.8 million; and truck and tractor purchases - $7.5million.
Although there were increases in the net post-employment benefits obligations adding to liabilities, thedecrease in total liabilities is primarily the result of not issuing new debt during the year and the paymentof existing bonds.
For Fiscal Year 2015, the unrestricted net position decreased due to the decision to draw down existingcash balances to pay for capital assets instead of issuing new debt during the year, as well as the effect ofimplementing new accounting standards related to pensions.
Changes in Net Position
The Department's net position at June 30, 2015 was $3,440.7 million, compared to $3,361.9 million atJune 30, 2014. Operating revenues were $510.9 million and $484.3 million in Fiscal Years 2015 and2014, respectively. Total operating expenses were $601.0 million and $567.8 million in Fiscal Years2015 and 2014, respectively.
Condensed Financial Information - Department of TransportationChanges in Net Position for the Years Ended June 30
(Dollars expressed in millions)
Change
2015 2014 ($) (%)
Operating revenues $ 510.9 $ 484.3 $ 26.6 5.5
Operating expensesOperating expenses 573.8 534.5 39.3 7.4Depreciation 27.2 33.2 (6.0) (18.1)
Total operating expenses 601.0 567.7 33.3 5.9
Operating loss (90.1) (83.4) (6.7) 8.0
Nonoperating revenues, net 212.3 188.5 23.8 12.6
Income before transfers 122.2 105.1 17.1 16.3
Transfers, net (7.1) 39.7 (46.8) (117.9)
Change in net position 115.1 144.8 (29.7) (20.5)
Total net position - beginning of year, as previouslystated 3,361.9 3,217.1 144.8 4.5
Prior period adjustment - Implementation of GASBNos. 68 and 71 (36.3) - (36.3) N/A
Total net position - beginning of year, as restated 3,325.6 3,217.1 108.5 3.4
Total net position - end of year $ 3,440.7 $ 3,361.9 $ 78.8 2.3
8

State of DelawareDepartment of Transportation
Management’s Discussion and AnalysisJune 30, 2015
The increase in operating revenues from 2014 to 2015 is primarily attributed to increased toll revenuesand an increase in motor vehicle and related revenues as a result of increased auto sales.
The increase in total operating expenses from 2014 to 2015 is primarily due to increased professional feesfor the planning of projects and increases in materials and supplies from a challenging winter season.
The increase in nonoperating revenues from 2014 to 2015 is a result of increased federal grant revenuesrelating to federal capital projects.
Capital Assets and Debt Administration
Capital Assets
As of June 30, 2015, the Department had invested $4,530.2 million in capital assets, including roads,bridges, buildings, land, and equipment. Net of accumulated depreciation, the Department's net capitalassets at June 30, 2015 totaled $4,321.3 million. This amount represents a net increase (includingadditions and disposals, and net of depreciation) of $49.0 million over June 30, 2014. The increase isprimarily a result of the following infrastructure and equipment spending: West Dover Connector - $6.7million; US 301 - $12.8 million; Wilmington Riverfront/Christina River Bridge - $5.3 million; SR-1/I-95Interchange - $5.8 million; and truck and tractor purchases - $7.5 million.
The Department is using the "modified approach" related to depreciation on its roads and bridges. Themodified approach requires that the Department initially set a percentage benchmark for maintaining theinfrastructure in fair or better condition and report at least every three years on their condition assessment.
It is the Department's policy to maintain at least 85% of its highway system at a fair or better conditionrating and 75% of its bridge system (combined structural and deck ratings) at a good or better conditionrating as follows:
The condition of road pavement is measured using the Overall Pavement Condition (OPC) system, whichis based on the extent and severity of various pavement distresses that are visually observed. The OPCsystem uses a measurement scale that is based on a condition index ranging from 0 for poor pavement to5 for pavement in good condition.
The condition of bridge structures is measured using the "Bridge Condition Rating" (BCR), which isbased on the Federal Highway Administration's (FHWA) Coding Guide, "Recording and Coding Guidefor the Structure Inventory and Appraisal of the Nation's Bridges". The BCR uses a measurement scalethat is based on a condition index ranging from 0 to 9, 0 to 4 for substandard bridges, and 9 for bridges ingood condition. For reporting purposes, substandard bridges are classified as those with a rating of 4 orless. The good or better condition bridges are taken as those with ratings of 6 to 9. A rating of 5 isconsidered fair. The information is taken from past "Bridge Inventory Status" reports.
The Department performs condition assessments of eligible infrastructure assets at least every three years.
9

State of DelawareDepartment of Transportation
Management’s Discussion and AnalysisJune 30, 2015
Of the Department's 1,626 bridge structures that were rated in 2015, 74.5% received a good or better BCRrating, 18.7% were rated fair, and 6.8% received a substandard rating. Of the 8,049,340 square feet ofbridge deck that was rated, 74.3% or 5,979,029 square feet received an OPC condition rating of good orbetter, 21.1% received a fair rating, and 4.6% received a substandard deck rating. In 2013, 4,448centerline miles were rated; 98.6% received a fair or better OPC rating and 1.4% received a poor rating.No roadway condition assessment was performed for Fiscal Year 2015.
The estimate to maintain and preserve the Department's infrastructure was $241.9 million and $198.9million for 2015 and 2014, respectively. The actual expenditures were $291.6 million and $234.8 millionfor 2015 and 2014, respectively.
Debt Administration
Transportation Systems Revenue Bonds are issued with the approval of the State and the State's BondIssuing Officers (the Governor, the Secretary of Finance, the Secretary of State, and the State Treasurer)to finance improvements to the State's transportation systems. Approval by the General Assembly of theState is not required for the Authority to issue bonds to refund any of its bonds provided that a presentvalue debt service savings is achieved in such refunding. The sales must comply with the rules andregulations of the United States Treasury Department and the United States Securities and ExchangeCommission.
At June 30, 2015, the Authority had $861.4 million in revenue bonds outstanding, an 8.3% decrease fromJune 30, 2014. On June 30, 2015 and 2014, the Authority had a total of $262.4 million in authorized butunissued revenue bonds.
Of the 10 outstanding Senior Bond Issues, all bonds are rated AA+ and Aa2 by Standard and Poor's andMoody's Investors Services, respectively. The GARVEE Bond, 2010 Series is rated AA and A1 byStandard and Poor's and Moody's Investors Services, respectively.
The Department's investment portfolio is actively managed by Wilmington Trust Company and primarilyconsists of U.S. government securities, U.S. government agency securities, and high-grade commercialpaper. The majority of these investments have maturities of less than one year. The Department's bondratings have allowed continued access to the municipal bond market at favorable interest rates.
Contacting the Department's Financial Management
This financial report is designed to provide bondholders, patrons, and other interested parties with ageneral overview of the Department's finances and to demonstrate the Department's accountability for themoney it receives. If you have questions about this report or need additional financial information,contact the State of Delaware Department of Transportation, Finance Unit, P.O Box 778, Dover,Delaware 19903.
10

State of DelawareDepartment of Transportation
Statement of Net PositionJune 30, 2015
(with summarized financial information for June 30, 2014)
Delaware Transportation Authority 2015 2014DELDOT TTF DTC Total Total
Current assetsCash and cash equivalents
Unrestricted $ 258,338 $ 26,447,592 $ 34,715,497 $ 61,421,427 $ 46,816,405Restricted 6,799 3,655,737 - 3,662,536 26,655,174
Pooled cash and investments 12,401,297 - - 12,401,297 14,355,895Investments - at fair value
Unrestricted - 55,413,618 - 55,413,618 79,197,865Restricted 195,896 110,039,426 - 110,235,322 70,517,154
Accounts receivableTrade 10,617,916 8,891,270 1,016,993 20,526,179 18,189,511Federal grants 26,268,004 276,291 765,313 27,309,608 39,121,024Interest - 398,661 - 398,661 454,745
Inventory 14,554,901 - 3,096,249 17,651,150 17,702,410Other assets - - 207,330 207,330 213,325
Total current assets 64,303,151 205,122,595 39,801,382 309,227,128 313,223,508
Noncurrent assetsCapital assets, not depreciable
Land 144,769,155 152,306,437 1,872,536 298,948,128 288,612,090Infrastructure 2,543,143,814 1,216,991,300 - 3,760,135,114 3,723,674,937Construction in progress 17,169,477 - - 17,169,477 34,086,538Service concession buildings and improvements - 22,100,000 - 22,100,000 22,100,000
Capital assets, depreciableBuildings and improvements 71,596,684 8,072,030 57,862,351 137,531,065 118,630,402Fixtures, vehicles, and equipment 111,904,656 - 182,422,919 294,327,575 296,476,030
Total capital assets 2,888,583,786 1,399,469,767 242,157,806 4,530,211,359 4,483,579,997Less: accumulated depreciation 85,923,293 4,217,142 118,779,115 208,919,550 211,273,388Capital assets, net 2,802,660,493 1,395,252,625 123,378,691 4,321,291,809 4,272,306,609
Investments - at fair value, net of current portionUnrestricted - 4,563,474 - 4,563,474 26,553,523Restricted - 70,484,736 - 70,484,736 59,626,299
Net pension asset - - 253,443 253,443 3,707,985Total noncurrent assets 2,802,660,493 1,470,300,835 123,632,134 4,396,593,462 4,362,194,416
Total assets 2,866,963,644 1,675,423,430 163,433,516 4,705,820,590 4,675,417,924
Deferred outflows of resourcesLoss on refundings of debt - 20,448,278 - 20,448,278 22,823,445Changes in employer proportionate share of net pension liability 212,160 - - 212,160 -Pension contributions made after the measurement date 6,508,133 - 2,232,549 8,740,682 -
Total deferred outflows of resources 6,720,293 20,448,278 2,232,549 29,401,120 22,823,445
(Continued)11
State of DelawareDepartment of Transportation
Statement of Net Position (Continued)June 30, 2015
(with summarized financial information for June 30, 2014)
Delaware Transportation Authority 2015 2014DELDOT TTF DTC Total Total
Current liabilitiesAccounts payable and other accrued expenses $ 15,711,288 $ 15,608,211 $ 10,317,149 $ 41,636,648 $ 41,444,293Accrued payroll 3,749,874 - 2,124,008 5,873,882 5,342,023Escrow deposits 6,411,575 2,259,980 - 8,671,555 10,112,519Customer toll deposits - 14,487,762 - 14,487,762 11,921,228Interest payable - 20,737,791 - 20,737,791 20,733,321Unearned revenue - - - - 56,675Pollution remediation obligations 685,000 - - 685,000 1,280,000Insurance loss reserve - - 2,485,340 2,485,340 2,427,420Compensated absences payable 963,077 - 1,127,251 2,090,328 1,787,132General obligation bonds payable - - - - 103,426Revenue bonds payable - 72,580,000 - 72,580,000 77,655,000Bond issue premium - net of accumulated amortization - 11,902,313 - 11,902,313 6,823,880
Total current liabilities 27,520,814 137,576,057 16,053,748 181,150,619 179,686,917
Noncurrent liabilitiesOther post-employment benefits payable 112,946,392 - 101,508,765 214,455,157 194,503,873Compensated absences - net of current portion 7,629,630 - 2,194,981 9,824,611 10,479,463Insurance loss reserve - net of current portion - - 9,168,660 9,168,660 9,583,580Pollution remediation obligations - net of current portion 1,308,000 - - 1,308,000 2,231,500Revenue bonds payable - net of current portion - 788,820,000 - 788,820,000 861,400,000Bond issue premium - net of accumulated amortization and current
portion - 33,576,224 - 33,576,224 58,915,314Net pension liability 14,114,288 - - 14,114,288 -
Total noncurrent liabilities 135,998,310 822,396,224 112,872,406 1,071,266,940 1,137,113,730
Total liabilities 163,519,124 959,972,281 128,926,154 1,252,417,559 1,316,800,647
Deferred inflows of resourcesService concession arrangement - 18,942,857 - 18,942,857 19,574,286Differences between projected and actual earnings on pension plan
investments 22,430,145 - 706,367 23,136,512 -
Total deferred inflows of resources 22,430,145 18,942,857 706,367 42,079,369 19,574,286
Net positionNet investment in capital assets 2,802,660,493 519,840,247 123,378,691 3,445,879,431 3,267,408,989Restricted 202,695 152,713,740 253,443 153,169,878 160,506,612Unrestricted (115,128,520) 44,402,583 (87,598,590) (158,324,527) (66,049,165)
Total net position $ 2,687,734,668 $ 716,956,570 $ 36,033,544 $ 3,440,724,782 $ 3,361,866,436
See accompanying notes to financial statements.12
State of DelawareDepartment of Transportation
Statement of Revenues, Expenses, and Changes in Fund Net PositionJune 30, 2015
(with summarized financial information for June 30, 2014)
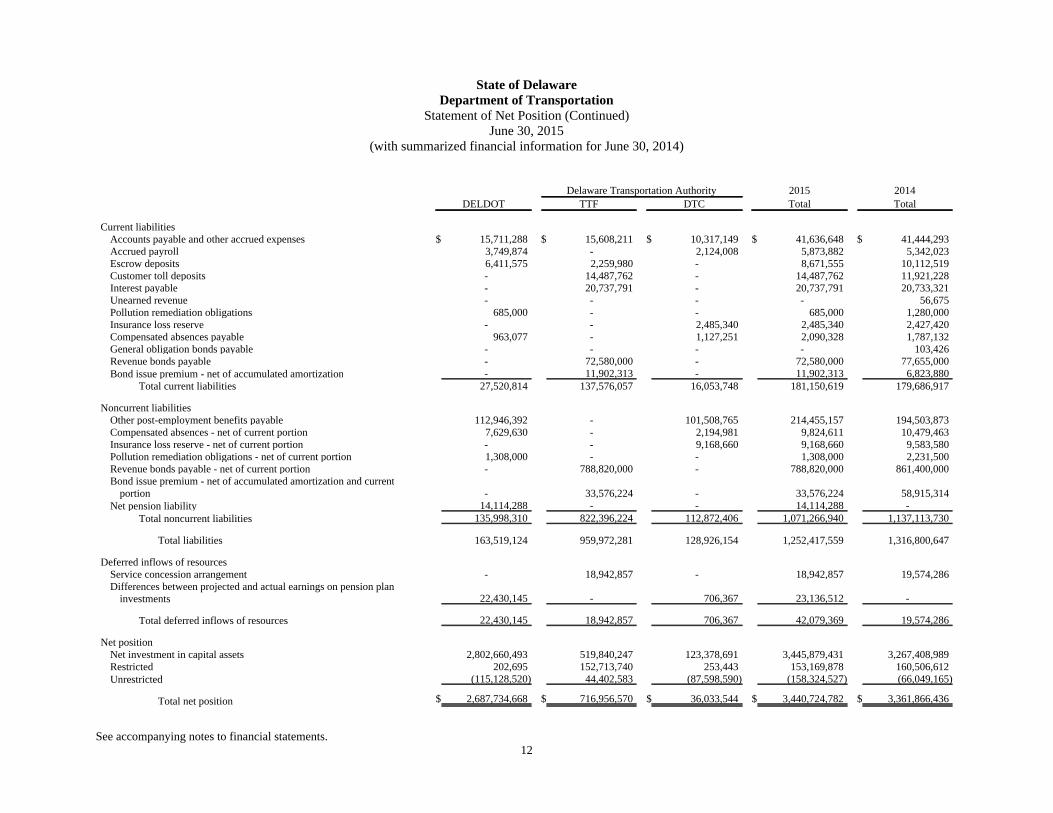
Delaware Transportation Authority 2015 2014DELDOT TTF DTC Total Total
Operating revenuesPledged revenue
Turnpike revenue $ - $ 120,363,461 $ - $ 120,363,461 $ 122,404,184Motor fuel tax revenue - 116,968,447 - 116,968,447 114,555,916Motor vehicle document fee revenue - 94,037,087 - 94,037,087 84,830,376Motor vehicle registration fee revenue - 51,184,304 - 51,184,304 49,243,279Other motor vehicle revenue - 25,757,326 - 25,757,326 26,259,772International Fuel Tax Agreement revenue - 2,694,453 - 2,694,453 2,372,142
Toll revenue - Delaware SR-1 - 55,767,180 - 55,767,180 47,561,542Passenger fares - - 18,452,285 18,452,285 16,332,281Miscellaneous 13,299,683 9,571,417 2,820,574 25,691,674 20,751,376
Total operating revenues 13,299,683 476,343,675 21,272,859 510,916,217 484,310,868
Operating expensesRoad maintenance, preservation, and repairs 106,012,905 45,864,274 - 151,877,179 122,087,638Payroll expense 115,000,588 - 79,833,141 194,833,729 200,998,978Professional fees 51,168,591 99,182,481 21,598,327 171,949,399 157,477,186Materials, supplies, and other 7,360,703 26,165,562 21,590,493 55,116,758 53,947,378Depreciation 7,872,770 188,500 19,131,585 27,192,855 33,242,994
Total operating expenses 287,415,557 171,400,817 142,153,546 600,969,920 567,754,174
Operating income (loss) (274,115,874) 304,942,858 (120,880,687) (90,053,703) (83,443,306)
Nonoperating revenues (expenses)Income from investments - pledged - 1,844,953 - 1,844,953 2,257,110Income from investments - - - - 24,083Bad debt recovery - 923,348 - 923,348 887,732Federal grant revenue 226,266,879 276,291 7,475,681 234,018,851 224,087,434Pass-through grant revenue - - 3,336,385 3,336,385 3,206,584Pass-through grant expense - - (4,962,061) (4,962,061) (5,973,876)Interest expense - (23,482,198) - (23,482,198) (38,529,291)Service concession arrangement - 631,428 - 631,428 2,525,714
Excess (deficiency) of nonoperating revenues overnonoperating expenses 226,266,879 (19,806,178) 5,850,005 212,310,706 188,485,490
Income (loss) before transfers (47,848,995) 285,136,680 (115,030,682) 122,257,003 105,042,184
(Continued)13
State of DelawareDepartment of Transportation
Statement of Revenues, Expenses, and Changes in Fund Net Position (Continued)June 30, 2015
(with summarized financial information for June 30, 2014)
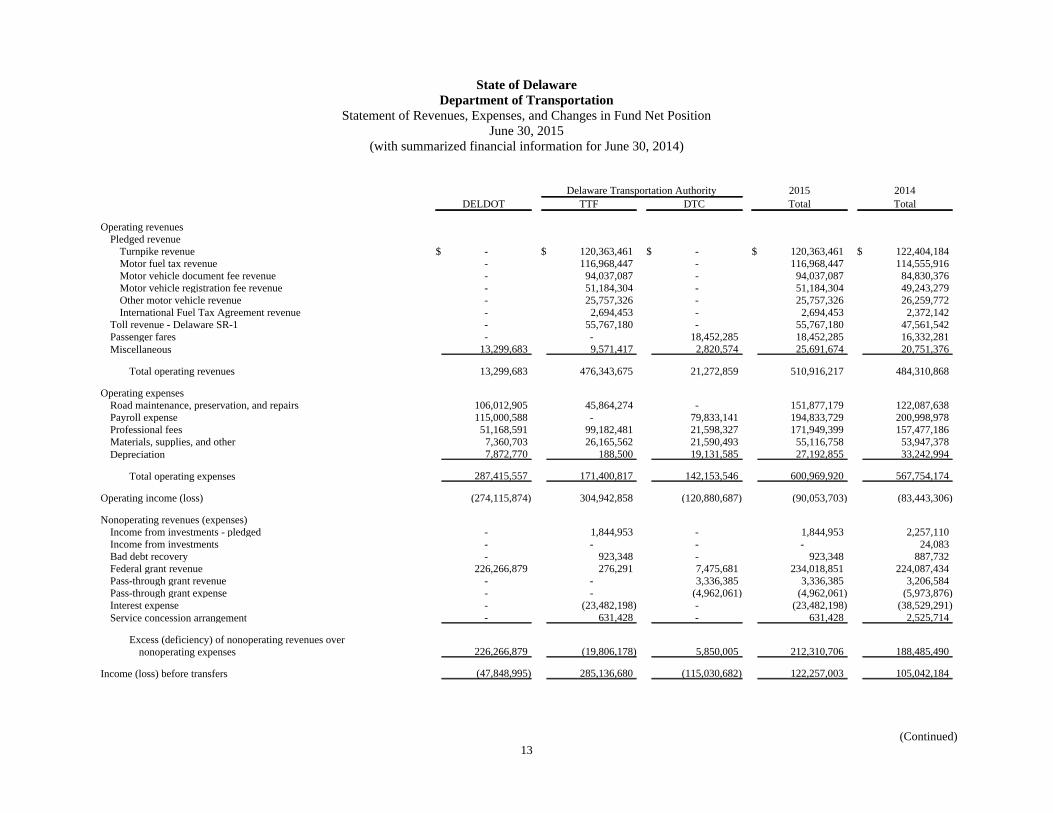
Delaware Transportation Authority 2015 2014DELDOT TTF DTC Total Total
Transfers to other governmental agencies $ - $ (5,484,944) $ - $ (5,484,944) $ (3,743,385)Transfers to State General Fund - (5,000,000) - (5,000,000) (5,000,000)Transfers from State General Fund - 3,388,738 - 3,388,738 48,467,109Capital contributions (13,791,965) - 13,791,965 - -Transfers to DTC (7,331,880) (85,583,707) 92,915,587 - -Transfers to DelDOT 104,103,279 (104,103,279) - - -
Change in fund net position 35,130,439 88,353,488 (8,323,130) 115,160,797 144,765,908
Fund net position - beginning of year, as previously stated 2,687,157,063 628,603,082 46,106,291 3,361,866,436 3,217,100,528
Prior period adjustment - Implementation of GASB Nos. 68 and 71 Net pension liability (measurement date) (41,255,617) - (3,815,944) (45,071,561) - Deferred outflows - Contributions made during Fiscal Year 2014 6,702,783 - 2,066,327 8,769,110 -
Total prior period adjustment (34,552,834) - (1,749,617) (36,302,451) -
Fund net position - beginning of year, as restated 2,652,604,229 628,603,082 44,356,674 3,325,563,985 3,217,100,528
Fund net position - end of year $ 2,687,734,668 $ 716,956,570 $ 36,033,544 $ 3,440,724,782 $ 3,361,866,436
See accompanying notes to financial statements.14

State of DelawareDepartment of Transportation
Statement of Cash FlowsJune 30, 2015
(with summarized financial information for June 30, 2014)
Delaware Transportation Authority 2015 2014DELDOT TTF DTC Total Total
Cash flows from operating activitiesReceipts from customers $ 10,419,238 $ 477,878,722 $ 18,374,660 $ 506,672,620 $ 481,661,002Payments to suppliers (172,003,495) (167,947,809) (39,820,124) (379,771,428) (316,709,002)Payments to employees (109,680,352) - (63,791,063) (173,471,415) (177,134,285)Insurance claims paid - - (5,537,731) (5,537,731) (3,960,884)Other receipts - - 2,820,390 2,820,390 2,445,960
Net cash provided by (used in) operating activities (271,264,609) 309,930,913 (87,953,868) (49,287,564) (13,697,209)
Cash flows from noncapital financing activitiesTransfers from State General Fund - 3,388,738 - 3,388,738 48,467,109Transfers to State General Fund - (5,000,000) - (5,000,000) (5,000,000)Federal operating subsidies - - 7,475,681 7,475,681 4,516,222Pass-through grant revenue - - 3,528,336 3,528,336 2,159,344Pass-through grant payments - - (4,962,061) (4,962,061) (5,973,876)Transfers from TTF 96,963,350 (189,686,986) 92,723,636 - (701,690)Transfers to other governmental agencies - (5,484,944) - (5,484,944) (3,743,385)
Net cash provided by (used in) noncapital financing activities 96,963,350 (196,783,192) 98,765,592 (1,054,250) 39,723,724
Cash flows from capital and related financing activitiesPayments of revenue bond principal - (77,655,000) - (77,655,000) (84,450,000)Payments of general obligation bond principal - (103,426) - (103,426) (142,867)Premium from revenue bond sale - - - - 15,983,075Loss from bond refunding - - - - 8,089,500Federal reimbursement of debt service - 276,291 - 276,291 -Proceeds from capital grants 230,404,449 6,623,370 - 237,027,819 207,200,107Bond issuance costs from revenue bond sale - - - - 2,380,684Proceeds from capital contributions (14,842,441) - 14,842,441 - -Acquisition of capital assets (43,740,034) (12,131,568) (20,356,310) (76,227,912) (127,250,270)Payments of interest - (41,363,218) - (41,363,218) (47,745,720)
Net cash provided by (used in) capital and related financingactivities 171,821,974 (124,353,551) (5,513,869) 41,954,554 (25,935,491)
Cash flows from investing activitiesPurchase of investments - (2,352,695,177) - (2,352,695,177) (23,433,296)Proceeds from sale of investments 7,922 2,347,884,946 - 2,347,892,868 26,945,974Collection on loans previously written off - 923,348 - 923,348 887,732Escrow insurance deposits - - 22,971 22,971 37,176Interest received - 1,901,036 - 1,901,036 2,200,048
Net cash provided by (used in) investing activities 7,922 (1,985,847) 22,971 (1,954,954) 6,637,634
(Continued)15

State of DelawareDepartment of Transportation
Statement of Cash Flows (Continued)June 30, 2015
(with summarized financial information for June 30, 2014)
Delaware Transportation Authority 2015 2014DELDOT TTF DTC Total Total
Net increase (decrease) in cash and cash equivalents $ (2,471,363) $ (13,191,677) $ 5,320,826 $ (10,342,214) $ 6,728,658
Cash and cash equivalents - beginning of year 15,137,797 43,295,006 29,394,671 87,827,474 81,098,816
Cash and cash equivalents - end of year $ 12,666,434 $ 30,103,329 $ 34,715,497 $ 77,485,260 $ 87,827,474
Reconciliation of operating income (loss) to net cash used inoperating activities
Net operating income (loss) $ (274,115,874) $ 304,942,858 $ (120,880,687) $ (90,053,703) $ (83,443,306)
Adjustment to reconcile net operating income (loss) to net
cash provided by (used in) operating activitiesDepreciation 7,872,770 188,500 19,131,585 27,192,855 33,242,994Adoption of GASB Nos. 68 and 71 3,698,443 - (178,743) 3,519,700 -Changes in assets and liabilities
(Increase) decrease in accounts receivable - trade (1,934,359) (479,934) 77,625 (2,336,668) (292,694)(Increase) decrease in inventory (425,683) - 476,943 51,260 722,917Decrease in prepaid expenses - - 28,965 28,965 1,012,651(Increase) decrease in net pension asset - - 361,402 361,402 (395,894)Increase (decrease) in accounts payable and other accrued
expenses (5,517,113) 3,264,508 2,444,960 192,355 7,341,928Increase (decrease) in escrow deposits (946,086) (494,878) - (1,440,964) 3,990,487Increase (decrease) in insurance loss reserve - - (357,000) (357,000) 2,164,000Increase (decrease) in compensated absences (482,196) - 130,540 (351,656) (1,678,389)Increase (decrease) in accrued payroll and related expenses 271,542 - 260,317 531,859 (287,931)Decrease in unearned revenue - (56,675) - (56,675) (535,890)Increase (decrease) in customer toll deposits - 2,566,534 - 2,566,534 (1,864,354)Increase (decrease) in pollution remediation obligations (1,518,500) - - (1,518,500) 99,365Decrease in net pension liability (7,568,612) - - (7,568,612) -Increase in post-employment benefits payable 9,401,059 - 10,550,225 19,951,284 26,226,907
Net cash provided by (used in) operating activities $ (271,264,609) $ 309,930,913 $ (87,953,868) $ (49,287,564) $ (13,697,209)
See accompanying notes to financial statements.16

State of DelawareDepartment of Transportation
Notes to Financial StatementsJune 30, 2015
(1) Organization
The Delaware Department of Transportation (the Department) is a major fund of the State ofDelaware (the State). The Department has the overall responsibility for coordinating anddeveloping comprehensive, balanced transportation planning and policies for the State. Inaddition, the Department has overall responsibility for maintenance and operation of roadways andbridges that fall under its jurisdiction. To assist the Department in their mission, the State and theDepartment created the Delaware Transportation Authority (the Authority), which includes theactivities of the Transportation Trust Fund (the Trust Fund) and the Delaware Transit Corporation(DTC). The Authority is a body politic and corporate whose actions are overseen by the Secretaryof Transportation (the Secretary), the Director of the Office of Financial Management and Budget,and the Administrator of the Trust Fund. The Authority’s principal role is to provide financing tothe Department and, as a result, is a blended component unit of the State and is included in thesefinancial statements on a blended basis.
The Trust Fund was created by the State as a special fund with its corporate powers held by theAuthority, under the Transportation Trust Fund Act of 1987 (the TTF Act). The underlyingpurpose of the TTF Act and the Trust Fund is to address the growing urgency to provide additionalmeans to finance the maintenance and development of the integrated highway, air, and watertransportation system in the State for the economic benefit of the State and for the welfare andsafety of the users of the transportation system. The primary funding of the Trust Fund comesfrom motor fuel taxes, motor vehicle document fees, motor vehicle registration fees, and othertransportation-related fees, which are imposed and collected by the State and transferred to theTrust Fund. The State has irrevocably pledged, assigned, and continuously appropriated to theTrust Fund these taxes and fees. The other major sources of revenue for the Trust Fund are theDelaware Turnpike and the Delaware SR-1 Toll Roads. The Authority may apply Trust Fundrevenue for transportation projects, subject to the approval of the State, and may pledge any or allof this revenue to secure financing for these projects. The TTF Act also granted the Authority thepower to issue bonds payable from and secured by the revenues pledged and assigned to the TrustFund.
The trust agreements in effect are the Motor Fuel Tax Revenue Bond Trust Agreement (the MotorFuel Tax Agreement), dated September 1, 1981, as supplemented, and the Transportation TrustFund Agreement (the Trust Agreement), dated August 1, 1988, as supplemented. The TrustAgreement is a bond indenture, intended to ensure payment to bondholders through assets andrevenues pledged to the Trust Fund. Pledged revenues fund certain accounts created under Section4.02 of the Trust Agreement and, to the extent those revenues are not needed for that purpose, theyare deposited, lien-free, to the Trust Fund. Surplus pledged revenues and nonpledged revenues ofthe Trust Fund may be used to fund the operations of the Department. The provisions of the MotorFuel Tax Agreement and the Trust Agreement govern the disposition of revenues and other incomeand prescribe certain accounting practices, including the conditions for transfer of monies amongthe various funds and accounts held by the Authority or the Trustee and the use of such funds.
Pursuant to Title 2 of the Delaware Code, Sections 1304(a) and 1307(a) as enacted by 69 DelawareLaw Chapter 435, DTC was created in Fiscal Year 1995 as a subsidiary public benefit corporation
17

State of DelawareDepartment of Transportation
Notes to Financial StatementsJune 30, 2015
of the Authority. With approval of the Governor, the Secretary appoints the Director of DTC, whoserves at the pleasure of the Secretary. The Authority provides significant operational subsidies toDTC annually. DTC is authorized to operate the public transportation system within the State andprovides services directly to the public. As a result, it is a blended component unit of theAuthority. Separate financial statements for DTC are available by writing to the State of DelawareDepartment of Transportation, 800 Bay Road, Dover, Delaware 19903.
(2) Summary of Significant Accounting Policies
(a) Measurement Focus and Basis of Accounting
The Department, which is comprised of three funds - DelDOT, the Trust Fund, and DTC,operates as an enterprise fund. The Department’s financial statements are reported using theeconomic resources measurement focus and the accrual basis of accounting. Under thismethod, revenues are recorded when earned and expenses are recorded at the time liabilitiesare incurred, regardless of the timing of the related cash flows.
(b) Cash and Cash Equivalents
Cash and cash equivalents consist of demand deposits, short-term money market securities,and other deposits held by financial institutions, generally with original maturities of threemonths or less when purchased.
The Department maintains cash escrow accounts for administrative purposes and hasclassified these cash balances as restricted. An offsetting liability is recorded in theaccompanying statement of net position.
(c) Allowance for Doubtful Accounts
Accounts receivable are expected to be fully collectible at June 30, 2015, and accordingly, aprovision for uncollectible accounts has not been established.
(d) Inventory
Inventory is accounted for at the lower of cost or market. Cost is determined using theweighted average method.
(e) Investments
Investments are recorded at fair value. Fair value is determined using quoted market pricesin an active market, if available. For certain U.S. government agency and corporate fixed-income securities, for which an active market does not exist, fair value is determined using adiscounted cash flow model. Significant inputs to the discounted cash flow model are thecoupon, yield, and expected maturity date of the security.
18

State of DelawareDepartment of Transportation
Notes to Financial StatementsJune 30, 2015
(f) Management Estimates
The preparation of financial statements in conformity with accounting principles generallyaccepted in the United States of America requires management to make estimates andassumptions that affect the reported amounts of assets and liabilities and disclosure ofcontingent assets and liabilities at the date of the financial statements and the reportedamounts of revenues and expenses during the reporting period. Actual results could differfrom those estimates.
(g) Capital Assets
Capital assets, which include land, buildings, improvements, fixtures, equipment, andinfrastructure assets (such as roads and bridges, which are normally immovable and of valueonly to the State), are reported in the Department’s financial statements.
Capital assets are defined by the State as assets with an initial individual cost of more than$25,000 at the date of acquisition and an estimated useful life in excess of one year. It is thepolicy of the Department, with the exception of DTC, to capitalize all buildings and landregardless of cost, improvements to land and buildings when the cost of projects exceed$100,000, and infrastructure when the cost of individual items or projects exceeds$1,000,000. Such assets are recorded at historical cost, or estimated historical cost, iforiginal cost is not determinable. Donated capital assets are recorded at estimated fairmarket value at the time of the donation. Buildings, improvements, fixtures, and equipmentare depreciated on a straight-line basis.
Capital assets are defined by DTC as all assets purchased with State and federal grant funds,as well as any asset with a cost greater than $5,000 purchased with operating funds.
For assets not part of infrastructure, the costs of normal preservation, maintenance, andrepairs that do not add to the value of the asset or materially extend asset lives are notcapitalized.
For infrastructure, the Department uses the “modified approach” to account for roads andbridges, as provided by Governmental Accounting Standards Board (GASB) Statement No.34, Basic Financial Statements - and Management's Discussion and Analysis - for State andLocal Governments. Under this process, the Department does not record depreciationexpense nor are amounts expended in connection with improvements to these assetscapitalized, unless the improvements expand the capacity or efficiency of an asset.Utilization of this approach requires the Department to: (1) commit to maintaining andpreserving affected assets at or above a condition level established by the Department, (2)maintain an inventory of the assets and perform periodic condition assessments to ensurethat the condition level is being maintained, and (3) make annual estimates of the amountsthat must be expended to maintain and preserve assets at the predetermined condition levels.
19

State of DelawareDepartment of Transportation
Notes to Financial StatementsJune 30, 2015
The Department maintains two asset management systems, one for the roads and one for thebridges. In addition, the Department completes condition assessments on its roads andbridges at least every three years.
Buildings, improvements, fixtures, and equipment, other than those associated with serviceconcession agreements, are depreciated using the straight-line method over the followingestimated useful lives:
Buildings and improvements 5 - 40 yearsRevenue vehicles 4 - 25 yearsService vehicles and equipment 3 - 20 yearsCommunications equipment 10 - 40 yearsFurniture and fixtures 3 - 10 yearsBus signs and shelters 10 years
(h) Compensated Absences
Compensated absences are absences for which Department employees will be paid, such asvacation and sick leave. A liability for compensated absences that are attributable toservices already rendered and that are not contingent on a specific event that is outside thecontrol of the Department and its employees is accrued as employees earn the rights to thebenefits. Compensated absences that relate to future services or that are contingent on aspecific event that is outside the control of the Department and its employees are accountedfor in the period in which such services are rendered or such events take place.
(i) Line of Credit
The Trust Fund has a line of credit agreement with PNC Bank for $50,000,000 that maturesNovember 2016. There were no borrowings against the line at June 30, 2015. The linebears interest on the amount that has been advanced from time to time pursuant to the bankloan agreements. At June 30, 2015, the rate was equal to 0.6975%.
(j) Revenue Recognition
Turnpike/Toll Revenue - Turnpike/Toll revenues consist primarily of fees for the usage of theDelaware Turnpike and the toll portion of Delaware SR-1 and are recognized at the timevehicles pass through the toll plazas.
Motor Fuel Tax Revenue - Motor fuel tax revenues are generally recognized at the time fuelis dispensed to the ultimate user.
Motor Vehicle Revenue - Motor vehicle revenues are recognized at the time services areprovided to customers.
Passenger Fares - Passenger fare revenues are recorded at the time services are provided.
20

State of DelawareDepartment of Transportation
Notes to Financial StatementsJune 30, 2015
(k) Bond Issue Premiums/Discounts
Amortization of bond issue premiums/discounts is provided using the straight-line methodover the life of the bond issue. Net amortization resulted in $20,260,657 of reductions ofinterest expense in 2015.
(l) Revenues and Expenses
The Department defines nonoperating revenues as federal grant revenue, investment income,and collections on loans previously written off. Pledged revenue represents taxes, fees, andinvestment income committed to repayment of revenue bonds. All other revenues arederived from normal operations of the Department. Nonoperating expenses are defined asgrant expenses and interest expense. All other expenses are a result of normal operations.
(m) Deferred Outflows of Resources and Deferred Inflows of Resources
Deferred outflows of resources are defined as consumption of net assets by the governmentthat is applicable to future reporting periods. Deferred inflows of resources are defined asacquisition of net assets by the government that is applicable to a future reporting period.Deferred outflows increase net position, similar to assets, and deferred inflows decrease netposition, similar to liabilities.
The components of deferred outflows of resources and deferred inflows of resourcesreported in the financial statements as of June 30, 2015 were as follows:
Deferred outflows of resources:Loss on refundings of debt $ 20,448,278Changes in employer proportionate share of net pension liability 212,160Pension contributions made after the measurement date 8,740,682
Total deferred outflows of resources $ 29,401,120
Deferred inflows of resources:Service concession arrangement $ 18,942,857Differences between projected and actual investment earnings on
pension plan investments 23,136,512
Total deferred inflows of resources $ 42,079,369
(n) New Accounting Standards Adopted
During the Fiscal Year Ended June 30, 2015, the Department adopted GASB Statement No.68, Accounting and Financial Reporting for Pensions. The primary objective of thisStatement is to improve accounting and financial reporting by state and local governmentsfor pensions. This Statement establishes standards for measuring and recognizing liabilities,deferred outflows of resources, deferred inflows of resources, and expense/expenditures. For
21

State of DelawareDepartment of Transportation
Notes to Financial StatementsJune 30, 2015
defined benefit pension plans, this Statement identifies the methods and assumptions thatshould be used to project benefit payments, discount projected benefit payments to theiractuarial present value, and attribute that present value to periods of employee service. Inaddition, this Statement details the recognition and disclosure requirements for employerswith liabilities (payables) to a defined benefit pension plan. Adoption of GASB No. 68resulted in the recognition of a net pension liability of $45,071,561 and a reduction of netposition of $45,071,561 as of June 30, 2014.
GASB issued Statement No. 71, Pension Transition for Contributions Made Subsequent tothe Measurement Date, in November 2013. GASB No. 71 addresses an issue regardingapplication of the transition provisions of GASB No. 68. The issue relates to amountsassociated with contributions, if any, made by a state or local government employer, ornonemployer contributing entity, to a defined benefit pension plan after the measurementdate of the government's beginning net pension liability. The adoption of GASB No. 71resulted in the recognition of deferred outflows and an increase in net position of $8,769,110as of June 30, 2014.
(o) Summarized Comparative Information
The basic financial statements include certain prior year summarized comparativeinformation in total, but not at the level of detail required for a presentation in conformitywith generally accepted accounting principles. Accordingly, such information should beread in conjunction with the Department's financial statements for the year ended June 30,2014, from which the summarized information was derived.
(3) Cash and Investments
(a) Cash Management Policy and Investment Guidelines
The Department follows the Statement of Objectives and Guidelines for the Investment ofState of Delaware Funds (the Policy) of the State's Cash Management Policy Board (theBoard). The Board, created by State law, establishes policies for, and the terms, conditions,and other matters relating to, the investment of all money belonging to the State exceptmoney in the Delaware Pension Employee Retirement System, the Other Post-EmploymentBenefits Trust (the OPEB Trust), and money held under the State deferred compensationprogram. By law, all deposits and investments belonging to the State are under the controlof the State Treasurer in various pooled investment funds (State Investment Pool) except forthose that, by specific authority, are under the control of other agencies or component units,as determined by the Board. The Board, created by State law, establishes policies for, andthe terms, conditions, and other matters relating to, the investment of all money belonging tothe Department. Investments of the Department are further restricted to “QualifiedInvestments” as defined in the Trust Agreement.
All deposits and investments of the Department are categorized as “Authority Accounts.”
22

State of DelawareDepartment of Transportation
Notes to Financial StatementsJune 30, 2015
As defined by the Policy, the investment objectives of Authority Accounts includemaximizing yield and maintaining the safety of principal. At June 30, 2015, investments ofthe Department are primarily in U.S. government securities, U.S. government agencysecurities, and commercial paper rated in the highest rating category by either Moody’s orStandard & Poor’s. All of these meet the objectives defined by the Policy and are QualifiedInvestments in accordance with the Trust Agreement.
The Policy is available on the Office of the State Treasurer's website athttp://treasury.delaware.gov.
(b) Custodial Credit Risk
Deposits
Per the Policy, all State deposits are required by law to be collateralized by directobligations of, or obligations that are guaranteed by, the United States of America orother suitable obligations as determined by the Board, unless the Board shall find suchcollateralization not in the best interest of the State. The Board has determined thatcertificates of deposit and time deposits must be collateralized unless the bank issuing thecertificate has assets of not less than $5 billion and is rated not lower than B by Fitch,Inc. Bank Watch.
The Board has also determined that State demand deposits need not be collateralized,provided that any bank that holds these funds has, for any quarter during the most recenteight quarters, a return on average assets of 0.5% or greater and an average capital ratio(total equity to total assets) of 5% or greater. If the bank does not meet either of thesecriteria, collateral must be pledged and shall consist of one or more of the followingsecurities:
U.S. government securities; U.S. government agency securities; Federal Home Loan Board letters of credit; State of Delaware securities; or Securities of a political subdivision of the State with a Moody's Investors Service
rating of A or better.
Additionally, the bank must ensure that those securities pledged as collateral (except forFederal Home Loan Board letters of credit) have a market value equal to or greater than102% of the total average monthly ledger balance(s) (net of Federal Deposit InsuranceCorporation limits) held in all accounts and ensure that the securities pledged as collateralare housed at the Federal Reserve Bank. Financial institutions must provide reports on amonthly basis to the State Treasurer's Office detailing the collateral pledged and providea Call Report on a quarterly basis to the State Treasurer's Office.
23

State of DelawareDepartment of Transportation
Notes to Financial StatementsJune 30, 2015
The Department’s cash and cash equivalents held at external financial institutions at June30, 2015 were $65,083,963, and the bank balances were $65,143,472. The differencesbetween bank balances and carrying amounts resulted from outstanding checks anddeposits-in-transit. Of the bank balances, $65,025,933 was covered by federal depositoryinsurance or by collateral held by the Department’s agent, in the Department’s name, atJune 30, 2015. The remaining bank balances of $117,539 were neither insured norcollateralized at June 30, 2015.
As of June 30, 2015, the Department also had $12,401,297 held in the State InvestmentPool by the State Treasurer’s Office. The State Treasurer’s Office controls these fundsand any investment decisions are made by the State Treasurer’s Office. The StateInvestment Pool includes deposit accounts and short- and long-term investments. Thedeposits held in the State Investment Pool are allocated to the Department, but thecustodial credit risk cannot be categorized for these deposits.
Investments
Investments of the Department are stated at fair value. At June 30, 2015, all of theDepartment’s investments were insured or registered, with securities held by theDepartment or the counterparty in the Department’s name.
(c) Interest Rate Risk
Interest rate risk is the risk that changes in interest rates of debt investments will adverselyaffect the value of an investment. The Policy provides that maximum maturity forinvestments in Department accounts, at the time of purchase, shall not exceed 10 years,except when it is prudent to match a specific investment instrument with a known specificfuture liability, in which case the maturity limitation shall match the maturity of thecorresponding liability.
The following table presents a listing of directly held investments and related maturities atJune 30, 2015:
Investment maturities (in years)Investment type Fair value Less than 1 1 - 5 6 - 10
U.S. government securities $ 44,163,109 $ 7,465,654 $ 15,762,877 $ 20,934,578U.S. government agency
securities 133,670,692 96,036,031 16,993,478 20,641,183Commercial paper 62,863,349 61,951,359 911,990 -
Total investments $240,697,150 $165,453,044 $ 33,668,345 $ 41,575,761
24

State of DelawareDepartment of Transportation
Notes to Financial StatementsJune 30, 2015
(d) Credit Risk
Credit risk is the risk that an issuer or other counterparty to an investment will not fulfill itsobligations. The Department follows the Policy and the Trust Agreement by investing onlyin authorized securities. The Department’s general investment policy for credit risk is toapply the prudent-person rule. Investments are made as a prudent person would be expectedto act, with discretion and intelligence, to seek reasonable income, preserve capital and, ingeneral, avoid speculative investments.
In addition, the Trust Agreement limits investments in commercial paper to those with aMoody’s rating of P-1 or a Standard & Poor’s rating of A-1 for short-term investments. TheDepartment had investments in commercial paper of $62,863,349 at June 30, 2015. Allcommercial paper held matures within five years and is rated in accordance with the TrustAgreement. The investments in U.S. government and government agency securities arerated at Aaa with Moody’s and AA+ with Standard & Poor’s.
(e) Investments in Excess of 5%
Concentration of credit risk is the risk of loss attributed to the magnitude of theDepartment’s investments in a single issuer (5% or more of total investments). Wheninvestments are concentrated in one issuer, this concentration represents heightened risk ofpotential loss. No specific percentage identifies when concentration risk is present. Theinvestments in obligations explicitly guaranteed by the U.S. government, mutual funds, andother pooled investments are exempt from disclosure.
The Policy provides that the purchase of securities cannot exceed the following percentageof account limitations, valued at market. Investments due to mature in one business day maybe excluded from the computation of said limitations.
A. U.S. government - no restrictions.
B. Government agency - 50% total; 20% in any one agency.
C. Certificates of deposit, time deposits, and bankers acceptances - 50% total; 5% inany one issuer.
1. Domestic - No additional restrictions.
2. Nondomestic - 25%.
3. Delaware domiciled - Not more than the lesser of $10 million or 25% of anissuer’s total equity capital may be invested in any one issuer. (Investmentsdue to mature in one business day may be excluded from the computation ofthis percentage.)
D. Corporate debt - 50% total; 25% in any one industry; 5% in any one issuer, 5% ofany issuer's total outstanding securities.
25

State of DelawareDepartment of Transportation
Notes to Financial StatementsJune 30, 2015
1. Domestic - No additional restrictions.
2. Nondomestic - 25%; 5% in any one issuer.
E. Repurchase agreements - 50% total.
F. Reverse repurchase agreements - 25% total.
G. Money market funds - 25% total; 10% in any one fund.
H. Canadian treasuries - 25% total; 10% in any one agency.
I. Canadian agency securities - 25% total; 10% in any one agency.
J. Mortgage-backed and asset-backed securities - 10% total (when combined withasset-backed securities and trust certificates, if applicable).
K. Municipal obligations - 5% in any one issuer.
L. Guaranteed investment contracts - Permitted where it is prudent to match a specificinvestment instrument with a known specific future liability, subject to credit qualityguidelines for commercial paper and corporate bonds and debentures and withadequate exit provisions in the event of the future downgrade of the issuer.
M. Asset-backed securities and trust certificates - 10% total (when combined withmortgage-backed and asset-backed securities, if applicable).
The following issuers have investments at fair value in excess of 5% of the investmentportfolio at June 30, 2015:
Federal National Mortgage Association $ 94,370,094 39%United States Treasury 44,163,109 18 Federal Home Loan Mortgage Corporation 29,108,830 12 Commonwealth Bank of Australia 14,499,285 6
(f) Investment Commitments
The Department has made no investment commitments as of June 30, 2015.
(g) Funding of Unpaid Loss Insurance Reserve Liability
Included in cash at Fiscal Years June 30, 2015 and 2014 was $- and $-, respectively, whichwill by utilized to fund the remaining loss insurance liability (Note 15) less the escrowinsurance deposits.
26

State of DelawareDepartment of Transportation
Notes to Financial StatementsJune 30, 2015
(4) Capital Assets
Capital asset activity for the Fiscal Year Ended June 30, 2015 was as follows:
Beginningbalance Increases Decreases Ending balance
Capital assets not being depreciated:Land $ 288,612,090 $ 10,336,038 $ - $ 298,948,128Infrastructure 3,723,674,937 36,460,177 - 3,760,135,114Service concession buildings and
improvements 22,100,000 - - 22,100,000Construction-in-progress 34,086,538 2,451,633 (19,368,694) 17,169,477
Total capital assets not beingdepreciated 4,068,473,565 49,247,848 (19,368,694) 4,098,352,719
Capital assets being depreciated:Buildings and improvements 118,630,402 18,905,663 (5,000) 137,531,065Furniture, vehicles, and equipment 296,476,030 27,806,694 (29,955,149) 294,327,575
Total capital assets being depreciated 415,106,432 46,712,357 (29,960,149) 431,858,640
Less accumulated depreciation for:Buildings and improvements 41,172,399 3,942,305 (5,000) 45,109,704Furniture, vehicles, and equipment 170,100,989 23,250,550 (29,541,693) 163,809,846
Total accumulated depreciation 211,273,388 27,192,855 (29,546,693) 208,919,550
Total capital assets being depreciated,net 203,833,044 19,519,502 (413,456) 222,939,090
Total capital assets, net $ 4,272,306,609 $ 68,767,350 $ (19,782,150) $ 4,321,291,809
Depreciation expense for Fiscal Year 2015 was $27,192,855.
(5) Changes in Long-Term Liabilities
Long-term liability activity for the Fiscal Year Ended June 30, 2015 was as follows:
Beginningbalance Additions Reductions Ending balance
Due within oneyear
Revenue bonds $ 939,055,000 $ - $ (77,655,000) $ 861,400,000 $ 72,580,000General obligation bonds 103,426 - (103,426) - -Bond issue premium, net of
accumulated amortization 65,739,194 - (20,260,657) 45,478,537 11,902,313Insurance loss reserve 12,011,000 5,180,731 (5,537,731) 11,654,000 2,485,340Post-employment benefits 194,503,873 31,551,284 (11,600,000) 214,455,157 -Pollution remediation
obligations 3,511,500 - (1,518,500) 1,993,000 685,000Net pension liability - 14,114,288 - 14,114,288 -Compensated absences 12,266,595 - (351,656) 11,914,939 2,090,328
Long-term liabilities $ 1,227,190,588 $ 50,846,303 $ (117,026,970) $ 1,161,009,921 $ 89,742,981
27

State of DelawareDepartment of Transportation
Notes to Financial StatementsJune 30, 2015
(6) Revenue Bonds Outstanding
Date ofissue/maturity
Amount oforiginal issue Description and fixed interest rates
Bondsoutstandingat June 30,
2015
Senior Bonds:2005/2025 150,000,000 Transportation System Senior Revenue
Bonds, 2005, 5.00% $ 7,870,0002006/2026 127,445,000 Transportation System Senior Revenue
Bonds, 2006, 3.50% - 5.00% 39,035,0002007/2021 87,890,000 Transportation System Senior Revenue
Bonds, 2007A, 4.00% - 5.00% 50,135,0002008/2028 84,720,000 Transportation System Senior Revenue
Bonds, 2008A, 4.00% - 5.00% 62,575,0002008/2029 117,875,000 Transportation System Senior Revenue
Bonds, 2008B, 5.00% 97,620,0002009/2029 105,315,000 Transportation System Senior Revenue
Bonds, 2009A, 5.00% 92,180,0002010/2019 47,715,000 Transportation System Senior Revenue
Bonds, 2010A, 5.00% 32,990,0002010/2030 72,120,000 Transportation System Senior Revenue
Bonds, 2010B, 3.95% - 5.80% 72,120,0002012/2024 222,870,000 Transportation System Senior Revenue
Bonds, 2012, 3.00% - 5.00% 211,540,0002014/2024 108,760,000 Transportation System Senior Revenue
Bonds, 2014, 2.25% - 5.00% 108,760,000GARVEE Bonds:
2010/2025 113,490,000 Transportation System Grant AnticipationBonds, 2010, 3.25% - 5.00% 86,575,000
Total bonds payable 861,400,000
Less: current portion 72,580,000
Long-term portion $788,820,000
The State has pledged turnpike, motor fuel tax, and motor vehicle fee revenues to the Trust Fund inorder to support repayments of revenue bonds. Proceeds from the revenue bonds were used tofinance the infrastructure maintenance, preservation, and construction-related projects of the State'shighway transportation system, as well as security for the repayment of the outstanding revenuebonds of the Authority.
28

State of DelawareDepartment of Transportation
Notes to Financial StatementsJune 30, 2015
The revenue bonds do not constitute a debt of the State or of any political subdivision thereof, or apledge of the general taxing power or the faith and credit of the State or of any such politicalsubdivision.
Annual principal and interest payments on the revenue bonds are expected to require less than 35%of pledged revenues. Principal and interest paid on the revenue bonds for the Fiscal Year EndedJune 30, 2015 was $119,121,644
The Transportation System Senior Revenue Bonds have fixed interest rates and are limitedobligations of the Authority secured only by the pledged revenues of the Trust Fund. The pledgedrevenues of the Authority were as follows at June 30, 2015:
Pledged operating revenues $ 411,005,078Investment income 1,844,953
Total pledged revenues $ 412,850,031
The Transportation System GARVEE Bonds have fixed interest rates and are limited obligations ofthe Authority secured by and payable solely from the annual federal appropriation for the State’sfederal aid transportation projects. On average, the State has been apportioned approximately $160million in federal highway aid annually over the past five fiscal years. At that level, principal andinterest payments on the GARVEE bonds are expected to require approximately 6.5% of pledgedfederal highway aid annually. While the Authority believes that sufficient pledged federal highwayaid will be available during the term of the bonds to meet all required principal and interestpayments, various factors beyond the Authority’s control may impact the ability to make allpayments when due, including, but not limited to, subsequent reauthorization of federal highwayaid and federal budgetary limitations.
At June 30, 2015, the Authority had a total of $262,369,957 in authorized but unissued revenuebonds, including $11,510,000 in GARVEE bond authorization, to fund a portion of the Departmentof Transportation Capital Improvement Program.
The annual requirement to amortize all revenue bonds payable as of June 30, 2015 was as follows:
Years endingJune 30, Principal maturity Interest maturity Total
2016 $ 72,580,000 $ 39,767,858 $ 112,347,8582017 70,595,000 36,317,308 106,912,3082018 69,880,000 32,895,008 102,775,0082019 73,945,000 29,336,333 103,281,3332020 74,185,000 25,684,475 99,869,475
2021 - 2025 338,290,000 77,410,200 415,700,2002026 - 2030 154,715,000 19,277,974 173,992,974
2031 7,210,000 209,090 7,419,090$ 861,400,000 $ 260,898,246 $ 1,122,298,246
29

State of DelawareDepartment of Transportation
Notes to Financial StatementsJune 30, 2015
(7) Debt Defeasance
The Authority has defeased various bond issues by creating separate irrevocable trust funds. Newdebt had been issued and the proceeds had been used to purchase U.S. government securities thatwere placed in the trust funds. The investments and fixed earnings from the investments aresufficient to fully service the defeased debt until the debt is called or matures.
For financial reporting purposes, the debt is considered defeased, and therefore, not reported as aliability. As of June 30, 2015, the amount of defeased debt outstanding amounted to $130,535,000.
(8) Restricted Net Position
Restricted net position was as follows at June 30, 2015:
Pension funds:Prepaid DTC pension contribution $ 253,443
Rebate funds:Amounts generated from operations to meet future arbitrage
rebate requirements 366,165Debt service funds:
Amounts generated from operations required by the TrustAgreement to be provided to meet current principal andinterest payments 87,935,654
Debt reserve funds:Amounts generated from operations required by the Trust
Agreement to be provided as a reserve for future principaland interest payments 64,411,921
Highway beautification funds:Amounts held in trust to be used for highway beautification 202,695
Total restricted net position $ 153,169,878
(9) International Registration Plan
The Department participates in the International Registration Plan (IRP) pursuant to Section 4008of the Intermodal Surface Transportation Efficiency Act of 1997 (ISTEA). ISTEA requiresjurisdictions to join base state agreements for the collection and distribution of commercial vehicleregistration fees. IRP is an agreement among member jurisdictions whereby commercialregistration fees are collected and reallocated based on a proration of miles traveled in eachjurisdiction. Net revenues recorded during Fiscal Year 2015 were $9,222,460. IRP fees areincluded in motor vehicle registration fee revenue.
30

State of DelawareDepartment of Transportation
Notes to Financial StatementsJune 30, 2015
(10) International Fuel Tax Agreement
The Department participates in the International Fuel Tax Agreement (IFTA). IFTA is anagreement among member jurisdictions whereby commercial license fees are collected andreallocated based on a proration of miles traveled in each jurisdiction. Net revenues recordedduring Fiscal Year 2015 were $2,694,453.
(11) DTC Union Contracts
Operators and maintenance personnel of the North District Fixed Route system are represented bythe Amalgamated Transit Union AFL-CIO, Local 842. The term of the current CollectiveBargaining Agreement covers the period September 1, 2013 through August 31, 2016.
Paratransit Specialists statewide and South District Fixed Route Operators are also represented bythe Amalgamated Transit Union AFL-CIO, Local 842, under a separate Collective BargainingAgreement. The term of the current Collective Bargaining Agreement covers the period September1, 2013 through August 31, 2016.
Certain administrative, operations, and maintenance personnel are represented by the Office andProfessional Employee International Union AFL-CIO, Local 32. The term of the currentCollective Bargaining Agreement covers the period January 1, 2013 through December 31, 2016.
(12) Pension Plan
A. State Employees' Pension Plan
With the exception of DTC employees (see Note 12B); the Department's full-time employeesare covered by the State Employees' Pension Plan, a cost-sharing, multiple-employer,defined benefit plan, which is administered by the Delaware Public Employees RetirementSystem (DPERS). The General Assembly is responsible for setting benefits andcontributions and amending plan provisions; administrative rules and regulations are adoptedand maintained by the Board of Pension Trustees (the Board).
Detailed information concerning the State Employees' Pension Plan is presented in itspublicly available annual basic financial statements, which can be obtained by writing theState Board of Pension Trustees and Office of Pensions, McArdle Building, Suite 1, 860Silver Lake Blvd., Dover, Delaware 19904-2402.
(1) Plan Description and Eligibility
The State Employees' Pension Plan covers virtually all full-time or regular part-timeemployees of the State, including employees of other affiliated entities. There are twotiers within this plan: 1) Employees hired prior to January 1, 2012 (Pre-2012) and 2)Employees hired on or after January 1, 2012 (Post-2011).
31

State of DelawareDepartment of Transportation
Notes to Financial StatementsJune 30, 2015
Service Benefits
Final average monthly compensation (employees hired Post-2011 may not includeovertime in pension compensation) multiplied by 2% and multiplied by the years ofcredited service prior to January 1, 1997, plus final average monthly compensation,multiplied by 1.85%, and multiplied by years of credited service after December 31,1996, subject to minimum limitations. For this plan, the average monthlycompensation is the monthly average of the highest three periods of 12 consecutivemonths of compensation.
Vesting
Pre-2012 date of hire members are fully vested after five years of credited service andPost-2011 date of hire members are fully vested after 10 years of credited service.
Retirement
Pre-2012 date of hire members are eligible to retire at age 62 with five years ofcredited service; age 60 with 15 years of credited service; or after 30 years of creditedservice at any age. Post-2011 date of hire members are eligible to retire at age 65 withat least 10 years of credited service; age 60 with 20 years of credited service; or with30 years of credited service at any age.
Disability Benefits
Pre-2012 date of hire members receive the same as service benefits and must have fiveyears of credited service. In lieu of disability pension benefits, over 90% of membersof this plan opted into the Disability Insurance Program offered by the State effectiveJanuary 1, 2006. Post-2011 date of hire members are provided disability benefitsthrough the State's Disability Insurance Program.
Survivor Benefits
If the deceased member is receiving a pension, the eligible survivor receives 50% ofthe pension (or 75% with a 3% reduction of benefit). If the deceased member is activewith at least five years of credited service, the eligible survivor receives 75% of thebenefit the employee would have received at age 62.
Burial Benefit
The burial benefit is $7,000 per member.
Contributions
The Board's employer-determined contributions, based principally on an actuarially
32

State of DelawareDepartment of Transportation
Notes to Financial StatementsJune 30, 2015
determined rate, were 9.5% for Fiscal Year 2014. The Department's contributions tothe plan were $6,702,782. Pre-2012 date of hire members are required to contribute3% of earnings in excess of $6,000, and Post-2011 date of hire members are requiredto contribute 5% of earnings in excess of $6,000.
(2) Allocation Percentage Methodology
In accordance with GASB 68, DPERS prepared a Schedule of Pension Amounts byParticipating Employer, which calculates the employer's proportionate share of theState Employees' Pension Plan's collective net pension liability, deferred outflows ofresources, deferred inflows of resources, and pension expense. DPERS managementhas elected to allocate the employer's proportionate shares of the collective pensionamounts based on the percentage of actual employer contributions. The Department'sproportionate share of the collective pension amounts was 3.8332% and 3.8097% atJune 30, 2014 and 2013, respectively.
(3) Net Pension Liability
For the Fiscal Year Ended June 30, 2015, the Department reported a net pensionliability in the amount of $14,114,288 for its proportionate share of the StateEmployees' Pension Plan's collective net pension liability. The net pension liabilityfor the June 30, 2014 measurement date was determined by an actuarial valuation asof June 30, 2013, and update procedures were used to roll forward the total pensionliability to June 30, 2014. The Department reported a decrease in beginning net assetsof $41.3 million to account for the net pension liability balance at July 1, 2014. Thecollective total pension liability for the June 30, 2013 measurement date wasdetermined by an actuarial valuation at June 30, 2013. The actuarial valuation andrelated update procedures used the following actuarial assumptions:
Investment rate of return/discount rate, including inflation 7.20%Projected salary increases, including inflation 3.50% to 11.50%Cost-of-living adjustments Ad-hocInflation 3.00%
These assumptions are based on an experience study conducted in 2011. It is likelythat future experience will not exactly conform to these assumptions. To the extentthat actual experience deviates from these assumptions, the emerging liabilities maybe higher or lower than anticipated. The more the experience deviates, the larger theimpact on future financial statements.
Mortality rates were based on the Sex Distinct RP - 2000 Combined Mortality Tableprojected to 2015 using scale AA for Males or Females, as appropriate, for mortalityimprovement.
33

State of DelawareDepartment of Transportation
Notes to Financial StatementsJune 30, 2015
Long-Term Expected Rate of Return - The long-term expected rate of return onpension plan investments was determined using a building-block method in whichbest estimate ranges of expected future real rates of return (expected returns, net ofinvestment expense and inflation) are developed for each major asset class. Theseranges are combined to produce the long-term expected rate of return by weighting theexpected future real rates of return by an asset allocation percentage, which is basedon the nature and mix of current plan investments, and adding expected inflation.Best estimates of geometric real rates of return for each major asset class included inthe DPERS's current and expected asset allocation is summarized in the followingtable.
Asset class
Long-termexpected realrate of return
Domestic equity 5.7%International equity 5.7 Fixed income 2.0 Alternative investments 7.0 Cash and cash equivalents 7.8
Discount Rate - The discount rate for all plans used to measure the total pensionliability was 7.2%. The projection of cash flows used to determine the discount rateassumed that contributions from plan members will be made at the currentcontribution rates and that contributions from employers will be made at ratesdetermined by the Board, as actuarially determined. Based on those assumptions, thepension plan's fiduciary net position was projected to be available to make all theprojected future benefit payments of current plan members. Therefore, the long-termexpected rate of return on pension plan investments was applied to all periods ofprojected benefit payments to determine the total pension liability.
Sensitivity of the Net Pension Liability to Changes in the Discount Rate - Thefollowing presents the Department's proportionate share of the State Employees'Pension Plan's net pension liability, calculated using the discount rate of 7.2%, as wellas what the Department's proportionate share of the net pension liability would be if itwere calculated using a discount rate that is one percentage point lower or higher thanthe current rate (expressed in thousands):
1% Decrease Discount rate 1% Increase
$ 52,896 $ 14,114 $ (18,664)
Expected and Actual Experience Differences - The difference between expected andactual experience with regard to economic and demographic factors is amortized overthe weighted average of the expected remaining service life of active and inactivemembers, which is six years. The first year of amortization is recognized as pension
34

State of DelawareDepartment of Transportation
Notes to Financial StatementsJune 30, 2015
expense, with the remaining years recognized as either a deferred outflow or deferredinflow of resources. The collective amount of the difference between expected andactual experience for the Fiscal Year Ended June 30, 2014 was $0.
Change in Assumptions - The change in assumptions about future economic ordemographic factors or other inputs is amortized over the weighted average of theexpected remaining service life of active and inactive plan members, which is sixyears. The first year of amortization is recognized as pension expense, with theremaining years recognized as either a deferred outflow or deferred inflow ofresources. The collective amount of change in assumptions for the Fiscal Year EndedJune 30, 2014 was $0.
Changes in Employer Proportionate Share - The change in employer proportionateshare is the amount of the difference between the employer proportionate share of thenet pension liability in the prior year compared to the current year. This change inproportion is amortized over the weighted average of the expected remaining servicelife of active and inactive plan members, which is six years. The first year ofamortization is recognized as pension expense, with the remaining years recognized asa deferred outflow of resources. The amount of difference of the Department'sproportionate share from Fiscal Year 2013 to Fiscal Year 2014 was $254,592, ofwhich $42,432 was recognized in current year pension expense and $212,160 wasrecognized as a deferred outflow of resources at June 30, 2015.
Differences between Projected and Actual Investment Earnings on Pension PlanInvestments - The difference between the actual earnings on plan investmentscompared to the plan's expected rate of return of 7.2% is amortized over a closedperiod of five years. The first year of amortization is recognized as pension expense,with the remaining four years recognized as a deferred inflow of resources. Thecollective amount of the difference between projected and actual earnings for theFiscal Year Ended June 30, 2014 was $28,037,681, of which $5,607,536 wasrecognized in current year pension expense and $22,430,145 was recognized as adeferred inflow of resources at June 30, 2015.
(4) Pension Expense, Deferred Outflows of Resources, and Deferred Inflows ofResources
For the Fiscal Year Ended June 30, 2015, the Department recognized $2.8 million inpension expense, which represents its proportionate share of the State Employees'Pension Plan's collective pension expense.
35

State of DelawareDepartment of Transportation
Notes to Financial StatementsJune 30, 2015
As of June 30, 2015, the Department reported deferred outflows of resources anddeferred inflows of resources related to pension from the following sources:
Deferredoutflows ofresources
Deferred inflowsof resources
Net difference between projected and actualearnings on plan investments $ - $ 22,430,145
Net difference to change in proportion 212,160 -
Contributions made subsequent to themeasurement date 6,508,133 -
Totals $ 6,720,293 $ 22,430,145
Contributions made subsequent to the measurement period of June 30, 2014 (FiscalYear 2015 contributions) will be recognized as a reduction to the net pension liabilityin Fiscal Year 2016. The remaining components of collective deferred outflows ofresources and deferred inflows of resources, other than the difference between theprojected and actual earnings on DPERS investments, are amortized into pensionexpense over a closed period, which reflects the weighted average remaining servicelife of all plan members, beginning in the year in which the deferred amount occurs.The amortization period is six years for the State Employees' Pension Plan fordeferred amounts arising in 2014. The annual difference between the projected andactual earnings on investments is amortized over a five-year closed period beginningthe year in which the difference occurs. The net amount of the Department'sproportionate share of the net collective deferred outflows (inflows) will berecognized in pension expense during the Fiscal Years Ended June 30,:
2016 $ (5,565,104)2017 (5,565,104)2018 (5,565,104)2019 (5,565,104)2020 42,431
B. DTC Pension Plans
(1) Plan Descriptions
DTC administers the Delaware Transit Corporation Pension Plan (DTC Plan) and theDART Contributory Pension Plan (DART Plan).
The DTC Plan is a single-employer, defined benefit, contributory plan coveringnoncollectively bargained employees of DTC, Delaware Authority for RegionalTransit (DART), and Delaware Administration for Special Transit.
36

State of DelawareDepartment of Transportation
Notes to Financial StatementsJune 30, 2015
The DART Plan is a single-employer, defined benefit, contributory plan coveringmembers of Local 32, Office and Professional Employees International Union AFL-CIO, and Local 842, Amalgamated Transit Union AFL-CIO and its collectivebargaining units: the North District Fixed Route and Maintenance Employees and theParatransit and Greater Dover Area Fixed Route Drivers, who are employed by DTC.
Each plan provides retirement, disability, and death benefits to plan members andbeneficiaries.
Both plans issue a publicly available financial report that includes financial statementsand required supplementary information. Those reports may be obtained by writingDTC at 900 Public Safety Boulevard, Dover, Delaware 19901-4503.
At June 30, 2014, the following employees were covered by the DTC Plan:
Active members 256Inactive members or beneficiaries currently
receiving benefits 52Terminated, vested members 53
Total 361
At December 31, 2014, the following employees were covered by the DART Plan:
Active members 648Inactive members or beneficiaries currently
receiving benefits 155Terminated, vested members 72
Total 875
(2) Benefits
The DTC Plan provides retirement, disability, and death benefits. All employees with10 years of credited service are eligible to retire at age 55. All employees may retireat any age after 25 years of credited service or upon reaching the age of 62. If anemployee terminates their employment after at least five years of credited service, butbefore normal retirement age, they may defer pension benefits until reachingretirement age. Employees who retire after reaching normal retirement age with atleast five years of credited service are entitled to receive pension benefits equal to70% of the participant's average earnings, offset by 100% of the primary insuranceamount, reduced by 1/25 for each year of service less than 25, at the later of theparticipant's normal retirement date or actual retirement, computed to the nearestdollar. Benefits fully vest after five years of credited service. The disabilityretirement benefit of a participant shall be the participant's normal retirement benefitdetermined by computing their average earnings for the period ending on the last day
37

State of DelawareDepartment of Transportation
Notes to Financial StatementsJune 30, 2015
that the employee worked prior to commencement of disability. Death benefits for aparticipant who dies while employed after completing five years of credited service isequal to 75% of the service pension to which the participant would have been eligibleat age 65; for a former participant who dies after completing five years of service,50% of the accrued benefit that would have been payable at age 65.
The DART Plan provides retirement, disability, and death benefits. All employeeswith 10 years of credited service are eligible to receive pension benefits at age 65. Allemployees may retire at any age after 25 years of credited service or upon reachingthe age of 65 with a minimum of five years of continuous service. If an employeeterminates their employment after at least five years of continuous service, but beforenormal retirement age, they may defer pension benefits until reaching retirement age.Monthly benefits are calculated as $65 multiplied by the applicable years of servicecredited to the eligible participant. DTC may offset its contribution by the employercontributions made on behalf of a participant who terminated and withdrew theircontributions. Upon the death of a retiree or active participant, a lump-sum paymentwill be made comprised of the aggregate of the participant's contributions that exceedthe aggregate of the payments that have been made to the participant.
(3) Funding Policy
For the DTC Plan, DTC retains the authority to establish, evaluate, and amend theobligations to contribute to the Plan. DTC's annual contribution determined by theactuary is funded monthly until the required contribution is met. Employees hiredafter June 30, 2012 are required to contribute 3% of eligible annual compensation inexcess of $6,000.
For the DART Plan, the DTC Pension Committee retains the authority to establish,evaluate, and amend the obligations to contribute to the Plan of both the Planmembers, as collectively bargained, and DTC. Plan members are required tocontribute 5% of their hourly wages for each hour worked to a maximum of 2,080hours per year. DTC contributes 5% of the regular hourly wages to the Plan.
The contributions recognized by the DTC Plan and the DART Plan during the FiscalYear Ended June 30, 2015 were $1,157,550 and $908,777, respectively.
(4) Net Pension Liability (Asset)
The DTC Plan's net pension liability (asset) for the Fiscal Year Ended June 30, 2015was determined by an actuarial valuation as of June 30, 2014. Update procedureswere used to roll forward the 2014 valuation results. There have been no changesbetween the measurement date of the net pension liability (asset) and the report datethat are expected to have a significant effect on the net pension liability (asset).
38

State of DelawareDepartment of Transportation
Notes to Financial StatementsJune 30, 2015
The total pension liability used to calculate the net pension liability (asset) wasdetermined using the following actuarial assumptions, applied to all periods includedin the measurement:
Investment rate of return 7.5%, net of plan investment expense, includinginflation
Salary increases 2.5%, including inflationInflation 2.0%Mortality RP-2000 Combined Healthy tables with
generational projection by Scale AA
The long-term expected rate of return on DTC Plan investments was determined usinga building-block method where return expectations are established for each assetclass. The building-block approach uses the current underlying fundamentals, nothistorical returns. These return expectations are weighted based on the followingasset/target amounts:
Asset class
Long-termexpected realrate of return
Domestic equity 5.2%International equity 5.2 Emerging equity 5.7 Core fixed income 3.0 Intermediate IG Corp 3.8 Bank loans 2.7 High yield 4.3 Emerging debt 4.8
The DART Plan's net pension asset/liability for the calendar year ended December 31,2014 was determined by an actuarial experience study as of January 1, 2015. Therehave been no changes between the measurement date of the net pension asset/liabilityand the report date that are expected to have a significant effect on the net pensionasset/liability. The total pension liability used to calculate the net pension liabilitywas determined using the following actuarial assumptions, applied to all periodsincluded in the measurement:
Investment rate of return 7.0%Salary increases 4.0%, including inflationInflation 2.0%Mortality RP-2000 Blue Collar table without any future
mortality improvements
39

State of DelawareDepartment of Transportation
Notes to Financial StatementsJune 30, 2015
The long-term expected rate of return on DART Plan investments was determinedusing a building-block method where return expectations are established for each assetclass. The building-block approach uses the current underlying fundamentals, nothistorical returns. These return expectations are weighted based on the followingasset/target amounts:
Asset class
Long-termexpected realrate of return
Domestic equity 5.2%International equity 5.2 Emerging equity 5.7 Core fixed income 3.0 Intermediate IG Corp 3.8 Bank loans 2.7 High yield 4.3 Emerging debt 4.8 Cash equivalents 0.8
(5) Discount Rate
The discount rate used to measure the total pension liability was 7.5% for the DTCPlan and 7.0% for the DART Plan. The projection of cash flows used to determinethe discount rate assumed that employee contributions will be made at the currentcontribution rate and that contributions from DTC will be made at rates determined bythe Pension Committee, actuarially calculated. Based on those assumptions, the Plan'sfiduciary net position was projected to be available to make all projected futurebenefit payments of current plan members. Therefore, the long-term expected rate ofreturn on Plan investments was applied to all periods of projected benefit payments todetermine the total pension liability.
40

State of DelawareDepartment of Transportation
Notes to Financial StatementsJune 30, 2015
(6) Changes in the Net Pension Liability (Asset)
Changes in DTC's net pension liability (asset) for the Fiscal Year Ended June 30, 2015 were as follows:
DTC Plan DART Plan Total
Totalpensionliability
(a)
Planfiduciary net
position(b)
Net pensionliability(asset)(a) - (b)
Totalpensionliability
(a)
Planfiduciary net
position(b)
Net pensionliability(asset)(a) - (b)
Totalpensionliability
(a)
Planfiduciary net
position(b)
Net pensionliability(asset)(a) - (b)
Balances at 7/1/13 (DTC Plan) and1/1/14 (DART Plan) $ 20,057,790 $ 17,937,922 $ 2,119,868 $ 37,483,272 $ 39,495,181 $ (2,011,909) $ 57,541,062 $ 57,433,103 $ 107,959
Changes for the year: Service cost 840,320 - 840,320 1,765,669 - 1,765,669 2,605,989 - 2,605,989 Interest 1,483,009 - 1,483,009 2,675,064 - 2,675,064 4,158,073 - 4,158,073 Changes of benefit terms - - - 1,029,691 - 1,029,691 1,029,691 - 1,029,691 Differences between expected and
actual experience - - - 4,126 - 4,126 4,126 - 4,126 Contributions - employer - 1,157,550 (1,157,550) - 908,777 (908,777) - 2,066,327 (2,066,327) Contributions - member - 30,251 (30,251) - 1,262,888 (1,262,888) - 1,293,139 (1,293,139) Net investment income - 2,443,142 (2,443,142) - 2,605,668 (2,605,668) - 5,048,810 (5,048,810) Benefit payments, including refunds
of member contributions (568,654) (568,654) - (2,103,050) (2,103,050) - (2,671,704) (2,671,704) - Administrative expenses - (115,578) 115,578 - (133,417) 133,417 - (248,995) 248,995
Net changes 1,754,675 2,946,711 (1,192,036) 3,371,500 2,540,866 830,634 5,126,175 5,487,577 (361,402)
Balances at 6/30/14 (DTC Plan)and 12/31/14 (DART Plan) $ 21,812,465 $ 20,884,633 $ 927,832 $ 40,854,772 $ 42,036,047 $ (1,181,275) $ 62,667,237 $ 62,920,680 $ (253,443)
41

State of DelawareDepartment of Transportation
Notes to Financial StatementsJune 30, 2015
(7) Sensitivity of Net Pension Liability (Asset) to Changes in the Discount Rate
The sensitivity of the net pension liability to changes in the DTC Plan's discount rateas of June 30, 2014, and the DART Plan's discount rate as of December 31, 2014 is asfollows:
1% DecreaseCurrent
Discount rate 1% Increase
DTC Plan (7.5%) $ 3,619,855 $ 927,832 $ (1,343,018)
DART Plan (7.0%) $ 3,236,223 $ (1,181,275) $ (4,978,492)
(8) Expected and Actual Experience Difference
The difference between expected and actual experience with regard to economic anddemographic factors is amortized over the weighted average of the expectedremaining service life of active and inactive members, which is six years. The firstyear of amortization is recognized as pension expense, with the remaining yearsrecognized as either a deferred outflow or deferred inflow of resources. Thecollective amount of the difference between expected and actual experience for theFiscal Year Ended June 30, 2014 and December 31, 2014 was $0.
(9) Change in Assumptions
The change in assumptions about future economic or demographic factors or otherinputs is amortized over the weighted average of the expected remaining service lifeof active and inactive plan members, which is six years. The first year of amortizationis recognized as pension expense, with the remaining years recognized as either adeferred outflow or deferred inflow of resources. The collective amount of change inassumptions for the Fiscal Year Ended June 30, 2014 and December 31, 2014 was $0.
(10) Difference between Projected and Actual Investment Earnings on Pension PlanInvestments
The difference between the actual earnings on plan investments compared to the DTCPlan's expected rate of return of 7.5% and DART Plan's expected rate of return of7.0% is amortized over a closed period of five years. The first year of amortization isrecognized as pension expense with the remaining four years recognized as a deferredinflow of resources. The collective amount of the difference between projected andactual earnings for the Fiscal Year Ended June 30, 2014 and December 31, 2014 was$706,367.
42

State of DelawareDepartment of Transportation
Notes to Financial StatementsJune 30, 2015
(11) Pension Expense, Deferred Outflows of Resources, and Deferred Inflows ofResources
The components of pension expense for the DTC Plan and DART Plan for Fiscal Year2015 were as follows:
DTC Plan DART Plan
Service cost $ 840,320 $ 1,765,669Interest 1,483,009 2,675,064Member contributions (30,251) (1,262,888)Benefit changes - 1,029,691Difference between actual and expected
experience - 4,126Administrative expenses 115,578 133,417Projected earnings on plan investments (1,364,227) (2,762,433)Amortization of investment return
differences (215,783) -
Pension expense $ 828,646 $ 1,582,646
For the Fiscal Year Ended June 30, 2015, DTC reported deferred outflows anddeferred inflows of resources related to pensions from the following sources:
Deferred outflowsof resources
Deferred inflows ofresources
Contributions made subsequent to themeasurement date $ 2,232,549 $ -
Pension plan investment return differences - 706,367
Totals $ 2,232,549 $ 706,367
Amounts reported as deferred outflows of resources will be recognized as a reductionto the net pension liability in Fiscal Year 2016. Amounts reported as deferred inflowsof resources will be recognized in pension expense as follows:
2016 $ 184,4302017 184,4302018 184,4302019 184,4302020 (31,353)
(13) Other Post-Employment Benefits (OPEB)
With the exception of DTC employees (see Note 13A), the Department's eligible employees arecovered under the OPEB Trust.
43

State of DelawareDepartment of Transportation
Notes to Financial StatementsJune 30, 2015
(a) Plan Description
On July 1, 2007, the OPEB Trust was established pursuant to Section 115 of the InternalRevenue Code and separate from the DPERS. The OPEB Trust is administered by theDPERS Board of Directors. Policy for and management of the OPEB benefits provided toretirees are the responsibility of the State. No stand-alone financial report is issued for theOPEB Trust.
The OPEB Trust is a single-employer, defined benefit plan. The OPEB Trust providesretirement medical coverage to pensioners and their eligible dependents in the StateEmployees’, Judiciary, Open State Police, and Closed State Police pension plans. The Stateof Delaware has elected to assume the OPEB liability on behalf of employees whoparticipate in the State's pension plan but are employed at outside agencies includingDelaware State University, University of Delaware, Delaware State Housing Authority,Delaware Charter Schools, and Delaware Solid Waste Authority.
Membership of the plan consisted of the following at June 30, 2015:
Retirees and beneficiaries receiving benefits 20,970Terminated plan members entitled to, but not yet receiving,
benefits 3,205Active eligible plan members 36,748
Total 60,923
The Department has approximately 1,700 active eligible plan members, which is the basis onwhich plan costs are allocated.
Substantially all State employees become eligible for post-retirement benefits if they reachretirement age while working for the State. The costs of providing these benefits are sharedbetween the State and the retired employee. The plan provisions are as follows:
Eligibility
State employees:
Early Retirement: Age 55 with 15 years of service or any age with 25 years of service.
Normal Retirement (hired before January 1, 2012): Age 62 with five years of service,age 60 with 15 years of service, or any age with 30 years of service.
Normal Retirement (hired on or after January 1, 2012): Age 65 with 10 years ofservice, age 60 with 20 years of service, or any age with 30 years of service.
44

State of DelawareDepartment of Transportation
Notes to Financial StatementsJune 30, 2015
Judges:
Normal Retirement (before July 1, 1980): Age 65 with 12 years of service, any agewith 24 years of service, or involuntarily retired after 22 years of service as a judge.
Normal Retirement (after June 30, 1980): Age 62 with 12 years of service, any agewith 24 years of service, or involuntarily retired after 22 years of service as a judge.
Closed State Police:
Normal Retirement: Age 55 or 20 years of service.
Open State Police:
Normal Retirement: Employed at age 55 with 10 years of service, any age with 20years of service, or 10 years of service when age plus service equals 75.
Benefits
During the Fiscal Year Ended June 30, 2015, the State provided health insurance optionsthrough several providers.
Spouse and Survivor Coverage
Both are available under any of the plan options with similar retiree contributions.
Employee Contributions
If hired prior to July 1, 1991, no contributions are required. If hired on or after July 1, 1991(except disability pension), contributions depend on years of service, as follows:
Years of servicePercent of premium
paid by State
Less than 10 %010 - 14 5015 - 19 75
20 or more 100
(b) Funding Policy
The State funds the OPEB Trust for current retirees on a pay-as-you-go basis along withfunding for future benefits at a rate that is approved in the annual budget, but not actuariallydetermined. Additional funding has also been provided on an ad-hoc basis. By State statuteChapter 52, Title 29 of the Delaware Code, contribution requirements of plan members andthe government are established and may be amended by the State Legislature. Funds arerecorded in the OPEB Trust for the payment of retiree healthcare claims and administrative
45

State of DelawareDepartment of Transportation
Notes to Financial StatementsJune 30, 2015
and investment expenses. Administrative costs are financed through investment earnings.State appropriations, other employer contributions, and retiree contributions for healthcareare recorded in the OPEB Trust. The funds available are invested under the management ofthe DPERS Board of Pension Trustees, which acts as the Board of Trustees for the OPEBTrust and is responsible for the financial management of the OPEB Trust.
(c) Contributions
The contribution rates for the employer and retiree are established annually by the budgetingprocess of the State. Those rates include an employer contribution based on projected pay-as-you-go financing requirements as a percentage of covered payroll, with an additionalamount to pre-fund benefits, which is not actuarially determined. For Fiscal Year 2015, theState contribution in relation to the annual required contribution (ARC) totaled $226.3million. The portion of the contribution allocated to the Department for Fiscal Year 2015was $11.4 million.
Retiree contribution rates are affected by the retiree date of hire, with eligible retirees hiredafter June 30, 1991 paying a proportionately higher rate if their years of service total lessthan 20. Retiree contributions for health coverage during Fiscal Year 2015 totaled $8.0million.
(d) Annual OPEB Cost and Net OPEB Obligation
The State’s annual OPEB cost is calculated based on the ARC, an amount actuariallydetermined in accordance with GAAP. The ARC represents a level of funding that, if paidon an ongoing basis, is projected to cover normal cost each year and amortize any unfundedactuarial liabilities over a period of 30 years. Amounts “required” but not actually set asideto pay for these benefits are accumulated as part of the net OPEB obligation.
The following table shows the components of the State’s annual OPEB cost, the amountactually contributed to the Plan, the State’s net OPEB obligation, and the amounts allocatedto the Department for the Fiscal Year Ended June 30, 2015:
(in Millions)
State totalDepartmentallocation
Net OPEB obligation as of June 30, 2014 $ 1,988.6 $ 103.6Annual required contribution 404.4 20.4Interest on net OPEB obligation 84.5 4.2Adjustment to annual required contribution (76.7) (3.9)
Annual OPEB cost 2,400.8 124.3
Employer contributions (226.3) (11.4)
Net OPEB obligation as of June 30, 2015 $ 2,174.5 $ 112.9
46

State of DelawareDepartment of Transportation
Notes to Financial StatementsJune 30, 2015
The Department's annual OPEB cost, the percentage of annual OPEB cost contributed to thePlan, and the net OPEB obligation are as follows (dollar amounts in millions):
Fiscal YearEnded
Annual OPEBcost
Percentage ofannual OPEB
cost contributedNet OPEBobligation
06/30/2015 $ 124.3 %9 $ 112.906/30/2014 113.9 9 103.606/30/2013 103.5 10 92.8
(e) Funded Status and Funding Progress
As of June 30, 2015, the plan was 4.9% funded. The actuarial accrued liability for benefitswas $6,321.2 million, and the actuarial value of assets was $312.4 million, resulting in anunfunded actuarial accrued liability (UAAL) of $6,008.8 million for the State. The coveredpayroll (annual payroll of active employees covered by the Plan) was $2,048.0 million, andthe ratio of the UAAL to the covered payroll was 293.4%. Specific amounts related to theDepartment cannot be determined.
Actuarial valuations of an ongoing plan involve estimates of the value of reported amountsand assumptions about the probability of occurrence of events far into the future. Examplesinclude assumptions about future employment, mortality, and the healthcare cost trend.Amounts determined regarding the funded status of the plan and the ARC are subject tocontinual revision as actual results are compared with past expectations and new estimatesare made about the future.
(f) Actuarial Methods and Assumptions
Projections of benefits for financial reporting purposes are based on the substantive plan (theplan as understood by the employer and the OPEB plan members) and include the types ofbenefits provided at the time of each valuation and the historical pattern of sharing of benefitcosts between the employer and plan members to that point. The actuarial methods andassumptions used include techniques that are designed to reduce the effects of short-termvolatility in actuarial accrued liabilities and the actuarial value of assets, consistent with thelong-term perspective of the calculations.
In the June 30, 2015 actuarial valuation, the entry age normal actuarial cost method wasused. Investments are valued at fair value. The actuarial assumptions included a 4.25%investment rate of return, which is a blended rate of the expected long-term investmentreturns on plan assets and on the State’s own investments calculated based on the fundedlevel of the plan at the valuation date, and an initial medical inflation rate of 4.25%. TheUAAL is being amortized as a level percentage of projected payroll on a level percent openbasis over 30 years using a 3.25% rate of salary increase.
47

State of DelawareDepartment of Transportation
Notes to Financial StatementsJune 30, 2015
A. DTC OPEB
(1) Plan Description
In June 2010, the Delaware Transit Corporation OPEB Fund Trust (the DTC OPEBTrust) was established pursuant to Section 115 of the Internal Revenue Code. TheDTC OPEB Trust is administered by DTC. Policy for and management of the OPEBbenefits provided to retirees are the responsibility of DTC. No stand-alone financialreport is issued for the DTC OPEB Trust.
The DTC OPEB Trust is a single-employer, defined benefit plan. The DTC OPEBTrust provides retirement medical insurance coverage to retired employees and theireligible dependents. DTC has elected to assume the DTC OPEB Trust liability onbehalf of all of its employees.
Membership of the plan consisted of the following at June 30, 2014:
Retirees and beneficiaries receiving benefits 148Terminated plan members entitled to, but not yet
receiving, benefits 31Active eligible plan members 817
Total 996
Substantially all DTC employees become eligible for post-retirement benefits if theyreach retirement age while working for DTC. The plan provisions are as follows:
Eligibility
Contract Employees:
Age 65 with five years of service or after attaining 25 years of service.
Normal Retirement:
Age 55 with 10 years of service or age 62 with five years of service.
Benefits
During the Fiscal Year Ended June 30, 2015, DTC provided health insurance optionsthrough several providers.
Spouse and Survivor Coverage
Surviving spouses of participants are allowed access to the plan and receive the samesubsidy as retirees.
48

State of DelawareDepartment of Transportation
Notes to Financial StatementsJune 30, 2015
Employee Contributions
No contributions are required by the employees.
(2) Funding Policy
DTC funds the DTC OPEB Trust on a pay-as-you-go basis with additional fundingprovided on an ad-hoc basis. Funds are recorded in the DTC OPEB Trust for thepayment of retiree healthcare claims and administrative and investment expenses.Administrative costs are financed through investment earnings. Employercontributions and retiree contributions for healthcare are recorded in the DTC OPEBTrust. The funds available are invested under DTC’s management, which acts as theTrustee and is responsible for the financial management of the DTC OPEB Trust. Thecash basis costs associated with these benefits were $1,399,775 for the Fiscal YearEnded June 30, 2015.
(3) Contributions
DTC subsidizes the medical premium. The subsidized percentage is 90% of publishedrates for retirees less than age 65 and 100% for retirees age 65 or greater. DTCsubsidizes 100% of the dental and vision coverage for noncontract employees.Contract employees are allowed access to dental and vision coverage, but must paythe full premium. Life insurance is provided to retirees. Retirees under age 70receive $6,000 in coverage. Once the participant reaches age 70, the coverage dropsto $5,000. DTC must pay $0.23 per month per $1,000 of coverage for each employee.
(4) Annual OPEB Cost and Net OPEB Obligation
DTC’s annual OPEB cost is calculated based on the ARC of the employer, an amountactuarially determined in accordance with GAAP. The ARC represents a level offunding that, if paid on an ongoing basis, is projected to cover the normal cost eachyear and amortize any unfunded actuarial liabilities over a period not to exceed 30years. Amounts “required” but not actually contributed to pay for these benefits areaccumulated as part of the net OPEB obligation. The following table shows thecomponents of DTC’s annual OPEB cost, the amount actually contributed to the plan,and DTC’s net OPEB obligation for the Fiscal Year Ended June 30, 2015:
Net OPEB obligation as of June 30, 2014 $ 90,958,540Annual required contribution 12,868,000Interest on net OPEB obligation 3,606,000Adjustment to annual required contribution (4,524,000)
Annual OPEB cost 102,908,540
Employer contributions (1,399,775)
Net OPEB obligation as of June 30, 2015 $ 101,508,765
49

State of DelawareDepartment of Transportation
Notes to Financial StatementsJune 30, 2015
DTC's annual OPEB cost, the percentage of annual OPEB cost contributed to the plan,and the net OPEB obligation are as follows:
Fiscal YearEnded
Annual OPEBcost
Percentage ofannual OPEB
cost contributedNet OPEBobligation
06/30/2015 $ 11,950,000 %11.71 $ 101,508,76506/30/2014 16,748,000 7.69 90,958,54006/30/2013 15,671,000 7.62 75,498,140
(5) Funded Status and Funding Progress
As of July 1, 2014, the most recent actuarial valuation date, the plan was 2.1% funded.The actuarial accrued liability was $104,434,000, and the actuarial value of assets was$2,188,606, resulting in a UAAL of $102,245,394. The covered payroll (annualpayroll of active employees covered by the plan) was $42,716,806, and the ratio of theUAAL to the covered payroll was 239.4%.
Actuarial valuations of an ongoing plan involve estimates of the value of reportedamounts and assumptions about the probability of occurrence of events far into thefuture. Examples include assumptions about future employment, mortality, and thehealthcare cost trend. Amounts determined regarding the funded status of the planand the ARC of the employer are subject to continual revision as actual results arecompared with past expectations and new estimates are made about the future. Theschedule of funding progress, presented as required supplementary informationfollowing the notes to financial statements, presents multi-year trend informationabout whether the actuarial value of plan assets is increasing or decreasing over timerelative to the actuarial accrued liability for benefits.
(6) Actuarial Methods and Assumptions
Projections of benefits for financial reporting purposes are based on the substantiveplan (the plan as understood by the employer and the OPEB plan members) andinclude the types of benefits provided at the time of each valuation and the historicalpattern of sharing of benefit costs between the employer and plan members to thatpoint. The actuarial methods and assumptions used include techniques that aredesigned to reduce the effects of short-term volatility in actuarial accrued liabilitiesand the actuarial value of assets, consistent with the long-term perspective of thecalculations.
In the July 1, 2014 actuarial valuation, the projected unit credit method was used withlinear proration to assumed benefit commencement. The actuarial assumptionsincluded a 4.0% investment rate of return, 3.0% payroll growth rate, a 2.4% inflationrate, and a healthcare cost trend rate based on the Society of Actuaries Long-Term
50

State of DelawareDepartment of Transportation
Notes to Financial StatementsJune 30, 2015
Trend Model adjusted for the projected impact of the cadillac tax for pre-age 65retirees. Sample trends are as follows:
2015 4.5%2020 5.3 2025 5.0 2050 4.8
The unfunded liability is being amortized as a level percentage of payroll over a 30-year closed amortization period.
(14) Commitments and Contingencies
(a) Construction Commitments
The Department had contractual commitments of $295,901,907 for construction of varioushighway projects at June 30, 2015. Current and future appropriations will fund thesecommitments as work is performed.
(b) Litigation
The Department is involved in various legal actions arising in the normal course of business.In the opinion of management, such matters will not have a material effect upon the financialposition of the Department.
(c) Pollution Remediation
GASB No. 49 provides guidance for state and local governments in estimating and reportingthe potential costs of pollution remediation. While GASB No. 49 does not require theDepartment to search for pollution, it does require the Department to reasonably estimateand report a remediation liability when any of the following obligating events has occurred:
a. Pollution poses an imminent danger to the public and the Department is compelledto take action;
b. The Department is in violation of a pollution-related permit or license;
c. The Department is named, or has evidence that it will be named, as a responsibleparty by a regulator;
d. The Department is named, or has evidence that it will be named, in a lawsuit toenforce a cleanup; or
e. The Department commences, or legally obligates itself to conduct, remediationactivities.
The Department becomes aware of pollution conditions in the fulfillment of its mission, andsite investigation, planning and design, cleanup, and site monitoring are typical remediation
51

State of DelawareDepartment of Transportation
Notes to Financial StatementsJune 30, 2015
activities of the Department. The Department has the knowledge and expertise to estimatethe remediation obligations presented herein based upon prior experience in identifying andfunding similar remediation activities. GASB No. 49 requires the Department to calculatepollution remediation liabilities using the expected cash flow technique. Where theDepartment cannot reasonably estimate a pollution remediation obligation, it does not reporta liability; however, the Department has not identified any of these situations.
The remediation obligation estimates presented in these financial statements are subject tochange over time. Cost may vary due to price fluctuations, changes in technology, changesin potential responsible parties, results of environmental studies, changes to statutes orregulations, and other factors that could result in revisions to these estimates. Prospectiverecoveries from responsible parties may reduce the Department’s obligation. Capital assetsmay be created when pollution remediation outlays are made under specific circumstances.
At June 30, 2015, the Department had outstanding pollution remediation liabilities of$1,993,000.
(15) Risk Management
The Department is exposed to various risks of loss related to workers’ compensation, healthcare,automobile, and casualty claims. Except as noted below, the Department is a participant in theState of Delaware’s Risk Management Program, which covers all claim settlements and judgmentsout of its General Fund. The Department pays premiums to the General Fund for this coverage.
(a) Workers' Compensation Insurance
DTC maintains coverage for workers’ compensation benefits. DTC manages the coveragethrough both the retention of risk and the purchase of commercial insurance. The paymentof workers’ compensation claims is processed through a third-party administrator.
For years prior to 2003, DTC established workers’ compensation loss contingency reservesbased upon insurance carriers’ actuarial reviews. Benefit claims in an amount of $100,000or less per person, per coverage year are paid by DTC from the workers’ compensation losscontingency reserve. Once any claim exceeds $100,000 or total claims for a given policyperiod exceed the maximum loss amount, the insurance policy covers the excess.
For Fiscal Year 2003, DTC changed its coverage to a first dollar program. Also, all claimswere subject to a $5,000 deductible for the medical portion of a claim. All other expensesrelated to a claim were covered by the insurance carrier.
Subsequent to Fiscal Year 2003, DTC changed its coverage and was insured through FiscalYear 2011 by the State. For Fiscal Years 2012 through 2014, DTC was insured throughLiberty Mutual. In Fiscal Year 2015, DTC returned to being covered by the State and thepremium was calculated as $9.00 per $100 on gross wages. DTC is not responsible for anycosts other than the premium paid, thus no loss contingency reserves were established.
52

State of DelawareDepartment of Transportation
Notes to Financial StatementsJune 30, 2015
(b) Auto Insurance
DTC maintains auto insurance coverage through both the retention of risk and the purchaseof commercial insurance. Auto loss reserves that are based upon actuarial reviews wereestablished by DTC.
For years prior to 2003, DTC established auto loss reserves based upon insurance carriers’actuarial reviews. Individual claims in an amount of $100,000 or less per incident, percoverage year were paid from the auto loss reserve funds. Once a specific claim exceeds$100,000 or total claims for a given policy period exceed the maximum loss amountestablished by the insurance carrier, the insurance policy covers the excess.
For 2003 and subsequent years, DTC changed its auto insurance coverage whereby theyestablished self-insured retention thresholds up to certain dollar amounts and purchasedcommercial insurance (wrap-around) policies for coverage amounts in excess of the self-insured retention thresholds. DTC established initial loss reserve insurance liabilities foreach of the years based upon actuarially determined valuations assuming DTC’s maximumliability exposure to be $1,000,000 per occurrence (this reflects the sovereign immunity cappursuant to Title 2 of the Delaware Code, Subsection 1329). DTC had several cases thatwere settled in excess of the sovereign immunity cap.
53

State of DelawareDepartment of Transportation
Notes to Financial StatementsJune 30, 2015
For individual claims in excess of the sovereign immunity cap, DTC established a maximumamount of loss based upon their self-insured retention program, as well as purchasingcommercial insurance coverage in the amounts identified in the table below:
Fiscal Year
Initial lossreserve
insuranceliability
established
Maximumamount ofloss under
self-insuredretention
program (peroccurrence)
Excesscommercial
coverage(aggregate)
2015 $ 5,078,000 $ 1,000,000 ***2014 4,510,000 1,000,000 ***2013 4,304,004 1,000,000 ***2012 3,828,996 1,000,000 ***2011 3,372,000 1,000,000 ***2010 3,467,000 1,000,000 ***2009 3,129,000 900,000 **2008 3,106,000 900,000 **2007 (01/15/07 - 06/30/07) * 900,000 **2007 (07/01/06 - 01/14/07) 2,607,350 2,300,000 $ 5,000,0002006 2,858,258 2,300,000 5,000,0002005 2,763,367 2,300,000 5,000,0002004 2,666,763 1,300,000 6,000,0002003 2,561,000 1,300,000 10,000,000
* Initial loss reserve established July 1, 2006 in the amount of $2,607,350 for the entire fiscalyear.
** For these loss years, DTC is self-insured for the first $900,000, and the next $100,000 iscommercial coverage. DTC has no additional coverage beyond this point.
*** For these years, DTC is self-insured with no commercial coverage.
54

State of DelawareDepartment of Transportation
Notes to Financial StatementsJune 30, 2015
The components of the remaining insurance loss reserve on DTC's statement of net positionwere as follows at June 30, 2015:
Auto loss reserve remaining for Fiscal Year 2015 $ 3,456,000Auto loss reserve remaining for Fiscal Year 2014 3,355,000Auto loss reserve remaining for Fiscal Year 2013 3,792,000Auto loss reserve remaining for Fiscal Year 2012 742,000Auto loss reserve remaining for Fiscal Year 2011 189,000Auto loss reserve remaining for Fiscal Year 2010 116,000Auto loss reserve remaining for Fiscal Year 2000 4,000
$ 11,654,000
Changes in the balance of total claim liabilities during Fiscal Year 2015 were as follows:
Beginningbalance -
July 1, 2014
Current yearestimated claimsand changes in
estimatesActual claim
paymentsEnding balance -
June 30, 2015
$ 12,011,000 $ 5,180,731 $ (5,537,731) $ 11,654,000
(16) Operating Leases
The Department has several noncancellable operating leases, primarily for operation andmaintenance facilities, which expire at various times through June 29, 2020. Those leases requirethe Department to pay for maintenance and liability insurance costs. Rental expenses were$257,649 for the Fiscal Year Ended June 30, 2015.
Future minimum lease payments under operating leases that have remaining terms in excess of oneyear as of June 30, 2015 are as follows:
2016 $ 188,7472017 47,9932018 1,8002019 1,8002020 1,800
$ 242,140
DTC had an operating lease agreement for transit vehicle tires, which expired on August 31, 2014.The lease agreement can be automatically renewed for two additional one year periods, whichextends the lease through August 31, 2016. The lease agreement requires DTC to make monthlypayments based on miles driven multiplied by a mileage rate as set forth in the agreement. Themileage rate is based on contract year and estimated annual vehicle miles. For the Fiscal YearEnded June 30, 2015, DTC incurred expenses related to this lease of $608,161.
55

State of DelawareDepartment of Transportation
Notes to Financial StatementsJune 30, 2015
(17) Transfers In From and Out to Other Funds
Per the terms of the Trust Agreement, the Trust Fund is responsible for reimbursing the State forthe Department's operating, maintenance, and capital expenses financed by the State's general bankaccount. However, the State's General Assembly and the State's Division of Revenue transferredthe following amounts as general operating support from the State's General Fund to theDepartment at June 30, 2015:
Amounts transferred to the Trust Fund:Division of Motor Vehicles $ 2,874,726Division of Revenue, Motor Vehicle Dealer/Lessor
License and Document Fees 514,012
$ 3,388,738
In addition, the Trust Fund is responsible for maintaining funds appropriated by the GeneralAssembly for DTC, and reimbursing DTC for its operating and capital expenses up to the totalamount of the appropriated funds. Total reimbursement for the Fiscal Year Ended June 30, 2015was $92,915,587.
(18) Service Concession Arrangement for Welcome Center and Service Plaza
At the end of Fiscal Year 2010, construction was completed on the Welcome Center and ServicePlaza (the Center) pursuant to an agreement with HMS Host Tollroads, Inc. (HMS), under whichHMS financed, designed, and built the Center and continues to maintain and operate the Center for35 years. The agreement with HMS was entered into in order to improve the comfort of motoriststraveling through Delaware and to avoid the issuance of debt. Under the agreement, HMS isresponsible for maintaining the Center to current conditions and insuring the Center over the courseof the 35 year operations period. The Trust Fund will be entitled to a percentage of all sales fromfuel and non-fuel items sold. At the end of the arrangement, operation of the Center will betransferred to the Trust Fund in its enhanced condition. The Department reports the Center as acapital asset with a carrying amount of $22,100,000 at June 30, 2015, and a related deferred inflowof resources of $18,942,857, which is being amortized over 35 years. Amortization expense for theFiscal Year Ended June 30, 2015 was $631,428.
(19) Subsequent Events
Events and transactions subsequent to year end have been evaluated for potential recognition in thefinancial statements or disclosure in the notes to financial statements. All events and transactionshave been evaluated through November 23, 2015, which is the date the financial statements wereavailable to be issued.
56
State of DelawareDepartment of Transportation
Notes to Financial StatementsJune 30, 2015
(20) Reclassifications
Certain reclassifications have been made to the prior year's financial statements in order to conformto the current year presentation. The reclassifications had no effect on previously reported changesin net position or net position.
57

REQUIRED SUPPLEMENTARY INFORMATION

State of DelawareDepartment of Transportation
Required Supplementary InformationJune 30, 2015
Required Supplementary Information - Governments That Use the Modified Approach forInfrastructure Assets
As allowed by GASB Statement No. 34, Basic Financial Statements - and Management's Discussion andAnalysis - for State and Local Governments, the State has adopted an alternative process for recordingdepreciation expense on selected infrastructure assets. Under this alternative method, referred to as themodified approach, the State expenses certain maintenance and preservation costs and does not reportdepreciation expense. Assets accounted for under the modified approach include 4,448 centerline milesand 1,626 bridges that the State is responsible for maintaining.
The condition of the State's road pavement is measured using the Overall Pavement Condition (OPC)system, which is based on the extent and severity of various pavement distresses that are visuallyobserved. The OPC system uses a measurement scale that is based on a condition index ranging from 0.0for poor pavement to 5.0 for pavement in good condition.
The condition of bridges is measured using the "Bridge Condition Rating" (BCR), which is based on theFederal Highway Administration (FHWA) Coding Guide, "Recording and Coding Guide for the StructureInventory and Appraisal of the Nation's Bridges." The BCR uses a measurement scale that is based on acondition index ranging from 0 to 9, 0 to 4 for substandard bridges, and 9 for bridges in good condition.For reporting purposes, substandard bridges are classified as those with a rating of 4 or less. The good orbetter condition bridges were taken as those with ratings of between 6 and 9. A rating of 5 is consideredfair. The information is taken from past "Bridge Inventory Status" reports.
It is the State's policy to maintain at least 85% of its highways at a fair or better condition level and 75%of its bridge systems at a good or better condition level. No more than 10% of bridges and 15% of roadsshould be in substandard condition. Condition assessments are determined every year for roads and everytwo years for bridges. Due to the timing of these condition assessments, information for the Fiscal YearEnded June 30, 2015 is not available.
59

State of DelawareDepartment of Transportation
Required Supplementary InformationJune 30, 2015
Structural rating numbers and percentages for bridges
Calendar year ended December 31,:2015 2014 2013
BCR conditionrating Number Percentage Number Percentage Number Percentage
Good 6 - 9 1,211 74.5 1,198 75.3 1,152 73.1Fair 5 304 18.7 307 19.3 331 21.0Poor 0 - 4 111 6.8 87 5.4 92 5.9
Totals 1,626 100.0 1,592 100.0 1,575 100.0
Deck rating numbers and percentages for bridges
Calendar year ended December 31,:2015 2014 2013
OPC conditionrating Square feet Percentage Square feet Percentage Square feet Percentage
Good 6 - 9 5,979,029 74.3 5,886,694 74.9 5,936,967 75.4Fair 5 1,696,198 21.1 1,650,327 21.0 1,549,714 19.7Poor 0 - 4 374,113 4.6 321,851 4.1 384,961 4.9
Totals 8,049,340 100.0 7,858,872 100.0 7,871,642 100.0
Center-line mile numbers and percentages for road pavement
Calendar year ended December 31,:2013 2011 2009
OPC conditionrating
Center-linemiles Percentage
Center-linemiles Percentage
Center-linemiles Percentage
Good 3.0 - 5.0 4,032 90.6 3,796 86.7 3,423 78.5Fair 2.5 - 3.0 356 8.0 400 9.1 575 13.2Poor Below 2.5 60 1.4 182 4.2 362 8.3
Totals 4,448 100.0 4,378 100.0 4,360 100.0
Comparison of estimated-to-actual maintenance/preservation (in thousands)*
Fiscal Year Ended June 30,:2015 2014 2013 2012 2011
Estimated $ 241,900 $ 198,873 $ 185,399 $ 243,600 $ 259,351Actual 291,630 234,800 233,810 285,923 248,973
* The estimated expenditures represent annual Bond Bill authorization. The actual expendituresrepresent the current year spending, which includes cumulative authorization.
60

State of DelawareDepartment of Transportation
Required Supplementary InformationJune 30, 2015
Required Supplementary Information - DelDOT/Trust Fund Pension
Schedule of Proportionate Share of Net Pension Liability
Proportionate Share of Net Pension Liability June 30, 2014
DelDOT/Trust Fund proportion of the net pension liability %3.8332
DelDOT/Trust Fund proportion of the net pension liability - dollar value $ 14,114,288
DelDOT/Trust Fund covered employee payroll $ 73,603,519
DelDOT/Trust Fund proportionate share of the net pension liability as apercentage of covered employee payroll %19.18
Contributions
Contractually required contribution $ 6,702,782
Contributions in relation to the contractually required contribution 6,702,782
Contribution deficiency $ -
DelDOT/Trust Fund covered employee payroll $ 73,603,519
Contribution as a percentage of covered employee payroll %9.11
In accordance with GASB No. 68, this schedule has been prepared prospectively as the above informationfor the preceding years in not readily available. This schedule will accumulate each year until sufficientinformation to present a ten-year trend is available.
61

State of DelawareDepartment of Transportation
Required Supplementary InformationJune 30, 2015
Required Supplementary Information - DTC Pensions
The following provides an analysis of the changes in DTC's net pension liability (asset) for each of itsplans:
Statement of Changes in Net Pension Liability (Asset) and Related Ratios(Dollar amounts in thousands)
DTC Plan6/30/2014
DART Plan12/31/2014
Total pension liabilityService cost $ 840 $ 1,766Interest 1,483 2,675Changes of benefit terms - 1,030Differences between expected and actual experience - 4Benefit payments, including refunds of member contributions (569) (2,103)
Net change in total pension liability 1,754 3,372
Total pension liability - beginning 20,058 37,483
Total pension liability - ending (a) $ 21,812 $ 40,855
Plan fiduciary net positionContributions - employer $ 1,158 $ 909Contributions - members 30 1,263Net investment income 2,443 2,605Benefit payments, including refunds of member contributions (569) (2,103)Administrative expense (116) (133)
Net change in plan fiduciary net position 2,946 2,541
Plan fiduciary net position - beginning 17,938 39,495
Plan fiduciary net position - ending (b) $ 20,884 $ 42,036
Net pension liability (asset) - ending (a) - (b) $ 928 $ (1,181)
Plan fiduciary net position as a percentage of total pension liability %95.75 %102.89
Covered-employee payroll $ 12,099 $ 27,627
Net pension liability (asset) as a percentage of covered-employee payroll %7.67 %(4.27)
Expected average remaining service years of all participants 8.5 8.3
Notes to Schedule
Benefit changes: NoneChanges of assumptions: None
62
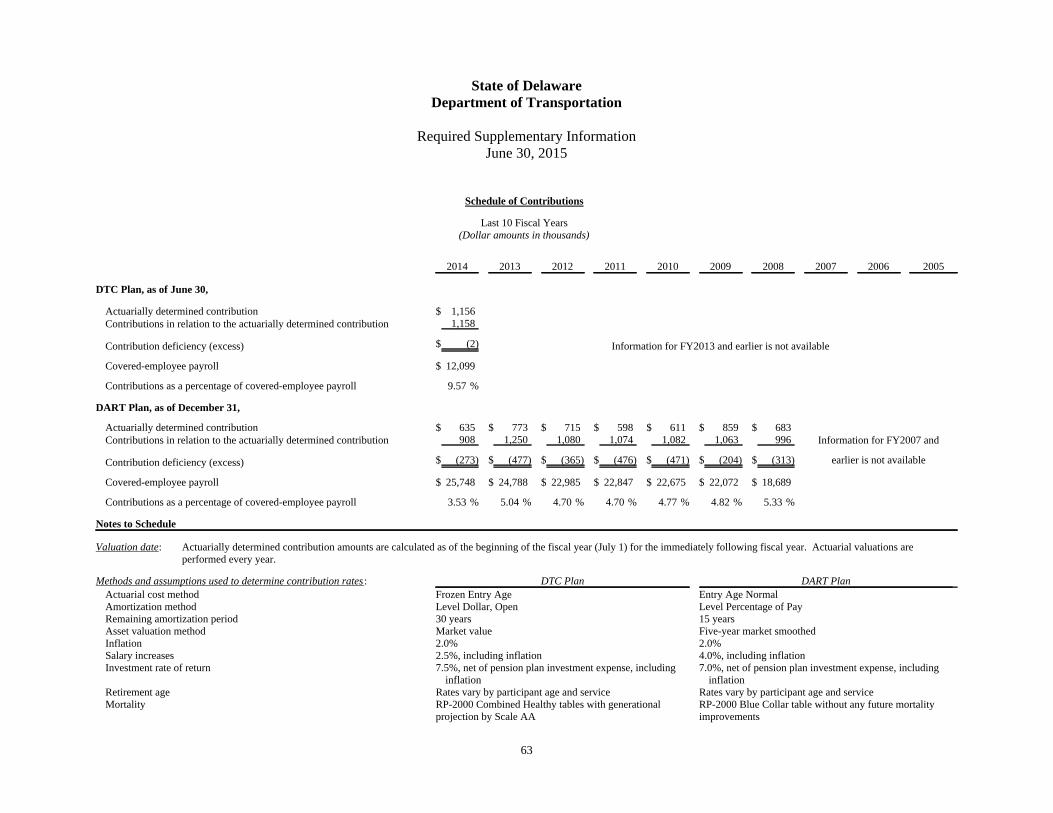
State of DelawareDepartment of Transportation
Required Supplementary InformationJune 30, 2015
Schedule of Contributions
Last 10 Fiscal Years(Dollar amounts in thousands)
2014 2013 2012 2011 2010 2009 2008 2007 2006 2005
DTC Plan, as of June 30,
Actuarially determined contribution $ 1,156Contributions in relation to the actuarially determined contribution 1,158
Contribution deficiency (excess) $ (2) Information for FY2013 and earlier is not available
Covered-employee payroll $ 12,099
Contributions as a percentage of covered-employee payroll %9.57
DART Plan, as of December 31,
Actuarially determined contribution $ 635 $ 773 $ 715 $ 598 $ 611 $ 859 $ 683Contributions in relation to the actuarially determined contribution 908 1,250 1,080 1,074 1,082 1,063 996 Information for FY2007 and
Contribution deficiency (excess) $ (273) $ (477) $ (365) $ (476) $ (471) $ (204) $ (313) earlier is not available
Covered-employee payroll $ 25,748 $ 24,788 $ 22,985 $ 22,847 $ 22,675 $ 22,072 $ 18,689
Contributions as a percentage of covered-employee payroll %3.53 %5.04 %4.70 %4.70 %4.77 %4.82 %5.33
Notes to Schedule
Valuation date: Actuarially determined contribution amounts are calculated as of the beginning of the fiscal year (July 1) for the immediately following fiscal year. Actuarial valuations areperformed every year.
Methods and assumptions used to determine contribution rates : DTC Plan DART PlanActuarial cost method Frozen Entry Age Entry Age NormalAmortization method Level Dollar, Open Level Percentage of PayRemaining amortization period 30 years 15 yearsAsset valuation method Market value Five-year market smoothedInflation 2.0% 2.0%Salary increases 2.5%, including inflation 4.0%, including inflationInvestment rate of return 7.5%, net of pension plan investment expense, including
inflation7.0%, net of pension plan investment expense, including
inflationRetirement age Rates vary by participant age and service Rates vary by participant age and serviceMortality RP-2000 Combined Healthy tables with generational
projection by Scale AARP-2000 Blue Collar table without any future mortalityimprovements
63

State of DelawareDepartment of Transportation
Required Supplementary InformationJune 30, 2015
Required Supplementary Information - DTC OPEB Trust
The following table presents additional information related to funding status and funding progress. It isintended to help readers assess the individual plan's funding status on a going-concern basis and assessprogress made in accumulating sufficient assets to pay benefits when due:
Schedule of Funding Status and Progress
ActuarialValuation Date
ActuarialValue ofAssets (a)
ActuarialAccruedLiability
(AAL) (b)
Excess(Deficit) ofAssets OverAAL (a-b)
Funded Ratio(a/b)
Coveredpayroll (c)
Excess(Deficit) as a
% of CoveredPayroll((a-b)/c)
07/01/2014 $ 2,189,000 $ 104,434,000 $ (102,245,000) %2.10 $ 42,716,806 %(239.36)07/01/2013 1,878,000 135,237,000 (133,359,000) 1.39 38,546,221 (345.97)07/01/2012 1,755,283 121,627,000 (119,871,717) 1.44 34,537,878 (347.07)
64

SUPPLEMENTARY INFORMATION

Delaware Transportation AuthorityTransportation Trust Fund
Statement of Net Position in Accordance with Trust AgreementJune 30, 2015
(with comparative totals for June 30, 2014)
(Memorandum Only)Operations Trust Holdings Debt Reserve 2015 2014
Current assetsCash and cash equivalents
Unrestricted $ 26,384,024 $ 63,568 $ - $ 26,447,592 $ 16,648,716Restricted - 3,643,014 12,723 3,655,737 26,646,290
Investments - at fair valueUnrestricted 45,293,433 10,120,185 - 55,413,618 79,197,865Restricted - 107,388,612 2,650,814 110,039,426 70,313,336
Accounts receivableTrade 8,891,270 - - 8,891,270 8,411,336Federal grants 276,291 - - 276,291 6,899,661Interest 398,661 - - 398,661 454,745
Total current assets 81,243,679 121,215,379 2,663,537 205,122,595 208,571,949
Noncurrent assetsCapital assets, not depreciable
Land - 152,306,437 - 152,306,437 146,001,454Infrastructure - 1,216,991,300 - 1,216,991,300 1,211,164,715Service concession buildings and improvements - 22,100,000 - 22,100,000 22,100,000
Capital assets, depreciableBuildings and improvements - 8,072,030 - 8,072,030 8,072,030
Total capital assets - 1,399,469,767 - 1,399,469,767 1,387,338,199Less: accumulated depreciation - 4,217,142 - 4,217,142 4,028,642Capital assets, net - 1,395,252,625 - 1,395,252,625 1,383,309,557
Investments - at fair value, net of current portionUnrestricted 408,645 4,154,829 - 4,563,474 26,553,523Restricted 366,164 8,370,187 61,748,385 70,484,736 59,626,299
Total noncurrent assets 774,809 1,407,777,641 61,748,385 1,470,300,835 1,469,489,379
Total assets 82,018,488 1,528,993,020 64,411,922 1,675,423,430 1,678,061,328
Deferred outflows of resources - 20,448,278 - 20,448,278 22,823,445
(Continued)66

Delaware Transportation AuthorityTransportation Trust Fund
Statement of Net Position in Accordance with Trust Agreement (Continued)June 30, 2015
(with comparative totals for June 30, 2014)
(Memorandum Only)Operations Trust Holdings Debt Reserve 2015 2014
Current liabilitiesAccounts payable and other accrued expenses $ 15,608,211 $ - $ - $ 15,608,211 $ 12,343,703Escrow deposits - 2,259,980 - 2,259,980 2,754,858Customer toll deposits 14,487,762 - - 14,487,762 11,921,228Interest payable - 20,737,791 - 20,737,791 20,733,321Unearned revenue - - - - 56,675General obligation bonds payable - - - - 103,426Revenue bonds payable - 72,580,000 - 72,580,000 77,655,000Bond issue premium - net of accumulated amortization - 11,902,313 - 11,902,313 6,823,880
Total current liabilities 30,095,973 107,480,084 - 137,576,057 132,392,091
Noncurrent liabilitiesRevenue bonds payable - net of current portion - 788,820,000 - 788,820,000 861,400,000Bond issue premium - net of accumulated amortization and current
portion - 33,576,224 - 33,576,224 58,915,314Total noncurrent liabilities - 822,396,224 - 822,396,224 920,315,314
Total liabilities 30,095,973 929,876,308 - 959,972,281 1,052,707,405
Deferred inflows of resources - 18,942,857 - 18,942,857 19,574,286
Net positionNet investment in capital assets - 519,840,247 - 519,840,247 378,411,937Restricted 366,164 87,935,654 64,411,922 152,713,740 156,585,925Unrestricted 51,556,351 (7,153,768) - 44,402,583 93,605,220
Total net position $ 51,922,515 $ 600,622,133 $ 64,411,922 $ 716,956,570 $ 628,603,082
67

Delaware Transportation AuthorityTransportation Trust Fund
Statement of Revenues, Expenses, and Changes in Net Position in Accordance with Trust AgreementYear Ended June 30, 2015
(with comparative totals for the year ended June 30, 2014)
(Memorandum Only)Operations Trust Holdings Debt Reserve 2015 2014
Operating revenuesPledged revenue
Turnpike revenue $ 120,363,461 $ - $ - $ 120,363,461 $ 122,404,184Motor fuel tax revenue 116,968,447 - - 116,968,447 114,555,916Motor vehicle document fee revenue 94,037,087 - - 94,037,087 84,830,376Motor vehicle registration fee revenue 51,184,304 - - 51,184,304 49,243,279Other motor vehicle revenue 25,757,326 - - 25,757,326 26,259,772International Fuel Tax Agreement revenue 2,694,453 - - 2,694,453 2,372,142
Total pledged revenue 411,005,078 - - 411,005,078 399,665,669Toll revenue - Delaware SR-1 55,767,180 - - 55,767,180 47,561,542Miscellaneous 8,258,624 1,312,793 - 9,571,417 12,749,770
Total operating revenues 475,030,882 1,312,793 - 476,343,675 459,976,981
Operating expensesRoad maintenance, preservation, and repairs 1,387,149 44,477,125 - 45,864,274 49,372,042Professional fees 49,208,623 49,973,858 - 99,182,481 100,086,311Materials, supplies, and other 18,837,237 7,328,325 - 26,165,562 23,758,092Depreciation - 188,500 - 188,500 154,695
Total operating expenses 69,433,009 101,967,808 - 171,400,817 173,371,140
Operating income (loss) 405,597,873 (100,655,015) - 304,942,858 286,605,841
Nonoperating revenues (expenses)Income from investments - pledged 51,188 1,033,257 760,508 1,844,953 2,257,110Bad debt recovery - 923,348 - 923,348 887,732Federal grant revenue - 276,291 - 276,291 6,899,661Interest expense - (23,482,198) - (23,482,198) (38,529,291)Service concession arrangement - 631,428 - 631,428 2,525,714
Excess (deficiency) of nonoperating revenues overnonoperating expenses 51,188 (20,617,874) 760,508 (19,806,178) (25,959,074)
Income (loss) before transfers 405,649,061 (121,272,889) 760,508 285,136,680 260,646,767
(Continued)68

Delaware Transportation AuthorityTransportation Trust Fund
Statement of Revenues, Expenses, and Changes in Net Position in Accordance with Trust Agreement (Continued)Year Ended June 30, 2015
(with comparative totals for the year ended June 30, 2014)
(Memorandum Only)Operations Trust Holdings Debt Reserve 2015 2014
Net transfers per agreement $ (213,271,441) $ 209,276,573 $ 3,994,868 $ - $ -Transfers to other governmental agencies (5,484,944) - - (5,484,944) (3,743,385)Transfers to State General Fund - (5,000,000) - (5,000,000) (5,000,000)Transfers from State General Fund - 3,388,738 - 3,388,738 48,467,109Transfers to DTC (85,583,707) - - (85,583,707) (83,878,200)Transfers to DelDOT (104,103,279) - - (104,103,279) (112,792,414)
Change in fund net position (2,794,310) 86,392,422 4,755,376 88,353,488 103,699,877
Fund net position - beginning of year 54,716,825 514,229,711 59,656,546 628,603,082 524,903,205
Fund net position - end of year $ 51,922,515 $ 600,622,133 $ 64,411,922 $ 716,956,570 $ 628,603,082
69

Delaware Transportation AuthorityTransportation Trust Fund
Schedule of Revenue Bonds OutstandingJune 30, 2015
Principal 2005 Series 2006 Series 2007 A Series 2008 A Series 2008 B Series 2009 A Series 2009 B Series 2010 B Series 2012 Series 2014 SeriesTotal Senior Bond
Series
FY16 $ 7,870,000 $ 5,865,000 $ 105,000 $ 14,620,000 $ 4,550,000 $ 4,270,000 $ 4,170,000 $ - $ 9,945,000 $ 14,195,000 $ 65,590,000FY17 - 6,160,000 4,975,000 15,355,000 4,730,000 4,485,000 8,530,000 - 5,395,000 13,685,000 63,315,000FY18 - - 5,220,000 2,110,000 4,970,000 4,710,000 9,975,000 - 25,600,000 9,670,000 62,255,000FY19 - - 5,455,000 2,215,000 5,215,000 4,945,000 4,830,000 - 38,800,000 4,500,000 65,960,000FY20 - - 5,730,000 2,330,000 5,480,000 5,195,000 5,485,000 5,070,000 21,555,000 14,965,000 65,810,000FY21 - - 22,130,000 2,445,000 5,750,000 5,455,000 - 5,200,000 12,715,000 10,650,000 64,345,000FY22 - - 6,520,000 2,540,000 6,040,000 5,725,000 - 5,340,000 23,100,000 12,330,000 61,595,000FY23 - - - 2,645,000 6,340,000 6,010,000 - 5,495,000 30,280,000 8,060,000 58,830,000FY24 - - - 2,750,000 6,660,000 6,310,000 - 5,655,000 24,800,000 8,465,000 54,640,000FY25 - 8,695,000 - 2,865,000 7,000,000 6,625,000 - 5,830,000 19,350,000 195,000 50,560,000FY26 - 9,000,000 - 2,980,000 7,360,000 6,960,000 - 6,015,000 - 12,045,000 44,360,000FY27 - 9,315,000 - 3,105,000 7,745,000 7,305,000 - 6,215,000 - - 33,685,000FY28 - - - 3,240,000 8,150,000 7,670,000 - 6,450,000 - - 25,510,000FY29 - - - 3,375,000 8,580,000 8,055,000 - 6,695,000 - - 26,705,000FY30 - - - - 9,050,000 8,460,000 - 6,945,000 - - 24,455,000FY31 - - - - - - - 7,210,000 - - 7,210,000
$ 7,870,000 $ 39,035,000 $ 50,135,000 $ 62,575,000 $ 97,620,000 $ 92,180,000 $ 32,990,000 $ 72,120,000 $ 211,540,000 $ 108,760,000 $ 774,825,000
PrincipalGARVEE 2010
SeriesTotal GARVEE
Bond Series Totals
FY16 $ 6,990,000 $ 6,990,000 $ 72,580,000FY17 7,280,000 7,280,000 70,595,000FY18 7,625,000 7,625,000 69,880,000FY19 7,985,000 7,985,000 73,945,000FY20 8,375,000 8,375,000 74,185,000FY21 8,785,000 8,785,000 73,130,000FY22 9,210,000 9,210,000 70,805,000FY23 9,625,000 9,625,000 68,455,000FY24 10,145,000 10,145,000 64,785,000FY25 10,555,000 10,555,000 61,115,000FY26 - - 44,360,000FY27 - - 33,685,000FY28 - - 25,510,000FY29 - - 26,705,000FY30 - - 24,455,000FY31 - - 7,210,000
$ 86,575,000 $ 86,575,000 $ 861,400,000
70

Delaware Transportation AuthorityTransportation Trust Fund
Schedule of Revenue Bond CoverageJune 30, 2015
Oversight responsibility for the issuance of debt by the State and its authorities is centralized under theSecretary of Finance. The following table sets forth certain indebtedness of the Authority. Furtherinformation for the Authority may be found in the notes to financial statements, changes in long-termliabilities, and bonds outstanding.
(Dollar amounts in thousands)
Debt service requirements
Fiscal YearGross pledged
revenue Principal Interest Total Coverage*
2005 $ 300,820 $ 53,920 $ 39,370 $ 93,290 3.222006 337,350 58,445 40,573 99,018 3.412007 346,954 61,370 45,534 106,904 3.252008 381,590 67,640 46,210 113,850 3.352009 367,399 73,510 43,619 117,129 3.142010 363,948 74,380 50,885 125,265 2.912011 376,186 71,760 52,585 124,345 3.032012 378,960 76,320 56,411 132,731 2.862013 387,918 83,230 48,097 131,327 2.952014 401,923 75,205 47,162 122,367 3.282015 412,850 77,655 41,467 119,122 3.47
* The above calculation represents the total gross pledged revenue as it relates to the total debtservice requirement of all Senior and Junior Bonds. The calculation method used in the OfficialStatement per the Trust Agreement calculates only the Senior Bond debt service requirementand subtracts investment income revenue from gross pledged revenue.
71

William A. Santora, CPA
John A. D'Agostino, CPA, MST
Heath N. Kahrs, CPA
Robert S. Smith, CPA
Stacey A. Powell, CPA, CFE, CICA
Robert Freed, Principal
Linda A. Pappajohn, Principal
Christiana Executive Campus 220 Continental Drive Suite 112 Newark, DE 19713-4309
Phone: (302) 737-6200 (800) 347-0116 Fax: (302) 737-3362
E-Mail: [email protected] www.santoracpagroup.com
Independent Auditors' Report on Internal Control Over Financial Reporting and on Complianceand Other Matters Based on an Audit of Financial Statements Performed in Accordance With
Government Auditing Standards
State of Delaware Department of TransportationDover, Delaware
We have audited, in accordance with the auditing standards generally accepted in the United States ofAmerica and the standards applicable to financial audits contained in Government Auditing Standardsissued by the Comptroller General of the United States, the financial statements of the business-typeactivities and each major fund of the State of Delaware Department of Transportation (the Department),an enterprise fund of the State of Delaware as of and for the Fiscal Year Ended June 30, 2015, and therelated notes to financial statements, which collectively comprise the Department's basic financialstatements, and have issued our report thereon dated November 23, 2015.
Internal Control Over Financial Reporting
In planning and performing our audit of the financial statements, we considered the Department's internalcontrol over financial reporting (internal control) to determine the audit procedures that were appropriatein the circumstances for the purpose of expressing our opinions on the financial statements, but not for thepurpose of expressing an opinion on the effectiveness of the Department's internal control. Accordingly,we do not express an opinion on the effectiveness of the Department's internal control.
A deficiency in internal control exists when the design or operation of a control does not allowmanagement or employees, in the normal course of performing their assigned functions, to prevent, ordetect and correct, misstatement on a timely basis. A material weakness is a deficiency, or combinationof deficiencies, in internal control, such that there is a reasonable possibility that a material misstatementof the Department's financial statements will not be prevented, or detected and corrected on a timelybasis. A significant deficiency is a deficiency, or a combination of deficiencies, in internal control that isless severe than a material weakness, yet important enough to merit attention by those charged withgovernance.
Our consideration of internal control was for the limited purpose described in the first paragraph of thissection and was not designed to identify all deficiencies in internal control that might be materialweaknesses or significant deficiencies, and therefore, material weaknesses or significant deficiencies mayexist that were not identified. We consider the deficiencies described as findings 2015-1 and 2015-2 inthe accompanying Schedule of Findings to be material weaknesses.
72

State of Delaware Department of Transportation
Compliance and Other Matters
As part of obtaining reasonable assurance about whether the Department's financial statements are freefrom material misstatement, we performed tests of its compliance with certain provisions of laws,regulations, contracts, and grant agreements, noncompliance with which could have a direct and materialeffect on the determination of financial statement amounts.
However, providing an opinion on compliance with those provisions was not an objective of our audit,and accordingly, we do not express such an opinion. The results of our tests disclosed no instances ofnoncompliance or other matters that are required to be reported under Government Auditing Standards.
We noted certain matters that we reported to management of the Department in a separate letter datedNovember 23, 2015.
The Department's Responses to Findings
The Department's responses to the findings identified in our audit are described in the accompanyingSchedule of Findings. The Department's responses were not subjected to the auditing procedures appliedin the audit of the financial statements and, accordingly, we express no opinion on the responses.
Purpose of this Report
The purpose of this report is solely to describe the scope of our testing of internal control and complianceand the results of that testing, and not to provide an opinion on the effectiveness of the Department'sinternal control or on compliance. This report is an integral part of an audit performed in accordance withGovernment Auditing Standards in considering the Department's internal control and compliance.Accordingly, this communication is not suitable for any other purpose.
____________________________________
November 23, 2015Newark, Delaware
73

State of DelawareDepartment of Transportation
Schedule of FindingsJune 30, 2015
Finding 2015-1: Financial Reporting (Material Weakness)
Background
Throughout the year, the Department operates and records transactions on the cash and budget basis ofaccounting using First State Financials (FSF), the State’s accounting system. The cash basis ofaccounting differs significantly from the accrual basis of accounting, which is the Department's basis forreporting information included in the financial statements in accordance with accounting principlesgenerally accepted in the United States of America (GAAP).
Since FSF is not used throughout the year to capture transactions on the accrual basis of accounting, theyear-end compilation of the Department's financial statements is complex and heavily reliant on manualadjustments to properly record accruals and other non-routine transactions. State agencies on FSF arerequired to prepare GAAP packages to make various types of adjustments to correct the non-GAAP basisof accounting throughout the year. The Division of Accounting (DOA) provides training and instructionsto State personnel on the GAAP package preparation and sets timelines for GAAP package submission tothe DOA. In addition, there are some State agencies that use systems outside of FSF to gather and trackrequired information; this adds to the complexity of the year-end GAAP package reporting andreconciliation process.
Condition
The Department's management has overall responsibility for the preparation and fair presentation of theirfinancial statements. The DOA is responsible for compiling the Department's financial statements inaccordance with GAAP.
During our audit, we identified several significant adjustments as a result of inaccurate or incompleteinformation included in the Department's GAAP package:
$3,044,850 overstatement of the Division of Motor Vehicle's (DMV) direct access accountsreceivable. This accounts receivable balance was recorded on both TTF and DelDOT fund trialbalances. Subsequently, it was determined that the majority of this accounts receivable had in factbeen collected and was recorded in error.
$1,760,660 overstatement in Computer Software In Process.
$6,233,368 expensed in current period related to prior-period expenditures on the new DMVCenter.
In addition, we noted the following deficiencies in internal control over financial reporting:
GAAP requires use of the effective interest method in calculating the amortization of bondpremiums/discounts. The accumulated amortization and amortization expense reported in thecompiled financial statements were recorded using the straight-line method. The impact ofadjusting the bond premium amortization to be in accordance with GAAP was $13.4 million.
74

State of DelawareDepartment of Transportation
Schedule of FindingsJune 30, 2015
GASB Nos. 68 and 71 were implemented by the Department in Fiscal Year 2015. The compiledfinancial statements did not calculate the impact of GASB No. 68 correctly and did not consider theimpact of GASB No. 71. In addition, the compiled financial statements were missing certaindisclosures required for compliance with GASB Nos. 68 and 71. The impact of adjusting entries tocorrectly present the impact of GASB Nos. 68 and 71 was $6.5 million.
Reconciliations of revenue and expenses (proving out a rollforward of cash basis revenues andexpenses from FSF, adding in the impact of accrual entries, and showing an adjusted total thatagrees to financial statement line items) was not provided with the compiled financial statements.This type of reconciliation control is necessary to ensure that the financial statements are completeand accurate and reflect all activity of the Department for the fiscal year.
Several amounts reported in the statement of cash flows were adjusted to reconcile to supportingaudit documentation and workpapers.
Revenues owed to DelDOT under a Park & Ride agreement with DTC in the amount of $757,836were not properly accrued as a receivable on DelDOT's books and records as of June 30, 2015.
Transfers to Other Governmental Agencies and Transfers from General Fund line items bothoverstated by $5 million due to double counting of Municipal Street Aid transfer to General Fund.Transfers from General Fund understated by approximately $514,000 related to Dealer/Lessorlicense and document fees not being included. In addition, the compiled footnote included asupplemental appropriation from Bond Bill; based on review of the Bond Bill and discussion withmanagement, no supplemental appropriation was approved or received in Fiscal Year 2015.
Criteria
According to the National Council on Government Accounting Concept Statement No. 1, Objectives ofFinancial Reporting, “The overall goal of accounting and financial reporting for governmental units is toprovide: 1) financial information useful for making economic, political, and social decisions, anddemonstrating accountability and stewardship; and 2) information useful for evaluating managerial andorganizational performance.”
Internal Control – Integrated Framework, published by the Committee of Sponsoring Organizations ofthe Treadway Commission (COSO), defines financial reporting objectives as follows: “Financialreporting objectives address the preparation of reliable published financial statements, including interimand condensed financial statements and selected financial data derived from such statements…Reliablefinancial statements are a prerequisite to obtaining investor or creditor capital, and may be critical to theaward of certain contracts or to dealing with certain suppliers. Investors, creditors, customers, andsuppliers often rely on financial statements to assess management’s performance and to compare it withpeers and alternative investments. The term ‘reliability’ as used with financial reporting objectives
75

State of DelawareDepartment of Transportation
Schedule of FindingsJune 30, 2015
involves the preparation of financial statements that are fairly presented in conformity with generallyaccepted or other relevant and appropriate accounting principles and regulatory requirements for externalpurposes.”
The financial statements are the responsibility of management. A proper system of internal control overfinancial reporting is essential in order to prevent, detect, and correct misstatements and to ensure thatsuch information is useful in decision-making and evaluating managerial and departmental performance,as well as demonstrating accountability and stewardship. Controls must be properly designed, in place,and operating effectively to ensure that the Department's accounting and financial information is fairlystated in accordance with GAAP.
Cause
There is not an effective internal management review process to ensure that the financial statements areaccurate and complete and that presentation and disclosure is proper prior to submission for audit.Review at both the DOA and Department levels was not performed at a sufficient level of precision toidentify these significant misstatements.
All Department and DOA staff working on various aspects of the GAAP reporting process should havesufficient technical expertise to perform the work accurately and timely. Management relies heavily onthe audit process to identify financial statement errors and to implement new accounting standards.
The misstatement related to bond premium amortization was caused by the non-GAAP policy of using thestraight-line method instead of the effective interest method.
Effect
There were material misstatements to the compiled financial statements submitted for audit.
Recommendation
We recommend that management refine the process used to complete the draft Department financialstatements, notes to the financial statements, all significant GAAP adjustments, conversion to accrualadjustments, and prepare the necessary account reconciliations. The review process should includecompletion of a disclosure checklist to ensure that financial statements include all requirements of GAAP,as well as an evaluation of the reasonableness of individual financial statement line items and their relatedfootnote disclosures by an individual with sufficient accounting and financial reporting experience andknowledge of the processes at the Department to detect and correct material inconsistencies and errors.Focus should be placed on the valuation of accounts associated with the GAAP package process andfinancial statement presentation, including the completeness and accuracy of the financial statements.
76

State of DelawareDepartment of Transportation
Schedule of FindingsJune 30, 2015
View of Responsible Officials
Fiscal Year 2015 was the second year that the DOA compiled the Department’s financial statements, andwe are gradually realizing the goals intended in doing so: increased skill and understanding of ourfinancial statements and the processes required to produce them among members of our team, improvedcontrols, and the ability to produce financial statements more frequently and efficiently in order toimprove management information and decision making. The conditions cited are reminders of theimportance of communication, and we acknowledge an improvement opportunity going forward betweenthe Department and the DOA. We intend to schedule regular meetings with the DOA during the reportcompilation process to ensure the GAAP package and any adjusting entries are thoroughly understoodand agreed to. We will also be engaging the DOA on both the conditions and deficiencies you havecommunicated. Taking into account our practice of refunding certain bond issues and the desire to more accurately reflectthe value of bond premiums in the financial statements, we agree with your recommendation and adoptedthe effective interest method. We will continue calculating bond premium amortization using thismethodology going forward.
Finding 2015-2: Division of Motor Vehicle Revenues (Material Weakness)
Background
One of the sources of revenue for the Department is the DMV revenue, which is initiated when acustomer enters one of the DMV locations to register a vehicle or pay a fee. The customer completes theappropriate forms, and the cashier at the DMV location enters the customer information into the MotorVehicle and License System (MVALS), which calculates the appropriate fee the customer is to pay. On adaily basis for each location, a Daily Cash Report is created to reconcile the daily total for cash, creditcards, and checks for each cashier. Any discrepancies greater than $5 are investigated. The completedDaily Cash Reports are provided to the Accounting Specialist who reconciles the Daily Cash Reports tothe MVALS system report for each location. The Accounting Specialist ensures that any shortages/overages greater than $5 are reasonable and explained. A second Accounting Specialist then reconcilesthe MVALS totals to the related bank statement.
Condition
In testing a sample of 11 DMV daily revenue reconciliations, we verified that each daily reconciliationwas properly reviewed and approved; this includes an audit by the Accounting Specialist that comparesthe lane work to what was recorded in MVALS for accuracy. In addition, for each daily reconciliationtested, the daily revenue was properly included in the total deposit submitted for the day, and the dailydeposit properly flowed through to the month-end bank statement.
We did not identify control or substantive testing exceptions in the sample of 11 daily reconciliationstested. However, in reviewing the fiscal year DMV revenue reconciliation summary, we identified $3.3million in “MVALS Adjustments”. These amounts represent unreconciled variances between theMVALS system and bank statements. A breakout of the variances by month is detailed below:
77

State of DelawareDepartment of Transportation
Schedule of FindingsJune 30, 2015
MonthMVALS
Adjustments
July 2014 $ (177,970)August 2014 (182,898)September 2014 (197,402)October 2014 (487,140)November 2014 502,417December 2014 (408,585)January 2015 (243,953)February 2015 (404,365)March 2015 (138,596)April 2015 (383,280)May 2015 (209,627)June 2015 (1,041,503)
Total $ (3,372,902)
In addition, we noted the following regarding the MVALS system:
It is not possible to run consistent month-end reports, as MVALS system users are able to makechanges after the fact (the month period in the system is never officially closed out). As a result,running the same month-end report on different days could generate different report results.
There are no system controls to ensure that the correct transaction is processed in MVALS. Forexample, if the cashier incorrectly codes a transaction but enters the correct transaction amount, thecashier may process the transaction without correcting the coding (i.e., cashier processes one typeof service but codes it to another service with the same cost). As a result, it is possible for a cashierto manipulate the transaction that is being processed. Because of this system limitation,management review of system reports from MVALS may not catch errors in data entry/coding inthe system.
Criteria
Internal Control – Integrated Framework, published by COSO, defines control activities as “policies andprocedures that help ensure management directives are carried out.” Control activities occur throughoutan organization, at all levels and functions, and include a wide range of activities, such as authorizations,verifications, reconciliations, reviews of operating performance, security of assets, and segregation ofduties. To ensure control activities meet the objectives of management, supporting documentation for allsuch activities should be referred to or maintained with the financial documents. Management reviewcontrols are defined as activities of a person different than the preparer analyzing and performingoversight of activities performed and is an integral part of any internal control structure.
78

State of DelawareDepartment of Transportation
Schedule of FindingsJune 30, 2015
Cause
There are system limitations in the reporting functionality of MVALS. As a result, management cannotpinpoint the cause of the “MVALS Adjustments” noted above.
Effect
Without being able to effectively explain all reconciling items included in DMV revenue reconciliations,misstatements to the financial statements could go undetected.
Recommendation
We recommend that the Department consider updated software to use for recording DMV revenues orseek modifications to the current MVALS system that would address the reporting issues noted above.We further recommend that the Department ensure all reconciliations of cash and credit card transactionsare performed timely, including explanations for all variances and “MVALS Adjustments”, as required bythe Department’s internal policies and procedures.
View of Responsible Officials
The DMV Financial Services section performs a daily reconciliation of MVALS transactions to includecash, credit card, and checks for each lane (Delaware City, Wilmington, Georgetown, and Dover). Thisdaily reconciliation ensures all revenue received throughout each day is properly accounted for andsubsequently deposited in the bank. To address the reporting issues noted in this audit finding, the DMVis making it a priority to work closely with the Department’s technology group to explore enhancementsthat can be made to improve MVALS revenue reporting. Specifically, we will work to identify alladjustments and make this a part of our monthly reconciliation.
79