Embed Size (px)
Citation preview
8/8/2019 State of Bay Area Blacks Report Part I
http://slidepdf.com/reader/full/state-of-bay-area-blacks-report-part-i 1/58
State of Bay Area Blacks A Look at Black Population Trends in the Bay Area, Part I
Commissioned by:
!
Report Period:
1990-2008
8/8/2019 State of Bay Area Blacks Report Part I
http://slidepdf.com/reader/full/state-of-bay-area-blacks-report-part-i 2/58
!"#$%&'(&)'*+%*+,&
About BABIP and the State of Bay Area Blacks Report and Convening ............................................................. 1
EXECUTIVE SUMMARY .................................................................................................................................. 4
Regional Analysis of Black Population ................................................................................................................ 9
1. Regional Population Change by County ............................................................................................... 9
2. Black Population Change: Regionally and by County ...................................................................... 12
3. Black Population Age and Gender Profiles at County Level from 2000 to 2008 ............................ 16
4. County Level Ethnic Diversity............................................................................................................. 17
5. County Level Ethnic Composition....................................................................................................... 20
City Level Analysis of Black Populations .......................................................................................................... 22
6. Black Population Change at the City Level from 2000 to 2008 ....................................................... 22
7. City Level Ethnic Diversity .................................................................................................................. 28
Black and African-American Neighborhoods ..................................................................................................... 33
8. Neighborhood Level Black Populations .............................................................................................. 33
9. Demographics for Selected Black Communities ................................................................................ 44
10. Contextual Factors............................................................................................................................ 48
11. Next Phase of Research..................................................................................................................... 49
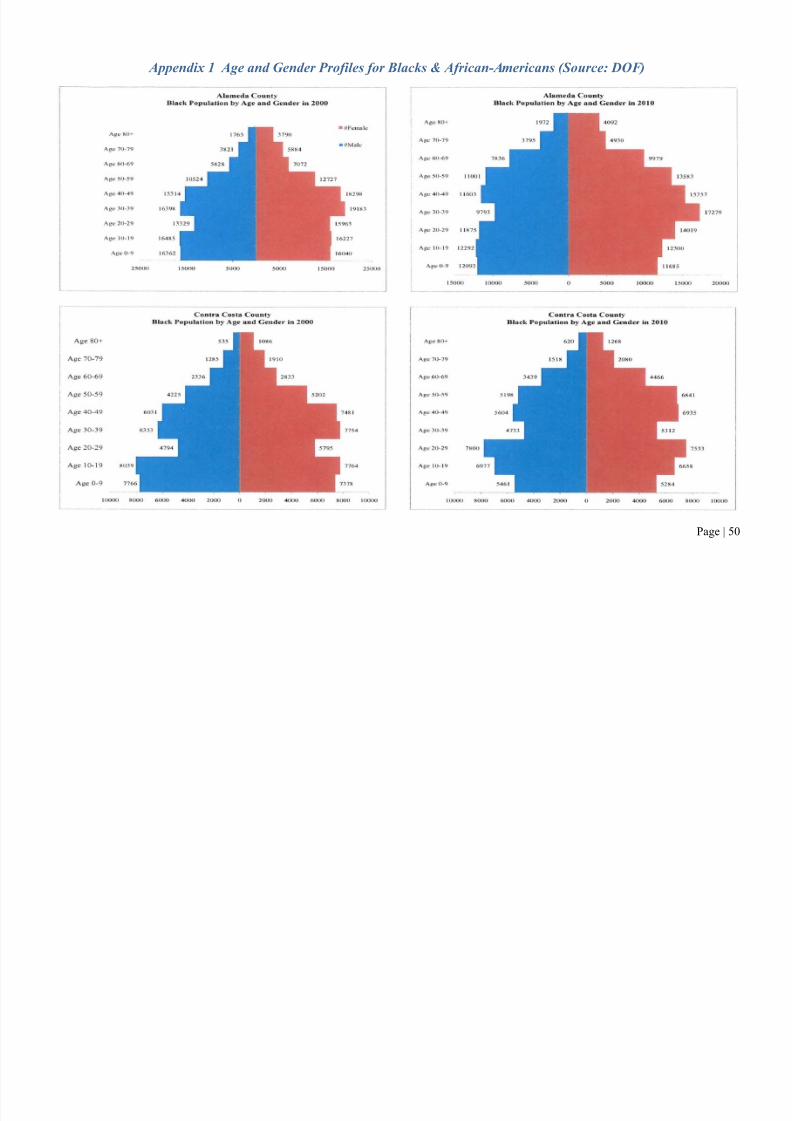
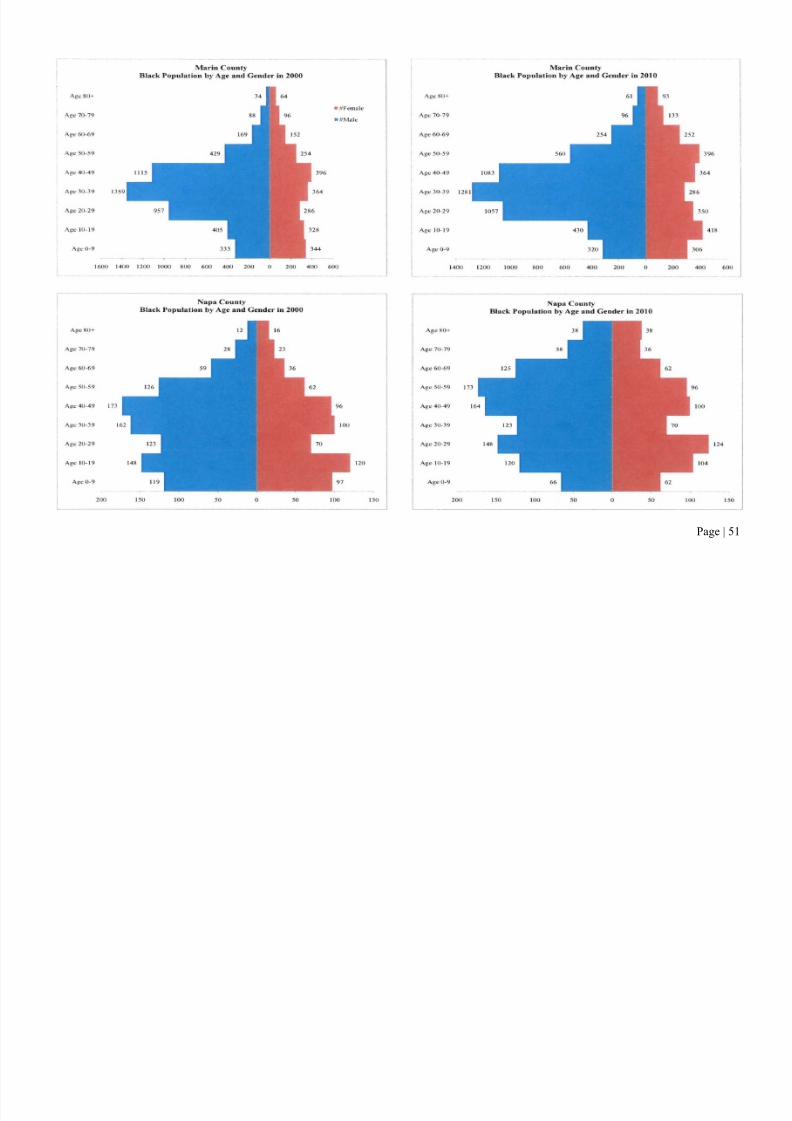
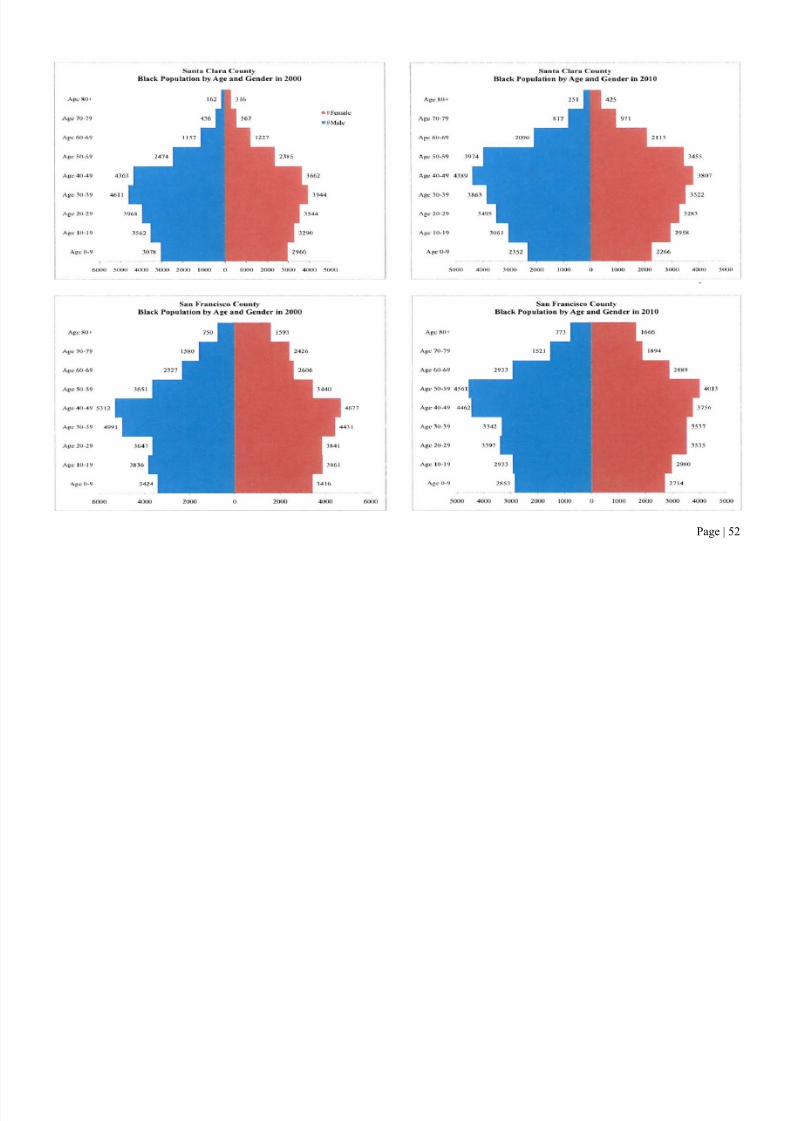
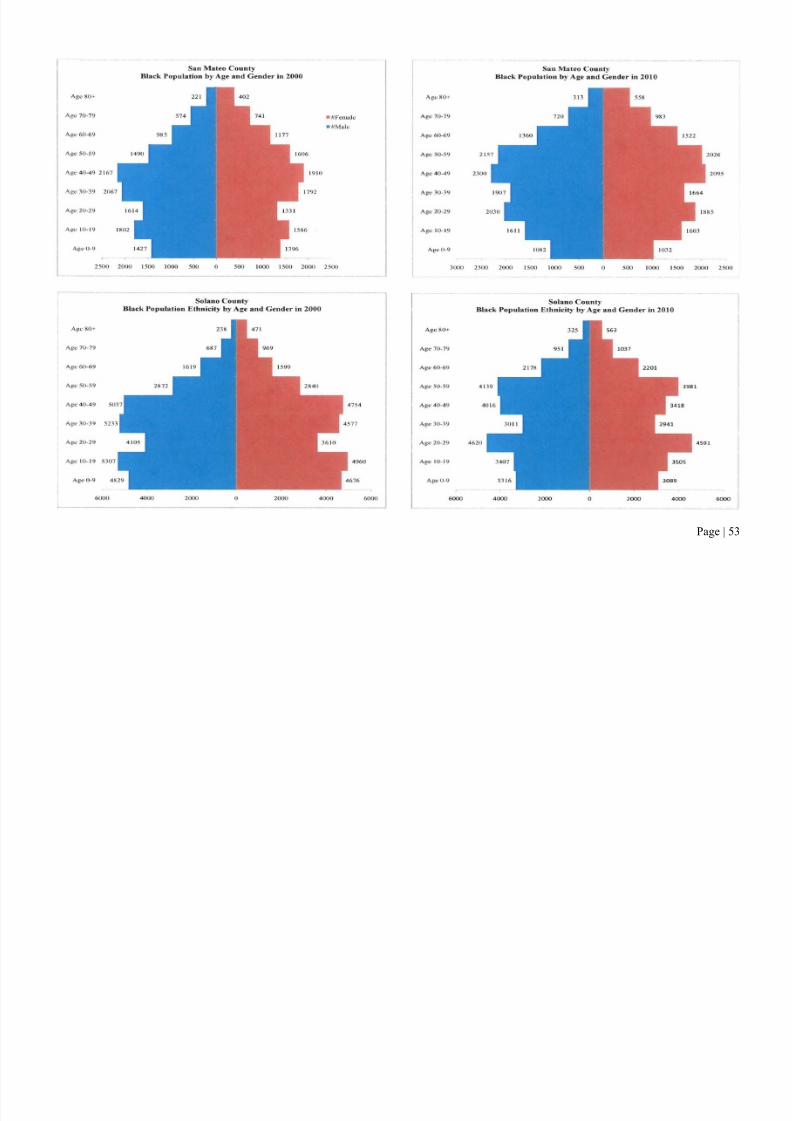
Appendix 1 Age and Gender Profiles for Blacks & African-Americans (Source: DOF)....................... 50!
&-*.%/&'(&!"#$%,&
Table 1 Regional Population Change by County 2000-2008 .............................................................. 10!Table 2 Regional Black Population Change by County 2000-2008 Ranked by % Change 13
8/8/2019 State of Bay Area Blacks Report Part I
http://slidepdf.com/reader/full/state-of-bay-area-blacks-report-part-i 3/58
Figure 8 Diversity Index in 2000 and 2008 ......................................................................................... 18!Figure 9 Map of County Diversity Index and Ethnic Composition in 2008 ........................................ 19!Figure 10 Alameda County Ethnicity Shifts 2000-2008...................................................................... 20!Figure 11 San Francisco County Ethnicity Shifts 2000-2008 ............................................................. 21!Figure 12 San Mateo County Ethnicity Shifts 2000-2008 ................................................................... 21!Figure 13 Map of Black Populations by City in 2000 ......................................................................... 24!Figure 14 Map of Black Populations by City in 2008 ......................................................................... 25!Figure 15 Map of Percent Black Population by City in 2008 ............................................................... 26!Figure 16 Map of Percentage Change in Black Population by City from 2000-2008 .......................... 27!Figure 17 Richmond Changes in Ethnic Composition ......................................................................... 29!Figure 18 Berkeley Changes in Ethnic Composition ............................................................................ 29!
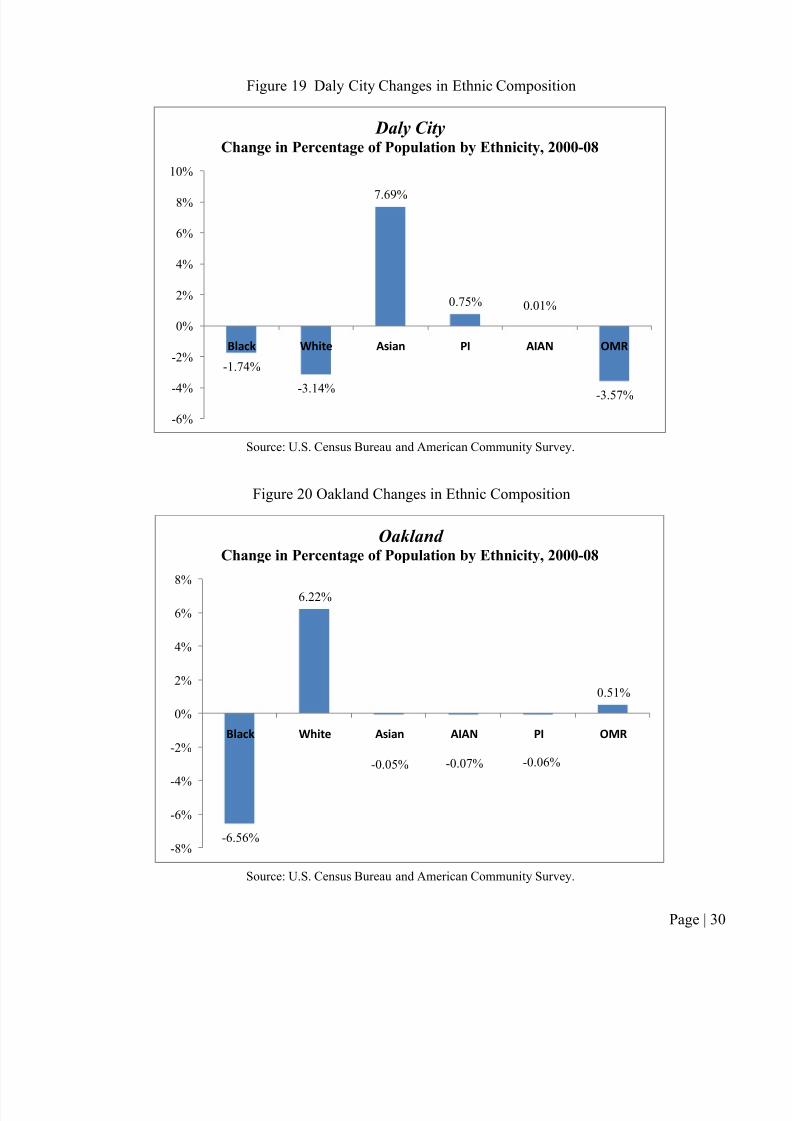
Figure 19 Daly City Changes in Ethnic Composition ......................................................................... 30!
Figure 20 Oakland Changes in Ethnic Composition............................................................................. 30!Figure 21 Vallejo Changes in Ethnic Composition .............................................................................. 31!Figure 22 Map of Change in Diversity Index by City from 2000-2008 .............................................. 32!Figure 23 Number of Black Persons Per Census Tract in 2000 ........................................................... 35!Figure 24 Number of Black Persons Per Census Tract in 1990 ........................................................... 36!Figure 25 Contra Costa County Black Population by Tract in 2000 ................................................... 37!Figure 26 San Francisco County Black Population by Tract in 2000.................................................. 38!
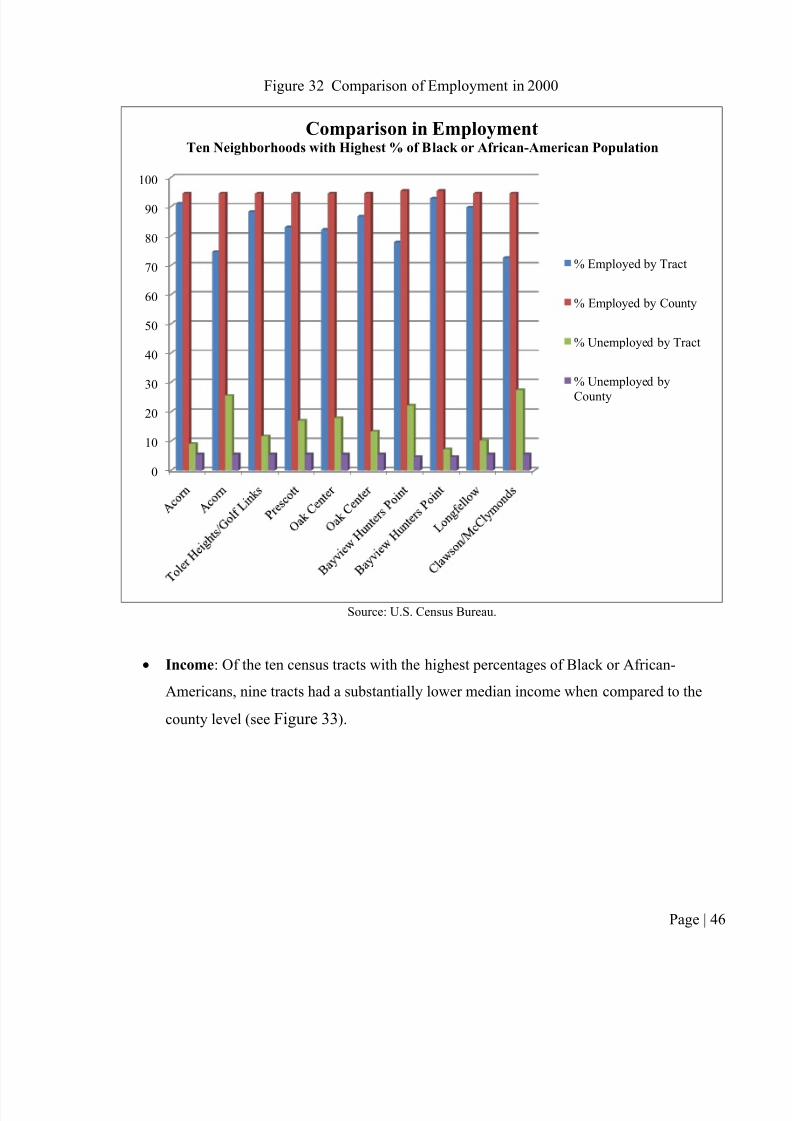
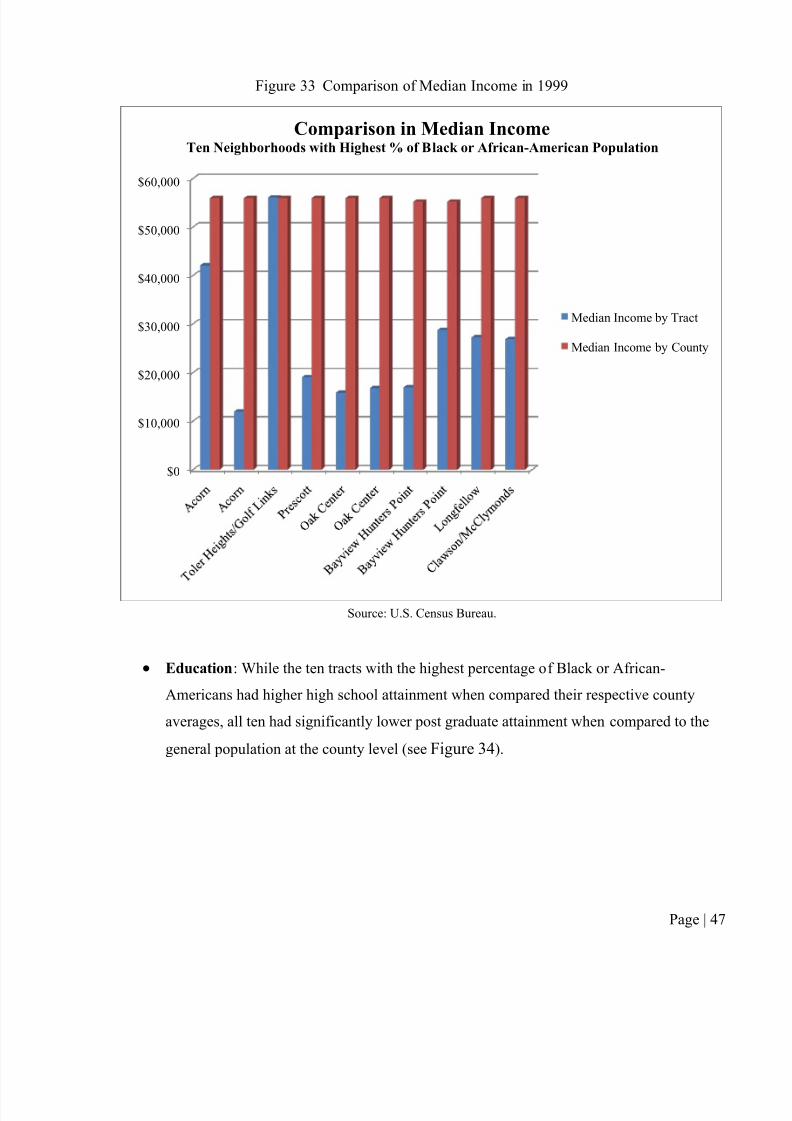
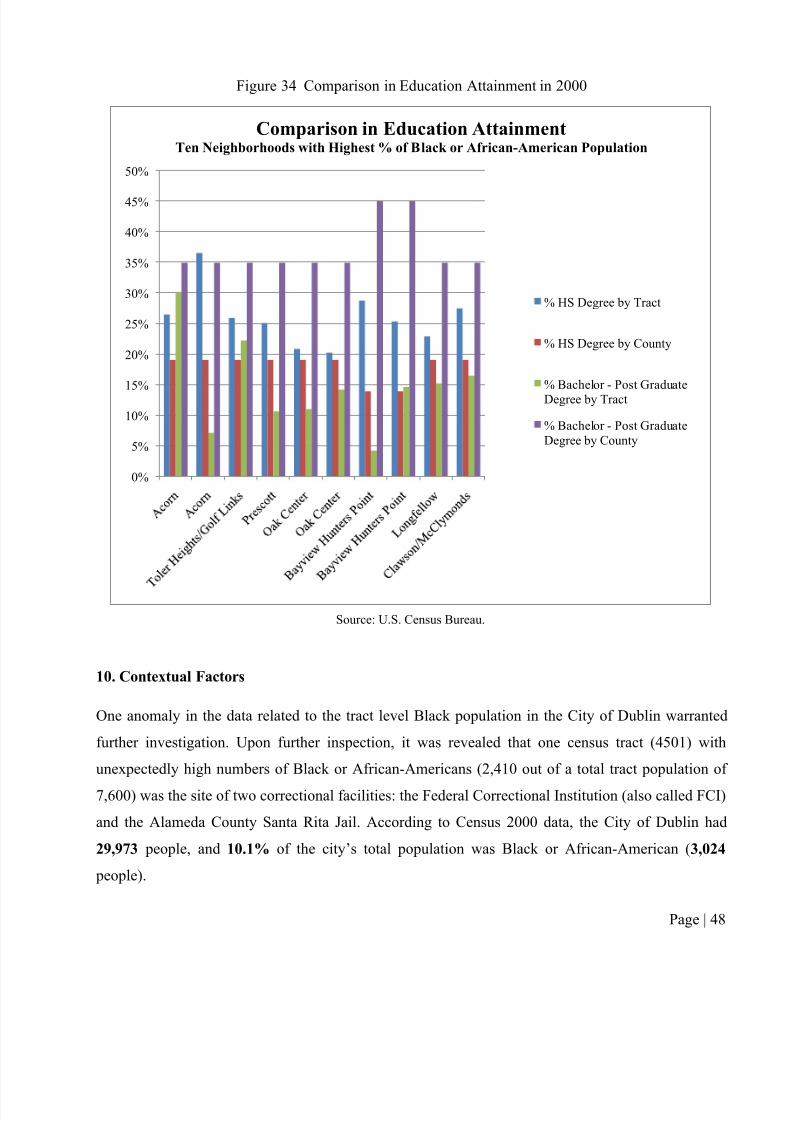
Figure 27 San Mateo County Black Population by Tract in 2000 ........................................................ 39!Figure 28 Solano County Black Population by Tract in 2000 .............................................................. 40!Figure 29 Alameda County Black Population by Tract in 2000 .......................................................... 41!Figure 30 Change in Alameda County Black Population by Tract from 2000-2006 .......................... 42!Figure 31 Comparison of Home Ownership vs. Rental Housing ........................................................ 45!Figure 32 Comparison of Employment in 2000 .................................................................................. 46!Figure 33 Comparison of Median Income in 1999 .............................................................................. 47!Figure 34 Comparison in Education Attainment in 2000 .................................................................... 48!
8/8/2019 State of Bay Area Blacks Report Part I
http://slidepdf.com/reader/full/state-of-bay-area-blacks-report-part-i 4/58
5#'3+& 656-7& "*.& +8%& 9+"+%& '(& 6":& 54%"& 6$";<,& =%>'4+& "*.&
)'*?%*1*2& With members representing more than 30 local foundations, Bay Area Blacks in Philanthropy
(BABIP) is a regional, nonprofit membership organization whose mission is to advance the interests
of African Americans in philanthropy and address the impact of racial disparity within philanthropic
institutions and African American communities. Bringing together foundation professionals-
trustees, program officers, administrative and technical staff – with corporate, governmental, and
association representatives, BABIP is engaged in the critical dialogues and debates that affect our
core constituents and leverages our role in helping to rebuild and strengthen Black neighborhoods
and the nonprofit infrastructure that serves them.
As part of its core interest, BABIP has begun to explore the impact of lingering economic volatility,
persistent disparities in health, education, and employment, and wide-spread development activity on
the Bay Area’s Black community.
The first decade of the 21st Century has been a tumultuous one with major political changes,
challenges for social change and economic upheavals both nationally and regionally. Amidst these
political, social and economic changes, there also have been substantial population changes in theBay Area including the continuing pattern of immigration into Bay Area cities and migration of Bay
Area residents out of the state and out of the region. One significant population change has been the
8/8/2019 State of Bay Area Blacks Report Part I
http://slidepdf.com/reader/full/state-of-bay-area-blacks-report-part-i 5/58
Education;
Health and environment;
Employment and income;
Crime and incarceration; and
Economic development.
While we agreed that conducting a research project to document the patterns was an important
foundation for engaging in discussions to identify strategies to improve outcomes for African-
Americans, we concluded that we were constrained by the timing of the release of new U.S. Census
data which is scheduled for release in the first half of 2011.
After some discussion, we decided to proceed with the research project in two phases. The first
phase, which is presented in this report, examines population trends and selected demographic data
for African-Americans in nine Bay Area counties between 2000 and 2008, using a combination of U.S. Census data for 2000 and California Department of Finance population estimates for 2008.
Using this preliminary analysis, In this analysis we drill down from the regional to the county to the
city to the census tracts level to examine where African-Americans have lived between 2000 and
2008. Based on this analysis, we were able to identify ten census tracts and their corresponding
neighborhoods with the highest density of African-American residents.
BABIP is convening a conference in late September 2010 to present the results of the initial research
and engage its members and other convening participants in discussions focused on identifying: 1)
8/8/2019 State of Bay Area Blacks Report Part I
http://slidepdf.com/reader/full/state-of-bay-area-blacks-report-part-i 6/58
This research is comprised of two distinct phases: the first consists of this initial analysis of the
changing demographics and characteristics of the African-American populations in the Bay Area. A
second phase, planned for early 2011, will include the latest statistics on populations from the 2010
Census and the updated American Community Survey’s five-year estimates, as well as a profile of
several key indicators including: health, safety, education, employment and income, environmental
conditions, and economic development.
The questions raised by BABIP that this report addresses include:
1. Where did African-Americans reside in the Bay Area in 2000 and what changes occurred
through 2008?
2. What are the population characteristics of the African-American neighborhoods and how do
they compare to other racial/ethnic groups?
3. What cities and neighborhoods had the highest concentration of African-Americans in 2000
and 2008?
4. What are the most significant needs in African-American neighborhoods and what are the
implications for philanthropic investments in the African-American communities?
While the interest of BABIP is primarily on Black and African-American residents, there are some
notable limitations to the administrative datasets in common use. While the U.S. Censusdifferentiates between African-American and other peoples from Africa, the Caribbean and elsewhere
who are considered ‘Black’ by the Census, other sources such as California’s Department of Finance
8/8/2019 State of Bay Area Blacks Report Part I
http://slidepdf.com/reader/full/state-of-bay-area-blacks-report-part-i 7/58
EXECUTIVE SUMMARY
The Bay Area has seen many changes in the past twenty years, changes in the housing stock, in the
education sector, in the employment opportunities and the industries based here, in the workforce
development arena, in economic development activities, and in the demographics of its populace.
Long recognized as a multi-cultural region with rich ethnic communities tied to established
neighborhoods, the diversity of the Bay Area has changed constantly, with no ethnic group remaining
demographically static over the past two decades. For organizations and individuals involved in
serving and supporting the Black and African-American communities in the Bay Area, it is important
to understand the changes that are impacting these communities and how these populations
themselves are changing. This report examines the State of the Race: an analysis of the changing
Black community in the Bay Area and begins to present data and information pertinent to the
philanthropic, community building, and governmental sectors.
This report sets out to answer four main questions posed by the Bay Area Blacks in Philanthropy.
Where did African-Americans reside in the Bay Area in 2000 and what changes occurred
through 2008?
Across the nine county region, the population has increased by 519,879 people between 2000 and
8/8/2019 State of Bay Area Blacks Report Part I
http://slidepdf.com/reader/full/state-of-bay-area-blacks-report-part-i 8/58
Further analysis at a county level revealed that the Black population had distinct gaps in age
distribution: for several counties there was an alarming drop in the populations of 20 to29 year old
Black males, while in some counties this gap is visible in both the male and female populations.
Where the gap in population exists for both genders, we can consider macro causes like birth rates
and family size preferences as related. However in county sized areas where only males aged 20 to
29 are underrepresented, we must consider other, more troubling factors like incarceration, homicide
and premature deaths as possible contributors to this reality.
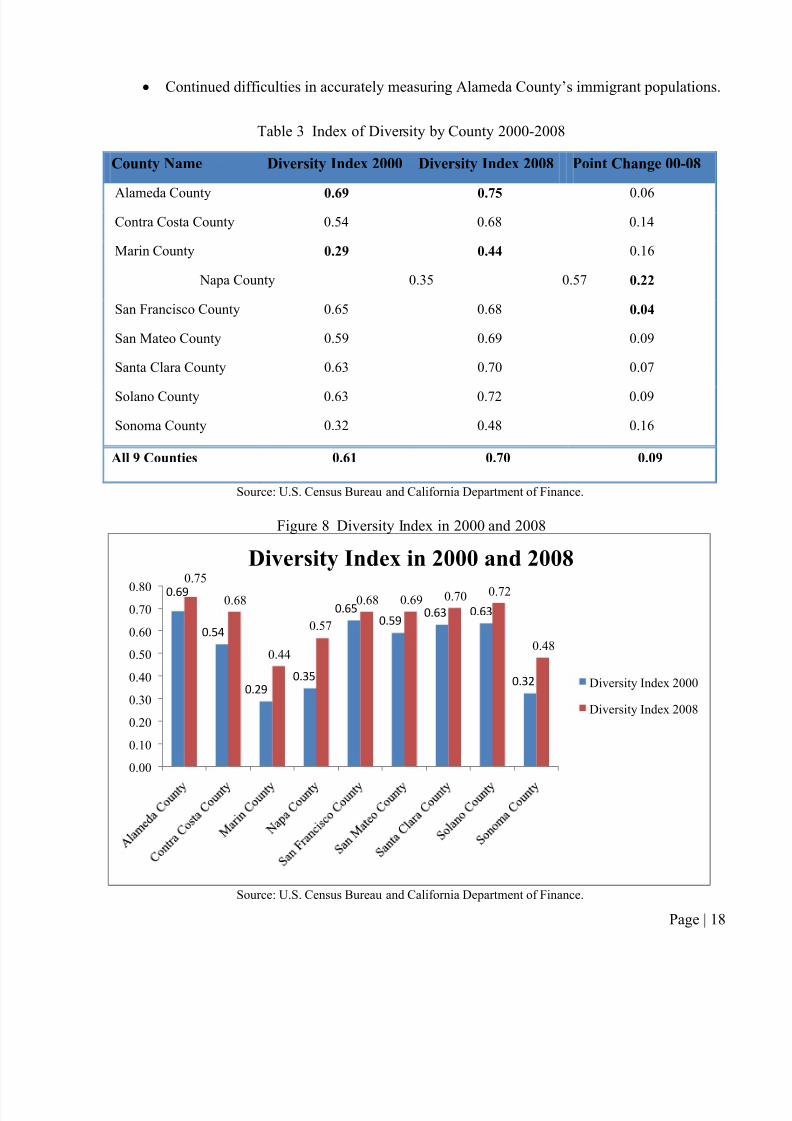
An analysis of the diversity of each county shows that Marin, Sonoma and Napa counties were the
least diverse. Nevertheless, all nine Bay Area counties experienced increases in diversity between
2000 and 2008. Alameda County was the most diverse in both years.
Between 1990 and 2000, the percentage of census tracts with over 50% Black population dropped
from 5.7% to 3.3%, and the percentage of with over 30% Blacks went from 9.6% down to 7.3%. In
1990, Alameda County had 26.8% of tracts with over 30% Black, yet only 20.9% of tracts in 2000
had this proportion of Blacks. Solano County went from having 6 tracts with over 30% Black in
1990 to none in 2000. Similarly, San Mateo County went from 5 tracts with over 30% Black to only
one between 1990 and 2000.
What are the population characteristics of the African-American community and how do they
8/8/2019 State of Bay Area Blacks Report Part I
http://slidepdf.com/reader/full/state-of-bay-area-blacks-report-part-i 9/58
For the ten tracts with the highest proportions of Blacks, most socio-economic indicators showed
very consistent patterns: these neighborhoods compared poorly to the overall county level statistics.
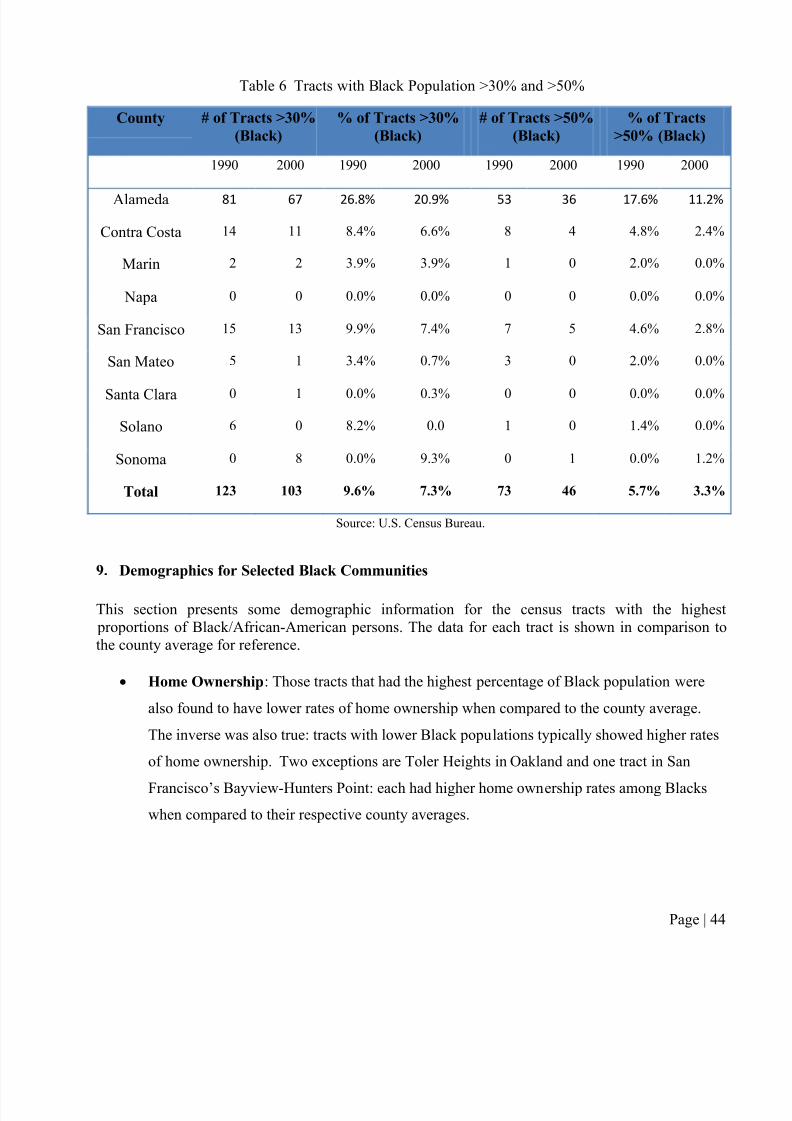
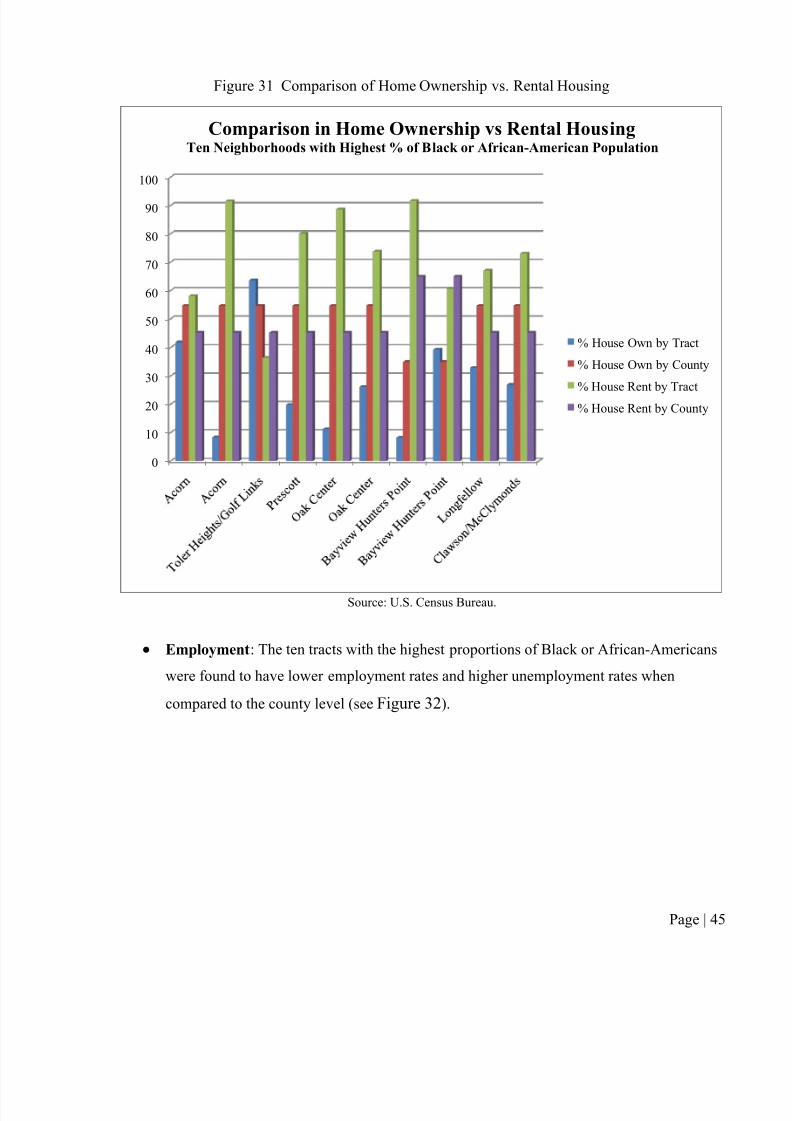
In eight out of the ten tracts, the rate of home ownership was much lower than the county average;
Bayview and Toler Heights were the exceptions and these represent more established Black
communities. In each of the ten tracts, unemployment levels were higher than the county average,
and in all except for Toler Heights, income levels were significantly lower than the average.
Education attainment was also much lower in most of the ten tracts, with all having much lower rates
of bachelor and post-graduate degrees than the county averages—rates often ranged from one-third toone-half of those of their respective counties.
What cities and neighborhoods had the highest concentration of African-Americans in 2000
and 2008?
From 2000 through 2008, Oakland remained the city with the largest Black population, although
there was a 25% decrease in this population over this time period. San Francisco had the second
largest Black population, followed by Richmond; these cities saw reductions in their Black
populations of 17.6% and 18.6%, respectively.
Cities experiencing a noticeable increase in their Black populations include Mountain View (+119%),
Antioch (+115%) and San Leandro (+76%). Daly City and Berkeley had the largest declines in
8/8/2019 State of Bay Area Blacks Report Part I
http://slidepdf.com/reader/full/state-of-bay-area-blacks-report-part-i 10/58
also concentrated Black communities (in this report defined only by census tracts) in the cities of
Menlo Park, East Palo Alto, Vallejo, Fairfield, Vacaville, Pittsburg, and Antioch.
One demographic shift of note: in 1990 there were several tracts in rural Sonoma County with modest
Black populations which—in the 2000 Census—show almost no Black residents. In general, the
central counties in the region have experienced decreases overall in their Black populations, along
with corresponding increases in outer ring counties and cities. Anecdotal evidence suggests that many
Black (and other races) families are moving even further from the Bay Area in search of newer and
lower cost housing in cities such as Tracy, Lodi, and Stockton.
What are the most significant needs in African-American communities and what are the
implications for philanthropic investments in the African-American communities?
In this report we outline some of the population changes within the Black communities of the Bay
Area and identify the regions and neighborhoods most affected by these demographic shifts. Our
analysis indicates that many historically Black inner-city neighborhoods are in a state of flux. The
resulting pattern shows a more dispersed Black population throughout the Bay Area, particularly
among the increasingly diverse outer counties of the region. As our populations shift and target
communities move, those of us in the philanthropic, community-based organization, service, and
public agency sectors need to be alert and responsive to these changes in order to tailor, adjust, and

8/8/2019 State of Bay Area Blacks Report Part I
http://slidepdf.com/reader/full/state-of-bay-area-blacks-report-part-i 11/58
provide these services) in their new communities? Do necessary services even exist in newer, less
developed communities?
&
8/8/2019 State of Bay Area Blacks Report Part I
http://slidepdf.com/reader/full/state-of-bay-area-blacks-report-part-i 12/58
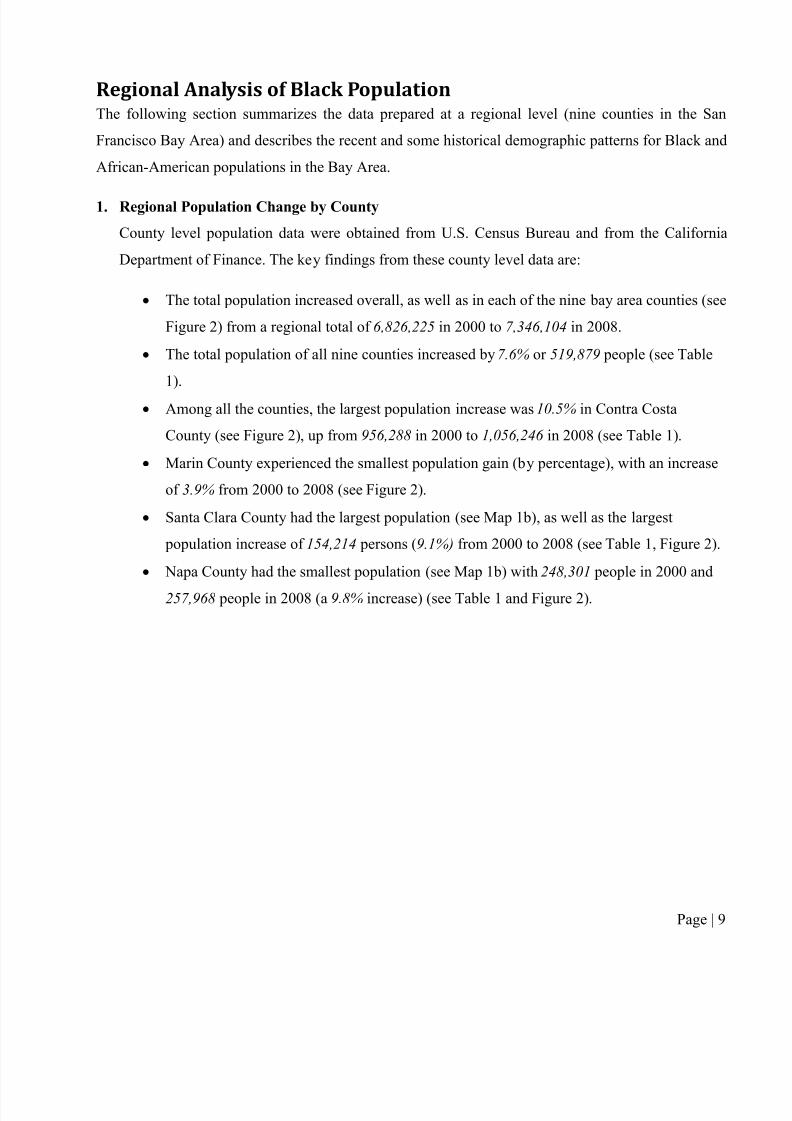
=%21'*"$&5*"$:,1,&'(&6$";<&7'>3$"+1'*&The following section summarizes the data prepared at a regional level (nine counties in the San
Francisco Bay Area) and describes the recent and some historical demographic patterns for Black and
African-American populations in the Bay Area.
1. Regional Population Change by County
County level population data were obtained from U.S. Census Bureau and from the California
Department of Finance. The key findings from these county level data are:
The total population increased overall, as well as in each of the nine bay area counties (see
Figure 2) from a regional total of 6,826,225 in 2000 to 7,346,104 in 2008.
The total population of all nine counties increased by 7.6% or 519,879 people (see Table
1).
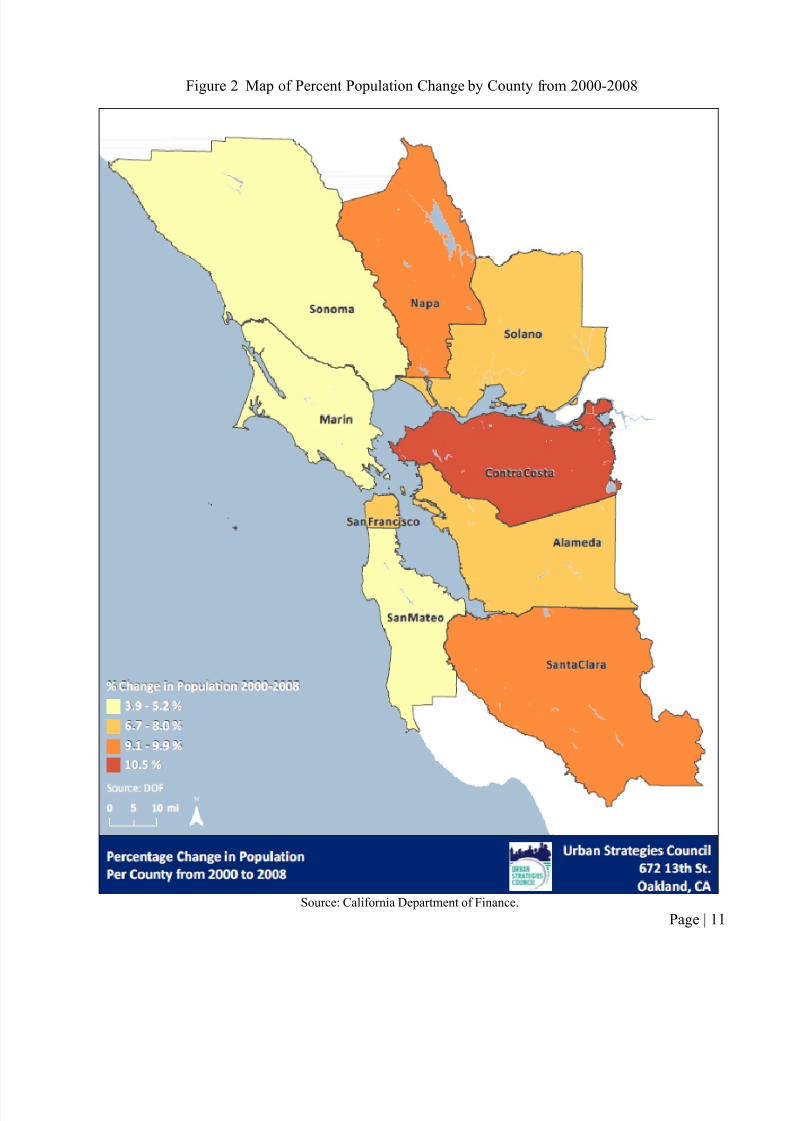
Among all the counties, the largest population increase was 10.5% in Contra CostaCounty (see Figure 2), up from 956,288 in 2000 to 1,056,246 in 2008 (see Table 1).
Marin County experienced the smallest population gain (by percentage), with an increase
of 3.9% from 2000 to 2008 (see Figure 2).
Santa Clara County had the largest population (see Map 1b), as well as the largest
population increase of 154,214 persons (9.1%) from 2000 to 2008 (see Table 1, Figure 2).
Napa County had the smallest population (see Map 1b) with 248,301 people in 2000 and
257,968 people in 2008 (a 9.8% increase) (see Table 1 and Figure 2).
8/8/2019 State of Bay Area Blacks Report Part I
http://slidepdf.com/reader/full/state-of-bay-area-blacks-report-part-i 13/58
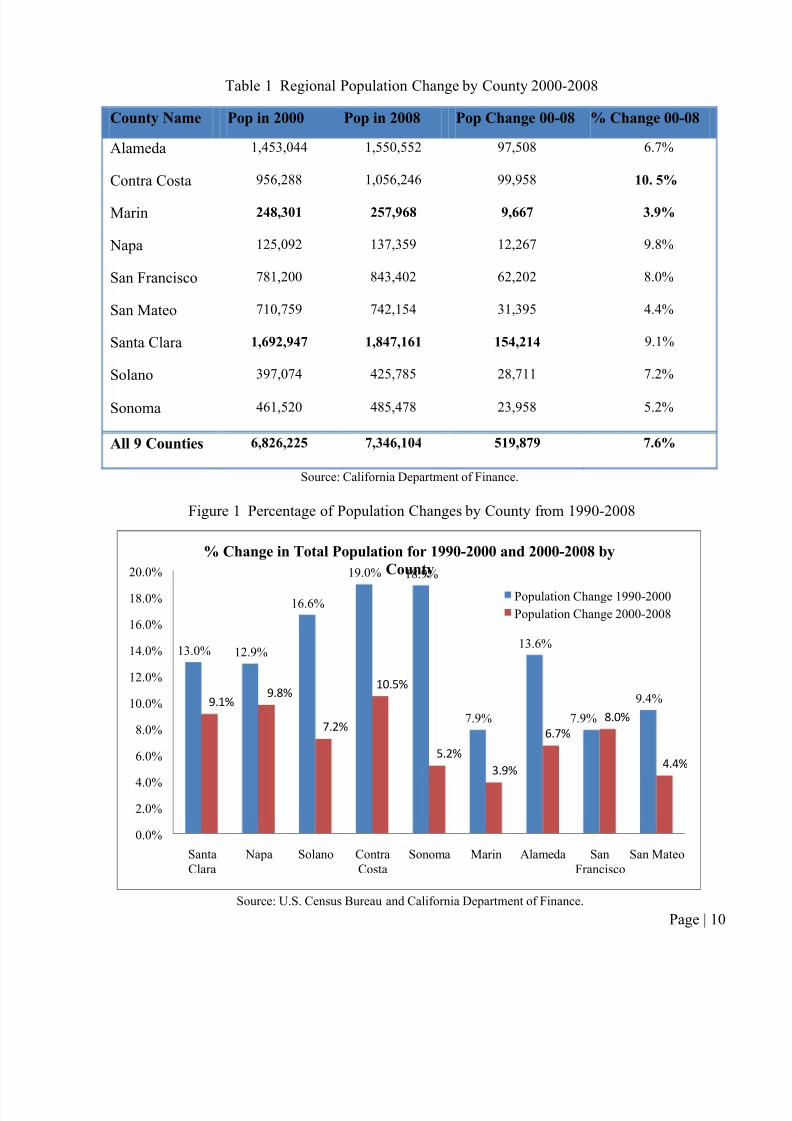
Table 1 Regional Population Change by County 2000-2008
County Name Pop in 2000 Pop in 2008 Pop Change 00-08 % Change 00-08
Alameda 1,453,044 1,550,552 97,508 6.7%
Contra Costa 956,288 1,056,246 99,958 10. 5%
Marin 248,301 257,968 9,667 3.9%
Napa 125,092 137,359 12,267 9.8%
San Francisco 781,200 843,402 62,202 8.0%
San Mateo 710,759 742,154 31,395 4.4%
Santa Clara 1,692,947 1,847,161 154,214 9.1%
Solano 397,074 425,785 28,711 7.2%
Sonoma461,520 485,478 23,958 5.2%
All 9 Counties 6,826,225 7,346,104 519,879 7.6%
Source: California Department of Finance.
Figure 1 Percentage of Population Changes by County from 1990-2008
16.6%
19.0% 18.9%
18.0%
20.0%% Change in Total Population for 1990-2000 and 2000-2008 by
County
Population Change 1990-2000
8/8/2019 State of Bay Area Blacks Report Part I
http://slidepdf.com/reader/full/state-of-bay-area-blacks-report-part-i 14/58
Figure 2 Map of Percent Population Change by County from 2000-2008
8/8/2019 State of Bay Area Blacks Report Part I
http://slidepdf.com/reader/full/state-of-bay-area-blacks-report-part-i 15/58
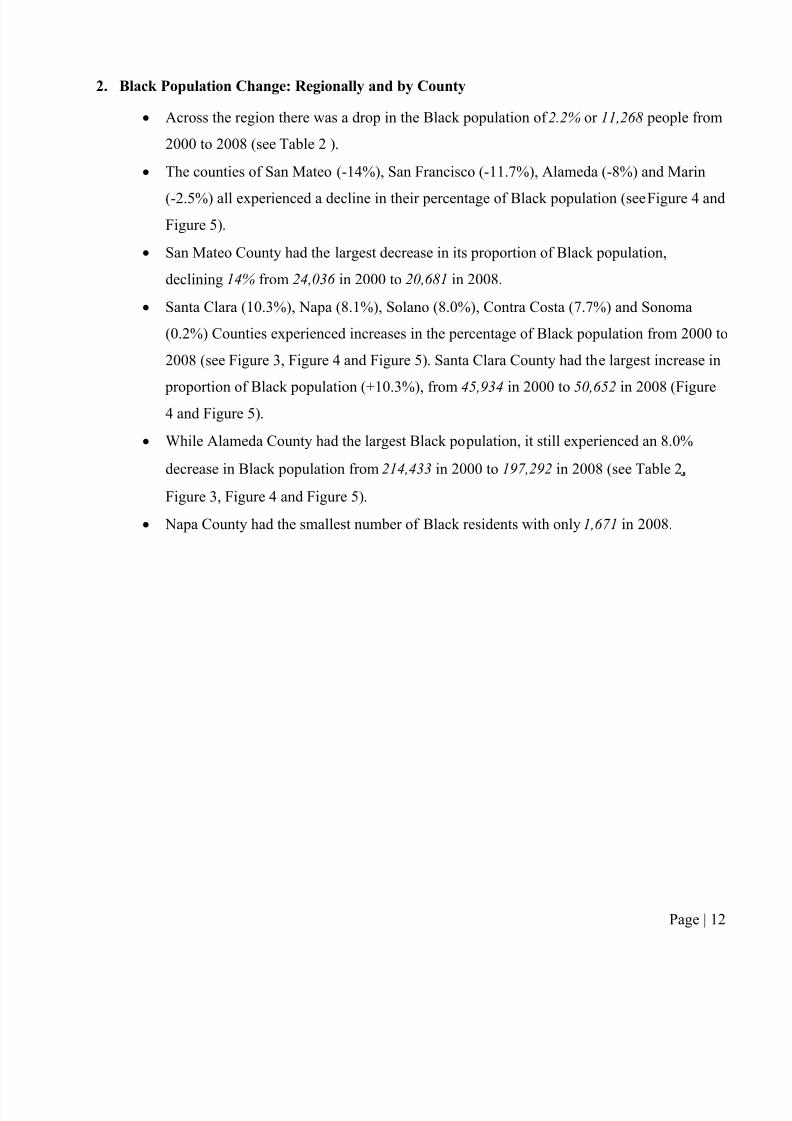
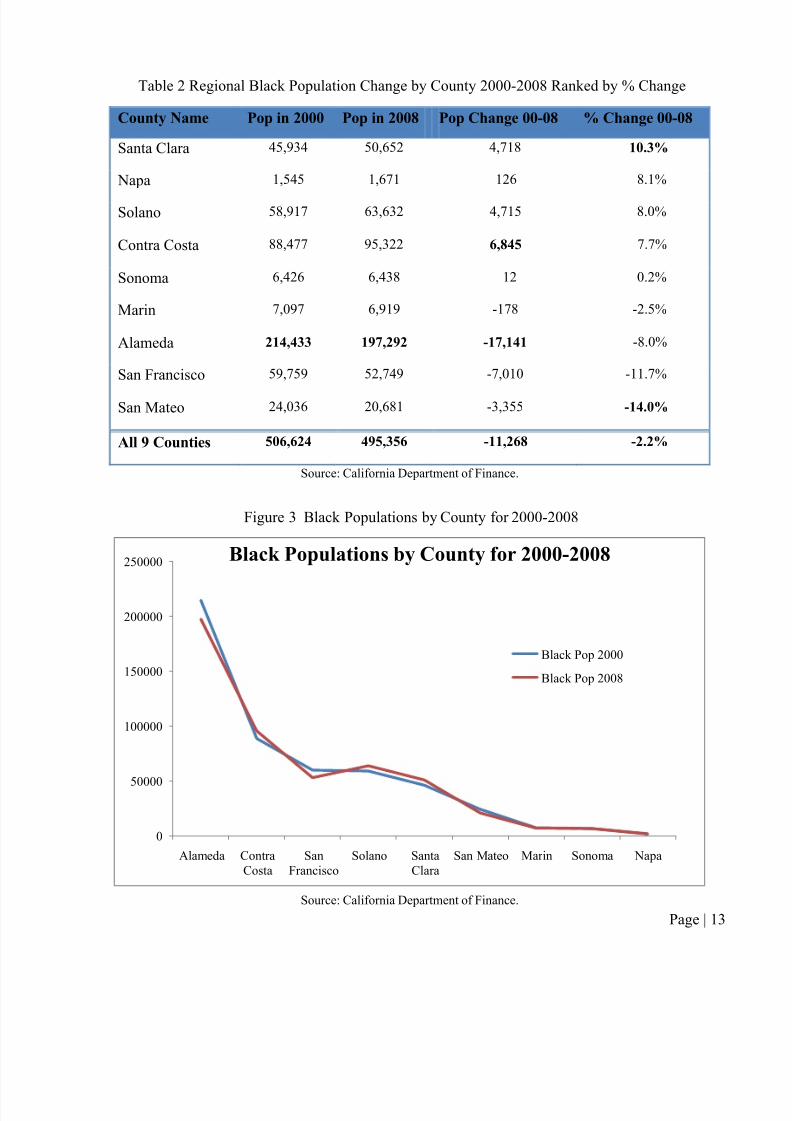
2. Black Population Change: Regionally and by County
Across the region there was a drop in the Black population of 2.2% or 11,268 people from
2000 to 2008 (see Table 2 ).
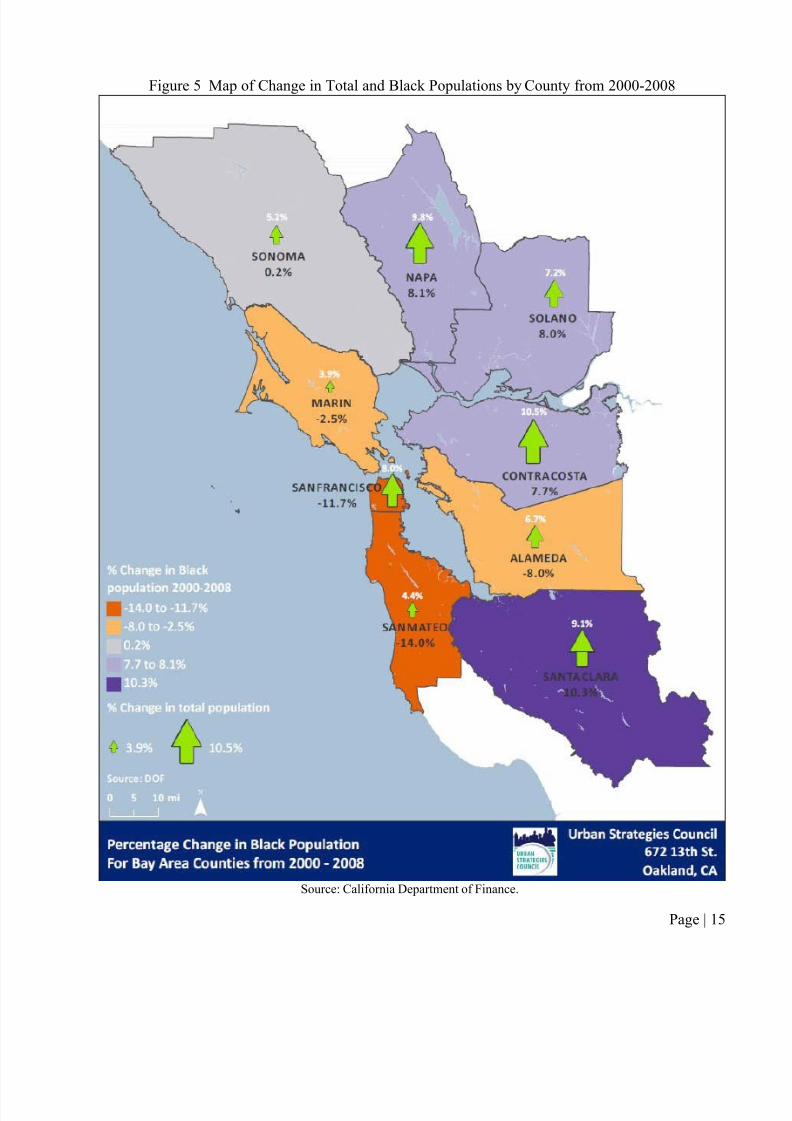
The counties of San Mateo (-14%), San Francisco (-11.7%), Alameda (-8%) and Marin
(-2.5%) all experienced a decline in their percentage of Black population (see Figure 4 and
Figure 5).
San Mateo County had the largest decrease in its proportion of Black population,
declining 14% from 24,036 in 2000 to 20,681 in 2008.
Santa Clara (10.3%), Napa (8.1%), Solano (8.0%), Contra Costa (7.7%) and Sonoma
(0.2%) Counties experienced increases in the percentage of Black population from 2000 to
2008 (see Figure 3, Figure 4 and Figure 5). Santa Clara County had the largest increase in
proportion of Black population (+10.3%), from 45,934 in 2000 to 50,652 in 2008 (Figure
4 and Figure 5).
While Alameda County had the largest Black population, it still experienced an 8.0%
decrease in Black population from 214,433 in 2000 to 197,292 in 2008 (see Table 2,
Figure 3, Figure 4 and Figure 5).
Napa County had the smallest number of Black residents with only 1,671 in 2008.
8/8/2019 State of Bay Area Blacks Report Part I
http://slidepdf.com/reader/full/state-of-bay-area-blacks-report-part-i 16/58
Table 2 Regional Black Population Change by County 2000-2008 Ranked by % Change
County Name Pop in 2000 Pop in 2008 Pop Change 00-08 % Change 00-08
Santa Clara 45,934 50,652 4,718 10.3%
Napa 1,545 1,671 126 8.1%
Solano 58,917 63,632 4,715 8.0%
Contra Costa 88,477 95,322 6,845 7.7%
Sonoma 6,426 6,438 12 0.2%
Marin 7,097 6,919 -178 -2.5%
Alameda 214,433 197,292 -17,141 -8.0%
San Francisco 59,759 52,749 -7,010 -11.7%
San Mateo 24,036 20,681 -3,355 -14.0%
All 9 Counties 506,624 495,356 -11,268 -2.2%
Source: California Department of Finance.
Figure 3 Black Populations by County for 2000-2008!
250000 Black Populations by County for 2000-2008

8/8/2019 State of Bay Area Blacks Report Part I
http://slidepdf.com/reader/full/state-of-bay-area-blacks-report-part-i 17/58
Figure 4 Map of Black Populations by County for 2000-2008!
8/8/2019 State of Bay Area Blacks Report Part I
http://slidepdf.com/reader/full/state-of-bay-area-blacks-report-part-i 18/58
Figure 5 Map of Change in Total and Black Populations by County from 2000-2008
8/8/2019 State of Bay Area Blacks Report Part I
http://slidepdf.com/reader/full/state-of-bay-area-blacks-report-part-i 19/58
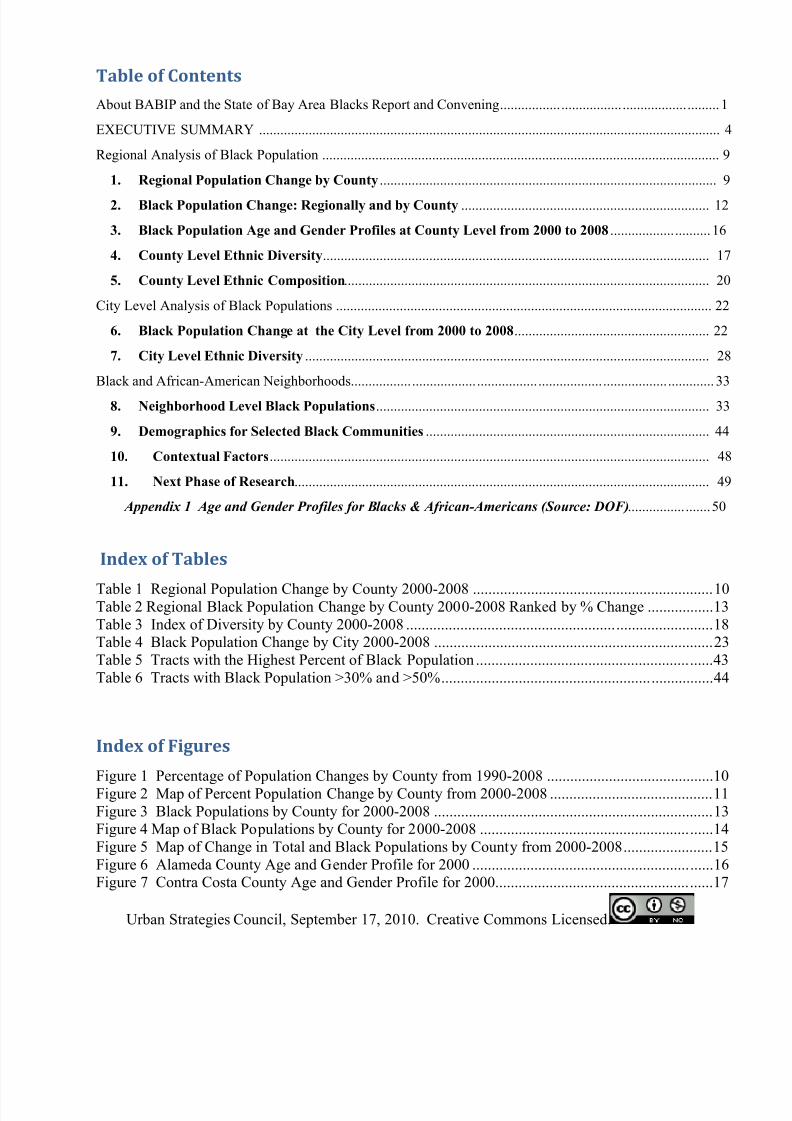
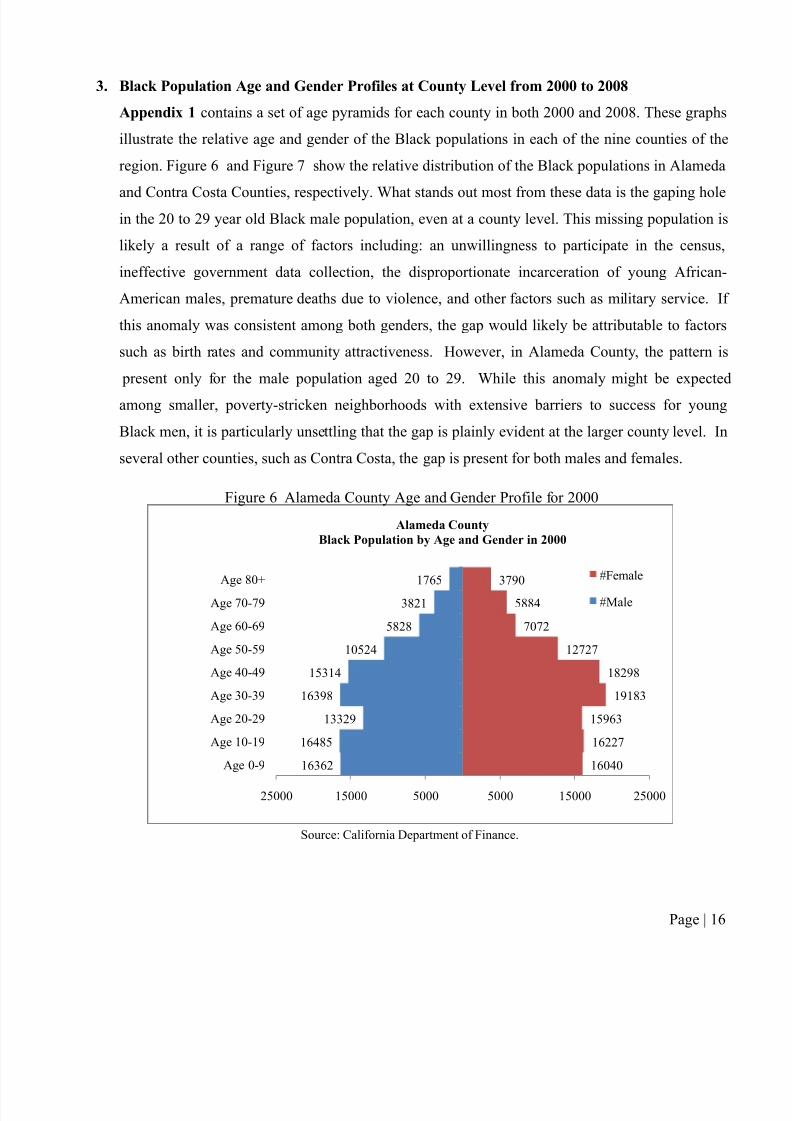
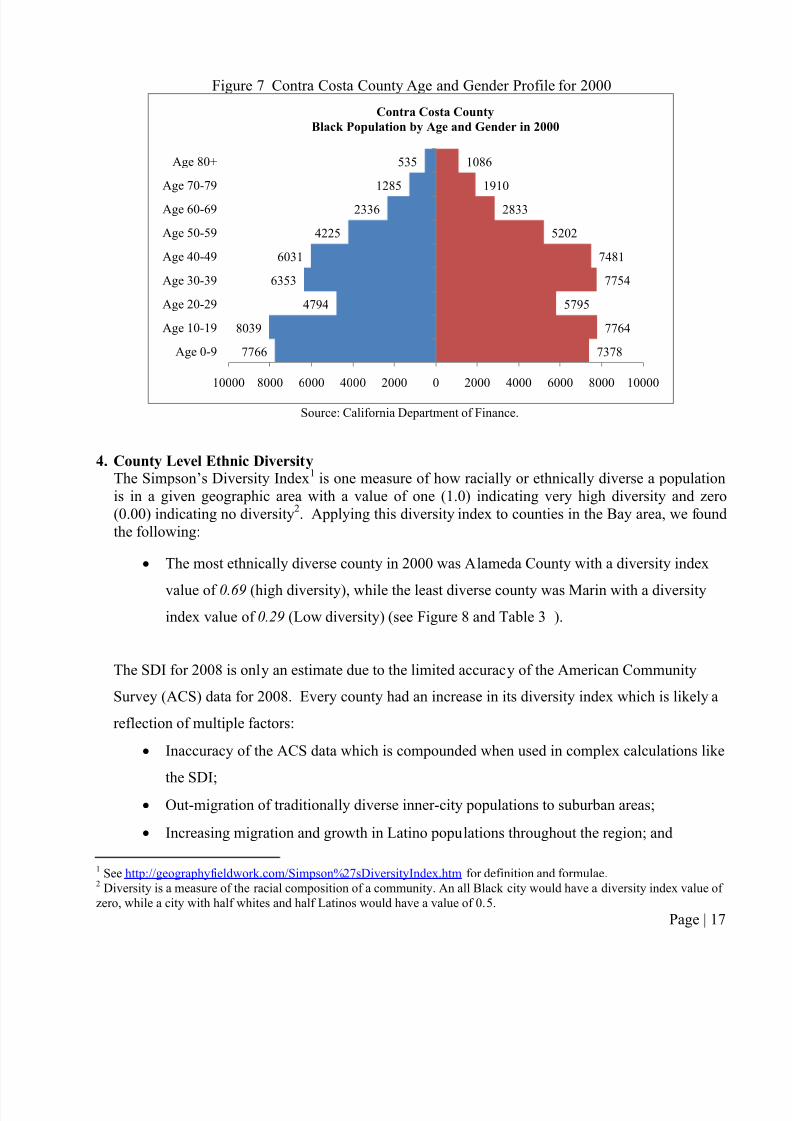
3. Black Population Age and Gender Profiles at County Level from 2000 to 2008
Appendix 1 contains a set of age pyramids for each county in both 2000 and 2008. These graphs
illustrate the relative age and gender of the Black populations in each of the nine counties of the
region. Figure 6 and Figure 7 show the relative distribution of the Black populations in Alameda
and Contra Costa Counties, respectively. What stands out most from these data is the gaping hole
in the 20 to 29 year old Black male population, even at a county level. This missing population is
likely a result of a range of factors including: an unwillingness to participate in the census,
ineffective government data collection, the disproportionate incarceration of young African-American males, premature deaths due to violence, and other factors such as military service. If
this anomaly was consistent among both genders, the gap would likely be attributable to factors
such as birth rates and community attractiveness. However, in Alameda County, the pattern is
present only for the male population aged 20 to 29. While this anomaly might be expected
among smaller, poverty-stricken neighborhoods with extensive barriers to success for young
Black men, it is particularly unsettling that the gap is plainly evident at the larger county level. In
several other counties, such as Contra Costa, the gap is present for both males and females.
Figure 6 Alameda County Age and Gender Profile for 2000
3821
1765
5884
3790
Age 70-79
Age 80+
Alameda County
Black Population by Age and Gender in 2000
#Female
#Male
8/8/2019 State of Bay Area Blacks Report Part I
http://slidepdf.com/reader/full/state-of-bay-area-blacks-report-part-i 20/58
Figure 7 Contra Costa County Age and Gender Profile for 2000
Source: California Department of Finance.
4. County Level Ethnic Diversity The Simpson’s Diversity Index1 is one measure of how racially or ethnically diverse a populationis in a given geographic area with a value of one (1.0) indicating very high diversity and zero(0.00) indicating no diversity2
The most ethnically diverse county in 2000 was Alameda County with a diversity index
value of 0.69 (high diversity), while the least diverse county was Marin with a diversity
. Applying this diversity index to counties in the Bay area, we foundthe following:
7766
8039
4794
6353
6031
4225
2336
1285
535
7378
7764
5795
7754
7481
5202
2833
1910
1086
10000 8000 6000 4000 2000 0 2000 4000 6000 8000 10000
Age 0-9
Age 10-19
Age 20-29
Age 30-39
Age 40-49
Age 50-59
Age 60-69
Age 70-79
Age 80+
Contra Costa County
Black Population by Age and Gender in 2000
8/8/2019 State of Bay Area Blacks Report Part I
http://slidepdf.com/reader/full/state-of-bay-area-blacks-report-part-i 21/58
Continued difficulties in accurately measuring Alameda County’s immigrant populations.
Table 3 Index of Diversity by County 2000-2008
County Name Diversity Index 2000 Diversity Index 2008 Point Change 00-08
Alameda County 0.69 0.75 0.06
Contra Costa County 0.54 0.68 0.14
Marin County 0.29 0.44 0.16
Napa County 0.35 0.57 0.22
San Francisco County 0.65 0.68 0.04
San Mateo County 0.59 0.69 0.09
Santa Clara County 0.63 0.70 0.07
Solano County 0.63 0.72 0.09
Sonoma County 0.32 0.48 0.16
All 9 Counties 0.61 0.70 0.09
Source: U.S. Census Bureau and California Department of Finance.
Figure 8 Diversity Index in 2000 and 2008
)#,"
) ,* ) ,+ ) ,+
0.75
0.68 0.68 0.69 0.70 0.72
0 70
0.80
Diversity Index in 2000 and 2008
8/8/2019 State of Bay Area Blacks Report Part I
http://slidepdf.com/reader/full/state-of-bay-area-blacks-report-part-i 22/58
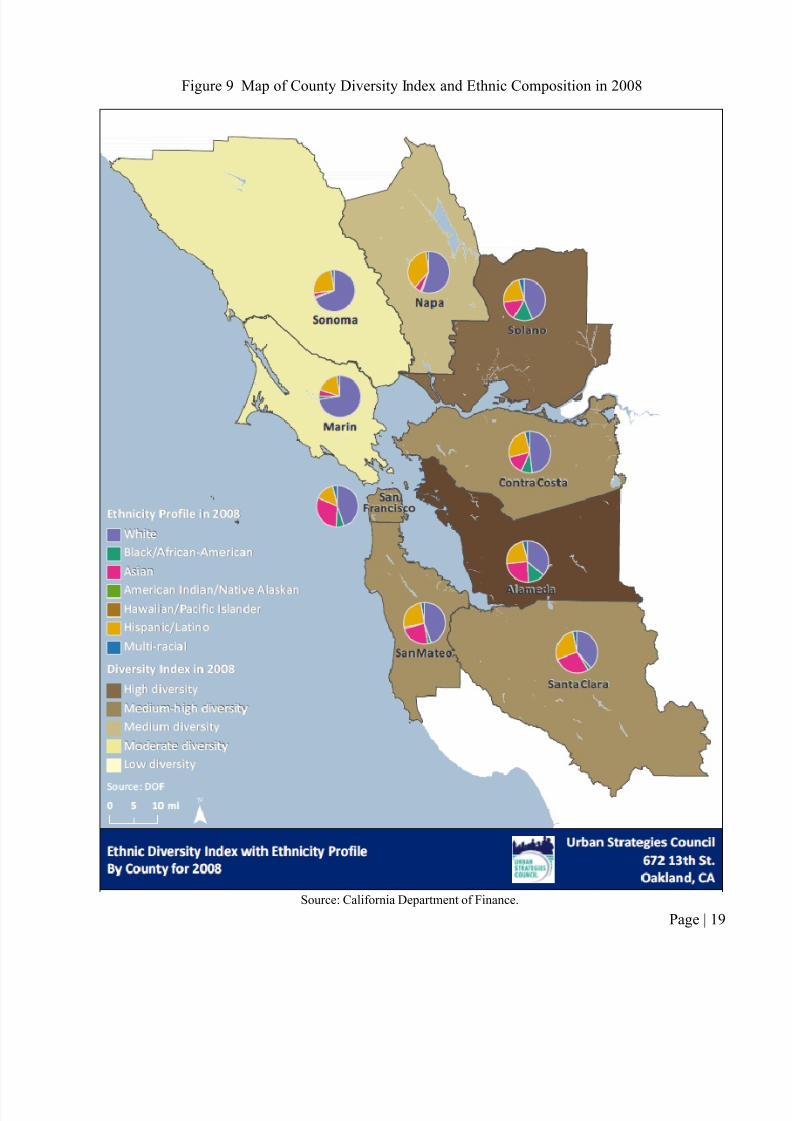
Figure 9 Map of County Diversity Index and Ethnic Composition in 2008
8/8/2019 State of Bay Area Blacks Report Part I
http://slidepdf.com/reader/full/state-of-bay-area-blacks-report-part-i 23/58
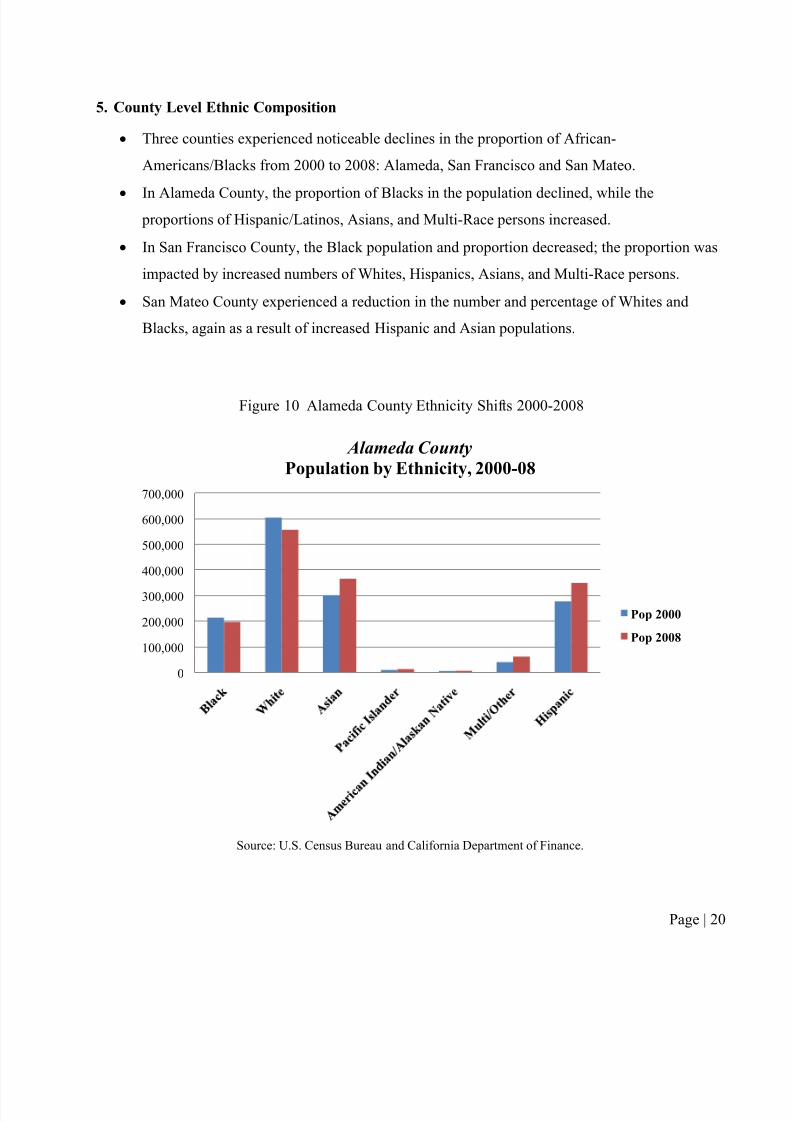
5. County Level Ethnic Composition
Three counties experienced noticeable declines in the proportion of African-Americans/Blacks from 2000 to 2008: Alameda, San Francisco and San Mateo.
In Alameda County, the proportion of Blacks in the population declined, while the
proportions of Hispanic/Latinos, Asians, and Multi-Race persons increased.
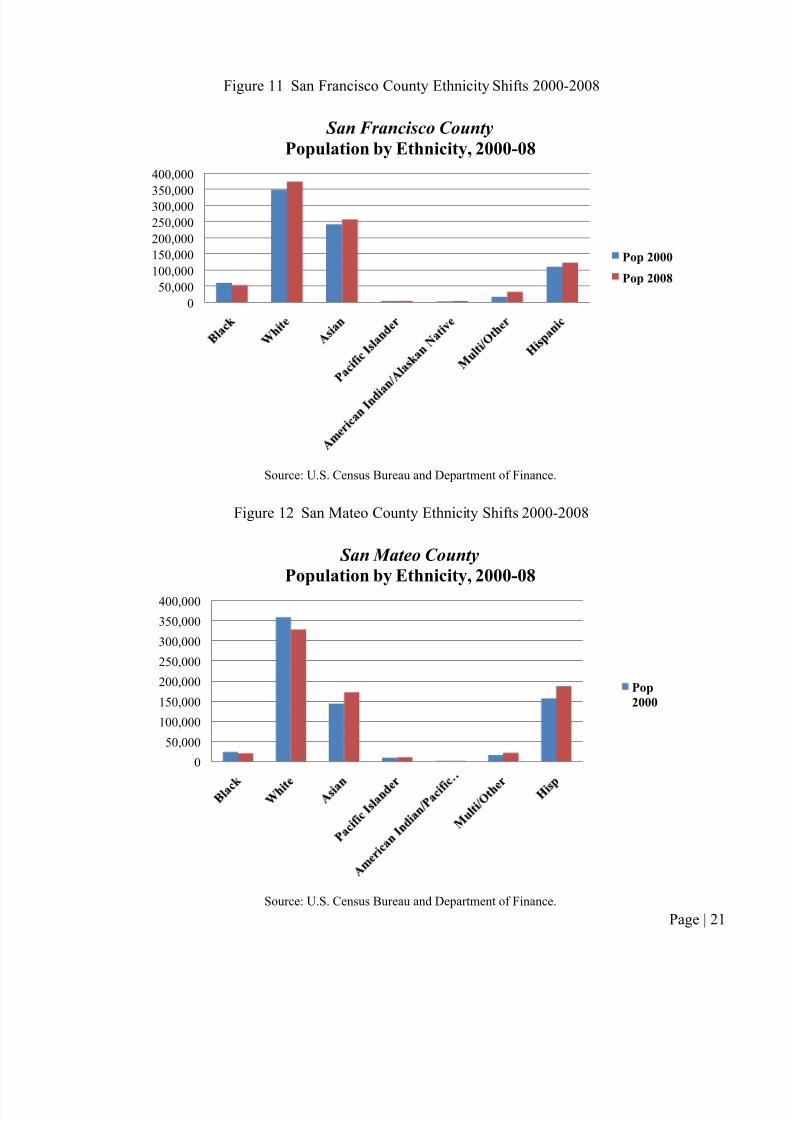
In San Francisco County, the Black population and proportion decreased; the proportion was
impacted by increased numbers of Whites, Hispanics, Asians, and Multi-Race persons. San Mateo County experienced a reduction in the number and percentage of Whites and
Blacks, again as a result of increased Hispanic and Asian populations.
Figure 10 Alameda County Ethnicity Shifts 2000-2008
300,000
400,000
500,000
600,000
700,000
Alameda County
Population by Ethnicity, 2000-08
8/8/2019 State of Bay Area Blacks Report Part I
http://slidepdf.com/reader/full/state-of-bay-area-blacks-report-part-i 24/58
Figure 11 San Francisco County Ethnicity Shifts 2000-2008
Source: U.S. Census Bureau and Department of Finance.
Figure 12 San Mateo County Ethnicity Shifts 2000-2008
0
50,000
100,000
150,000
200,000
250,000
300,000
350,000
400,000
San Francisco County
Population by Ethnicity, 2000-08
Pop 2000
Pop 2008
400,000
San Mateo CountyPopulation by Ethnicity, 2000-08
8/8/2019 State of Bay Area Blacks Report Part I
http://slidepdf.com/reader/full/state-of-bay-area-blacks-report-part-i 25/58
)1+:&@%?%$&5*"$:,1,&'(&6$";<&7'>3$"+1'*,&The following section summarizes Black populations at a city level for officially recognized cities or places, also known as “Census Designated Places”. These data do not include unincorporated countyareas and represent a partial view of the region, albeit a view that incorporates all major establishedcities in the region. These ACS data were not published for cities with populations under 20,000.
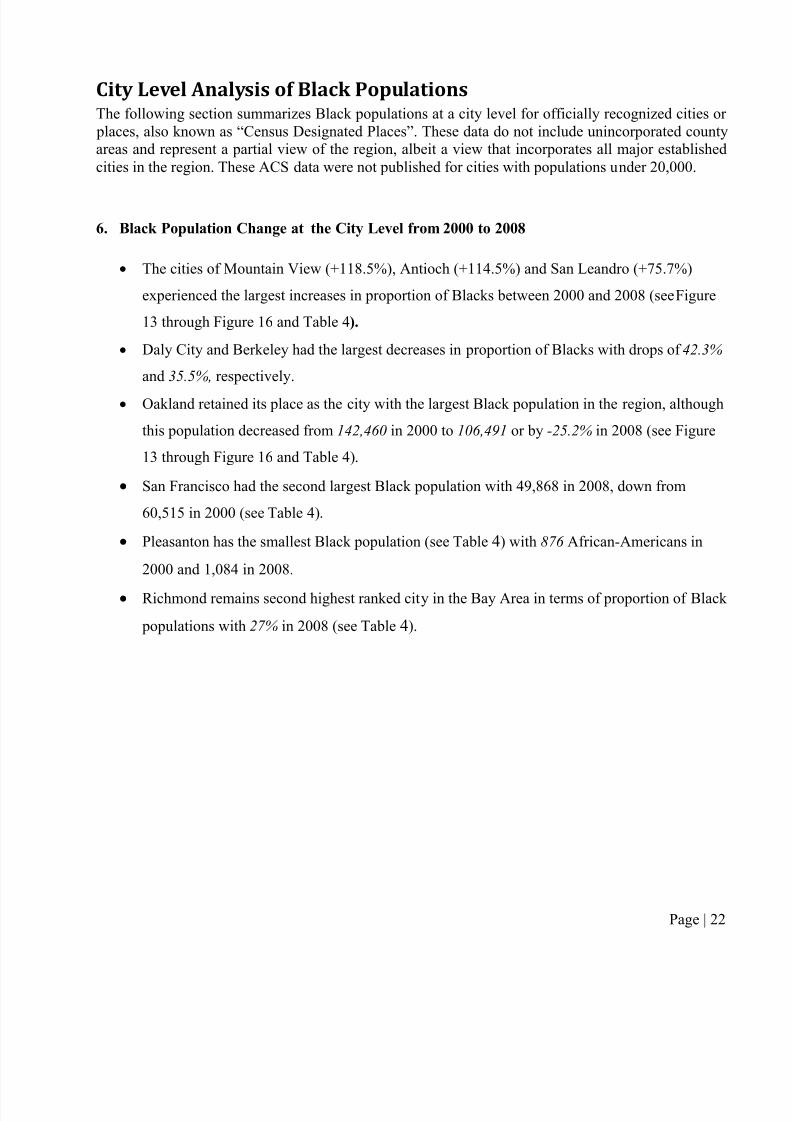
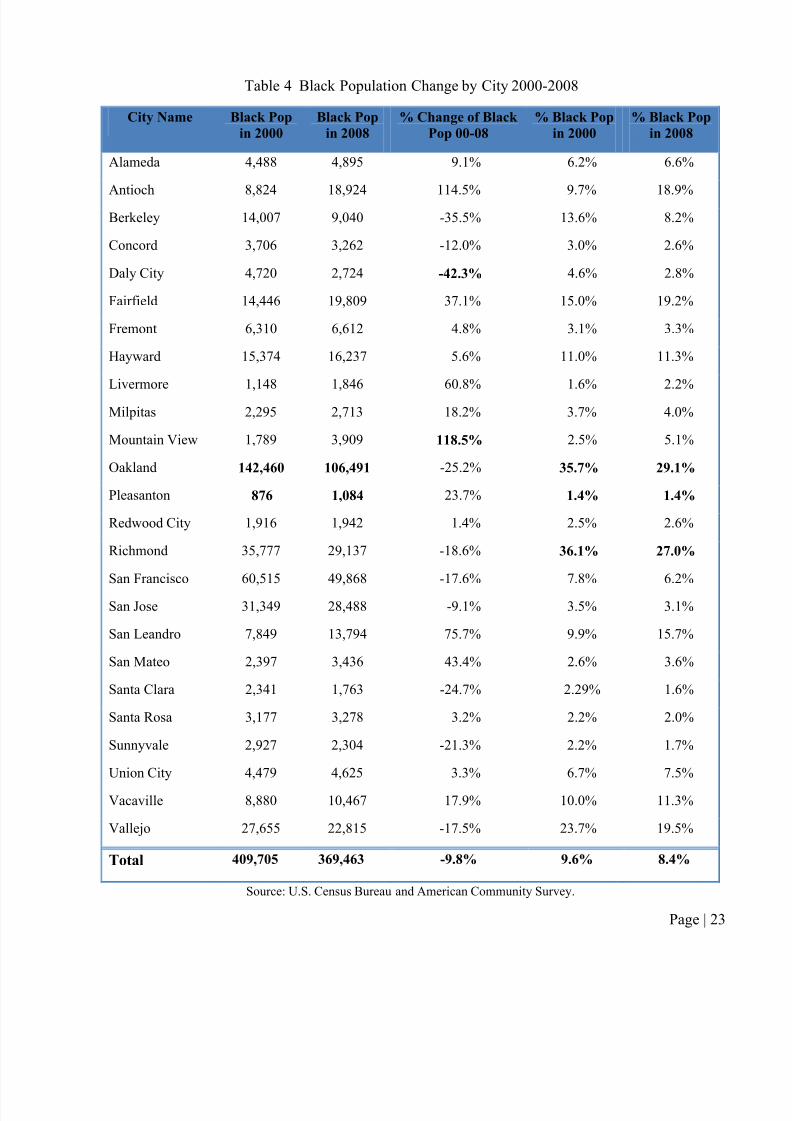
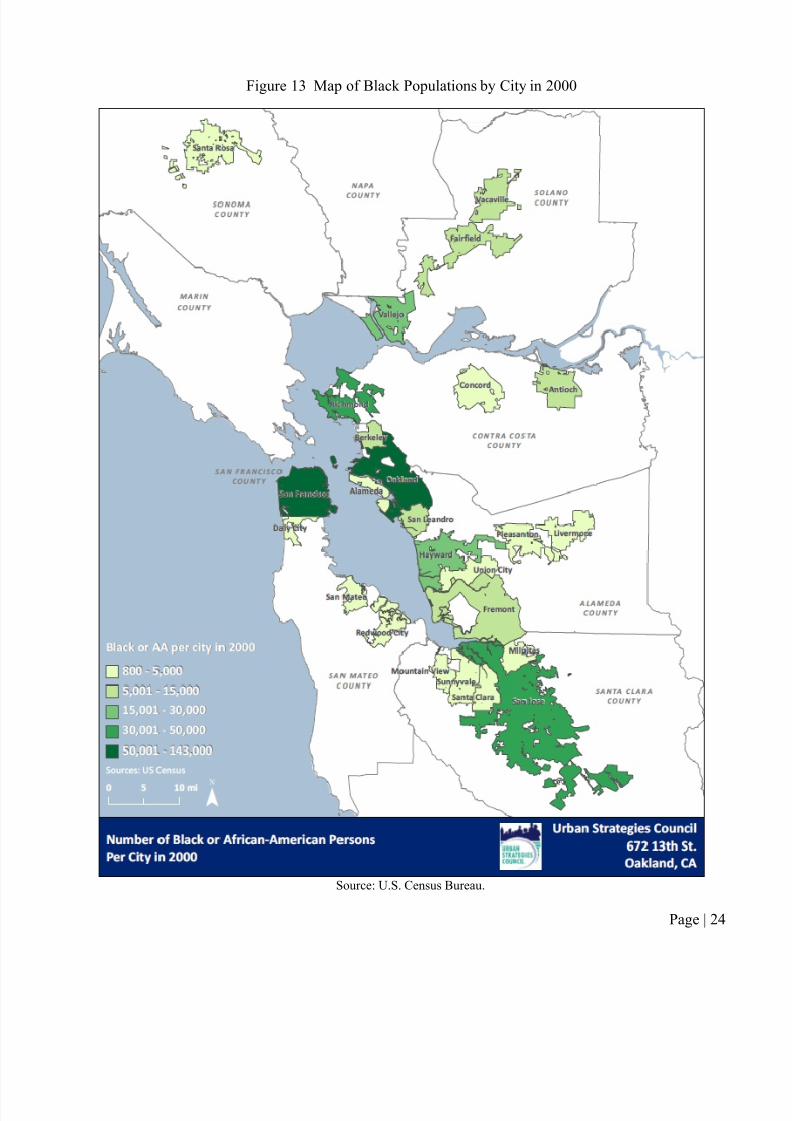
6. Black Population Change at the City Level from 2000 to 2008
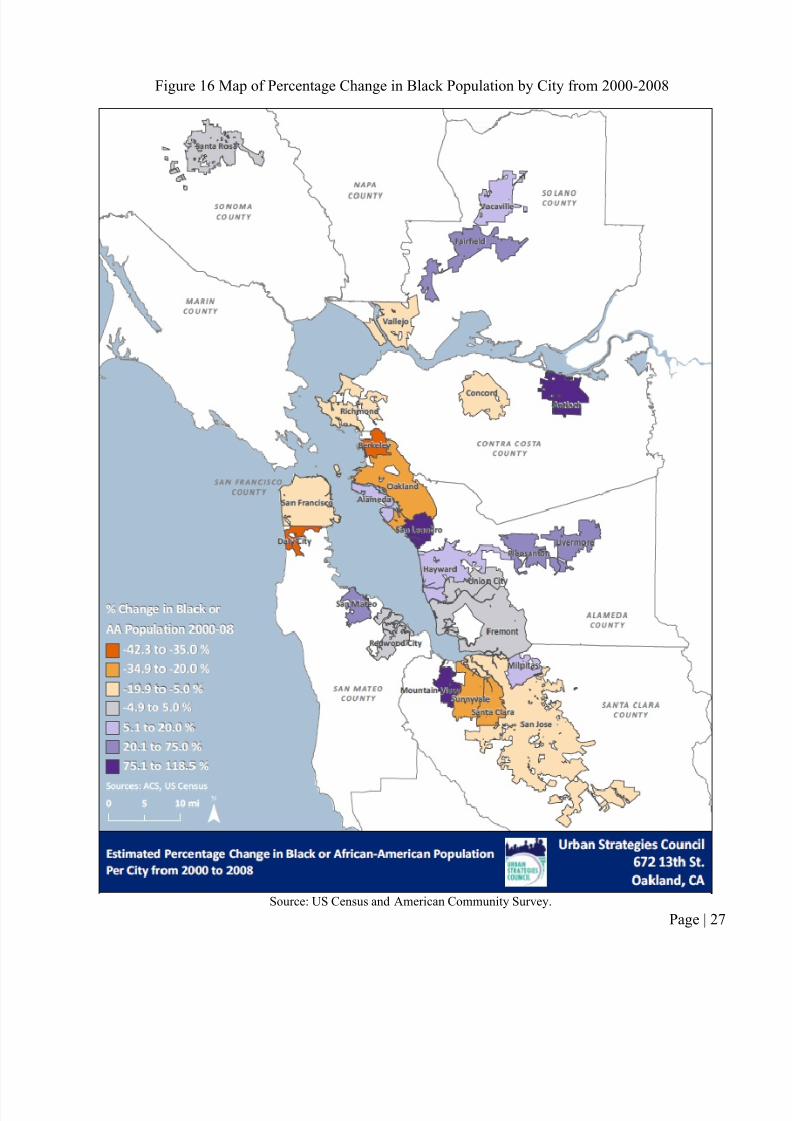
The cities of Mountain View (+118.5%), Antioch (+114.5%) and San Leandro (+75.7%)
experienced the largest increases in proportion of Blacks between 2000 and 2008 (see Figure
13 through Figure 16 and Table 4).
Daly City and Berkeley had the largest decreases in proportion of Blacks with drops of 42.3%
and 35.5%, respectively.
Oakland retained its place as the city with the largest Black population in the region, although
this population decreased from 142,460 in 2000 to 106,491 or by -25.2% in 2008 (see Figure
13 through Figure 16 and Table 4).
San Francisco had the second largest Black population with 49,868 in 2008, down from
60,515 in 2000 (see Table 4).
Pleasanton has the smallest Black population (see Table 4) with 876 African-Americans in
2000 and 1,084 in 2008.
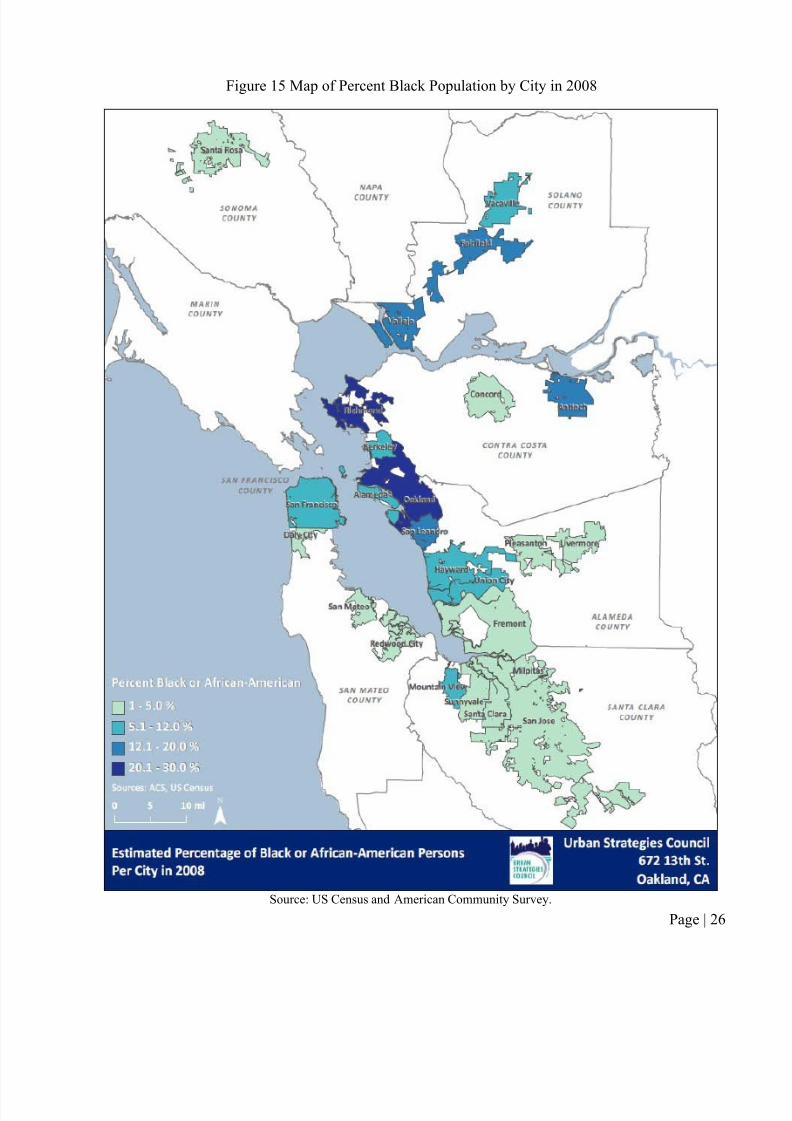
Richmond remains second highest ranked city in the Bay Area in terms of proportion of Black
8/8/2019 State of Bay Area Blacks Report Part I
http://slidepdf.com/reader/full/state-of-bay-area-blacks-report-part-i 26/58
Table 4 Black Population Change by City 2000-2008
City Name Black Pop
in 2000
Black Pop
in 2008
% Change of Black
Pop 00-08! % Black Pop
in 2000
% Black Pop
in 2008
Alameda 4,488 4,895 9.1% 6.2% 6.6%
Antioch 8,824 18,924 114.5% 9.7% 18.9%
Berkeley 14,007 9,040 -35.5% 13.6% 8.2%
Concord 3,706 3,262 -12.0% 3.0% 2.6%
Daly City 4,720 2,724 -42.3% 4.6% 2.8%Fairfield 14,446 19,809 37.1% 15.0% 19.2%
Fremont 6,310 6,612 4.8% 3.1% 3.3%
Hayward 15,374 16,237 5.6% 11.0% 11.3%
Livermore 1,148 1,846 60.8% 1.6% 2.2%
Milpitas 2,295 2,713 18.2% 3.7% 4.0%Mountain View 1,789 3,909 118.5% 2.5% 5.1%
Oakland 142,460 106,491 -25.2% 35.7% 29.1%
Pleasanton 876 1,084 23.7% 1.4% 1.4%
Redwood City 1,916 1,942 1.4% 2.5% 2.6%
Richmond 35,777 29,137 -18.6% 36.1% 27.0%
San Francisco 60,515 49,868 -17.6% 7.8% 6.2%
San Jose 31 349 28 488 -9 1% 3 5% 3 1%
8/8/2019 State of Bay Area Blacks Report Part I
http://slidepdf.com/reader/full/state-of-bay-area-blacks-report-part-i 27/58
Figure 13 Map of Black Populations by City in 2000!
8/8/2019 State of Bay Area Blacks Report Part I
http://slidepdf.com/reader/full/state-of-bay-area-blacks-report-part-i 28/58
Figure 14 Map of Black Populations by City in 2008!
8/8/2019 State of Bay Area Blacks Report Part I
http://slidepdf.com/reader/full/state-of-bay-area-blacks-report-part-i 29/58
Figure 15 Map of Percent Black Population by City in 2008!
8/8/2019 State of Bay Area Blacks Report Part I
http://slidepdf.com/reader/full/state-of-bay-area-blacks-report-part-i 30/58
Figure 16 Map of Percentage Change in Black Population by City from 2000-2008!
8/8/2019 State of Bay Area Blacks Report Part I
http://slidepdf.com/reader/full/state-of-bay-area-blacks-report-part-i 31/58
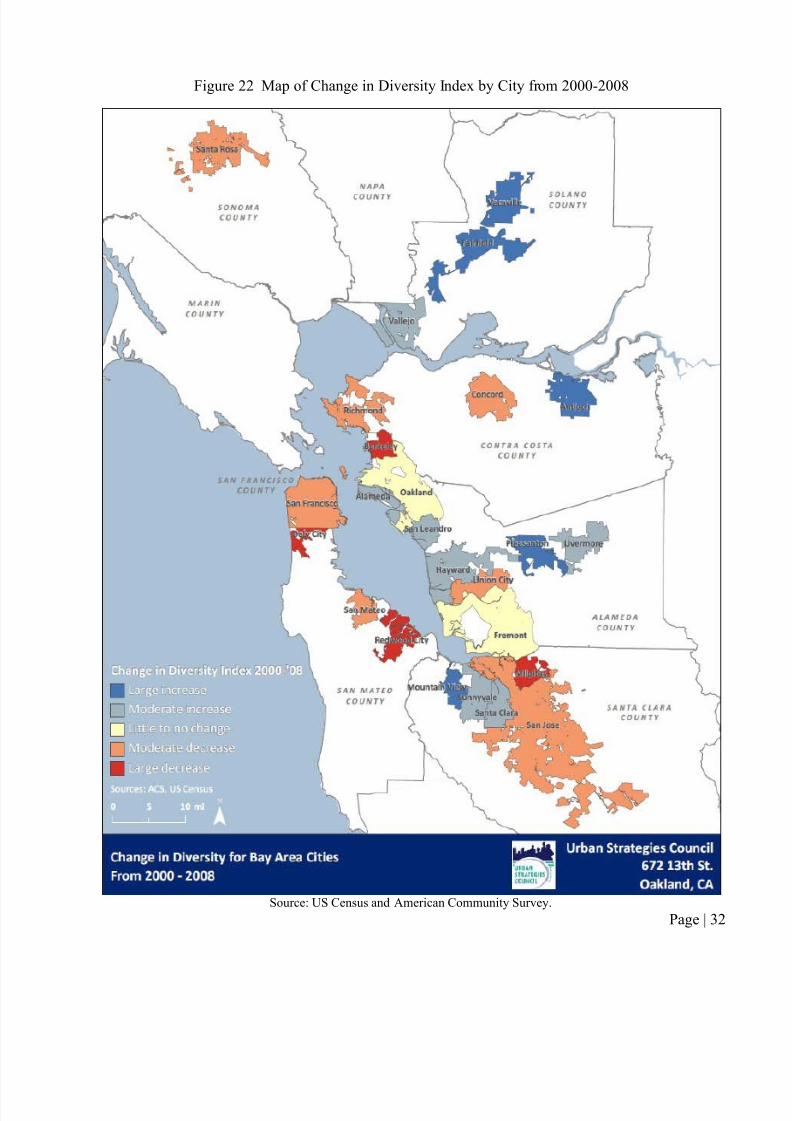
7. City Level Ethnic Diversity
Calculations of the diversity index at the city level were completed for this report; however, these
values were deemed unreliable due to the accuracy of the ACS data at a city level and the
calculation method involved. We have, nevertheless, presented below the changes in ethnic
composition for the cities that lost the most substantial populations of Blacks from 2000 to 2008.
(Note: in these data, the abbreviation OMR refers to Other/Multi-race, while AIAN refers to
American Indian/Alaskan Natives.)
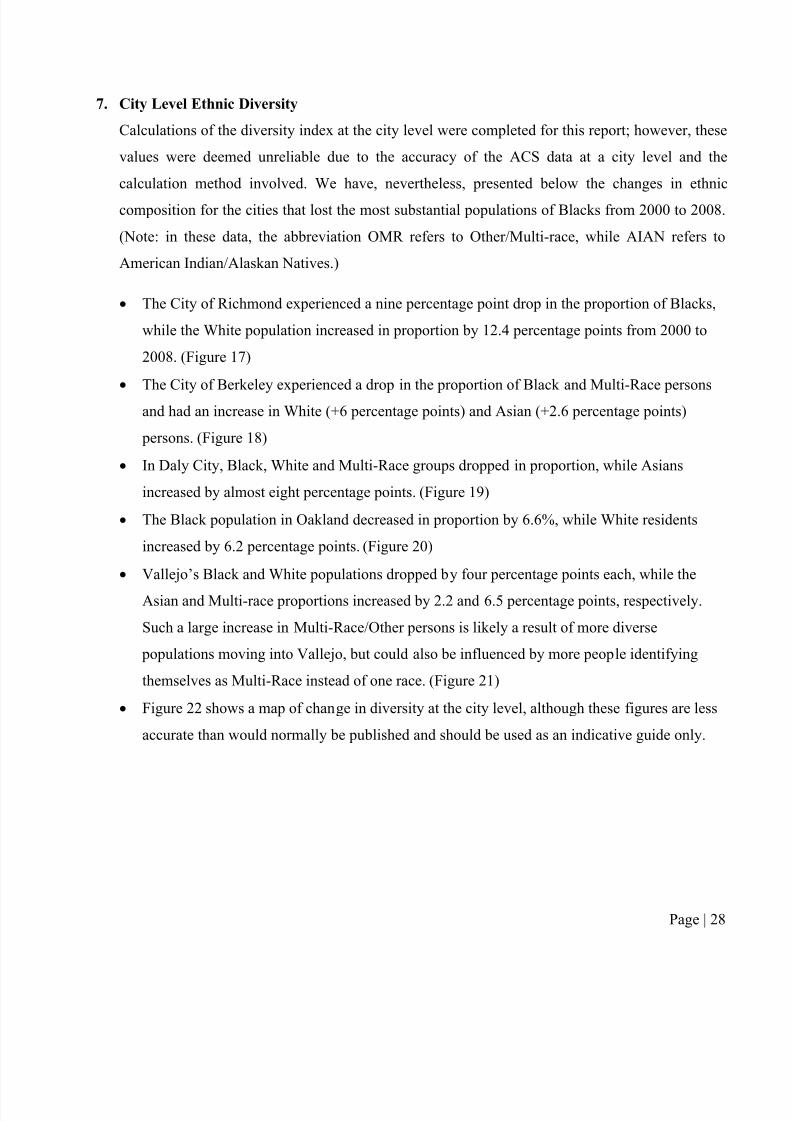
The City of Richmond experienced a nine percentage point drop in the proportion of Blacks,
while the White population increased in proportion by 12.4 percentage points from 2000 to
2008. (Figure 17)
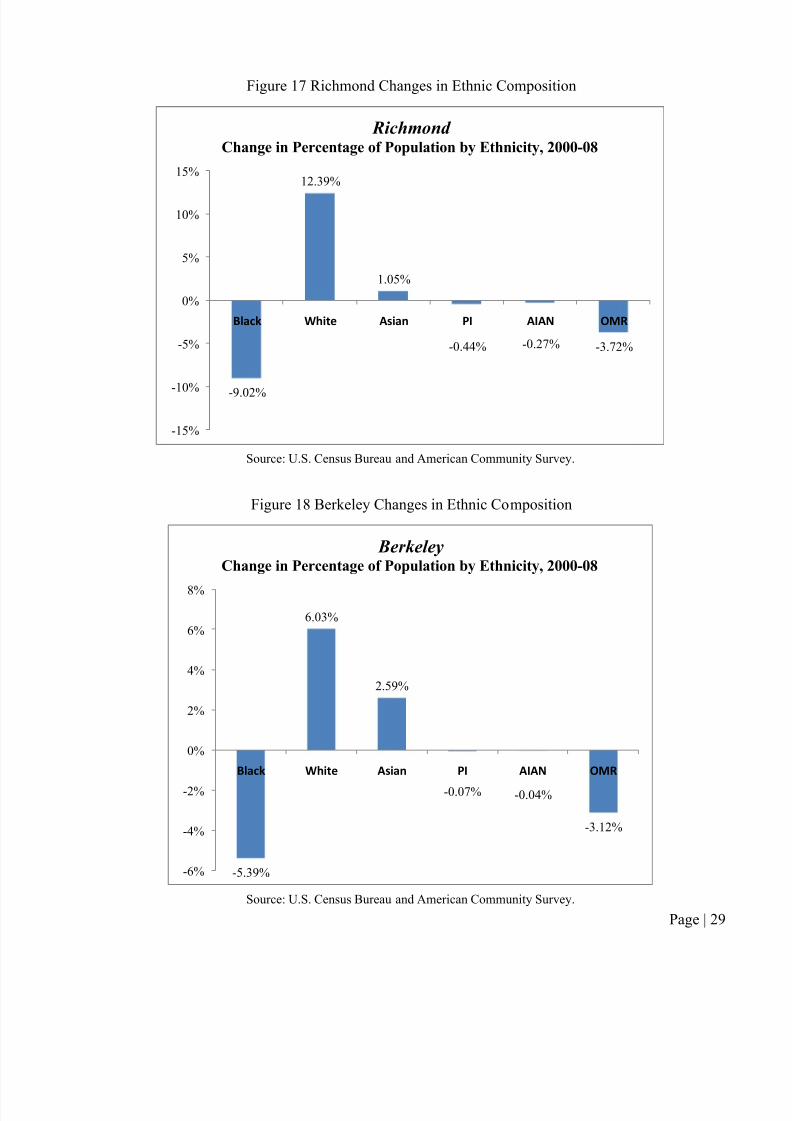
The City of Berkeley experienced a drop in the proportion of Black and Multi-Race persons
and had an increase in White (+6 percentage points) and Asian (+2.6 percentage points) persons. (Figure 18)
In Daly City, Black, White and Multi-Race groups dropped in proportion, while Asians
increased by almost eight percentage points. (Figure 19)
The Black population in Oakland decreased in proportion by 6.6%, while White residents
increased by 6.2 percentage points. (Figure 20)
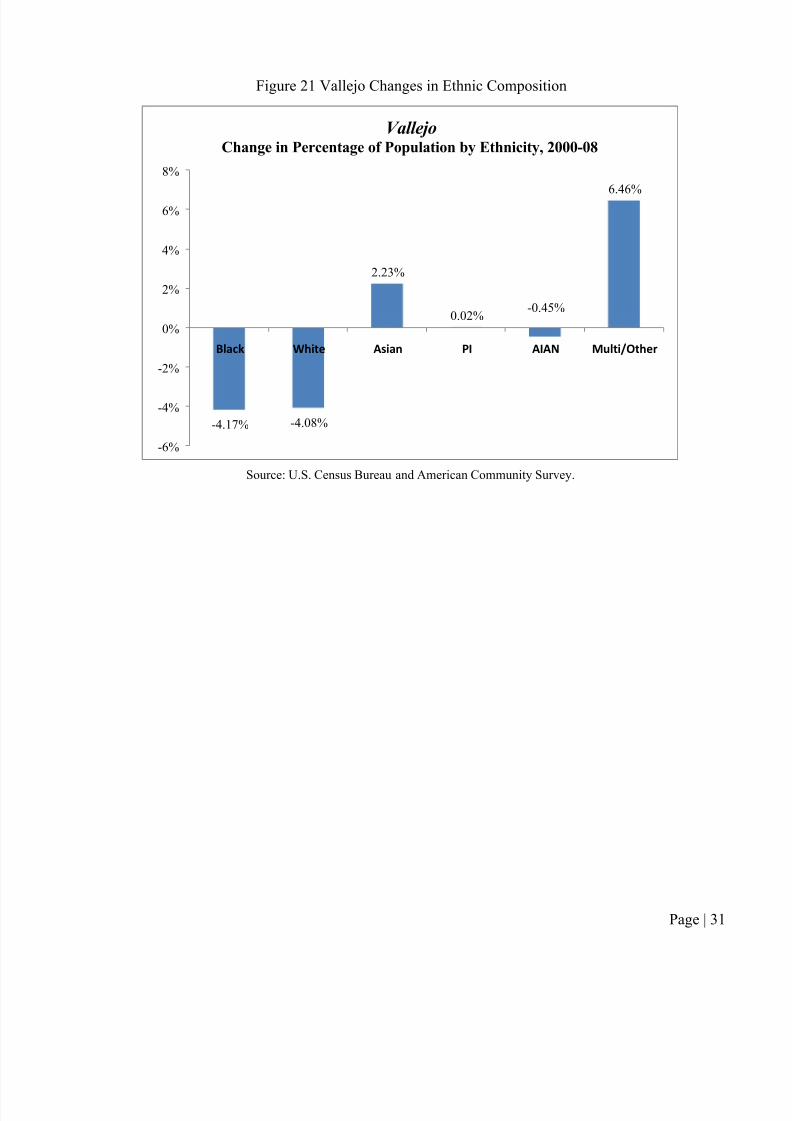
Vallejo’s Black and White populations dropped by four percentage points each, while the
Asian and Multi-race proportions increased by 2.2 and 6.5 percentage points, respectively.
8/8/2019 State of Bay Area Blacks Report Part I
http://slidepdf.com/reader/full/state-of-bay-area-blacks-report-part-i 32/58
Figure 17 Richmond Changes in Ethnic Composition
Source: U.S. Census Bureau and American Community Survey.
Figure 18 Berkeley Changes in Ethnic Composition
-9.02%
12.39%
1.05%
-0.44% -0.27% -3.72%
-15%
-10%
-5%
0%
5%
10%
15%
!"#$% &'()* +,(#- ./ +/+0 123
Richmond Change in Percentage of Population by Ethnicity, 2000-08
8%
BerkeleyChange in Percentage of Population by Ethnicity, 2000-08
8/8/2019 State of Bay Area Blacks Report Part I
http://slidepdf.com/reader/full/state-of-bay-area-blacks-report-part-i 33/58
Figure 19 Daly City Changes in Ethnic Composition
Source: U.S. Census Bureau and American Community Survey.
Figure 20 Oakland Changes in Ethnic Composition
-1.74%
-3.14%
7.69%
0.75% 0.01%
-3.57%
-6%
-4%
-2%
0%
2%
4%
6%
8%
10%
!"#$% &'()* +,(#- ./ +/+0 123
Daly CityChange in Percentage of Population by Ethnicity, 2000-08
6.22%
8%
Oakland
Change in Percentage of Population by Ethnicity, 2000-08
8/8/2019 State of Bay Area Blacks Report Part I
http://slidepdf.com/reader/full/state-of-bay-area-blacks-report-part-i 34/58
Figure 21 Vallejo Changes in Ethnic Composition
Source: U.S. Census Bureau and American Community Survey.
-4.17% -4.08%
2.23%
0.02%-0.45%
6.46%
-6%
-4%
-2%
0%
2%
4%
6%
8%
!"#$% &'()* +,(#- ./ +/+0 24")(51)'*6
Vallejo
Change in Percentage of Population by Ethnicity, 2000-08
8/8/2019 State of Bay Area Blacks Report Part I
http://slidepdf.com/reader/full/state-of-bay-area-blacks-report-part-i 35/58
Figure 22 Map of Change in Diversity Index by City from 2000-2008!
8/8/2019 State of Bay Area Blacks Report Part I
http://slidepdf.com/reader/full/state-of-bay-area-blacks-report-part-i 36/58
6$";<&"*.&5(41;"*A5B%41;"*&C%128#'48''.,&The following section summarizes the Bay Area Black or African-American communities at smaller
geographical levels that represent actual neighborhoods rather than larger administrative regions suchas counties and cities. This phase of our analysis utilized census tract data and identified clusters of
tracts that represent somewhat cohesive neighborhoods. Where possible, we identify these
neighborhoods by their commonly known neighborhood names. Census tracts generally consist of
several hundred to several thousand people. While smaller census boundaries are available, there are
currently no updated data at these levels; hence, we have used the smallest level of detail available to
analyze changes over time. Due to the nature of the demographic data available, most sources
produce only figures for Black and/or African-American persons. In most Bay Area neighborhoods
this grouping is mostly counting African-Americans; however, there are a number of immigrant and
refugee communities in the region with growing populations that include Blacks other than African-
Americans. Obviously this will have some impact on the type of community represented by these
figures and this limitation of the data does justify further study regionally to identify populations of
African or Caribbean immigrants and refugees who have health and social needs that are distinct
from the issues and needs within the traditional African-American community.
8. Neighborhood Level Black Populations
The highest concentrations of Black or African-American populations were in the following
8/8/2019 State of Bay Area Blacks Report Part I
http://slidepdf.com/reader/full/state-of-bay-area-blacks-report-part-i 37/58
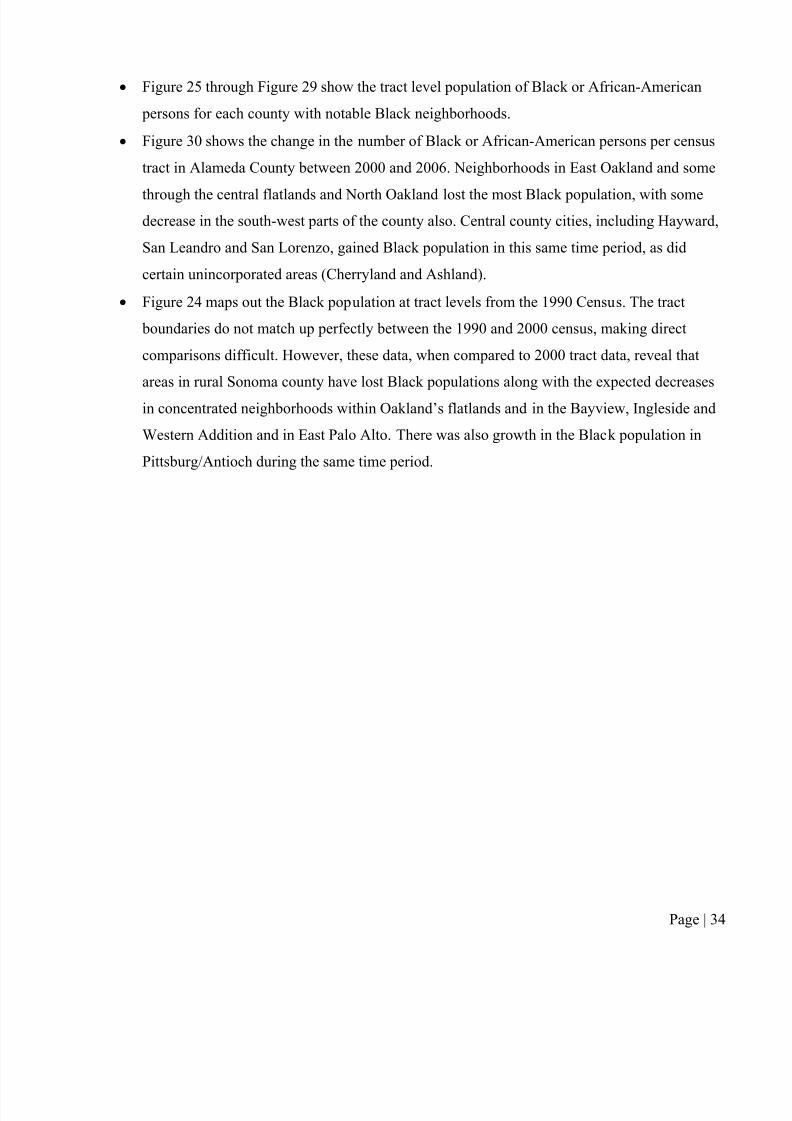
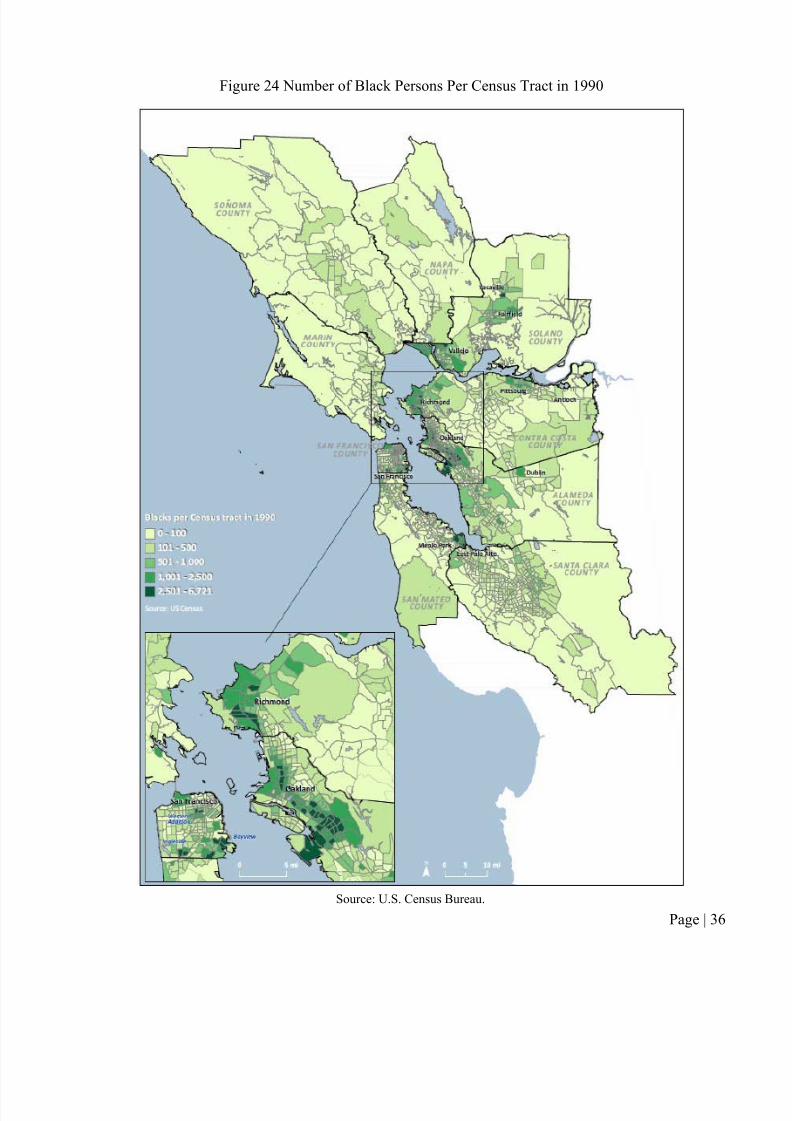
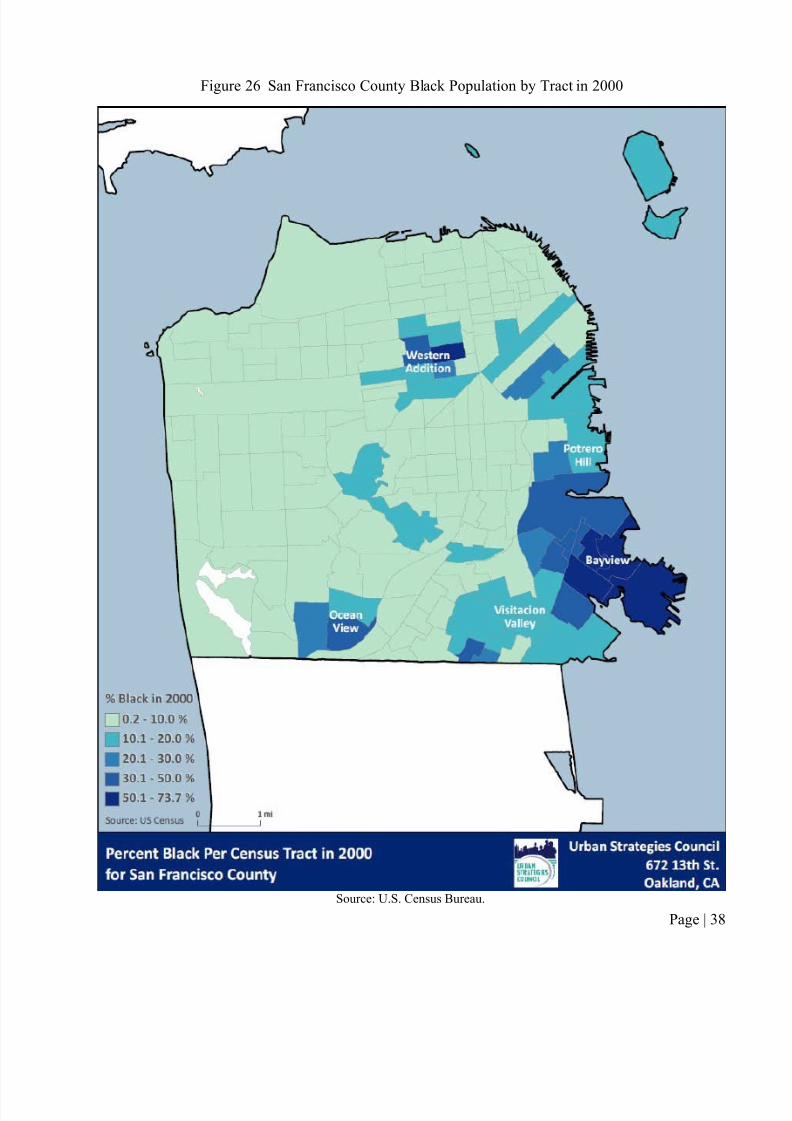
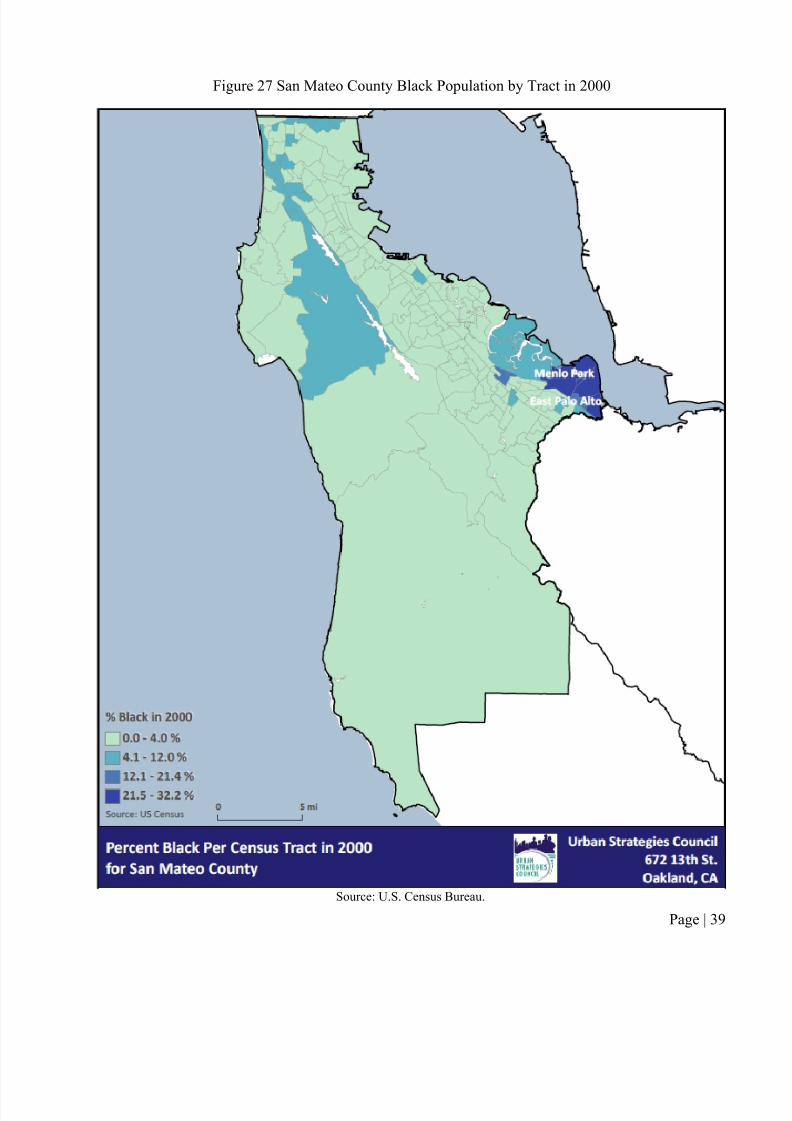
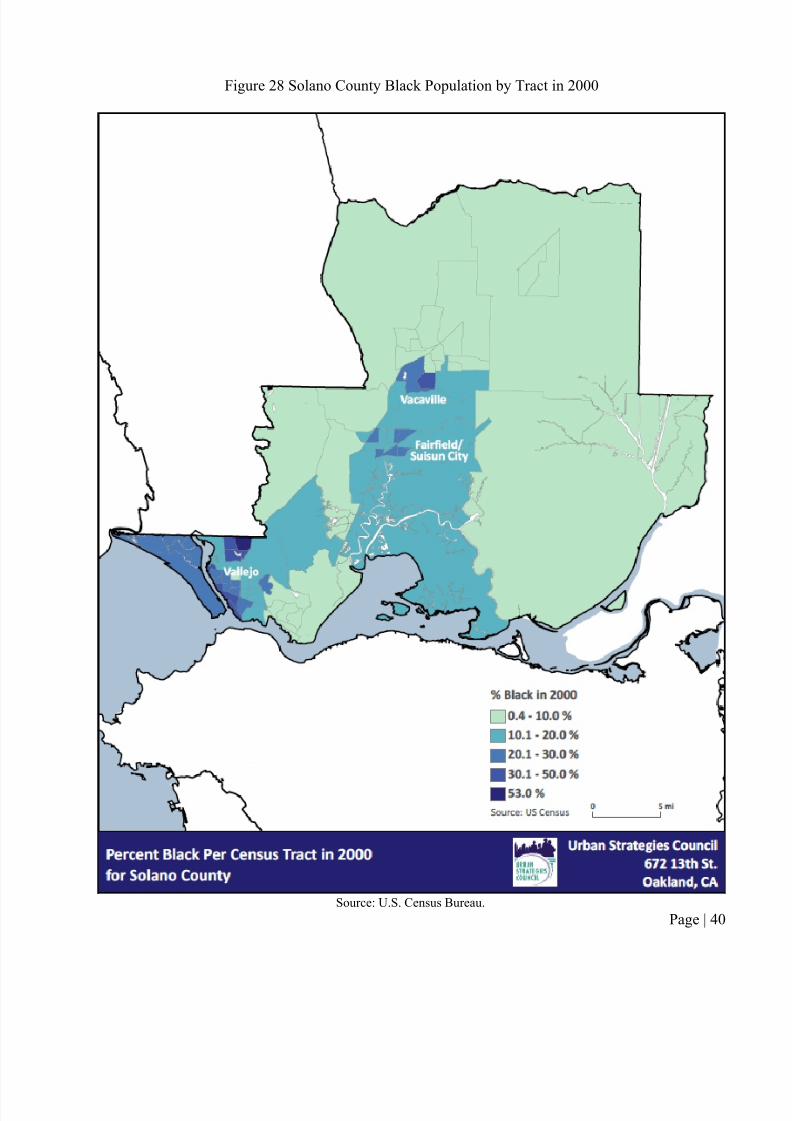
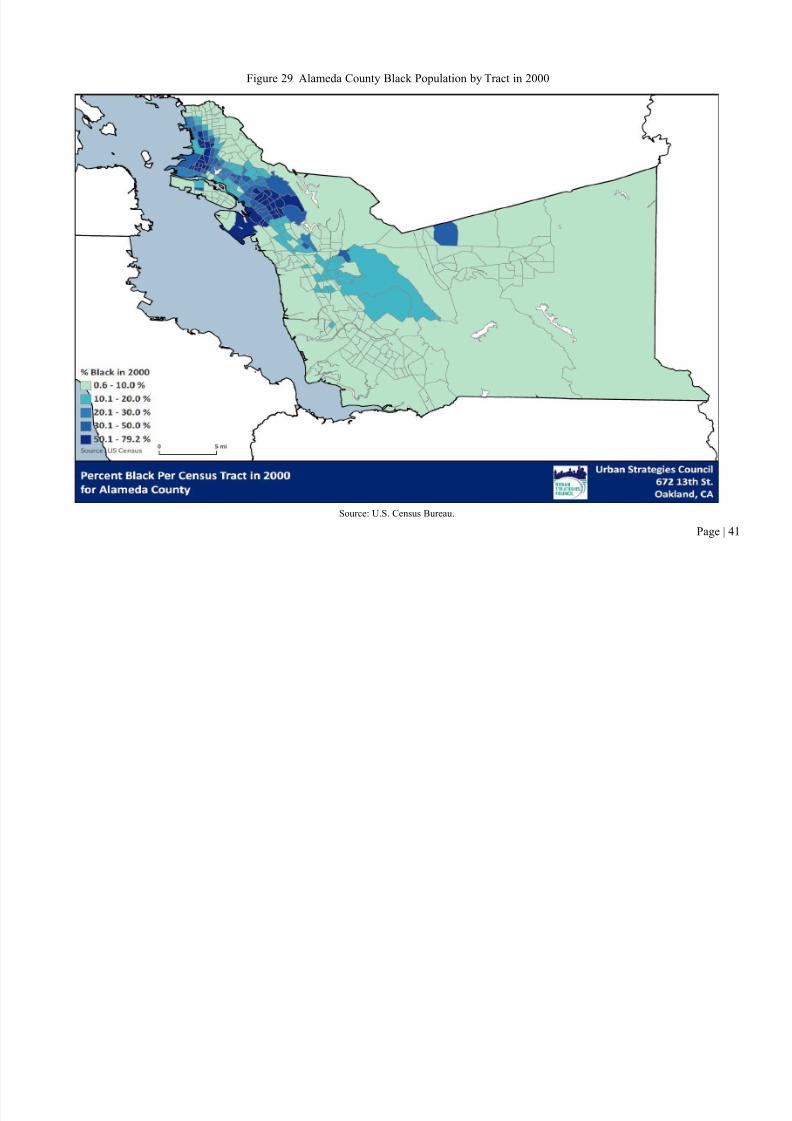
Figure 25 through Figure 29 show the tract level population of Black or African-American
persons for each county with notable Black neighborhoods.
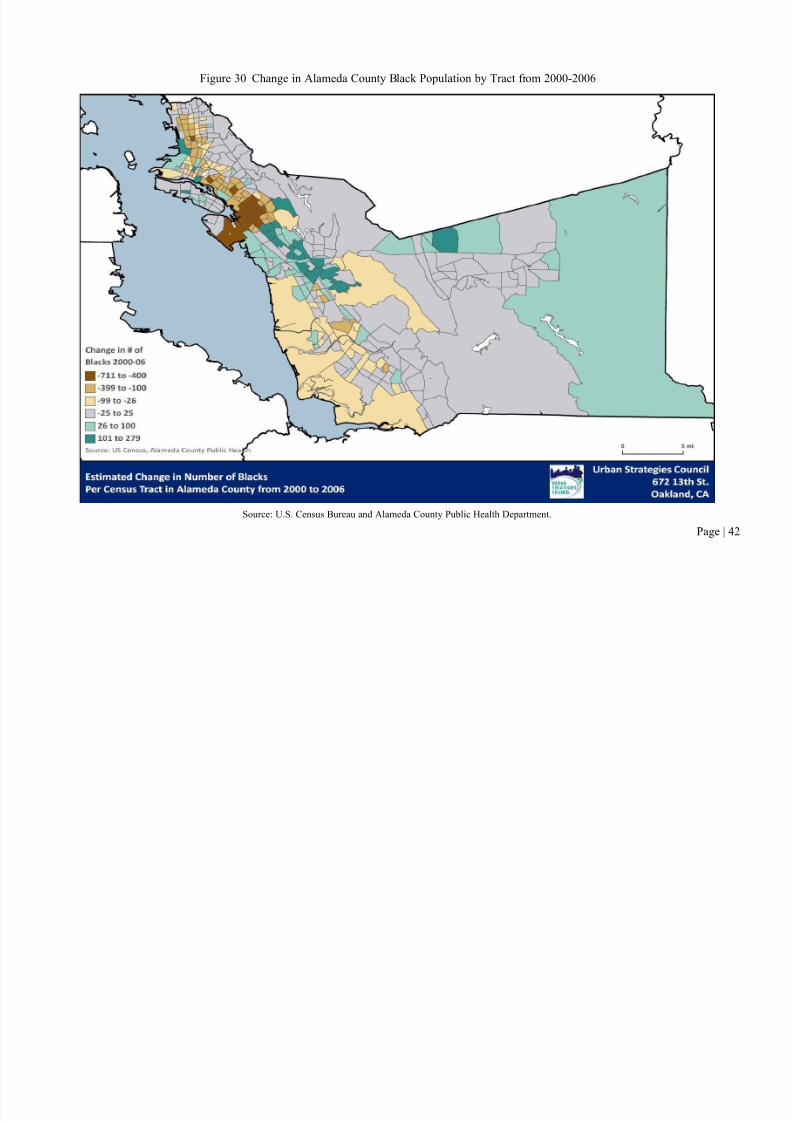
Figure 30 shows the change in the number of Black or African-American persons per censustract in Alameda County between 2000 and 2006. Neighborhoods in East Oakland and some
through the central flatlands and North Oakland lost the most Black population, with some
decrease in the south-west parts of the county also. Central county cities, including Hayward,
San Leandro and San Lorenzo, gained Black population in this same time period, as did
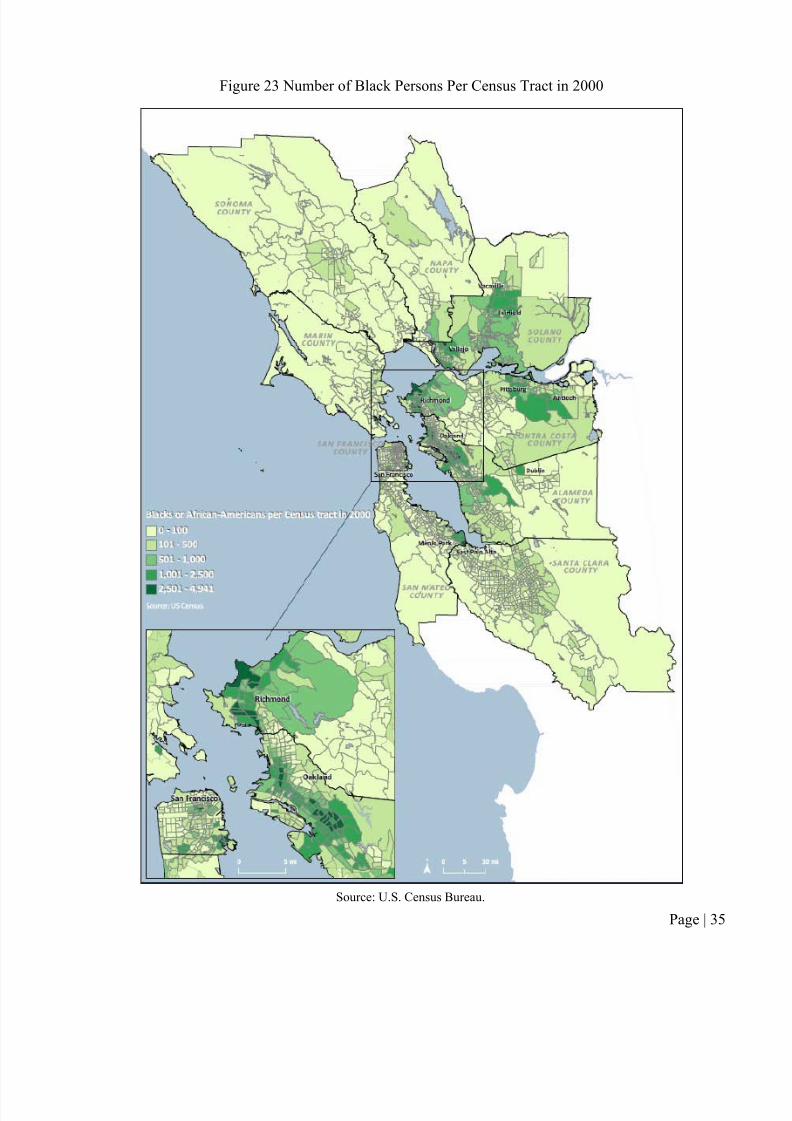
certain unincorporated areas (Cherryland and Ashland). Figure 24 maps out the Black population at tract levels from the 1990 Census. The tract
boundaries do not match up perfectly between the 1990 and 2000 census, making direct
comparisons difficult. However, these data, when compared to 2000 tract data, reveal that
areas in rural Sonoma county have lost Black populations along with the expected decreases
in concentrated neighborhoods within Oakland’s flatlands and in the Bayview, Ingleside and
Western Addition and in East Palo Alto. There was also growth in the Black population in
Pittsburg/Antioch during the same time period.
8/8/2019 State of Bay Area Blacks Report Part I
http://slidepdf.com/reader/full/state-of-bay-area-blacks-report-part-i 38/58
Figure 23 Number of Black Persons Per Census Tract in 2000
8/8/2019 State of Bay Area Blacks Report Part I
http://slidepdf.com/reader/full/state-of-bay-area-blacks-report-part-i 39/58
Figure 24 Number of Black Persons Per Census Tract in 1990
8/8/2019 State of Bay Area Blacks Report Part I
http://slidepdf.com/reader/full/state-of-bay-area-blacks-report-part-i 40/58
Page | 37
Figure 25 Contra Costa County Black Population by Tract in 2000
Source: U.S. Census Bureau.
8/8/2019 State of Bay Area Blacks Report Part I
http://slidepdf.com/reader/full/state-of-bay-area-blacks-report-part-i 41/58
Figure 26 San Francisco County Black Population by Tract in 2000
8/8/2019 State of Bay Area Blacks Report Part I
http://slidepdf.com/reader/full/state-of-bay-area-blacks-report-part-i 42/58
Figure 27 San Mateo County Black Population by Tract in 2000
8/8/2019 State of Bay Area Blacks Report Part I
http://slidepdf.com/reader/full/state-of-bay-area-blacks-report-part-i 43/58
Figure 28 Solano County Black Population by Tract in 2000
8/8/2019 State of Bay Area Blacks Report Part I
http://slidepdf.com/reader/full/state-of-bay-area-blacks-report-part-i 44/58
Page | 41
Figure 29 Alameda County Black Population by Tract in 2000
Source: U.S. Census Bureau.
8/8/2019 State of Bay Area Blacks Report Part I
http://slidepdf.com/reader/full/state-of-bay-area-blacks-report-part-i 45/58
Page | 42
Figure 30 Change in Alameda County Black Population by Tract from 2000-2006
Source: U.S. Census Bureau and Alameda County Public Health Department.
8/8/2019 State of Bay Area Blacks Report Part I
http://slidepdf.com/reader/full/state-of-bay-area-blacks-report-part-i 46/58
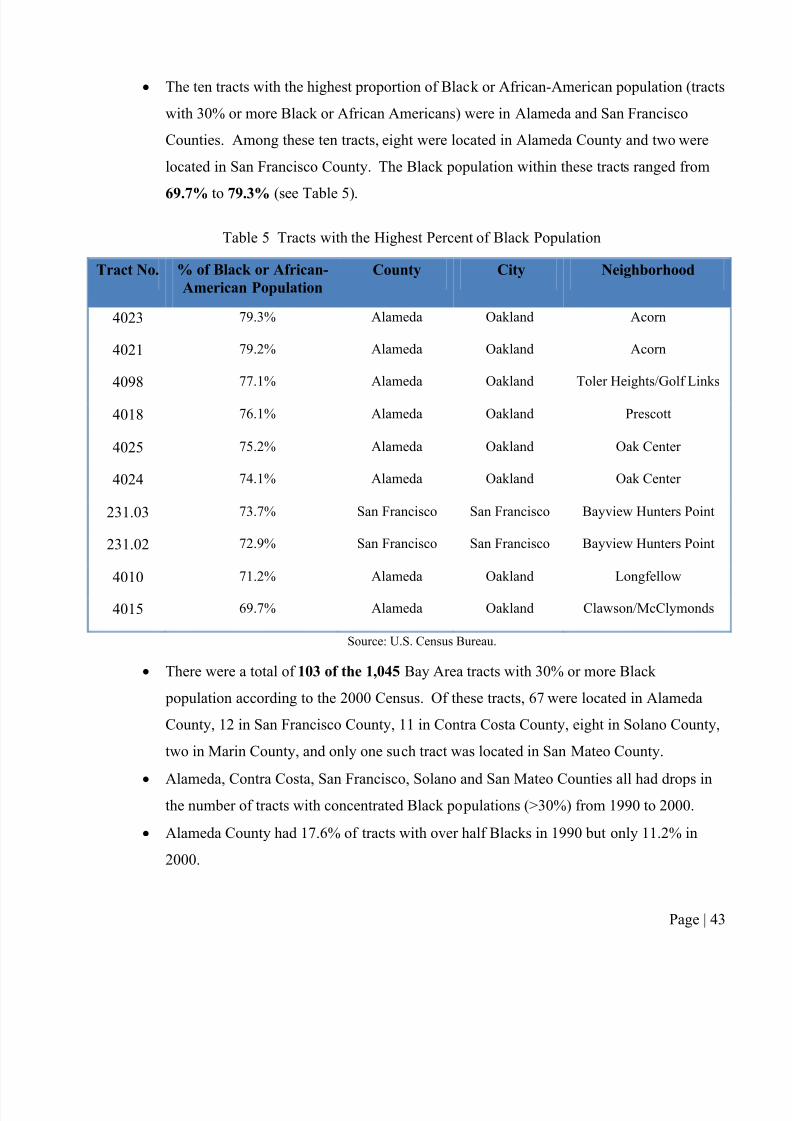
The ten tracts with the highest proportion of Black or African-American population (tracts
with 30% or more Black or African Americans) were in Alameda and San Francisco
Counties. Among these ten tracts, eight were located in Alameda County and two werelocated in San Francisco County. The Black population within these tracts ranged from
69.7% to 79.3% (see Table 5).
Table 5 Tracts with the Highest Percent of Black Population
Tract No. % of Black or African-
American Population
County City Neighborhood
4023 79.3% Alameda Oakland Acorn
4021 79.2% Alameda Oakland Acorn
4098 77.1% Alameda Oakland Toler Heights/Golf Links
401876.1% Alameda Oakland Prescott
4025 75.2% Alameda Oakland Oak Center
4024 74.1% Alameda Oakland Oak Center
231.03 73.7% San Francisco San Francisco Bayview Hunters Point
231.02 72.9% San Francisco San Francisco Bayview Hunters Point
4010 71.2% Alameda Oakland Longfellow
4015 69 7% Alameda Oakland Clawson/McClymonds
8/8/2019 State of Bay Area Blacks Report Part I
http://slidepdf.com/reader/full/state-of-bay-area-blacks-report-part-i 47/58
Table 6 Tracts with Black Population >30% and >50%
County # of Tracts >30%
(Black)
% of Tracts >30%
(Black)
# of Tracts >50%
(Black) % of Tracts
>50% (Black)
1990 2000 1990 2000 1990 2000 1990 2000
Alameda &$ ,' (,#&% ()#"% *+ +, $'#,% $$#(%
Contra Costa 14 11 8.4% 6.6% 8 4 4.8% 2.4%
Marin 2 2 3.9% 3.9% 1 0 2.0% 0.0%
Napa 0 0 0.0% 0.0% 0 0 0.0% 0.0%
San Francisco 15 13 9.9% 7.4% 7 5 4.6% 2.8%
San Mateo 5 1 3.4% 0.7% 3 0 2.0% 0.0%
Santa Clara 0 1 0.0% 0.3% 0 0 0.0% 0.0%
Solano 6 0 8.2% 0.0 1 0 1.4% 0.0%
Sonoma 0 8 0.0% 9.3% 0 1 0.0% 1.2%
Total 123 103 9.6% 7.3% 73 46 5.7% 3.3%
Source: U.S. Census Bureau.
9. Demographics for Selected Black Communities
This section presents some demographic information for the census tracts with the highest
8/8/2019 State of Bay Area Blacks Report Part I
http://slidepdf.com/reader/full/state-of-bay-area-blacks-report-part-i 48/58
Figure 31 Comparison of Home Ownership vs. Rental Housing
Source: U.S. Census Bureau.
0
10
20
30
40
50
60
70
80
90
100
Comparison in Home Ownership vs Rental HousingTen Neighborhoods with Highest % of Black or African-American Population
% House Own by Tract
% House Own by County
% House Rent by Tract
% House Rent by County
8/8/2019 State of Bay Area Blacks Report Part I
http://slidepdf.com/reader/full/state-of-bay-area-blacks-report-part-i 49/58
8/8/2019 State of Bay Area Blacks Report Part I
http://slidepdf.com/reader/full/state-of-bay-area-blacks-report-part-i 50/58
Figure 33 Comparison of Median Income in 1999
$0
$10,000
$20,000
$30,000
$40,000
$50,000
$60,000
Comparison in Median IncomeTen Neighborhoods with Highest % of Black or African-American Population
Median Income by Tract
Median Income by County
8/8/2019 State of Bay Area Blacks Report Part I
http://slidepdf.com/reader/full/state-of-bay-area-blacks-report-part-i 51/58
Figure 34 Comparison in Education Attainment in 2000
0%
5%
10%
15%
20%
25%
30%
35%
40%
45%
50%
Comparison in Education AttainmentTen Neighborhoods with Highest % of Black or African-American Population
% HS Degree by Tract
% HS Degree by County
% Bachelor - Post GraduateDegree by Tract
% Bachelor - Post GraduateDegree by County
8/8/2019 State of Bay Area Blacks Report Part I
http://slidepdf.com/reader/full/state-of-bay-area-blacks-report-part-i 52/58
According to city-data.com, an estimated total of 12.2% (or 5,087) people were in local jails or other
confinement facilities while there were 5.4% (or 2,251) people in federal prisons and detentioncenters. This incarcerated population accounts for the majority of the Black population in this tract
and the City of Dublin.
11. Next Phase of Research
This report presents an initial summary of the changes in the Black and African-American population
across the Bay Area Region. It uses the most reliable information sources available at a regional and
local level; however, much detail is not current at the smallest geographic levels and will be available
only with the release of the 2010 Census and tract level ACS data. With these new data, a much more
current and detailed analysis is being planned. This second phase will delve further into conditions at
a neighborhood level, incorporating more data on community indicators of health, safety, education,
employment and income, environmental conditions and economic development.
8/8/2019 State of Bay Area Blacks Report Part I
http://slidepdf.com/reader/full/state-of-bay-area-blacks-report-part-i 53/58
Page | 50
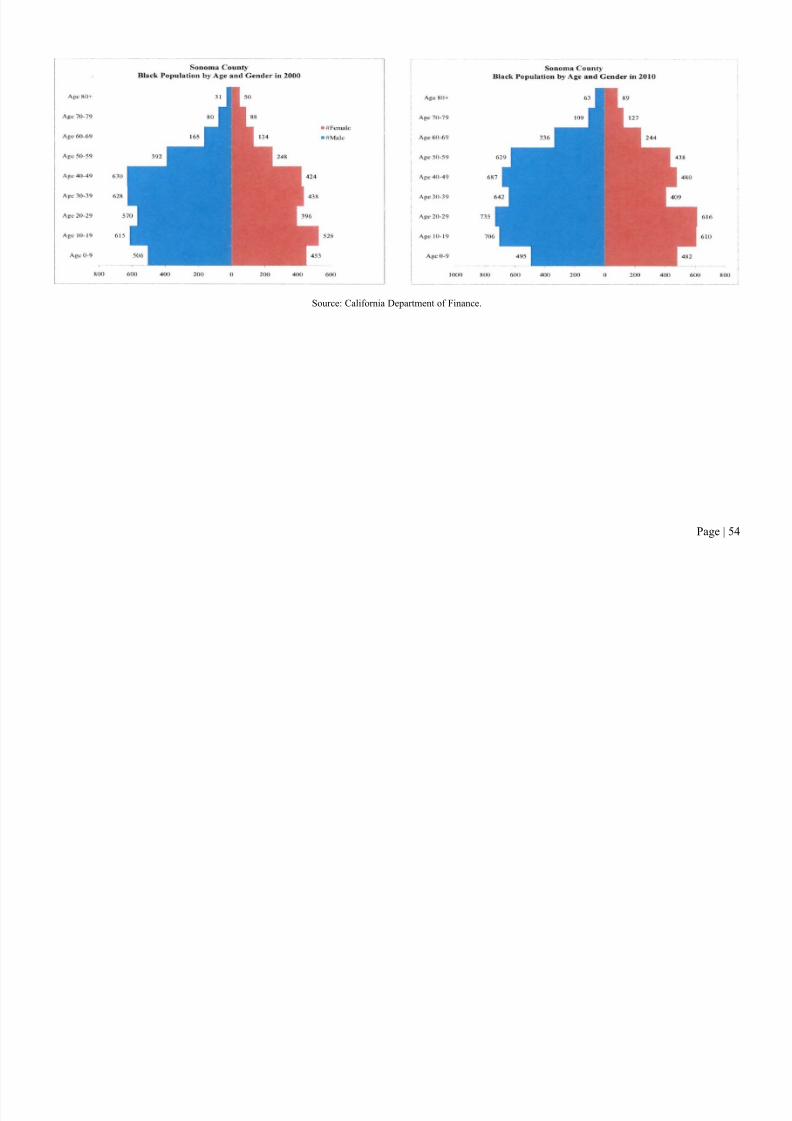
Appendix 1 Age and Gender Profiles for Blacks & African-Americans (Source: DOF)
8/8/2019 State of Bay Area Blacks Report Part I
http://slidepdf.com/reader/full/state-of-bay-area-blacks-report-part-i 54/58
Page | 51
8/8/2019 State of Bay Area Blacks Report Part I
http://slidepdf.com/reader/full/state-of-bay-area-blacks-report-part-i 55/58
Page | 52
8/8/2019 State of Bay Area Blacks Report Part I
http://slidepdf.com/reader/full/state-of-bay-area-blacks-report-part-i 56/58
Page | 53
8/8/2019 State of Bay Area Blacks Report Part I
http://slidepdf.com/reader/full/state-of-bay-area-blacks-report-part-i 57/58
Page | 54
Source: California Department of Finance.

8/8/2019 State of Bay Area Blacks Report Part I
http://slidepdf.com/reader/full/state-of-bay-area-blacks-report-part-i 58/58
Page | 55
Creative Commons Licensing
This report is copyright protected by a new type of licensing system that reflects a diverse range of modern media and use.
Attribution Non-Commercial
This license lets you remix, tweak, and build upon this work non-commercially, and although any new works must also acknowledge UrbanStrategies Council and be non-commercial, you don’t have to license any derivative works on the same terms.