Embed Size (px)
Citation preview

State of Arizona Executive Budget
SUMMARY
FISCAL YEAR 2019
Douglas A. Ducey GOVERNOR
JANUARY 2018
Provisions for Individuals with Disabilities
Individuals who have a disability and require reasonable accommo-dation in order to use this document are encouraged to contact the Governor’s Office of Strategic Planning and Budgeting at 602-542-

Table of Contents
Budget Message
Budget Summary .................................................................................................................................. 3 Budget in a Flash .................................................................................................................................. 7 General Fund Sources and Uses.................................................................................................. 10 Education .............................................................................................................................................. 11 Public Safety ........................................................................................................................................ 15 Health and Welfare ........................................................................................................................... 17 Natural Resources ............................................................................................................................. 20 Government That Works ................................................................................................................ 22 The Economy ....................................................................................................................................... 25 General Fund Revenue Summary ............................................................................................... 29 FY 2019 Executive Budget – All Funds ...................................................................................... 30 General Fund Operating Budget Summary ............................................................................ 33 Other Appropriated Funds Operating Budget Summary ................................................. 35
Other
Resources .............................................................................................................................................. 45 Acknowledgement ............................................................................................................................ 46

The Budget Summary
The FY 2019 Executive Budget puts Arizona’s spirit of service to work investing in education, protecting the most vulnerable, providing a “Second Chance,” and expanding access to our natural treasures, all while balancing the budget.
rizona’s future is without limits. Over the past three years, the Executive has worked with the Legislature to invest in our people, with special attention to K-12 teachers, child
safety workers, law enforcement officers, and firefighters. In the coming fiscal year, we will expand our focus to include men and women who have served a debt to society, and give them a meaningful second chance at success in life.
The Executive has reined in State Government, reducing wasteful regulations and letting Arizonans keep more of the money they have earned. The State has embraced the 21st century sharing economy and disruptive technologies that challenge the status quo, push the boundaries of innovation, and allow new job creators to thrive.
These efforts are key factors in the growth of Arizona’s economy. A combination of prudent belt-tightening initiatives and steadily growing revenues are allowing State Government to balance its budget in FY 2018 and provide a model for responsible decision-making and restraint that will sustain the State’s fiscal health in the years ahead.
The Executive sees steady improvement in Arizona’s outlook, as the state remains a leader across the nation in key economic attributes. The stage has been carefully set for continued expansion throughout the next three years. The FY 2019 Executive Budget seeks to continue Arizona’s positive momentum, providing substantial support for key priorities of the Executive, with K-12 education at the top, while maintaining a structural balance in the State’s General Fund.
FY 2018 Budget Forecast
The Executive forecasts a current fiscal year structural surplus of $6 million and an ending cash balance of $43 million.
FY 2019 Executive Budget
The FY 2019 Executive Budget prioritizes investments in K-12 and addresses important operational needs. General Fund spending will grow by 3.2% while maintaining a structural surplus of $5 million and an ending cash balance of $67 million.
1 Passed by Arizona voters in May 2016, Proposition 123 increases education funding by $3.5 billion over 10 years by allocating money from the General Fund and increasing annual distributions from the State Land Trust.
Education
Arizona’s high-quality K-12 and Higher Education systems are key factors in building a stronger economy, promoting future economic growth, and enhancing the lives of our citizens.
The FY 2019 Executive Budget accelerates the upward trend in funding for education that started with Proposition 1231 and continued with other achievement-oriented strategic investments in teacher pay, Results-Based Funding, early literacy, and construction and repair of public schools. With a focus on ending Recession-era funding cuts, over the next five years the Executive Budget provides $1.4 billion above the baseline budget for public K-12 schools and the State’s three public universities.
K-12 EDUCATION
The FY 2019 Executive Budget dramatically accelerates the State’s K-12 investment and:
• establishes a path to full restoration of Recession-erareductions made to education;
• permanently increases teacher salaries;
• boosts funding for building renewal, and;
• includes targeted investments that close the achievementgap and advance a 21st century curriculum.
End Recession-Era Funding Cuts. The Executive Budget restores suspended Additional Assistance to district and charter schools and fully funds large Joint Technical Education Districts (JTEDs).
$100 Million in New Per-Pupil Funding. The Executive Budget restores a significant portion of the Basic State Aid formula known as District Additional Assistance (DAA) and Charter Additional Assistance (CAA). Those formulas have been partially suspended since the Great Recession, limiting the ability of schools to update such essential items as textbooks, curricula, learning technologies, and school buses. The immediate impact to public schools is $100 million in new, permanent, and flexible funding in FY 2019, or approximately $90 per pupil above enrollment growth and inflation.
A
FY 2019 Executive Budget 3

Full Restoration of $371 Million in DAA and CAA by FY 2023. Beyond the first-year investment of $100 million, the Executive Budget phases in a full restoration of funding to the DAA and CAA formulas by FY 2023 to ultimately grow annual funding for schools by $371 million per year.
Fully Fund Large JTEDs. Also a remnant of the Recession, large JTEDs with a student count above 2,000 have received only 95.5% of their funding formula. The Executive Budget fully funds the formula for large JTEDs, allowing career and technical schools to enhance their course offerings and industry-certified programs.
Permanently Increase Teacher Salaries. The Executive Budget provides an additional $34 million to continue the teacher salary increase that began in FY 2018 and ensures that the full $68 million in teacher salaries becomes permanent by moving that funding into the base level, which is adjusted for inflation each year going forward.
School Construction and Repairs. As the number of Arizona students grows, more learning space is needed. The Executive Budget fully funds the construction or major expansion of five new schools to serve 4,725 more students. Additionally, the Executive Budget provides the largest infusion of building renewal funding since FY 2007, with $51.8 million available in FY 2019 for school districts to maintain their facilities. The Executive Budget also adds $10 million for building renewal in FY 2018.
Targeted Investments. The Executive Budget targets resources to expand education support for children with disabilities and integrate computer science in all grade levels.
Early Intervention for Children with Disabilities. The Arizona State Schools for the Deaf and Blind (ASDB) provides home visits by early-childhood teachers to infants and toddlers who are deaf, hard of hearing, blind, or visually impaired. The Executive Budget expands the program by funding additional teaching positions, which will result in more home visits and educational support, especially to children living in rural areas.
Governor’s Partnership for K-12 Computer Science. Building from (a) technology investments included in the FY 2018 budget for the development of computer science teacher and student curricula and (b) State matching funds for enhanced broadband access at schools, the Executive Budget creates a Computer Science Pilot Program that offers rigorous training and infrastructure to public schools that do not currently offer computer science instruction.
For new K-12 initiatives, the Executive Budget adds a total of $200 million above the $116 million in baseline adjustments for enrollment growth and inflation, after accounting for technical changes of $(102 million) at the School Facilities Board, there would be a net increase of $214 million in new K-12 investments (including the FY 2018 supplemental).
HIGHER EDUCATION
With regard to Arizona’s public universities, developing a world-class higher education system requires ongoing
investment in university research and development. New research infrastructure will encourage innovation and expand economic opportunities for students by attracting high-quality faculty members, who in turn will provide applied learning opportunities for students preparing for their future careers.
The Executive Budget implements the first year of a landmark $1 billion capital funding plan for new research and development infrastructure, including deferred maintenance projects.
In addition, the Executive Budget includes $8 million in one-time General Fund resources to provide more budget flexibility to the universities in addressing high-priority needs and costs associated with Arizona resident students.
Further, the Executive Budget restarts the National Guard Tuition Reimbursement program, which has been inactive since FY 2010, to help Arizona National Guard members pursue a postsecondary degree or certificate.
Health and Welfare
The Executive Budget continues critical investments that support more safe and loving homes for children and protect Arizona’s vulnerable adults and the elderly.
CHILD SAFETY
The Department of Child Safety (DCS) has made significant progress in investigating child welfare reports, improving the quality of preventive in-home services, and reducing the number of children in out-of-home placements.
The number of inactive cases and open reports requiring investigation has reached an all-time low since DCS’s inception. Four months before the July 2017 deadline, DCS met the Legislative benchmark of 1,000 inactive cases and 8,000 open reports, and the Department remains ahead of schedule in meeting caseload targets set for July 2018.
These positive developments are possible because of committed and compassionate DCS caseworkers who have access to improved child placement practices, stronger relationships with foster care agencies and faith-based networks, and unwavering State support of the kinship stipend and foster adoption programs.
Continued success depends on redeveloping DCS’s child welfare data system, which is also funded in the Executive Budget.
VULNERABLE ADULTS
The Executive Budget includes funding to protect vulnerable adults from neglect and abuse.
As the Adult Protective Services caseload at the Department of Economic Security (DES) continues to grow, the Executive Budget expands the program by adding more staff to fully fund caseload growth demands.
The Executive Budget also expands home and community-based services for the elderly, helping our seniors safely remain independent and in their own homes as long as possible.
4 FY 2019 Executive Budget

IMPROVING FOOD SECURITY
While Arizona’s food bank organizations provide assistance to the hungry, their capacity is limited by a lack of refrigeration space or transportation. The Executive Budget provides one-time funding to increase the food bank network’s capacity to accept, distribute, store, and serve more farm-fresh produce and to expand access to healthy foods for low-income families, particularly in rural areas.
Good Government
Consistent with the Executive’s commitment to running State Government “at the speed of business,” the Executive Budget provides funding for a number of good-government initiatives and solutions to important operating needs, including:
• a one-time deposit to strengthen the cash position of theHealth Insurance Trust Fund (HITF);
• continued investment in transforming legacy informationtechnology (IT) systems and enhancing cybersecurity; and
• prioritizing life and safety improvements to capital assetsin the State’s building system.
The Executive Budget also includes state matching funds toleverage federal dollars to build a new National Guard Readiness Center in Tucson that will consolidate Guard assets in southern Arizona and improve training and mobilization readiness.
Finally, the Executive Budget expands funding for preventive road surface maintenance to the highest level in state history.
Public Safety
The Executive’s public safety priorities include continuing to lower the recidivism rate among individuals who have paid their debt to society and are leaving our State prisons; fighting opioid abuse; and hiring more Department of Public Safety (DPS) officers to make Arizona communities safer.
A REAL SECOND CHANCE
Reducing the rate of recidivism (i.e., decreasing the relapse of former inmates into criminal behavior) lowers incarceration costs to the State, enhances public safety, and provides a real “Second Chance” for individuals who have paid their debt to society to become engaged and productive citizens.
The Executive Budget continues support for Second Chance initiatives for inmates while they are in the prison system and after they are released, in the form of:
• additional funding to hire more substance abusecounselors and educational staff; and
• expanding staffing and infrastructure for employmentcenters at multiple Department of Corrections facilities.
2 This line includes $10 million of supplemental funding in FY 2018 for building renewal projects.
OPIOID ENFORCEMENT
The Executive’s 2017 declaration of a statewide emergency to address the growing threat of opioid abuse provides strong evidence of State Government’s commitment to fighting that public epidemic.
The State has already enhanced surveillance of opioid use in Arizona to more quickly identify bad prescription practices. The Executive Budget builds on those efforts by establishing a new Arizona Pharmaceutical Diversion and Drug Theft Task Force within DPS to coordinate with federal, State, and local law enforcement agencies to prevent and disrupt opioid abuse, trafficking, and inappropriate prescriber behavior.
STATE TROOPER FORCE ENHANCEMENT
The Executive sees the need for an increased night-time State Trooper presence to patrol State highways and protect Arizona residents and visitors from wrong-way drivers, drug trafficking, and other threats to public safety.
Natural Resources
Arizona’s 35 State parks continue to play an increasingly significant role in tourism and the economic health of rural Arizona. The Executive Budget strategically reinvests park revenues into the parks system to expand the facilities at Oracle State Park and Buckskin Mountain State Park and meet the ongoing need to maintain existing assets. These investments are critical to economic development in rural Arizona.
Major General Fund Budget Issues, FY 2018 and FY 2019
K-12: Baseline Enrollment Growth and Inflation .... $115.5 million
K-12: Additional Assistance and Other Initiatives ....... 121 million
School Facilities Board: Building Renewal Grants2 .....45.2 million
K-12: Teacher Salary Increase ............................................... 34 million
University Capital Bonding .................................................... 27 million
University Capital and Operational Funding ..................... 8 million
DPS: Border Strike Force Enhancement ........................... 2.9 million
DPS: Wrong-Way Driving Patrol ......................................... 1.4 million
DES: Improving Food Security................................................ 1 million
DEMA: National Guard Tuition Reimbursement .............. 1 million
PROJECTED ENDING BALANCES
FY 2019 .................................................................................... $ 67 million
FY 2020 ........................................................................................ 92 million
FY 2021 ..................................................................................... 200 million
FY 2019 Executive Budget 5

PROJECTED STRUCTURAL BALANCES
FY 2019 ....................................................................................... $ 5 million
FY 2020 ........................................................................................ 29 million
FY 2021 ..................................................................................... 107 million
Sources and Uses of Funds
The General Fund’s Sources and Uses of Funds statement that follows summarizes the Executive Budget in tabular form. The statement presents the following:
• The FY 2017 Preliminary Actual column reflects currently known revenues and expenditures for FY 2017, from the State’s Accounting and Financial Information System.
• FY 2018 Enacted reflects the enacted appropriations.
• The FY 2018 Net Changes column shows Executive’s changes to the enacted appropriations.
• The FY 2018 Executive Budget column shows the Executive’s revenue projections and expenditures.
• The FY 2019 Net Changes column shows Executive’s changes to the enacted appropriations.
• The FY 2019 Executive Budget column shows the Executive’s revenue projections and expenditures.
• The FY 2020 and FY 2021 Net Changes column reflect the changes in those years compared to the prior year for the Executive’s revenue and expenditure projections.
• The FY 2020 and FY 2021 Executive Budget column reflect the Executive’s revenue projections and expenditures.
6 FY 2019 Executive Budget

GEN
ERA
L FU
ND
CA
SH F
LOW
Pr
elim
Act
ual
Exec
utiv
e Bu
dget
Exec
utiv
e Bu
dget
Exec
utiv
e Bu
dget
Exec
utiv
e Bu
dget
FY 2
017
FY 2
018
FY 2
019
FY 2
020
FY 2
021
Begi
nnin
g Ba
lanc
e28
4,01
5,00
0$
15
0,87
1,00
0$
42
,644
,300
$
67
,150
,200
$
92
,325
,900
$
Adj
. Bas
e Re
venu
es9,
358,
542,
000
9,67
0,45
9,00
010
,037
,061
,500
10,4
62,3
63,7
0010
,904
,316
,700
Reve
nue
Chan
ges
-
(11,
500,
000)
55
,000
,000
47
,500
,000
40
,000
,000
One
-tim
e Re
venu
es14
4,36
1,60
061
,558
,700
76,1
03,2
000
0
Tota
l Rev
enue
s9,
786,
918,
600
$
9,87
1,38
8,70
0$
10
,210
,809
,000
$
10,5
77,0
13,9
00$
11
,036
,642
,600
$
Enac
ted
Spen
ding
9,63
6,04
7,60
0$
9,81
5,09
0,90
0$
9,81
5,09
0,90
0$
10,1
43,6
58,8
00$
10,4
84,6
88,0
00$
Base
line
Chan
ges
6,42
7,10
017
0,05
4,00
030
9,55
8,80
028
3,47
8,00
0
Net
New
Initi
ativ
es7,
226,
400
158,
513,
900
31,4
70,4
0068
,922
,600
Tota
l Spe
ndin
g9,
636,
047,
600
$
9,82
8,74
4,40
0$
2.
0%10
,143
,658
,800
$
3.2%
10,4
84,6
88,0
00$
3.
4%10
,837
,088
,600
$
3.4%
Endi
ng B
alan
ce15
0,87
1,00
0$
42,6
44,3
00$
67
,150
,200
$
92,3
25,9
00$
19
9,55
4,00
0$
GEN
ERA
L FU
ND
STR
UCT
URA
L BA
LAN
CE
Prel
im A
ctua
lFo
reca
stFo
reca
stFo
reca
stFo
reca
stFY
201
7FY
201
8FY
201
9FY
202
0FY
202
1O
ngoi
ng R
even
ues2
9,35
8,54
2,00
0$
9,65
8,95
9,00
0$
3.2%
10,0
92,0
61,5
00$
4.5%
10,5
09,8
63,7
00$
4.1%
10,9
44,3
16,7
00$
4.1%
Ong
oing
Spe
ndin
g9,
374,
747,
600
9,65
3,37
9,30
03.
0%10
,087
,237
,300
4.5%
10,4
81,1
88,0
003.
9%10
,837
,088
,500
3.4%
Stru
ctur
al B
alan
ce(1
6,20
5,60
0)$
5,
579,
700
$
4,
824,
200
$
28
,675
,700
$
107,
228,
200
$
1 Year
-ove
r-ye
ar g
row
th c
ompa
res
tota
l spe
ndin
g, in
clud
ing
supp
lem
enta
l app
ropr
iatio
ns, t
o th
e pr
ior y
ear.
Exec
utiv
e Bu
dget
In-A
-Fla
sh
YOY1
% g
row
th
YOY
% g
row
th
GEN
ERA
L FU
ND
STR
UCT
URA
L BA
LAN
CEH
ISTO
RIC
AL R
EVEN
UES
TO
SPE
ND
ING
COM
PARI
SON
OF
REV
ENU
ES T
O S
PEN
DIN
G
- 2.0
4.0
6.0
8.0
10.
0
12.
0
FY 2
009
FY 2
012
FY 2
015
FY 2
018
FY 2
021
Billions
Tota
l GF
Reve
nues
Tota
l GF
Spen
ding
6 5
29
107
(3,0
00)
(3,4
01)
(2,2
03)
(409
)
(364
) (411
) (336
) (36)
(16
)
(4,0
00)
(3,5
00)
(3,0
00)
(2,5
00)
(2,0
00)
(1,5
00)
(1,0
00)
(500
)0
500
FY 2
009
FY 2
012
FY 2
015
FY 2
018
FY 2
021
Millions
9,00
0
9,50
0
10,0
00
10,5
00
11,0
00
11,5
00
FY 2018
FY 2019
FY 2020
FY 2021
Millions O
ngoi
ng R
even
ues
One
-tim
e Re
venu
esO
ngoi
ng S
pend
ing
One
-tim
e Sp
endi
ng
FY 2019 Executive Budget 7

2 Incl
udes
enh
ance
d re
venu
e fr
om a
dditi
onal
Dep
artm
ent o
f Rev
enue
aud
itors
, col
lect
ors,
and
frau
d pr
even
tion
in F
Y 20
19 to
FY
2021
.
GEN
ERA
L FU
ND
SPE
ND
ING
New
FY
2018
Spe
ndin
g:13
,653
,500
$
New
FY
2019
Spe
ndin
g:32
8,56
7,90
0$
Prel
im A
ctua
lEx
ecut
ive
Budg
etBa
selin
e A
djus
tmen
tsN
ew In
itia
tive
sEx
ecut
ive
Budg
et
FY 2
017
FY 2
018
FY 2
019
FY 2
019
FY 2
0193
Educ
atio
n4,
086,
457,
000
$
4,
226,
958,
400
$
11
5,50
4,20
0$
14
9,90
0,00
0$
4,
492,
362,
600
$
6.
3%
AH
CCCS
1,75
0,94
1,40
01,
775,
264,
100
71,0
13,5
00(5
4,07
7,80
0)1,
792,
199,
800
1.0%
Corr
ectio
ns1,
046,
689,
500
1,06
7,62
4,80
030
,000
,000
(2,8
10,4
00)
1,09
4,81
4,40
02.
5%
Uni
vers
ities
69
8,47
2,40
070
4,81
9,70
011
,999
,100
8,00
0,10
072
4,81
8,90
02.
8%
Econ
omic
Sec
urity
538,
272,
200
586,
110,
300
29,9
84,0
0016
,212
,700
632,
307,
000
7.9%
Child
Saf
ety
379,
179,
400
379,
790,
800
8,83
7,60
00
388,
628,
400
2.3%
Scho
ol F
acili
ties
Boar
d22
8,09
4,40
030
2,28
6,60
0(1
01,6
60,9
00)
40,4
67,8
0023
1,09
3,50
0-2
3.6%
Judi
ciar
y11
3,01
7,70
011
0,71
8,70
033
9,20
041
3,00
011
1,47
0,90
00.
7%
Publ
ic S
afet
y12
1,19
5,70
010
9,61
4,20
0(1
,200
,000
)(8
31,9
00)
107,
582,
300
-1.9
%
Hea
lth S
ervi
ces
86,5
53,6
0087
,669
,400
0(1
,250
,000
)86
,419
,400
-1.4
%
Oth
er58
7,17
4,30
047
7,88
7,40
05,
237,
300
2,49
0,40
048
1,96
1,60
00.
9%
Tota
l9,
636,
047,
600
$
9,82
8,74
4,40
0$
A
170,
054,
000
$
B
158,
513,
900
$
C
10,1
43,6
58,8
00$
3.
2%
GEN
ERA
L FU
ND
SPE
ND
ING
DIS
TRIB
UTI
ON
, FY
2009
to F
Y 20
19 (b
illio
ns)
YOY
% g
row
th
3 The
amou
nts
in th
e FY
201
9 Ex
ecut
ive
Budg
et c
olum
n ar
e no
t equ
al to
the
sum
of t
he F
Y 20
18 a
nd o
ther
FY
2019
col
umns
bec
ause
of s
uppl
emen
tals
incl
uded
in F
Y 20
18 th
at a
re c
onsi
dere
d on
e-tim
e sp
endi
ng a
nd n
ot n
eces
saril
y ca
rrie
d in
to F
Y 20
19. F
or
GEN
ERA
L FU
ND
SPE
ND
ING
DIS
TRIB
UTI
ON
, FY
2009
to F
Y 20
19
42%
21%
10%
11
%
8%
9%
44%
19%
11%
7%
10%
9%
0%5%10%
15%
20%
25%
30%
35%
40%
45%
50%
K-12
Edu
catio
nAH
CCCS
& D
HS
Corr
ectio
nsU
nive
rsiti
esD
ES &
DCS
Oth
er
FY 2
009
Enac
ted
Budg
et ($
9.9B
)FY
201
9 Ex
ecut
ive
Budg
et ($
10.1
B)
The
Exec
utiv
e Bu
dget
allo
ws
for
Gen
eral
Fun
d sp
endi
ng to
gro
w b
y 3.
2% in
FY
2019
, whi
ch is
less
than
th
e 3.
7% fo
reca
sted
infla
tion
(2.0
%)
plus
pop
ulat
ion
grow
th (1
.7%
).
4.1
2.0
0.9
1.
1
0.8
0.
9
4.5
1.9
1.1
0.7
1.0
0.
9
0.0
0.5
1.0
1.5
2.0
2.5
3.0
3.5
4.0
4.5
5.0
K-12
Edu
catio
nAH
CCCS
& D
HS
Corr
ectio
nsU
nive
rsiti
esD
ES &
DCS
Oth
er
$
FY 2
009
Enac
ted
Budg
et ($
9.9B
)FY
201
9 Ex
ecut
ive
Budg
et ($
10.1
B)
8 FY 2019 Executive Budget

GEN
ERA
L FU
ND
SPE
ND
ING
BRE
AKD
OW
N
HEA
LTH
AN
D W
ELFA
REO
THER
CH
AN
GES
$5.6
M F
Y 20
19 B
asel
ine
CHIL
D S
AFE
TY$3
.5M
Secr
etar
y of
Sta
te$8
.8M
FY
2019
Bas
elin
e $1
.2M
Land
Dep
artm
ent
$8.8
MAd
optio
n Se
rvic
es$1
.1M
Com
mun
ity C
olle
ges
$0.3
MJu
dici
ary
ECO
NO
MIC
SEC
URI
TY($
0.6M
)Al
l Oth
er, N
et B
asel
ine
K-12
AN
D H
IGH
ER E
DU
CATI
ON
$30M
FY
2019
Bas
elin
e $1
.7M
FY
2019
Init
iati
ve
$33.
2MD
DD
Cas
eloa
d &
Cap
itatio
n G
row
th$1
0MH
ealth
Insu
ranc
e Tr
ust F
und,
Age
ncy
Prem
ium
sD
EPA
RTM
ENT
OF
EDU
CATI
ON
$8.8
MD
DD
Str
uctu
ral S
hort
falls
$2.1
MRe
stor
ativ
e Po
pula
tion
Fund
ing
$116
M F
Y 20
19 B
asel
ine
($12
M)
Tech
nica
l Adj
ustm
ents
$1M
Nat
iona
l Gua
rd T
uitio
n Re
imbu
rsem
ent
$113
.4M
Infla
tion
Adju
stm
ent
$16.
2M F
Y 20
19 In
itia
tive
$5
.2M
All O
ther
Initi
ativ
e In
crea
ses
$81.
8MEn
rollm
ent G
row
th$1
5.2M
Inte
grat
ion
of C
RS C
osts
for D
D in
to D
ES D
DD
($16
.6M
)Al
l Oth
er S
avin
gs a
nd O
ffset
s$1
5.6M
Hig
her A
vera
ge C
ost P
er P
upil
$1M
Impr
ovin
g H
ealth
y Ea
ting
Opt
ions
($0.
4M)
Rem
ove
One
-Tim
e FY
201
8 Ap
prop
riatio
ns($
41.4
M)
Incr
ease
d Pe
rman
ent F
und
Dis
trib
utio
nsA
HCC
CSO
VER
ALL
SPE
ND
ING
($53
.5M
)Pr
oper
ty T
axes
from
New
Con
stru
ctio
n$7
1M F
Y 20
19 B
asel
ine
$170
M F
Y 20
19 N
et B
asel
ine
$149
.9M
FY
2019
Init
iati
ve
$71M
Enro
llmen
t Gro
wth
and
Fun
d O
ffset
s$4
48M
Base
line
Incr
ease
s$1
00M
Incr
ease
Add
ition
al A
ssis
tanc
e($
54.1
M) F
Y 20
19 In
itia
tive
($
278M
)Ba
selin
e D
ecre
ases
$34M
Addi
tiona
l Tea
cher
Sal
ary
Incr
ease
($0.
2M)
AIH
P Ba
se M
odifi
catio
n$1
59M
FY
2019
Net
New
Init
iati
ve$5
.3M
Info
rmat
ion
Tech
nolo
gy P
roje
ct($
1M)
Out
of C
ontr
act B
HS
Inpa
tient
Fac
ilitie
s$2
37M
Initi
ativ
e In
crea
ses
$4M
Early
Lite
racy
Fun
ding
($2.
5M)
End
Prio
r Qua
rter
Cov
erag
e($
79M
)In
itiat
ive
Dec
reas
es$2
.5M
Com
pute
r Sci
ence
Pilo
t Pro
gram
($15
.2M
)Tr
ansf
er D
D C
RS fu
ndin
g to
DES
$2M
Fully
Fun
d La
rge
JTED
s($
35.2
M)
Real
loca
te P
rop
204
Prot
ectio
n an
d M
SA to
BH
S$3
29M
Tot
al N
ew S
pend
ing
$1.1
MAr
izon
a Ac
adem
ic S
tand
ards
Req
uire
men
ts$1
MM
anda
ted
Stat
ewid
e As
sess
men
tsPU
BLIC
SA
FETY
SCH
OO
L FA
CILI
TIES
BO
ARD
DEP
ART
MEN
T O
F PU
BLIC
SA
FETY
($10
1.7M
) FY
2019
Bas
elin
e ($
1.2M
) FY
2019
Bas
elin
e ($
49M
)Pr
ior Y
ear N
ew S
choo
l Con
stru
ctio
n($
1.2M
)Ba
ck O
ut F
Y 20
18 O
ne-T
ime
Fund
ing
($35
.5M
)N
ew S
choo
l Fac
ilitie
s D
ebt S
ervi
ce($
0.8M
) FY
2019
Init
iati
ve
($17
.2M
)Ba
ck o
ut F
Y18
Build
ing
Rene
wal
Gra
nts
$2.9
MBo
rder
Str
ike
Forc
e En
hanc
emen
t$4
0.5M
FY
2019
Init
iati
ve
$1.4
MW
rong
Way
Driv
ing
Patr
ol$0
.2M
Addi
tiona
l Sta
ff($
5.2M
)Re
allo
catio
n of
Res
ourc
es$5
.1M
New
Sch
ool C
onst
ruct
ion
$35.
2MBu
ildin
g Re
new
al G
rant
sCO
RREC
TIO
NS
$30M
FY
2019
Bas
elin
e U
NIV
ERSI
TIES
$30M
Inm
ate
Hea
lth C
are
SLI F
undi
ng A
djus
tmen
t$1
2M F
Y 20
19 B
asel
ine
FY
2019
Bas
elin
e ($
2.8M
) FY
2019
Init
iati
ve
$27M
Infr
astr
uctu
re B
onds
($2.
8M)
Priv
ate
Pris
on C
apac
ity C
ap($
0M)
Rese
arch
Infr
astr
uctu
re R
efin
ance
($15
M)
Rem
ove
One
-Tim
e FY
201
8 Ap
prop
riatio
ns$8
M F
Y 20
19 In
itia
tive
$8
MAd
ditio
nal I
nves
tmen
t
4 The
($10
1M) i
n Ba
selin
e A
djus
tmen
ts fo
r Sch
ool F
acili
ties
Boar
d re
flect
the
rem
oval
of o
ne-t
ime
fund
ing
in F
Y 20
18 a
nd re
tired
deb
t ser
vice
on
cons
truc
tion
of n
ew s
choo
ls th
at o
ccur
red
in th
e 20
00s.
KEY
HIG
HLI
GH
TS
exam
ple,
the
Exec
utiv
e Bu
dget
incl
udes
$4.
1M in
FY
2018
for t
he D
epar
tmen
t of F
ores
try
and
Fire
Man
agem
ent;
this
am
ount
is n
ot c
ontin
ued
in F
Y 20
19.
80%
of n
ew E
xecu
tive
Initi
ativ
e sp
endi
ng is
goi
ng to
K-1
2 Ed
ucat
ion
•$2
00M
abo
ve th
e Ed
ucat
ion
base
line,
incl
udin
g $1
00M
in n
ew,
perm
anen
t, an
d fle
xibl
e pe
r-pu
pil f
undi
ng a
s pa
rt o
f a 5
-yea
r, $3
71M
rest
orat
ion
of R
eces
sion
-era
cut
s
FY 2019 Executive Budget 9
FY 1
7FY
18
FY 1
8FY
18
FY 1
9FY
19
FY 2
0FY
20
FY 2
1FY
21
Prel
im A
ctua
lEn
acte
dN
et C
hang
esEx
ecut
ive
Budg
etN
et C
hang
esEx
ecut
ive
Budg
etN
et C
hang
esEx
ecut
ive
Budg
etN
et C
hang
esEx
ecut
ive
Budg
et
SOU
RCES
OF
FUN
DS
Begi
nnin
g Ba
lanc
e28
4,01
517
0,97
715
0,87
142
,644
67,1
5092
,326
Ong
oing
Rev
enue
sBa
se R
even
ues
10,0
22,1
2410
,354
,237
10,3
51,2
2910
,711
,866
11,1
59,4
1411
,625
,361
Urb
an R
even
ue S
harin
g(6
63,5
82)
(680
,770
)(6
80,7
70)
(674
,804
)(6
97,0
50)
(721
,044
)A
djus
ted
Base
Rev
enue
s9,
358,
542
9,67
3,46
79,
670,
459
10,0
37,0
6110
,462
,364
10,9
04,3
17Tr
ansf
ers
& N
ewly
Ena
cted
Cha
nges
144,
362
8,17
350
,059
131,
103
47,5
0040
,000
Post
Bud
get T
ax L
aw C
hang
es0
0(1
1,50
0)0
00
HIT
F Tr
ansf
er78
,900
00
00
0D
HS
BHS
Tran
sfer
Sav
ings
35,0
000
00
00
Pres
crip
tion
Dru
g Re
bate
Tra
nsfe
r30
,000
00
00
0Pr
evio
usly
Ena
cted
Fun
d Tr
ansf
ers
462
8,17
38,
173
00
0N
ew F
und
Tran
sfer
s0
053
,386
76,1
030
0Ta
x Re
duct
ions
00
00
(7,5
00)
(15,
000)
Incr
eae
Frau
d Pr
even
tion
00
030
,000
30,0
0030
,000
DO
R A
udito
rs a
nd C
olle
ctor
s0
00
25,0
0025
,000
25,0
00Su
btot
al R
even
ues
9,50
2,90
49,
681,
639
9,72
0,51
810
,168
,165
10,5
09,8
6410
,944
,317
TOTA
L SO
URC
ES O
F FU
ND
S9,
786,
919
9,85
2,61
69,
871,
389
10,2
10,8
0910
,577
,014
11,0
36,6
43
USE
S O
F FU
ND
S
Ope
rati
ng B
udge
t A
ppro
pria
tion
s9,
426,
465
9,71
5,49
316
,354
9,73
1,84
631
6,41
110
,031
,904
355,
609
10,3
87,5
1234
6,89
710
,734
,409
Oth
er E
xpen
ses/
(Rev
enue
s)20
9,58
299
,598
(2,7
00)
96,8
9812
,157
111,
755
(14,
579)
97,1
765,
504
102,
680
Capi
tal O
utla
y18
,000
5,70
00
5,70
0(1
,878
)3,
822
(3,8
22)
00
0Re
nt In
crea
se0
00
01,
878
1,87
80
1,87
80
1,87
8Co
unty
Bas
e D
istr
ibut
ion
14,0
016,
001
06,
001
06,
001
06,
001
06,
001
DJC
Loc
al C
ost-
Shar
ing
Offs
et0
8,00
00
8,00
0(8
,000
)0
00
00
Pina
l/Yav
apai
/Moh
ave
Dis
trib
utio
n0
1,65
00
1,65
0(1
,650
)0
00
00
IT P
ro-R
ata
00
00
686
686
068
60
686
AD
E -
Stud
ent L
ongi
tudi
nal D
S &
ELA
S7,
300
7,30
00
7,30
0(7
,300
)0
00
00
CHIL
DS
Repl
acem
ent:
Gua
rdia
n7,
582
5,00
00
5,00
09,
460
14,4
60(9
,460
)5,
000
05,
000
Sale
/ Le
ase-
Back
Lea
se-P
urch
ase
Paym
ent
84,1
1784
,115
084
,115
(3)
84,1
127
84,1
190
84,1
19Ri
o N
uevo
Pay
men
t10
,000
10,0
000
10,0
000
10,0
000
10,0
000
10,0
00Ci
vic
Cent
er P
aym
ent
20,4
4922
,499
022
,499
022
,499
497
22,9
9650
423
,500
Tran
spor
tatio
n Fu
ndin
g86
,500
00
00
00
00
0Re
tirem
ent R
ate
Adj
ustm
ents
00
00
31,4
6531
,465
5,00
036
,465
5,00
041
,465
FY 2
018
HIT
F Su
ppor
t0
00
0(2
4,98
4)(2
4,98
4)0
(24,
984)
0(2
4,98
4)FY
201
9 A
genc
y Pr
emiu
m S
uppo
rt0
00
09,
994
9,99
4(9
,994
)0
00
Reve
rt S
peci
al E
lect
ion
Mon
ies
00
00
(2,9
63)
(2,9
63)
2,96
30
00
Tran
spor
tatio
n Re
vers
ion
00
00
(230
)(2
30)
230
00
0Ba
cklo
g Pr
ivat
izat
ion
Reve
rsio
n0
0(2
,700
)(2
,700
)0
00
00
0Ef
ficie
ncy
Savi
ngs
0(1
0,00
0)0
(10,
000)
10,0
000
00
00
Adm
inis
trat
ive
Adj
ustm
ents
116,
287
100,
000
010
0,00
00
100,
000
010
0,00
00
100,
000
Una
lloca
ted
Adj
ustm
ent
016
016
016
016
016
Reve
rtm
ents
(154
,653
)(1
40,6
83)
0(1
40,6
83)
(4,3
18)
(145
,000
)0
(145
,000
)0
(145
,000
)
TOTA
L U
SES
OF
FUN
DS
9,63
6,04
89,
815,
091
13,6
549,
828,
744
328,
568
10,1
43,6
5934
1,02
910
,484
,688
352,
401
10,8
37,0
89
END
ING
BA
LAN
CE15
0,87
137
,525
42,6
4467
,150
92,3
2619
9,55
4
Ong
oing
Rev
enue
s9,
358,
542
9,67
3,46
79,
658,
959
10,0
92,0
6110
,509
,864
10,9
44,3
17O
ngoi
ng E
xpen
ditu
res
9,37
4,74
89,
653,
379
9,65
3,37
910
,087
,237
10,4
81,1
8810
,837
,089
STRU
CTU
RAL
BALA
NCE
(16,
206)
20,0
875,
580
4,82
428
,676
107,
228
Not
e: F
Y 2
018
to F
Y 2
021
Net
Cha
nges
col
umns
incl
ude
base
line
and
initi
ativ
e is
sues
.
Gen
eral
Fun
d So
urce
s an
d U
ses
$ in
tho
usan
ds
10 FY 2019 Executive Budget

Education
The cornerstone of the FY 2019 Executive Budget is the commitment to phase in over five years a full restoration of reductions made to District Additional Assistance (DAA) and Charter Additional Assistance (CAA) during the Recession era.
he Executive Budget’s immediate impact to public schools is $100 million in new, permanent, and flexible funding in FY
2019, or approximately $90 per pupil, above enrollment growth and inflation - for uses including teacher compensation, student support services and capital projects – and increasing to $371 million by FY 2023.
K-12 Education
Since taking office, Governor Ducey’s primary focus has been maximizing the State’s investment in public K-12 education to ensure the best outcomes for Arizona’s more than 1.1 million students (see Figure 1).
• In May 2016, the Executive proposed and Arizona voters passed Proposition 123, which provided public schools with an additional $310 million in new funding in FY 2017 and, more importantly, settled a 5-year lawsuit over inflation funding for schools.
• The FY 2018 budget increased K-12 funding by $223 million through strategic investments in teacher pay, early literacy, and construction and repair of public school facilities.
• The FY 2019 Executive Budget adds net new funding of $214 million (including the FY 2018 supplemental) and continues this upward trend in funding by dramatically accelerating the State’s K-12 investment and establishing a path to a full restoration of Recession-era reductions made to a significant portion of the Basic State Aid formula.
The Executive’s continued commitment to increasing investments in K-12 education above enrollment growth and inflation is distinctly reflected in the Executive Budget. Almost 80% or $200 million, of new discretionary spending in FY 2019 (including the FY 2018 supplemental) is dedicated to K-12 education. These resources are in addition to the annual adjustments for enrollment growth, inflation, and other factors, which amount to an additional $116 million. Beyond FY 2019, the Executive Budget makes substantial investments every year for four years to ultimately grow annual funding for schools by $371 million per year.
FY 2019 EXECUTIVE BUDGET
The Executive Budget includes $211 million in new and permanent baseline per-pupil funding for student growth and inflation. The State General Fund share of that increase is partially offset by property taxes generated by new construction, increased distributions from the Permanent School Fund, and technical adjustments, resulting in a net baseline General Fund increase of $116 million for enrollment growth, inflation, and related adjustments, or $102 per pupil (inflation is projected to be 1.79% in FY 2019).
In addition to an increase in the baseline, the Executive Budget includes $200 million in new K-12 initiatives (including the FY 2018 supplemental), including school building renewal and new school construction investments by the School Facilities Board.
ENDING RECESSION-ERA FUNDING CUTS
The Executive immediately boosts the amount of new, permanent and flexible per-pupil funding that Arizona public schools receive through the Basic State Aid formula.
$100 Million in New Per-Pupil Funding. The Executive Budget restores a significant portion of the Basic State Aid formula known as District Additional Assistance (DAA) and Charter Additional Assistance (CAA) that have been suspended in part since FY 2009 as a result of the reductions made during the Great Recession. In FY 2019, public schools will receive an additional $100 million allocated on a per-pupil basis through the two formulas respectively.
T Figure 1
FY 2019 Executive Budget 11

Full Restoration of $371 Million by FY 2023. Beyond the first-year investment of $100 million, the Executive Budget phases in a full restoration of funding to the DAA and CAA formulas by FY 2023. The total increase of $371 million in new, permanent, and flexible funding for capital and operations, which may include additional teacher pay, will be phased in over four fiscal years:
• $168 million total ongoing funding in FY 2020;
• $236 million total ongoing funding in FY 2021;
• $303 million total ongoing funding in FY 2022; and
• $371 million total ongoing funding in FY 2023.
In statute, the DAA formula provides school districts with approximately $450-$600 per pupil annually. However, to address budget shortfalls, in each State budget since FY 2009, the amount of DAA that otherwise would have been apportioned to school districts was reduced by a fixed dollar amount. In FY 2018, the suspended amount equaled $352.4 million. The Executive Budget reduces the suspension of DAA to $257.5 million in FY 2019 and restores the entire formula amount by FY 2023.
Similarly, the CAA formula provides charter schools with $1,775 to $2,069 per pupil annually. However, as with DAA, in every budget since FY 2009, the amount of CAA that otherwise would have been apportioned to charter schools was reduced. In FY 2018, the reduction was $18.7 million. The Executive Budget reduces the suspension of CAA to $13.6 million in FY 2019 and restores the entire formula amount by FY 2023.
Fully Fund Large JTEDs. The Executive Budget also includes $2 million to fully restore the Basic State Aid formula for Joint Technical Education Districts (JTEDs). JTEDs that have a student count of over 2,000 will receive 100% of the Basic State Aid formula requirement in FY 2019, instead of the 95.5% that they have received in recent years. The additional resources will enhance the courses and industry-certified programs offered at JTEDs that serve more than half of all Arizona JTED students.
PERMANENTLY INCREASING TEACHER SALARIES
Several important investments that began in FY 2018 will continue in FY 2019, and the Executive Budget makes them permanent.
2% Teacher Salary Increase. Over 54,000 teachers received a salary increase that was proposed by the Executive and enacted as part of the FY 2018 budget. That pay increase is in addition to salary increases that school districts and charters provided from other sources, such as Proposition 123 and annual inflation adjustments provided by the State through the funding formula.
The Executive Budget provides an additional $34 million to continue the salary increase and ensures that funding is a permanent part of the State’s support for schools. Specifically, the proposed funding moves $68 million for teacher salaries into the base level in FY 2019 to ensure that it will be adjusted for inflation each year going forward.
CLOSING THE ACHIEVEMENT GAP
Early Intervention for Children with Disabilities. The Executive Budget includes $1.6 million to hire 21 new early-childhood teachers, doubling – from two visits to four – the number of monthly home visits that are provided to infants and toddlers in the “Birth to Three” program at the Arizona Schools for the Deaf and Blind (ASDB). The increased funding will also allow rural children to receive the same number of visits as their urban peers.
The Birth to Three program serves approximately 450 infants and toddlers who are deaf, hard of hearing, blind, or visually impaired. The program is staffed by certified early-intervention specialists who help families understand their child’s vision or hearing loss and the potential impact of that loss on their child’s development.
Results-Based Funding. In FY 2018, 288 high-performing public schools received $38.6 million through the Results-Based Funding program, established to help high-performing schools expand and replicate their successful models. Recipient schools have used Results-Based Funding to increase teacher salaries, hire instructional aides for math and English, provide additional professional development opportunities for teachers, and make other investments to improve student performance.
The Executive Budget continues the existing $38 million for public schools eligible for Results-Based Funding in FY 2019 to ensure that those important investments remain. More specifically, the Executive Budget directs Results-Based Funding in FY 2019 to be distributed using the FY 2018 formula, which is based on AzMERIT test results.
Expanding Early Literacy. For FY 2018, the Executive success-fully advocated funding for full-day kindergarten and other successful early-literacy strategies, from preschool to third grade, in school districts and charter schools in which more than 90% of students are eligible for free or reduced-price lunch.
The enacted FY 2018 budget included $8 million to fund early-literacy programs, which may be used for all-day kinder-garten, general preschool programs, longer K-3 school days, a longer school year, reading interventions, or reading coaches. As part of the FY 2018 spending plan, the Executive Budget increases funding for this important program by $4 million in FY 2019.
21ST CENTURY STANDARDS, ACCOUNTABILITY, CURRICULUM
Arizona’s Academic Standards. After 18 months of extensive research, review, and public hearings, in December 2016, the State Board of Education adopted Arizona’s new English language arts, and mathematics academic standards. This effort was in direct response to the Governor’s call to improve Arizona’s academic standards by replacing them with a new data-driven framework that is relevant to the students of today while preparing them with the necessary skills needed for the jobs of tomorrow.
12 FY 2019 Executive Budget
To ensure that the language arts and mathematics standards remain relevant, the State Board has implemented continuous review on an annual basis. And beyond, the State Board is in the midst of a significant update to the State’s social studies and science academic standards.
The Executive Budget recognizes this very important function and includes $1.1 million to continue funding 10.5 FTE positions at the Arizona Department of Education that support and provide technical assistance to the State Board for the development and implementation of our State’s academic standards.
Governor’s’ Partnership for K-12 Computer Science. The Executive recognizes the need for integrated instruction of computer science in all grade levels. The Executive Budget includes $2.5 million to fund a Computer Science Pilot Program that offers opportunities for high- quality, rigorous training for new computer science teachers in public schools that do not currently offer computer science instruction.
This initiative is part of a comprehensive package of targeted investments intended to advance computer science offerings in public schools which began in the FY 2018 budget. This package includes the development of academic standards for computer science and professional development opportunities for teachers, as well as state matching funds for the Arizona Broadband for Education Initiative that has already improved internet access at many schools across the state, especially in rural areas. Development of the computer science standards is currently underway, along with the creation of professional development modules to add standards training as well as a new and innovative micro-credentialing program to certify computer science teachers in the state.
Information Technology. The Executive Budget provides ongoing resources to operate and maintain the Arizona Department of Education’s Arizona Education Learning and Accountability System (AELAS). Among other functions, AELAS collects student data that is used to determine Basic State Aid payments. The Department has historically paid for operations and maintenance out of one-time appropriations for the continued development of the AELAS system; however, to ensure continuity of services to public schools, the Executive Budget will reflect the operational costs of the AELAS program as part of the Department’s baseline budget.
BUILDING RENEWAL AND CAPITAL
Increasing Building Renewal Grants. Using a grant-based program, the School Facilities Board (SFB) provides financial and technical assistance to school districts to maintain their school facilities.
To meet the increased volume of building renewal applica-tions and funding demands, the Executive Budget calls for a $35.1 million increase in the appropriation for building renewal to fund school districts’ capital needs. At a total of $51.8 million in available grants in FY 2019, this represents the largest infusion of
building renewal funding since FY 2007. The Executive Budget also adds $10 million for building renewal in FY 2018.
The Executive Budget permits SFB to use up to $750,000 of the building renewal appropriation in FY 2019 as the first step of a five-year, $5.2 million effort to hire third-party consultants to inventory school building systems’ age and performance characteristics into a statewide database. The resulting data analytics will enable SFB to collaborate with public schools to prioritize and schedule repairs and replacements of facilities in order to avoid costly building system failures. Additionally, the system will provide a measure of purchase predictability that enables SFB to leverage economies of scale to achieve bulk pricing on many capital items.
New School Construction and Expansion. Additionally, the Executive Budget includes $88.1 million for five new schools or school expansions in the Chandler Unified (three schools), Queen Creek Unified, and Tolleson Union High school districts. The new construction costs are financed through a 25-year certificate of participation (COP) with an estimated annual COP payment cost of $5.1 million.
Higher Education
The FY 2019 Executive Budget for Higher Education implements the first year of a landmark $1 billion capital funding plan, supports Arizona National Guard members’ pursuit of a college education, and provides resources to help universities serve a growing number of Arizona resident students.
Research and Development. The Executive Budget includes $27 million in funding to the three public universities for the first year’s payment on $1 billion in bonds for university investments in research and development infrastructure and deferred maintenance projects. Initial projects that will be supported by this significant capital investment include the University of Arizona’s $18 million renovation of the School of Animal and Comparative Biomedical Sciences Building, a portion of Arizona State University’s $90 million Hayden Library renovation, and Northern Arizona University’s $17 million Science Annex Renovation and $139 million Multi-Discipline STEM Building.
National Guard Tuition Reimbursement. Education benefits are a strong driver in the recruitment and reenlistment of National Guard members. According to a 2016 U.S. Department of Defense study, over 70% of new recruits nationwide reported that funding for college education was “very” or “extremely” influential in the decision to join their state’s National Guard.
The State of Arizona provided a tuition reimbursement program until FY 2010, when it was eliminated to help address the budget crisis, leaving Arizona as one of two states that do not offer any sort of tuition assistance to National Guard members. The Executive Budget restarts that program.
To further the goal of supporting Arizonans in pursuit of higher education, the Executive Budget includes $1 million for tuition benefits to assist National Guard members in attaining a
FY 2019 Executive Budget 13

postsecondary degree or certificate. The tuition reimbursement will allow National Guard members to close the gap between their actual tuition costs and any other scholarships or assistance they receive. According to the Department of Emergency and Military Affairs, the program is expected to help at least 127 National Guard members pursue postsecondary education at technical schools, community colleges, and universities.
State Support for Resident Students. The Executive Budget includes $8 million in one-time General Fund support for university operating and capital improvements, providing universities with budget flexibility to address their high-priority needs and provide additional support to Arizona resident students.
14 FY 2019 Executive Budget

Public Safety
The Executive Budget makes strategic investments to heighten public safety and continues to invest in needed recidivism efforts to ensure that individuals who have paid their debt to society are given a real second chance, and that in Arizona “corrections truly is corrections.”
he FY 2019 Executive Budget continues support for “Second Chance” initiatives aimed at reducing the State’s prison
population while protecting public safety by treating drug addiction inside prison and providing inmates pathways to employment.
In addition, the Executive Budget provides needed funding to combat wrong-way driving and opioid addiction and expands the State’s law enforcement presence at the Arizona-Mexico border by adding more patrol units to the Border Strike Force.
A Real Second Chance
Reducing the recidivism rate – i.e., decreasing the relapse of former inmates into criminal behavior – will curb future incarceration spending, enhance public safety, and give former inmates the chance to become engaged and productive citizens.
SUBSTANCE ABUSE TREATMENT
Substance abuse is strongly correlated to the number of people committing crimes and is a driver of the number of inmates in our State prisons. Improving access to substance abuse treatment for inmates before they leave prison increases their chances of success when re-entering society, and it represents a true public safety benefit for Arizona residents and visitors.
During FY 2017, the Department of Corrections (ADC) released 15,564 inmates identified as needing substance abuse treatment. Due to a shortage of licensed substance abuse counselors, only 2,235 of those inmates – just over 14% of the total – received treatment while incarcerated.
The Executive Budget provides $1.7 million to increase ADC’s substance abuse treatment capacity and help an additional 1,560 inmates who are struggling with substance abuse issues.
INMATE EDUCATION
The Executive’s focus on improving offender post-release outcomes extends beyond the expanded substance abuse treatment efforts mentioned above. Another major driving factor of recidivism is education, or, to be more precise, a lack of education.
In FY 2017, approximately 2,600 inmates who had not finished high school were released from prison without obtaining
a high school diploma or GED, only because State prisons did not have the capacity to teach the required classes. By adding $1.4 million to ADC’s education programming, the Executive Budget provides the opportunity for a basic education for an additional 486 inmates annually.
EMPLOYMENT CENTER EXPANSION
New employment centers at three Arizona prisons are equipping inmates with in-demand skill sets and helping them find jobs before leaving prison. To date, over 530 individuals have graduated from an employment center, and more than half have found employment after they were released from prison. More and more businesses are interested in partnering with ADC to train those individuals and eventually hire them as employees upon release. Given the demand by inmates and employers, the Executive Budget funds needed expansions of those programs.
The Lewis Employment Center can house 100 male inmates, and the Perryville Employment Center can house 40 female inmates. Those employment centers have produced impressive results, highlighting the opportunity for ADC to expand the programs in an effort to achieve the Department’s goal of reducing recidivism by 25% over the next decade. As over 60% of the Arizona inmate population will return to Maricopa County, an expansion of those programs at the two Maricopa County facilities is critical to meeting that goal.
The Executive Budget provides $449,900 to expand the Employment Center program at the Lewis and Perryville facilities, allowing 875 additional male inmates and 100 additional female inmates to participate in Employment Center programming annually.
Wrong-Way Driving Patrol
In June 2017, Governor Ducey instructed the Department of Public Safety (DPS), the Arizona Department of Transportation (ADOT), and the Governor’s Office of Highway Safety to immediately begin efforts to mitigate and prevent wrong-way driving.
To date, the Executive has implemented a state-of-the-art infrared camera system to better detect instances of wrong-way driving and improve notification of law enforcement. Over 145 cameras have been installed, in addition to new, illuminated
T
FY 2019 Executive Budget 15

wrong-way driving signs and increased patrolling of Safety Corridors.
While these crucial first steps will help alert drivers, the Executive has identified the need for a greater State Trooper presence during DPS’s “Night Watch” in the metropolitan Phoenix area in order to more quickly respond to wrong-way and impaired drivers.
The Executive Budget provides $1.4 million to increase patrol coverage and response times for the Night Watch, which will reduce fatalities and save lives.
Opioid Enforcement
Opioid addiction is a serious national public health problem. Drug overdoses are now the leading cause of death for Americans under 50, outnumbering both traffic fatalities and gun-related deaths. National data from 2014 reveals that opioids were involved in 61% of all drug overdose deaths during that year and that the rate of opioid overdoses tripled since 2000.
New Arizona-specific data shows an alarming 74% increase in Arizonans who have died from an opioid overdose since 2012, with 790 deaths in 2016 alone (see Figure 2). Last year, Governor Ducey declared a statewide emergency to address the opioid epidemic and ordered State Government to enhance surveillance of opioid use in Arizona.
Figure 2 Opioid Deaths in Arizona from 2007 to 2016
In September 2017, the Department of Health Services (DHS) issued an Opioid Action Plan that included a recommendation for increased participation by law enforcement in the U.S. Drug Enforcement Administration’s Tactical Diversion Squad (TDS). A TDS unit comprises federal, state, and local partners that work to prevent the illegal supply of pharmaceutical-grade controlled substances.
The Executive Budget provides $758,100 for DPS to establish the Arizona Pharmaceutical Diversion and Drug Theft Task Force that will coordinate with two Arizona agencies – DHS and the Board of Pharmacy – to participate in a TDS and combat the
abuse and trafficking of prescription drugs and inappropriate prescriber behavior.
Stopping Cartels, Protecting Arizona Border Communities
Focused on securing the Arizona-Mexico border, Governor Ducey established the Border Strike Force in 2015. Housed within DPS, the Border Strike Force conducts border security operations, seizing thousands of pounds of drugs and arresting over 2,000 traffickers and criminals since its inception.
Border county sheriffs and other law enforcement professionals have advocated for around-the-clock patrols of highways in southern Arizona, as criminals shift illegal activities to evening and nighttime hours when law enforcement presence is low.
The DPS Southern Highway Patrol Bureau, which covers Cochise, Graham, Greenlee, La Paz, Pima, Pinal, Santa Cruz, and Yuma counties, is a critical component of the Border Strike Force. The Executive Budget provides $2.9 million to increase the number of State Troopers to protect that 38,600-square-mile region, with the ultimate goal of reaching 24-hours-a-day, seven-days-a week coverage.
16 FY 2019 Executive Budget

Health and Welfare
The Executive Budget continues critical investments that support more safe and loving homes for children, prevent child abuse, and protect vulnerable adults and the elderly from neglect and exploitation.
he State vigilantly serves the most vulnerable among its residents by ensuring that abused and neglected children
find safe and forever family homes; assisting grandparents who are the caregivers for their grandchildren; serving the elderly in the dignity of their own homes; expanding the capacity of Arizona’s food bank network to address food insecurity; and integrating behavioral health care services for low-income patients with complex needs.
Child Safety
In recent years, critical developments in Arizona’s child safety agencies have infused a high level of urgency in reforming the manner in which the State protects children in its care and responds to reports of child abuse. Those reforms have resulted in significant progress in investigating child welfare cases, improving preventive in-home services, and reducing the out-of-home child population.
In March 2015, the Department of Child Safety (DCS) was plagued by a backlog of more than 16,000 inactive cases and 33,245 open reports that required investigation. Today, that number has a reached an all-time low and is now below the Legislative benchmarks of 1,000 inactive cases and 8,000 open reports (see Figure 3). DCS met the benchmarks four months before the July 2017 Legislative deadline.
• DCS has improved its child placement practices and coordination with foster care agencies, placing children in stable settings within hours – not days – and increasing the number of family-like settings for initial placement.
• The ratio of families receiving in-home services, which can mitigate the need to remove a child from the home, is rising.
• Targeted family-finding and permanency efforts are getting children out of group homes and emergency shelters and, in record numbers, into kinship placements and foster families.
Nonetheless, the amount of work remaining before DCS will have achieved true stability should not be understated. Procure-ment for replacing the Department’s child welfare technology system is underway, with a mobile solution for caseworkers completely launched in 2017. Additionally, DCS continues to
tackle contract renegotiations focused on service quality, process-improvement projects that will free caseworkers to devote more time to families, and initiatives to safely reduce the population of children in the State’s care.
SUPPORTING KINSHIP FAMILIES
To encourage the best outcomes for children in vulnerable situations, Governor Ducey announced in 2017 a new policy known as the “Grandmother Stipend.” The policy, which took effect in July 2017, expands relief for family members who, in the absence of a parent, are caregivers for children, an arrangement commonly referred to as “kinship care.” Kinship placements maintain and promote lifelong family connections and lessen the disruption of removal.
The FY 2018 budget increased the Grandmother Stipend by 200% and expanded eligibility to all kinship caregivers whose income does not exceed 200% of the federal poverty guidelines. As a result, the number of children benefitting from the stipend tripled in FY 2018, from 708 to 2,146, meaning thousands more children in uncertain circumstances are being cared for by family and loved ones.
REDUCING THE BACKLOG
When Governor Ducey took office in 2015, the State faced a backlog of over 16,000 inactive child welfare cases, the majority involving investigations that had been dormant for more than 60 days. Since that time, committed and compassionate DCS caseworkers have reduced the backlog of inactive cases by more
T Figure 3
FY 2019 Executive Budget 17

than 98%. By December 2017, the number of inactive cases had dropped to 265, the fastest decline in the country.
The target adopted in the 2017 Legislative session called for the backlog to stay below 1,000 each quarter, sustaining the effective elimination of the backlog. The Executive Budget continues this metric to flag any future increase in the backlog.
SAFELY REDUCING THE OUT-OF-HOME POPULATION
Between 2005 and 2016, the number of children in State care nearly doubled, increasing by over 92%. In September 2016, that trend began to dramatically reverse (see Figure 4).
Legislative benchmarks, established in 2017, called for reducing the number of kids in out-of-home care by 2% each quarter, ending FY 2018 with a population at or below 15,191 children. DCS is on track to reach that target, with 15,744 children in out-of-home care in October 2017. Already, a reduction in the out-of-home population has created capacity for DCS to further engage with families to improve assessment quality, service delivery, and timely permanency.
While DCS has been largely successful in safely reducing the out-of-home population, the 2% reduction benchmark may be harmful to sustaining the positive progress made so far. Many external factors, including the economy and population growth, impact the number of reports to the hotline and the need for foster care. While the Executive remains committed to safely reducing the number of children in out-of-home care, the Executive Budget removes the population benchmark, providing DCS with the flexibility to respond appropriately when a child is in danger.
ADOPTION: FOREVER FAMILIES
A welcome result of reducing the out-of-home population is an increase in the adoption rate for children in the State’s care, as can be seen in Figure 4. When reunification is not a possible outcome, adoption provides kids with permanent homes where they will be the safest and cared for the most. Adoption Services funding covers adoption home recruitment costs, adoption legal
expenses, and maintenance and special-needs subsidies for adopted children.
For the State, foster adoption is a long-term financial commitment, as DCS pays an adoption subsidy to the adoptive parents until the child reaches age 18 or graduates from high school, whichever occurs later.
The Executive Budget provides $15.8 million to fully fund the adoption subsidy for 33,087 children, making good on the Executive’s commitment to increase the number of children in loving, forever families.
SIGNIFICANT MILESTONES REMAIN AHEAD
As the out-of-home population decreases, DCS seeks to improve timeliness to permanency by updating its nationally recognized safety decision-making model, field standardization, and expanding prevention and intervention services and supports.
The Department is working to increase the placement of chil-dren in a family setting by refining the foster family recruitment process, improving the placement process, and improving supports to foster care providers.
DCS continues to develop and implement a secure and sustainable IT infrastructure necessary to carry out its mission. The Department successfully deployed the mobile solution in 2017 and plans to build additional segments of the synthesized information management system, Guardian, in FY 2019.
Assistance for Vulnerable Adults and the Elderly
ADULT PROTECTIVE SERVICES
Ensuring that Arizona’s vulnerable adults are safe from neglect and from physical, emotional, and financial abuse and exploitation is a high priority, and the 11.5% increase in reports to the Department of Economic Security (DES) Adult Protective Services (APS) between FY 2016 and FY 2017 must be addressed.
The Executive expects calls to the APS hotline to be met rapidly and effectively, with field staff dispatched in a timely manner. The Executive Budget replaces one-time funding from FY 2018 with federal support and expands the program by adding hotline and field staff to fully fund caseload growth demands.
HOME AND COMMUNITY-BASED SERVICES FOR THE ELDERLY
The Executive Budget provides an additional $471,000 for home and community-based services (HCBS) for the elderly. Those services allow seniors to safely remain independent and in their own homes for a longer period of time, keeping them out of costly nursing facilities. HCBS help seniors with essential daily activities, such as bathing, dressing, and meal preparation; they also provide for visiting nurses and home health aides.
IMPROVING FOOD SECURITY THROUGHOUT ARIZONA
While Arizona’s food bank organizations provide assistance to the hungry, in too many instances those providers, especially
Figure 4
18 FY 2019 Executive Budget

in rural areas, are forced to provide unhealthy processed food simply because of lack of refrigeration space or transportation.
The Executive Budget provides one-time funding of $1 million for capital equipment, materials, and supplies to increase the food bank network’s capacity to accept, distribute, store, and serve more farm-fresh produce. DES will manage and award the funds through a competitive process that prioritizes areas of greatest need throughout Arizona. The State’s investment will decrease food waste, increase access to healthy foods for low-income families, and improve health outcomes.
Health Services
PROGRAM INTEGRATIONS
For low-income Arizonans with complex medical needs, the traditional delivery and funding of care in the Arizona Health Care Cost Containment System (AHCCCS), the State’s Medicaid program, is fragmented. For example, a child with multiple disabling conditions and behavioral health needs would receive rehabilitative therapies under a contractor with the Children’s Rehabilitative Services (CRS) program; acute care needs would be overseen by an AHCCCS health plan; and behavioral health would be provided through the Regional Behavioral Health Authority (RBHA) contractor.
AHCCCS, DES, DCS, and the Department of Health Services (DHS) have undertaken a long-term effort to establish integrated contracts to ensure that different modalities of care are better coordinated. To help accomplish that objective, the Executive Budget transfers budget authority to the entity responsible formanaging those contracts.
• On November 2, 2017, AHCCCS issued a Request forProposal (RFP) for an “AHCCCS Complete Care” (ACC)contract to provide integrated physical, behavioral, andchildren’s rehabilitative services to its members, startingOctober 1, 2018. Accordingly, the Executive Budgetconsolidates the AHCCCS behavioral health and children’srehabilitative services special line items (SLIs) into AHCCCSacute-care SLIs.
• Native Americans receive their behavioral health throughRBHAs or, in certain cases, tribal RBHAs. For their physicalcare they may opt for (a) the American Indian HealthProgram (AIHP), (b) fee-for-service direct payments toproviders, or (c) an AHCCCS-contracted health plan. Formembers in AIHP, AHCCCS offers the option of receivingintegrated behavioral and acute care. The Executive Budget moves appropriation authority within the AHCCCS budgetto reflect this integration.
• Arizona’s children who are developmentally disabled (DD),have chronic and disabling conditions, and need theenhanced level of care provided by the Children’sRehabilitative Services (CRS) program receive their DDtherapies through DES contractors. Their physical and
behavioral health services are provided through CRS in a contract overseen by AHCCCS.
The Executive transfers from AHCCCS to DES the contract management for CRS and behavioral health services for DD members, effective October 1, 2018. Accordingly, the Executive Budget moves the funding from AHCCCS to DES.
FY 2019 Executive Budget 19

Natural Resources
The Executive Budget improves and expands recreational opportunities at State Parks, maximizes the value of State Trust Land for the benefit of K-12 education, strengthens the State’s negotiating position with respect to water rights along the Colorado River, and accelerates cleanups of Arizona land through more efficient and cost-effective practices.
rizona’s natural resources are beautiful recreational treasures enjoyed by millions and an important stimulus for the State’s
economic growth. The FY 2019 Executive Budget makes strategic investments
that improve and expand access to State parks; maximize the value of State Trust Land; strengthen the State’s negotiating position with respect to water rights; and improve public recreation and environmental quality for all to enjoy.
State Parks
Arizona’s 35 State parks continue to play an increasingly significant role in tourism and the vitality of rural economies.
FY 2017 was a record-breaking year for Arizona’s parks, with 2.9 million visitors and $18.2 million in revenue generation – increases of 8.9% and 13.5%, respectively, from the prior year. In addition to those impressive gains, in September 2017 Arizona State Parks received the National Recreation and Park Association’s Gold Medal for the nation’s best managed state park system.
As State Parks adds momentum to its upward trajectory, the Executive Budget strategically reinvests growing agency revenues into the State Parks system, balancing the importance of building renewal while pursuing new revenue-generating opportunities. Based on that approach, the Executive Budget continues one-time building renewal funding at FY 2018 levels, with a slight increase in the appropriation for major maintenance. The Executive Budget also funds a park expansion and renovation at Oracle State Park and Buckskin Mountain State Park, respectively.
Oracle State Park (Catalina Mountains). The Executive Budget includes $4 million to expand access to Oracle State Park beyond its current day-use status, adding 30 RV sites, 20 cabins and 20 tent sites.
By increasing the park’s annual revenue by a projected $1.2 million, the proposed one-time funding will convert its net annual deficit of $(286,000) into a surplus.
Buckskin Mountain State Park (Parker). The Executive Budget includes $2.5 million for Phase 1 of a three-phase park upgrade. Phase 1 of the redevelopment will include new cabins, electrical and water infrastructure upgrades, and new shower and restroom facilities.
In total, the $7 million redevelopment will add approximately 19 cabins, 18 RV sites, a boat launch ramp, beaches, ramadas, and an expanded parking lot to accommodate additional visitors. Once complete, the redevelopment is expected to increase park revenues by $1 million annually.
State Land Department
Innovative Management of State Trust Land. Over 90% of the 9.2 million acres of State Trust Land is held in trust for the benefit of public education. Maximizing the value of Trust Land provides more funding directly to Arizona’s K-12 classrooms.
By investing in opportunities that allow the State Land Department to more effectively leverage the market value of Trust Land, the State can expect to yield substantial results that increase funding for Arizona schools.
In FY 2018, the Department was appropriated $2.5 million in one-time funding from the Trust Land Management Fund for reassessment of federal permits, workflow digitization, survey assets, professional services contracts, and rights-of-way digitization. All of those investments enhance the value of State Trust Land and help stimulate Land Trust revenues to its beneficiaries, and the Executive Budget continues support for the associated costs on an ongoing basis.
Protecting the State’s CAP Water Rights. The Department holds rights to an allotment of 32,076 acre-feet of Central Arizona Project (CAP) water that benefits State Trust Lands. The Department is responsible for capital charges on those rights. The Department has required supplemental funding to pay its CAP water fees five out of the last eight fiscal years, including FY 2018. The amount of the supplemental has grown from $96,200 in FY 2011 to $449,100 in FY 2018, which suggests that the supplemental process may not be a suitable mechanism to meet CAP obligations going forward.
Further, the supplemental process results in late payment of CAP fees. The State intends to be a good client of CAP and seeks to ensure timely payments. Failure to pay any portion of the fees owed would result in the loss of water rights and a large reduction in the value of the specific parcel of land attached to those rights.
A
20 FY 2019 Executive Budget
The Executive Budget includes additional funding for CAP fees beyond what is estimated in FY 2019, as that amount will likely be revised upward. The policy shift will provide the Department with sufficient resources and flexibility to pay its CAP fees on time.
Department of Water Resources
As negotiations continue between the federal government and states holding Colorado River water rights, it is increasingly vital that the State has the resources in place to adequately protect Arizona’s interests and plan for the state’s water future.
One budgetary tool for achieving that objective is to provide the Department of Water Resources with greater flexibility in utilizing the Colorado River Litigation special line item (SLI).
To date, use of that SLI has been limited to litigation expenses in a dispute between the Navajo Nation and the U.S. Department of the Interior. The Executive recognizes that this litigation is not the Department’s only priority in fully representing the State’s interests in protecting its claims on the Colorado River. The Executive Budget broadens the scope of the SLI to “Colorado River Legal Expenses” for general Colorado River-related legal expenses, including costs associated with the Navajo Nation v. United States Department of the Interior.
Game and Fish Department
The Game and Fish Department’s 37 dams have an average age of 70 years. To maintain the structural integrity of its dams and improve public safety, the Executive Budget provides $150,000 to update the Department’s real-time flood warning systems and to clear trees and brush from dam areas.
The Department also owns 60 properties totaling more than 300,000 acres. The properties are maintained by the Department for habitat and recreation value. To ensure that those lands can continue to be enjoyed by inhabiting wildlife and the public, the Executive Budget provides $300,000 for infrastructure repairs and improvements.
Department of Environmental Quality
The Executive Budget continues support for the Water Quality Assurance Revolving Fund (WQARF) Program, through which the State determines financial and other responsibility for remediation of sites that have been contaminated by hazardous waste. There are 37 such sites on the WQARF registry.
Due to the severity of the contamination required to be listed on the registry, site remediation tends to be a complex, multi-year process. However, the Department of Environmental Quality (DEQ) has observed positive results by focusing on safely accelerating site cleanups through process efficiencies to reduce the cost per cleanup.
Those efforts have resulted in three sites being removed from the registry in FY 2017, increasing to five the total number of sites removed from the registry since WQARF’s inception in 1985. Further, in FY 2017 DEQ executed one Prospective Purchaser Agreement (PPA) and received four new PPA applications, which support environmentally responsible economic growth by removing liability barriers for eligible parties that wish to invest in previously contaminated sites. Also, during FY 2017 the program treated 1.4 billion gallons of contaminated groundwater.
The Executive seeks to build on the progress achieved in recent years and is working closely with DEQ to develop a new, permanent, non-General Fund funding stream that will be ready for implementation in FY 2020.
FY 2019 Executive Budget 21

Government that Works
Enhancing and capitalizing on the value of public assets are hallmarks of an effective state government.
Stewardship of Capital Assets
DEPARTMENT OF ADMINISTRATION
The Arizona Department of Administration (ADOA) building system includes an inventory of 4,357 buildings and structures with an area of 23.6 million square feet and an estimated replacement value of $4.7 billion.
Rental Charges. To provide additional revenue for reinvestment in the ADOA building system, the FY 2019 Executive Budget increases the rental rate of State-owned buildings for the first time since 2009. Rental rates for office space will increase from $13.08 per square foot to $16.08, and for storage space from $4.74 to $5.79.
This adjustment is expected to generate an additional $5.6 million in rental income to the Capital Outlay Stabilization Fund (COSF) that will help the State address building maintenance priorities, including fire and life safety issues.
While the rental rate for State-owned space will remain below the lowest market averages for Phoenix-area office and storage space, this increase is an important first step in addressing deferred maintenance and other critical infrastructure projects.
ADOA Building System Investments. The Executive Budget includes $17.7 million in one-time funding for capital needs in the ADOA building system. The primary sources of funding for building renewal investments are rental charges paid by State agencies to COSF and from General Fund appropriations. This amount consists of:
• $11 million from COSF for building renewal projects;
• $3.8 million from the General Fund and $1.9 million from COSF for new capital outlay at the Department of Emergency and Military Affairs and the Department of Public Safety (DPS); and
• $1 million from COSF for demolition of the State-owned building at 1275 W. Washington St. in Phoenix.
In addition, $12.2 million in one-time funding for building renewal projects comes from agency-specific funds. This amount consists of:
• $5.5 million at the Department of Corrections for building renewal;
• $2.3 million at the Department of Emergency and Military Affairs, as part of the State match for the Tucson Readiness Center;
• $1.4 million at the Game and Fish Department for building renewal and dam safety;
• $1.3 million at State Parks for maintenance on park structures;
• $1 million at Exposition and State Fair for building renewal and grounds maintenance;
• $600,000 at the Pioneers’ Home for six high-priority capital needs; and
• $126,300 at the Lottery for building and equipment maintenance.
DEPARTMENT OF EMERGENCY AND MILITARY AFFAIRS
The federal government has approved $18 million in design and construction costs for the new Readiness Center in Tucson. The Executive Budget provides a $6 million state match for an effective leveraging of State funds to enhance Arizona’s security.
The new Readiness Center will house the 172 soldiers that are part of the 222nd Transportation Company. The new investment will improve training and mobilization readiness.
By providing this funding in FY 2019, the Executive Budget will take advantage of the federal funding that expires in calendar year 2018.
DEPARTMENT OF PUBLIC SAFETY
The Executive Budget includes $2 million to replace dilapidated remote housing units and office space for DPS State Troopers. Some units are over 50 years old, far beyond the 20- to 25-year useful life of buildings of that type. The funding will address six of the worst locations.
Newer units are more energy efficient and cost less to operate and maintain. Further, better living and working conditions offer more incentive for State Troopers and their families to remain in or relocate to rural areas.
DEPARTMENT OF TRANSPORTATION
The Arizona Department of Transportation (ADOT) manages its own capital assets, separate from ADOA. Arizona’s highway system includes more than 21,500 highway lane-miles. Properly maintaining the roads results in less frequent major road construction, less stress on vehicles, and a more comfortable driving experience. The Federal Highway Administration estimates that, for every dollar spent on preventive maintenance, states save six dollars of road rebuilding costs.
22 FY 2019 Executive Budget

The Executive Budget provides an additional $25.6 million for preventive road surface maintenance, which includes liquid asphalt overlays that repair cracks and improve road smoothness. At $40.6 million, the Executive Budget will spend the most money on annual surface treatment to preserve Arizona’s highways than at any other time in state history. The funding will result in surface treatments for more than 3,000 additional lane-miles.
The Executive recognizes that the State Motor Vehicle Fuel Tax Revenue (i.e., the “gas tax”) used to fund Arizona’s transportation infrastructure is inadequate to meet the rising cost demands of new construction and fails to capture the full road impact of alternative fuel vehicles.
As more Arizonans transition to electric, hybrid, and other alternative fuel vehicles, the need for a stable and permanent revenue source to fund roads and bridges becomes even more critical. The Executive will direct ADOT to engage stakeholders and develop a more equitable funding solution that can support continued development and preservation of Arizona’s highways.
Large Automation Projects
The State is engaged in centralizing and enhancing the technology that supports its service-delivery mechanisms. The statewide information technology (IT) management plan specifies that certain IT projects are to be consolidated, with centralized oversight and project management provided by ADOA’s Arizona Strategic Enterprise Technology (ASET) Office.
The Executive Budget continues support of the ASET Office in moving toward completion of IT projects from previous years, investing in critical new projects, and expanding the IT security and support infrastructure upon which State services depend.
DEPARTMENT OF CHILD SAFETY
The Executive Budget includes $14.5 million to complete the third year of a four-year replacement of the obsolete Children’s Information Library and Data Source (CHILDS) child welfare data system at the Department of Child Safety (DCS). CHILDS was designed around the Department of Economic Security’s client server technology and cannot complete critical functions, necessitating a system replacement.
CHILDS’ replacement, Guardian, will be a secure cloud‐based system that employs mobile technology to assist with key agency functions, including intake processing, case management, provider management, and financial management. DCS has completely implemented Guardian’s mobile solution component, which allows caseworkers working off‐site to use a mobile tablet to take pictures, complete forms, run background checks, review and enter reports, and access other information management tools.
In FY 2019, DCS will complete Guardian’s platform development, hosting environment, and continue business integration, document management, technical integration, and quality management.
DEPARTMENT OF ADMINISTRATION
The Executive Budget includes $8.8 million for IT projects at ADOA that will enhance State operations and business practices:
• $5.3 million to complete the relocation of the State Data Center to a private facility;
• $3 million to complete the replacement of the statewide e-procurement system; and
• $500,000 to continue improving State agency websites.
OFFICE OF THE ATTORNEY GENERAL
The Executive Budget includes $1.5 million to update the Attorney General’s Case Management System that is no longer supported by the vendor.
BOARD OF BEHAVIORAL HEALTH EXAMINERS AND BOARD OF COSMETOLOGY
The Executive Budget includes $900,000, equally divided between the two boards, to join the multi-agency e-licensing system established in FY 2018 and will be used by 14 agencies.
This IT project will allow the two boards to properly manage their 11,000 and 111,000 licenses, respectively, instead of relying on outdated software and paper records.
DEPARTMENT OF ENVIRONMENTAL QUALITY
The Executive Budget includes $3.2 million for the next phase of the MyDEQ project. MyDEQ is an online platform intended to be more business-friendly by streamlining the permitting and compliance process.
As of January 2018, 44 of DEQ’s 147 services are available online, with an additional 16 services being added by September 2018 using FY 2018 funding. The FY 2019 funding will continue this progress. Automating much of DEQ’s permitting, in conjunction with other process changes, has shortened the average permit decision time from 121 days in FY 2008 to 8 days in FY 2018.
DEPARTMENT OF PUBLIC SAFETY
The Executive Budget includes $4.1 million for IT projects at the Department of Public Safety:
• $2.8 million for the second year of a three-year project to update the Arizona Criminal Justice Information System; and
• $1.3 million for the next phase of upgrading the state microwave communication system.
SECRETARY OF STATE
The Executive Budget includes $2.1 million for a new voter registration database at the Secretary of State. The new system will allow for better integration with the counties as well as real-time reporting on voter registration.
FY 2019 Executive Budget 23

State Employee Health Insurance
The Health Insurance Trust Fund (HITF) supports the State’s self-insured medical, pharmacy, and dental claims for State employees. In FY 2017, claims growth was 3.7%, lower than the 4.2% projection. However, as a result of the extreme claims spike in FY 2016, with no further changes the fund is still projected to have a structural deficit.
In addition to some employee plan changes, effective January 1, 2018, the Executive Budget includes an additional $10 million from the General Fund, coupled with approximately $20 million from other funds, to ensure that HITF remains solvent.
24 FY 2019 Executive Budget

’
The Economy
Arizona’s economy continues to be a leader across the nation, adding another year of solid growth in 2017 and setting the stage for continued expansion.
n 2017, the U.S. economy achieved another year of expansion that is quickly approaching one of the longest in the nation’s history. The ingredients of the expansion – historically low
inflation and steady, sustainable growth – remain in place for 2018.
Calendar year 2017 is on track to finish with three consecutive quarters of over 3% annualized growth in gross domestic product (GDP) - the first such occurrence since 2005. Consumers remain optimistic, and sentiment indices from small businesses are very strong. Following an unexpected but minor stumble in the first quarter of 2017, this continues a national turnaround trend that began in earnest in the fourth quarter of 2016.
For Arizona, 2017 marked both the lowest unemployment rate (4.5%) observed in over a decade and a marked acceleration in wage growth. The recovery of the state economy from the lows of the Great Recession continues at a modest but reliable pace, with over 27,000 jobs added just last year and 160,000 added since 2015.
The increasingly optimistic overall outlook for 2018 and beyond should be tempered, as always, by uncertainties. Specifically, as the U.S. transitions from a period of slow growth and regulatory caution back to a more traditional economy of robust expansion and dynamic innovation, old cyclical pressures of inflation and normal recession may re-emerge. However, this pattern should unfold over several years. Meanwhile, momentum in 2018 will be enhanced by significant corporate tax rate reductions and other Congressional reforms of the federal income tax code, combined with the Executive’s successes in working with the Legislature over the past three years to modernize State Government, invest in K-12 education, and prepare Arizona’s economy for an innovative future.
National Outlook
The national outlook can be viewed with continuing cautious optimism. Following brief slowdowns in the first quarters of both 2016 and 2017, the U.S. economy has outperformed expectations in a number of areas, discussed below, that have positive downstream effects on Arizona’s economic prospects and state revenue growth.
The most recent consensus outlook suggests a real GDP growth trajectory through 2020 at 2.5%-3%, and with each
passing month this outlook becomes clearer. Bright spots will be in consumer durables, housing, and automobiles, with business investment growing at robust rates against a backdrop of historically low energy prices, rising interest rates, and a persistently strong labor market with wages finally moving upward. Even faster growth is possible, given the passage of pro-growth tax reform in Washington, if business responds with increased domestic investment.
Headwinds, such as legacy debt and mandatory social spending, will be masked in the short term by several quarters of rapid growth but remain items of concern later in the three-year budget window. While tax reform and regulatory certainty have helped boost business and consumer confidence for now, Congress must face, in the long run, the spending side of the ledger and make the tough choices necessary to address lingering fiscal uncertainty.
EMPLOYMENT
The national labor market continues to steadily improve and may be aided in the short run by capital investment decisions that are accelerated by the tax package and other federal reforms.
Remarkably, despite being at levels last seen in 2001, the national unemployment rate has continued to fall in recent months. Given demographic challenges and an already tight labor market, the unemployment rate may be at or near its nadir. Still, there is opportunity for improvements in the labor force participation rate, as rising business demand fuels higher wages that will incentivize the return of workers who, disenchanted by the prior record of tepid growth and stagnant prospects, left the labor market over the past ten years.
Consensus projections for employment contemplate 2% employment growth nationally, with unemployment rates remaining below 5% throughout the next three years.
CONSUMER SPENDING
Consumer confidence is high and trending upward. In October 2017, the University of Michigan’s consumer sentiment index posted a level of 100.7 – its highest reading since January 2004. That finding suggests strong consumer spending into 2018, which is bullish for state tax revenue and overall GDP growth.
I
FY 2019 Executive Budget 25

The ongoing catalyst for spending is a strong labor market with modestly rising wages, improved household wealth, and higher discretionary incomes.
INTEREST RATES
The outlook for interest rates is becoming clearer with each passing Federal Reserve Board meeting. Incoming Fed chairman Jerome Powell will likely continue the policy of gradual tightening, with three 0.25-point benchmark rate increases scheduled for 2018. Acceleration in the tightening program is unlikely unless a significant rise in inflation occurs.
While the consensus forecast includes pressure on interest and inflation rates off of historic lows, those factors will have a minor impact on consumer demand as long as the Federal Reserve moves forward on the tightening cycle at a measured pace. Consumers will be bolstered overall by strength in labor markets and other areas of the economy.
Moreover, with continued easing of the financial regulatory environment, credit flows will likely increase despite higher interest rate levels. There is strong reason to believe that the interest rate environment will foster a moderately strong economic growth trajectory in 2018 and beyond.
BUSINESS SPENDING
Capital spending picked up in 2017, as businesses responded to an improving economy and the prospects for tax rate reductions going forward. Accelerated expensing and depreciation provisions planned for 2018 will probably prove to be an additional catalyst.
Investment-friendly tax and regulatory policies at the state and federal levels will continue to support business expansion and, in turn, economic growth over the next several years.
THE DOLLAR
In 2017, the dollar valuations stabilized against a basket of foreign currencies as the overall world economy gained strength. In the short run, higher interest rates will also contribute to dollar strength, provided that inflation remains tame. There is little reason to believe that the value of the dollar will change significantly in the absence of geopolitical shocks or sharp deviations from current monetary policy among developed countries.
CURRENT EVENTS AND RISKS
The number and persuasiveness of many national economy indicators, including the rate of GDP growth in the most recent three quarters, point to steady growth sustained by:
• low inflation rates;
• a steadily improving job market picture;
• strong business and consumer sentiment; and
• pro-growth federal policies evidenced by tax cuts andregulatory relief.
While downside risk invariably exists in the form of possible unforeseen shocks, political uncertainty, and slower growth outside the U.S., many economists point to continued opportunities for further economic momentum.
Considered together, this suggests that the national economy is today in the best shape it has been since prior to the Great Recession, which bodes well for the future.
Arizona Outlook
Arizona’s economy continues to be a leader across the nation, adding another year of solid growth in 2017 and setting the stage for continued expansion throughout the next three years. Employment gains in the first half of 2017 were in the 2%-2.5% range, and, after expected benchmark revisions, continued through the balance of the year.
Recent business relocation announcements, impressive net in-migration, and opportunities for wage appreciation will help to sustain the expansion. The state’s manufacturing sector relies on defense spending and electronics manufacturing, which are both poised to expand in the near term. While manufacturing employment nationally was down slightly in 2016, in Arizona it grew by nearly a percent, and through October 2017 growth was over 3%.
According to a report by S&P Global, Arizona’s “manufacturing sector has expanded as the state continues to receive large private sector investments,” including the massive build-up of Intel’s facility in Chandler. Moreover, Arizona’s growing professional service industries – especially health care and financial services - will help generate further new employment opportunities.
The case for continued optimism is supported by three conditions:
• Continued consumer confidence fuels a robust retail salesenvironment, supported by wage growth and federal taxreform.
• Arizona’s nascent manufacturing renaissance continues,thanks to pro-growth State policies that attract newbusiness investment and additional domestic in-migration.
• The ongoing diversification of Arizona’s economy intoprofessional services, high-tech manufacturing, and healthcare delivery continues.
Together, these compelling attributes combine to makeArizona’s “job and economic growth forecasts over the next five years among the best in the U.S.,” according to Forbes magazine. In fact, in 2017 alone, more than 80 companies that worked with the Arizona Commerce Authority pledged some 20,000 new jobs and more than $1.5 billion in new investment in Arizona over the next several years.
26 FY 2019 Executive Budget

EMPLOYMENT
Despite a tightening national labor market, Arizona remains below full employment even with the state’s unemployment rate reaching a 10-year low. According to the Arizona Office of Economic Opportunity, job openings have exceeded placements for the first time in over a decade, suggesting new opportunities to attract discouraged or out-of-state workers into the Arizona labor market.
Since 2015, over 160,000 private-sector jobs have been added, and the Executive forecast calls for Arizona’s employment growth to continue to outpace the national average through 2021.
PERSONAL INCOME
Arizona aggregate personal income growth, as reported by the U.S. Bureau of Economic Analysis, has displayed slow growth since the Great Recession. However, more recent data has suggested a turnaround in wage appreciation, and most economists expect wage and income growth to accelerate, achieving rates of overall personal income growth that are several percentage points above the levels in the past several years.
Notably, during the first two quarters of 2017, annualized personal income growth averaged nearly 6%, and the Executive forecast projects a return to growth in the 4%-4.5% range over the next three years.
IN-MIGRATION
For decades, the pace of domestic in-migration has been key to Arizona’s growth. Prominent among the state’s historical attractions for newcomers have been affordable housing, an attractive climate, and a competitive cost of living. While Arizona continues to feature all of these attributes, in-migration to Arizona has slowed in recent years, consistent with national trends, and today’s movers increasingly represent Millennial, college-educated professionals who hold a different set of preferences than the movers of yesterday.
Arizona is well positioned to meet its demographic challenges, thanks to the state’s strong embrace of the 21st century sharing economy – an economic system in which assets or services are shared between private individuals.
The state’s innovation-friendly regulatory environment stands to attract high-tech industries with jobs that appeal to Millennial movers. Arizona’s Office of Economic Opportunity reports that, since the Great Recession, a plurality of new migrants into the state have had some type of post-secondary education. The pace of Arizona’s in-migration should continue to improve during the three-year budget window.
RISKS
The most serious risk to Arizona comes from a scenario, as in previous years, in which the nation falls back into recession due to macroeconomic conditions beyond the state’s control.
Catalysts for a national downturn might include another financial crisis or a geopolitical or natural shock.
In contrast to prior years, an upswing in the state’s housing sector and a more diversified Arizona economy would likely provide some local insulation against the effects of a national downturn.
UPSIDE POTENTIAL
Arizona has leaped into the 21st century under the Executive’s leadership. Over the past three years, the administration has worked with the Legislature to reshape the state’s economy for the future through a combination of aggressive investments in K-12 education, pro-growth tax reforms, and a reduction in the regulatory barriers to entry that delay innovation and growth.
Together, this state has charted a course towards:
• ensuring that 60% of Arizonans have a certificate or college degree by 2030;
• fully funding K-12 education above and beyond the rate of inflation and population growth;
• identifying a list of more than 500 regulations that can be improved or eliminated; and
• reshaping State Government to be leaner and more efficient in serving the residents and taxpayers of this state.
As policymakers continue down this road, particularly through the initiatives and recommendations contained in the Executive Budget, there exists real opportunity to exceed the projections discussed in the Executive’s revenue forecast.
THE REVENUE OUTLOOK
General Fund revenue growth in FY 2017 was dampened by slower than expected growth in Transaction Privilege Tax (TPT) collections and a significant decline in Corporate Income Tax collections. While spring 2017 Individual Income Tax payments slowed in comparison with spring 2016, overall collections were in line with model predictions.
The Executive forecast contemplates that one-time technical issues related to the simplification of municipal TPT collections affected the revenue numbers in FY 2017 and may do so again in FY 2018. Going forward, the Executive forecast reflects the pace of recent collections while including signs of wage inflation that will provide ongoing support for revenue growth in FY 2019 and beyond.
Achieving the FY 2019 Baseline Revenue Forecast. Overall, revenue collections from the “Big 3” – Transaction Privilege, Individual Income, and Corporate Income taxes – are on track to achieve the Executive estimates for FY 2018, leaving State Government well positioned to achieve the Executive’s four-year estimate going into FY 2019.
The State’s Transaction Privilege Tax – the largest component of General Fund revenue and a key bellwether of state economic
FY 2019 Executive Budget 27

and fiscal health – has been a strong performer, posting year-to-date growth of over 5% through November 2017, compared to an Executive forecast of just over 4% for the same period.
The Corporate Income Tax continues to underperform. While that trend is attributable in part to the previously enacted Corporate Income Tax reforms, we have also noted generally poor nationwide performance in this category, including in states that did not reduce taxes. The Executive believes this is renewed evidence that punitive capital taxes only serve to discourage investment and innovation, and higher rates are not the solution, due to high volatility and low collections. However, lower collections from Corporate Income Tax are reflected in the Executive forecast and are offset by consistently solid performance in the Individual Income Tax, which, through November 2017, exceeded estimates by more than $20 million.
Overall, assuming achievement of the Executive forecast of 3.1% ongoing revenue growth in FY 2018 and continued improvement in the state and national economies as discussed in this section, State Government is likely to achieve the 3.7% base revenue growth in FY 2019 as proposed in the Executive Budget.
RECOMMENDED REVENUE POLICY CHANGES
Increasing the Exemption for Military Retirement Pay to $10,000. Since 1989, Arizona has provided an exemption from state Individual Income Tax for the first $2,500 in military retirement pay received by a retired service member.
Unfortunately, for the 52,000 retired military personnel who live in Arizona, inflation alone has reduced the value of that exemption by more than half. Their spirit of service has earned them a lifetime benefit from our nation in the form of a retirement pension, and the State should let them keep as much of that benefit as possible.
To that end, the Executive Budget includes an increase in the level of the military retirement pay exemption, from $2,500 to $10,000, to more than offset the value lost over the past 18 years from inflation. This policy would be phased in over the next two tax years, at a cost of about $15 million when fully implemented in FY 2021. The increased exemption is expected to save an Arizona retired service member more than $280 in state income taxes annually.
Expanded Tax Fraud Prevention Services. The FY 2016 budget authorized the Department of Revenue (DOR) to contract with a data analytics firm to identify and prevent the issuance of potentially fraudulent income tax refunds. DOR reports that its private-sector partner, using information not available to the Department, helped State Government save over $30 million in FY 2016.
In light of that success, the Executive Budget includes an expansion of those services to Transaction Privilege Tax (TPT) fraud – e.g., under- or non-reporting by businesses – which, according to DOR, deprives the State of up to $1 billion in TPT collections each year. There are private data analytics firms with
access to credit card transaction records and other merchant data that can be compared with state tax returns to identify potential evaders. Entering into contingent-fee contracts with such firms is expected to return $30 million per year to the General Fund.
Increase Audit and Collections Resources. Between FY 2008 and FY 2017, outstanding tax obligations increased from $370 million to nearly $500 million. Those are taxes that are owed but remain unpaid. Approximately half of the $500 million in unpaid taxes comes from TPT.
To address that issue, the Executive Budget includes $2 million from the DOR Collections Fund for 25.0 new FTE positions to focus on reducing the outstanding collections inventory and identifying other evaders. This ensures that all taxpayers are being treated equitably and that honest businesses are not forced to pay more due to the deliberate evasion of others.
Coupled with other solutions proposed here and new operational efficiencies at the DOR, this proposal is expected to return $25 million per year to the General Fund.
28 FY 2019 Executive Budget

Actual Estimate Estimate Estimate Estimate
TAXES FY 2017 FY 2018 FY 2019 FY 2020 FY 2021
Individual Income 4,130,559.8 4,328,000.0 4,507,900.0 4,715,260.0 4,927,420.0
Corporate Income 368,136.4 314,000.0 299,060.0 301,450.0 304,170.0
Sales and Use 4,505,914.8 4,647,500.0 4,838,400.0 5,067,900.0 5,309,070.0
Property Taxes 32,538.5 41,543.1 27,599.0 27,482.0 23,423.0
Luxury Taxes 57,638.3 59,035.0 52,331.0 52,724.0 53,427.0
Insurance Premium Taxes 504,339.3 525,010.0 529,100.0 542,856.6 556,970.9
Estate Taxes ‐ ‐ ‐ ‐ ‐
Other Taxes 2,740.7 8,607.1 7,208.0 3,216.0 3,189.0
TOTAL TAXES 9,601,867.9 9,923,695.2 10,261,598.0 10,710,888.6 11,177,669.9
OTHER REVENUES
Licenses, Fees & Permits/Misc. 165,137.5 165,562.9 175,674.0 181,709.1 187,101.6
Interest Earnings 17,001.0 17,698.9 15,000.0 12,500.0 10,000.0
Lottery 78,690.4 79,170.0 94,980.0 96,879.6 98,817.2
Transfers & Reimbursements 64,859.5 58,471.8 79,432.0 82,204.0 86,486.0
TOTAL REVENUES 9,927,556.3 10,244,598.8 10,626,684.0 11,084,181.3 11,560,074.7
ADJUSTMENTS
Urban Revenue Sharing (663,582.2) (680,770.1) (674,804.4) (697,050.0) (721,044.0)
Disproportionate Share 94,321.7 95,130.3 85,181.9 75,233.5 65,285.6
Temporary Transaction Privilege Tax 246.3 ‐ ‐ ‐ ‐
Scheduled Fund Transfers 144,361.6 61,558.7 76,103.2 ‐ ‐
Recommended Revenue Changes ‐ ‐ 55,000.0 47,500.0 40,000.0
GRAND TOTAL REVENUES 9,502,903.6 9,720,517.7 10,168,164.7 10,509,863.7 10,944,316.7
Note : Projected impacts from previously enacted tax law changes are included in the forecast.
General Fund Revenue Summary
FY 2019 Executive Budget 29

General Fund
Other Appropriated
Non‐Appropriated
All Funds
FY 2019 Executive Budget - All Funds(Dollars in Thousands)
Board of Accountancy 0.0 2,042.2 0.0 2,042.2
Acupuncture Board of Examiners 0.0 169.6 0.0 169.6
Department of Administration 107,767.1 251,215.1 1,203,808.1 1,562,790.3
Office of Administrative Hearings 884.2 0.0 812.6 1,696.8
African‐American Affairs 125.8 0.0 15.0 140.8
Department of Agriculture 8,887.1 1,816.5 19,329.5 30,033.1
Arizona Health Care Cost Containment System 1,792,199.8 356,427.6 12,108,846.5 14,257,473.9
Commission on the Arts 0.0 0.0 2,409.1 2,409.1
Board of Athletic Training 0.0 123.6 0.0 123.6
Attorney General ‐ Department of Law 26,825.4 48,664.2 68,785.9 144,275.5
Board of Barbers 0.0 391.5 0.0 391.5
Board of Behavioral Health Examiners 0.0 1,695.4 0.0 1,695.4
Board for Charter Schools 1,200.6 0.0 61.5 1,262.1
Department of Child Safety 388,628.4 621,079.7 0.0 1,009,708.1
Board of Chiropractic Examiners 0.0 410.9 0.0 410.9
Citizens' Clean Elections Commission 0.0 0.0 11,500.0 11,500.0
Commerce Authority 21,800.0 0.0 11,903.4 33,703.4
Community Colleges 56,156.1 0.0 0.0 56,156.1
Constable Ethics Standards & Training Board 0.0 0.0 445.4 445.4
Registrar of Contractors 0.0 12,268.4 4,666.8 16,935.2
Corporation Commission 621.5 26,652.4 825.0 28,098.9
Department of Corrections 1,094,814.4 56,410.2 70,919.9 1,222,144.5
Board of Cosmetology 0.0 1,827.6 73.4 1,901.0
Criminal Justice Commission 0.0 6,452.6 11,797.6 18,250.2
Schools for the Deaf and the Blind 21,932.0 13,948.7 19,722.1 55,602.8
Commission for the Deaf and the Hard of Hearing 0.0 4,622.6 0.0 4,622.6
Board of Dental Examiners 0.0 1,266.2 0.0 1,266.2
Early Childhood Development and Health Board 0.0 0.0 143,093.4 143,093.4
Department of Economic Security 632,307.0 294,378.7 3,460,317.8 4,387,003.5
State Board of Education 1,153.6 0.0 0.0 1,153.6
Department of Education 4,492,362.6 290,303.3 1,969,846.2 6,752,512.1
Department of Emergency and Military Affairs 12,108.3 1,438.4 55,557.9 69,104.6
Department of Environmental Quality 0.0 83,061.1 82,521.3 165,582.4
Office of Economic Opportunity 484.1 0.0 163,551.0 164,035.1
Board of Equalization 646.4 0.0 0.0 646.4
Board of Executive Clemency 1,123.0 0.0 40.9 1,163.9
Exposition & State Fair 0.0 12,564.9 0.0 12,564.9
Department of Financial Institutions 1,951.0 4,008.3 1,270.8 7,230.1
Board of Fingerprinting 0.0 0.0 623.6 623.6
Department of Forestry and Fire Management 10,180.0 0.0 39,234.8 49,414.8
Board of Funeral Directors & Embalmers 0.0 443.1 0.0 443.1
Game & Fish Department 0.0 42,846.3 75,806.2 118,652.5
Department of Gaming 1,779.5 15,610.0 1,714.8 19,104.3
Office of the Governor 8,377.0 0.0 33,610.3 41,987.3
Governor's Office of Strategic Planning and Budgeting 2,004.5 0.0 0.0 2,004.5
Department of Health Services 86,419.4 54,220.5 324,282.7 464,922.6
Governor's Office of Highway Safety 0.0 0.0 10,260.8 10,260.8
30 FY 2019 Executive Budget

General Fund
Other Appropriated
Non‐Appropriated
All Funds
FY 2019 Executive Budget - All Funds(Dollars in Thousands)
Arizona Historical Society 3,209.8 0.0 1,079.8 4,289.6
Prescott Historical Society of Arizona 840.2 0.0 1,115.0 1,955.2
Department of Homeland Security 0.0 0.0 20,171.2 20,171.2
Board of Homeopathic Medical Examiners 0.0 90.0 0.0 90.0
Department of Housing 0.0 323.2 114,074.4 114,397.6
Industrial Commission of Arizona 0.0 20,110.4 21,028.8 41,139.2
Department of Insurance 5,688.8 0.0 32,495.6 38,184.4
Judiciary 111,470.9 42,517.1 30,653.6 184,641.6
Department of Juvenile Corrections 20,676.1 17,655.1 1,171.2 39,502.4
Land Department 12,415.0 8,050.0 663.0 21,128.0
Auditor General 19,368.8 0.0 2,040.2 21,409.0
House of Representatives 13,419.1 0.0 0.0 13,419.1
Joint Legislative Budget Committee 2,513.8 0.0 0.0 2,513.8
Legislative Council 8,278.4 0.0 0.0 8,278.4
Senate 9,548.1 0.0 0.0 9,548.1
Department of Liquor Licenses and Control 0.0 3,138.6 1,262.9 4,401.5
Lottery Commission 0.0 131,550.7 1,465,478.1 1,597,028.8
Massage Therapy 0.0 469.8 0.0 469.8
Medical Board 0.0 6,859.3 165.0 7,024.3
Mine Inspector 1,226.8 112.9 426.4 1,766.1
Naturopathic Physicians Board of Medical Examiners 0.0 184.5 0.0 184.5
Navigable Stream Adjudication Commission 125.5 200.0 0.0 325.5
Board of Nursing 0.0 4,538.4 412.4 4,950.8
Nursing Care Ins. Admin. Examiners 0.0 450.9 0.0 450.9
Board of Occupational Therapy Examiners 0.0 180.3 0.0 180.3
Board of Dispensing Opticians 0.0 148.5 0.0 148.5
Board of Optometry 0.0 244.7 0.0 244.7
Board of Osteopathic Examiners 0.0 913.1 0.0 913.1
Parks Board 0.0 14,801.5 19,472.0 34,273.5
Personnel Board 0.0 378.7 0.0 378.7
Board of Pharmacy 0.0 2,180.2 1,859.6 4,039.8
Board of Physical Therapy Examiners 0.0 486.4 0.0 486.4
Pioneers' Home 0.0 6,737.4 6.2 6,743.6
Board of Podiatry Examiners 0.0 160.1 0.0 160.1
Commission for Postsecondary Education 1,646.8 1,541.1 1,446.4 4,634.3
Power Authority 0.0 0.0 25,485.0 25,485.0
Board for Private Postsecondary Education 0.0 333.4 304.5 637.9
Board of Psychologist Examiners 0.0 497.9 0.0 497.9
Department of Public Safety 107,582.3 186,745.2 90,109.6 384,437.1
Public Safety Personnel Retirement System 0.0 0.0 12,217.2 12,217.2
Department of Real Estate 2,937.5 0.0 338.5 3,276.0
Residential Utility Consumer Office 0.0 1,344.3 0.0 1,344.3
Board of Respiratory Care Examiners 0.0 323.5 0.0 323.5
Arizona State Retirement System 0.0 24,642.7 150,330.6 174,973.3
Department of Revenue 29,466.3 48,842.4 1,876.8 80,185.5
School Facilities Board 231,093.5 0.0 339,389.0 570,482.5
Department of State ‐ Secretary of State 17,028.4 4,295.5 4,371.5 25,695.4
FY 2019 Executive Budget 31
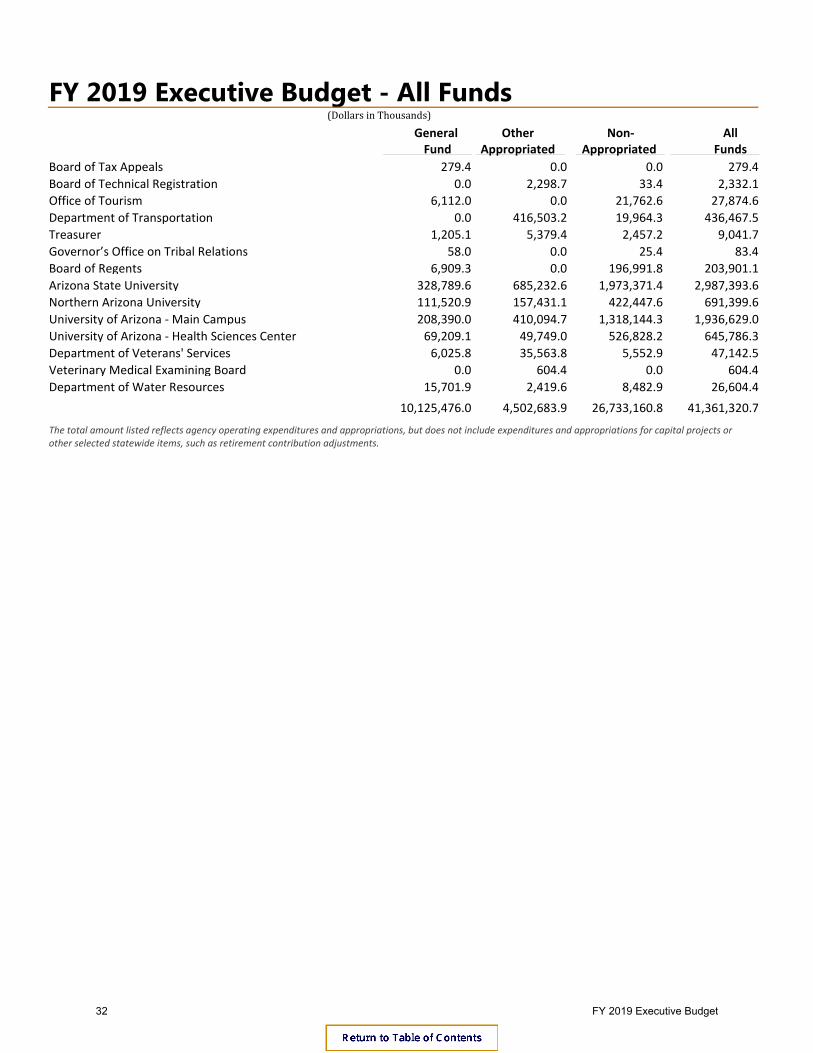
General Fund
Other Appropriated
Non‐Appropriated
All Funds
FY 2019 Executive Budget - All Funds(Dollars in Thousands)
Board of Tax Appeals 279.4 0.0 0.0 279.4
Board of Technical Registration 0.0 2,298.7 33.4 2,332.1
Office of Tourism 6,112.0 0.0 21,762.6 27,874.6
Department of Transportation 0.0 416,503.2 19,964.3 436,467.5
Treasurer 1,205.1 5,379.4 2,457.2 9,041.7
Governor’s Office on Tribal Relations 58.0 0.0 25.4 83.4
Board of Regents 6,909.3 0.0 196,991.8 203,901.1
Arizona State University 328,789.6 685,232.6 1,973,371.4 2,987,393.6
Northern Arizona University 111,520.9 157,431.1 422,447.6 691,399.6
University of Arizona ‐ Main Campus 208,390.0 410,094.7 1,318,144.3 1,936,629.0
University of Arizona ‐ Health Sciences Center 69,209.1 49,749.0 526,828.2 645,786.3
Department of Veterans' Services 6,025.8 35,563.8 5,552.9 47,142.5
Veterinary Medical Examining Board 0.0 604.4 0.0 604.4
Department of Water Resources 15,701.9 2,419.6 8,482.9 26,604.4
10,125,476.0 4,502,683.9 26,733,160.8 41,361,320.7
The total amount listed reflects agency operating expenditures and appropriations, but does not include expenditures and appropriations for capital projects or other selected statewide items, such as retirement contribution adjustments.
32 FY 2019 Executive Budget

Expenditures Appropriation
Executive Budget
Executive Budget
Changes and Adjustments
FY 2017 FY 2018
FY 2018 FY 2019FY 2019
General Fund Operating Budgets Summary(Dollars in Thousands)
176,857.5 110,131.1 110,131.1 107,767.1Department of Administration (2,364.0)
860.5 870.9 870.9 884.2Office of Administrative Hearings 13.3
119.9 125.8 125.8 125.8African‐American Affairs 0.0
9,045.2 9,563.7 9,479.0 8,887.1Department of Agriculture (676.6)
1,693,816.6 1,775,264.1 1,775,264.1 1,792,199.8Arizona Health Care Cost Containment System
16,935.7
24,020.3 26,344.2 26,344.2 26,825.4Attorney General ‐ Department of Law 481.2
997.4 1,200.6 1,200.6 1,200.6Board for Charter Schools 0.0
348,563.9 379,790.8 379,790.8 388,628.4Department of Child Safety 8,837.6
21,800.0 21,800.0 21,800.0 21,800.0Commerce Authority 0.0
54,312.7 55,086.5 55,086.5 56,156.1Community Colleges 1,069.6
609.6 621.5 621.5 621.5Corporation Commission 0.0
1,028,851.4 1,067,624.8 1,067,624.8 1,094,814.4Department of Corrections 27,189.6
20,168.1 21,932.0 21,932.0 21,932.0Schools for the Deaf and the Blind 0.0
538,032.2 586,110.3 586,110.3 632,307.0Department of Economic Security 46,196.7
921.7 1,153.6 1,153.6 1,153.6State Board of Education 0.0
4,080,893.0 4,226,958.4 4,226,958.4 4,492,362.6Department of Education 265,404.2
9,944.3 11,238.3 11,238.3 12,108.3Department of Emergency and Military Affairs
870.0
2,823.6 2,823.6 2,823.6 0.0Department of Environmental Quality (2,823.6)
508.7 484.1 484.1 484.1Office of Economic Opportunity 0.0
187.0 191.9 191.9 0.0Governor's Office for Equal Opportunity (191.9)
549.6 646.4 646.4 646.4Board of Equalization 0.0
746.6 963.5 963.5 1,123.0Board of Executive Clemency 159.5
2,912.8 2,201.0 2,201.0 1,951.0Department of Financial Institutions (250.0)
10,579.2 11,922.5 16,000.5 10,180.0Department of Forestry and Fire Management
(1,742.5)
1,979.5 1,779.5 1,779.5 1,779.5Department of Gaming 0.0
5,867.6 8,871.4 8,871.4 8,377.0Office of the Governor (494.4)
1,567.9 2,014.6 2,014.6 2,004.5Governor's Office of Strategic Planning and Budgeting
(10.1)
81,592.5 87,669.4 87,669.4 86,419.4Department of Health Services (1,250.0)
2,722.9 3,179.8 3,179.8 3,209.8Arizona Historical Society 30.0
805.9 840.2 840.2 840.2Prescott Historical Society of Arizona 0.0
811.4 830.0 830.0 0.0Department of Housing (830.0)
1,074.9 0.0 0.0 0.0Independent Redistricting Commission 0.0
5,039.8 5,878.3 5,878.3 5,688.8Department of Insurance (189.5)
110,793.3 110,718.7 110,718.7 111,470.9Judiciary 752.2
22,672.6 19,549.8 19,549.8 20,676.1Department of Juvenile Corrections 1,126.3
12,029.8 12,365.9 12,815.0 12,415.0Land Department 49.1
18,066.5 18,688.8 18,688.8 19,368.8Auditor General 680.0
13,317.0 13,419.1 13,419.1 13,419.1House of Representatives 0.0
2,309.5 2,513.8 2,513.8 2,513.8Joint Legislative Budget Committee 0.0
6,696.4 8,278.4 8,278.4 8,278.4Legislative Council 0.0
8,905.7 9,548.1 9,548.1 9,548.1Senate 0.0
996.8 1,226.8 1,226.8 1,226.8Mine Inspector 0.0
122.1 125.5 125.5 125.5Navigable Stream Adjudication Commission 0.0
FY 2019 Executive Budget 33

Expenditures Appropriation
Executive Budget
Executive Budget
Changes and Adjustments
FY 2017 FY 2018
FY 2018 FY 2019FY 2019
General Fund Operating Budgets Summary(Dollars in Thousands)
1,220.8 1,881.8 1,881.8 1,646.8Commission for Postsecondary Education (235.0)
114,214.6 109,614.2 109,614.2 107,582.3Department of Public Safety (2,031.9)
1,529.4 787.6 787.6 0.0Radiation Regulatory Agency (787.6)
2,344.3 3,028.0 3,028.0 2,937.5Department of Real Estate (90.5)
28,425.6 31,291.3 31,291.3 29,466.3Department of Revenue (1,825.0)
227,929.6 292,286.6 302,286.6 231,093.5School Facilities Board (61,193.1)
14,306.8 12,190.1 14,090.1 17,028.4Department of State ‐ Secretary of State 4,838.3
266.6 268.3 279.4 279.4Board of Tax Appeals 11.1
7,112.0 7,112.0 7,112.0 6,112.0Office of Tourism (1,000.0)
30,049.8 50.5 50.5 0.0Department of Transportation (50.5)
889.3 1,205.1 1,205.1 1,205.1Treasurer 0.0
56.7 58.0 58.0 58.0Governor’s Office on Tribal Relations 0.0
16,928.4 6,909.3 6,909.3 6,909.3Board of Regents 0.0
308,102.6 320,259.0 320,259.0 328,789.6Arizona State University 8,530.6
106,317.0 108,612.8 108,612.8 111,520.9Northern Arizona University 2,908.1
198,493.2 199,829.5 199,829.5 208,390.0University of Arizona ‐ Main Campus 8,560.5
68,631.2 69,209.1 69,209.1 69,209.1University of Arizona ‐ Health Sciences Center
0.0
5,876.9 6,115.8 6,115.8 6,025.8Department of Veterans' Services (90.0)
11,572.1 16,001.9 16,001.9 15,701.9Department of Water Resources (300.0)
9,469,760.7 9,809,258.6 9,825,612.1 10,125,476.0General Fund Operating Total 316,217.4
The total amount listed reflects agency operating expenditures and appropriations, but does not include expenditures and appropriations for capital projects or other selected statewide items, such as retirement contribution adjustments.
34 FY 2019 Executive Budget

Expenditures Appropriation
Executive Budget
Executive Budget
Changes and Adjustments
FY 2017 FY 2018
FY 2018 FY 2019FY 2019
Other Appropriated Funds Operating Budgets Summary(Dollars in Thousands)
Board of Accountancy
Accountancy Board Fund 1,521.7 2,042.2 2,042.2 2,042.2 0.0
Acupuncture Board of Examiners
Acupuncture Board of Examiners Fund 159.2 185.5 185.5 169.6 (15.9)
Department of Administration
Personnel Division Fund 11,679.6 12,951.5 12,951.5 13,123.4 171.9
Capital Outlay Stabilization Fund 15,316.7 18,159.9 18,159.9 18,659.9 500.0
Cosmetology Board Fund 0.0 0.0 0.0 450.0 450.0
Arizona Highway Patrol Fund 0.0 0.0 0.0 2,806.2 2,806.2
Corrections Fund 422.9 573.6 573.6 573.6 0.0
Information Technology Fund 2,908.7 2,948.9 2,948.9 8,774.6 5,825.7
Air Quality Fund 406.0 927.3 927.3 927.3 0.0
Behavioral Health Examiners Fund 0.0 0.0 0.0 450.0 450.0
Underground Storage Tank Revolving Fund 0.0 0.0 0.0 1,400.0 1,400.0
Permit Administration Fund 0.0 0.0 0.0 1,000.0 1,000.0
Statewide Monument and Memorial Repair Fund
0.0 0.0 0.0 25.3 25.3
Public Safety Equipment Fund 0.0 0.0 0.0 1,250.0 1,250.0
State Web Portal Fund 3,368.6 5,551.6 5,551.6 8,568.6 3,017.0
Automation Projects Fund 26,064.7 58,764.9 58,764.9 33,952.6 (24,812.3)
Special Employee Health Fund 4,884.8 5,302.0 5,302.0 5,302.0 0.0
Admin ‐ AFIS II Collections Fund 0.0 375.9 375.9 0.0 (375.9)
Motor Pool Revolving Fund 6,834.3 10,154.1 10,154.1 10,154.1 0.0
Special Services Fund 412.8 812.3 812.3 998.9 186.6
State Surplus Property Fund 2,643.7 2,960.6 2,960.6 2,960.6 0.0
Admin ‐ Surplus Property/Federal Fund 34.9 465.7 465.7 465.7 0.0
Risk Management Fund 86,374.0 90,951.4 106,753.9 97,159.1 6,207.7
Arizona Financial Information System Collections Fund
9,295.4 9,457.5 9,457.5 9,457.5 0.0
Automation Operations Fund 19,771.2 24,067.0 24,067.0 30,897.0 6,830.0
Telecommunications Fund 1,706.2 1,858.7 1,858.7 1,858.7 0.0
Agency Total 192,124.4 246,282.9 262,085.4 251,215.1 4,932.2
Department of Agriculture
Livestock Custody Fund 0.0 0.0 0.0 20.0 20.0
Nuclear Emergency Management Fund 0.0 275.0 275.0 275.0 0.0
Air Quality Fund 1,369.7 1,441.5 1,441.5 1,441.5 0.0
Agriculture Designated/Donations Fund 0.0 0.0 0.0 80.0 80.0
Agency Total 1,369.7 1,716.5 1,716.5 1,816.5 100.0
FY 2019 Executive Budget 35

Expenditures Appropriation
Executive Budget
Executive Budget
Changes and Adjustments
FY 2017 FY 2018
FY 2018 FY 2019FY 2019
Other Appropriated Funds Operating Budgets Summary(Dollars in Thousands)
Arizona Health Care Cost Containment System
Tobacco Tax and Health Care Fund 72,042.7 72,998.2 72,998.2 67,413.9 (5,584.3)
Tobacco Products Tax Fund 18,747.2 19,244.3 19,244.3 17,535.5 (1,708.8)
Substance Abuse Services Fund 2,250.2 2,250.2 2,250.2 2,250.2 0.0
Children's Health Insurance Program Fund 24,779.4 117,688.2 117,688.2 119,948.6 2,260.4
Budget Neutrality Compliance Fund 2,672.5 3,655.3 3,655.3 3,788.2 132.9
Prescription Drug Rebate Fund 113,740.0 145,691.2 145,691.2 145,491.2 (200.0)
Agency Total 234,232.0 361,527.4 361,527.4 356,427.6 (5,099.8)
Commission on the Arts
Budget Stabilization Fund 1,500.0 1,500.0 1,500.0 0.0 (1,500.0)
Arizona Arts Trust Fund 0.0 0.0 0.0 0.0 0.0
Agency Total 1,500.0 1,500.0 1,500.0 0.0 (1,500.0)
Board of Athletic Training
Athletic Training Fund 110.6 120.6 120.6 123.6 3.0
Attorney General ‐ Department of Law
Consumer Protection/Fraud Revolving Fund 3,935.7 6,335.6 6,335.6 7,296.9 961.3
Attorney General Antitrust Revolving Fund 147.8 246.3 246.3 246.3 0.0
Attorney General Collection Enforcement Fund
6,282.0 6,920.9 6,920.9 6,920.9 0.0
Consumer Restitution and Remediation Revolving Fund
0.0 0.0 0.0 1,489.0 1,489.0
Interagency Service Agreements 14,995.6 16,500.8 16,500.8 16,500.8 0.0
Victims Rights Fund 3,609.7 3,761.3 3,761.3 3,761.3 0.0
Internet Crimes Against Children 632.1 900.0 900.0 900.0 0.0
Risk Management Fund 8,615.5 9,468.6 9,468.6 9,468.6 0.0
Attorney General Legal Services Cost Allocation Fund
1,931.9 2,080.4 2,080.4 2,080.4 0.0
Agency Total 40,150.3 46,213.9 46,213.9 48,664.2 2,450.3
Automobile Theft Authority
Automobile Theft Authority Fund 5,227.5 5,301.4 5,301.4 0.0 (5,301.4)
Board of Barbers
Board of Barbers Fund 303.0 345.8 345.8 391.5 45.7
Board of Behavioral Health Examiners
Behavioral Health Examiners Fund 1,542.0 1,777.8 1,777.8 1,695.4 (82.4)
Department of Child Safety
Temporary Assistance for Needy Families (TANF) Fund
146,946.5 149,472.7 149,472.7 149,472.7 0.0
Child Care and Development Fund 27,000.0 27,000.0 27,000.0 27,000.0 0.0
DCS Expenditure Authority 286,763.8 415,540.8 415,540.8 439,170.6 23,629.8
Child Abuse Prevention Fund 642.6 1,459.3 1,459.3 1,459.3 0.0
Children and Family Services Training Program Fund
0.0 207.1 207.1 207.1 0.0
Risk Management Fund 2,181.4 2,471.2 2,471.2 3,770.0 1,298.8
Agency Total 463,534.3 596,151.1 596,151.1 621,079.7 24,928.6
36 FY 2019 Executive Budget

Expenditures Appropriation
Executive Budget
Executive Budget
Changes and Adjustments
FY 2017 FY 2018
FY 2018 FY 2019FY 2019
Other Appropriated Funds Operating Budgets Summary(Dollars in Thousands)
Board of Chiropractic Examiners
Chiropractic Examiners Board Fund 451.1 455.1 455.1 410.9 (44.2)
Registrar of Contractors
Registrar of Contractors Fund 8,691.1 12,268.4 12,268.4 12,268.4 0.0
Corporation Commission
Utility Regulation Revolving Fund 13,636.0 14,275.9 14,275.9 14,275.9 0.0
Security Regulatory and Enforcement Fund 4,824.4 4,969.3 4,969.3 4,969.3 0.0
Public Access Fund 5,903.8 6,638.1 6,638.1 6,638.1 0.0
Securities Investment Management Fund 666.8 717.5 717.5 717.5 0.0
Arizona Arts Trust Fund 47.6 51.6 51.6 51.6 0.0
Agency Total 25,078.5 26,652.4 26,652.4 26,652.4 0.0
Department of Corrections
Corrections Fund 21,931.5 32,812.3 32,812.3 32,812.3 0.0
State Education Fund for Correctional Education Fund
609.9 675.0 675.0 675.0 0.0
DOC ‐ Alcohol Abuse Treatment Fund 311.4 555.5 555.5 555.5 0.0
Transition Program Fund 2,221.1 2,400.1 2,400.1 3,385.0 984.9
Prison Construction and Operations Fund 5,022.0 12,500.0 12,500.0 12,500.0 0.0
Inmate Store Proceeds Fund 0.0 386.3 386.3 1,340.4 954.1
Penitentiary Land Earnings Fund 979.3 2,062.5 2,062.5 2,062.5 0.0
State Charitable, Penal & Reformatory Land Earnings Fund
1,459.4 2,661.5 2,661.5 3,079.5 418.0
Agency Total 32,534.7 54,053.2 54,053.2 56,410.2 2,357.0
Board of Cosmetology
Cosmetology Board Fund 1,773.9 1,864.5 1,864.5 1,827.6 (36.9)
Criminal Justice Commission
Criminal Justice Enhancement Fund 497.4 651.3 651.3 651.3 0.0
Victim Compensation and Assistance Fund 3,230.4 4,222.6 4,222.6 4,222.6 0.0
Drug and Gang Prevention Resource Center Fund
582.7 605.0 605.0 605.0 0.0
State Aid to County Attorneys Fund 727.8 973.7 973.7 973.7 0.0
State Aid to Indigent Defense Fund 833.3 0.0 0.0 0.0 0.0
Inmate Store Proceeds Fund 0.0 750.0 750.0 0.0 (750.0)
Penitentiary Land Earnings Fund 0.0 1,000.0 1,000.0 0.0 (1,000.0)
State Charitable, Penal & Reformatory Land Earnings Fund
0.0 1,000.0 1,000.0 0.0 (1,000.0)
Agency Total 5,871.5 9,202.6 9,202.6 6,452.6 (2,750.0)
Schools for the Deaf and the Blind
Telecom for the Deaf Fund 0.0 0.0 0.0 2,070.0 2,070.0
Schools for the Deaf and Blind Fund 11,465.1 11,878.7 11,878.7 11,878.7 0.0
Agency Total 11,465.1 11,878.7 11,878.7 13,948.7 2,070.0
Commission for the Deaf and the Hard of Hearing
Telecom for the Deaf Fund 3,040.2 4,622.6 4,622.6 4,622.6 0.0
Board of Dental Examiners
Dental Board Fund 1,092.5 1,229.9 1,229.9 1,266.2 36.3
FY 2019 Executive Budget 37

Expenditures Appropriation
Executive Budget
Executive Budget
Changes and Adjustments
FY 2017 FY 2018
FY 2018 FY 2019FY 2019
Other Appropriated Funds Operating Budgets Summary(Dollars in Thousands)
Department of Economic Security
Workforce Investment Grant Fund 42,853.9 56,040.2 56,040.2 56,040.2 0.0
Temporary Assistance for Needy Families (TANF) Fund
70,316.7 72,964.7 72,964.7 72,964.7 0.0
Child Care and Development Fund 87,910.2 107,773.6 107,773.6 107,773.6 0.0
Special Administration Fund 5,313.2 2,951.8 2,951.8 4,122.8 1,171.0
Child Support Enforcement Administration Fund
8,019.0 17,267.4 17,267.4 17,267.4 0.0
Domestic Violence Services Fund 3,423.7 4,000.0 4,000.0 4,000.0 0.0
Public Assistance Collections Fund 6.6 422.1 422.1 422.1 0.0
Department Long‐Term Care System Fund 26,559.6 26,561.5 26,561.5 26,561.5 0.0
Spinal and Head Injuries Trust Fund 2,251.8 2,326.4 2,326.4 4,226.4 1,900.0
Health Services Lottery Fund 519.0 2,800.0 2,800.0 0.0 (2,800.0)
Statewide Cost Allocation Plan Fund 0.0 1,000.0 1,000.0 1,000.0 0.0
Agency Total 247,173.6 294,107.7 294,107.7 294,378.7 271.0
State Board of Education
Teacher Certification Fund 163.5 0.0 0.0 0.0 0.0
Department of Education
School Accountability Fund Prop 301 Fund 6,348.0 7,000.0 7,000.0 7,000.0 0.0
Teacher Certification Fund 1,814.0 2,363.2 2,363.2 2,363.2 0.0
State Web Portal Fund 500.0 0.0 0.0 0.0 0.0
Empowerment Scholarship Account Fund 813.1 1,202.0 1,202.0 1,202.0 0.0
Professional Development Fund 249.4 2,700.0 2,700.0 2,700.0 0.0
Tribal College Dual Enrollment Program 123.0 250.0 250.0 250.0 0.0
Budget Stabilization Fund 0.0 2,600.0 2,600.0 0.0 (2,600.0)
Public Institution Permanent School Earnings Fund
219,804.2 235,343.5 235,343.5 276,788.1 41,444.6
Agency Total 229,651.7 251,458.7 251,458.7 290,303.3 38,844.6
Department of Emergency and Military Affairs
Nuclear Emergency Management Fund 1,426.9 1,438.4 1,438.4 1,438.4 0.0
Emergency Management Assistance Compact Revolving Fund
20.4 0.0 0.0 0.0 0.0
Agency Total 1,447.3 1,438.4 1,438.4 1,438.4 0.0
38 FY 2019 Executive Budget

Expenditures Appropriation
Executive Budget
Executive Budget
Changes and Adjustments
FY 2017 FY 2018
FY 2018 FY 2019FY 2019
Other Appropriated Funds Operating Budgets Summary(Dollars in Thousands)
Department of Environmental Quality
DEQ Emissions Inspection Fund 29,040.5 30,610.1 30,610.1 29,610.1 (1,000.0)
Hazardous Waste Management Fund 1,304.9 1,744.3 1,744.3 1,744.3 0.0
Air Quality Fund 6,404.6 7,381.9 7,381.9 7,381.9 0.0
Underground Storage Tank Revolving Fund 40.4 22.0 22.0 6,574.0 6,552.0
Recycling Fund 915.3 2,361.3 2,361.3 3,361.3 1,000.0
Permit Administration Fund 5,449.5 10,876.3 10,876.3 7,163.0 (3,713.3)
Emergency Response Fund 110.1 132.8 132.8 132.8 0.0
Solid Waste Fee Fund 914.6 1,247.4 1,247.4 1,247.4 0.0
Water Quality Fee Fund 6,904.5 10,582.3 10,582.3 10,582.3 0.0
Safe Drinking Water Program Fund 0.0 1,800.0 1,800.0 1,800.0 0.0
Indirect Cost Recovery Fund 12,109.7 13,464.0 13,464.0 13,464.0 0.0
Agency Total 63,194.1 80,222.4 80,222.4 83,061.1 2,838.7
Exposition & State Fair
Arizona Exposition and State Fair Fund 11,352.9 12,153.3 12,153.3 12,564.9 411.6
Department of Financial Institutions
Financial Services Fund 1,428.3 3,226.8 3,226.8 3,958.3 731.5
Banking Department Revolving Fund 0.0 0.0 0.0 50.0 50.0
Board of Appraisal Fund 538.7 815.1 85.1 0.0 (815.1)
Agency Total 1,967.0 4,041.9 3,311.9 4,008.3 (33.6)
Board of Funeral Directors & Embalmers
Funeral Directors and Embalmers Fund 369.7 378.2 378.2 443.1 64.9
Game & Fish Department
Game and Fish Fund 29,618.6 37,110.6 37,110.6 36,624.9 (485.7)
Watercraft Licensing Fund 3,367.6 5,834.4 5,834.4 4,848.4 (986.0)
Game/Non‐game Fund 110.7 346.8 346.8 346.8 0.0
Capital Improvement Fund 1,001.2 1,001.2 1,001.2 1,001.2 0.0
Wildlife Endowment Fund 0.0 16.2 16.2 25.0 8.8
Agency Total 34,098.1 44,309.2 44,309.2 42,846.3 (1,462.9)
Department of Gaming
Lottery Fund 300.0 300.0 300.0 300.0 0.0
Permanent Tribal‐State Compact Fund 1,488.5 2,105.4 2,105.4 2,105.4 0.0
Arizona Benefits Fund 9,553.3 11,050.9 11,050.9 11,036.7 (14.2)
Racing Regulation Fund 2,067.1 2,167.9 2,167.9 2,167.9 0.0
Agency Total 13,408.8 15,624.2 15,624.2 15,610.0 (14.2)
FY 2019 Executive Budget 39

Expenditures Appropriation
Executive Budget
Executive Budget
Changes and Adjustments
FY 2017 FY 2018
FY 2018 FY 2019FY 2019
Other Appropriated Funds Operating Budgets Summary(Dollars in Thousands)
Department of Health Services
Tobacco Tax Hlth Care Fund MNMI Account Fund
587.4 700.0 700.0 700.0 0.0
Capital Outlay Stabilization Fund 1,548.5 1,559.9 1,559.9 1,329.8 (230.1)
Health Services Licenses Fund 8,914.1 9,372.7 9,372.7 11,017.0 1,644.3
Child Care and Development Fund 831.6 887.9 887.9 887.9 0.0
Disease Control Research Fund 83.4 0.0 0.0 1,000.0 1,000.0
Health Research Fund 3,501.3 4,000.0 4,000.0 3,000.0 (1,000.0)
Nuclear Emergency Management Fund 0.0 0.0 0.0 789.7 789.7
Emergency Medical Services Operating Fund 5,061.7 6,248.1 6,248.1 5,748.1 (500.0)
Newborn Screening Program Fund 6,798.8 7,674.9 7,674.9 7,674.9 0.0
Nursing Care Institution Protection Fund 22.7 138.2 138.2 138.2 0.0
Environmental Lab License Revolving Fund 841.2 930.4 930.4 930.4 0.0
Child Fatality Review Fund 93.3 96.9 96.9 96.9 0.0
Vital Records Electronic Systems Fund 1,361.5 3,637.4 3,637.4 3,637.4 0.0
The Arizona State Hospital Fund 8,363.3 6,808.8 6,808.8 6,808.8 0.0
DHS State Hospital Land Earnings Fund 738.8 970.0 970.0 650.0 (320.0)
DHS ‐ Indirect Cost Fund 8,449.5 9,581.3 9,581.3 9,811.4 230.1
Agency Total 47,197.1 52,606.5 52,606.5 54,220.5 1,614.0
Board of Homeopathic Medical Examiners
Homeopathic Medical Examiners Fund 65.5 89.0 89.0 90.0 1.0
Department of Housing
Housing Trust Fund 318.5 323.2 323.2 323.2 0.0
Industrial Commission of Arizona
Industrial Commission Admin Fund 18,292.2 20,110.4 20,110.4 20,110.4 0.0
Judiciary
Supreme Court CJEF Disbursements Fund 5,037.9 9,834.8 9,834.8 9,834.8 0.0
Judicial Collection ‐ Enhancement Fund 15,193.0 20,799.3 20,799.3 20,799.3 0.0
Defensive Driving Fund 3,046.6 4,205.9 4,205.9 4,205.9 0.0
Court Appointed Special Advocate Fund 2,876.7 3,348.5 3,348.5 3,598.5 250.0
Confidential Intermediary Fund 219.0 493.6 493.6 493.6 0.0
Drug Treatment and Education Fund 502.4 502.9 502.9 502.9 0.0
State Aid to Courts Fund 2,132.3 2,945.1 2,945.1 2,945.1 0.0
Legislative, Executive, Judicial Public Buildings Land Fund
0.0 137.0 137.0 137.0 0.0
Health Services Lottery Fund 250.0 250.0 250.0 0.0 (250.0)
Agency Total 29,257.9 42,517.1 42,517.1 42,517.1 0.0
Department of Juvenile Corrections
Juvenile Corrections CJEF Dist Fund 516.0 531.3 531.3 531.3 0.0
State Education Fund for Committed Youth Fund
1,036.8 1,591.2 1,591.2 1,591.2 0.0
Local Cost Sharing Fund 11,260.0 11,260.0 11,260.0 11,260.0 0.0
State Charitable, Penal and Reformatory Land Fund
1,963.6 3,272.6 3,272.6 4,272.6 1,000.0
Agency Total 14,776.4 16,655.1 16,655.1 17,655.1 1,000.0
40 FY 2019 Executive Budget

Expenditures Appropriation
Executive Budget
Executive Budget
Changes and Adjustments
FY 2017 FY 2018
FY 2018 FY 2019FY 2019
Other Appropriated Funds Operating Budgets Summary(Dollars in Thousands)
Land Department
Environmental Special Plate Fund 147.5 260.6 260.6 260.6 0.0
Due Diligence Fund 0.0 500.0 500.0 500.0 0.0
Trust Land Management Fund 2,632.6 6,489.4 6,489.4 7,289.4 800.0
Agency Total 2,780.1 7,250.0 7,250.0 8,050.0 800.0
Auditor General
Arizona Water Banking Fund 0.0 200.0 200.0 0.0 (200.0)
Department of Liquor Licenses and Control
Liquor Licenses Fund 3,858.7 3,047.5 3,047.5 3,138.6 91.1
Lottery Commission
Lottery Fund 99,356.1 114,420.9 114,420.9 131,550.7 17,129.8
Massage Therapy
Massage Therapy Board Fund 413.7 466.1 466.1 469.8 3.7
Medical Board
Medical Examiners Board Fund 6,606.0 6,841.9 6,841.9 6,859.3 17.4
Mine Inspector
Aggregate Mining Reclamation Fund 20.6 112.9 112.9 112.9 0.0
Naturopathic Physicians Board of Medical Examiners
Naturopathic Board Fund 162.3 183.0 206.0 184.5 1.5
Navigable Stream Adjudication Commission
Arizona Water Banking Fund 185.2 200.0 200.0 200.0 0.0
Board of Nursing
Nursing Board Fund 4,775.6 4,860.5 4,860.5 4,538.4 (322.1)
Nursing Care Ins. Admin. Examiners
Nursing Care Institution Admin/ACHMC Fund 370.7 426.5 426.5 450.9 24.4
Board of Occupational Therapy Examiners
Occupational Therapy Fund 161.2 183.7 183.7 180.3 (3.4)
Board of Dispensing Opticians
Dispensing Opticians Board Fund 119.4 141.7 155.7 148.5 6.8
Board of Optometry
Board of Optometry Fund 203.4 222.2 222.2 244.7 22.5
Board of Osteopathic Examiners
Osteopathic Examiners Board Fund 847.7 913.1 913.1 913.1 0.0
Parks Board
State Parks Revenue Fund 13,338.4 14,401.5 14,401.5 14,801.5 400.0
Personnel Board
Personnel Division Fund 323.1 378.1 378.1 378.7 0.6
Board of Pharmacy
Pharmacy Board Fund 2,666.8 2,294.7 2,294.7 2,180.2 (114.5)
Board of Physical Therapy Examiners
Physical Therapy Fund 437.9 448.0 448.0 486.4 38.4
FY 2019 Executive Budget 41

Expenditures Appropriation
Executive Budget
Executive Budget
Changes and Adjustments
FY 2017 FY 2018
FY 2018 FY 2019FY 2019
Other Appropriated Funds Operating Budgets Summary(Dollars in Thousands)
Pioneers' Home
Pioneers' Home State Charitable Earnings Fund
4,056.7 4,547.9 4,547.9 4,547.9 0.0
Pioneers' Home Miners' Hospital Fund 1,972.2 2,057.7 2,057.7 2,189.5 131.8
Agency Total 6,028.9 6,605.6 6,605.6 6,737.4 131.8
Board of Podiatry Examiners
Podiatry Examiners Board Fund 135.4 149.7 149.7 160.1 10.4
Commission for Postsecondary Education
Postsecondary Education Fund 1,518.9 1,541.1 1,541.1 1,541.1 0.0
Board for Private Postsecondary Education
Private Postsecondary Education Fund 396.3 421.0 421.0 333.4 (87.6)
Board of Psychologist Examiners
Psychologist Examiners Board Fund 446.4 480.6 480.6 497.9 17.3
Department of Public Safety
State Highway Fund 7,301.8 8,713.5 8,713.5 13,913.5 5,200.0
Arizona Highway Patrol Fund 24,112.2 25,474.4 25,474.4 25,474.4 0.0
Automobile Theft Authority Fund 3,000.0 0.0 0.0 6,138.4 6,138.4
Safety Enforcement and Transportation Infrastructure Fund
1,551.8 1,634.4 1,634.4 1,634.4 0.0
Drug and Gang Prevention Resource Center Fund
1,000.0 0.0 0.0 758.1 758.1
Crime Laboratory Assessment Fund 870.2 870.3 870.3 0.0 (870.3)
Auto Fingerprint Identification Fund 896.7 2,919.7 2,919.7 0.0 (2,919.7)
DNA Identification System Fund 4,637.3 4,970.1 4,970.1 0.0 (4,970.1)
Public Safety Equipment Fund 2,783.3 3,893.7 3,893.7 3,893.7 0.0
Crime Laboratory Operations Fund 13,218.1 13,611.3 13,611.3 0.0 (13,611.3)
Gang and Immigration Intelligence Team Enforcement Mission Fund
4,517.4 2,527.7 2,527.7 2,527.7 0.0
Fingerprint Clearance Card Fund 0.0 700.0 700.0 700.0 0.0
State Aid to Indigent Defense Fund 561.9 700.0 700.0 700.0 0.0
Motorcycle Safety Fund 0.0 205.0 205.0 205.0 0.0
Parity Compensation Fund 2,129.4 3,422.3 3,422.3 3,422.3 0.0
Concealed Weapons Permit Fund 1,491.8 1,420.0 1,420.0 1,420.0 0.0
Highway User Revenue Fund 95,908.4 99,398.7 99,398.7 99,398.7 0.0
DPS Criminal Justice Enhancement Fund 2,860.5 2,873.4 2,873.4 2,873.4 0.0
Risk Management Fund 1,263.7 1,314.2 1,314.2 1,314.2 0.0
DPS Forensics Fund 0.0 0.0 0.0 22,371.4 22,371.4
Agency Total 168,104.5 174,648.7 174,648.7 186,745.2 12,096.5
Radiation Regulatory Agency
State Radiologic Technologist Certification Fund
249.1 273.8 273.8 0.0 (273.8)
Nuclear Emergency Management Fund 0.0 789.7 789.7 0.0 (789.7)
Radiation Regulatory Fee Fund 555.9 582.9 582.9 0.0 (582.9)
Agency Total 805.0 1,646.4 1,646.4 0.0 (1,646.4)
42 FY 2019 Executive Budget

Expenditures Appropriation
Executive Budget
Executive Budget
Changes and Adjustments
FY 2017 FY 2018
FY 2018 FY 2019FY 2019
Other Appropriated Funds Operating Budgets Summary(Dollars in Thousands)
Residential Utility Consumer Office
Residential Utility Consumer Office Revolving Fund
1,150.0 1,344.3 1,344.3 1,344.3 0.0
Board of Respiratory Care Examiners
Board of Respiratory Care Examiners Fund 297.8 323.3 323.3 323.5 0.2
Arizona State Retirement System
Retirement System Appropriated Fund 22,588.0 22,667.7 22,667.7 22,442.7 (225.0)
LTD Trust Fund 1,641.0 2,500.0 2,500.0 2,200.0 (300.0)
Agency Total 24,229.0 25,167.7 25,167.7 24,642.7 (525.0)
Department of Revenue
Tobacco Tax and Health Care Fund 619.8 684.6 684.6 684.6 0.0
Department of Revenue Administrative Fund 43,214.9 45,303.7 45,303.7 45,303.7 0.0
DOR Liability Setoff Fund 331.6 404.1 404.1 804.1 400.0
Empowerment Scholarship Account Fund 0.0 50.0 50.0 50.0 0.0
DOR Collections Fund 0.0 0.0 0.0 2,000.0 2,000.0
Agency Total 44,166.3 46,442.4 46,442.4 48,842.4 2,400.0
Department of State ‐ Secretary of State
Election Systems Improvement Fund 1,458.1 2,943.7 2,943.7 2,943.7 0.0
Records Services Fund 692.7 751.8 751.8 1,351.8 600.0
Agency Total 2,150.8 3,695.5 3,695.5 4,295.5 600.0
Board of Technical Registration
Technical Registration Board Fund 2,261.8 2,233.7 2,233.7 2,298.7 65.0
Department of Transportation
State Aviation Fund 1,573.6 2,103.1 2,103.1 1,637.1 (466.0)
State Highway Fund 335,234.2 361,130.8 361,130.8 384,911.9 23,781.1
Highway Damage Recovery Account 0.0 3,000.0 3,000.0 4,000.0 1,000.0
Transportation Department Equipment Fund 16,536.8 18,726.3 18,726.3 18,726.3 0.0
Safety Enforcement and Transportation Infrastructure Fund
1,832.6 1,897.4 1,897.4 1,497.5 (399.9)
Air Quality Fund 161.6 161.7 161.7 324.2 162.5
Vehicle Inspection and Title Enforcement Fund
1,435.2 1,464.4 1,464.4 1,464.4 0.0
Motor Vehicle Liability Insurance Enforcement Fund
2,395.1 1,332.4 1,332.4 2,982.3 1,649.9
Driving Under Influence Abatement Fund 149.3 153.4 153.4 153.4 0.0
Highway User Revenue Fund 602.5 656.1 656.1 656.1 0.0
Ignition Interlock Device Fund 0.0 0.0 0.0 150.0 150.0
Agency Total 359,920.9 390,625.6 390,625.6 416,503.2 25,877.6
Treasurer
Boating Safety Fund 2,183.8 2,183.8 2,183.8 2,183.8 0.0
Treasurer Empowerment Scholarship Account Fund
79.4 304.4 304.4 304.4 0.0
State Treasurer's Operating Fund 2,514.4 2,595.6 2,595.6 2,595.6 0.0
State Treasurer's Management Fund 195.6 295.6 295.6 295.6 0.0
Agency Total 4,973.2 5,379.4 5,379.4 5,379.4 0.0
FY 2019 Executive Budget 43

Expenditures Appropriation
Executive Budget
Executive Budget
Changes and Adjustments
FY 2017 FY 2018
FY 2018 FY 2019FY 2019
Other Appropriated Funds Operating Budgets Summary(Dollars in Thousands)
Arizona State University
ASU Collections ‐ Appropriated Fund 667,300.8 681,632.6 681,632.6 681,632.6 0.0
Technology and Research Initiative Fund 3,600.0 3,600.0 3,600.0 3,600.0 0.0
Agency Total 670,900.8 685,232.6 685,232.6 685,232.6 0.0
Northern Arizona University
NAU Collections ‐ Appropriated Fund 147,283.3 157,431.1 157,431.1 157,431.1 0.0
University of Arizona ‐ Main Campus
U of A Main Campus ‐ Collections ‐ Appropriated Fund
370,627.6 410,094.7 410,094.7 410,094.7 0.0
University of Arizona ‐ Health Sciences Center
U of A Main Campus ‐ Collections ‐ Appropriated Fund
50,924.8 49,749.0 49,749.0 49,749.0 0.0
Department of Veterans' Services
Veterans' Conservatorship Fund 302.7 0.0 0.0 0.0 0.0
State Home for Veterans Trust Fund 29,787.6 35,492.7 35,492.7 35,563.8 71.1
Agency Total 30,090.3 35,492.7 35,492.7 35,563.8 71.1
Veterinary Medical Examining Board
Veterinary Medical Examiners Board Fund 503.0 590.0 590.0 604.4 14.4
Department of Water Resources
Arizona Water Banking Fund 0.0 1,211.4 1,211.4 1,211.4 0.0
Water Resources Fund 608.6 641.4 641.4 941.4 300.0
Assured and Adequate Water Supply Administration Fund
0.0 266.8 266.8 266.8 0.0
Agency Total 608.6 2,119.6 2,119.6 2,419.6 300.0
Other Appropriated Funds Operating Total 3,768,658.2 4,379,834.8 4,394,944.3 4,502,683.9 122,849.1
The total amount listed reflects agency operating expenditures and appropriations, but does not include expenditures and appropriations for capital projects or other selected statewide items, such as retirement contribution adjustments.
44 FY 2019 Executive Budget

Resources
Governor’s Office of Strategic Planning and Budgeting
Website
Executive Budgets for FY 2018 and Previous Years
Statement of Federal Funds
Master List of State Government Programs
Constitutional Appropriation Limit Calculation
State Agency Technical Resources
Agency Budget Development Software and Training Resources
Managing for Results, Arizona’s Strategic Planning Handbook
Other Helpful Links
Arizona’s Official Website
Governor’s Website
The Arizona Experience Website
State Agencies’ Websites
Openbooks, a searchable database of the State Accounting System
Arizona Employment Statistics
Arizona Population Statistics
FY 2018 Appropriations Report
FY 2019 Executive Budget 45

Acknowledgement
Governor Ducey gratefully acknowledges the skilled and dedicated efforts of the staff of the Governor’s Office of Strategic Planning and Budgeting.
Director Matthew Gress
Assistant Directors Bret Cloninger Bill Greeney
Budget Managers Kaitlin Harrier Charles Martin Fletcher Montzingo
Senior Budget Analyst Bashar Naji
Budget Analysts Ben Blink Ashley Beason Sarah Pirzada Cristina Tunon Ryan Vergara Jacob Wingate
Analyst
Chief Economist Tax Policy Advisor
Justin Romney
Glenn Farley
Systems Analyst Tao Jin
Office Manager
Interns
Pamela Ray
Andrea Sirois Jordan Neubauer
46 FY 2019 Executive Budget