Embed Size (px)
Citation preview
8/13/2019 State Median Household Income
http://slidepdf.com/reader/full/state-median-household-income 1/6
8/13/2019 State Median Household Income
http://slidepdf.com/reader/full/state-median-household-income 2/6
MIDWEST
FOR MORE INFORMATION VISIT WWW.CSG.ORG/BOOKOFTHESTATES A PRODUCT OF CAP
THE COUNCIL OF STATE GOVER2014
THE BOOK OF THE STATES 2014
Facts & FiguresSTATE MEDIAN HOUSEHOLD INCOME
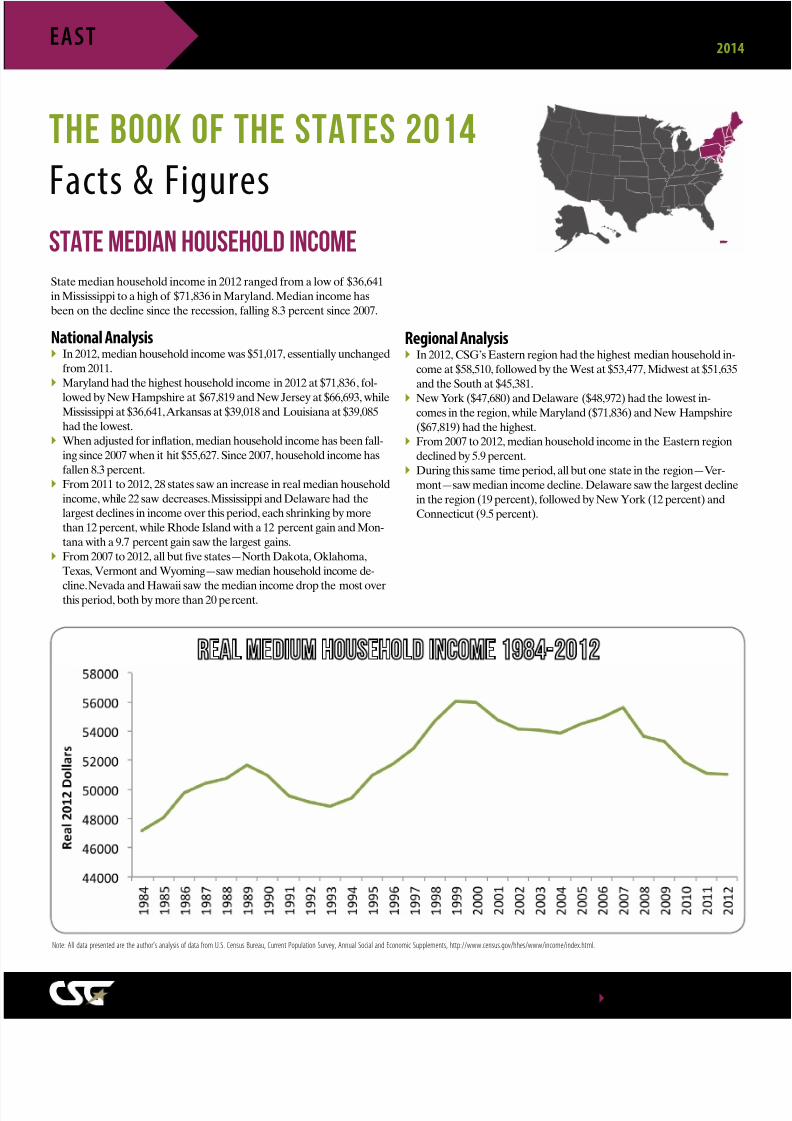
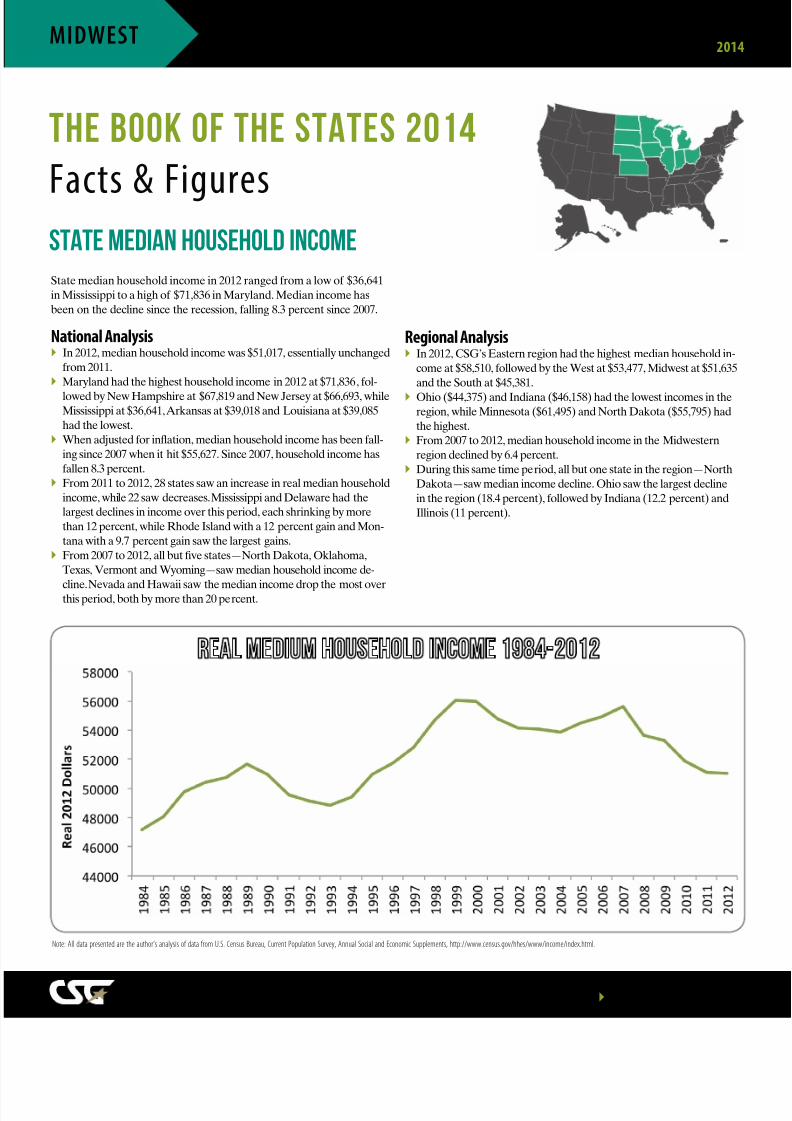
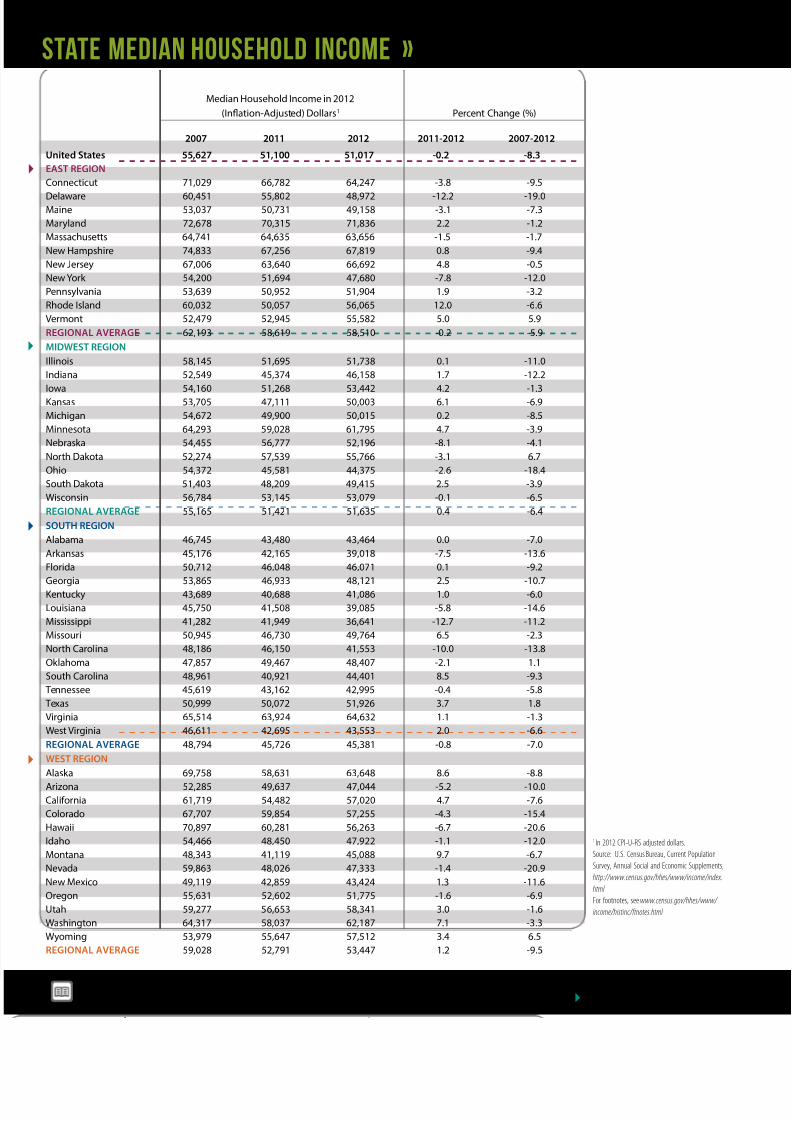
State median household income in 2012 ranged from a low of $36,641in Mississippi to a high of $71,836 in Maryland. Median income hasbeen on the decline since the recession, falling 8.3 percent since 2007.
National AnalysisIn 2012, median household income was $51,017, essentially unchangedfrom 2011.Maryland had the highest household income in 2012 at $71,836, fol-lowed by New Hampshire at $67,819 and New Jersey at $66,693, whileMississippi at $36,641, Arkansas at $39,018 and Louisiana at $39,085had the lowest.
When adjusted for ination, median household income has been fall-ing since 2007 when it hit $55,627. Since 2007, household income hasfallen 8.3 percent.From 2011 to 2012, 28 states saw an increase in real median householdincome, while 22 saw decreases. Mississippi and Delaware had thelargest declines in income over this period, each shrinking by morethan 12 percent, while Rhode Island with a 12 percent gain and Mon-tana with a 9.7 percent gain saw the largest gains.From 2007 to 2012, all but ve states—North Dakota, Oklahoma,Texas, Vermont and Wyoming—saw median household income de-
cline. Nevada and Hawaii saw the median income drop the most overthis period, both by more than 20 percent.
Regional Analysis In 2012, CSG’s Eastern region had the highest median household in-come at $58,510, followed by the West at $53,477, Midwest at $51,635and the South at $45,381.
Ohio ($44,375) and Indiana ($46,158) had the lowest incomes in theregion, while Minnesota ($61,495) and North Dakota ($55,795) hadthe highest.From 2007 to 2012, median household income in the Midwesternregion declined by 6.4 percent.During this same time period, all but one state in the region—NorthDakota—saw median income decline. Ohio saw the largest declinein the region (18.4 percent), followed by Indiana (12.2 percent) andIllinois (11 percent).
Note: All data presented are the author’s analysis of data from U.S. Census Bureau, Current Population Survey, Annual Social and Economic Supplements, http://www.census.gov/hhes/www/income/index
8/13/2019 State Median Household Income
http://slidepdf.com/reader/full/state-median-household-income 3/6
SOUTH
A PRODUCT OF CAPITOL RFOR MORE INFORMATION VISIT WWW.CSG.ORG/BOOKOFTHESTATES
THE COUNCIL OF STATE GOVE 201
THE BOOK OF THE STATES 2014
Facts & FiguresSTATE MEDIAN HOUSEHOLD INCOME
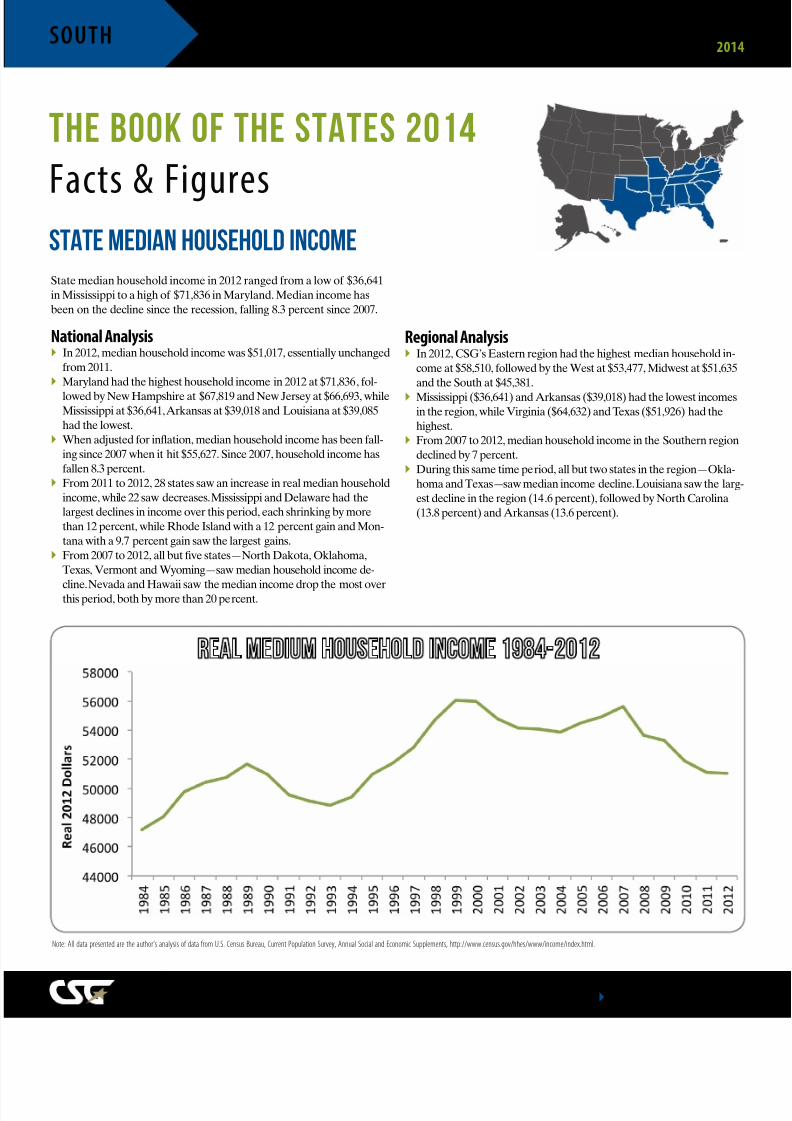
State median household income in 2012 ranged from a low of $36,641in Mississippi to a high of $71,836 in Maryland. Median income hasbeen on the decline since the recession, falling 8.3 percent since 2007.
National Analysis` In 2012, median household income was $51,017, essentially unchanged
from 2011.` Maryland had the highest household income in 2012 at $71,836, fol-
lowed by New Hampshire at $67,819 and New Jersey at $66,693, whileMississippi at $36,641, Arkansas at $39,018 and Louisiana at $39,085had the lowest.
` When adjusted for ination, median household income has been fall-ing since 2007 when it hit $55,627. Since 2007, household income hasfallen 8.3 percent.
` From 2011 to 2012, 28 states saw an increase in real median householdincome, while 22 saw decreases. Mississippi and Delaware had thelargest declines in income over this period, each shrinking by morethan 12 percent, while Rhode Island with a 12 percent gain and Mon-tana with a 9.7 percent gain saw the largest gains.
` From 2007 to 2012, all but ve states—North Dakota, Oklahoma,Texas, Vermont and Wyoming—saw median household income de-
cline. Nevada and Hawaii saw the median income drop the most overthis period, both by more than 20 percent.
Regional Analysis ` In 2012, CSG’s Eastern region had the highest median household in-come at $58,510, followed by the West at $53,477, Midwest at $51,635and the South at $45,381.
` Mississippi ($36,641) and Arkansas ($39,018) had the lowest incomesin the region, while Virginia ($64,632) and Texas ($51,926) had thehighest.
` From 2007 to 2012, median household income in the Southern regiondeclined by 7 percent.
` During this same time period, all but two states in the region—Okla-homa and Texas—saw median income decline. Louisiana saw the larg-est decline in the region (14.6 percent), followed by North Carolina(13.8 percent) and Arkansas (13.6 percent).
Note: All data presented are the author’s analysis of data from U.S. Census Bureau, Current Population Survey, Annual Social and Economic Supplements, http://www.census.gov/hhes/www/income/index
8/13/2019 State Median Household Income
http://slidepdf.com/reader/full/state-median-household-income 4/6
WEST
A PRODUCT OF CAPITOL RFOR MORE INFORMATION VISIT WWW.CSG.ORG/BOOKOFTHESTATES
THE COUNCIL OF STATE GOVE 201
THE BOOK OF THE STATES 2014
Facts & FiguresSTATE MEDIAN HOUSEHOLD INCOME
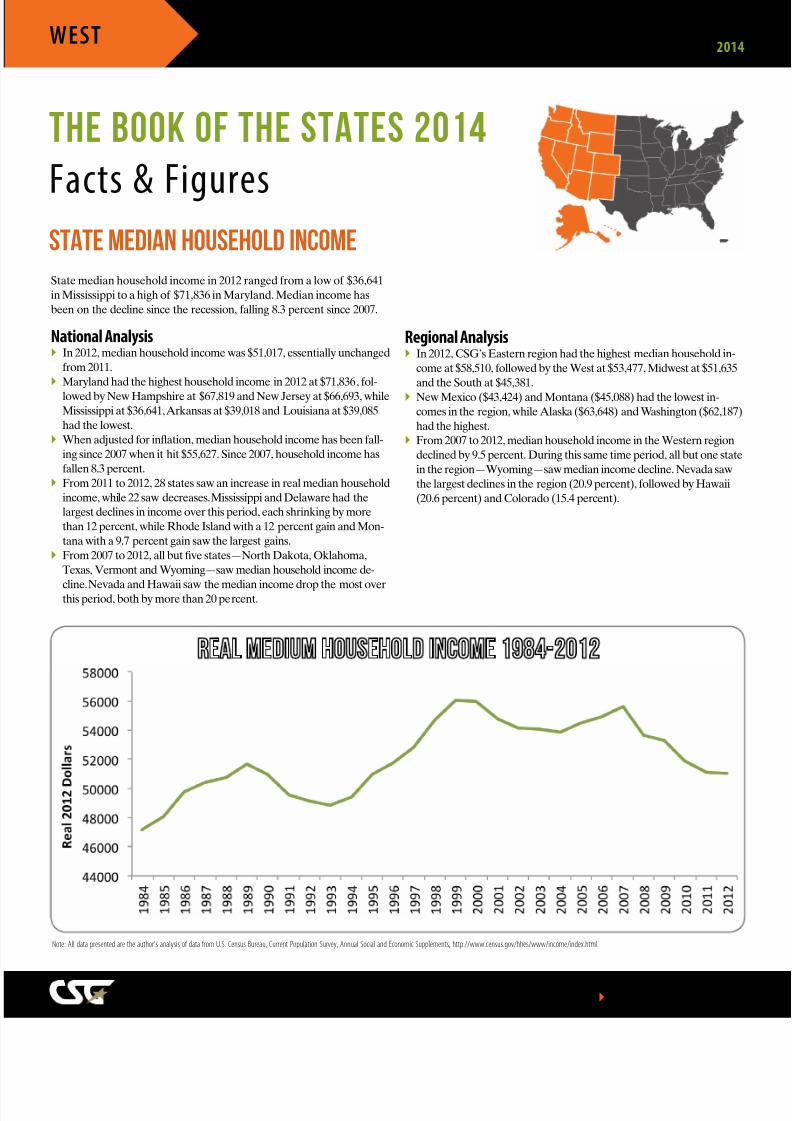
State median household income in 2012 ranged from a low of $36,641in Mississippi to a high of $71,836 in Maryland. Median income hasbeen on the decline since the recession, falling 8.3 percent since 2007.
National Analysis` In 2012, median household income was $51,017, essentially unchanged
from 2011.` Maryland had the highest household income in 2012 at $71,836, fol-
lowed by New Hampshire at $67,819 and New Jersey at $66,693, whileMississippi at $36,641, Arkansas at $39,018 and Louisiana at $39,085had the lowest.
` When adjusted for ination, median household income has been fall-ing since 2007 when it hit $55,627. Since 2007, household income hasfallen 8.3 percent.
` From 2011 to 2012, 28 states saw an increase in real median householdincome, while 22 saw decreases. Mississippi and Delaware had thelargest declines in income over this period, each shrinking by morethan 12 percent, while Rhode Island with a 12 percent gain and Mon-tana with a 9.7 percent gain saw the largest gains.
` From 2007 to 2012, all but ve states—North Dakota, Oklahoma,Texas, Vermont and Wyoming—saw median household income de-
cline. Nevada and Hawaii saw the median income drop the most overthis period, both by more than 20 percent.
Regional Analysis ` In 2012, CSG’s Eastern region had the highest median household in-come at $58,510, followed by the West at $53,477, Midwest at $51,635and the South at $45,381.
` New Mexico ($43,424) and Montana ($45,088) had the lowest in-comes in the region, while Alaska ($63,648) and Washington ($62,187)had the highest.
` From 2007 to 2012, median household income in the Western regiondeclined by 9.5 percent. During this same time period, all but one statein the region—Wyoming—saw median income decline. Nevada sawthe largest declines in the region (20.9 percent), followed by Hawaii(20.6 percent) and Colorado (15.4 percent).
Note: All data presented are the author’s analysis of data from U.S. Census Bureau, Current Population Survey, Annual Social and Economic Supplements, http://www.census.gov/hhes/ww
8/13/2019 State Median Household Income
http://slidepdf.com/reader/full/state-median-household-income 5/6` A PRODUCT OF CAPITO` A PRODUCT OF CAPITO
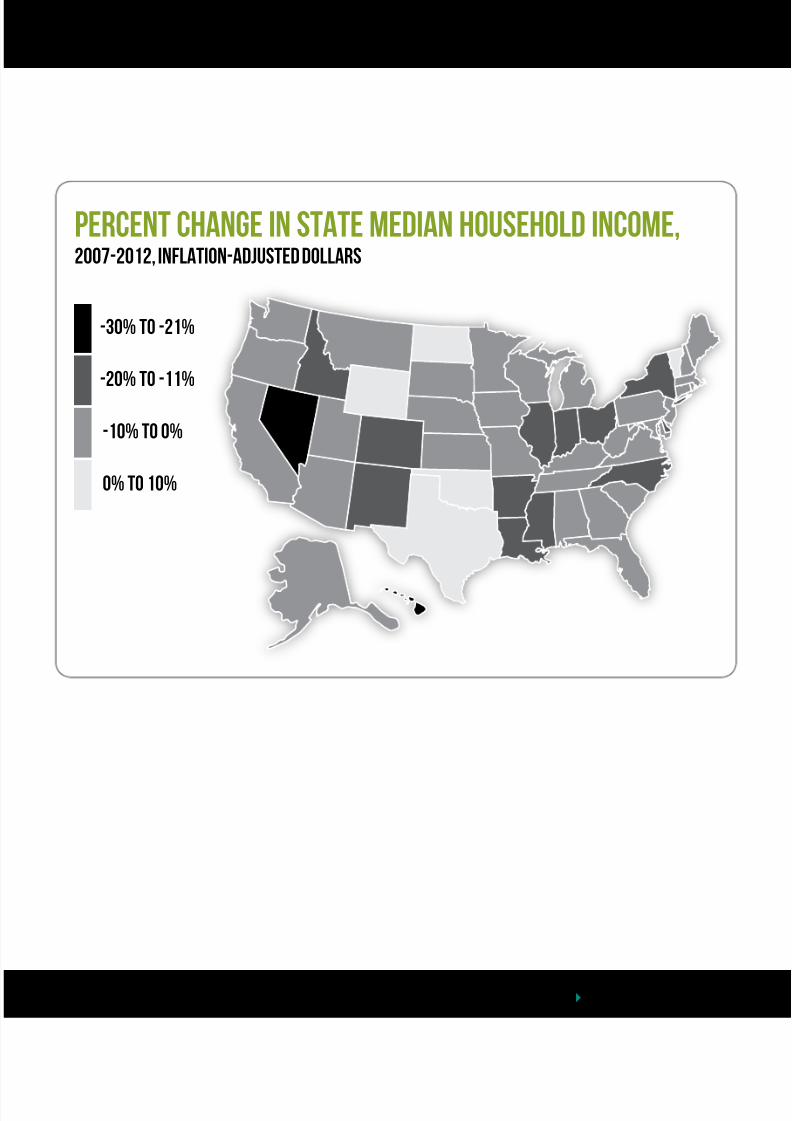
Percent Change in State Median Household Income,2007-2012, Inflation-Adjusted Dollars
-30% to -21%
-20% to -11%
-10% to 0%
0% to 10%
8/13/2019 State Median Household Income
http://slidepdf.com/reader/full/state-median-household-income 6/6 A PRODUCT OF CAPITOL RESEA
THE COUNCIL OF STATE GOVERNM
Jennifer Burnett, CSG Program Manager, Research Services and Special Projects | [email protected] Burnett, CSG Program Manager, Fiscal and Economic Development Policy | [email protected] ` A PRODUCT OF CAPITO
STATE MEDIAN HOUSEHOLD INCOME »
Median Household Income in 2012(Ination-Adjusted) Dollars 1 Percent Change (%)
2007 2011 2012 2011-2012 2007-2012
United States 55,627 51,100 51,017 -0.2 -8.3
EAST REGION
Connecticut 71,029 66,782 64,247 -3.8 -9.5
Delaware 60,451 55,802 48,972 -12.2 -19.0Maine 53,037 50,731 49,158 -3.1 -7.3Maryland 72,678 70,315 71,836 2.2 -1.2Massachusetts 64,741 64,635 63,656 -1.5 -1.7New Hampshire 74,833 67,256 67,819 0.8 -9.4New Jersey 67,006 63,640 66,692 4.8 -0.5New York 54,200 51,694 47,680 -7.8 -12.0Pennsylvania 53,639 50,952 51,904 1.9 -3.2Rhode Island 60,032 50,057 56,065 12.0 -6.6Vermont 52,479 52,945 55,582 5.0 5.9REGIONAL AVERAGE 62,193 58,619 58,510 -0.2 -5.9MIDWEST REGION
Illinois 58,145 51,695 51,738 0.1 -11.0Indiana 52,549 45,374 46,158 1.7 -12.2
Iowa 54,160 51,268 53,442 4.2 -1.3Kansas 53,705 47,111 50,003 6.1 -6.9Michigan 54,672 49,900 50,015 0.2 -8.5Minnesota 64,293 59,028 61,795 4.7 -3.9Nebraska 54,455 56,777 52,196 -8.1 -4.1North Dakota 52,274 57,539 55,766 -3.1 6.7Ohio 54,372 45,581 44,375 -2.6 -18.4South Dakota 51,403 48,209 49,415 2.5 -3.9Wisconsin 56,784 53,145 53,079 -0.1 -6.5REGIONAL AVERAGE 55,165 51,421 51,635 0.4 -6.4SOUTH REGION
Alabama 46,745 43,480 43,464 0.0 -7.0Arkansas 45,176 42,165 39,018 -7.5 -13.6Florida 50,712 46,048 46,071 0.1 -9.2Georgia 53,865 46,933 48,121 2.5 -10.7Kentucky 43,689 40,688 41,086 1.0 -6.0Louisiana 45,750 41,508 39,085 -5.8 -14.6Mississippi 41,282 41,949 36,641 -12.7 -11.2Missouri 50,945 46,730 49,764 6.5 -2.3North Carolina 48,186 46,150 41,553 -10.0 -13.8Oklahoma 47,857 49,467 48,407 -2.1 1.1South Carolina 48,961 40,921 44,401 8.5 -9.3 Tennessee 45,619 43,162 42,995 -0.4 -5.8 Texas 50,999 50,072 51,926 3.7 1.8Virginia 65,514 63,924 64,632 1.1 -1.3West Virginia 46,611 42,695 43,553 2.0 -6.6REGIONAL AVERAGE 48,794 45,726 45,381 -0.8 -7.0WEST REGION
Alaska 69,758 58,631 63,648 8.6 -8.8
Arizona 52,285 49,637 47,044 -5.2 -10.0California 61,719 54,482 57,020 4.7 -7.6Colorado 67,707 59,854 57,255 -4.3 -15.4Hawaii 70,897 60,281 56,263 -6.7 -20.6Idaho 54,466 48,450 47,922 -1.1 -12.0Montana 48,343 41,119 45,088 9.7 -6.7Nevada 59,863 48,026 47,333 -1.4 -20.9New Mexico 49,119 42,859 43,424 1.3 -11.6Oregon 55,631 52,602 51,775 -1.6 -6.9Utah 59,277 56,653 58,341 3.0 -1.6Washington 64,317 58,037 62,187 7.1 -3.3Wyoming 53,979 55,647 57,512 3.4 6.5REGIONAL AVERAGE 59,028 52,791 53,447 1.2 -9.5
1In 2012 CPI-U-RS adjusted dollars.Source: U.S. Census Bureau, Current PoSurvey, Annual Social and Economic Suhttp://www.census.gov/hhes/www/income/inhtml For footnotes, seewww.census.gov/hhes/www/ income/histinc/ftnotes.html