Embed Size (px)
Citation preview

STATE HANDBOOK: SOUTH AUSTRALIA OCTOBER 2017
CONTENTS 2 | Key points 3 | In Focus: A relatively broad-based recovery 4 | Consumer & household sector 5 | NAB customer spending behaviours 6 | Business sector 7 | Commercial property sector 8 | Residential property 9 | Demographics 10 | Labour market 11 | Economic structure and trade 12 | Fiscal outlook 13 | Semi government and credit outlook 14 | State and territory forecasts
CONTACTS
Riki Polygenis Alex Stanley Head of Australian Senior Interest Rate Strategist +61 3 8697 9534 +61 2 9237 8154 +61 475 986 285 [email protected] [email protected]
Important Notice This document has been prepared by National Australia Bank Limited ABN 12 004 044 937 AFSL 230686 ("NAB"). Any advice contained in this document has been prepared without taking into account your objectives, financial situation or needs. Before acting on any advice in this document, NAB recommends that you consider whether the advice is appropriate for your circumstances. NAB recommends that you obtain and consider the relevant Product Disclosure Statement or other disclosure document, before making any decision about a product including whether to acquire or to continue to hold it. Please click here to view our disclaimer and terms of use.

-2
0
2
4
6
8
10
1992 1996 2000 2004 2008 2012 2016
SA Australia
CHART 1: STATE GSP GROWTH FORECASTS Annual average growth (%), see last page for table
CHART 2: STATE FINAL DEMAND Year-ended % change
Source: ABS and NAB Group Economics 2
KEY POINTS: South Australia experiencing a modest cyclical recovery
South Australia is experiencing a cyclical recovery at present, with infrastructure spending providing support and a more competitive AUD (despite appreciation this year) assisting international education and tourism, as well as manufacturing (outside of auto and steel, including wine). State final demand expanded by 2.6% in 2016-17 following growth of just 1.1% in 2015-16, with the latest figures for Q2 even faster at a year-ended rate of 4.0% yoy (and above national domestic final demand growth of 2.4% yoy). Real gross state product is estimated to have increased by 1¾-2 % in 2016-17 following growth of 1.9% in 2015-16, although these annual average figures do not fully capture the strengthening momentum in recent quarters.
The recent economic upswing has been reflected in a particularly large surge in business conditions in recent months, with the improvement relatively broad-based across all sectors except mining and retail.
The labour market has improved, with employment growth picking up to 2.0% yoy and the trend unemployment rate dropping to 6.1% in Aug-17 from a peak of almost 8% in mid-15. This has supported housing construction, and helped sustain moderate growth in household consumption in the face of falling average wages, although it has so far been insufficient to stem the slowdown in population growth and negative interstate migration. Encouragingly, there has been a large lift in manufacturing and construction jobs, and in male full-time employment this year, although the closure of Holden’s Elizabeth plant in October will weigh (~1K direct jobs to be lost with estimates up to 24K jobs through the supply chain at risk). Employment growth for females has also picked up more recently, largely in part-time work.
Despite recent momentum, there are some key challenges ahead. The closure of Holden’s Elizabeth plant is imminent, dwelling construction has likely peaked, and uncertainty remains around energy supply (and prices). Construction of the Royal Adelaide Hospital has reached technical completion, and government infrastructure spending overall is forecast to peak in 2017-18 at a record $2.2bn (largely roads, public transport, hospitals and education), and ease off thereafter. That said, attempts to re-purpose and modernise the manufacturing industry, especially via the National Shipbuilding Plan will add significantly to growth in coming years - the redevelopment of the Osborne naval shipyard starts in late 2017, construction of 2 of the 12 offshore patrol vessels commences in 2018, major surface combatants (9 frigates) are to start in 2020 and 12 submarines are to commence in 2022-23 at Osborne. The state government has committed $550m in new spending on energy security, and $50m to ensure the survival of the Arrium Steelworks in Whyalla. Despite strong community opposition, a proposal to store nuclear waste in SA has also not been ruled out. The expansion of BHP’s Olympic Dam was put on hold in 2013, although strength in copper prices may support exports values and state government royalties if sustained. Seasonal conditions are mixed so far in 2017-18, with winter crop production to be lower, although the outlook for wine exports remains bright. Net services exports (international students and tourism) will likely to continue to expand solidly.
Meanwhile, the structural challenges facing the state remain. These include a more rapidly ageing population than the rest of Australia, negative interstate migration (particularly of young workers), and a more narrow industrial base (although policy is moving in the right direction here). Overall, we forecast real GSP growth to pick up to 2¾% in 2017-18 (partly due to the higher base) following estimated growth of ~2% in 2016-17, before easing back to 1¾% in 2018-19. The unemployment rate is forecast at 6.5% on average through 2017-18, with softer employment outcomes offset to some extent by slow population growth, before holding steady in 2018-19. Dwelling prices in Adelaide are forecast to grow modestly overall (see within).
0
1
2
3
4
5
6
NSW VIC QLD SA WA TAS NT ACT
2014-15 2015-16 2016-17 (f) 2017-18 (f) 2018-19 (f)

6.76.6
5.21.7
1.21.00.9
0.70.50.5
0.10.1
0.0-0.2-0.3
-1.0-2.8
-4.9-5.4
-9 -8 -7 -6 -5 -4 -3 -2 -1 0 1 2 3 4 5 6 7 8
ManufacturingConstruction
Admin servicesArts
Public adminRental services
HealthUtilitiesMining
EducationCommunications
TransportWholesale trade
Other servicesFinance
Retail tradeAgricultureHospitality
Business services
IN FOCUS: A relatively broad-based recovery, for now
Construction activity has also picked up in SA. This has been most evident in public investment figures, while dwelling construction has been steady at a high level. These are both likely to be peaking soon, as discussed on page 2. Meanwhile, household spending has continued at a moderate rate. Net exports are likely to have subtracted from growth in 2016-17, largely due to declines in wheat, meat, copper & automotive parts. These aggregate trade figures mask strength in services exports (international education and tourism). While Victoria and NSW appear to be capturing the greatest share of this growth, international student enrolments are growing rapidly, while domestic and international visitor nights are also picking up (Chart 6). Data on exports by commodity is also likely to show strength in wine exports in 2016-17 (as per the national trend).
Sources: ABS, NAB Group Economics, Tourism Research Australia
The pick-up in economic momentum in South Australia so far in 2017 appears relatively broad-based across industries, with all industries except for retail trade and mining reporting positive business conditions. Large improvements have been evident in wholesale, transport/utilities, manufacturing, construction and finance/business/property services, while recreational and personal services have remained strong. This has translated through to better labour market conditions, with employment growth surging to 2% yoy, although, employment growth has been more concentrated in manufacturing, construction and admin services.
CHART 6: TOURISM AND INTERNATIONAL EDUCATION INDICATORS
CHART 3: SA BUSINESS CONDITIONS BY INDUSTRY Net balance, seasonally adjusted, quarterly
CHART 4: CHANGE IN EMPLOYMENT BY INDUSTRY 12 months to AUGUST 2017, SA, Persons, 000s
CHART 5: COMPONENTS ESTIMATED STATE FINAL DEMAND Contribution to growth in SFD + net exports, annual average
3
-80-60-40-20
020406080
2013 2014 2015 2016 2017Construction Fin/Bus/Prop Manuf Mining
Rec & pers serv Retail Wholesale Trans/Util
5
10
15
20
25
30
35
5
10
15
20
25
30
35
2007 2009 2011 2013 2015 2017International visitor nights (millions)Domestic visitor nights (millions)International Student Enrolments (thousands), YTD July
-2.0
-1.0
0.0
1.0
2.0
3.0
4.0
2012-13 2013-14 2014-15 2015-16 2016-17
Net exports
GovernmentconsumptionUnderlying publicinvestmentUnderlying businessinvestmentDwelling investment
Household consumption
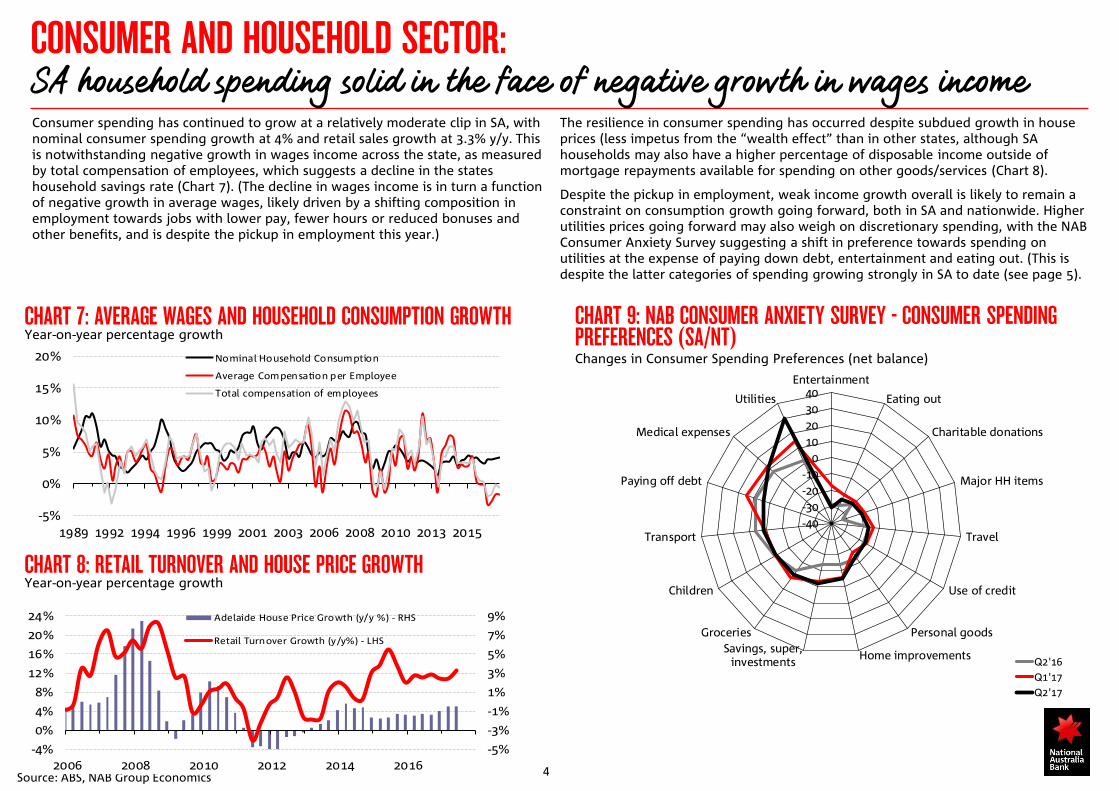
CONSUMER AND HOUSEHOLD SECTOR: SA household spending solid in the face of negative growth in wages income
The resilience in consumer spending has occurred despite subdued growth in house prices (less impetus from the “wealth effect” than in other states, although SA households may also have a higher percentage of disposable income outside of mortgage repayments available for spending on other goods/services (Chart 8).
Despite the pickup in employment, weak income growth overall is likely to remain a constraint on consumption growth going forward, both in SA and nationwide. Higher utilities prices going forward may also weigh on discretionary spending, with the NAB Consumer Anxiety Survey suggesting a shift in preference towards spending on utilities at the expense of paying down debt, entertainment and eating out. (This is despite the latter categories of spending growing strongly in SA to date (see page 5).
Source: ABS, NAB Group Economics 4
Consumer spending has continued to grow at a relatively moderate clip in SA, with nominal consumer spending growth at 4% and retail sales growth at 3.3% y/y. This is notwithstanding negative growth in wages income across the state, as measured by total compensation of employees, which suggests a decline in the states household savings rate (Chart 7). (The decline in wages income is in turn a function of negative growth in average wages, likely driven by a shifting composition in employment towards jobs with lower pay, fewer hours or reduced bonuses and other benefits, and is despite the pickup in employment this year.)
CHART 7: AVERAGE WAGES AND HOUSEHOLD CONSUMPTION GROWTH Year-on-year percentage growth
CHART 8: RETAIL TURNOVER AND HOUSE PRICE GROWTH Year-on-year percentage growth
-5%
0%
5%
10%
15%
20%
1989 1992 1994 1996 1999 2001 2003 2006 2008 2010 2013 2015
Nominal Household Consumption
Average Compensation per Employee
Total compensation of employees
-5%
-3%
-1%
1%
3%
5%
7%
9%
-4%
0%
4%
8%
12%
16%
20%
24%
2006 2008 2010 2012 2014 2016
Adelaide House Price Growth (y/y %) - RHS
Retail Turnover Growth (y/y%) - LHS
-40-30-20-10
010203040
Entertainment
Eating out
Charitable donations
Major HH items
Travel
Use of credit
Personal goods
Home improvementsSavings, super,investments
Groceries
Children
Transport
Paying off debt
Medical expenses
Utilities
Q2'16Q1'17Q2'17
CHART 9: NAB CONSUMER ANXIETY SURVEY - CONSUMER SPENDING PREFERENCES (SA/NT) Changes in Consumer Spending Preferences (net balance)

NAB CUSTOMER SPENDING BEHAVIOURS: Spending growth subdued, but faster in regional areas
Source: ABS, NAB Group Economics 5
NAB’s customer transaction data allows for a more granular look at consumer spending behaviour across regions in SA. In the Adelaide metro area, growth in the value of spending was soft at 1.9% yoy. It was fastest for Arts & Recreation (33.9%), Accommodation & Food Services (10.2%) and Other Services (6.8%), but contracted for Wholesale Trade (-16.0%), Financial & Insurance Services (-11.9%), Education & Training (-6.8%) and Electricity, Gas, Water & Waste (-6.0%). By postcode, overall customer spending growth was fastest in Gepps Cross, Mallala, Virginia and Kangarilla. Spending growth was faster for regional SA (at 6.0% yoy), although average spend was lower at $1,785 compared with $2,143 for Adelaide Metro. By postcode, growth was fastest in Truro, Booleroo Centre, Owen and Edithburgh.
CHART 10: GREATER ADELAIDE METRO AREA Year-ended growth to Q2 2017, nominal
CHART 11: REGIONAL SA (EX METRO) Year-ended growth to Q2 2017, nominal
CHART 12: TOP 20 GROWING METRO POSTCODES FOR SPENDING Year-ended growth to Q2 2017
CHART 13: TOP 20 GROWING REGIONAL POSTCODES FOR SPENDING Year-ended growth to Q2 2017
Overall Growth
1.9%
Average Monthly
Spend (Q2) $2,143
Overall Growth
6.0%
Average Monthly
Spend (Q2) $1,785
24.4
%
22.4
%
17.7
%
16.9
%
15.2
%
15.0
%
14.3
%
12.2
%
12.1
%
11.2
%
10.0
%
9.9%
9.8%
9.6%
9.0%
8.6%
8.5%
8.1%
7.7%
7.4%
0%
5%
10%
15%
20%
25%
30%
Gep
ps
Cro
ss
Mal
lala
Vir
gin
ia
Kan
gar
illa
No
var
Gar
den
s
Penf
ield
Mea
dow
s
Bela
ir
Wal
kerv
ille
Wo
od
ville
Wes
t
Tap
ero
o
Man
sfie
ld P
ark
Myr
tle
Ban
k
Will
un
ga
Lobe
thal
Ker
sbro
ok
Ferr
yden
Par
k
Burt
on
Ku
rral
ta P
ark
Ald
gat
e
5094 5502 5120 5157 5040 5121 5201 5052 5081 5011 5017 5012 5064 5172 5241 5231 5010 5110 5037 5154
53.9
%
36.0
%
32.8
%
28.1
%
26.9
%
25.4
%
25.1
%
24.8
%
23.6
%
22.3
%
20.6
%
20.3
%
20.2
%
19.9
%
19.8
%
19.3
%
19.0
%
17.5
%
16.0
%
15.9
%
0%
10%
20%
30%
40%
50%
60%
Tru
ro
Boo
lero
o C
entr
e
Ow
en
Edit
hb
urg
h
Crys
tal B
roo
k
Ro
ber
tsto
wn
Mila
ng
Lau
ra
Was
leys
Wat
erva
le
Gla
dst
on
e
Port
Ger
mei
n
Wilm
ing
ton
The
Co
oro
ng
Ro
be
Port
Bro
ug
hto
n
Mo
nas
h
Kar
oo
nda
Tin
tin
ara
Kin
gsc
ote
53565482546055835523538152565480540054525473549554855261527655225342530752665223
-20
-10
0
10
20
30
40 Net Balance (%). June quarter 2017
Conditions Confidence
-30
-20
-10
0
10
20
30
40
-30
-20
-10
0
10
20
30
40
2006 2007 2008 2009 2010 2011 2012 2013 2014 2015 2016 2017
Total South Australia
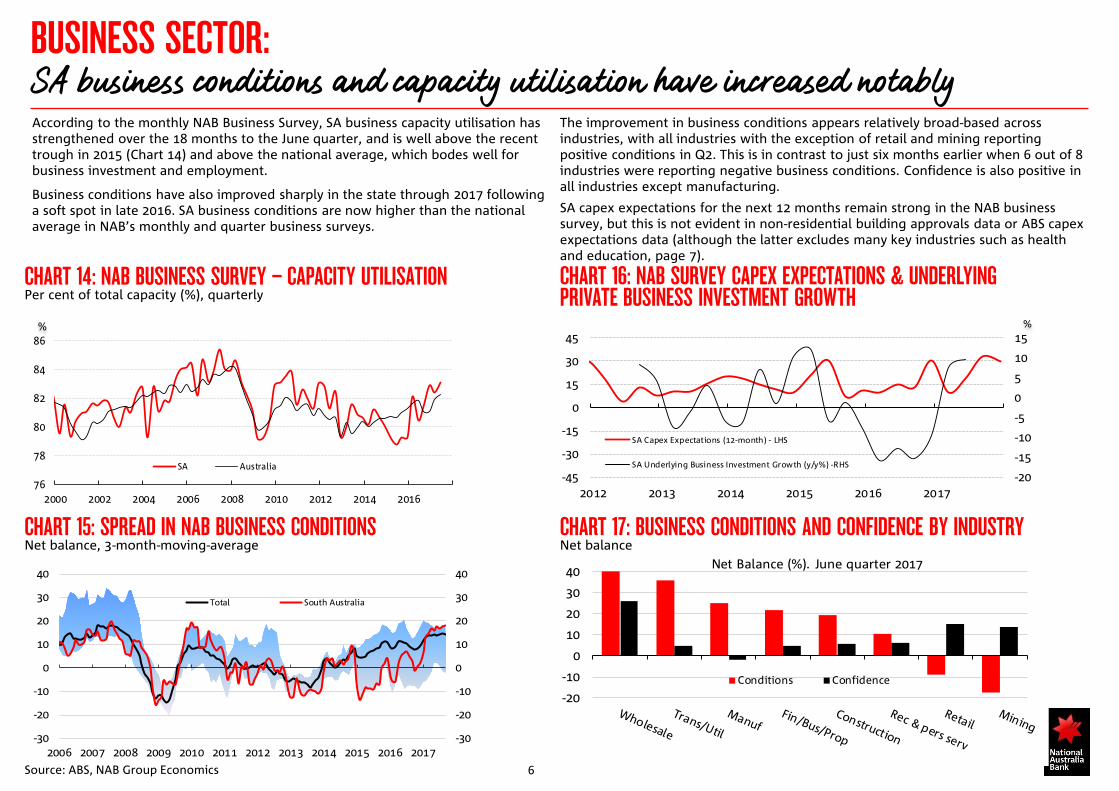
BUSINESS SECTOR: SA business conditions and capacity utilisation have increased notably
The improvement in business conditions appears relatively broad-based across industries, with all industries with the exception of retail and mining reporting positive conditions in Q2. This is in contrast to just six months earlier when 6 out of 8 industries were reporting negative business conditions. Confidence is also positive in all industries except manufacturing.
SA capex expectations for the next 12 months remain strong in the NAB business survey, but this is not evident in non-residential building approvals data or ABS capex expectations data (although the latter excludes many key industries such as health and education, page 7).
6 Source: ABS, NAB Group Economics
According to the monthly NAB Business Survey, SA business capacity utilisation has strengthened over the 18 months to the June quarter, and is well above the recent trough in 2015 (Chart 14) and above the national average, which bodes well for business investment and employment.
Business conditions have also improved sharply in the state through 2017 following a soft spot in late 2016. SA business conditions are now higher than the national average in NAB’s monthly and quarter business surveys.
CHART 14: NAB BUSINESS SURVEY – CAPACITY UTILISATION Per cent of total capacity (%), quarterly
CHART 15: SPREAD IN NAB BUSINESS CONDITIONS Net balance, 3-month-moving-average
CHART 16: NAB SURVEY CAPEX EXPECTATIONS & UNDERLYING PRIVATE BUSINESS INVESTMENT GROWTH
CHART 17: BUSINESS CONDITIONS AND CONFIDENCE BY INDUSTRY Net balance
76
78
80
82
84
86
2000 2002 2004 2006 2008 2010 2012 2014 2016
SA Australia
%
-20
-15
-10
-5
0
5
10
15
-45
-30
-15
0
15
30
45
2012 2013 2014 2015 2016 2017
SA Capex Expectations (12-month) - LHS
SA Underlying Business Investment Growth (y/y%) -RHS
%

COMMERCIAL PROPERTY/NON-RESIDENTIAL INVESTMENT: Construction activity tracking at low levels, but retail resilient
The decline of automotive manufacturing will also weigh on machinery & equipment investment in the state going forward. Consequently, capital expenditure expectations for 2017-18 are lower than in 2016-17, although we note that these do not include key industries such as health, education and agriculture. Chart 16).
7 Source: ABS, NAB Group Economics
Non-residential building approvals have fallen further, and overall are consistent with a weak outlook for building activity in the state. The drop off has largely been in “other” - this category includes health and may relate to the technical completion of the Royal Adelaide Hospital (which has now been transferred from the private to the public sector). Retail/wholesale building approvals meanwhile have been resilient, despite weak business conditions for retailers. Office approvals are also at low levels, and the recent tick up in the vacancy rate does not bode well for further construction.
CHART 18: NON-RESIDENTIAL BUILDING APPROVALS Million dollars
CHART 19: OFFICE APPROVALS AND VACANCY RATES
CHART 20: SA CAPITAL EXPENDITURE & EXPECTATIONS Actual & expected based on previous realisation ratio ($billion)
0
70
140
210
280
350
420
490
0
10
20
30
40
50
60
70
2002 2004 2006 2008 2010 2012 2014 2016
Retail/Wholesale -LHS Offices - LHS Factories- LHS
Warehouses-LHS Other-RHS
$m
357911131517190
8162432404856
2006 2008 2010 2012 2014 2016
Office Approvals (lhs)
Office Vacancy Rates (inverse, rhs)
%$m
0
10
20
30
40
50
60
NSW VIC TAS SA QLD WA
2012-13 2013-14 2014-15 2015-16 2016-17 2017-18 (e)

-4.0-3.0-2.0-1.00.01.02.0
Q3'
13
Q4'
13
Q1'
14
Q2'
14
Q3'
14
Q4'
14
Q1'
15
Q2'
15
Q3'
15
Q4'
15
Q1'
16
Q2'
16
Q3'
16
Q4'
16
Q1'
17
Q2'
17
Q3'
17
Nex
t 12m
Nex
t 2y
Australia SA/NT
ExpectationsEstimated price growth in relevant survey period
RESIDENTIAL PROPERTY: Housing market slow overall, but price growth has picked up in some places
Meanwhile, regional house prices have accelerated to 5.1% y/y or an average $279K.
The latest NAB Property Survey suggests industry participants expect only very modest price rises for SA/NT in the next two years (Chart 24).
NAB Group Economics’ forecasts for Adelaide houses is for growth of 3.4% in 2017 and 1.7% in 2018. Growth in prices for units/apartments is forecast to be 0.5% in both 2017 and 2018.
8 Source: ABS, NAB Group Economics
Growth in Adelaide dwelling prices remains relatively subdued overall at 2% growth y/y, increasingly lagging behind the 8-capital-city average (Chart 21). This is largely a function of weaker growth in housing demand as a result of slow population growth and population ageing. There has however been a pick up in price growth for Adelaide detached houses to 6% y/y. Price growth for units/apartments is very low at 1% (Chart 22), and varies significantly across suburbs with prices declining in Northern Adelaide but growing strongly in Eastern Adelaide (Chart 23).
CHART 21: ADELAIDE HOUSE PRICES CoreLogic hedonic prices (index)
CHART 22: SA RESIDENTIAL PROPERTY PRICE GROWTH (Y/Y%) Percentage year-on- year growth (%)
CHART 23: ADELAIDE - MEDIAN PROPERTY PRICE GROWTH Percentage growth in the year to Q2 2017 (%)
CHART 24: NAB PROPERTY SURVEY – HOUSE PRICE EXPECTATIONS Percentage growth (%)
-10
-5
0
5
10
15
20
25
-10%
-5%
0%
5%
10%
15%
20%
25%
2004 2006 2008 2010 2012 2014 2016 2018
Adelaide Houses Adelaide Units
Regional Houses
-4 -2 0 2 4 6 8 10
Eastern Adelaide
Northern Adelaide
Southern Adelaide
Western Adelaide
House Prices
Unit Prices
020406080
100120140160
1995 1998 2001 2004 2007 2010 2013 2016
Index
Adelaide Dwelling Prices (lhs)
Capital City Dwelling Prices (lhs)

-10
-5
0
5
10
15
20
25
2002 2004 2006 2008 2010 2012 2014 2016
'000s Natural increase Net overseas migration
Net interstate migration Total population growth
DEMOGRAPHICS: Negative interstate migration continues to weigh on SA’s population growth
SA’s population remains older on average than the national population, and has also aged more quickly, rising to a median age of 40 in 2016 from less than 36 years a decade earlier. SA has the second oldest population after Tasmania. (Chart 27).
SA’s share of the national population continues to decline, as national population growth picks up while SA population growth slows (Chart 28).
9 Source: ABS, NAB Group Economics
South Australia’s population growth has slowed sharply since 2014 and is now at 0.6% y/y (Chart 25). National population growth by contrast has picked up to 1.6% y/y as at Mar-17. The slowdown in SA is largely due to more negative interstate migration (or outflow to other states), while net overseas migration has been broadly stable at a moderate positive rate (Chart 26).
CHART 28: SA SHARE OF AUS POPULATION AND GROWTH IN MIGRATION Quarterly population change (‘000 persons)/SA population as a percentage share of Australian population (%)
CHART 26: POPULATION GROWTH Four-quarter rolling sum (‘000 persons)
CHART 25: SA AND AUS POPULATION GROWTH Year-ended percentage growth (%)
CHART 27: MEDIAN AGE OF POPULATION BY STATE
0.0
0.5
1.0
1.5
2.0
2.5
1982 1986 1990 1994 1998 2002 2006 2010 2014
SA Pop Growth
AUS Pop Growth
%26 28 30 32 34 36 38 40 42 44
AUSNSW
VICQLD
SAWATASNT
ACT
1996
2016
7.0%7.1%7.2%7.3%7.4%7.5%7.6%7.7%7.8%
-3,000-2,000-1,000
01,0002,0003,0004,0005,0006,000
2002 2004 2006 2008 2010 2012 2014 2016
Net overseas migration (LHS)
Net interstate migration (LHS)
Share of Aus population (RHS)
55
57
59
61
63
65
2
3
4
5
6
7
8
2002 2004 2006 2008 2010 2012 2014 2016
Unemployment rate (trend) (LHS)Participation rate (trend) (RHS)Employment to population ratio (trend) (RHS)
2
4
6
8
10
2002 2004 2006 2008 2010 2012 2014 2016
SA Greater Adelaide Rest of SA
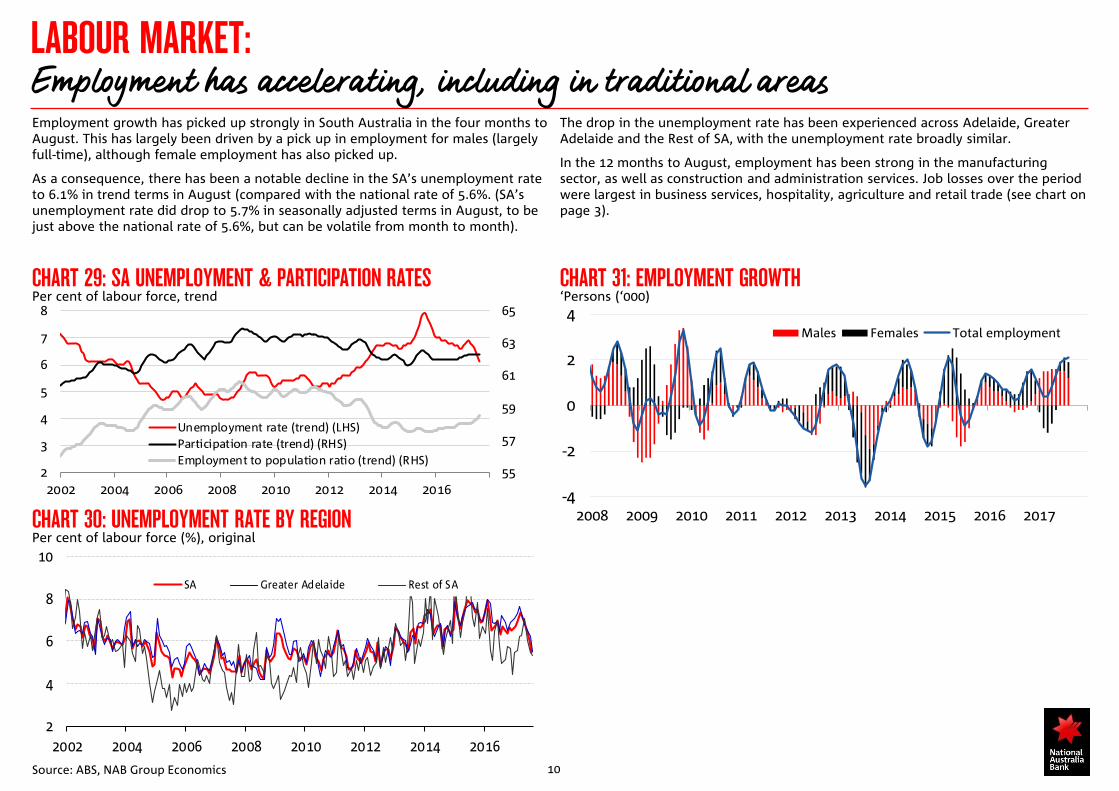
LABOUR MARKET: Employment has accelerating, including in traditional areas
The drop in the unemployment rate has been experienced across Adelaide, Greater Adelaide and the Rest of SA, with the unemployment rate broadly similar.
In the 12 months to August, employment has been strong in the manufacturing sector, as well as construction and administration services. Job losses over the period were largest in business services, hospitality, agriculture and retail trade (see chart on page 3).
10 Source: ABS, NAB Group Economics
Employment growth has picked up strongly in South Australia in the four months to August. This has largely been driven by a pick up in employment for males (largely full-time), although female employment has also picked up.
As a consequence, there has been a notable decline in the SA’s unemployment rate to 6.1% in trend terms in August (compared with the national rate of 5.6%. (SA’s unemployment rate did drop to 5.7% in seasonally adjusted terms in August, to be just above the national rate of 5.6%, but can be volatile from month to month).
CHART 30: UNEMPLOYMENT RATE BY REGION Per cent of labour force (%), original
CHART 31: EMPLOYMENT GROWTH ‘Persons (‘000)
CHART 29: SA UNEMPLOYMENT & PARTICIPATION RATES Per cent of labour force, trend
-4
-2
0
2
4
2008 2009 2010 2011 2012 2013 2014 2015 2016 2017
Males Females Total employment

CHART 32: COMPOSITION OF EMPLOYMENT & GVA Percentage share (%)
11 Source: ABS, NAB Economics, DFAT
ECONOMIC STRUCTURE AND TRADE Health is the largest sector, and SA’s largest trading partners are in Asia
0% 2% 4% 6% 8% 10% 12% 14% 16%
HealthFinance
ManufacturingConstructionPublic admin
TransportBusiness services
EducationRetail tradeAgriculture
Wholesale tradeUtilitiesMining
Admin servicesRental services
HospitalityOther services
CommunicationsArts
GVA Employment
TABLES 33 & 34: TOP SA EXPORT DESTINATIONS AND IMPORT SOURCE COUNTRIES
The health sector continues to dominate in terms of output and (particularly) employment. The traditional industry pillar of manufacturing has declined as a share of output over time, although as at Q2-17 was the third largest employer, and actually increased marginally as a share of total employment to 10% in the past year, although will face a significant challenge as auto manufacturing shuts down in the coming year. Retail trade remains the second-largest employer, although is the 9th largest industry in terms of output. In 2015-16, finance & insurance services overtook manufacturing as the second largest industry by gross value added production, but remains a relative small employer overall (Chart 32).
The ASEAN bloc and China are SA’s main export and import partners (Chart 33 & 34), followed by the EU and the US, and non-ASEAN countries in Asia such as India, Japan and Singapore.
SA’s top commodity exports in 2015-16 included copper as well as copper ores & concentrates, alcoholic beverages, wheat and meat. SA imports top imports are refined petroleum, passenger motor vehicles, vehicle parts and accessories and goods vehicles (Charts 35 & 36).
Million ($m)
TABLES 35 & 36: TOP SA MERCHANDISE EXPORTS AND IMPORTS
Value of exports ($m)1 ASEAN 23632 China 22703 US 12954 EU 12035 India 9616 Japan 6557 New Zealand 4128 UK 3689 Korea 24610 HK 242
Value of imports ($m)1 ASEAN 20752 China 16913 EU 14904 US 8725 Singapore 8106 Japan 6557 Korea 3618 Germany 2819 New Zealand 20310 UK 157
Major exports, goods, 2015-16 ($m)Copper 1382Alcoholic beverages 1359Wheat 1242Copper ores & concentrates 763Meat (excl beef) 732Beef 536Lead 471Iron ore & concentrates 419Vegetables 288Passenger motor vehicles 275
Major imports goods, 2015-16 ($m)Refined petroleum 949Passenger motor vehicles 714Vehicle parts & accessories 373Goods vehicles 355Alcoholic beverages 256Other ores & concentrates 246Furniture, mattresses & cushions 187Heating & cooling equipment & parts 176Fertilisers (ex crude) 173Rotating electric plant & parts 141
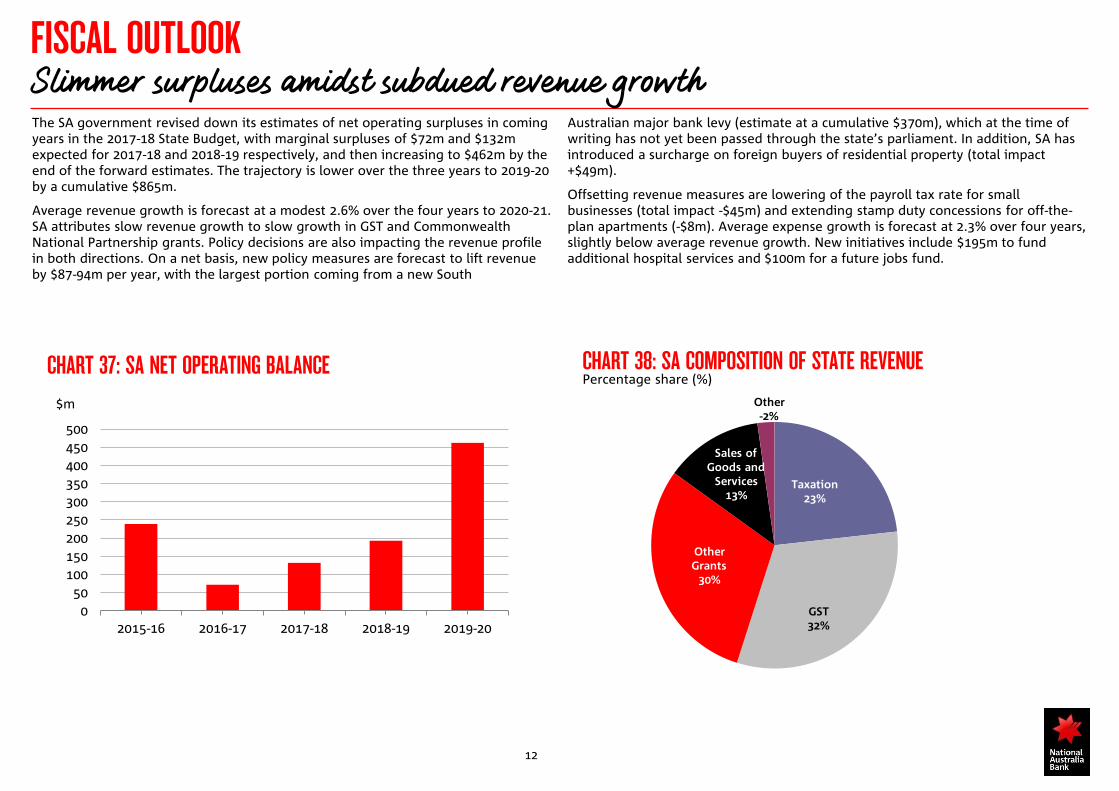
FISCAL OUTLOOK Slimmer surpluses amidst subdued revenue growth
Australian major bank levy (estimate at a cumulative $370m), which at the time of writing has not yet been passed through the state’s parliament. In addition, SA has introduced a surcharge on foreign buyers of residential property (total impact +$49m).
Offsetting revenue measures are lowering of the payroll tax rate for small businesses (total impact -$45m) and extending stamp duty concessions for off-the-plan apartments (-$8m). Average expense growth is forecast at 2.3% over four years, slightly below average revenue growth. New initiatives include $195m to fund additional hospital services and $100m for a future jobs fund.
12
The SA government revised down its estimates of net operating surpluses in coming years in the 2017-18 State Budget, with marginal surpluses of $72m and $132m expected for 2017-18 and 2018-19 respectively, and then increasing to $462m by the end of the forward estimates. The trajectory is lower over the three years to 2019-20 by a cumulative $865m.
Average revenue growth is forecast at a modest 2.6% over the four years to 2020-21. SA attributes slow revenue growth to slow growth in GST and Commonwealth National Partnership grants. Policy decisions are also impacting the revenue profile in both directions. On a net basis, new policy measures are forecast to lift revenue by $87-94m per year, with the largest portion coming from a new South
CHART 37: SA NET OPERATING BALANCE CHART 38: SA COMPOSITION OF STATE REVENUE Percentage share (%)
Taxation23%
GST32%
Other Grants
30%
Sales of Goods and
Services13%
Other-2%
050
100150200250300350400450500
2015-16 2016-17 2017-18 2018-19 2019-20
$m

SEMI GOVERNMENT AND CREDIT OUTLOOK Some budget slippage, but funding needs remain light
SAFA’s term funding requirement for FY17-18 is $2.8bn, which includes $0.1bn of new funding, $2.0bn of maturities and $0.7bn in pre-funding.
SAFA is rated Aa1/stable by Moody’s and AA/positive from S&P. The latest budget slippage suggests S&P is unlikely to act on its positive outlook and upgrade SA’s rating for the foreseeable future.
13
South Australia’s Budget projects slimmer general government surpluses over the next few years. New policy measures have been introduced to increase revenue, including a bank levy, which at the time of writing hasn’t yet passed parliament. Total state net debt is now forecast to rise instead of flattening out in the coming years.
CHART 39: SA NON-FINANCIAL PUBLIC SECTOR NET DEBT CHART 41: S&P CREDIT METRIC: BUDGET PERFORMANCE
METRICS
CHART 40: SAFA TERM BONDS OUTSTANDING
12
13
13
14
14
15
15
16
2016-17 2017-18 2018-19 2019-20 2020-21
$bn
Source: NAB, SA budget
FY-17 BudgetFY17 MYBR
FY18 Budget
Sources: NAB, SA budget
-25%
-20%
-15%
-10%
-5%
0%
5%
10%
2012 2013 2014 2015 2016 2017 2018 2019 2020 2021
Adj Operating balance as % of adjusted operating revenues
S&P balance after capital scoring threshold
S%P Operating balance scoring threshold
Balance after capital account as % total adjusted revenue
Budget 17-18
Budget 17-18
MYBR 16-17
MYBR 16-17
0.0
0.5
1.0
1.5
2.0
2.5AUDbn
SAFA bond curve
Issuance as at 30 June 17
Issuance FYTD

FORECASTS BY STATE AND TERRITORY Base effects to drive SA growth higher in 2017-18, before moderation in 2018-19
Source: ABS, CoreLogic, NAB Economics
NAB’s economic forecasts by state and territory are below. For a summary of the outlook by state, please see the States Handbook – Overview which contains links to the detailed handbook for each state and territory.
REAL GROSS STATE PRODUCT AND UNEMPLOYMENT RATE FORECASTS Annual average
14
HEDONIC HOUSE PRICE FORECASTS* Through the year growth to Q4
HEDONIC UNIT/APARTMENT PRICE FORECASTS * Through the year growth to Q4
2015 2016 2017f 2018f 2019f
Sydney 15.5 10.7 5.1 3.7 3.0
Melbourne 15.8 9.5 8.6 5.5 3.4
Brisbane 6.9 2.7 3.1 1.9 1.2
Adelaide 3.8 3.8 3.4 1.7 1.7
Perth -4.2 -2.9 -3.0 0.7 1.2
Hobart 7.0 9.6 10.0 4.9 1.7
Cap City Avg 11.2 7.3 4.6 3.4 2.5
2015 2016 2017f 2018f 2019f
Sydney 13.1 5.8 5.9 0.5 0.6
Melbourne 7.5 4.7 6.4 1.2 -2.4
Brisbane 1.1 -3.0 -1.1 -1.8 -1.2
Adelaide 2.4 0.6 0.5 0.5 0.5
Perth -2.8 -6.3 -1.9 0.4 0.7
Hobart 1.1 6.4 5.7 2.4 0.6
Cap City Avg 8.2 3.5 4.7 0.5 -0.3
15-16 16-17f 17-18f 18-19f 15-16 16-17 17-18f 18-19fNSW 3.5 2.2 3.1 2.5 5.4 5.0 4.7 4.7VIC 3.3 2.9 3.3 2.7 6.0 5.9 5.8 5.4QLD 2.0 2.2 3.2 2.5 6.2 6.2 6.0 5.9SA 1.9 1.8 2.7 1.7 7.3 6.7 6.5 6.5WA 1.9 0.3 3.2 3.0 6.0 6.2 6.2 5.9TAS 1.3 1.0 2.2 1.8 6.5 6.1 6.0 6.0NT 2.7 1.5 1.5 5.0 4.2 3.5 4.0 4.2ACT 3.4 3.0 3.1 2.6 4.5 3.8 4.8 4.8Australia 2.7 2.0 3.2 2.5 5.9 5.7 5.4 5.3
Gross State Product YoY Unemployment RateNAB growth and unemployment rate forecasts for the states