Embed Size (px)
Citation preview
State Fiscal Outlook for 2008
NASCIO
January 16, 2008
Scott PattisonExecutive Director
National Association of State Budget Officers
444 North Capitol Street, NW, Suite 642 • Washington, DC 20001 • (202) 624-5382 • www.nasbo.org
2NASBO
Current Fiscal Situation
3NASBO
Recent State Fiscal Trends
Slowing revenue in FY 2008 Some states experiencing significant
shortfalls Increased attention towards
infrastructure and transportation Health care Property tax relief
4NASBO
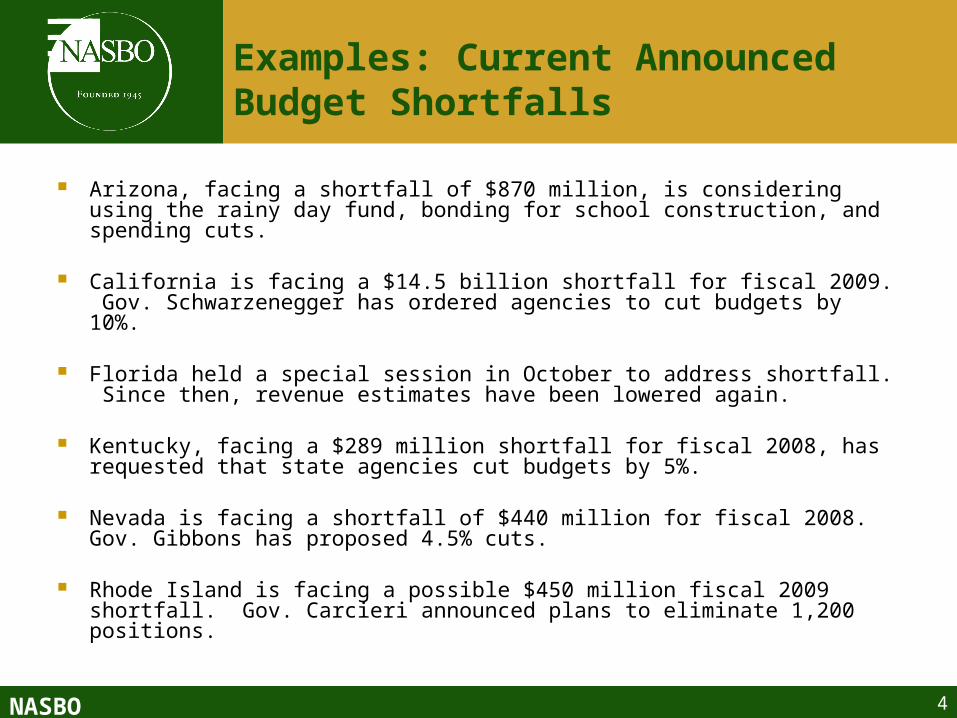
Examples: Current Announced Budget Shortfalls
Arizona, facing a shortfall of $870 million, is considering using the rainy day fund, bonding for school construction, and spending cuts.
California is facing a $14.5 billion shortfall for fiscal 2009. Gov. Schwarzenegger has ordered agencies to cut budgets by 10%.
Florida held a special session in October to address shortfall. Since then, revenue estimates have been lowered again.
Kentucky, facing a $289 million shortfall for fiscal 2008, has requested that state agencies cut budgets by 5%.
Nevada is facing a shortfall of $440 million for fiscal 2008. Gov. Gibbons has proposed 4.5% cuts.
Rhode Island is facing a possible $450 million fiscal 2009 shortfall. Gov. Carcieri announced plans to eliminate 1,200 positions.
5NASBO
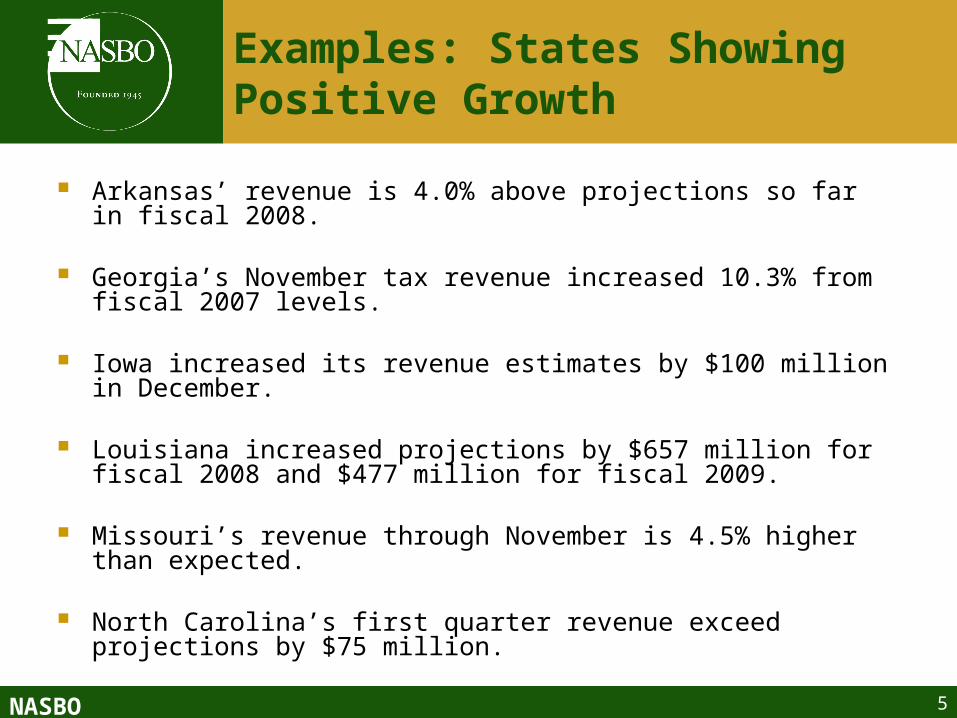
Examples: States Showing Positive Growth
Arkansas’ revenue is 4.0% above projections so far in fiscal 2008.
Georgia’s November tax revenue increased 10.3% from fiscal 2007 levels.
Iowa increased its revenue estimates by $100 million in December.
Louisiana increased projections by $657 million for fiscal 2008 and $477 million for fiscal 2009.
Missouri’s revenue through November is 4.5% higher than expected.
North Carolina’s first quarter revenue exceed projections by $75 million.
6NASBO
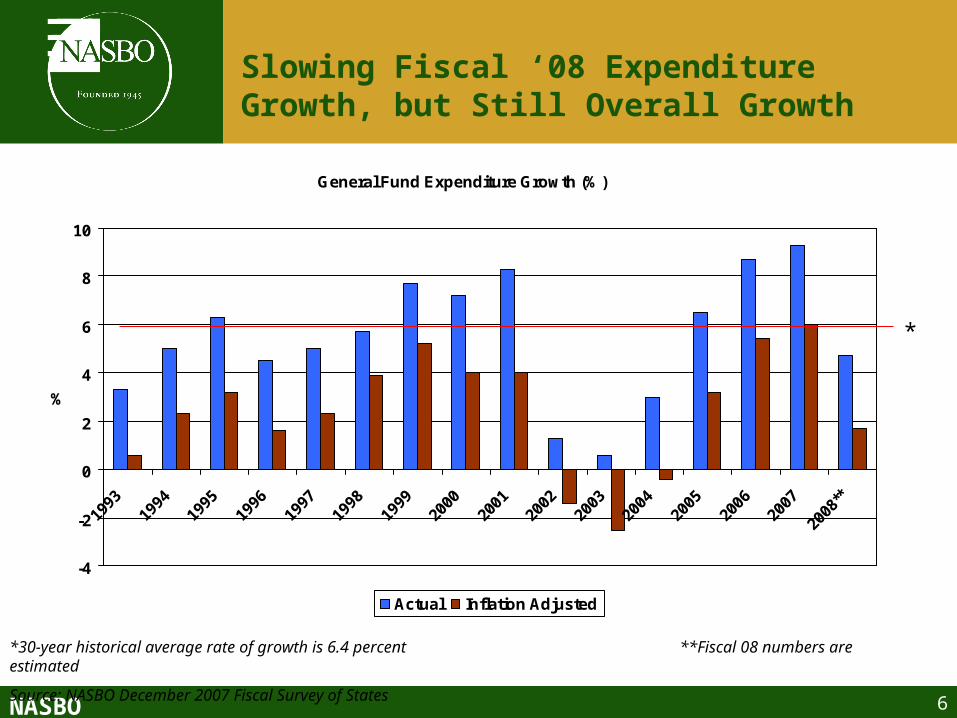
Slowing Fiscal ‘08 Expenditure Growth, but Still Overall Growth
General Fund Expenditure Growth (%)
-4
-2
0
2
4
6
8
10
1993
1994
1995
1996
1997
1998
1999
2000
2001
2002
2003
2004
2005
2006
2007
2008
**
%
Actual Inflation Adjusted
*30-year historical average rate of growth is 6.4 percent **Fiscal 08 numbers are estimated
Source: NASBO December 2007 Fiscal Survey of States
*
7NASBO
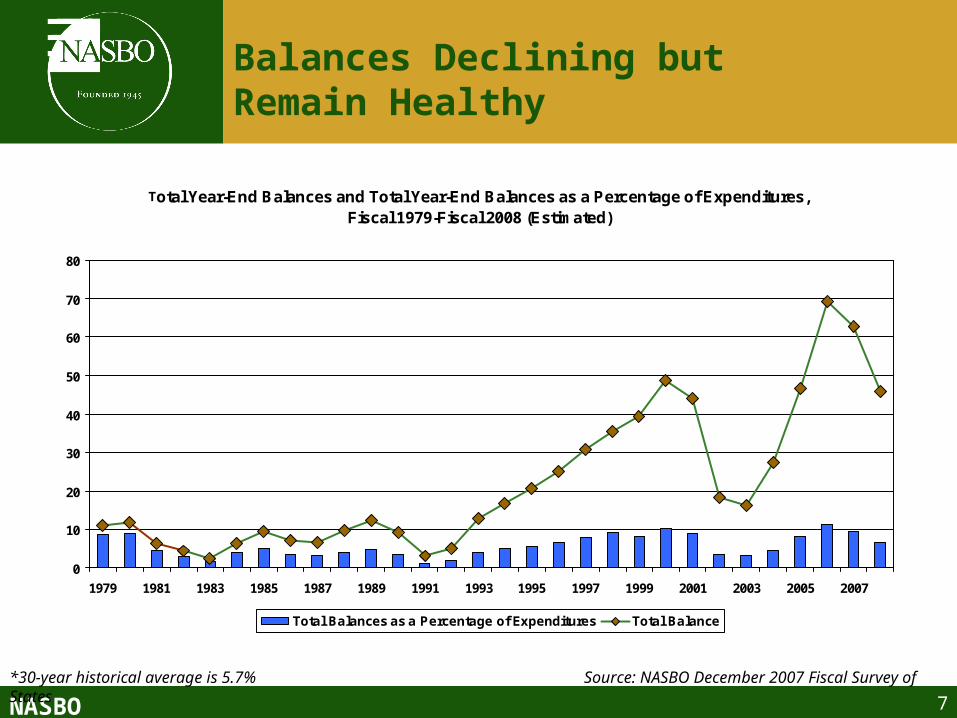
Balances Declining but Remain Healthy
Total Year-End Balances and Total Year-End Balances as a Percentage of Expenditures, Fiscal 1979-Fiscal 2008 (Estimated)
0
10
20
30
40
50
60
70
80
1979 1981 1983 1985 1987 1989 1991 1993 1995 1997 1999 2001 2003 2005 2007
Total Balances as a Percentage of Expenditures Total Balance
*30-year historical average is 5.7% Source: NASBO December 2007 Fiscal Survey of States
8NASBO
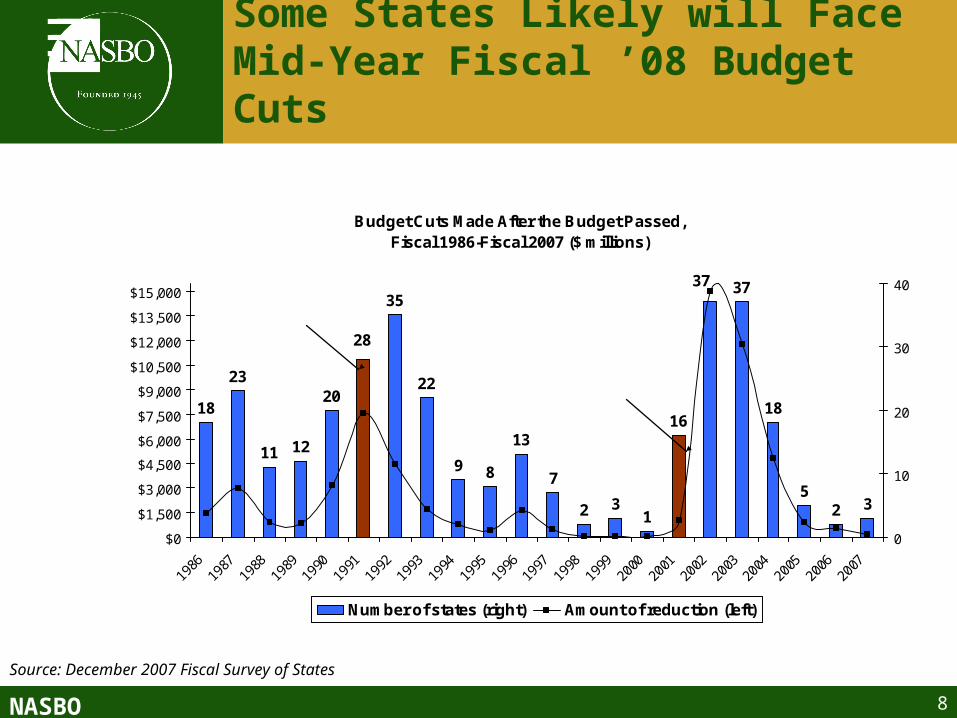
Some States Likely will Face Mid-Year Fiscal ’08 Budget Cuts
Budget Cuts Made After the Budget Passed,Fiscal 1986-Fiscal 2007 ($ millions)
18
23
11 12
20
35
22
9 8
13
7
2 31
16
37
18
52 3
28
37
$0
$1,500
$3,000
$4,500
$6,000
$7,500
$9,000
$10,500
$12,000
$13,500
$15,000
1986
1987
1988
1989
1990
1991
1992
1993
1994
1995
1996
1997
1998
1999
2000
2001
2002
2003
2004
2005
2006
2007
0
10
20
30
40
Number of states (right) Amount of reduction (left)
Recession ends
Recession ends
Source: December 2007 Fiscal Survey of States
9NASBO
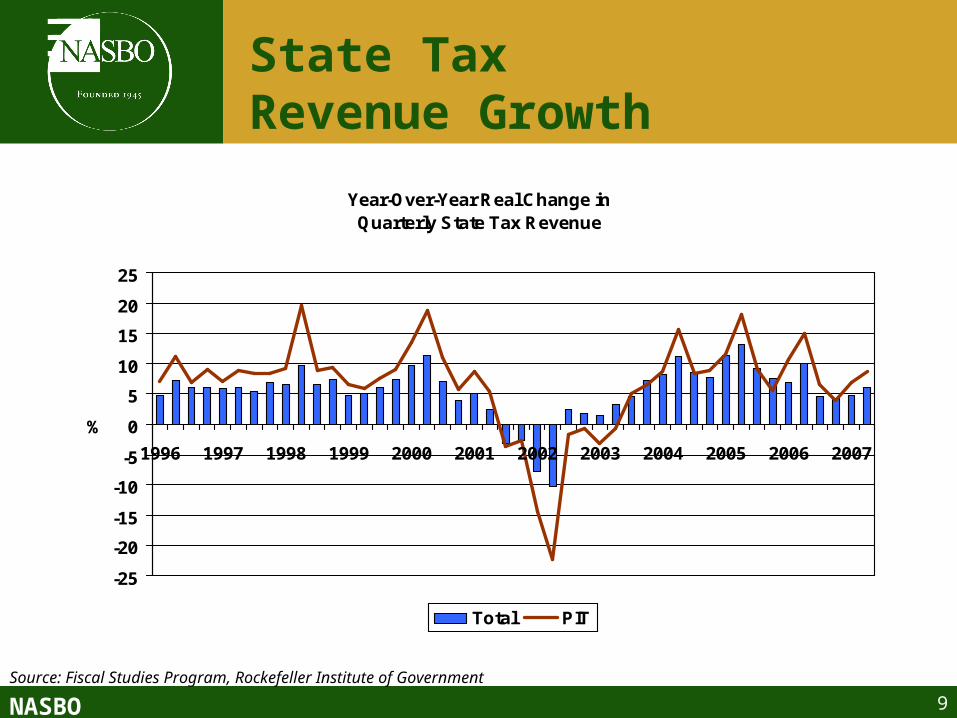
State Tax Revenue Growth
Year-Over-Year Real Change inQuarterly State Tax Revenue
-25
-20
-15
-10
-5
0
5
10
15
20
25
1996 1997 1998 1999 2000 2001 2002 2003 2004 2005 2006 2007
%
Total PIT
Source: Fiscal Studies Program, Rockefeller Institute of Government
10NASBO
Trends
11NASBO
Long Term Spending Pressures
Medicaid and Health Care
K-12 Higher Education Demographic
Changes Infrastructure Pensions
12NASBO
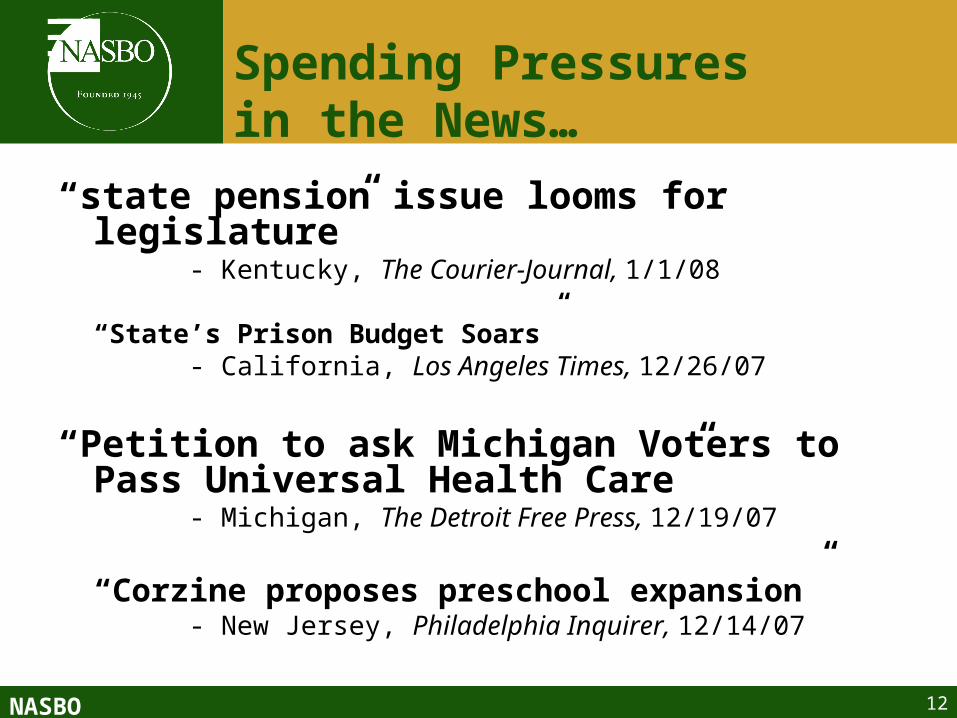
Spending Pressures in the News…
“state pension issue looms for legislature”
- Kentucky, The Courier-Journal, 1/1/08
“State’s Prison Budget Soars”- California, Los Angeles Times, 12/26/07
“Petition to ask Michigan Voters to Pass Universal Health Care”
- Michigan, The Detroit Free Press, 12/19/07
“Corzine proposes preschool expansion” - New Jersey, Philadelphia Inquirer, 12/14/07
13NASBO
FY 2008 Budgetary Issues Medicaid
Economic Woes Housing Downturn Impacting Revenue
Health Care SCHIP, Universal Health Care
Infrastructure/Transportation
Property Tax Relief
14NASBO
Other FY 2008 Issues
Transparency/Accountability
School Funding Pre-K expansion Examining Higher Ed Spending
Search for Alternative Revenue Sources Gaming Leases/Privatization
15NASBO
Background on State Spending Trends
16NASBO
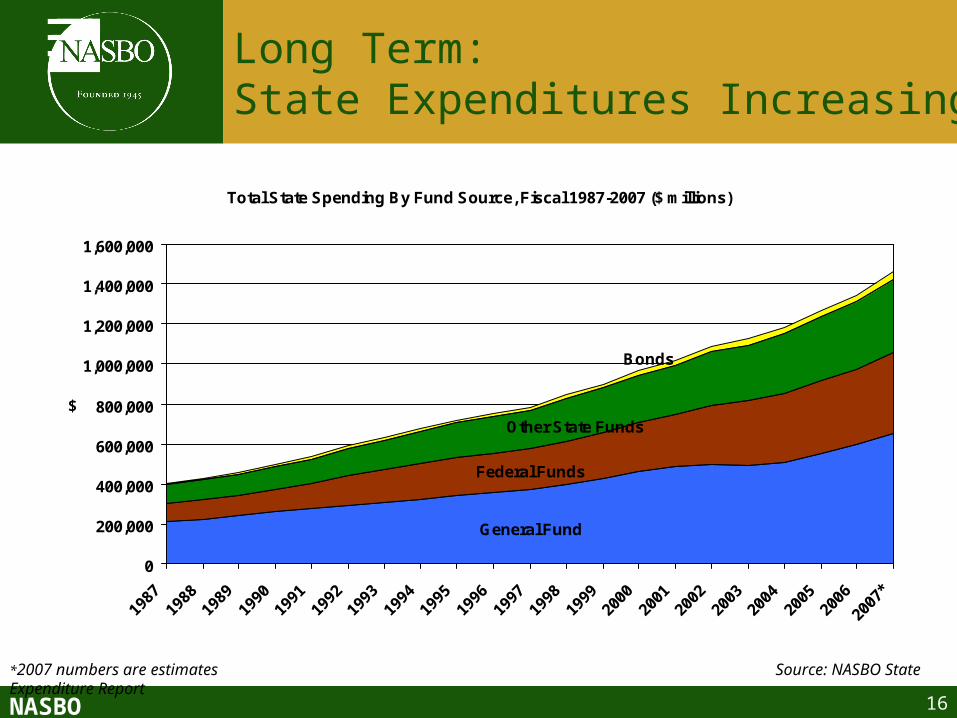
Long Term:State Expenditures Increasing
Total State Spending By Fund Source, Fiscal 1987-2007 ($ millions)
General Fund
Federal Funds
Other State Funds
Bonds
0
200,000
400,000
600,000
800,000
1,000,000
1,200,000
1,400,000
1,600,000
1987
1988
1989
1990
1991
1992
1993
1994
1995
1996
1997
1998
1999
2000
2001
2002
2003
2004
2005
2006
2007
*
$
*2007 numbers are estimates Source: NASBO State Expenditure Report
17NASBO
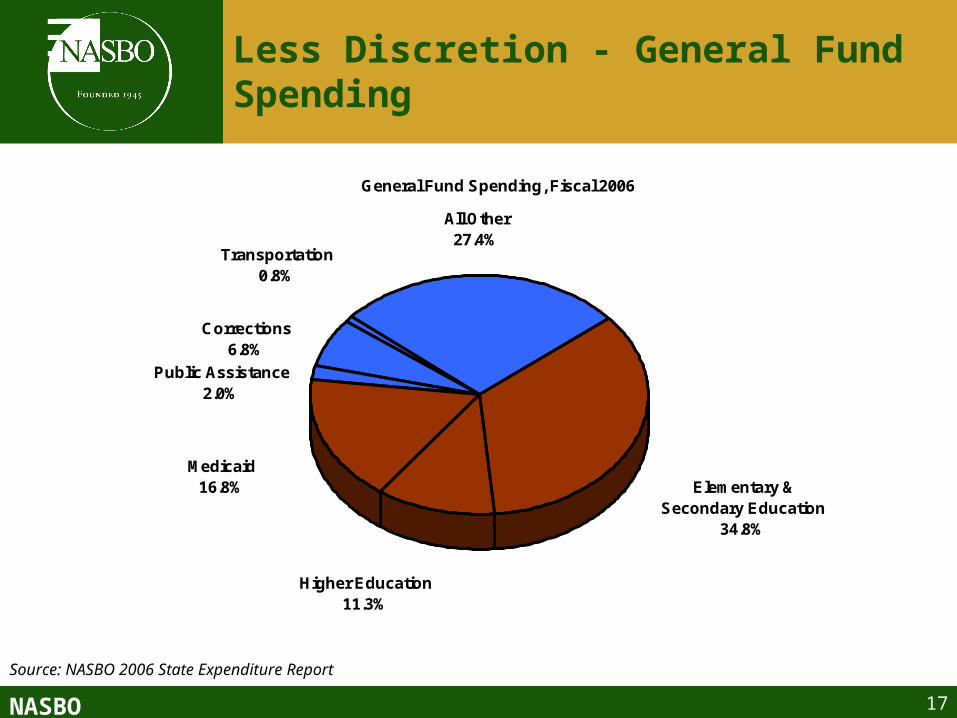
Less Discretion - General Fund Spending
General Fund Spending, Fiscal 2006
All Other27.4%
Transportation0.8%
Corrections6.8%
Public Assistance2.0%
Medicaid16.8%
Higher Education11.3%
Elementary & Secondary Education
34.8%
Source: NASBO 2006 State Expenditure Report
18NASBO
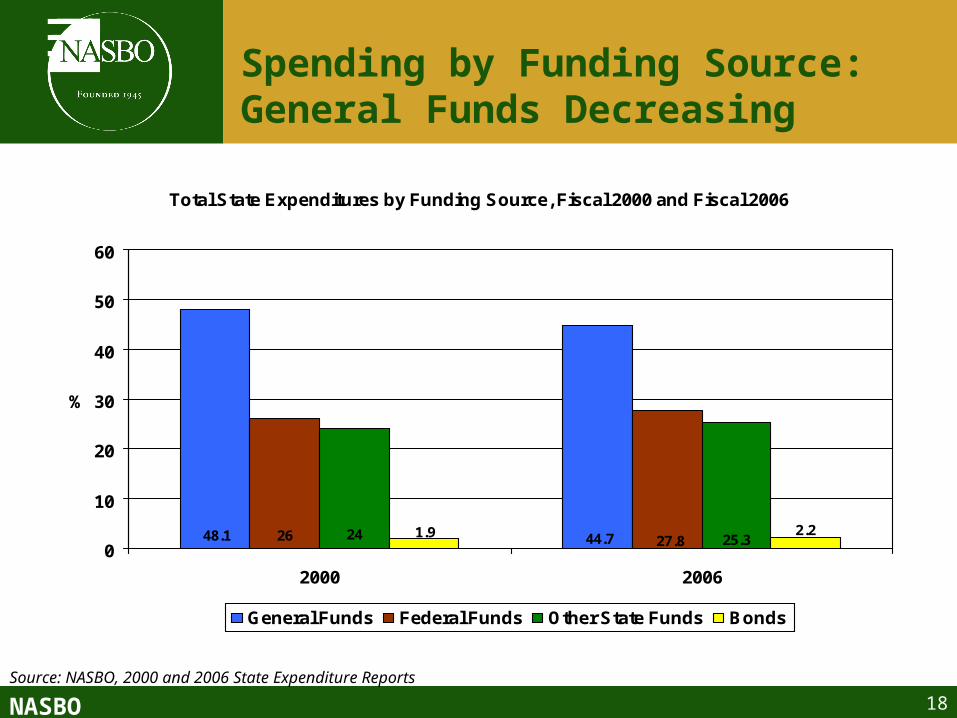
Spending by Funding Source: General Funds Decreasing
Total State Expenditures by Funding Source, Fiscal 2000 and Fiscal 2006
48.1 44.726 27.824 25.31.9 2.2
0
10
20
30
40
50
60
2000 2006
%
General Funds Federal Funds Other State Funds Bonds
Source: NASBO, 2000 and 2006 State Expenditure Reports
19NASBO
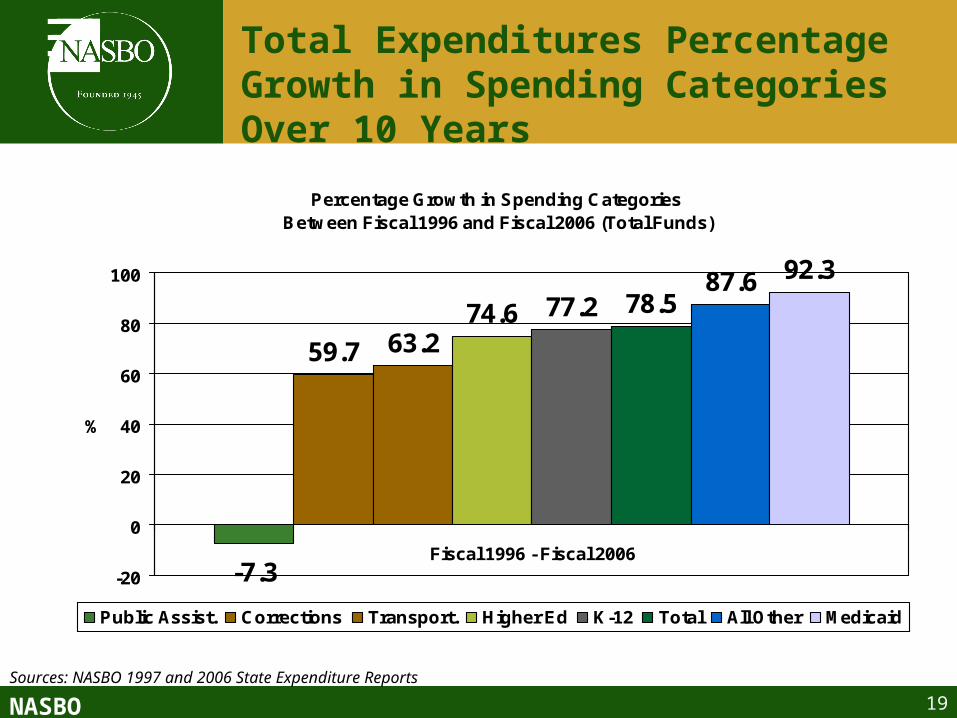
Total Expenditures Percentage Growth in Spending Categories Over 10 Years
Percentage Growth in Spending Categories Between Fiscal 1996 and Fiscal 2006 (Total Funds)
-7.3
59.7 63.274.6 77.2 78.5
87.6 92.3
-20
0
20
40
60
80
100
Fiscal 1996 - Fiscal 2006
%
Public Assist. Corrections Transport. Higher Ed K-12 Total All Other Medicaid
Sources: NASBO 1997 and 2006 State Expenditure Reports
20NASBO
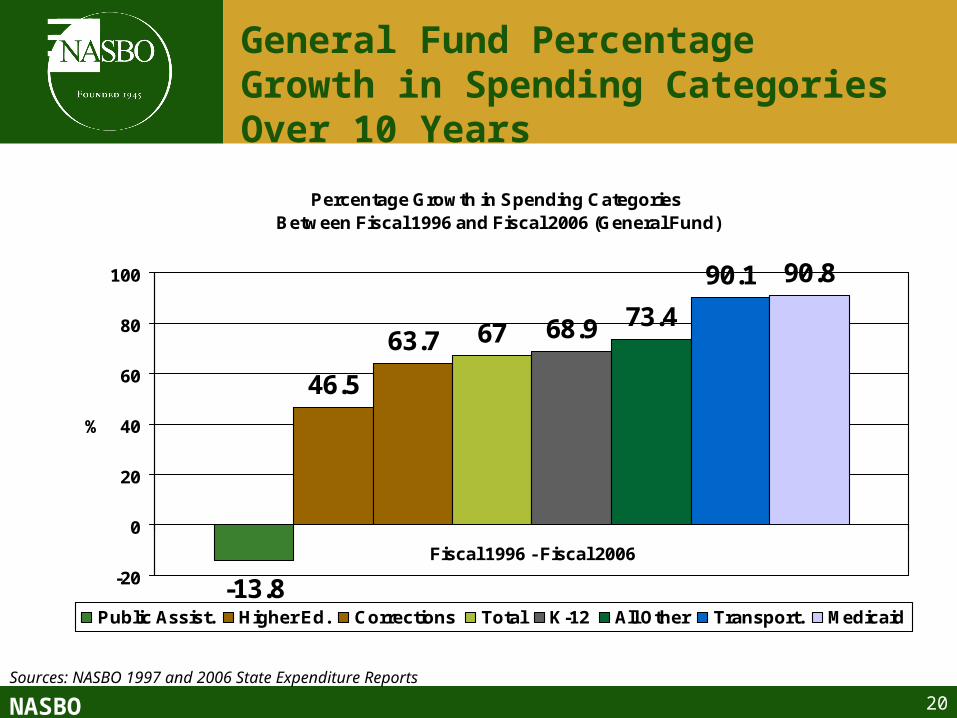
General Fund Percentage Growth in Spending Categories Over 10 Years
Percentage Growth in Spending Categories Between Fiscal 1996 and Fiscal 2006 (General Fund)
-13.8
46.5
63.7 67 68.9 73.4
90.1 90.8
-20
0
20
40
60
80
100
Fiscal 1996 - Fiscal 2006
%
Public Assist. Higher Ed. Corrections Total K-12 All Other Transport. Medicaid
Sources: NASBO 1997 and 2006 State Expenditure Reports

21NASBO
Medicaid
22NASBO
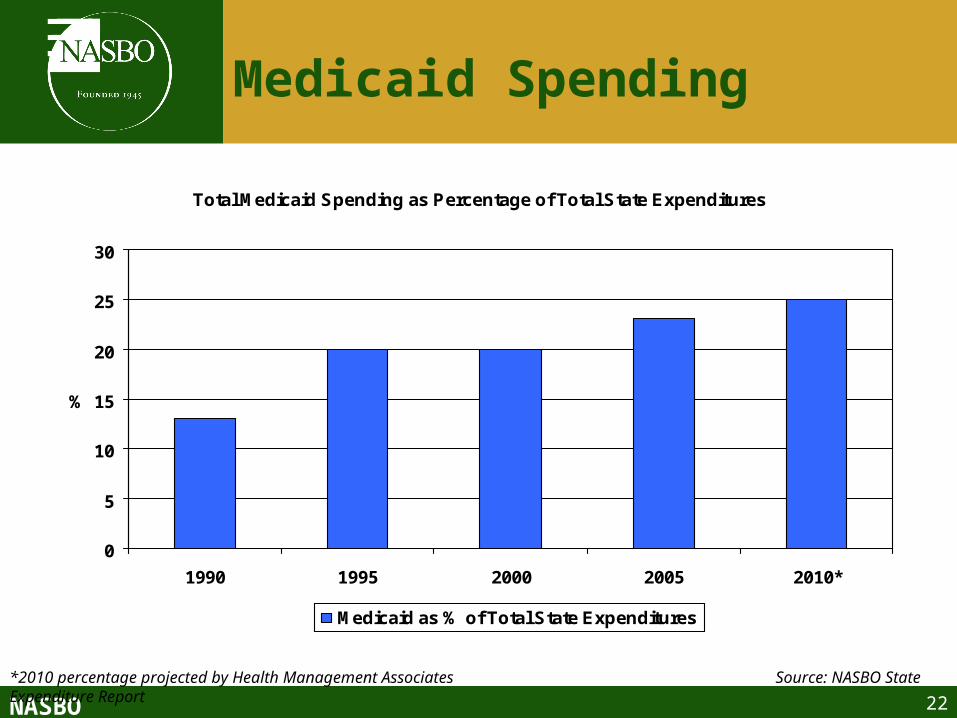
Medicaid Spending
Total Medicaid Spending as Percentage of Total State Expenditures
0
5
10
15
20
25
30
1990 1995 2000 2005 2010*
%
Medicaid as % of Total State Expenditures
*2010 percentage projected by Health Management Associates Source: NASBO State Expenditure Report
23NASBO
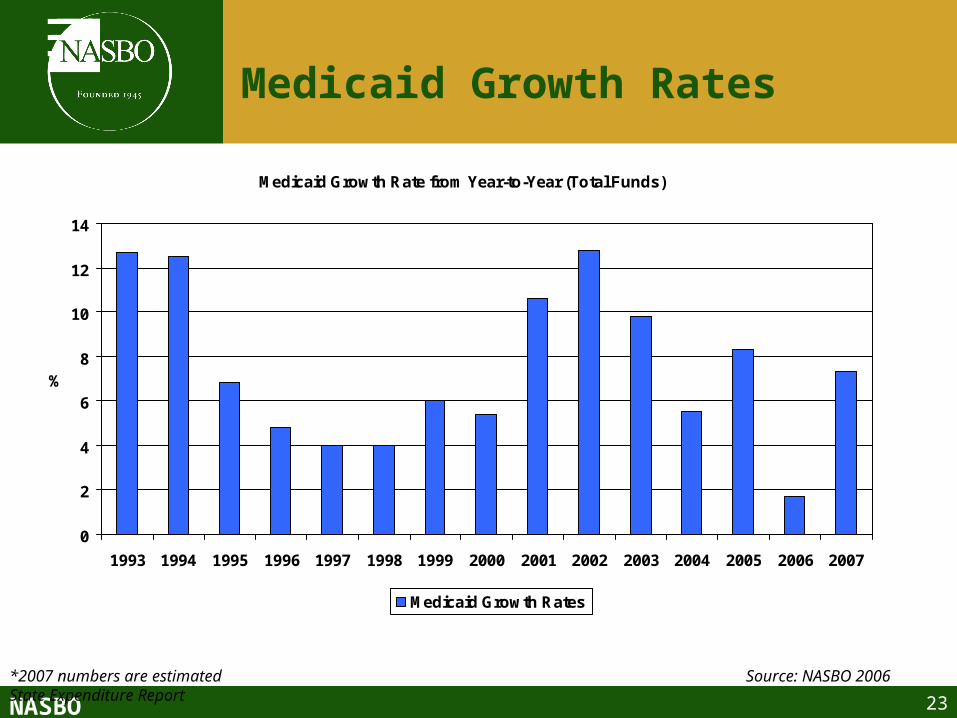
Medicaid Growth Rates
Medicaid Growth Rate from Year-to-Year (Total Funds)
0
2
4
6
8
10
12
14
1993 1994 1995 1996 1997 1998 1999 2000 2001 2002 2003 2004 2005 2006 2007
%
Medicaid Growth Rates
*2007 numbers are estimated Source: NASBO 2006 State Expenditure Report
24NASBO
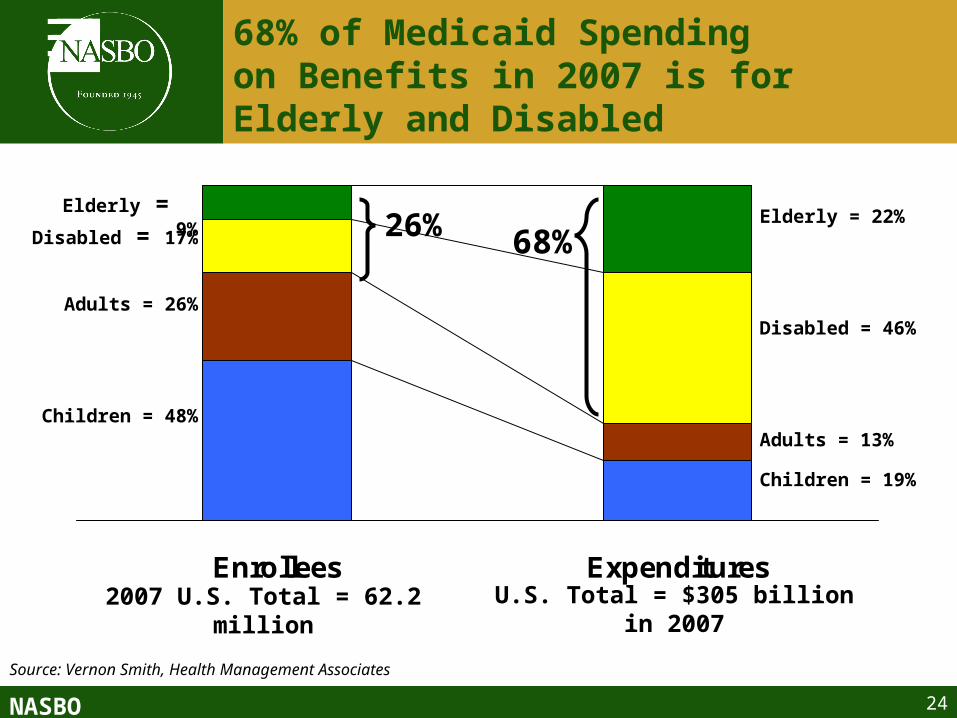
Enrollees Expenditures
68% of Medicaid Spending on Benefits in 2007 is for Elderly and Disabled
Children = 19%
Elderly = 22%
Disabled = 46%
Adults = 13%Children = 48%
Elderly = 9%
Disabled = 17%
Adults = 26%
2007 U.S. Total = 62.2 million U.S. Total = $305 billion in 2007
26% 68%
Source: Vernon Smith, Health Management Associates
25NASBO
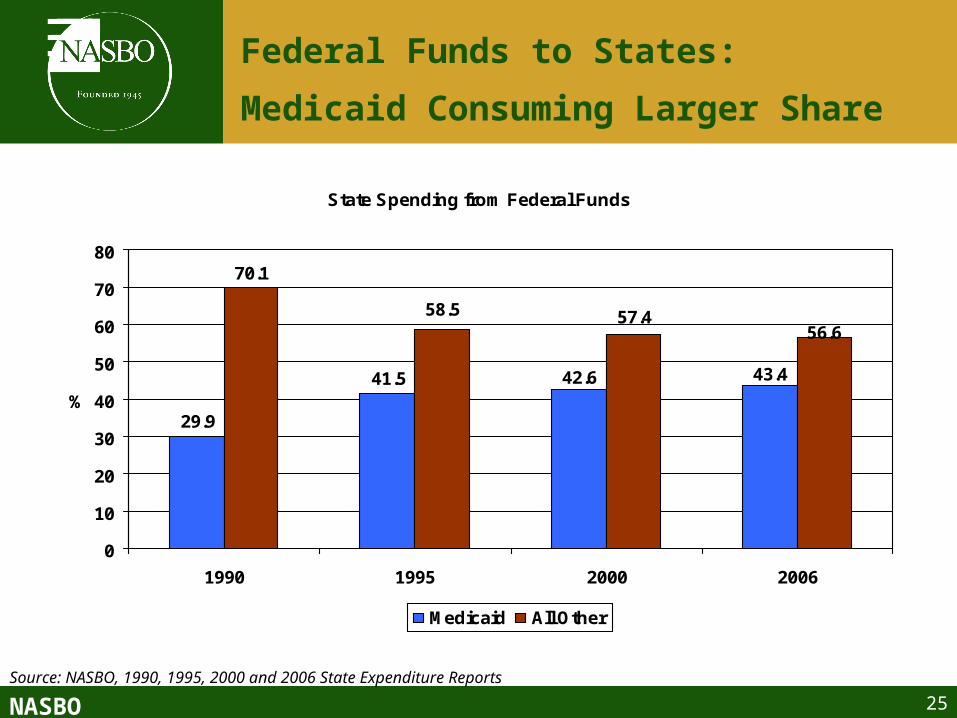
Federal Funds to States:
Medicaid Consuming Larger Share
State Spending from Federal Funds
43.442.641.5
29.9
56.657.458.5
70.1
0
10
20
30
40
50
60
70
80
1990 1995 2000 2006
%
Medicaid All Other
Source: NASBO, 1990, 1995, 2000 and 2006 State Expenditure Reports

26NASBO
Outlook
27NASBO
State Fiscal Outlook
Revenue and spending growth likely to slow • Housing decline and a slowing
economy could be problematic• National economic situation will
determine extent of state revenue slowdown
States will face fiscal challenges over next several years
States will look for creative financing opportunities to meet spending demands

28NASBO
www.nasbo.org