Embed Size (px)
Citation preview


State and Change of Dryland East Asia (DEA)
Jiqnan Chen, Ranjeet John, Guanghua Qiao, Ochirbat Batkhishig, Wenping Yuan, Yaoqi Zhang, Changliang Shao, Zutao Ouyang, Linghao Li, K c Oao, and Ge Sun
Sum m ary: Dry land East Asia (DEA) refers to a region with 4.81 million square kilometers (km2) and includes Mongolia and four provinces/regions in Northern China (hereafter called "administrative units" ): Inner Mongolia, Gansu, Ningxia, and Xinjian g. This introduction chapter provides an overview of the DEA region from three perspectives: 1) geography, demography, and economics, 2) climate and land use changes, and 3) ecosystem production and evapotnmspiration. Development of a sound adaptation plan, therefore, is becoming a necessity for the sustainable future of a region such as DEA. \Ve emphasize t he spatial and temporal variations of the major variables associaled with each of the three topic areas. F inally, we discuss the scientific aucl societal challenges for developing adaptation plaus based on the con<"ept of coupled natural and human ( CN H) systems.
1.1 Geography, D emography and Economics in DEA
Dry land East Asia (DEA) i~ deli ned in this book Hs a regiou that iuclud<.~
J\ longolia. (lvJG) and four provinces/regions in Nurt.hwcstcrll Chi na (lwrcafl er, <"filled ·'admini~l r;H:n, tli Jil.s'' l: fntt Pr '\ [l)p .. ,j;,, A "t• >l l'>!' "'1~ J! , · ,, 11 (1~ 1 ) 1 1:'ll
·w• r ;-.. , l. t .\ o~·••· • l"' . ;tl,d \. iuji <~J t g Uygur Att: '>IJOilJotl:; R eg10n ()...J ). The 4.h l 111illiou ::.qnare kiiOJ ncter regiou (Fig. 1.1) is approxilllatcl_\· the IJ;dl" ~ i ze or C'h in<~ or the US.\, with X.l ns tltc l ar~esl province
4 - Jiquan Chen, et a l.
(1.638 x 10⁶ km2 ) and NX as the smallest province (0.052 x 10⁶ km2 ) (Table 1.1). DEA borders Russia and Kazakhstan to the north and Kyrgyzstan, Tajik i~ tan ,
Afghanistan , and Kashmir to the west (Fig. 1.1). The biogeographic units of DEA (i.e., ecoregions), classified by the World \iVildlife Fund (VlWF) , iucl utle eighl biomes within t he Palearct ic Realm (Olson et al. , 2001 ) and are dominated by deserts and xeric shrublands (47.3%), ternperalc grasslands (23.4%), and
temperate forests (11.1 %). DEA has Lhe Pami r Plateau and Lhe Tibetan Pl: tlt':lu
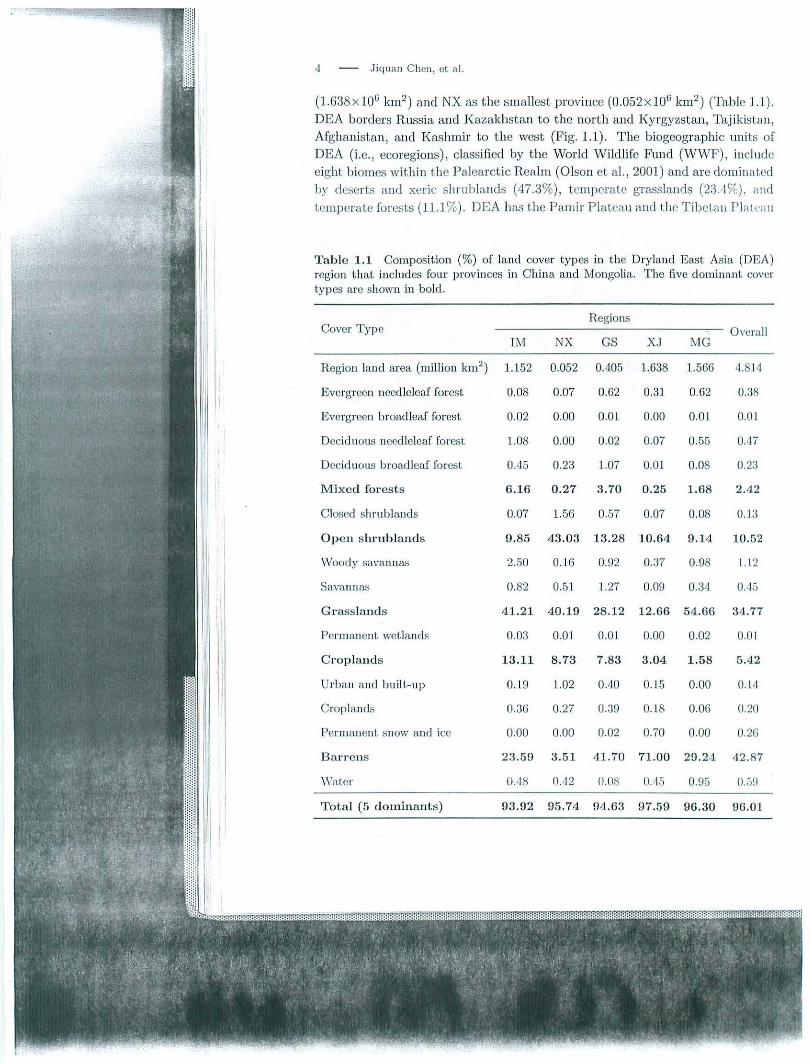
Table 1.1 Composition (%) of land cover types in the Dryland East Asia (DBA) region. that includes four provinces in China and Mongolia . The five dominant cover types are shown in bold.
Cover Type Regions
---- --------- --- Overall IM NX GS XJ MG
Region Janel area (million km2) 1.152 0.052 0.405 1.638 1.566 4.814
Evergreen needleleaf forest 0.08 0.07 0.62 0.31 0.62 0.:38
Evergreen broadlea.f forest 0.02 0.00 0.01 0.00 0.01 0.01
Deciduous ncecl leleaf forest 1.08 0.00 0.02 0.07 0.55 0.47
Deciduous broadleaf forest 0.45 0.23 1.07 0.01 0.08 0.23
Mixed fm·ests 6.16 0.27 3. 70 0.25 1.68 2.42
Closed shrublands 0.07 1.56 0.57 0.07 0.08 0.13
Open shrublands 9 .85 43.03 13.28 10.64 9.14 10.52
Woody savannas 2.50 0.16 0.92 0.37 0.98 l.l2
Savannas 0.82 0.51 1.27 0.09 0.34 0.45
G r assla nds
Permanent wetlands
C ropla nds
Urban and bui lt-up
Croplands
Permanent snow and ice
Barrens
Vv'atcr
Total (5 domina nts)
41.21 40.19 28 .12 12 .66 54.66 34 .77
0.03 0.01 0.01 0.00 0.02 0.01
13.11 8.73 7.83 3.04 1.58 5 .42
0 .19 1.02 0.40 0.15 0.00 0.14
0.36 0.27 0.39 0.18 0.06 0.20
0.00 0.00 0.02 0.70 0.00 0.2G
23.59 3 .51 41.70 71.00 29.24 42.87
OA8 0.42 0.08 0.45 0.95 0.5!J
93.92 95. 74 94 .63 97.59 96.30 96 .01
Stat!• nrd Change of Dryland [a;.• \~ia (DEA ) - 5
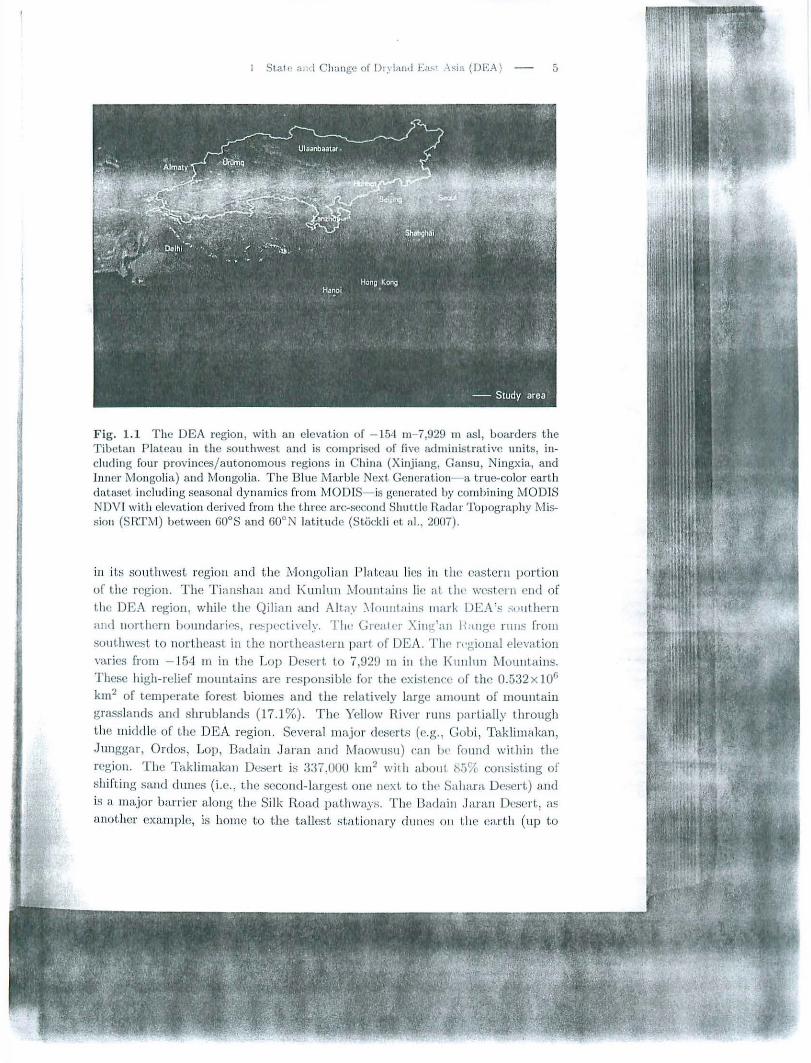
F ig. 1.1 The DEA region, with an elevation of - 154 m- 7,929 m asl, boarders the Tibetan Plateau in the southwest and is comprised of five administrative units, including four provinces/autonomous regions in China (X injiang, Ga nsu , Ningxia, and Inner Mongolia) and Mongolia. T he Blue Marble Next Generation- a true-color earth d ataset. including seasonal dynamics from MODIS- i::; generated by combining MODIS NDVI with elevation derived from the three arc-second Shuttle Radar Topography l\·lission (SRTYJ) l.Jetween 60°8 and 60°N latitude (S ti:ickl i et. al. , 2007).
in it,:; southwest region and t he J\'Jougolian P lateau lies iu Lite rus tern portion
or Lite region. T he Tiansha.u and K unlun }founl aius lie at thl' western end of t.he DEA rcgiou, whi le t he Qilian ami Altay .\ fonutains tnark DEA"s SPtt thrrn
and northern bounda r irs, re~pcct i ,·cly. Til<' Grenier Xi1t1.( an H·tugC' runs from
southwest. lo northeast. in the norlheas1.crn pa rt of DEA. Thr r··giuual elevation varies from - 154 m in t he Lop Desert to 7,929 m in the l(ull ltm tl loull tains.
These high-relief mountains arc respous i ble for t..he existence of the 0.532 x 10⁶
km2 of temperate forest biomes and the rclalivcly large ammmt of mountain
grasslands and shrublands (17.1 %). T he Yellow River runs pa rtially lhrough
the tnidclle of t he D EA region. Severa l major deserLs (e.g. , Gobi , Taklim;.ll<an,
Junggar, Ordas, Lop, Baclaiu J o ran nnd Maowusu) can lJp found wi t bin tlte
region. T he Taklimakan Desert is 337.000 krn2 with about 1-,.')o/, consi:>t.ing of
shifLing sand dmtes (i.e .. Lhe sccoud-largest OIIC next to lll<' Sahara Deser t) a 11d is a major barrier along t he Sil k Road pathways. The Badaitt .Jnran Deser t, as
another exanJplc, is home to the ta llest s tat iona ry duucs 0 11 Ute eartlt (up to
6 - Jiquan Chen, et al.
500 m high). The increasing frequency and intensity of dust storms in East A~ia
have been attributed to these massive deserts and other degraded grasslands (Ln et a l. , 2009; Xuan et al., 2000).
In China, t he region has special significance for national security ami cnvironmeutal concerns (e.g., t he testing site for nuclear bombs in Lop Nur , Lllc
space flight center in Jiuquan, etc.). lviongolia itseli' is the 19th la rgest nne\ most sparsely populated country in the world. It is also the world's secondlargest landlocked country after Kazakhstan. The country contains very lit Ue arable land, as much of its area is covered by arid and unproductive steppes, with mountains to the north and west and the Gobi Desert to the southwest. Approximately 30% of the population is nomadic or semi-nomadic. For Lllc
Land Cover and Land Use Change (LCLUC) Program of the National Aeronautics a nd Space Administration (NASA) , DEA is the continental extreme for lhe Monsoon Asia Integrated Regional Study (:tviAIRS) domain and t he southern end of t he Northern E urasian Earth Science Partnership Initiative (NEESPI) domain (Groisman et a l. , 2009; Qi et al. , 20.12).
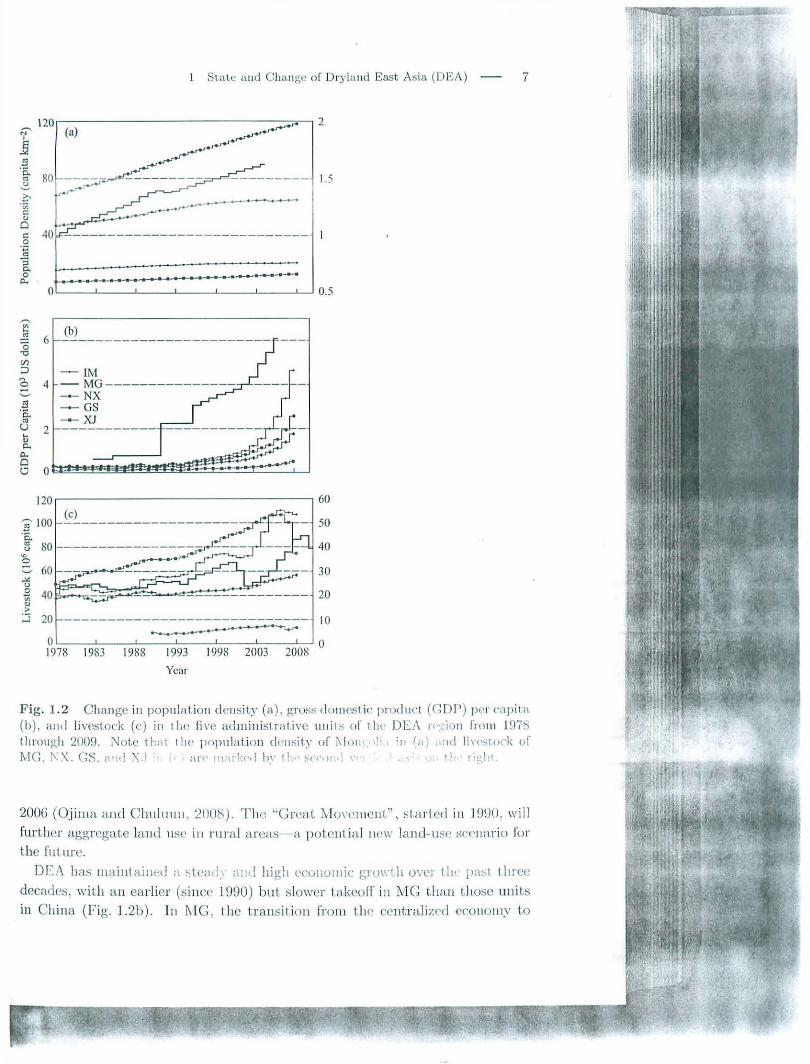
The population of all five admin.istrative uruts has been steadily increasing, with an average anuual rate of 2.19%, but varied from 1.14% in IIVI to 2.42% in NX (Fig. 1.2). The total population in DEA increased from 5t!.37 million in 1978 to 78.07 mi llion in 2004. In 2008, the population density varied from 13.0/ km2
in XJ to 118.1/km2 in NX, 21.3/ km2 in IM, and 65.0/km2 in GS (Fig. 1.2a), 'vvhich arc aU significantly lower than the Chinese national average of 139.6/krn2 .
Mongolia remains sparsely occupied, with a population density of 1.6/km2 in 2004- an increase of 2.35%. Diverse ethnic groups such as Uygur, Mongol, Hui, Kazak, Man, and Zang (Tibetan) characterize all four administrative uni t::; in China. T hey are considered "rvfinority Regions" because of their diverse and numerous ethnic groups. Consequently, the region has been considered a focal a rea for government support (e.g. , the Korthwest Construction Program) since the early 1980s and for special policies set by the central governments such
as college education, financial compensation, number of children per family, etc. However, lhe proportion oF Han Chinese has been steadily increasing and becoming t he majority in all four uni ts . For example, Han Chinese comprises 79.1% of tlJC population in Ii\I, while )..fongols account for 17.2%. In X.J , Uygur remains clt llll ilW II t (45%) ovpr ll aa C!Jiucse (41%). The J!Ja jl>l' cii i,~s wi th la.rg0 populatio11:.; iuclnd<' Ur i.imq i (2.7<14 nJi(Jjon) in XJ , l3aotou (1.779 mi ll ion ) and HuhhoL (2 .8G7 million) in Jl\I , Lauzl10u (2 .177 million) ill GS, Yinchuan (1.200
million) in NX, and Ulaanbaatar (1.190 million) in MG (sec Fan et a.l., this book). This aecotlllt.s for 1 5A% of the to ta l popul a tion in the region. Purtllcr aorlh, in i\ l cm~ulia. 43.'2){ of its 2.0 million people ean be found in its C"npilal ( Ulaaubaalnr) . O ver t he past decade, urbanization has continued to inLeusify clue to the transition from a centralized economy to a market economy; this
has resulted in an increase in urbau population from 21.6% in 1956 to 63.3% in
.., 0
State and Change of Dryland East Asia (OE!\) 7
I ---- I I e
.......................... 0 '-------'---L._-----'----'-----'---.J..__J 0.5
(b) 6 ----------------------------
- IM 4 - MG --------- ------
-- NX -+- GS --XJ
2 - ----------
120 r-----------------------·60
s 100 50
40 ·c. "' 80 u
"' 0
'-' 60 30 .:.: u 0 v; 20 "' > ~ 10
0 1978 1983 1988 1993 199!1 2003 2008 °
Year
F ig. 1.2 C hange in populatio n d cnsiL.Y (a), gross donlC'stic product (G OP) per capi ta (b), and livcslock (c) in t lw fi\'f' "dminist rat. i\·c utti ts of til!' DE1\ n :~i•>n fro m l 91S l hrou)l,h 2tl09. Nolc t hilt I I)(' popnlalion d··nsi l .\' of t\ lon• ,li 'II 1;1 , . ncl lin•,;tock or t-.-JC:. l\ X. CS. (l' d '\ l · , ' <lJ"f ' l)'l+('d h_\ ' I' ~··('•))' ' I ,·d 1
200G (O.i ima allcl Ch1l1Ull11, 20ll8). The "Gn•n.t l\:lm'l'J IICil!." \sta r! cd i tt j n~JO, will
further aggregate la ud u:-w i11 rural are<.IS a po l<' I tl ial Ill'\\' la nd-ust' s<·<•nario fo r
the f11t ure.
DP.A has maiulai11ed a s l<•;t d,\ n; d high ecunUilliC grm'-·1 It on•r IIH past l ltree
decades, wiLh an earlier (::; ince J 990) but slower tHkcufl' in l:VI G tltau Lhose units in China (Fig . 1.2b) . l n 1\ IG. the transiLion fro m 1.h<' centralized ccollOIU)' t,o

8 - Jiquau Chen, et al.
the markel economy started in 1990 after the collapse of former Soviet Union, with an average growth ra te of about 2.8% in the 1990s and > 6% in the recent decade.
The GDP per capiLa in MG was $61 1 in 1983 but jumped to $6,082 in 2006 -a tenfold increase over a 23-year period. In China, the "Open Economy Policy" , implemenled since 1979, promoted a miraculous growth of 9.7% bct.ween J D79
a nd 2006 at tlle national level. J nlcrestingly, China was not affected by t.ltc global economic depression Lhat began in 2008. However, because of its large population, the GDP per capita in the four DEA tmics of China was only $233 in 1983 and $1 ,373 in 2006, which were 38.1% and 22.8% of MG, respectively, for the two considered years, regardless of high GDP. Additionally, the economic growth was not evenly shared among the four units, with IM ranldng fhst amoug Chi11a 's 31 provinces, wl lile XJ , GS, and NX had much smaller GDP growth. As a result , t he GDP per capita in 2008 was $4,639 and $504 in 1M and XJ , respectively. The 10\ver-lhan-average economic growth and the significant differences among the uni ts have been recognized by the government and are currently considered priority areas for development to addTess the regional dispari ty in upcoming years (i.e., China's 12th five-year plan, Qi et al. , 2012).
Livestock has been widely used as a primary metric in dry land regions because of its importance in linking people, the economy and the environment . The livestock population in the DEA region doubled from 110.67x 10⁶ in 1978 to 222.38 x 10⁶ in 2008 (Fig. 1.2c) . An 88.7% increase was found in l\1IG for the study period, while a 104.1 % increase was found for the other four units within China. GS and XJ had the lowest increase, at "'50%, while IM: and NX achieved 164.2% and 156.5% increases, respect.ively. The above difl'erences in changes of livestock population among the four units in China may be partially due to the relatively high proportion of grasslands in IM (41.25) and NX (40.2%) and the low proportions in GS (28 .2%) and XJ (12 .7%) (Table 1.1). The large amount of livestock in IM (2L1.2% of DEA in 2008) made II\:[ China's largest import base for dairy products (Sneath, 1998) . Over t ime, the changes in livestock populat ion seem to have had many more variables in IM and MG (i.e., on Lhe Mongolian Plateau), but not in the other three units. \"~le suspect that this may be related to the high sensitivity of t he plateau to t he changing climate because the Mongolian Plateau, with an elevation of 900-1,500 m, has been identified as one of the most sensitive regions in the world to the warmi ng climate by U:>CC (2007). For example, clear reductions in livestock population from 2000- 2001 and 2008- 2009 were recorded and both related to climate events such as low precipitntion or drought (Pig. 1.3 and Fig . 1.4).

L State a nd Cha nge of Dryland East Asia (DEA) - 9
1s.-----------------------, 1 2~------- 0.358*
_ _ _ _ ___ ___ _=:.:....,:_;, _ _
j----------------------
1 ~~==~==~====~==~==== 101.----- 0.343~ -----------------
6~---------------------
4~--~--~----~--~--~ 12.----------------------,
e: 9
~
0.4 17*
e <J p.,
E ~ ... ~
---------------------
0.377*
0~------------------~
6 0.450•
tr. ., - Jt..:'-- L l -------------------61_ __ -1.,_ __ --l., ____ L_ __ -l.,_ __ _,J
1960 1970 1980 1990 2000 20 10
3001------ 15. 168 ------~-~-------
1 ,. j• ~\}' ----· ~\ L I ,It '1. ~ ~ .. ~,.
~!,.r.---;-.i.'li ....; ___ ' -----
r ly --
200
100
XJ o~--~--~-----1.--~--~
600 - 2.875
-----~---~~~~-L~----
NX OL---~--~--~~--~--~
I 600
,;:: .g 400 g
2.023
·c.. ·;:; e a.
!M
300L_ -3.846 J --------------------Yv ~'·· 'rJr l A j 200~ \Aftf--1\(f 7\-;:--vyvr• -'4~
I OT----:------:z--::------;:a-1 0 I I I I
1960 1970 1980 1990 2000 2010
Ycur
F ig. 1.3 Long-Ler111 changes of a nnual mcau air temperature and prccipila l ion between 1960 and 2009 in the fi ve adminislralive un ils of DEA, showing a cousisLent warming trend in all five nni ls bul a varia ble precipilnlioa trend. T he tt ll tllbcr it t each panel indicates the dccada l change of Lernpcralurc (°C) or precipiLa l.ion (nun) and t he * ind icates a signifi ca.m l~vcl at 0.05.

lO - Jiquan C hen , et a l.
Air Temperature N Precipitation
A
(b) lntra-anmwl Variation
Fig. 1.4 Changes in long- term mean (1960- 2009), standard deviation (i.e., intraannua l variation) , aud annual mean in 1996 and 2008 across the DEA region. These spatially continuous t rend maps were created using the tension spline method based on 166 nat ional climatic stations in C hina and :Mongolia.
1.2 Clhnate and Land-Use Changes
Long-term in sitv. recordo: or tempcrat.ure and precipitation \\"ere used to quanLify cbangcs over t.i111c anrl across DEA landscapes (Lu et al., 2009). The daily me
teorological data (1961- 2009) from 149 weather stations was acquired n·om the Chi na Metcorollogical D aLa Sharing Service System (bttp:j /cdc.cma.gov.cn/ ),
·while monthly mean temperatm e and precipitation at 17 national meteorological stations in Mongolia were provided by the Hydro-Jvfeteorological Agency of

l State and Change of Dryland East Asia (DEA) - 11
l'v1ongoHa for Lhe same time period. The latitude, longitude, a nd elevation for
each of the 166 stations were a lso included in the data, a llowing us t o anaJyze the
spatial variation. We spatia lly interpolated the annual mean tempera Lme and
precipitation using a tens ion spline m ethod (Fta nke, 1982; MiLas et al., 1988) .
The tens ion spline cr<•ates a less-s moql h ~urrnce as comparerllo a rc•.f!,u lar splinc.
\\' it h \;due:-. con:-t nt itt• 'I du,.,• ·r to tlt<• sam pi• · mn~c . Tl ti:- i:- \':-I H'cinlly tn tc !or
t. l11 · iut crpn.at l'!l exlt <" •· \ t.lll'~ ti >r il' ttua! " 1 .w ra td:'l' au• 1 ··ipit d i••lt. Tl tL'
tension :;plith' was projPctcd Oll a 5,Gilu 111 (i.e., 0.05 degree) to nta tch tl w C limate
.\-iodeling Grid (CYJ.G), willt a n Albers equa l u.rca projection.
T here h as been a s ignificant increase in amma l mean temperature, but va ri
able, insignificant changes in precipitaLiou for t he study period fi·om 19G0- 2009
(Fig. 1.3). The long-term cha nges in both temperature alld prccipiLn t ion are complicated by the high intra-annual var iations as well as the complex topogra
phy (Fig. 1.1a). The dccadal increase in annual temperature was higher in MG
and GS (0.450 and 0.417 oc; 10 yr , r espectively) than in the three remaining
units, with the lowest warming (0.343 °C/10 yr ) in NX. As a r esul t,, t he a nnual
mean tempera ture in XJ, NX and IM has no t b een below zero since 1985 . These
increasing trends were previously reported for clif[erent biomes a nd spatial scales.
Lu et al. (2009) reported tha l t he warming is more affected by daily minimum temperature tha n daily maxiwum va lues (see a lso Zha i & Pan , 2003) , suggest ing
t hat the warming t rends repor ted here a rc likely less pronounced tha n when min
imum dai ly temperature is used. They a lso reported that the grassland biome
( +0.41 °C/10 yr) a nd desert biome ( + 0.39 °C/10 yr ) experienced ntore iucreases
iu air tempera ture per decade than fores t biomes (0.27 °C/10 yr) . Precip itation
at low elevations bas been increasing; however , at high elevaLio11s, it. lta,s been
decreasing. On a seasonal basis, the lrencl o f tem perature increases was higher
in winter (0.42 oc; J 0 yr) than fall (0.34 oc; 10 yr), spring (0.30 °C/1 0 yr) '
or summer (0 .27 °C/10 y r) . As for precipitation , we did not find a significant
cha nge for any unit from a linear regression analysis. However , NX and MG
had an overall decreasing t rend over Lite 50-year s tudy period , compared Lo t he
increasing trends in the other three uni ts (Fig . 1.3). XJ has t he larges t p ort.ion
of deser ts (71.0%, Table 1.1) and experienced t he h ighest increase (15.2 mm/ 10
yr) in precipitation (Piao el a l. , 2005). T he fact that a rid biontcs geL more rain
in DEA is cliO'erent front other arid regions (e.g., North Africa a nd Australia),
where a marked decrease in Sahelia n rainfall and increased precipita t ion vari
abil ity in arid Aust.rali11 have been reported (Da i e t al. , 2004; Jviorton et al. , 2011 ) .
From t lw ~< >Ill h\\Ts l t.u uvrtl~t·a:;t. a tmua l mean tcmperatme decrease~ \\' hiie
precipitatio11 i11 crcn~-;es (F ig. l. ·la ) . \Van ncr a nomalies were fotttt cl a round t.hc
Lop and Takli nmk<:ll t Dc~crts in XJ , whil<• cold a nomalies "·cr<' fo u11d in Tiansha n, the Greater Xi ng ·au R.a11ge, and nortlwm Mongolia. Tl ti::; spatia l pattern
of t.he Rmface air Le11t pcraLurc iu DBA docs no t matclt as well wi lh the spatial

12 - J iquan Chen, ct al.
distribution of precipitation in sout heastern DEA as it does in southern GS, NX, and IM, where high annual means coincide with high precipitation. IvJore importantly, there seem to be contrasting spatial patterns for the intra-annual variations (i.e., measured by the standard deviation of the climatic data from 1960 to 2009) for both variables (Fig. 1.4b). High intra-annual variations in tempC'raLure were found in southwest Tianshan, Yumen of GS (a.k.a., the weRt c11d
of the Great Wall of Cbina), Qilianshan, and the northern Gobi Desert . Precipitation variability, on the other hand, matches well with its spatial meansthe higher mean values correspond to higher precipitation variances. To demonstrate the intra-annual variability of temperature and precipitation, we include the spatia.lly interpolated distributions in an extreme cold and dry year (1968, F ig. 1.4c) and a warm and wet year (2008, Fig. 1.4d).
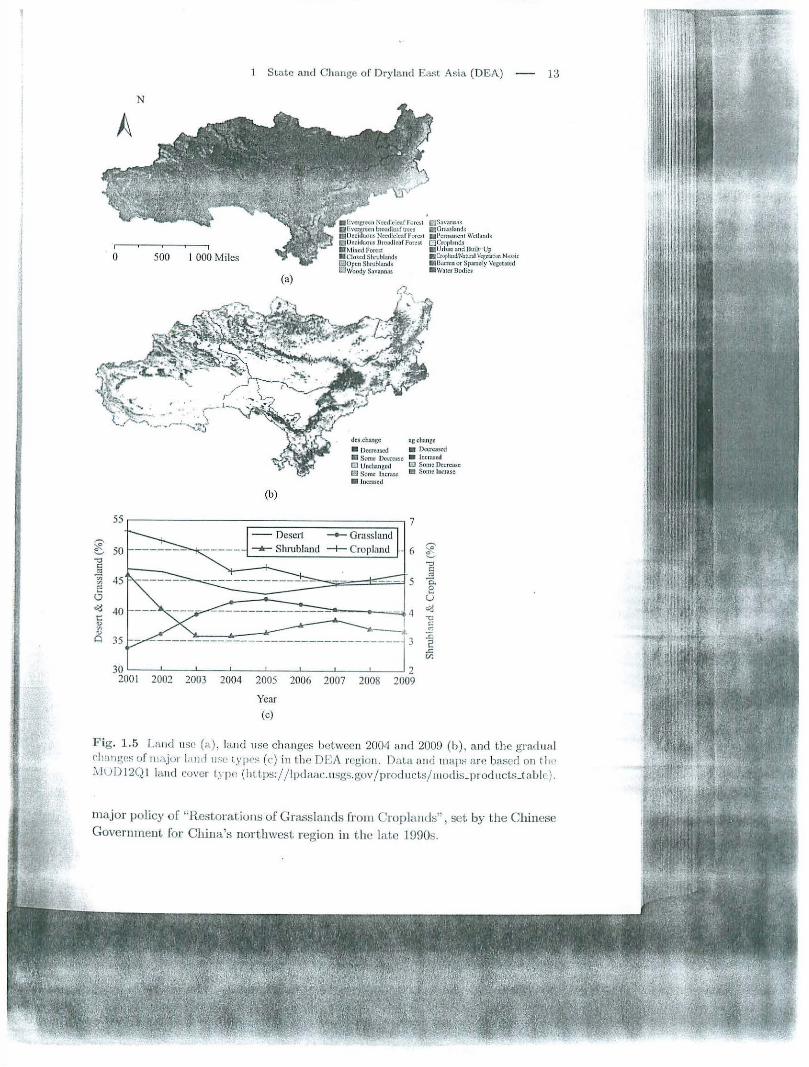
Current land cover types (MODIS-IGBP LC) followi ng the IGBP classification system (Olson et al. , 2001) in DEA are predominated by barrens and sparsely vegetated land (2.06 x l06 km2 , 42.9%), temperate grasslands (1.67x10⁶ lon2 ,
34.8%), (0.5l x 10G lon2 , 10.5%) , and croplands (0.26 x 10⁶ Icm2 , 5.42%) (Table 1.1, Fig. 1.5a). Croplands, open sbrubland, and mixed coniferous forest account for > 96% of the DEA region; mban land use occupies only 6.8 x 10³ km2 (0.2%), despite the high population in the region. From 1992 to 2004, there were significant increases in cropland, barren la nd, urban land, and grassland in IM, while MG had the smallest amount of croplands in the region. The average compos ition of land cover types is deviated for every unit , including rv84% of MG as grasslands and banens, 71.0% of XJ a.c; barrens, and 43.0% NX as slu ublands (Table 1.1).
DEA landscapes have also been undergoing dramatic changes. The grasslands fluctuated between 33.7% and 42.0% between 2001 and 2009, while barrens fluctuated between 43% and 47%. Urban growth , desertification and land conversion to agricultural systems are the three major land-use changes in recent decades. John et a!. (2009) reported that the urban, crop, and barren lands in IIVI increased by 249%, 47%, and 151%, respect]vely, resulting in sigrrifica:nt changes in species distribution (John et a!., 2008) and increased water stress (Shao et al., 2008; Miao et al. , 2009). Desertification normally results iu an increase in both shrublands in semi-arid areas and deserts near the grassland-desert transit ional zones (Figs. 1.5b and c). Herbaceous grass species native to the region are being replaced by deep-rooted invasive shrubs, whicb have less-efficient wawr use (Che11g el a!. , 2007) . Based on t,he MODIS LU database , it seems tltat i11tcnsified land use changes are moslly within or around (he transitional zones IH:!Lween t.he biomes (Figs. l.5a and b). JJ·om a statistical point of view, however , the total land area for grasslands has increased (Fig. 1.5c) . A caTeful study o( the land-u~c changes (F ig. 1.5b) reveals that this is due to Lhe large loss of forests in uorthern MG and nor thwest XJ. A surprising phenomenon is that the total cropland area has also beell decreasing, which is likely related to the
55
"""' c 50 ""' "' ::: -;;; "' "' 0
«! r: ., "' .... 0 35
30 2001 2002 2003 2004
SLate and Change of Ory la.ud Ea.~t Asia (DEA)
(b)
2005 2006 2007
Year (c)
des.ch.ange
•ocaeascd llil Some Dccn: a.sc: [J Unch3.ngcd E1 Some lncrase • lnc:rued
~ehan.gc:
• Dec:'c:ased • lnc:~sed
0 Some Decrease 11!1 Some lncnse
7
6 ;? c ~
-g "' 5 0. 8 l.J ~ ;:; £ 2 .<: cr.
2 2008 2009
]3
F ig. 1.5 L111 1d usc {a), hnd use changes bet,wccn 2004 a nd 200!) (b), and Lhe graclmd rhant;e~ of n1ajor land u~c Lyp<'~ (c) in Lhc DEi\ regio n. Dala and tll ~tfl>' a re based on t ' " ' 11101) l 2Q I land cover lypc (11LLps;f jlpuaac. usgs.gov fprodncl.~/ ntodis_prodncls_tabiP) .
major policy of '"R estorations of G rasslauds fro111 Croplauds'', soL by the Chinese Government for China's northwest region in t he lat.c 1990s.
14 - J iquan Chen, et a l.
1.3 Ecosystem Production and Evapotranspiration
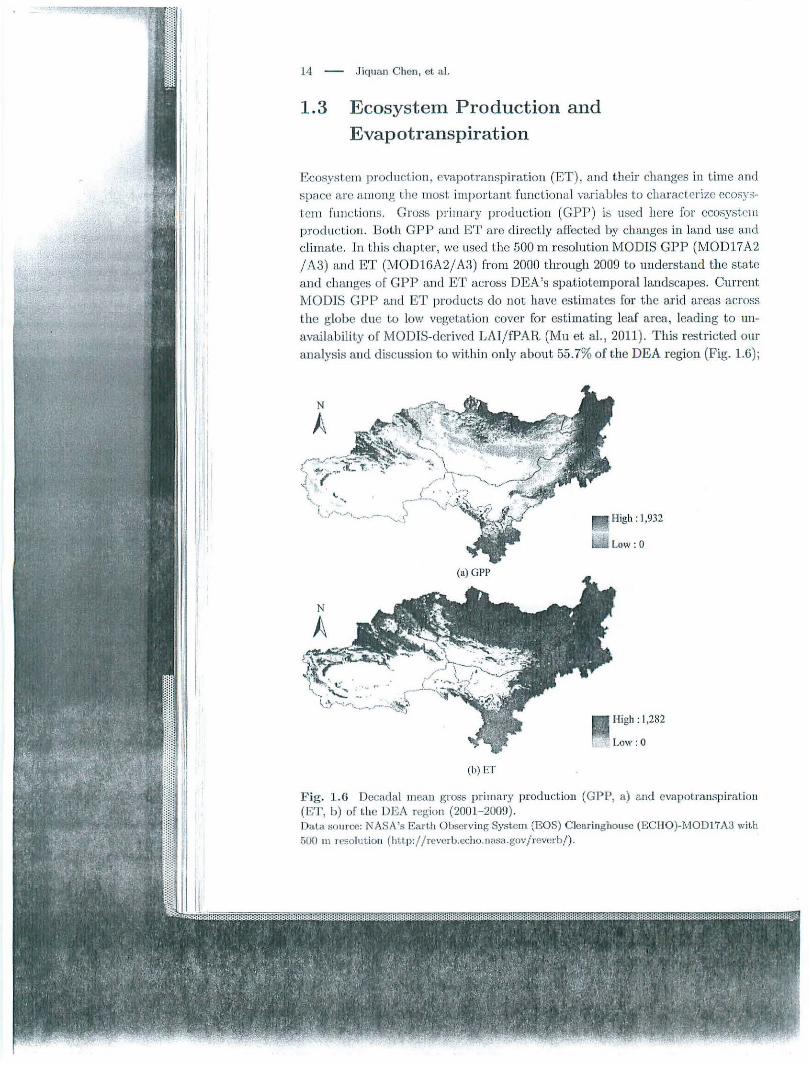
Ecosyst.cm producl.ion, evapot.ranspiratioH (ET ), and t.heir changes in t ime and space nrc at11ong Lhe most important funcLional vn.riaLles to characterize ecosysLelll l'll llc tions. Gross prima ry production (GPP ) is used here for ecosystem prod uct ion. Both GPP and E T are directly afi'ected by changes in land use aHd climate. In this chapter, we used the 500 m resolution MODIS GP P (MOD17 A2 / A3 ) nnd ET (MOD16A2/ A3) from 2000 through 2009 to understand the state and changes of GPP and ET across DEA's spaLiotemporallandscapes. Current MODIS GPP and ET products do not have est.imates for t he ar id areas across lhc globe cl.ue to low vegetation cover for estimating leaf area, leading to unavailability of lVfODIS-clerived LAI/ fPAR (lvlu et al ., 2011). This restricted our analysis a nd discussion to within only about 55.7% of t he DEA region (Fig. 1.6);
(b) ET
High : 1,932
lJ Lc.w :O
H.igb : I ,282
Low : O
F ig. 1.6 Decadal mean gross primary productio11 (GPP, a) a.nd evapotranspiration (ET , b) of the DBA region (2001- 200!.)) . Data som cc: NASA's Earth Observing System (EOS) Clearinghouse (ECHO)-MOD17A3 with 500 m resolutiort (hUp: / /reverb.echo. n;~sa .gov/revcrb/) .

State and C h;lllgc of Dryland EasL A~iil (DCA) - 15
although the GPP and ET for t he remaining 45 .3% are near zero a nd , thus, negligible. Never theless, our discussion below is sLill possible and is based on t he differences amoug t he t hree ecoregion biomes (forest , grassland , and deserL, F ig. 1.1) as well as among the five adminislralive units.
T he mean (±standard deviation) GPP of lhP t hree dominant biomes for Lhe st.udy period (2000 201)9) varied front I f)rdl:%.0 g C 111 2 yr 1 in t he de3<'L'L
biouJC to 303.~ = 151 .9 and 508.5±2 1 .0 g C 11 1 :.! yr- 1 it.t t he !!,ra:-sl;utd and forest biomes (Fig. 1.7) . These resul ts ~hould be ca ut iously iut.erprcted be
caus~ a relatively la rge amount of a rea is LrcaLecl as "no vegcLntion" by Lhe MODIS team (i.e., no data) in barren areas. YcL , tbe total GPP for DEA is (0.8243±0.3011) x 109 g C y r- 1 and t he average ET is 276.1± 96.6 mm yr - 1• In addition to the three dominant biomes for llle DE A region, \\'e a lso obtained zonal s tatistics of G P P and ET in grassland , desert., and foresl biomes a t the
provincial level. It is also clear t ha t the inlra-annual variations of lhc s;tme biome in different administra tive uni ts were not always similar. l.:'vt and GS showed higher GPP at all t hr ee biomes than t he other three adminisLraLi,·e unils. For example, GPP of the forest biomc in GS was 73G.0± 271.7 g C 111 -
2 yr- 1, while
Grassland Desert forest ,....... 870 --:.:;::IM=:=NX'::;:.:-as
--xJ - MG ---------------
Fig. 1.7 Changes in GPI ' {g C 111 - 2 yr 1), E1 (uuu) and \\T E l>f t.lll'<c d<,t ni ua m biomes in t he fiv<' adlllin is~rali ve units of th.• DEA n'~ion fro111 2000 lo 200!1. sl1o\\'ing lhc nonparaJ iel int ra-annual variations <tnlong the lliOille;; a nd provinces DaLa. source: same a~ i 11 Pig. 1. 6.

16 - Jiquan Chen, et al.
t he forest biome in neighboring NX was about half o[ GS (51.7%) at 336. 7± 159.1 g C m - 2 yr- 1 . These differences are likely due to t he favorable temperat ure and precipitation combination (Fig. 1.4) (see also Lu et al., 2011). ET of t he forest biome (368.1±147.9 mm yr - 1 ) was eA.'])ected to be higher than that at the grassland (267.1± 96.5 mm yr- 1 ) or desert (194.5±45.5 mm yr- 1
) biomes. However, t hese biomc difl'ercnccs also var ied among the five administrative unit~ . T he ET level in GS, fo r example, varied greatly among the t hree biomes at J 82.4, 349.:3 , and 468A rrun yr- 1 for t he desert , grassland, and forest biomes, respectively, while the biome differences in XJ seemed rather small (268.6- 275.0 mm yr- 1
) ,
with ET of the grassland biome occasionally exceeding that of the forest biome. MG showed t he smallest intra-annual variat ion of ET. When integrating GPP and ET into a concept of water-use efftciency ('WUE=GP P / ET), there seemed to be different pat terns among the biomes and administrat ive units. First , t he clear-cut conclusion on vVUE among the biomes is not very apparent. In GS and XJ, WUE of the forest and desert biomes was higher t han that of the grassland biome, while the biome difference in NX was very small. Unlike GPP and ET, 'VVUE differences among the units appeared independent of biomes. For t.he desert biome, WUE was lower in XJ and MG and tbe h ighest in GS. For the grassland biorne, XJ has the lowest WLJE but there were no significant differences for t he grassland WUE among the other fottr units. For the forest biorne, WUE was the h.igbest. in GS and the lowest in MG.
The temporal and spatia l changes of GPP, ET and \VUE reflect both climatic conditions and land use (Figs. 1.4 t o 1.6). Although no effort has been made to perform systema tic a nd comprehensive analyses on parti tioning the cont ributions of climate and land use on GPP and ET, our preliminary analysis on t his t.opic indicated th at land use was responsible for 64.3% and 83.6% of GPP a.nd ET varia~.io11, respectively, while climate explained only 26.8% and 14.5%. [n other words, the irnpacL of land use on GPP and ET dynamics is 2.4 and 5.8 l-imes lcigher than t.hal of climate. Logically, these conclusions will Jjkely vary by biomc and aclrnini:; tra tive uni t .
1.4 Scientific and Societal Challenges for Adaptations in DEA
Global cli rnal ic change, human activit ies via various land-use pract ices and natural d isturb<~nces are considered t he primary d rivers for the ecosystem functions and services of any region. Development of a sound adaptation plan, therefore, is becoming a neccssi t.y for t he sust ainable future of a region such as DEA. One cannot develop a sound adaptation st;ra tegy without understanding the int.erac-

1 SLaLe and C hange of Dryla.nd East Asia (DEA) - 17
tive changes between the natural and human systems on this "crowded planet" (Bulkeley, 2001 ; Palmer et al. , 2004; Liu et al. , 2008) . Fortunately, many teams have extensively documented the similarities and differences in the past , present, and future of the DEA region (i.e., data and expertise availability). Accompanied by advanced technology (e.g., remote sensing products, models, available eddy-flux towers, etc.), we could reaclt out Lo these Leallls for a comprehensiYe analysis of the it1t.eract ions between t.he l11 tman system (HS.) and natural system (NS) toward science-based adaptation plans for the region (Fig. 1.8). Yet, Lhis type of synthesis effort has not been made by any research team. Another reseai.·ch priority for the fu ture of the DEA region is to examine and model the interact ive changes of HS and NS at d ifl'erent temporal and spatial scales in order to develop sound adaptation plans for the changing climate and land use. Specifically, we need to understand how global climate change (including warming and climatic variability) and land-use change regulate both biophysical and socioeconomic functions through exploring the underlying processes and vulnerability analyses. Generally speaking, climate change and human stresses will place unequal pressure on each element of HS and NS matrices. Yet, because of the intra-connections among the elements and between the two matrices, one element of either matrix will have the potential to trigger the changes of the other elements. These changes, however , can be predicted when important un-
F ig . 1.8 P roposed conceptual framework for explori ng t he linkages between biophysical and socioeconomic parameters as well as their coupled effects on the interact ions and feedbacks wiLIIin and between the human system (H.S) and na t.urAI system (1\S).

J8 - Jiquau Chen, et al.
derly ing proce~ses <u·e understood and incorpor a ted in a comprehensive model
Lha t includes boLll biophysical and socioeconomic influences.
A more pressing issue related to socioeconomic changes (e.g., population
g rowlh and ins LiL11 Uonal changes) imp acts o n ecosystem funcLions, which are
often delineated by adm inistrative bow1daries (e.g. , Zhcn cl al.. 2010) . These
difl'<'rcnces wi ll likely yiekl difi'creut land-usc intensities in each province and
alter t.hc fuuclion a.ud dyuamics of ecosystems, which , in t.uru , will have nega
tive reed buck 0 11 CCOII O I11i C development and future pol icy. lJ:>illg' t.hc livestock
statistics of lJ\1 and }1C as a n exam ple, major pol icy changes in boLh regions
app ea r to be responsib le for the s hifts in livestock population (F ig . 1.2c; Qi et
a l. , 2012). In J.:V[, Lhc s ubstantial increase in livestock in the lat.e 1980s was
largely a resul t. of livest.ock aud grassland t.enure r eform , while t.he drop in live
s tock a round 2000 was caused by g1·assland restoration polic ies enacted around
1998- 1999. The s ubs t.ant. ia l livestock increase since 2004 was like ly caused by
growing demaml dr iveu by fast. economic growth and markeL reform. However,
climaLic e>...'irentes a nd episodic events (e.g., E l Nino) complicated Ll te dynamics
o f livestock populaLions (e.g., 18% mortality in IvJG d ue to Lhc cxt.remc snow and
cold wint.er of 2009 2010). Recen t ly, in southern D EA, the Chinese government
an nounced several major policies (e.g. , subsidy and reward program for the coun
t. ry's herdsmen over the com ing years to reverse and prevent damage to grass
lands. htt.p:/ /ncws.:x inhuanet.cornfenglish2010/china/20 11-05/06/c~3862052.
htm), while Lhe X i11jia ng Division of the Na tiona l Development. and Reform Com
IJiission d isclosed i.hai.. it will invest 1.8 billion RMB in sand pr even t ion and con
t.rol p r ojects arou.m l l.he Tarim R iver Basin (h ttp: / /english.pcoplcdaily.com.CII/
90001/90770/90882/737556l.html). T hese new policies will produce d irect ·~ucl
imntcd iate LCLUC in DEA. One caution associated wit h Lhc coupl<x l hum:m n.nd
na.Lura l syst.ents (C IL N) is to realize that both the driver s and the dep-endent. vmi
ables are bicnu·cltically organized (i.e ., county-prcfectu re-provi ncc-counlry) n.nd
h ave d ifl'erc11l spatial a nd Lcrnpo ral r esoluLious. Socioecotlontic data arc often
collccLccl at the count.'· lt•vcl an nually by t.hc na.L ional census progralll or at. ten
year interval:;, suggC':;\ ing LltaL om aualysis wiU have to be conducted accurdiug
Lo t his hierarchy. lu conlras L, ecosystems arc spatially organized by climalc.
soil, and/or land cover L:'pes.
T he role of popul<Llion a nd p rices differ in the way t hey drive LC L C . The
local populaliou growt.h tnay not cause LCLUC d irectly, buL mthcr iudir ectly,
Lhrough the markcl and price mcdJanism. Popula~ion a.ud prices would a l:>o
have di fl'e rc.ut im pacl.s on various land-usc types via the markets. For bui ll
up hllld uses (e.g., rc:,idenl ia l), local poputat.iou chnnges would ltavc a mu('h
stronger imp:tcl Ll ta n otltcr land-usc typ es because foods and ot.hcr products ca n
be d irectly irn porlcd,/expon cd from/w other regions, but t.ltc residential usc
canneL be solved by increas ing more residential areas in oLlter regions. Changes
in land valueH resul t ing from relative price changes would sig nifican !.ly impact

1 State and Clmugc of Dryland Eas~ Asia (DEA) - 19
the population and econo my. For exam ple, a s ubstantial rise in uteat and milk
price.c; d riven by growing dema nds resul ts in increased pastora l land values, wages and economic development in t he r egion, a ttracti ng people Lo the region (rom
the rest of the cou ntry.
Mongolians who maintain nomadic pastoral practices predominmt t ly inhabit
the :.Jongolian Plat.C'all. llowcver, the 111ajority of the pa>-toral lto u:>eholcls in both l\ lG and L\1 b0ga n setlliug around pcnuanC'nl tO\\"Jt~ or im111igratcd to
large urban centers in recent decades because of rapid econontic grmvLlJ and
new policies (Havstad eL a l. , 2008) . I n 2007, the number o f li vestock in MG
reached 40 million- a n increase of 15.7% frmu 2006 , resulting in > 60% of the
pas Lureland being overgrazed. T hese rapid changes in both climate and socioeconomic syst.cws will place different levels of biophysical a nd :mthropogcnic
stress on the ecosystellls . Adaptive m a nagement plans and po licies a re therefore
needed to maintain ecosystem resilience to Lhe chauge ( i.e., adaptatio n) . IM and
l\lG have developed contrasting political systems since 1979, with much more
rapid changes in Hvf tha n in JviG , producing d is liuct land cover cha nges between
1980 and the current decade (Sneath , 1998) . As a consequence of t.he landcover
cha ngeH, severe and frequen t catastrophes (e.g ., dust stor ms) have dras t ica lly
increased in Hvi. T he laud use changes are expected Lo escala te over the uext two
decades. Additionally, sig nificant increases in a ir temperaLure s ince Lite 1950s
have been observed due to global warming: the increases varied s igui fica nlly and
were non-parallel a mo ng ecosystems . ln 2001, Lhe total ne t p rimary produc
tion (NPP) of t he Mongolian P lateau was 434 Tg C y r - L, w.ith ITvi and MG
accow tting for 48% a nd 52% , respectively. At Lite NEESPI rneetiug in Beij ing in
l\ovember, 2007, resea rchers of the Purd ue Cl imate C ha nge Center a.nd Institute
of Geographic Sciences a nd Nat ural Resources Research, CAS (IGSNRR-CAS)
predicted that climate cha nge 0 11 t ltc Platea u during the 21st cent ury will be
hig her tha n the g lo ba l average (e.g. , Ln e t a l. , 2000). By 2100, Lite projected a ir
temperature ,..,-ill i ncrease by 4.6- 8.3°C a nd the projected annual tolal p recipi
tation will increase by 122 mm Lo 178 mm. I\PP a nd uet ecosystem prod uction
(NEP ) will cont innous ly increase during l!JC 21st century, will1 1\PP reaclLing
58G- 792 T g C yr- 1 (i .e., 24%-68% increase fro m 2001) and NEP reaching 57-
113 Tg C y r - 1 (280% GGO% increase from 2001) by 2100. More importantly, MG ,
in this cen tury, will cont.ribu te more NEP for the plateau- a u increase from the current 48% to 61 %. These pre]jmi nary project ions provide a good star t toward
developing ada pta t io n s trategies on the Ylongolian P lateau. Clearly, au urge11t
scientific synthesis, by iucluding mult iple counLries and agencies, is needed to
ward the strategic preparation for fu t urc adaptnl ions plans for I he region.
20 - Jiquan Chen, et al.
Acknowledgen1ents
Our study for this chapter has been partially supported by the LCLUC Program of NASA, the Natural Science Foundation of China, the Chinese Academy of Sciences, and Henan University. Iviany colleagues (e.g., Lisa Delp Taylor, Lin Zhen, Jian Ni, Nan Lu, Haitao Li, Pavel Groisman, Garik Gutman, and an anonymous reviewer) contributed data, thoughtful discussion, and directions for our research.
References
Bulkeley, H. (2001). No regrets? Economy and environment in Australia's domestic climate change policy. Global Environmental Change, 11, 155- 169.
C heng, X., An, S., Chen, .J ., Li , B ., Liu, Y., and Liu, S. (2007) . Spatial relationships
among sp ecies, a bove-ground biomass, N, and P in degraded grasslands in Ordas Plateau, Northwestern China. Jou·mal of Arid Environments, 68, 652-667.
Dai, A., Lamb, P . J., Trenberth, K. E., Hulme, M., ,Jones, P. D., and Xie, P. (2004).
The recent Sahel drought is real. International Journal of Climatology, 24, 1323-133L
Ftanke, n.. (1982) . Smooth in terpolation of scattered data by local t hin p laLe sp lines. Computer· and Mathematics wit:h Applications, 8, 273-281.
Groisman, P . Y., Clark, E. A., Ka t tsov, V. M., LetLenmaier, D. P., Sokolik, 1. N.,
Aizen , V.B ., et al. (2009). The Northern Eurasia ear th science partnership: Au example of science applied to societal needs. Bulletin of the fl merican M eleoml ogicul Society, 5, 671- 688.
Havstad, K. M. , Herrick, J ., and T seelei, E. (2008) . Mongolia's rangelands: ls livestock
production the key to t he f·uture? Pron#ers in Ecology and the Erwimnrnenl, 6, 386-391.
IPCC (2007). Summary for policy makers. In: Climate Change 2007: Impacts, Ada ptation and Vulnerabi lity, cootr ibution of Vilorking group II to t he Fourtl1 Assessment
Report of t l1 e Intel'-goverumental Panel on Climate Change (lPCC). Cambridge, UK: Cambridge Uuive:rsity Press.
J ohn, R., Chen, .J ., Lu, N ., Guo, K ., Lia ng, C., Wei, Y., et al. (2008). Predicting p lant diversity based on remote sensing products in . t he semi-arid region of Inner Mongolia . Remote Sensing of Envimnment, 112, 2018-2032.
J ohn, R. , Chen, J .,. Lu, N., an d Wilske, B. (2009). Land cover/ land use change and their ecological consequences. Environmenwl Research Letters, 4, 045010, cloi:
10 .1088/17-18- 9326/4/4/045010. L iu , J., Li, S., Ouyang, z., Tam, C., and Chen, X. (2008). Ecological and socioeconomic
efted.s of Ch ina 's policies for ecosystem services. Proceedings of National Academy of Sciences, 105, 94.77- 9,182.
1 State and Change of Dryland East Asia (DEA) - 21
Lu, N., Chen, S., Wilske, B. , Sun, G., and Cheu, J. (2011). Evapotranspira tion and soi l water relationships in a range of disturbed a nd undis turbed ecosyste ms in t he semi-arid Inner Mongolia, China. Joum.a/ of Plant Ecology, 4: 49-60.
Lu, N., W ilske, B. , Ni , J. , John, R. , a nd Chen, J . (2009). Climate cha nge in Inner Mongolia from 1955 t hrough 2005. Envii'Onmental Research Letters, 4. 045006. doi:
10.108 / 17-18-9:126/4/1/0 1500G. l.u , Y .. Zhuaug. Q., Zhou. G .. Sirin , ,\. , 1\JpJiiJo . .1. , and l(iddight<'r. D. (2009).
Pof'sib le decl ine of the carbon sink in the Mougoliau Plateau during the 2 1 :;1. c•·nL ury.
Envimnmenlal Resem·ch Letters, 4, 045023. doi: J0. 1088/1748-9326/4/4/045023. :'vliao, H., Chen, S., Chen, J ., Zhang, \;V. , Zhang, P. , Wei, L. , et al. (2009) . C ul tiva t ion
a nd grazing a ltered eva potranspiration nud cly numics in Inner Mongolia s teppes. Ag1'icultural an d F01·est Met eorology, 149, .L810- 18 L!J.
}!itas, L. , a nd Mitasova, H. (1988). Geuera l varia t ional approach to Lhe interpolation problem. Comptttc1· and Mathematics with A71[Jlications, 16, 983- 992.
:..lorton, S. R., Stafford Smith, D . i'vl. , Dickmau, C. R. , D unkerley, D. L., Friedel, 1\I.H., \kAIIister, R. R. J. , et al. (2011). A fresh framework for the ecology of arid Australia. JoUT·nal of Arid Environment, 75, 31 - 329.
lVl u, Q., Zhao, JVI. , a nd Running, S. W. (201 l ). ll 11 provemems loa MODIS global terrestria l eva.potra nspiratiou a lgorithm. Remo_te Sensing of Envimnmcnt, 115, 1781-
1800. Oji ma, D. , a nd Chuluun , T. (2008). Policy cl1n.nges in Mongolia: lmplicatio11s for la nd
use and landscapes. In: Galvin , K. A., H.eid, n.. S., Behnke, R. H. and Hobbs, N. T. (Eds.). Fragmentation in Semi-arid an d !l ricl l,a11dscapes: Consequences f or Hnman
and Natural Systems. Springer, Dordrecht , T he Net herlands: 179- 193. Olson, D. M., Dinerstein, E., Wikrama nayake, E. D., Burgess, N. D. , P owell , G. V.
N., Underwood , E. C., et a l. (2001). Terrestrial ccoregions of the world: A new map of life on Earth. BioScience, 51, 933- 938.
Pa lmer, M., Beruhardt, E. , Chornesky, E., Collins, S., Dobson, A., Duke, C., et al.
(2004). Ecology for a crowded planet. Science, ~104 , 1251- 1252.
Piao, S., Fang, J., Liu, II ., and Zhu , B. (2005) . NDVI- ind icated d ecline in desert ificat ion in China in t he past two decades. Geo7Jhysical Research Letters, 32, LO.l029/ 2004GL0217Gtl.
Qi, J .. Chen, J. , \Van, S., and Ai, L. (2012). Understanding the coupled natural
a nd human systems in t he Dryland Eas t Asia. Environmental Resear'Ch Lette1·s, 7, 015202, doi:l0.1088/ 1748-9326/7/1/015202.
Slmo, C., Chen, J. , Li, L., Xu, 'vV., Chen, S., Tenney, G ., e t a l. (2008). Spatial variability in soil heal flux a t three Inner Mongolia s teppe ecosystems . Agricultural and Forest Meteomlogy, 148, 1433- 1443.
Sneath, D. (1998) . Ecology: State policy a nd paslm e degradation in inner Asia. Science, 281, 1147- 11 48.
SU:ickli . R. , Vidale, P. L. , Boone, A., a nd Schi"ir, C. (2007). lmpact of scale a nd aggregat ion on the terrestrial water exchauge: lntegru.t.ing land surface models and Rhone
catchment observations. Journal of llyd.rometeom/ogy, 8, 1002- 1015, doi:10. l.L 75/ J 1-IM613.1.
Xua n, J ., Liu , G. , and Du , K. (2000). D us t emission inventory in Northern China . AlmospheTic Emrimnment, 34, 4565- 4570.

22 - J iquan Chen, et al.
Zhai, P . and Pan, X . (2003). TI.·ends in temperature extremes during 1951- 1999 in China. Geophysical Research L etters, 30, 1913, doi:10.1029/2003GL018004.
Zhen, L. , Ochirbat , 8., Lv, Y., Wei, Y. J ., Liu, X. L., Chen, J . Q., et al. (2010}. Comparing patterns of ecosystem service consumpt ion and perceptions of range management bctwce11 elhnir. borders in Iwwr Mongolia and Mongolia. Envi1'0nmen
l al li.esec~rch Letter·s, 5. doi:lO. I 088/1748-9326/ 5/ l/ 015001.
Authors Information
J iquan Chen 1•6 *, Ranjeet John 1
, Guanghua Qiao2, Ochirbat Batkhishig3
,
Wen ping Yuan4 , Yaoqi Zhang5 , Changliang Shao6•1 , Zutao Ouyang1 , Linghao
Li6 , Ke G uo6 , Ge Sun 7
1. Landscape Ecology & Ecosystem Science (LEES) Lab , Department of Environmental Sciences, University of Toledo, Toledo, OH 43606-3390, USA
2. College of E conomics and Management, Inner Mongolia Agricultura l Univer
sity, Huhhot 010019, P.R. China 3. Soil Science Department, Institute of Geography, Mongolian Academy of Sci
ences, Ulaanbaatar 210620, Mongolia 4. College of Global Change and Earth System Science, Beijing Normal Univer
sity, Beijing 100875 , P.R. China 5. School of Forestry & Wi ldlife Sciences, Auburn UniYers iLy, AL 36849-5418,
USA 6. Institute of Botany, Chinese Academy of Sciences, Beijing 100093, P.R. China 7. Sou thern G lobal Change Program , USDA Fores t Service, NH 03824, USA
* Corresponding author
C hap ter 2
Dry land Context
Geoffrey M. /len. J olm., and Elena ,
S ummary : This
spher ic cou Lext by
within DEA wiLh ica. Key know led~
change ou both t \ i\fal.er is l.he cotru
tempor<tl pa.Ltern:; of t he vegel,ated I
lhc recent hmd d.)
2.1 Study
The region of foe; East Asia (DEA),
Mongolia and four
Region, Niugxia B and Gansu Provit contexL for the re!-
1:-o r comparison laLitudinal l><mcl f to political enlit iP annual precipita ti(