Embed Size (px)
Citation preview

STATE ACTION PLAN on CO2 emissions from aviation
Positivity Professionalism Trust Respect - - - - - - - - - - - - - - - - - - - - - - - - - - - - - - - - -
1
Table of Contents
Common Preamble ..................................................................................................................... 2
Introduction - Current State of Aviation in Iceland ................................................................... 4
Airports and Air Operators in Iceland ................................................................................. 4
Air Navigation Services ...................................................................................................... 4
The Development in Icelandic Aviation ............................................................................. 4
Section I – ECAC/EU Common Section .................................................................................... 5
A. ECAC Baseline Scenario ............................................................................................... 5
B. Actions Taken at the Supranational Level ...................................................................... 9
Aircraft-Related Technology Development ................................................................. 9
Alternative Fuels ........................................................................................................ 12
Improved Air Traffic Management and Infrastructure Use ....................................... 17
Economic/Market-based Measures ............................................................................ 28
EU Initiatives in Third Countries ............................................................................... 32
Support to Voluntary Actions .................................................................................... 33
Section II – National Actions in Iceland .................................................................................. 37
Aircraft-related Technology Development ....................................................................... 37
Improved Air Traffic Management and Infrastructure Use .............................................. 37
Economic/Market-based Measures ................................................................................... 38
Conclusion ................................................................................................................................ 38
References ................................................................................................................................ 39
2
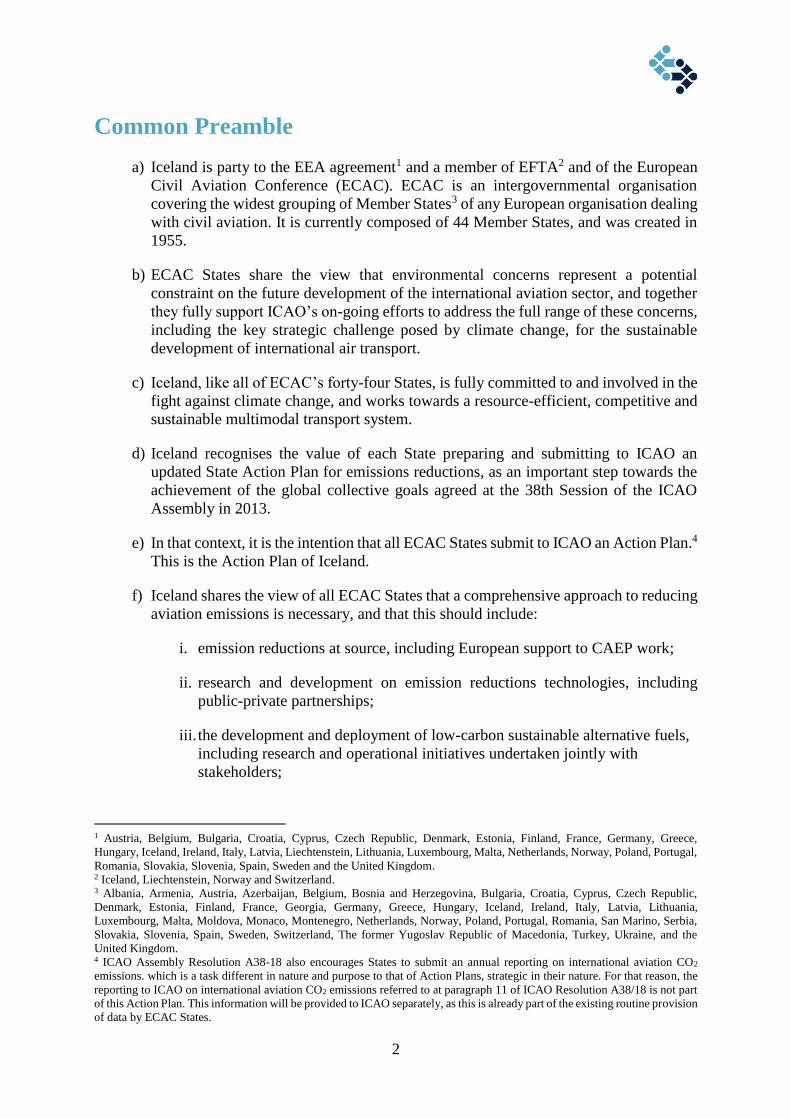
Common Preamble
a) Iceland is party to the EEA agreement1 and a member of EFTA2 and of the European
Civil Aviation Conference (ECAC). ECAC is an intergovernmental organisation
covering the widest grouping of Member States3 of any European organisation dealing
with civil aviation. It is currently composed of 44 Member States, and was created in
1955.
b) ECAC States share the view that environmental concerns represent a potential
constraint on the future development of the international aviation sector, and together
they fully support ICAO’s on-going efforts to address the full range of these concerns,
including the key strategic challenge posed by climate change, for the sustainable
development of international air transport.
c) Iceland, like all of ECAC’s forty-four States, is fully committed to and involved in the
fight against climate change, and works towards a resource-efficient, competitive and
sustainable multimodal transport system.
d) Iceland recognises the value of each State preparing and submitting to ICAO an
updated State Action Plan for emissions reductions, as an important step towards the
achievement of the global collective goals agreed at the 38th Session of the ICAO
Assembly in 2013.
e) In that context, it is the intention that all ECAC States submit to ICAO an Action Plan.4
This is the Action Plan of Iceland.
f) Iceland shares the view of all ECAC States that a comprehensive approach to reducing
aviation emissions is necessary, and that this should include:
i. emission reductions at source, including European support to CAEP work;
ii. research and development on emission reductions technologies, including
public-private partnerships;
iii. the development and deployment of low-carbon sustainable alternative fuels,
including research and operational initiatives undertaken jointly with
stakeholders;
1 Austria, Belgium, Bulgaria, Croatia, Cyprus, Czech Republic, Denmark, Estonia, Finland, France, Germany, Greece,
Hungary, Iceland, Ireland, Italy, Latvia, Liechtenstein, Lithuania, Luxembourg, Malta, Netherlands, Norway, Poland, Portugal,
Romania, Slovakia, Slovenia, Spain, Sweden and the United Kingdom. 2 Iceland, Liechtenstein, Norway and Switzerland. 3 Albania, Armenia, Austria, Azerbaijan, Belgium, Bosnia and Herzegovina, Bulgaria, Croatia, Cyprus, Czech Republic,
Denmark, Estonia, Finland, France, Georgia, Germany, Greece, Hungary, Iceland, Ireland, Italy, Latvia, Lithuania,
Luxembourg, Malta, Moldova, Monaco, Montenegro, Netherlands, Norway, Poland, Portugal, Romania, San Marino, Serbia,
Slovakia, Slovenia, Spain, Sweden, Switzerland, The former Yugoslav Republic of Macedonia, Turkey, Ukraine, and the
United Kingdom. 4 ICAO Assembly Resolution A38-18 also encourages States to submit an annual reporting on international aviation CO2
emissions. which is a task different in nature and purpose to that of Action Plans, strategic in their nature. For that reason, the
reporting to ICAO on international aviation CO2 emissions referred to at paragraph 11 of ICAO Resolution A38/18 is not part
of this Action Plan. This information will be provided to ICAO separately, as this is already part of the existing routine provision
of data by ECAC States.

3
iv. the optimisation and improvement of Air Traffic Management, and
infrastructure use within Europe, in particular through the Single European
Sky ATM Research (SESAR), and also beyond European borders, through
the Atlantic Initiative for the Reduction of Emissions (AIRE) in
cooperation with the US FAA;
v. Market-based measures, which allow the sector to continue to grow in a
sustainable and efficient manner, recognizing that the measures at (i) to (iv)
above cannot, even in aggregate, deliver in time the emissions reductions
necessary to meet the global goals. This growth becomes possible through
the purchase of carbon units that foster emission reductions in other sectors
of the economy, where abatement costs are lower than within the aviation
sector.
g) In Europe, many of the actions which are undertaken within the framework of this
comprehensive approach are in practice taken at a supra-national level, most of
them led by the European Union. They are reported in Section 1 of this Action
Plan, where Iceland’s involvement in them is described, as well as that of
stakeholders.
h) In Iceland a number of actions are undertaken at the national level, including by
stakeholders, in addition to those of a supra-national nature. These national actions
are reported in Section 2 of this Plan.
i) In relation to actions which are taken at a supranational level, it is important to
note that:
i. The extent of participation will vary from one State and another, reflecting
the priorities and circumstances of each State (economic situation, size of
its aviation market, historical and institutional context, such as EU/ non
EU). The ECAC States are thus involved to different degrees and on
different timelines in the delivery of these common actions. When an
additional State joins a collective action, including at a later stage, this
broadens the effect of the measure, thus increasing the European
contribution to meeting the global goals.
ii. Nonetheless, acting together, the ECAC States have undertaken to reduce
the region’s emissions through a comprehensive approach which uses each
of the pillars of that approach. Some of the component measures, although
implemented by some but not all of ECAC’s 44 States, nonetheless yield
emission reduction benefits across the whole of the region (thus for
example research, ETS).

4
Introduction - Current State of Aviation in Iceland
Iceland is a Nordic island country located in the North Atlantic Ocean. Geologically,
Iceland is located on the Mid-Atlantic ridge, and marks the actual boundaries between
adjacent tectonic plates; the Eurasian plate and the North American plate. The total land
area of Iceland is 103,000 km2 and its ever-growing number of inhabitants currently stands
at 350,710, or 3.4 inhabitants per square kilometer. Reykjavik, and the surrounding
municipalities that collectively make up the so-called Greater Reykjavik area, are home to
222,484 inhabitants, or 63% of the population.
Airports and Air Operators in Iceland
Iceland has four international airports located in Akureyri, Egilsstadir, Keflavik and
Reykjavik. Additionally, the number of domestic airports in Iceland is 13 plus 46 landing
strips. In terms of passengers the airport in Keflavik is by far the busiest one, with the
majority of the international traffic and almost all scheduled international traffic involving
heavy jets, while Reykjavik airport serves as the center for domestic flights in Iceland.
The airports are operated by Isavia Ltd., a state-owned limited liability company. As stated
in their Annual report from 2015, new facilities to accommodate the increased number of
passengers are in construction at Keflavik airport.
There are 14 commercial air operators in Iceland.
Air Navigation Services
The Reykjavik control area is among the largest in the world at approximately 5.4 million
square kilometres, and consists of Reykjavik FIR and Sondrestrom FIR above FL 195. Each
year approximately 100,000 airplanes fly over 140 million km in the Reykjavik control
area.
The Development in Icelandic Aviation
In 2017, the total number of passengers in Keflavik airport was 8,755,352. As of April
2018, the total number of passengers in the airport was 2,436,981, an increase of 11.6%
from the previous year. This is in keeping with the development from previous years, as the
total number of passengers in Keflavik airport has more than tripled since 2010. A
considerable growth in tourism is partly the cause of this increase, but there has also been
a significant increase in transit passengers.
5
Section I – ECAC/EU Common Section
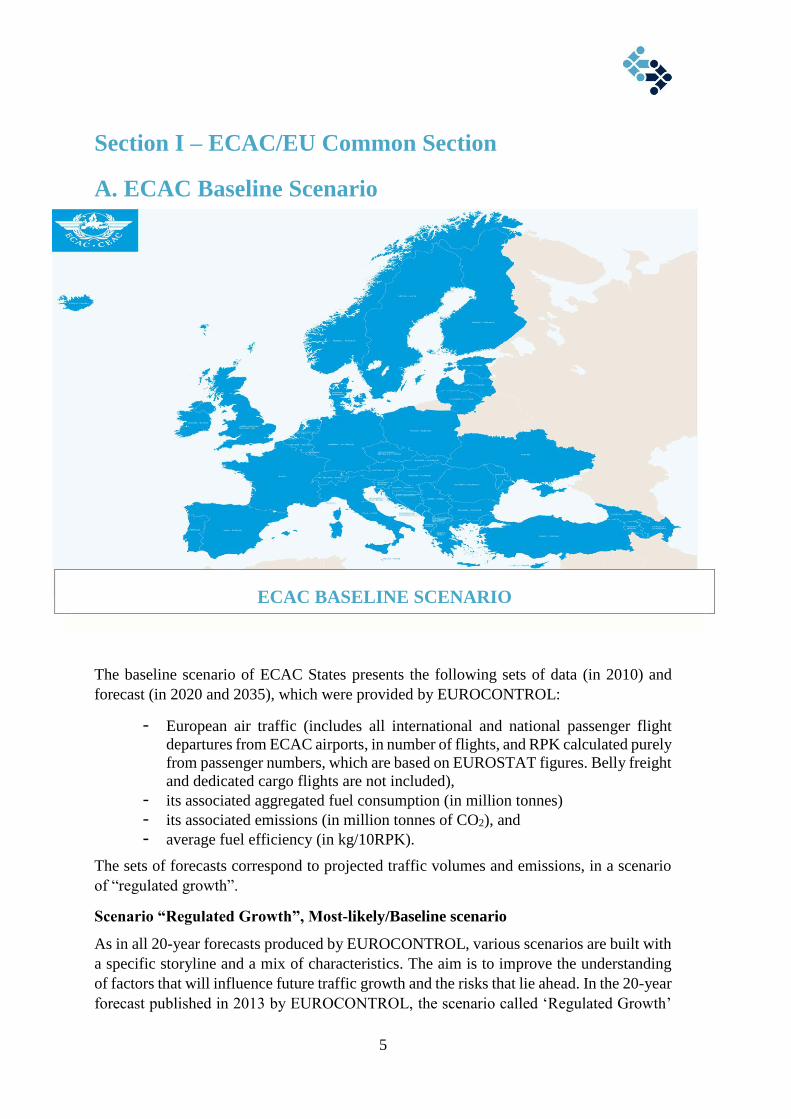
A. ECAC Baseline Scenario
ECAC BASELINE SCENARIO
The baseline scenario of ECAC States presents the following sets of data (in 2010) and
forecast (in 2020 and 2035), which were provided by EUROCONTROL:
- European air traffic (includes all international and national passenger flight
departures from ECAC airports, in number of flights, and RPK calculated purely
from passenger numbers, which are based on EUROSTAT figures. Belly freight
and dedicated cargo flights are not included),
- its associated aggregated fuel consumption (in million tonnes)
- its associated emissions (in million tonnes of CO2), and
- average fuel efficiency (in kg/10RPK).
The sets of forecasts correspond to projected traffic volumes and emissions, in a scenario
of “regulated growth”.
Scenario “Regulated Growth”, Most-likely/Baseline scenario
As in all 20-year forecasts produced by EUROCONTROL, various scenarios are built with
a specific storyline and a mix of characteristics. The aim is to improve the understanding
of factors that will influence future traffic growth and the risks that lie ahead. In the 20-year
forecast published in 2013 by EUROCONTROL, the scenario called ‘Regulated Growth’

6
was constructed as the ‘most-likely’ or ‘baseline’ scenario, most closely following the
current trends. It considers a moderate economic growth, with regulation reconciling the
environmental, social and economic demands.
Table 1. Summary characteristics of EUROCONTROL scenarios:
The table above presents a summary of the social, economic and air traffic-related
characteristics of the different scenarios developed by EUROCONTROL for the purposes
of EUROCONTROL 20-year forecast of IFR movements.5
ECAC baseline scenario
The ECAC baseline scenario presented in the following tables was generated by
EUROCONTROL for all ECAC States including the Canary Islands. Over-flights of the
ECAC area have not been included.
The baseline scenario, which is presented in the following tables, does not include business
and dedicated cargo traffic. It covers only commercial passenger flight movements for the
5 The characteristics of the different scenarios can be found in Task 4: European Air Traffic in 2035,
Challenges of Growth 2013, EUROCONTROL, June 2013 available at ECAC website.

7
area of scope outlined in the previous paragraph, using data for airport pairs, which allows
for the generation of fuel efficiency data (in kg/RPK). Historical fuel burn (2010) and
emission calculations are based on the actual flight plans from the PRISME data warehouse,
including the actual flight distance and the cruise altitude by airport pair. Future year fuel
burn and emissions (2020, 2035) are modelled based on actual flight distances and cruise
altitudes by airport pair in 2014. Taxi times are not included. The baseline is presented
along a scenario of engine-technology freeze, as of 2014, so aircraft not in service at that
date are modelled with the fuel efficiency of comparable-role in-service aircraft (but with
their own seating capacities).
The future fleet has been generated using the Aircraft Assignment Tool (AAT) developed
collaboratively by EUROCONTROL, the European Aviation Safety Agency and the
European Commission. The retirement process of the Aircraft Assignment Tool is
performed year by year, allowing the determination of the amount of new aircraft required
each year. This way, the entry into service year (EISY) can be derived for the replacement
aircraft. The Growth and Replacement (G&R) Database used is largely based on the
Flightglobal Fleet Forecast - Deliveries by Region 2014 to 2033. This forecast provides the
number of deliveries for each type in each of the future years, which are re-scaled to match
the EUROCONTROL forecast.
The data and forecasts for Europe show two distinct phases, of rapid improvement followed
by continuing, but much slower improvement after 2020. The optimism behind the forecast
for the first decade is partly driven by statistics: in the 4 years 2010-2014, the average
annual improvement in fuel efficiency for domestic and international flights was around
2%, [Source: EUROCONTROL] so this is already achieved. Underlying reasons for this
include gains through improvements in load factors (e.g. more than 3% in total between
2010 and 2014), and use of slimmer seats allowing more seats on the same aircraft.
However, neither of these can be projected indefinitely into the future as a continuing
benefit, since they will hit diminishing returns. In their place we have technology transitions
to A320neo, B737max, C-series, B787 and A350 for example, especially over the next 5
years or so. Here this affects seat capacity, but in addition, as we exit from the long
economic downturn, we see an acceleration of retirement of old, fuel-inefficient aircraft, as
airline finances improve, and new models become available. After that, Europe believes
that the rate of improvement would be much slower, and this is reflected in the ‘technology
freeze’ scenario, which is presented here.
Table 2. Total fuel burn for passenger domestic and international flights (ECAC)
Year
Traffic (millions of
departing flights)
Total Fuel burn (in
million tonnes)
2010 7,12 40,34
2020 8,46 47,91
2035 11,43 72,35

8
Table 3. CO2 emissions forecast
Year
CO2 emissions (in
million tonnes)
2010 127,48
2020 151,40
2035 228,63
Table 4. Traffic in RPK (domestic and international departing flights from ECAC
airports, PAX only, no freight and dedicated cargo flights)
Year Traffic (in billion RPK)
2010 1 329,6
2020 1 958,7
2035 3 128,2
Table 5. Fuel efficiency (kg/10RPK)
Year Fuel efficiency (in kg/10
RPK)
2010 0,3034
2020 0,2468
2035 0,2337
Table 6. Average annual fuel efficiency improvement
Period Fuel efficiency
improvement
2020 - 2010 -2,05%
2035 - 2020 -0,36%
2035 - 2010 -1,04%
In order to further improve fuel efficiency and to reduce future air traffic emissions beyond
the projections in the baseline scenario, ECAC States have taken further action.
Supranational measures in order to achieve such additional improvement will be described
in the following sections.
It should be noted, however, that a quantification of the effects of many measures is
difficult. As a consequence, no aggregated quantification of potential effects of the
supranational measures can be presented in this action plan.
ECAC/EU
9
B. Actions taken at the supranational level
Aircraft Emissions Standards (Europe's Contribution to the
Development of the Aeroplane CO2 Standard in CAEP)
European Member States fully supported the work achieved in ICAO’s Committee on
Aviation Environmental Protection (CAEP), which resulted in an agreement on the new
aeroplane CO2 Standard at CAEP/10 meeting in February 2016, applicable to new
aeroplane type designs from 2020 and to aeroplane type designs that are already in-
production in 2023. Europe significantly contributed to this task, notably through the
European Aviation Safety Agency (EASA) which co-led the CO2 Task Group within
CAEP’s Working Group 3, and which provided extensive technical and analytical support.
The assessment of the benefits provided by this measure in terms of reduction in European
emissions is not provided in this action plan. Nonetheless, elements of assessment of the
overall contribution of the CO2 standard towards the global aspirational goals are available
in CAEP.
AIRCRAFT-RELATED TECHNOLOGY DEVELOPMENT

10
Research and Development
Clean Sky is an EU Joint Technology Initiative (JTI) that aims to develop and mature
breakthrough “clean technologies” for air transport. By accelerating their deployment, the
JTI will contribute to Europe’s strategic environmental and social priorities, and
simultaneously promote competitiveness and sustainable economic growth.
Joint Technology Initiatives are specific large-scale EU research projects created by the
European Commission within the 7th Framework Programme (FP7) and continued within
the Horizon 2020 Framework Programme. Set up as a Public Private Partnership between
the European Commission and the European aeronautical industry, Clean Sky pulls
together the research and technology resources of the European Union in a coherent
programme, and contribute significantly to the ’greening’ of aviation.
The first Clean Sky programme (Clean Sky 1 - 2011-2017) has a budget of € 1,6 billion,
equally shared between the European Commission and the aeronautics industry. It aims to
develop environmental friendly technologies impacting all flying-segments of commercial
aviation. The objectives are to reduce CO2 aircraft emissions by 20-40%, NOx by around
60% and noise by up to 10dB compared to year 2000 aircraft.
What has the current JTI achieved so far?
It is estimated that Clean Sky resulted in a reduction of
aviation CO2 emissions by more than 20% with respect to
baseline levels (in 2000), which represents an aggregate
reduction of 2 to 3 billion tonnes of CO2 over the next 35
years
This was followed up by a second programme (Clean Sky 2 – 2014-2024) with the
objective to reduce aircraft emissions and noise by 20 to 30% with respect to the latest
technologies entering into service in 2014. The current budget for the programme is
approximately €4 billion.
The two Interim Evaluations of Clean Sky in 2011 and 2013 acknowledged that the
programme is successfully stimulating developments towards environmental targets. These
preliminary assessments confirm the capability of achieving the overall targets at
completion of the programme.
Main remaining areas for RTD efforts under Clean Sky 2 are:
Large Passenger Aircraft: demonstration of best technologies to achieve the
environmental goals while fulfilling future market needs and improving the
competitiveness of future products.
Regional Aircraft: demonstrating and validating key technologies that will enable
a 90-seat class turboprop aircraft to deliver breakthrough economic and
environmental performance and superior passenger experience.
Fast Rotorcraft: demonstrating new rotorcraft concepts (tilt-rotor and FastCraft
compound helicopter) technologies to deliver superior vehicle versatility and
performance.
ECAC/EU
11
Airframe: demonstrating the benefits of advanced and innovative airframe
structures (like a more efficient wing with natural laminar flow, optimised control
surfaces, control systems and embedded systems, highly integrated in metallic and
advanced composites structures). In addition, novel engine integration strategies
and investigate innovative fuselage structures will be tested.
Engines: validating advanced and more radical engine architectures.
Systems: demonstrating the advantages of applying new technologies in major
areas such as power management, cockpit, wing, landing gear, to address the needs
of future generation aircraft in terms of maturation, demonstration and Innovation.
Small Air Transport: demonstrating the advantages of applying key technologies
on small aircraft demonstrators and to revitalise an important segment of the
aeronautics sector that can bring key new mobility solutions.
Eco-Design: coordinating research geared towards high eco-compliance in air
vehicles over their product life and heightening the stewardship in intelligent Re-
use, Recycling and advanced services.
In addition, the Technology Evaluator will continue and be upgraded to assess
technological progress routinely and evaluate the performance potential of Clean Sky 2
technologies at both vehicle and aggregate levels (airports and air traffic systems). More
details on Clean Sky can be found at the following link:
http://www.cleansky.eu/
12
ALTERNATIVE FUELS
European Advanced Biofuels Flightpath
Within the European Union, Directive 2009/28/EC on the promotion of the use of
energy from renewable sources (“the Renewable Energy Directive” – RED) established
mandatory targets to be achieved by 2020 for a 20% overall share of renewable energy
in the EU and a 10% share for renewable energy in the transport sector. Furthermore,
sustainability criteria for biofuels to be counted towards that target were established.6
In February 2009, the European Commission's Directorate General for Energy and
Transport initiated the SWAFEA (Sustainable Ways for Alternative Fuels and Energy
for Aviation) study to investigate the feasibility and the impact of the use of alternative
fuels in aviation.
The SWAFEA final report was published in July 2011.7 It provides a comprehensive
analysis on the prospects for alternative fuels in aviation, including an integrated
analysis of technical feasibility, environmental sustainability (based on the
sustainability criteria of the EU Directive on renewable energy)8 and economic aspects.
6 Directive 2009/28/EC of the European Parliament and of the Council of 23/04/2009 on the promotion of the use
of energy from renewable sources and amending and subsequently repealing Directives 2001/77/EC and
2003/30/EC, Article 17 Sustainability criteria for biofuels and bioliquids, at pp. EU Official Journal L140/36-
L140/38. 7http://www.icao.int/environmental-
protection/GFAAF/Documents/SW_WP9_D.9.1%20Final%20report_released%20July2011.pdf 8 Directive 2009/28/EC of the European Parliament and of the Council of 23 April 2009 on the promotion of the use
of energy from renewable sources and amending and subsequently repealing Directives 2001/77/EC and 2003/30/EC

13
It includes a number of recommendations on the steps that should be taken to promote
the take-up of sustainable biofuels for aviation in Europe.
In March 2011, the European Commission published a White Paper on transport.9 In
the context of an overall goal of achieving a reduction of at least 60% in greenhouse
gas emissions from transport by 2050 with respect to 1990, the White Paper
established a goal of low-carbon sustainable fuels in aviation reaching 40% by
2050.
Source: ACARE Strategic Research and Innovation Agenda, Volume 2
As a first step towards delivering this goal, in June 2011 the European Commission, in
close coordination with Airbus, leading European airlines (Lufthansa, Air
France/KLM, & British Airways) and key European biofuel producers (Choren
Industries, Neste Oil, Biomass Technology Group and UOP), launched the European
Advanced Biofuels Flight-path. This industry-wide initiative aims to speed up the
commercialisation of aviation biofuels in Europe, with the objective of achieving the
commercialisation of sustainably produced paraffinic biofuels in the aviation
sector by reaching a 2 million tonnes consumption by 2020.
This initiative is a shared and voluntary commitment by its members to support and
promote the production, storage and distribution of sustainably produced drop-in
biofuels for use in aviation. It also targets establishing appropriate financial
mechanisms to support the construction of industrial "first of a kind" advanced biofuel
production plants. The Biofuels Flight path is explained in a technical paper, which sets
out in more detail the challenges and required actions.10
More specifically, the initiative focuses on the following:
1. Facilitate the development of standards for drop-in biofuels and their
certification for use in commercial aircraft;
2. Work together with the full supply chain to further develop worldwide accepted
sustainability certification frameworks
3. Agree on biofuel take-off arrangements over a defined period of time and at a
reasonable cost;
4. Promote appropriate public and private actions to ensure the market uptake of
paraffinic biofuels by the aviation sector;
9 Roadmap to a Single European Transport Area – Towards a competitive and resource efficient transport system,
COM (2011) 144 final 10 http://ec.europa.eu/energy/technology/initiatives/doc/20110622_biofuels_flight_path_technical_paper.pdf
ACARE Roadmap targets regarding share alternative
sustainable fuels:
Aviation to use:
- at minimum 2% sustainable alternative fuels in 2020;
- at minimum 25% sustainable alternative fuels in 2035;
- at minimum 40% sustainable alternative fuels in 2050

14
5. Establish financing structures to facilitate the realisation of 2nd Generation
biofuel projects;
6. Accelerate targeted research and innovation for advanced biofuel technologies,
and especially algae.
7. Take concrete actions to inform the European citizen of the benefits of replacing
kerosene by certified sustainable biofuels.
The following “Flight Path” provides an overview about the objectives, tasks, and
milestones of the initiative.
Time horizons
(Base year -
2011)
Action Aim/Result
Short-term
(next 0-3 years)
Announcement of action at
International Paris Air Show
To mobilise all stakeholders
including Member States.
High-level workshop with financial
institutions to address funding
mechanisms.
To agree on a "Biofuel in Aviation
Fund".
> 1 000 tonnes of Fisher-Tropsch
biofuel become available.
Verification of Fisher-Tropsch
product quality. Significant volumes
of synthetic biofuel become
available for flight testing.
Production of aviation class biofuels
in the hydro-treated vegetable oil
(HVO) plants from sustainable
feedstock
Regular testing and eventually few
regular flights with HVO biofuels
from sustainable feedstock.
Secure public and private financial
and legislative mechanisms for
industrial second generation biofuel
plants.
To provide the financial means for
investing in first of a kind plants and
to permit use of aviation biofuel at
economically acceptable conditions.
Biofuel purchase agreement signed
between aviation sector and biofuel
producers.
To ensure a market for aviation
biofuel production and facilitate
investment in industrial 2G plants.
Start construction of the first series of
2G plants.
Plants are operational by 2015-16.
Identification of refineries & blenders
which will take part in the first phase
of the action.
Mobilise fuel suppliers and logistics
along the supply chain.
Mid-term (4-7
years)
2000 tonnes of algal oils are becoming
available.
First quantities of algal oils are used
to produce aviation fuels.
Supply of 1,0 M tonnes of
hydrotreated sustainable oils and 0,2
tonnes of synthetic aviation biofuels
in the aviation market.
1,2 M tonnes of biofuels are blended
with kerosene.
Start construction of the second series
of 2G plants including algal biofuels
and pyrolytic oils from residues.
Operational by 2020.

15
Time horizons
(Base year -
2011)
Action Aim/Result
Long-term (up
to 2020)
Supply of an additional 0,8 M tons of
aviation biofuels based on synthetic
biofuels, pyrolytic oils and algal
biofuels.
2,0 M tonnes of biofuels are blended
with kerosene.
Further supply of biofuels for
aviation, biofuels are used in most EU
airports.
Commercialisation of aviation
biofuels is achieved.
When the Flight-path 2020 initiative began in 2010, only one production pathway was
approved for aviation use; no renewable kerosene had actually been produced except
at very small scale, and only a handful of test and demonstration flights had been
conducted using it. Since then, worldwide technical and operational progress of the
industry has been remarkable. Four different pathways for the production of renewable
kerosene are now approved and several more are expected to be certified. A significant
number of flights using renewable kerosene have been conducted, most of them
revenue flights carrying passengers. Production has been demonstrated at
demonstration and even industrial scale for some of the pathways. Use of renewable
kerosene within an airport hydrant system was demonstrated in Oslo in 2015.
Performed flights using bio-kerosene
IATA: 2000 flights worldwide using bio-kerosene blends performed by 22
airlines between June 2011 and December 2015
Lufthansa: 1189 flights Frankfurt-Hamburg using 800 tonnes of bio-
kerosene (during 6 months – June/December 2011)
KLM: a series of 200 flights Amsterdam-Paris from September 2011 to
December 2014, 26 flights New York-Amsterdam in 2013, and 20 flights
Amsterdam-Aruba in 2014 using bio-kerosene
Production (EU) Neste (Finland): by batches
- Frankfurt-Hamburg (6 months) 1189 flights operated by Lufthansa: 800 tonnes
of bio-kerosene
- Itaka: €10m EU funding (2012-2015): > 1 000 tonnes
Biorefly: €13,7m EU funding: 2000 tonnes per year – second generation (2015)
– BioChemtex (Italy)
BSFJ Swedish Biofuels: €27,8m EU funding (2014-2019)

16
Research and Development Projects on Alternative Fuels in Aviation
In the time frame 2011-2016, 3 projects have been funded by the FP7 Research and
Innovation program of the EU.
ITAKA: €10m EU funding (2012-2015) with the aim of assessing the potential of a
specific crop (camelina) for providing jet fuel. The project aims entail the testing of the
whole chain from field to fly, assessing the potential beyond the data gathered in lab
experiments, gathering experiences on related certification, distribution and on
economical aspects. As feedstock, ITAKA targets European camelina oil and used
cooking oil, in order to meet a minimum of 60% GHG emissions savings compared
to the fossil fuel jetA1.
SOLAR-JET: this project has demonstrated the possibility of producing jet-fuel from
CO2 and water. This was done by coupling a two-step solar thermochemical cycle based
on non-stoichiometric ceria redox reactions with the Fischer-Tropsch process. This
successful demonstration is further complemented by assessments of the chemical
suitability of the solar kerosene, identification of technological gaps, and determination
of the technological and economical potentials.
Core-JetFuel: €1,2m EU funding (2013-2017) this action evaluates the research and
innovation “landscape” in order to develop and implement a strategy for sharing
information, for coordinating initiatives, projects and results and to identify needs in
research, standardisation, innovation/deployment, and policy measures at European
level. Bottlenecks of research and innovation will be identified and, where appropriate,
recommendations for the European Commission will be elaborated with respect to re-
orientation and re-definition of priorities in the funding strategy. The consortium covers
the entire alternative fuel production chain in four domains: Feedstock and
sustainability; conversion technologies and radical concepts; technical compatibility,
certification and deployment; policies, incentives and regulation. CORE-JetFuel
ensures cooperation with other European, international and national initiatives and with
the key stakeholders in the field. The expected benefits are enhanced knowledge of
decision makers, support for maintaining coherent research policies and the promotion
of a better understanding of future investments in aviation fuel research and innovation.
In 2015, the European Commission launched projects under the Horizon 2020
research programme with capacities of the order of several 1000 tonnes per year.

17
IMPROVED AIR TRAFFIC MANAGEMENT AND
INFRASTRUCTURE USE
The EU's Single European Sky Initiative and SESAR
SESAR Project
The European Union's Single European Sky (SES) policy aims to reform Air Traffic
Management (ATM) in Europe in order to enhance its performance in terms of its
capacity to manage larger volume of flights in a safer, more cost-efficient and
environmental friendly manner.
The SES aims at achieving 4 high level performance objectives (referred to 2005
context):
Triple capacity of ATM systems
Reduce ATM costs by 50%
Increase safety by a factor of 10
Reduce the environmental impact by 10% per flight
SESAR, the technological pillar of the Single European Sky, contributes to the Single
Sky's performance targets by defining, developing, validating and deploying innovative
technological and operational solutions for managing air traffic in a more efficient
manner.

18
SESAR contribution to the SES high-level goals set by the Commission are
continuously reviewed by the SESAR JU and kept up to date in the ATM Master Plan.
The estimated potential fuel emission savings per flight segment is depicted below:
SESAR’s contribution to the SES performance objectives is now targeting for 2016,
as compared to 2005 performance:
1) 27% increase in airspace capacity and 14% increase in airport capacity;
2) Associated improvement in safety, i.e. in an absolute term, 40% of reduction in
accident risk per flight hour.
3) 2,8 % reduction per flight in gate to gate greenhouse gas emissions;
4) 6 % reduction in cost per flight.
The projection of SESAR target fuel efficiency beyond 2016 (Step 1)11 is depicted in
the following graph:
11 Step 1, “Time-based Operations” is the building block for the implementation of the SESAR Concept and is
focused on flight efficiency, predictability and the environment. The goal is a synchronised and predictable European
ATM system, where partners are aware of the business and operational situations and collaborate to optimise the
network. In this first Step, time prioritisation for arrivals at airports is initiated together with wider use of datalink
and the deployment of initial trajectory-based operations through the use of airborne trajectories by the ground
systems and a controlled time of arrival to sequence traffic and manage queues.
Step 2, “Trajectory-based Operations” is focused on flight efficiency, predictability, environment and capacity,
which becomes an important target. The goal is a trajectory-based ATM system where partners optimise “business
and mission trajectories” through common 4D trajectory information and users define priorities in the network.
“Trajectory-based Operations” initiates 4D-based business/mission trajectory management using System Wide
Information Management (SWIM) and air/ground trajectory exchange to enable tactical planning and conflict-free
route segments.
Step 3, “Performance-based Operations” will achieve the high performance required to satisfy the SESAR target
concept. The goal is the implementation of a European high-performance, integrated, network-centric, collaborative
and seamless air/ground ATM system. “Performance-based Operations” is realised through the achievement of
SWIM and collaboratively planned network operations with User Driven Prioritisation Processes (UDPP).

19
It is expected that there will be an ongoing performance contribution from non-R&D
initiatives through the Step 1 and Step 2 developments, e.g. from improvements related
to FABs and Network Management: the intermediate allocation to Step 1 development
has been set at -4%, with the ultimate capability enhancement (Step 3) being -10%.
30% of Step 1 target will be provided through non-R&D improvements (-1,2% out of
-4%) and therefore -2,8% will come from SESAR improvements. Step 2 target is still
under discussion in the range of 4,5% to 6%.
The SESAR concept of operations is defined in the European ATM Master Plan and
translated into SESAR solutions that are developed, validated and demonstrated by the
SESAR Joint Undertaking and then pushed towards deployment through the SESAR
deployment framework established by the Commission.
SESAR Research Projects (environmental focus)
Within the SESAR R&D activities, environmental aspects have mainly been addressed
under two types of projects: Environmental research projects which are considered as
a transversal activity and therefore primarily contribute to the validation of the SESAR
solutions and SESAR demonstration projects, which are pre-implementation activities.
Environment aspects, in particular fuel efficiency, are also a core objective of
approximately 80% of SESAR’s primary projects.
Environmental Research Projects:
Four Environmental research projects are now completed:
Project 16.03.01 dealing with Development of the Environment validation
framework (Models and Tools);
Project 16.03.02 dealing with the Development of environmental metrics;
Project 16.03.03 dealing with the Development of a framework to establish
interdependencies and trade-off with other performance areas;
Project 16.03.07 dealing with Future regulatory scenarios and risks.

20
In the context of Project 16.03.01 the IMPACT tool was developed providing SESAR
primary projects with the means to conduct fuel efficiency, aircraft emissions and noise
assessments at the same time, from a web based platform, using the same aircraft
performance assumptions. IMPACT successfully passed the CAEP MDG V&V
process (Modelling and Database Group Verification and Validation process). Project
16.06.03 has also ensured the continuous development/maintenance of other tools
covering aircraft GHG assessment (AEM), and local air quality issues (Open-ALAQS).
It should be noted that these tools have been developed for covering the research and
the future deployment phase of SESAR.
In the context of Project 16.03.02 a set of metrics for assessing GHG emissions, noise
and airport local air quality has been documented. The metrics identified by Project
16.03.02 and not subject of specific IPRs will be gradually implemented into IMPACT.
Project 16.03.03 has produced a comprehensive analysis on the issues related to
environmental interdependencies and trade-offs.
Project 16.03.07 has conducted a review of current environmental regulatory measures
as applicable to ATM and SESAR deployment, and another report presenting an
analysis of environmental regulatory and physical risk scenarios in the form of user
guidance. It identifies both those Operation Focus Areas (OFA) and Key Performance
Areas which are most affected by these risks and those OFAs which can contribute to
mitigating them. It also provides a gap analysis identifying knowledge gaps or
uncertainties which require further monitoring, research or analysis.
The only Environmental Research project that is still on-going in the current SESAR
project is the SESAR Environment support and coordination project which ensures the
coordination and facilitation of all the Environmental research projects activities while
supporting the SESAR/AIRE/DEMO projects in the application of the material
produced by the research projects. In particular, this project delivered an Environment
Impact Assessment methodology providing guidance on how to conduct an assessment,
which metrics to use and do and don’ts for each type of validation exercise with specific
emphasis on flight trials.
New environmental research projects will be defined in the scope of SESAR 2020 work
programme to meet the SESAR environmental targets in accordance to the ATM
Master Plan.
Other Research Projects which contribute to SESAR's environmental target:
A large number of SESAR research concepts and projects from exploratory research to
preindustrial phase can bring environmental benefits. Full 4D trajectory taking due
account of meteorological conditions, integrated departure, surface and arrival
manager, airport optimised green taxiing trajectories, combined xLS RNAV operations
in particular should bring significant reduction in fuel consumption. Also to be further
investigated the potential for remote control towers to contribute positively to the
aviation environmental footprint.
Remotely Piloted Aircraft (RPAS) systems integration in control airspace will be an
important area of SESAR 2020 work programme and although the safety aspects are
21
considered to be the most challenging ones and will therefore mobilise most of research
effort, the environmental aspects of these new operations operating from and to non-
airport locations would also deserve specific attention in terms of emissions, noise and
potentially visual annoyance.
SESAR demonstration projects:
In addition to its core activities, the SESAR JU co-finances projects where ATM
stakeholders work collaboratively to perform integrated flight trials and demonstrations
validating solutions for the reduction of CO2 emissions for surface, terminal and
oceanic operations to substantially accelerate the pace of change. Since 2009, the SJU
has co-financed a total 33 “green” projects in collaboration with global partners, under
the Atlantic Interoperability Initiative to Reduce Emissions (AIRE), demonstrating
solutions on commercial flights.
A total of 15767 flight trials were conducted under the AIRE initiative involving more
than 100 stakeholders, demonstrating savings ranging from 20 to 1000kg fuel per flight
(or 63 to 3150 kg of CO2), and improvements to day-to-day operations. Other 9
demonstration projects took place from 2012 to 2014 focusing also on environment and
during 2015 and 2016 the SESAR JU is co-financing 15 additional large-scale
demonstrations projects more ambitious in geographic scale and technology. More
information can be found at http://www.sesarju.eu
AIRE – Achieving environmental benefits in real operations
AIRE was designed specifically to improve energy efficiency and lower engine
emissions and aircraft noise in cooperation with the US FAA, using existing
technologies by the European Commission in 2007. SESAR JU has been managing the
programme from an European perspective since 2008. 3 AIRE demonstration
campaigns took place between 2009 and 2014.
A key feature leading to the success of AIRE is that it focused strongly on operational
and procedural techniques rather than new technologies. AIRE trials have almost
entirely used technology which is already in place, but until the relevant AIRE project
came along, air traffic controllers and other users hadn’t necessarily thought deeply
about how to make the best use operationally of that technology. In New York and St
Maria oceanic airspace lateral [separation] optimisation is given for any flight that
requests it because of the AIRE initiative and the specific good cooperation between
NAV Portugal and FAA.
Specific trials have been carried for the following improvement areas/solutions as part
of the AIRE initiative:
a. Use of GDL/DMAN systems (pre departure sequencing system / Departure
Manager) in Amsterdam, Paris and Zurich;
b. Issue of Target-Off Block time (TOBT), calculation of variable taxi out time
and issue of Target-Start-up Arrival Time (TSAT) in Vienna;
c. Continuous Descent Operations (CDOs or CDAs) in Amsterdam, Brussels,
Cologne, Madrid, New York, Paris, Prague, Pointe a Pitre, Toulouse, and
Zurich;
22
d. CDOs in Stockholm, Gothenburg, Riga, La Palma; Budapest and Palma de
Majorca airports using RNP-AR procedures;
e. lateral and vertical flight profile changes in the NAT taking benefit of the
implementation of Automatic Dependent Surveillance-Broadcast (ADS-B)
surveillance in the North Atlantic;
f. Calculation of Estimated Times of Arrival (ETA) allowing time based
operations in Amsterdam;
g. Precision Area Navigation - Global Navigation Satellite System (PRNAV
GNSS) Approaches in Sweden;
h. Free route in Lisbon and Casablanca, over Germany, Belgium, Luxembourg,
Netherlands in the EURO-SAM corridor, France, and Italy;
i. Global information sharing and exchange of actual position and updated
meteorological data between the ATM system and Airline AOCs for the vertical
and lateral optimisation of oceanic flights using a new interface;
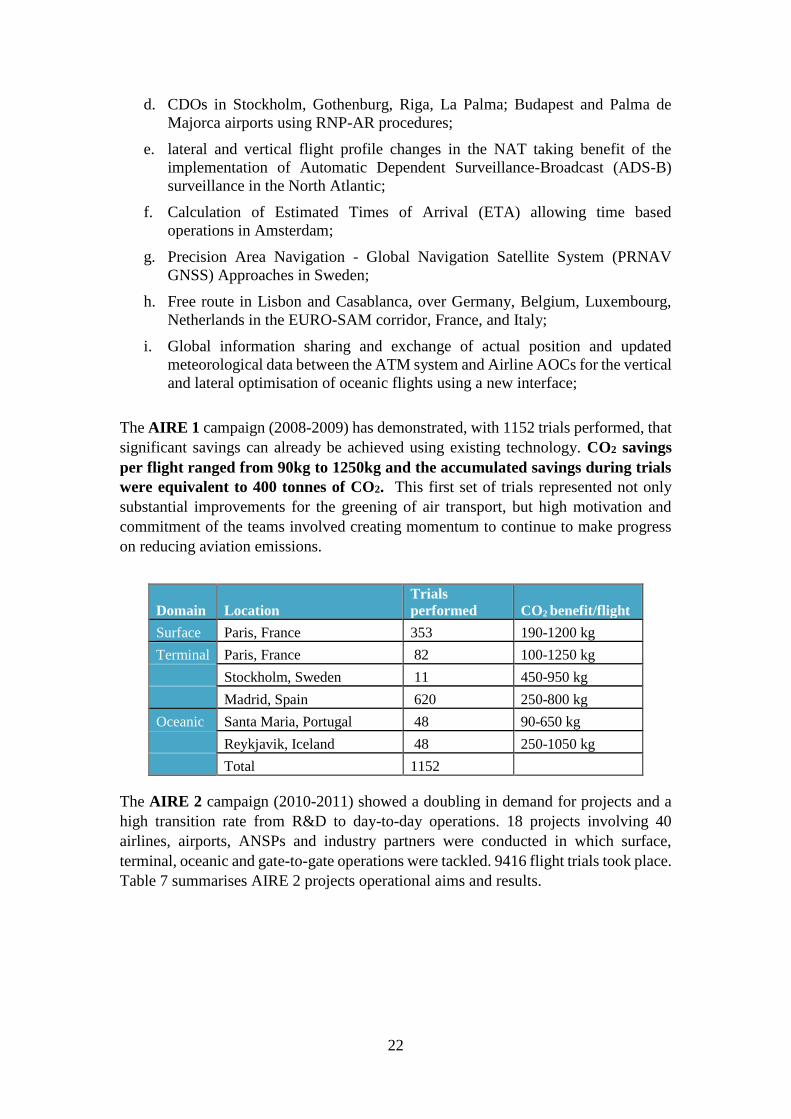
The AIRE 1 campaign (2008-2009) has demonstrated, with 1152 trials performed, that
significant savings can already be achieved using existing technology. CO2 savings
per flight ranged from 90kg to 1250kg and the accumulated savings during trials
were equivalent to 400 tonnes of CO2. This first set of trials represented not only
substantial improvements for the greening of air transport, but high motivation and
commitment of the teams involved creating momentum to continue to make progress
on reducing aviation emissions.
Domain Location
Trials
performed CO2 benefit/flight
Surface Paris, France 353 190-1200 kg
Terminal Paris, France 82 100-1250 kg
Stockholm, Sweden 11 450-950 kg
Madrid, Spain 620 250-800 kg
Oceanic Santa Maria, Portugal 48 90-650 kg
Reykjavik, Iceland 48 250-1050 kg
Total 1152
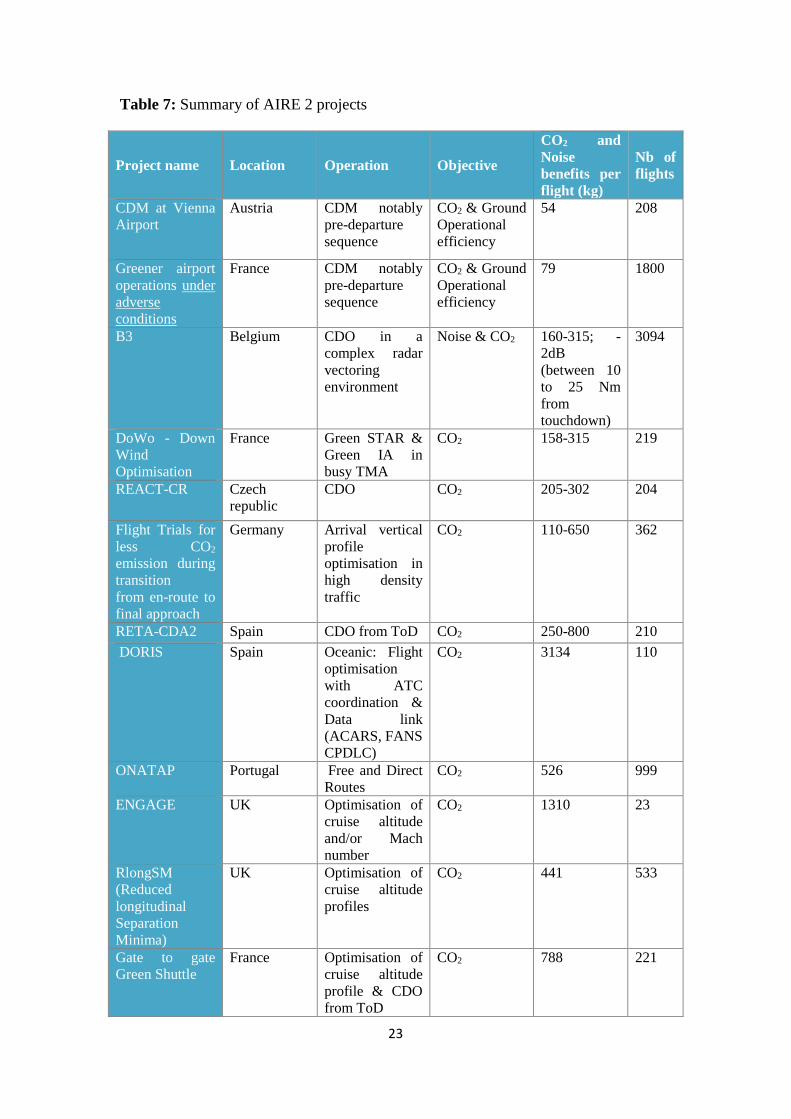
The AIRE 2 campaign (2010-2011) showed a doubling in demand for projects and a
high transition rate from R&D to day-to-day operations. 18 projects involving 40
airlines, airports, ANSPs and industry partners were conducted in which surface,
terminal, oceanic and gate-to-gate operations were tackled. 9416 flight trials took place.
Table 7 summarises AIRE 2 projects operational aims and results.
23
Table 7: Summary of AIRE 2 projects
Project name Location Operation Objective
CO2 and
Noise
benefits per
flight (kg)
Nb of
flights
CDM at Vienna
Airport
Austria CDM notably
pre-departure
sequence
CO2 & Ground
Operational
efficiency
54 208
Greener airport
operations under
adverse
conditions
France CDM notably
pre-departure
sequence
CO2 & Ground
Operational
efficiency
79 1800
B3 Belgium CDO in a
complex radar
vectoring
environment
Noise & CO2 160-315; -
2dB
(between 10
to 25 Nm
from
touchdown)
3094
DoWo - Down
Wind
Optimisation
France Green STAR &
Green IA in
busy TMA
CO2 158-315 219
REACT-CR Czech
republic
CDO CO2 205-302 204
Flight Trials for
less CO2
emission during
transition
from en-route to
final approach
Germany Arrival vertical
profile
optimisation in
high density
traffic
CO2 110-650 362
RETA-CDA2 Spain CDO from ToD CO2 250-800 210
DORIS Spain Oceanic: Flight
optimisation
with ATC
coordination &
Data link
(ACARS, FANS
CPDLC)
CO2 3134 110
ONATAP Portugal Free and Direct
Routes
CO2 526 999
ENGAGE UK Optimisation of
cruise altitude
and/or Mach
number
CO2 1310 23
RlongSM
(Reduced
longitudinal
Separation
Minima)
UK Optimisation of
cruise altitude
profiles
CO2 441 533
Gate to gate
Green Shuttle
France Optimisation of
cruise altitude
profile & CDO
from ToD
CO2 788 221

24
Project name Location Operation Objective
CO2 and
Noise
benefits per
flight (kg)
Nb of
flights
Transatlantic
green flight
PPTP
France Optimisation of
oceanic
trajectory
(vertical and
lateral) &
approach
CO2 2090+1050 93
Greener Wave Switzerland Optimisation of
holding time
through 4D slot
allocation
CO2 504 1700
VINGA Sweden CDO from ToD
with RNP STAR
and RNP AR.
CO2 & noise 70-285;
negligible
change to
noise
contours
189
AIRE Green
Connections
Sweden Optimised
arrivals and
approaches
based on RNP
AR & Data link.
4D trajectory
exercise
CO2 & noise 220 25
Trajectory based
night time
The
Netherlands
CDO with pre-
planning
CO2 + noise TBC 124
A380
Transatlantic
Green Flights
France Optimisation of
taxiing and
cruise altitude
profile
CO2 1200+1900 19
Total 9416
CDOs were demonstrated in busy and complex TMAs although some operational
measures to maintain safety, efficiency and capacity at an acceptable level had to
developed.

25
The AIRE 3 campaign comprised 9 projects (2012-2014) and 5199 trials summarised
in table 3
Project name Location Operation Number of
Trials
Benefits per flight
AMBER Riga International
Airport
turboprop aircraft to
fly tailored Required
Navigation
Performance –
Authorisation
Required (RNP-AR)
approaches together
with Continuous
Descent Operations
(CDO),
124 230 kg reduction in
CO2 emissions per
approach; A
reduction in noise
impact of 0.6
decibels (dBA)
CANARIAS La Palma and
Lanzarote airports
CCDs and CDOs 8 Area Navigation-
Standard Terminal
Arrival Route
(RNAV STAR) and
RNP-AR
approaches
34-38 NM and 292-
313 kg of fuel for La
Palma and 14 NM
and 100 kg of fuel
for Lanzarote saved.
OPTA-IN Palma de Mallorca
Airport
CDOs 101 Potential reduction
of 7-12% in fuel
burn and related
CO2 emissions
REACT plus Budapest Airport CDOs and CCOs 4113 102 kg of fuel
conserved during
each CDO
ENGAGE
Phase II
North Atlantic –
between Canada &
Europe
Optimisation of cruise
altitude and/or Mach
number
210 200-400 litres of
fuel savings;
An average of 1-2%
of fuel conserved
SATISFIED EUR-SAM
Oceanic corridor
Free routing 165 1578 kg in CO2
emissions
SMART Lisbon flight
information region
(FIR), New York
Oceanic and Santa
Maria FIR
Oceanic: Flight
optimisation
250 3134 kg CO2 per
flight
WE-FREE Paris CDG,
Venice, Verona,
Milano Linate,
Pisa, Bologna,
Torino, Genoa
airports
free routing 128 693 Kg of CO2 for
CDG-Roma
Fiumicino ; 504 kg
of CO2 for CDG
Milano Linate
MAGGO* Santa Maria FIR
and TMA
Several enablers 100* *
*The MAGGO project couldn’t be concluded

26
SESAR solutions and Common Projects for deployment
SESAR Solutions are operational and technological improvements that aim to
contribute to the modernisation of the European and global ATM system. These
solutions are systematically validated in real operational environments, which allow
demonstrating clear business benefits for the ATM sector when they are deployed
including the reduction by up to 500 kg of fuel burned per flight by 2035 which
corresponds to up to 1,6 tonnes of CO2 emissions per flight, split across operating
environments.
By end of 2015 twenty-five SESAR Solutions were validated targeting the full range
of ATM operational environments including airports. These solutions are made public
on the SESAR JU website in a datapack form including all necessary technical
documents to allow implementation. One such solution is the integration of pre-
departure management within departure management (DMAN) at Paris Charles de
Gaulle, resulting in a 10% reduction of taxi time, 4 000-tonne fuel savings annually and
a 10% increase of Calculated Take Off Time (CTOT) adherence and the
Implementation. Another solution is Time Based Separation at London Heathrow,
allowing up to five more aircraft per hour to land in strong wind conditions and thus
reduces holding times by up to 10 minutes, and fuel consumption by 10% per flight.
By the end of SESAR1 fifty-seven solutions will be produced.
The deployment of the SESAR solutions which are expected to bring the most benefits,
sufficiently mature and which require a synchronised deployment is mandated by the
Commission through legally binding instruments called Common Projects.
The first Common Projects identify six ATM functionalities, namely Extended Arrival
Management and Performance Based Navigation in the High Density Terminal
Manoeuvring Areas; Airport Integration and Throughput; Flexible Airspace
Management and Free Route; Network Collaborative Management; Initial System
Wide Information Management; and Initial Trajectory Information Sharing. The
deployment of those six ATM functionalities should be made mandatory.
The Extended Arrival Management and Performance Based Navigation in
the High Density Terminal Manoeuvring Areas functionality is expected to
improve the precision of approach trajectory as well as facilitate traffic
sequencing at an earlier stage, thus allowing reducing fuel consumption
and environmental impact in descent/arrival phases.
The Airport Integration and Throughput functionality is expected to
improve runway safety and throughput, ensuring benefits in terms of fuel
consumption and delay reduction as well as airport capacity.
The Flexible Airspace Management and Free Route functionality is
expected to enable a more efficient use of airspace, thus providing
significant benefits linked to fuel consumption and delay reduction.
The Network Collaborative Management functionality is expected to
improve the quality and the timeliness of the network information shared
by all ATM stakeholders, thus ensuring significant benefits in terms of Air
Navigation Services productivity gains and delay cost savings.

27
The Initial System Wide Information Management functionality, consisting
of a set of services that are delivered and consumed through an internet
protocol-based network by System Wide Information Management
(SWIM) enabled systems, is expected to bring significant benefits in terms
of ANS productivity.
The Initial Trajectory Information Sharing functionality with enhanced
flight data processing performances is expected to improve predictability
of aircraft trajectory for the benefit of airspace users, the network manager
and ANS providers, implying less tactical interventions and improved de-
confliction situation. This is expected to have a positive impact on ANS
productivity, fuel saving and delay variability.
SESAR 2020 programme
SESAR next programme (SESAR 2020) includes in addition to exploratory and
industrial research, very large scale demonstrations which should include more
environmental flight demonstrations and goes one step further demonstrating the
environmental benefits of the new SESAR solutions.

28
The EU Emissions Trading System
The EU Emissions Trading System (EU ETS) is the cornerstone of the European
Union's policy to tackle climate change, and a key tool for reducing greenhouse gas
emissions cost-effectively, including from the aviation sector. It operates in 31
countries: the 28 EU Member States, Iceland, Liechtenstein and Norway. The EU ETS
is the first and so far the biggest international system capping greenhouse gas
emissions; it currently covers half of the EU's CO2 emissions, encompassing those from
around 12 000 power stations and industrial plants in 31 countries, and, under its current
scope, around 640 commercial and non-commercial aircraft operators that have flown
between airports in the European Economic Area (EEA).
The EU ETS began operation in 2005; a series of important changes to the way it works
took effect in 2013, strengthening the system. The EU ETS works on the "cap and trade"
principle. This means there is a "cap", or limit, on the total amount of certain
greenhouse gases that can be emitted by the factories, power plants, other installations
and aircraft operators in the system. Within this cap, companies can sell to or buy
emission allowances from one another. The limit on allowances available provides
certainty that the environmental objective is achieved and gives allowances a market
value.
By the 30th April each year, companies, including aircraft operators, have to surrender
allowances to cover their emissions from the previous calendar year. If a company
reduces its emissions, it can keep the spare allowances to cover its future needs or sell
them to another company that is short of allowances. The flexibility that trading brings
ensures that emissions are cut where it costs least to do so. The number of allowances
reduces over time so that total emissions fall.
ECONOMIC/MARKET-BASED MEASURES
29
As regards aviation, legislation to include aviation in the EU ETS was adopted in 2008
by the European Parliament and the Council.12 The 2006 proposal to include aviation
in the EU ETS was accompanied by detailed impact assessment.13 After careful analysis
of the different options, it was concluded that this was the most cost-efficient and
environmentally effective option for addressing aviation emissions.
In October 2013, the Assembly of the International Civil Aviation Organization (ICAO)
decided to develop a global market-based mechanism (MBM) for international aviation
emissions. The global MBM design is to be decided at the next ICAO Assembly in
2016, including the mechanisms for the implementation of the scheme from 2020. In
order to sustain momentum towards the establishment of the global MBM, the
European Parliament and Council have decided to temporarily limit the scope of the
aviation activities covered by the EU ETS, to intra-European flights.14 The temporary
limitation applies for 2013-2016, following on from the April 2013 'stop the clock'
Decision15 adopted to promote progress on global action at the 2013 ICAO Assembly.
The legislation requires the European Commission to report to the European Parliament
and Council regularly on the progress of ICAO discussions as well as of its efforts to
promote the international acceptance of market-based mechanisms among third
countries. Following the 2016 ICAO Assembly, the Commission shall report to the
European Parliament and to the Council on actions to implement an international
agreement on a global market-based measure from 2020, that will reduce greenhouse
gas emissions from aviation in a non-discriminatory manner. In its report, the
Commission shall consider, and, if appropriate, include proposals on the appropriate
scope for coverage of aviation within the EU ETS from 2017 onwards.
Between 2013 and 2016, the EU ETS only covers emissions from flights between
airports which are both in the EEA. Some flight routes within the EEA are also
exempted, notably flights involving outermost regions.
The complete, consistent, transparent and accurate monitoring, reporting and
verification of greenhouse gas emissions remain fundamental for the effective
operation of the EU ETS. Aviation operators, verifiers and competent authorities have
already gained experience with monitoring and reporting during the first aviation
trading period; detailed rules are prescribed by Regulations (EU) N°600/201216 and
601/2012.17
12 Directive 2008/101/EC of the European Parliament and of the Council of 19 November 2008 amending Directive
2003/87/EC so as to include aviation activities in the scheme for greenhouse gas emission allowance trading within
the Community, http://eur-lex.europa.eu/legal-content/EN/TXT/?uri=CELEX:32008L0101 13 http://ec.europa.eu/clima/policies/transport/aviation/documentation_en.htm 14 Regulation (EU) No 421/2014 of the European Parliament and of the Council of 16 April 2014 amending Directive
2003/87/EC establishing a scheme for greenhouse gas emission allowance trading within the Community, in view
of the implementation by 2020 of an international agreement applying a single global market-based measure to
international aviation emissions http://eur-lex.europa.eu/legal-content/EN/ALL/?uri=CELEX:32014R0421 15 Decision No. 377/2013/EU derogating temporarily from Directive 2003/87/EC establishing a scheme for
greenhouse gas emission allowance trading within the Community, http://eur-
lex.europa.eu/LexUriServ/LexUriServ.do?uri=CELEX:32013D0377:EN:NOT 16 Commission Regulation (EU) No 600/2012 of 21 June 2012 on the verification of greenhouse gas emission reports
and tonne-kilometre reports and the accreditation of verifiers pursuant to Directive 2003/87/EC of the European
Parliament and of the Council, http://eur-lex.europa.eu/legal-
content/EN/TXT/PDF/?uri=CELEX:32012R0600&from=EN 17 Regulation (EU) No 601/2012 of the European Parliament and of the Council of 21 June 2012 on the monitoring
and reporting of greenhouse gas emissions pursuant to Directive 2003/87/EC of the European Parliament and of the
Council, http://eur-lex.europa.eu/legal-content/EN/ALL/?uri=CELEX:32012R0601
30
The EU legislation establishes exemptions and simplifications to avoid excessive
administrative burden for the smallest aircraft operators. Since the EU ETS for aviation
took effect in 2012 a de minimis exemption for commercial operators – with either
fewer than 243 flights per period for three consecutive four-month periods or flights
with total annual emissions lower than 10 000 tonnes CO2 per year –applies, which
means that many aircraft operators from developing countries are exempted from the
EU ETS. Indeed, over 90 States have no commercial aircraft operators included in the
scope of the EU ETS. From 2013 also flights by non-commercial aircraft operators
with total annual emissions lower than 1 000 tonnes CO2 per year are excluded from
the EU ETS up to 2020. A further administrative simplification applies to small aircraft
operators emitting less than 25 000 tonnes of CO2 per year, who can choose to use the
small emitter`s tool rather than independent verification of their emissions. In addition,
small emitter aircraft operators can use the simplified reporting procedures under the
existing legislation.
The EU legislation foresees that, where a third country takes measures to reduce the
climate change impact of flights departing from its airports, the EU will consider
options available in order to provide for optimal interaction between the EU scheme
and that country’s measures. In such a case, flights arriving from the third country could
be excluded from the scope of the EU ETS. The EU therefore encourages other
countries to adopt measures of their own and is ready to engage in bilateral discussions
with any country that has done so. The legislation also makes it clear that if there is
agreement on global measures, the EU shall consider whether amendments to the EU
legislation regarding aviation under the EU ETS are necessary.
Impact on fuel consumption and/or CO2 emissions
The environmental outcome of an emissions trading system is determined by the
emissions cap. Aircraft operators are able to use allowances from outside the aviation
sector to cover their emissions. The absolute level of CO2 emissions from the aviation
sector itself can exceed the number of allowances allocated to it, as the increase is offset
by CO2 emissions reductions in other sectors of the economy covered by the EU ETS.
Over 2013-16, with the inclusion of only intra-European flights in the EU ETS, the total
amount of annual allowances to be issued will be around 39 million. Verified CO2
emissions from aviation activities carried out between aerodromes located in the EEA
amounted to 56,9 million tonnes of CO2 in 2015. This means that the EU ETS will
contribute to achieve more than 17 million tonnes of emission reductions annually, or
around 68 million over 2013-2016, partly within the sector (airlines reduce their
emissions to avoid paying for additional units) or in other sectors (airlines purchase
units from other ETS sectors, which would have to reduce their emissions consistently).
While some reductions are likely to be within the aviation sector, encouraged by the
EU ETS's economic incentive for limiting emissions or use of aviation biofuels,18 the
majority of reductions are expected to occur in other sectors.
18 The actual amount of CO2 emissions savings from biofuels reported under the EU ETS from 2012 to 2014 was 2
tonnes

31
Putting a price on greenhouse gas emissions is important to harness market forces and
achieve cost-effective emission reductions. In parallel to providing a carbon price
which incentivises emission reductions, the EU ETS also supports the reduction of
greenhouse gas emissions through €2,1 billion funding for the deployment of
innovative renewables and carbon capture and storage. This funding has been raised
from the sale of 300 million emission allowances from the New Entrants' Reserve of
the third phase of the EU ETS. This includes over €900 million for supporting
bioenergy projects, including advanced biofuels.19
In addition, through Member States' use of EU ETS auction revenue in 2013, over €3
billion has been reported by them as being used to address climate change.20 The
purposes for which revenues from allowances should be used encompass mitigation of
greenhouse gas emissions and adaptation to the inevitable impacts of climate change in
the EU and third countries, to reduce emissions through low-emission transport, to fund
research and development, including in particular in the fields of aeronautics and air
transport, to fund contributions to the Global Energy Efficiency and Renewable Energy
Fund, and measures to avoid deforestation.
In terms of contribution towards the ICAO global goals, the States implementing the
EU ETS will together deliver, in “net” terms, a reduction of at least 5% below 2005
levels of aviation CO2 emissions for the scope that is covered. Other emissions
reduction measures taken, either at supra-national level in Europe or by any of the 31
individual states implementing the EU ETS, will also contribute towards the ICAO
global goals. Such measures are likely to moderate the anticipated growth in aviation
emissions.
Estimated emissions reductions resulting from the EU ETS
Year Reduction in CO2 emissions
2013-2016 65 million tonnes
The table presents projected benefits of the EU ETS based on the current scope (intra-
European flights).
19 For further information, see http://ec.europa.eu/clima/policies/lowcarbon/ner300/index_en.htm 20 For further information, see http://ec.europa.eu/clima/news/articles/news_2014102801_en.htm

32
EU INITIATIVES IN THIRD COUNTRIES
Multilateral Projects
At the end of 2013 the European Commission launched a project of a total budget of
€6,5 million under the name "Capacity building for CO2 mitigation from international
aviation". The 42-month project, implemented by the ICAO, boosts less developed
countries’ ability to track, manage and reduce their aviation emissions. In line with the
call from the 2013 ICAO Assembly, beneficiary countries will submit meaningful State
action plans for reducing aviation emissions, and also receive assistance for establishing
emissions inventories and piloting new ways of reducing fuel consumption. Through
the wide range of activities in these countries, the project contributes to international,
regional and national efforts to address growing emissions from international aviation.
The beneficiary countries are the following:
Africa: Burkina Faso, Kenya and Economic Community of Central African States
(ECCAS) Member States: Angola, Burundi, Cameroon, Central African Republic,
Chad, Republic of Congo, Democratic Republic of Congo, Equatorial Guinea, Gabon,
Sao Tome and Principe.
Caribbean: Dominican Republic and Trinidad and Tobago.
33
SUPPORT TO VOLUNTARY ACTIONS
ACI Airport Carbon Accreditation
Airport Carbon Accreditation is a certification programme for carbon management at
airports, based on carbon mapping and management standard specifically designed for
the airport industry. It was launched in 2009 by ACI EUROPE, the trade association
for European airports.
The underlying aim of the programme is to encourage and enable airports to implement
best practice carbon and energy management processes and to gain public recognition
of their achievements. It requires airports to measure their CO2 emissions in accordance
with the World Resources Institute and World Business Council for Sustainable
Development GHG Protocol and to get their emissions inventory assured by an
independent third party.
This industry-driven initiative was officially endorsed by EUROCONTROL and the
European Civil Aviation Conference (ECAC). It is also officially supported by the
United Nations Environmental Programme (UNEP). The programme is overseen by an
independent Advisory Board.
In 2014 the programme reached global status with the extension of the programme to
the ACI North American and Latin American & Caribbean regions, participation has
increased to 125 airports, in over 40 countries across the world – an increase of 23%
from the previous year, growing from 17 airports in Year 1 (2009-2010). These airports
welcome 1,7 billion passengers a year, or 27,5% of the global air passenger traffic.

34
Airport Carbon Accreditation is a four-step programme, from carbon mapping to
carbon neutrality. The four steps of certification are: Level 1 “Mapping”, Level 2
“Reduction”, Level 3 “Optimisation”, and Level 3+ “Carbon Neutrality”.
Levels of certification (ACA Annual Report 2014-2015)
One of its essential requirements is the verification by external and independent
auditors of the data provided by airports. Aggregated data are included in the Airport
Carbon Accreditation Annual Report thus ensuring transparent and accurate carbon
reporting. At level 2 of the programme and above (Reduction, Optimisation and Carbon
Neutrality), airport operators are required to demonstrate CO2 reduction associated with
the activities they control.
In Europe, participation in the programme has increased from 17 airports to 92 in 2015,
an increase of 75 airports or 441% since May 2010. 92 airports mapped their carbon
footprints, 71 of them actively reduced their CO2 emissions, 36 reduced their CO2
emissions and engaged others to do so, and 20 became carbon neutral. European
airports participating in the programme now represent 63,9% of European air passenger
traffic.
Anticipated benefits:
The Administrator of the programme has been collecting CO2 data from participating
airports over the past five years. This has allowed the absolute CO2 reduction from the
participation in the programme to be quantified.

35
Emissions reduction highlights
2009-
2010
2010-
2011
2011-
2012
2012-
2013
2013-
2014
2014-
2015
Total aggregate
scope 1 & 2
reduction (tCO2)
51 657 54 565 48 676 140 009 129 937 168 779
Total aggregate
scope 3
reduction (tCO2)
359 733 675 124 365 528 30 155 223 905 550 884
Emissions performance summary
Variable 2013 -2014 2014-2015
Emissions Number of
airports
Emissions Number of
airports
Aggregate carbon footprint for
‘year 0’21 for emissions under
airports’ direct control (all
airports)
22 044 683
tonnes CO2
85
2 089 358
tonnes CO2
92
Carbon footprint per
passenger
2,01
kg CO2
1,89
kg CO2
Aggregate reduction in
emissions from sources under
airports’ direct control (Level
2 and above)22
87 449
tonnes CO2
56 139 022
tonnes CO2
71
Carbon footprint reduction per
passenger
0,11
kg CO2
0,15
kg CO2
Total carbon footprint for
‘year 0’ for emissions sources
which an airport may guide or
influence (level 3 and above)23
12 777 994
tonnes CO2
31 14 037 537
tonnes CO2
36
Aggregate reductions from
emissions sources which an
airport may guide or influence
223 905
tonnes CO2
550 884
tonnes CO2
Total emissions offset (Level
3+)
181 496
tonnes CO2
16 294 385
tonnes CO2
20
Its main immediate environmental co-benefit is the improvement of local air quality.
Costs for design, development and implementation of Airport Carbon Accreditation
have been borne by ACI EUROPE. Airport Carbon Accreditation is a non-for-profit
initiative, with participation fees set at a level aimed at allowing for the recovery of the
aforementioned costs.
21 ‘Year 0’ refers to the 12 month period for which an individual airport’s carbon footprint refers to, which according
to the Airport Carbon Accreditation requirements must have been within 12 months of the application date. 22 This figure includes increases in emissions at airports that have used a relative emissions benchmark in order to
demonstrate a reduction. 23 These emissions sources are those detailed in the guidance document, plus any other sources that an airport
may wish to include.

36
The scope of Airport Carbon Accreditation, i.e. emissions that an airport operator can
control, guide and influence, implies that aircraft emissions in the LTO cycle are also
covered. Thus, airlines can benefit from the gains made by more efficient airport
operations to see a decrease in their emissions during the LTO cycle. This is coherent
with the objectives pursued with the inclusion of aviation in the EU ETS as of 1 January
2012 (Directive 2008/101/EC) and can support the efforts of airlines to reduce these
emissions.

37
Section II – National actions in Iceland
Aircraft-related Technology Development
The primary focus for Iceland in relation to aircraft-related technology development is
to maintain a modern fleet. Recent years have seen an increase in registrations of new
aircraft and a number of technological improvements designed to reduce emissions are
utilised.
Air Atlanta
Air Atlanta has achieved measurable efficiency in fuel consumption and CO2 emission
reduction due to renewal of aircrafts in recent years, or by 20%. Equipment on board
has also been updated and used to help to achieve efficiency as P-RNAV, ADS-B and
ACARS to obtain information for use in various ground systems like Fuel-monitoring,
APM-monitoring and EU ETS system.
Air Iceland Connect
Air Iceland Connect replaced its air fleet in 2016 from Fokker 50 to Bombardier Q200
and Q400 aircrafts. Bombardier has more seats than the previous Fokker 50 aircrafts,
which resulted in more efficient flights between the main domestic airports in Iceland
and considerable less fuel consumption per passenger, which reduces Greenhouse gas
emissions (GHG).
Icelandair
Icelandair constantly pursues new ways to improve fuel burn and reduce noise in its
operations. Environmental and fuel reduction projects, such as winglet improvements
on the entire fleet and investments in engine core wash equipment, are examples of
successful environmental initiatives. Procedures such as Continuous Descent Approach
(CDA), targeted center of gravity loading and single engine taxiing, are all contributing
to reduction of GHG emissions and noise levels.
The recent Boeing 737 additions to the fleet will reduce fuel consumption by 20% per
seat when compared to the older aircraft.
Additionally, Icelandair utilizes a software solution to further minimize the GHG
footprint of all flights. The fuel efficiency software provides a platform for both
strategic and tactical improvements in flight operations with fuel efficiency and GHG
reduction in mind.
Improved Air Traffic Management and Infrastructure Use
Iceland is a member of the Borealis alliance, which is “currently working on a major
programme to deliver free route airspace across the whole of Northern Europe by
2020.” The program will serve to “create free route airspace extending from the eastern
boundary of the North Atlantic to the western boundary of Russian airspace in the North
of Europe,” and the benefits in terms of fuel efficiency, environmental performance and
cost savings will be “significant.”
Iceland is a part of the Single European Sky (SES) and ISAVIA, Icelandair and Tern
Systems have participated in SESAR projects.

38
Economic/Market-based Measures
Iceland has participated in the EU- ETS since 2008, but the EU ETS Directive
2003/87/EC was incorporated into the EEA Agreement in 2007. Aviation was
incorporated into the EU ETS on [1 January] 2012, with Directive 2008/101/EC. Since
then, all aircraft operators that are under the scope of the trading system must obtain
allowances for emissions of CO2.” In 2017, five aircraft operators, all of them
Icelandic fell under the revised scope of the EU ETS, and surrendered emissions equal
to 813.745 tonnes of CO2.
Iceland is party to the EU ETS through the European Economic Area membership, and
over 40% of Iceland‘s emissions fall under the trading scheme.
Additionally, Iceland declared its determination to participate in the CORSIA scheme
from the pilot phase onwards with the endorsement of the Bratislava Declaration.
Conclusion
This action plan was finalised on 30 June 2018 and shall be considered as subject to
update after this date.