Embed Size (px)
Citation preview

Report on
Starch Hydrolysis
Submitted to
Dr. Karen J. Haman
Senior Lecturer
Iowa State University
Ames, Iowa
November 2, 2017
By
Group 4 - Mackenzie Garlock, Carolyn Jennrich, Aimee Pierce, Ria Warrier
Iowa State University
The purpose of the Starch Hydrolysis report was to research methods for the optimization of
glucose production via the enzyme hydrolysis of starch. This reaction is significant for biofuels
research, since starch hydrolysis produces glucose, which is fermented to produce ethanol.
Researchers manipulated reactor temperature, enzyme concentration, and substrate
concentration, to draw conclusions about the optimization of starch hydrolysis. Spirizyme Fuel
and Liquozyme SC DS were both tested as enzymes, with maltose serving as the substrate. It
was concluded that Spirizyme produced a higher glucose conversion, with higher initial
velocities than Liquozyme. Therefore, it is recommended that Spirizyme be used for a full-
plant scale-up in a pre-heated reactor at 75ºC (pretreatment) with a reactor temp of 65ºC, pH of
4.63, and an operating range of 0.0033-0.0066 g/L of Spirizyme per 20 g/L of substrate.

Group 4
November 1, 2017
ii
Executive Summary
This report entails the methods used to optimize the production of glucose via enzyme hydrolysis
of starch. Glucose production optimization applies to the ethanol sector – maximizing starch
conversion to sugars would improve yields, since the sugars are a raw material for ethanol
production. To explore this process, researchers tested two different enzymes – Spirizyme Fuel
and Liquozyme SC DS – varying enzyme concentration and the concentration of the maltose
substrate, as well as the reactor temperature. The optimum reaction would have the highest
conversion in the smallest amount of time with large operating ranges for temperature and pH.
With these manipulated variables, researchers hypothesized that as the concentration of the
enzyme increased, the maximum velocity of the system would increase. It was hypothesized that
Liquozyme SC DS will have a higher yield of glucose because it is an alpha-amylase. Alpha-
amylases break the alpha 1-4 bond which is present in the maltose substrate used. Researchers
also hypothesized that Spirizyme Fuel would produce higher initial velocities because it was
designed to operate in the saccharification step of the hydrolysis reaction.
Spirizyme produced higher glucose conversions than Liquozyme, with higher initial velocities. It
was found to perform best when pre-heating the reactor at 75ºC, with a reactor temp of 65ºC at a
pH of 4.63. The optimum operating range for Spirizyme was found to be 0.1-0.2 g per 20 g/L of
substrate. Therefore, we recommend the use of Spirizyme over Liquozyme, with the
implementation of a reactor pre-heating step at a substrate concentration range of 0.0033-0.0066
g/L Spirizyme (0.1-0.2 g Spirizyme in 30mL buffer solution) per 20 g/L substrate.
Limitations of the Starch Hydrolysis report include a limited number of enzymes used, and no
variance of solute pH. Since Spirizyme Fuel and Liquozyme SC DS were the only enzymes
tested, the only conclusions that can be drawn are between those two materials. The solute pH
was also held constant; further study varying the reaction pH will provide more insight into the
enzymatic hydrolysis of starch.

Group 4
November 1, 2017
iii
Table of Contents
Executive Summary ...................................................................................................................................... ii
List of Figures and Tables ............................................................................................................................ iv
Figures ..................................................................................................................................................... iv
Tables ....................................................................................................................................................... iv
Introduction ................................................................................................................................................... 1
Theory ........................................................................................................................................................... 1
Materials and Methods .................................................................................................................................. 3
Apparatus .................................................................................................................................................. 3
Methods .................................................................................................................................................... 4
Varying Substrate Concentration .......................................................................................................... 4
Varying Enzyme Concentration ............................................................................................................ 5
Results ........................................................................................................................................................... 5
Varying Substrate Concentration .............................................................................................................. 6
Initial Velocity versus Enzyme Concentration ......................................................................................... 9
Control Test versus Data ......................................................................................................................... 12
Discussion ................................................................................................................................................... 15
Criteria for the Optimum Enzyme and Operating Range........................................................................ 15
Implications of Varying Substrate Concentration ................................................................................... 15
Implications of Varying Enzyme Concentration .................................................................................... 16
Implications from the Control Test ......................................................................................................... 17
Optimum Enzyme and Operating Range ................................................................................................ 17
Sources of Error ...................................................................................................................................... 18
Conclusions ................................................................................................................................................. 18
Recommendations ....................................................................................................................................... 19
References ................................................................................................................................................... 20
Appendix ..................................................................................................................................................... 21
Sample Calculations ................................................................................................................................ 21
Group 4
November 1, 2017
iv
List of Figures and Tables
Figures
Figure 1: Global ethanol production since 1980 [4] .................................................................................... 1
Figure 2: Starch hydrolysis experiment ....................................................................................................... 4
Figure 3: Glucose concentration versus time used to determine the initial velocity (Spirizyme, Trial 7) ... 6
Figure 4: Glucose concentration versus time used to determine the initial velocity (Liquozyme, Trial 7). 7
Figure 5: Changed axis for comparison of Liquozyme, Trial 7. .................................................................. 7
Figure 6: Michaelis-Menten plot for Spirizyme comparing with and without pretreatment. ...................... 8
Figure 7: Michaelis-Menten plot for Liquozyme comparing with and without pretreatment. .................... 9
Figure 8: Michaelis-Menten plot comparing the Spirizyme and Liquozyme results. .................................. 9
Figure 9: Glucose concentration versus time used to determine the initial velocity (Varying Spirizyme,
Trial 1). ....................................................................................................................................................... 10
Figure 10: Glucose concentration versus time used to determine the initial velocity (Varying Liquozyme,
Trial 1). ....................................................................................................................................................... 11
Figure 11: Changed axis for comparison of Varying Liquozyme, Trial 1. ................................................ 11
Figure 12: Initial velocity versus enzyme concentration plot comparing the Spirizyme and Liquozyme. 12
Figure 13: Glucose concentration versus time without enzyme present. ................................................... 13
Figure 14: Control predictions compared to actual results for Spirizyme. ................................................ 13
Figure 15: Control predictions compared to actual results for Liquozyme. .............................................. 14
Tables
Table 1: Summary of enzyme properties. .................................................................................................... 3
Table 2 - Concentrations of substrate and times at which reading was taken .............................................. 4
Table 3 - Concentrations of enzyme and times at which reading was taken ................................................ 5
Table 4 - Average difference between control predictions and actual results. ........................................... 14
Group 4
November 1, 2017
1
Introduction
The purpose of the Starch Hydrolysis report was to explore research methods for the
optimization of glucose production via the enzyme hydrolysis of starch. The breakdown of
complex carbohydrates into simple sugars is a practical and important process to research, since
those sugars can be metabolized to produce ethanol – a leading industry biofuel. The
optimization of starch hydrolysis is particularly important to the USA and Iowa, being the
world’s largest corn producer, and therefore, ethanol producer [1]. Ethanol production from corn
hinges on the saccharification of complex carbohydrates like starch, which is the reaction that
this report attempts to optimize.
Ethanol has been used as fuel since 1826, but was not incorporated into mainstream use in the
United States until 2005 with the first Renewable Fuels Standard (RFS). The RFS established
ethanol production to decrease dependence on imported oil and increase the use of
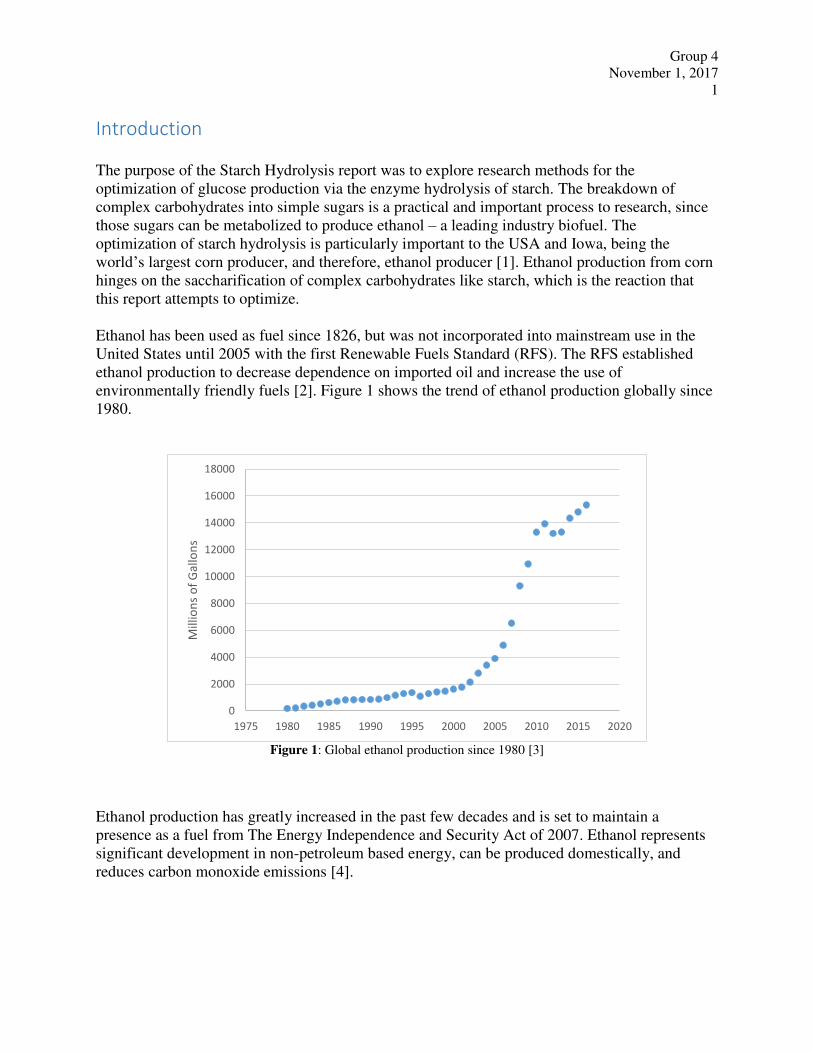
environmentally friendly fuels [2]. Figure 1 shows the trend of ethanol production globally since
1980.
Figure 1: Global ethanol production since 1980 [3]
Ethanol production has greatly increased in the past few decades and is set to maintain a
presence as a fuel from The Energy Independence and Security Act of 2007. Ethanol represents
significant development in non-petroleum based energy, can be produced domestically, and
reduces carbon monoxide emissions [4].
0
2000
4000
6000
8000
10000
12000
14000
16000
18000
1975 1980 1985 1990 1995 2000 2005 2010 2015 2020
Mil
lio
ns
of
Ga
llo
ns
Group 4
November 1, 2017
2
Theory
The processing of starch to make glucose goes through three stages. The first stage is
gelatinization. Gelatinization involves the starch granules forming a viscous suspension or a
slurry. This stage is achieved by heating starch with water. This process can be thought of as
cooking the starch. The next step in starch treatment is the liquefaction step. This involves the
partial hydrolysis of the starch. There will be a decrease in viscosity in this step. This step is
aided by the use of enzymes. The final step is saccharification which also produces glucose,
assisted by enzymes [5].
Liquefaction converts the large starch molecules to dextrins. Dextrin is a step between a complex
starch molecule and a simple sugar. The conversion of starch to dextrin is responsible for the loss
of viscosity in the starch slurry [6]. Saccharification then breaks the dextrin down further into
simple sugars [7].
Maltose is a compound made from the hydrolysis of glycogen and starch. It can be found in
germinating grains such as corn. Maltose consists of two molecules of glucose connected by an
alpha 1,4 – glycosidic bond. Maltose can be treated with an enzyme to form glucose [8] .
Enzymes are considered to be biological catalysts. These enzymes are responsible for breaking
down starch into glucose. Different enzymes act in different ways. Two enzymes that are
commonly used for glucose production are Liquozyme SC DS and Spirizyme Fuel Fuel.
Liquozyme is active in the liquefaction stage of the process. Where Spirizyme is active in the
saccharification step [6]. Spirizyme hydrolyzes alpha 1,4 – and alpha 1,6 – linkages. Liquozyme
is an alpha-amylase, which means that this enzyme attacks the alpha 1,4 – linkages of the
dextrin.
When an enzyme is added to a substrate a reaction occurs. The enzyme and the substrate form a
complex and then this reacts irreversibly to form a product and reproduce a free enzyme. The
reaction that takes place between an enzyme and a substrate is represented by Equation 1 shown
below.
𝐸 + 𝑆 ↔ 𝐸𝑆 → 𝐸 + 𝑃 (1)
Where E is the enzyme
S is the substrate
ES is substrate enzyme complex
P is the product
This equation can be further modeled by the Michaelis-Menten equation. The Michaelis-Menten
equation describes the reaction velocity as a function of the substrate concentration. Below in
Equation 2 is the Michaelis-Menten equation.
Group 4
November 1, 2017
3
𝑣 = 𝑉𝑚𝑎𝑥[𝑆]𝐾𝑀 + [𝑆] (2)
Where v is reaction velocity
Vmax is the maximum reaction velocity
[S] is the substrate concentration
KM is the Michaelis-Menten constant
Using this equation, a Michaelis-Menten plot can be created. The maximum velocity is the value
at which the graph levels off. The Michaelis-Menten constant is half of the maximum velocity.
The Michaelis-Menten plot shows, in general, how fast the reaction proceeds with different
concentrations of substrate [9]. See the sample calculations section for further explanation on
analyzing a Michaelis-Menten plot.
Notice that the enzyme concentration is not taken into account directly in this equation. This is
because varying the enzyme concentration will change how fast the reaction proceeds. How fast
the reaction proceeds is directly proportional to the amount of enzyme that is added to the
reaction. So even without directly taking it into account, it will change the Michaelis-Menten
plot showing the effect of different enzyme concentrations.
Materials and Methods
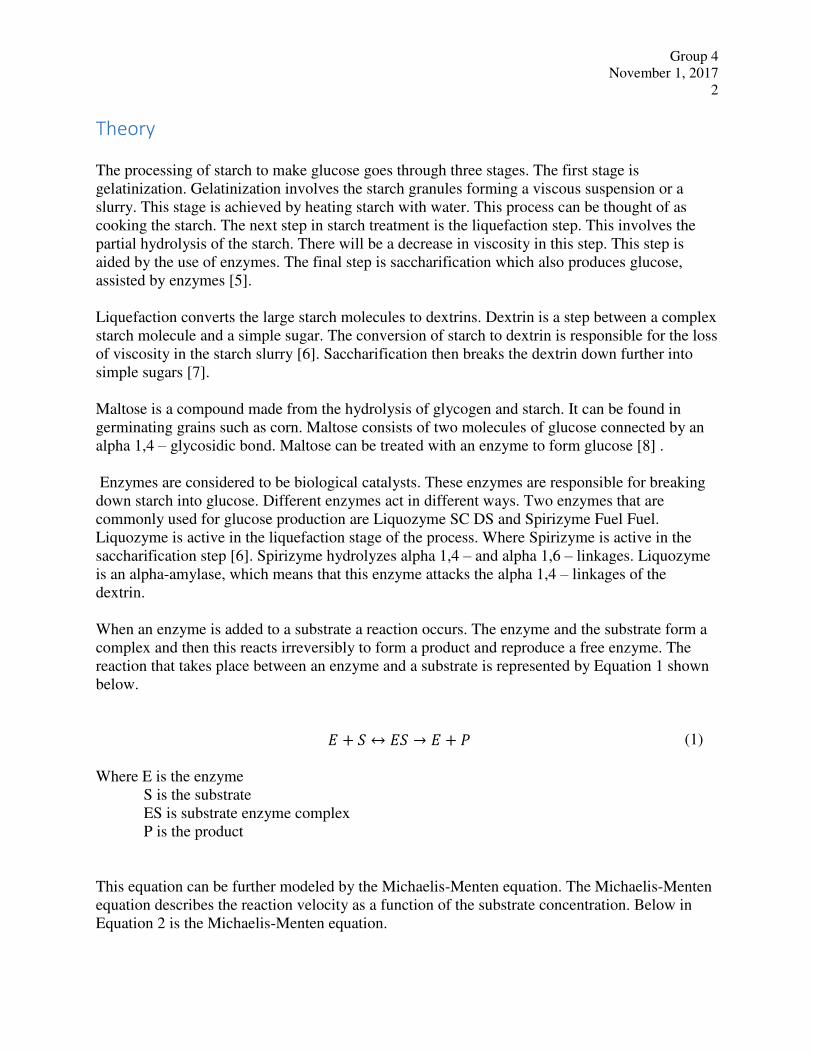
The goal of this experiment was to determine which of the two enzymes, Spirizyme Fuel or
Liquozyme, worked better to produce glucose from a maltose-acid buffer solution. Table 1
contains a brief summary of the properties of Spirizyme Fuel and Liquozyme.
Table 1: Summary of enzyme properties.
Property Spirizyme Fuel Liquozyme
pH Range 3.5 to 5.5 [6] 5 to 6 [6]
Temperature Range 65°C to 75°C [10] No Data
Density 1.15 g/mL [11] 1.262 g/mL [12]
Bond Broken α 1,4 and α 1,6 [13] α 1,4 [7]
These enzymes and maltose were used to carry out the experiment on starch hydrolysis. The
results of the experiment were found using the YSI 2700 glucose analyzer.

Group 4
November 1, 2017
4
Apparatus
The starch hydrolysis experiment uses the chemicals Spirizyme Fuel, Liquozyme, maltose,
water, a buffer solution controlling the pH of the solution (containing acetic acid and sodium
acetate), and a 2.3M Tris solution. A water bath is useful in conducting starch hydrolysis; it
keeps the temperature of reaction constant. Erlenmeyer flasks act as individual reaction vessels.
The YSI 2700 glucose analyzer determines the amount of glucose produced in the reaction, and a
YSI 2710 turntable holds the test tubes for the glucose analyzer, which determined the amount of
glucose produced. Figure 2 shows the glucose analyzer and the turntable.
Figure 2: Starch hydrolysis experiment
Methods
Substrate concentration and enzyme concentration were varied using each enzyme. In addition a
control trial, which excluded the addition of enzymes, was run.
Varying Substrate Concentration
Four different concentrations of substrate were prepared and used with the enzyme in a reaction
vessel in this experiment.
For the first run, 0.15g of maltose was added to 30mL of buffer solution and heated by placing it
in the water bath at 65⁰C. Seven test tubes of 1 ml of 2.3M Tris solution were prepared for the
first run.
The first run was done with initial substrate (maltose) concentration at 5 g/L. The reaction was
started when 0.087 mL, or 0.1 g, of Spirizyme Fuel was pipetted into the flask containing
substrate and the stopwatch was started. At 30 seconds, 60 seconds, 90 seconds 120 seconds, 180
seconds, 240 seconds and 300 seconds, 1 ml of solution was taken and put into one of the test
Group 4
November 1, 2017
5
tubes containing Tris. Tris stops the reaction from progressing any further. The test tubes were
analyzed for the amount of glucose produced. This was repeated 3 more times with substrate
concentrations of 10 g/L, 20 g/L, and 40 g/L. This is shown in Table 2 below.
Table 2 - Concentrations of substrate and times at which reading was taken
Time 30 60 90 120 180 240 300
Concentration of
substrate (g/L)
5 = 0.15g/30mL
10= 0.3g/30mL
20= 0.6g/30mL
40= 1.2g/30mL
Generally, in larger starch molecules, a pretreatment step is done to break the molecule before it
reacts with the enzyme to produce glucose. To test whether heating up the maltose solution
helped increase glucose production, trials 5-8 involved a pretreatment step before the reaction
took place. The substrate and enzyme concentration were kept the same as in Trials 1-4. After a
mixture of the buffer solution and substrate was created, the reaction vessel was kept in a water
bath at 75⁰C. When the reaction was ready to take place, the flask was moved to another water
bath (set at 65⁰C) and Spirizyme was added. The samples were taken at the same time as in trials
1-4 and glucose production was analyzed. A similar procedure was followed using Liquozyme.
Varying Enzyme Concentration
Next, the enzyme concentration was varied three times for the substrate concentration of 20 g/L.
The first run in this part of the experiment was done with initial enzyme concentration at 0.1 g.
The reaction was started when 0.087 mL, or 0.1 g, of Spirizyme Fuel was pipetted into the flask
containing substrate and the stopwatch was started. At 30 seconds, 60 seconds, 90 seconds 120
seconds, 180 seconds, 240 seconds and 300 seconds, 1 mL of solution was taken and put into one
of the test tubes containing Tris. The samples were analyzed, which reported the amount of
glucose produced. This procedure was repeated 2 more times with enzyme concentrations of 0.2
g, and 0.4 g. This is shown in Table 3 below.
Table 3 - Concentrations of enzyme and times at which reading was taken
Time 30 60 90 120 180 240 300
Concentration of
Enzyme (g)
0.10
0.20
0.40
Group 4
November 1, 2017
6
A pre-treatment step was also looked at for trials 4-6. After creating the acid buffer and substrate
solution, it was heated to a temperature of 75⁰C. When the reactants reached this temperature,
the reaction vessel was placed in a water bath of 65⁰C and the enzyme was added. Substrate and
enzyme concentrations were not changed from Trials 1-3. The samples were taken in accordance
to Table 2, above. These samples were analyzed for glucose concentration. A similar procedure
was followed using Liquozyme.
Control Trials
The control trials were conducted at two temperatures: 65⁰C and 75⁰C with a substrate
concentration of 20 g/L. Samples of 1mL in volume were taken periodically throughout the lab
period. The time of each sample was recorded to later be compared with glucose concentration.
Results
In order to compare the two enzymes, the Michaelis-Menten plots and the reaction velocity at
different enzyme concentrations were determined. These plots are presented in the following
sections. In addition, a control test was conducted with results presented last.
Varying Substrate Concentration
Eight trials (four without and four with pretreatment, respectively) for each enzyme with varying
substrate concentrations were conducted to determine the initial velocities for the Michaelis-
Menten plots. For Spirizyme Fuel, the initial velocity plots looked similar Figure 3 shown below.
Group 4
November 1, 2017
7
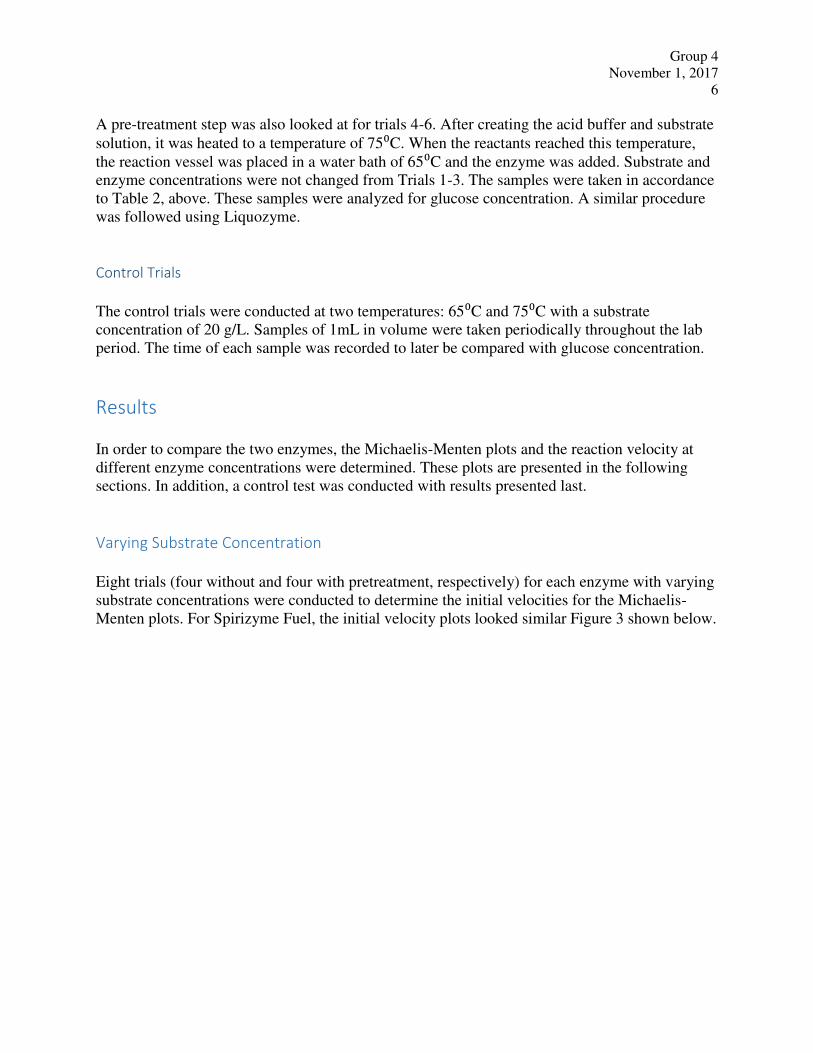
Figure 3: Glucose concentration versus time used to determine the initial velocity (Spirizyme, Trial 7)
Notice the plot levels out after approximately 120 seconds. Each trial using Spirizyme had a
similar shape. For Liquozyme, with the same substrate concentration and enzyme weight
percent, the initial velocity plot is shown below as Figure 4.
Figure 4: Glucose concentration versus time used to determine the initial velocity (Liquozyme, Trial 7).
0
1
2
3
4
5
6
7
0 50 100 150 200 250 300 350
Glu
cose
Co
nce
ntr
ati
on
(g
/L)
Time (s)
0.15
0.155
0.16
0.165
0.17
0.175
0.18
0.185
0 50 100 150 200 250 300 350
Glu
cose
Co
nce
ntr
ati
on
(g
/L)
Time (s)
Group 4
November 1, 2017
8
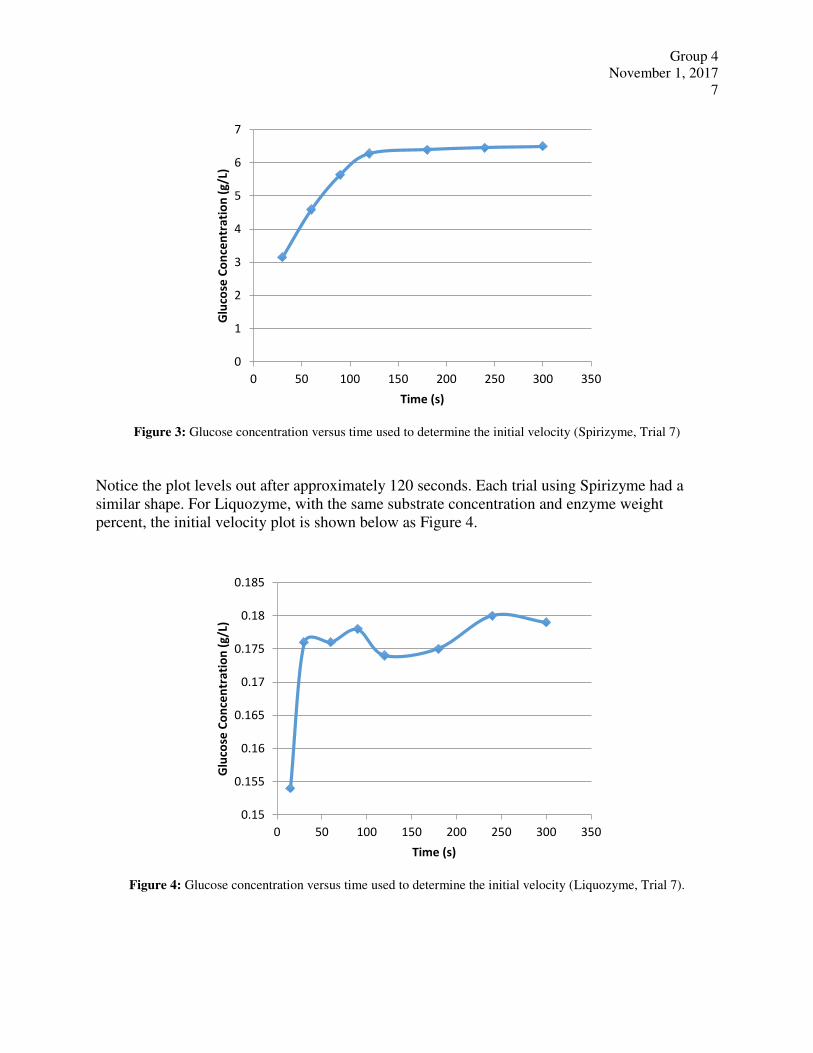
Notice the plot oscillates and does not reach a plateau as the trials with Spirizyme did. Many of
the Liquozyme trials had more oscillations than this plot. However, the increments on the
vertical axis are much smaller in Figure 4 than in Figure 3. If the axis are set to be the same as
those for Spirizyme, Figure 4 becomes Figure 5.
Figure 5: Changed axis for comparison of Liquozyme, Trial 7.
The oscillation becomes undetectable and the trend appears to be level. It is evident that less
glucose is produced compared to the Sprizyme trial and there is not a noticeable increase in
glucose production. This is true of all of the Liquozyme trials.
Taking these plots, the linear fit was determined using Excel. For the Spirizyme trials, the linear
fit was done after eliminating the plateau regions of the plot (discuss this in discussion). For the
Liquozyme, this was done for the entire data set. Using the slope of the trendline and the
substrate concentrations, the Michaelis-Menten plots were created. Figure 6 and Figure 7 are
Spirizyme and Liquozyme, respectively.
0
1
2
3
4
5
6
7
0 50 100 150 200 250 300 350
Glu
cose
Co
nce
ntr
ati
on
(g
/L)
Time (s)

Group 4
November 1, 2017
9
Figure 6: Michaelis-Menten plot for Spirizyme comparing with and without pretreatment.
Figure 7: Michaelis-Menten plot for Liquozyme comparing with and without pretreatment.
Figure 8 is the combination of the two plots as shown below.
0.005
0.01
0.015
0.02
0.025
0.03
0.035
0.04
0 10 20 30 40 50
Init
ial
Ve
loci
ty (
g/L
*s)
Substrate Concentration (g/L)
Without
Pretreatment
With
Pretreatment
-3.00E-05
-2.00E-05
-1.00E-05
0.00E+00
1.00E-05
2.00E-05
3.00E-05
4.00E-05
5.00E-05
6.00E-05
0 10 20 30 40 50Init
ial
Ve
loci
ty (
g/L
*s)
Substrate Concentration (g/L)
Without
Pretreatment
With
Pretreatment
Group 4
November 1, 2017
10
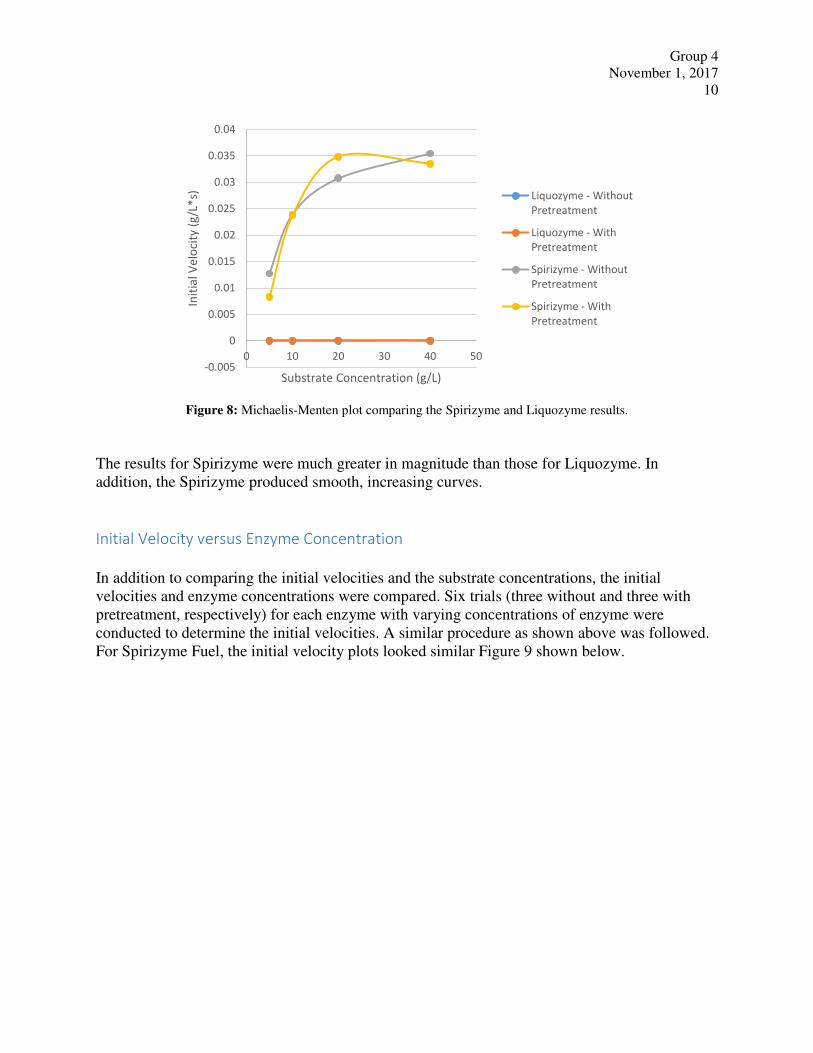
Figure 8: Michaelis-Menten plot comparing the Spirizyme and Liquozyme results.
The results for Spirizyme were much greater in magnitude than those for Liquozyme. In
addition, the Spirizyme produced smooth, increasing curves.
Initial Velocity versus Enzyme Concentration
In addition to comparing the initial velocities and the substrate concentrations, the initial
velocities and enzyme concentrations were compared. Six trials (three without and three with
pretreatment, respectively) for each enzyme with varying concentrations of enzyme were
conducted to determine the initial velocities. A similar procedure as shown above was followed.
For Spirizyme Fuel, the initial velocity plots looked similar Figure 9 shown below.
-0.005
0
0.005
0.01
0.015
0.02
0.025
0.03
0.035
0.04
0 10 20 30 40 50
Init
ial
Ve
loci
ty (
g/L
*s)
Substrate Concentration (g/L)
Liquozyme - Without
Pretreatment
Liquozyme - With
Pretreatment
Spirizyme - Without
Pretreatment
Spirizyme - With
Pretreatment
Group 4
November 1, 2017
11
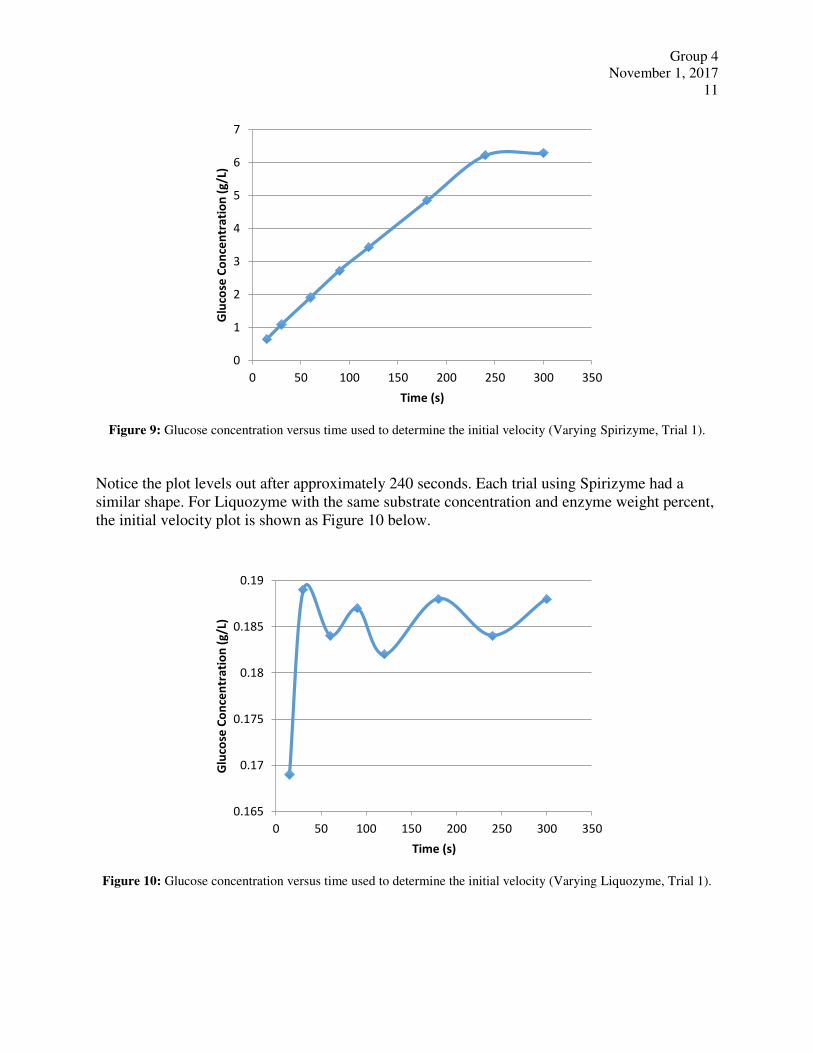
Figure 9: Glucose concentration versus time used to determine the initial velocity (Varying Spirizyme, Trial 1).
Notice the plot levels out after approximately 240 seconds. Each trial using Spirizyme had a
similar shape. For Liquozyme with the same substrate concentration and enzyme weight percent,
the initial velocity plot is shown as Figure 10 below.
Figure 10: Glucose concentration versus time used to determine the initial velocity (Varying Liquozyme, Trial 1).
0
1
2
3
4
5
6
7
0 50 100 150 200 250 300 350
Glu
cose
Co
nce
ntr
ati
on
(g
/L)
Time (s)
0.165
0.17
0.175
0.18
0.185
0.19
0 50 100 150 200 250 300 350
Glu
cose
Co
nce
ntr
ati
on
(g
/L)
Time (s)

Group 4
November 1, 2017
12
Notice the plot oscillates and does not reach a plateau as the trials with Spirizyme did. Many of
the Liquozyme trials had more oscillations than this plot. However, the increments on the
vertical axis are much smaller in Figure 10 than in Figure 9. If the axis are set to be the same as
those for Spirizyme, Figure 10 becomes Figure 11.
Figure 11: Changed axis for comparison of Varying Liquozyme, Trial 1.
With the change in axis, the oscillation in the data becomes undetectable and the trend appears to
be level. It is evident that less glucose is produced compared to the Sprizyme trial and there is
not a noticeable increase in glucose production. This is true of all Liquozyme trials.
Taking these plots, the linear fit was determined using Excel. For the Spirizyme trials, the linear
fit was done after eliminating the plateau regions of the plot (discuss this in discussion). For the
Liquozyme, this was done for the entire data set. Using the slope of the trend line and the
substrate concentrations, the following plot was created. Spirizyme and Liquozyme, are shown
on the same plot, Figure 12.
0
1
2
3
4
5
6
7
0 50 100 150 200 250 300 350
Glu
cose
Co
nce
ntr
ati
on
(g
/L)
Time (s)

Group 4
November 1, 2017
13
Figure 12: Initial velocity versus enzyme concentration plot comparing the Spirizyme and Liquozyme.
The results for Spirizyme were much greater in magnitude than those for Liquozyme. In
addition, the Spirizyme produced smooth, increasing curves.
Control Test versus Data
A control test was done at the reaction temperature (without pretreatment) and the pretreatment
temperature (with pretreatment) at a substrate concentration of 20 g/L. However, no enzyme was
added to the reactor. The control test was carried out to track glucose production without the
presence of an enzyme. Samples were taken from the control trials periodically throughout a lab
period and were analyzed. Figure 13 below compares the two trials.
0.00
0.01
0.02
0.03
0.04
0.05
0.06
0.07
0.08
0 0.1 0.2 0.3 0.4 0.5
Init
ial
Ve
loci
ty (
g/L
*s)
Enzyme Mass (g)
Liquozyme - Without
Pretreatment
Liquozyme - With
Pretreatment
Spirizyme - Without
Pretreatment
Spirizyme - With
Pretreatment
Group 4
November 1, 2017
14
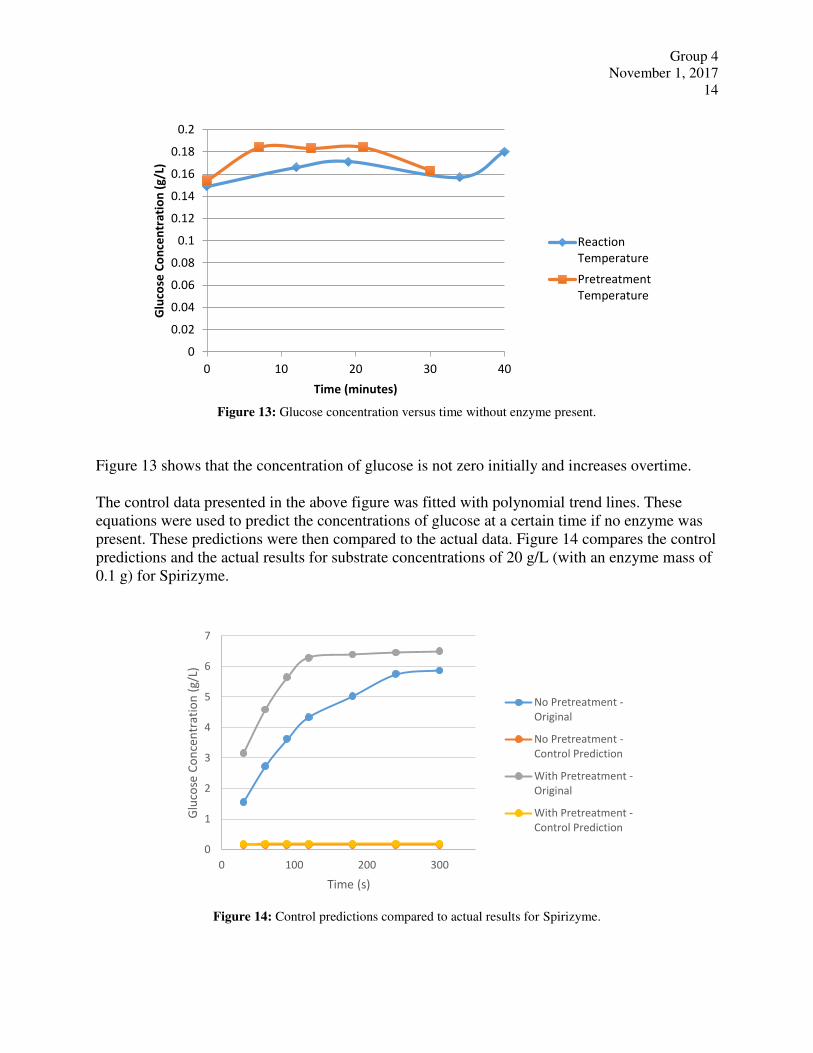
Figure 13: Glucose concentration versus time without enzyme present.
Figure 13 shows that the concentration of glucose is not zero initially and increases overtime.
The control data presented in the above figure was fitted with polynomial trend lines. These
equations were used to predict the concentrations of glucose at a certain time if no enzyme was
present. These predictions were then compared to the actual data. Figure 14 compares the control
predictions and the actual results for substrate concentrations of 20 g/L (with an enzyme mass of
0.1 g) for Spirizyme.
Figure 14: Control predictions compared to actual results for Spirizyme.
0
0.02
0.04
0.06
0.08
0.1
0.12
0.14
0.16
0.18
0.2
0 10 20 30 40
Glu
cose
Co
nce
ntr
ati
on
(g
/L)
Time (minutes)
Reaction
Temperature
Pretreatment
Temperature
0
1
2
3
4
5
6
7
0 100 200 300
Glu
cose
Co
nce
ntr
ati
on
(g
/L)
Time (s)
No Pretreatment -
Original
No Pretreatment -
Control Prediction
With Pretreatment -
Original
With Pretreatment -
Control Prediction
Group 4
November 1, 2017
15
Note that there is a large difference between the actual results and the predicted results with no
enzyme.
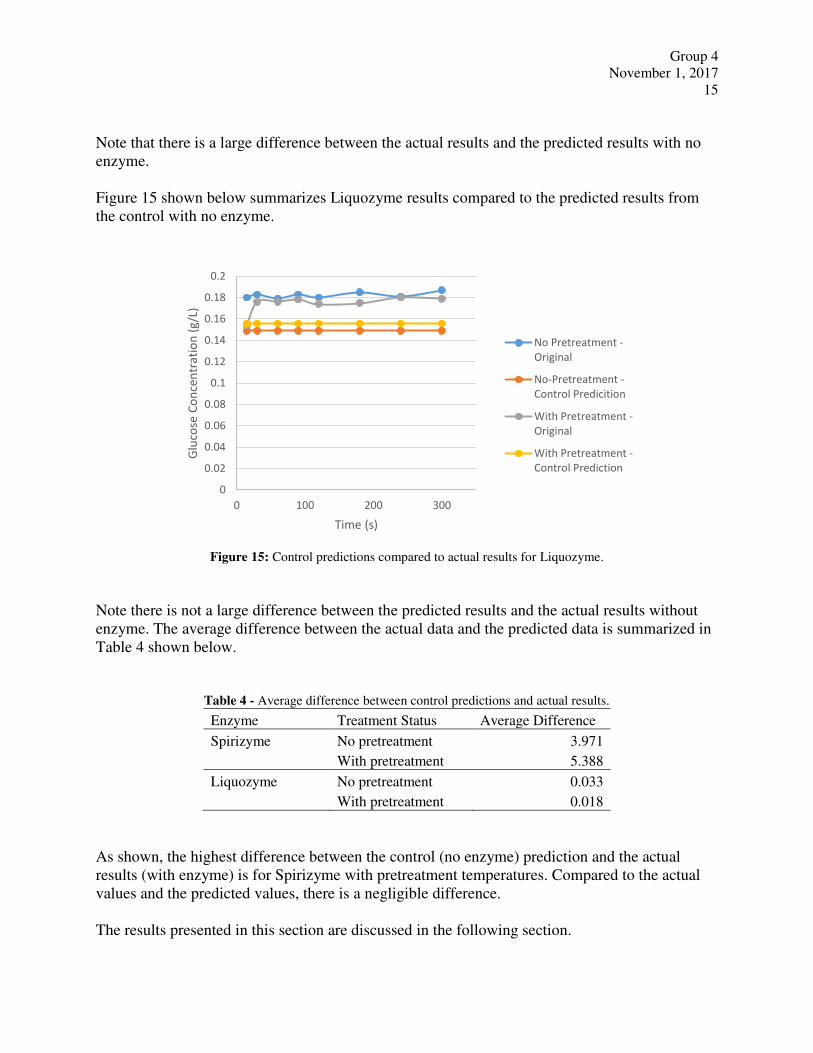
Figure 15 shown below summarizes Liquozyme results compared to the predicted results from
the control with no enzyme.
Figure 15: Control predictions compared to actual results for Liquozyme.
Note there is not a large difference between the predicted results and the actual results without
enzyme. The average difference between the actual data and the predicted data is summarized in
Table 4 shown below.
Table 4 - Average difference between control predictions and actual results.
Enzyme Treatment Status Average Difference
Spirizyme No pretreatment 3.971
With pretreatment 5.388
Liquozyme No pretreatment 0.033
With pretreatment 0.018
As shown, the highest difference between the control (no enzyme) prediction and the actual
results (with enzyme) is for Spirizyme with pretreatment temperatures. Compared to the actual
values and the predicted values, there is a negligible difference.
The results presented in this section are discussed in the following section.
0
0.02
0.04
0.06
0.08
0.1
0.12
0.14
0.16
0.18
0.2
0 100 200 300
Glu
cose
Co
nce
ntr
ati
on
(g
/L)
Time (s)
No Pretreatment -
Original
No-Pretreatment -
Control Predicition
With Pretreatment -
Original
With Pretreatment -
Control Prediction
Group 4
November 1, 2017
16
Discussion
In order to compare the two enzymes, the Michaelis-Menten plots and the reaction velocity at
different enzyme concentrations were created. In addition, a control test was conducted. The
following is a discussion of those results.
Criteria for the Optimum Enzyme and Operating Range
The problem to be addressed was the optimized process of producing glucose from maltose
given two different enzymes. The overarching assumption of this report was that an existing
production facility is in place. This means that certain variables were held constant, such as pH,
because in order to adjust various parameters additional process would need to be added. For
example, in the case of pH adjustment, an acid pump would need to be added along with
additional piping. For this manufacturing process, the focus was on saccharification, the
hydrolysis of complex sugars. Given that maltose is a disaccharide formed from two glucose
units, a high yielding hydrolysis reaction would have a large concentration of glucose.
An optimized process would do this quickly with the smallest amount of enzyme used to the
largest amount of raw material, in this case maltose. Therefore, Spirizyme and Liquozyme were
evaluated based on the yield of glucose and how well the mechanism behaves. In addition,
factors such as large operating ranges for temperature and pH that were provided from the
manufacturer literature were considered. Operating range was considered because if the process
had an upset, an enzyme with a large range would have a reduced risk of deactivation.
Once the optimum enzyme was chosen, the operating range was determined. This includes
reaction duration, temperature, pH and the concentrations of enzyme and substrate. Temperature
and concentrations were varied in this experiment. However, evaluating all possibilities was out
of scope for this report. Therefore, the optimum operating range was provided based on the
conditions tested. It was assumed that the pH of the operating process is fixed at a pH of 4.63.
Note that this pH is within the optimum operating range of Spirizyme but is just under the
operating range of Liquozyme [6].
Implications of Varying Substrate Concentration
Initial data collected for each enzyme showed very different trends. For Spirizyme, there would
be a linear trend until at some time the glucose concentration would reach a maximum and level
off. This behavior was expected. As time went on, the enzyme would react with more substrate
until the substrate was depleted. Each Spirizyme trial was consistent with the results shown in
Figure 3 of the results section. When analyzing these results to find the initial velocity, the linear
trend line was fit to the linear piece of the results. This was done so an accurate slope could be
Group 4
November 1, 2017
17
attained. The plateau, level piece indicated that there was no further conversion to glucose and
the reaction was over.
However, this same method could not be used with the results for Liquozyme. The initial results
shown in Figure 4 and Figure 5 do not follow the same trend as Spirizyme did. Instead, the
results appear to oscillate. However, when the axis are adjusted to match those of Spirizyme, it
appears to be linear. Compared to the magnitude of Spirizyme, Liquozyme did not produce
nearly as much glucose as Spirizyme did. This was true of all Liquozyme trials. When analyzing
results to find the initial velocity, a linear trend line was fit to the entire data set. This yielded
slopes that were very small including a negative slope. Which is much different than the
increasing slopes found with Spirizyme. The results of varying substrate concentration are best
summarized in Figure 8. This figure compares both enzymes with the different initial treatments.
The results for Spirizyme were much greater in magnitude than those for Liquozyme. In
addition, the Spirizyme produced smooth, increasing curves. Smooth, increasing curves were
expected based on the theory surrounding enzymes. The rate of reaction should increase as
substrate concentration increases due to the higher likelihood of enzyme encountering a substrate
molecule. At some point, the initial velocity will plateau when the enzyme is saturated with
substrate meaning each enzyme molecule has formed a enzyme-substrate complex and the
reaction cannot speed up without adding more enzyme.
Spirizyme produced the expected plots. Comparing the two conditions (with and without
pretreatment), similar results are found. Based on this data alone, a conclusive decision on
operating point cannot be determined. Therefore, the initial velocity versus enzyme
concentration was considered.
Implications of Varying Enzyme Concentration
In addition to comparing the initial velocities and the substrate concentrations, the initial
velocities and enzyme concentrations were compared. As expected, the initial results for both
enzymes were similar to those for varying substrate concentrations. The general curve for
glucose concentration with Spirizyme was expected as it was previously. Again the general
shape of Liquozyme, as seen in Figure 10, was oscillatory until the vertical axis was adjusted as
seen in Figure 11.
As done before, the initial results were used to determine the initial velocities. The results for
each enzyme with each initial treatment were plotted as shown in Figure 12. Again, as seen in
the varying substrate concentration part of the experiment, the Spirizyme produced plots of the
expected shape. This shape was expected because as your enzyme concentration increases, the
likelihood of an enzyme molecule encountering the substrate molecule is increased and the
reaction can be carried out quickly. The Liquozyme did not produce graphs with the expected
shape.

Group 4
November 1, 2017
18
Comparing the two Spirizyme trials, the Spirizyme without pretreatment performed much better
at higher enzyme concentration than the Spirizyme with pretreatment. The pretreated Spirizyme
appears to reach its plateau at approximately 0.2 g of enzyme added. This indicates that the
additional Spirizyme was no longer being effective because it was out of substrate to react with.
The Spirizyme without pretreatment has not reached the plateau for the enzyme concentrations
chosen. Therefore, the Spirizyme with pretreatment produced more glucose faster than the
Spirizyme without pretreatment. Based on the results in Figure 12, the maximum initial velocity
reached with a substrate concentration of 20 g/L is achieved at 0.2 g of Spirizyme or larger than
0.4 g of Liquozyme.
In industry, saving money is important. Assuming both enzymes cost the same amount, using the
minimum amount of enzyme to convert the same amount of substrate would be preferred.
Therefore, using Spirizyme at a mass of 0.2 g with pretreatment for a substrate concentration of
20 g/L is optimal.
Implications from the Control Test
Figure 13 showed that there is glucose present in the solution without the presence of enzyme.
This also showed that the pretreatment temperature had a higher concentration of glucose.
However, there is not a large difference between the two values. The control group proved that
there is glucose present in the samples without the use of any enzyme.
Looking at the values of glucose concentration, these can be considered minimal when compared
to the magnitude of the reactions with the use of enzymes. This is shown in Figure 14 with
Spirizyme. The predicted values, using the fitted lines, for the untreated control were minimal
compared to the glucose concentrations obtained in the experiment. Therefore, it can be
concluded that the heat did not contribute much to the production of glucose in the Spirizyme
trials. The same cannot be said for Liquozyme.
Figure 15 showed the control predictions compared to the results of the Liquozyme trials. The
largest difference is less than 0.04 g/L between the glucose concentrations of the actual data and
of the control predictions. Unlike Spirizyme, there is not a large difference between these two
values. The average difference between the control predictions and the actual results is
summarized in Table 3.
From the table, it is seen that the largest difference is for Spirizyme with pretreatment. This
means that the enzyme, Spirizyme, produced the most glucose without the assistance of
additional heat that was predicted by the control trial. From these results, it was concluded that
the best performing enzyme was Spirizyme with pretreatment.
Optimum Enzyme and Operating Range

Group 4
November 1, 2017
19
As discussed previously, the optimum enzyme would have the highest conversion in the smallest
amount of time with large operating ranges for temperature and pH.
Considering the highest conversion rate, Spirizyme had the largest initial velocity and glucose
conversions both with and without pretreatment. Unfortunately, temperature data was not found
on either enzyme. Therefore, it is not clear from these trials what the ideal temperature range is
and temperature range was not included in this decision. However, based on the literature,
Spirizyme had the largest pH range of 3.5 to 5.5 compared to Liquozyme’s range of 5 to 6.
Therefore, Spirizyme is considered to be the preferred enzyme.
The optimum operating point for Spirizyme includes set points for pH, temperature, reaction
duration, and concentrations of enzyme and substrate. The pH was held constant during this
experiment therefore, the optimum operating set points are based on a pH of 4.63. The optimum
operating temperature for Spirizyme was with pretreatment. This is supported by the
implications of varying enzyme concentration and the implications of the control test with the
implications of varying substrate concentration being inconclusive. These were all discussed in
the previous sections. Therefore, a temperature of 75°C was reached with the maltose before the
enzyme was added and reaction was carried out at a temperature of 65°C.
To determine the optimum operating set point for the concentrations of substrate (maltose) to
Spirizyme, the initial velocity plots were considered. For a constant enzyme mass of 0.1 g added,
the highest initial velocity occurred after a substrate concentration of 20 g/L. For a constant
substrate concentration of 20 g/L, the highest initial velocity occurred after an enzyme mass of
0.2 g was added to the substrate. Therefore, the optimum operating range for Spirizyme is 0.1 to
0.2 g per 20 g/L of substrate.
Sources of Error
Sources of error for this experiment include the assumptions made about the pH of the starch
solution. From industry experience, it was known that the pH of the starch milk entering without
pH adjustment is approximately 4.6. After a pH adjustment with caustic, for example, the pH is
increased to 5.8. Therefore in industry, the pH can be adjusted to meet the needs of the enzyme
used. However, the caustic pump could fail. The same pH was used for both enzymes with it
only being in the optimum range for Spirizyme. With the pH outside of the Liquozyme operating
range, it was likely deactivated. Therefore, it makes sense that the Spirizyme outperformed the
Liquozyme.
Another source of error is the measurement of the glucose concentration of the glucose analyzer.
The machine is approximately 20 years old had multiple technical difficulties during
experimentation. Finally, the method at which samples were taken could be subjected to human
error. Therefore, not all samples could have been taken as time accurately as possible. In
addition, hand-mixing the reactor was not as consistent as a reactor, such as a CSTR, would have
been. This could explain discrepancies in the results of the glucose analyzer.

Group 4
November 1, 2017
20
Conclusions
This experiment explored the effect of substrate concentration, enzyme concentration and
temperature on production of glucose from maltose. One goal of the experiment was to
determine which of two enzymes—Spirizyme Fuel and Liquozyme-- would break down the
substrate better. It was predicted that an increasing enzyme concentration would increase glucose
production and increasing substrate concentration would lead to an initial increase in glucose
production then glucose production would level off. Secondly, it was hypothesized that
Liquozyme would work better than Spirizyme to create glucose as an earlier piece of literature
stated that it will be able to break the 1-6 bonds. Thirdly, it was believed that Spirizyme Fuel
may work better as an enzyme to break down maltose as literature was found stating that
Spirizyme acted in the saccharification step of breaking down glucose [7].
The Michaelis-Menten model was used to analyze which enzyme worked better at the different
conditions conditions. Various substrate concnetrations, enzyme concentrations, and
temperatures were changed and the effects were analyzed.
In conclusion, it was found that Spirozyme Fuel was a better enzyme to use to break down
glucose than Liquozyme. Pretreatment was also found to be useful in increasing the amount of
glucose formed in each reaction. Pretreatment was also beneficial as a smaller amount of enzyme
was used to get more glucose.
Recommendations
The overall purpose of this experiment was to determine the best enzyme for converting starch
into glucose in an industrial process. In industry, the process would start with starch from a
source such as corn. It is recommended that a glucose polymer is used (either starch or a
maltodextrin) to determine the effectiveness of the enzymes on a larger molecule. In addition,
starch has a tendency to gel depending on its amylose content which makes it viscous. A higher
viscosity is harder to pump, therefore, before implementing any enzyme into the process, a series
of viscosity tests should be conducted.
Further testing to should challenge the assumption of a constant pH and verify the operating
ranges provided by literature. As well as provide a larger operating range of temperatures for the
enzymes.
Furthermore, this process lacked proper agitation that would be provided in industry. All future
experiments should consider using consistent agitation to promote the reaction.
Group 4
November 1, 2017
21
References
[1] J. Koziel, J. v. Leeuwen, W. Jenks and D. Grewell, "Ethanol production, purification, and analysis
techniques: a review," Iowa State University Agricultural and Biosystems Engineering, 2008.
[2] C. Gustafson, "History of Ethanol Production and Policy," North Dakota State University, 8 Mar
2010. [Online]. Available: https://www.ag.ndsu.edu/energy/biofuels/energy-briefs/history-of-
ethanol-production-and-policy. [Accessed 30 Oct 2017].
[3] "World Fuel Ethanol Production," Renewable Fuels Association, 2017. [Online]. Available:
http://www.ethanolrfa.org/resources/industry/statistics/#1454099788442-e48b2782-ea53. [Accessed
30 Oct 2017].
[4] "Economics of Biofuels," 17 April 2017. [Online]. Available: https://www.epa.gov/environmental-
economics/economics-biofuels. [Accessed 30 Oct 2017].
[5] "Enzyme Technology: The use of enzyme in starch hydrolysis," [Online]. Available:
http://www1.lsbu.ac.uk/water/enztech/starch.html. [Accessed 31 10 2017].
[6] "Enzyme Applications for the Fuel Ethanol Industry," 20 3 2008. [Online]. Available:
https://www.slideserve.com/adamdaniel/enzyme-applications-for-the-fuel-ethanol-industry.
[Accessed 31 10 2017].
[7] J. Palmer, "How to Brew: The starch conversion and sacchrification rest," [Online]. Available:
http://howtobrew.com/book/section-3/how-the-mash-works/the-starch-conversion-saccharification-
rest. [Accessed 31 10 2017].
[8] "Maltose," [Online]. Available: http://www.sciencedirect.com/topics/neuroscience/maltose.
[Accessed 31 10 2017].
[9] "Michaelis-Menten Kinetics and Briggs-Haldance Kinetics," [Online]. Available:
https://depts.washington.edu/wmatkins/kinetics/michaelis-menten.html. [Accessed 31 10 2017].
[10] Novozymes, "Spirizyme Fuel," Franklin, NC.
[11] Novozymes, "Spirizyme Fuel Product Data Sheet," Franklin, NC.
[12] Novozymes, "Liquozyme SC DS Product Data Sheet," Franklin, NC.
[13] Novozymes, "Spirizime Application Sheet," Franklin, NC.
[14] "Ethanol Fuel Basics," 18 May 2017. [Online]. Available:
https://www.afdc.energy.gov/fuels/ethanol_fuel_basics.html. [Accessed 30 Oct 2017].

Group 4
November 1, 2017
v
Appendix
Sample Calculations
The Michealis Menten plot is shown above. As the reaction levels out the substrate and enzyme has
reached its maximum rate of reaction. The value where the graph levels out is the maximum reaction
velocity. The Michealis Menten constant is the maximum reaction velocity divided by two. This process
was used to form the Michealis Menten plots.


![A kinetic model of starch hydrolysis by [alpha]- and …kchbi.chtf.stuba.sk/upload_new/file/Miro/Proc problemy...Kinetics of malt starch hydrolysis by endogeneous a- and &amylases](https://img.pdfslide.us/doc/110x75/5e4bb072f0085830d17bafc7/a-kinetic-model-of-starch-hydrolysis-by-alpha-and-kchbichtfstubaskuploadnewfilemiroproc.jpg)