Embed Size (px)
Citation preview
Impact of sourdough on in vitro starch hydrolysis in wheat tortilla bread Bachelor of Science Thesis in Chemical Engineering ELIN HIDEBRING Department of Chemical and Biological Engineering Division of Food Science CHALMERS UNIVERSITY OF TECHNOLOGY Gothenburg, Sweden, 2012
I
Impact of sourdough on in vitro starch hydrolysis in wheat tortilla bread
ELIN HIDEBRING
Department of Chemical and Biological Engineering Division of Food Science
CHALMERS UNIVERSITY OF TECHNOLOGY
Gothenburg, Sweden 2012
II
Impact of sourdough on in vitro starch hydrolysis in wheat tortilla bread
ELIN HIDEBRING
© ELIN HIDEBRING, 2012
Department of Chemical and Biological Engineering Chalmers University of Technology SE-412 96 Gothenburg Sweden Telephone +46 (0)31-772 1000
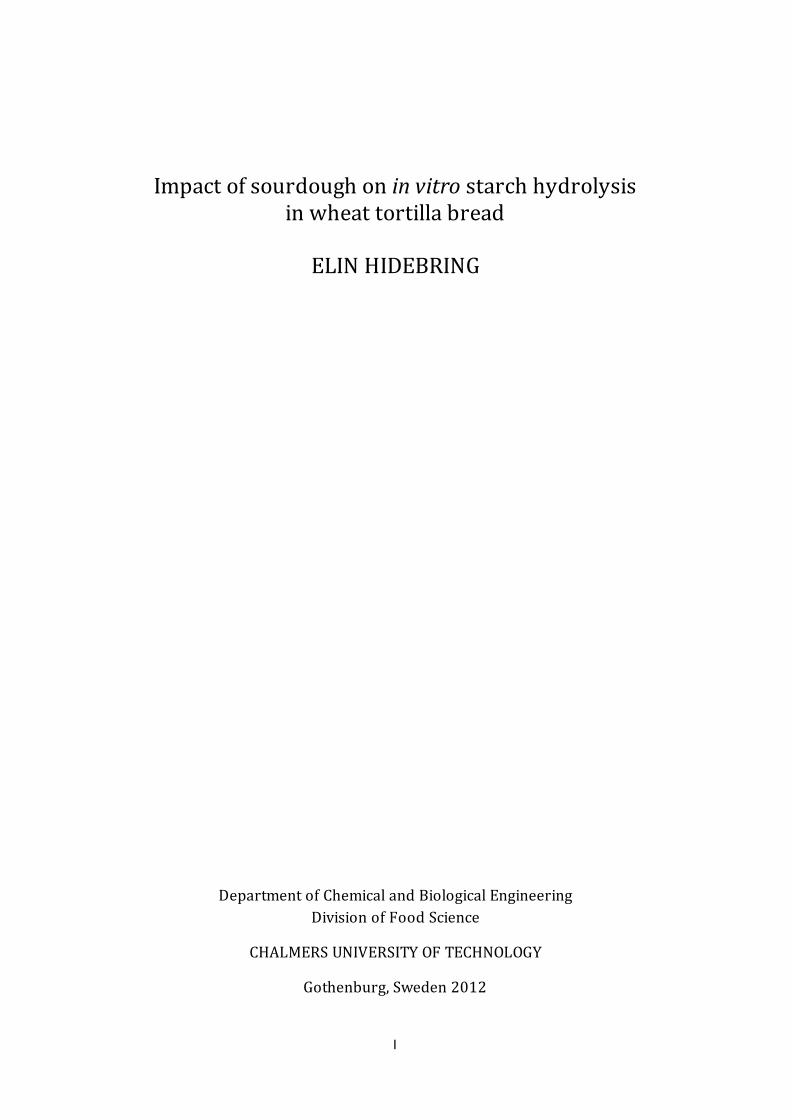
Cover: [Sourdough tortillas prepared in section 5.7]
Gothenburg, Sweden 2012
III
Impact of sourdough on in vitro starch hydrolysis in wheat tortilla bread ELIN HIDEBRING Department of Chemical and Biological Engineering Chalmers University of Technology
Abstract
Bread and other cereal products are important staple foods in many parts of the world, and they have high starch content by nature. Starch is our most common carbohydrate and it is made up by numerous glucose molecules. When ingested, a portion of the starch is hydrolysed by α-amylase to the disaccharide maltose in the mouth and small intestine. Intake of a diet rich in starch may cause high blood glucose response which can lead to type 2 diabetes, cardio vascular diseases and other health concerns. This thesis was carried out in cooperation with the spice and food company Santa Maria AB and aimed to study the in vitro starch hydrolysis in wheat tortilla bread when adding freeze-dried sourdough powders on its own or in combination with rye or oat flour. The desired result was to lower the starch hydrolysis rate relative to Santa Marias’s soft wheat tortilla.
Liquid sourdoughs as well as freeze-dried sourdoughs may contain lactic acid, which have been reported to lower the rate of starch hydrolysis. Sourdough powders (14 different) were provided by Santa Maria and analysed for organic acid concentration using a HPLC method. A large difference in lactic acid concentration was found. The two sourdough powders with the highest concentration of lactic acid were selected and used for baking wheat tortilla breads. The impact on starch hydrolysis with the addition of rye flour, oat flour or pinto bean flakes was also evaluated. The rate of starch hydrolysis in vitro was investigated for each tortilla.
The starch hydrolysis rate in the sourdough tortillas, with and without rye or out flour, was found to differ significantly from Santa Maria’s soft wheat tortilla. The results clearly demonstrated that the use of sourdough in combination with oat flour should be considered for the development of wheat tortilla bread with a lower starch digestibility. Further studies are needed to identify the mechanisms or compounds responsible for the observed inhibitory effects on starch degradation.
Keywords: sourdough, tortilla bread, lactic acid, in vitro, starch hydrolysis, DNS method
IV
Påverkan av surdeg på in vitro stärkelsehydrolys i vetetortilla ELIN HIDEBRING Institutionen för Kemi och Bioteknik Chalmers Tekniska Högskola
Sammanfattning
Bröd och andra stärkelseinnehållande produkter är viktiga basvaror i många delar av världen och de har naturligt ett högt stärkelseinnehåll. Stärkelse är den vanligaste förekommande kolhydraten och är uppbyggd av ett stort antal glukosmolekyler. En del av stärkelsen som vi äter, hydrolyseras av enzymet α-amylas till disackariden maltos i munnen och tunntarmen. Ett högt intag av stärkelse i maten kan ge ett högt blodsockersvar vilket i sin tur kan leda till diabetes typ 2, hjärt- och kärlsjukdomar och andra hälsoproblem. Detta examensarbete utfördes i samarbete med livsmedelsföretaget Santa Maria AB och syftet var att studera hydrolysen av stärkelse in vitro i vetetortillas vid tillsats av enbart frystorkat surdegspulver eller i kombination med råg- eller havremjöl. Det önskade resultatet var få en sänkning av hydrolyshastigheten jämfört med Santa Marias vetetortilla.
Flytande surdegar, såväl som frystorkade surdegspulver kan innehålla mjölksyra som enligt tidigare studier visat sig sänka hastigheten på stärkelsehydrolysen. Surdegspulvren (14 olika) tillhandahölls av Santa Maria och analyserades med avseende på deras innehåll av organiska syror med hjälp av en HPLC analys. Koncentrationen av mjölksyra varierade kraftigt mellan de olika surdegspulvren. De två pulvren med den högsta koncentrationen valdes ut och användes för att baka tortillabröd. Påverkan på stärkelsehydrolysen vid tillsats av rågmjöl, havremjöl och pintobönflingor utvärderades också. Hydrolyshastigheten analyserades för samtliga tortillabröd.
Omfattningen och hastigheten av stärkelsehydrolysen i surdegstortillabröden, med eller utan tillsats av råg- eller havremjöl, skiljde sig signifikant från Santa Marias vetetortilla. Resultaten visade tydligt att surdeg i kombination med havremjöl är ett intressant alternativ för utveckling av tortillabröd med en långsammare stärkelsehydrolys. Fler studier behövs för att identifiera de mekanismer eller ämnen som ger en sänkt hastighet av stärkelsehydrolysen.

V
Acknowledgements
I would like to give a sincere thanks to my supervisor Marie Alminger for her support and guidance throughout this thesis. I would also like to thank Torbjörn Lilliebjelke and Gunilla Kjellmer from Santa Maria, who has been a great help to me in many ways. I appreciate all the support from the all the other people at the division of Food Science, who has helped me and shown interest in my work.
VI
Table of Contents
1. Introduction .......................................................................................................................... 1
2. Objective............................................................................................................................... 2
3. Background ........................................................................................................................... 3
4. Theory .................................................................................................................................. 5
4.1 Starch hydrolysis .............................................................................................................. 5
4.2 DNS-method .................................................................................................................... 5
5. Method ................................................................................................................................. 7
5.1 Weighing of the sourdough powder ................................................................................... 7
5.2 Dry matter content ........................................................................................................... 7
5.3 pH measurement .............................................................................................................. 7
5.4 Preparation of sourdough powder solutions for the HPLC analysis ....................................... 7
5.5 Dilution of standard solutions............................................................................................ 7
5.6 HPLC procedur.................................................................................................................. 7
5.7 Preparation of tortillas...................................................................................................... 8
5.8 Maltose standard curve .................................................................................................... 8
5.9 In vitro starch hydrolysis ................................................................................................... 8
6. Results .................................................................................................................................. 9
6.1 pH measurements ............................................................................................................ 9
6.2 HPLC results ....................................................................................................................10
6.3 Preparation of tortilla bread.............................................................................................11
6.4 In vitro results .................................................................................................................11
7. Discussion ............................................................................................................................12
8. Concluding Remarks .............................................................................................................13
9. Future perspectives ..............................................................................................................14
References...................................................................................................................................15
APPENDIX ................................................................................................................................16
I. Method.................................................................................................................................16
II. Results .................................................................................................................................17
1
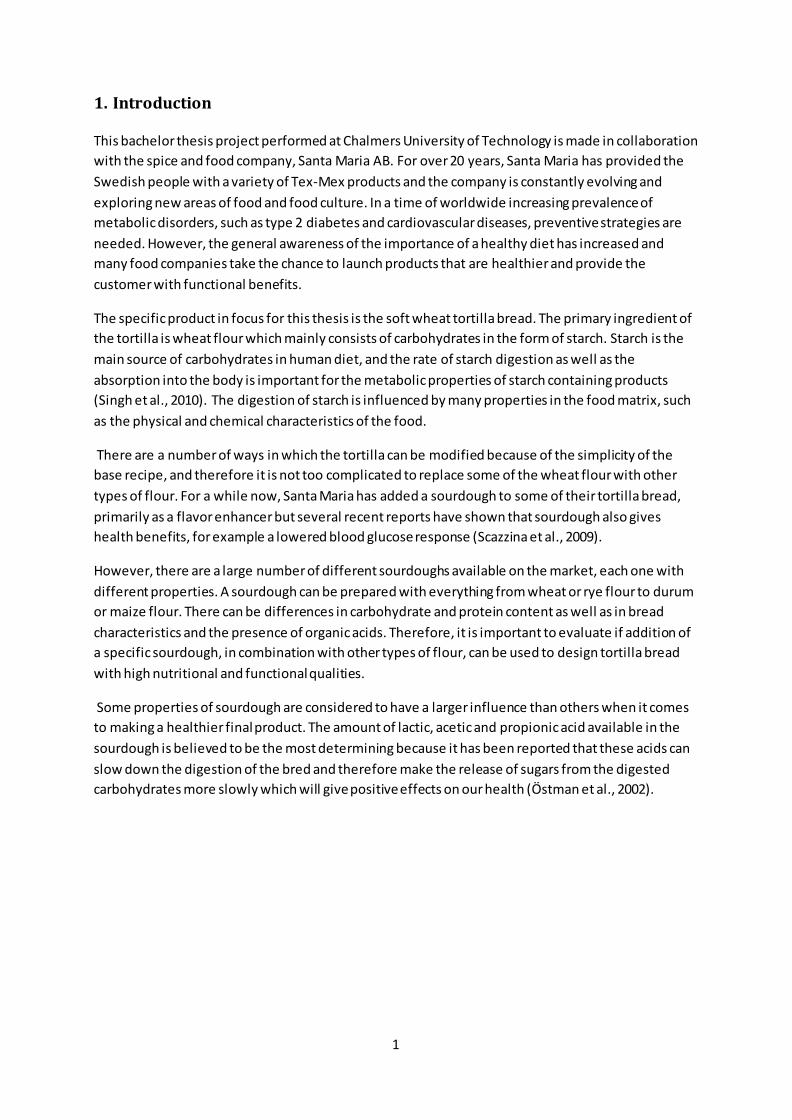
1. Introduction
This bachelor thesis project performed at Chalmers University of Technology is made in collaboration with the spice and food company, Santa Maria AB. For over 20 years, Santa Maria has provided the Swedish people with a variety of Tex-Mex products and the company is constantly evolving and exploring new areas of food and food culture. In a time of worldwide increasing prevalence of metabolic disorders, such as type 2 diabetes and cardiovascular diseases, preventive strategies are needed. However, the general awareness of the importance of a healthy diet has increased and many food companies take the chance to launch products that are healthier and provide the customer with functional benefits.
The specific product in focus for this thesis is the soft wheat tortilla bread. The primary ingredient of the tortilla is wheat flour which mainly consists of carbohydrates in the form of starch. Starch is the main source of carbohydrates in human diet, and the rate of starch digestion as well as the absorption into the body is important for the metabolic properties of starch containing products (Singh et al., 2010). The digestion of starch is influenced by many properties in the food matrix, such as the physical and chemical characteristics of the food.
There are a number of ways in which the tortilla can be modified because of the simplicity of the base recipe, and therefore it is not too complicated to replace some of the wheat flour with other types of flour. For a while now, Santa Maria has added a sourdough to some of their tortilla bread, primarily as a flavor enhancer but several recent reports have shown that sourdough also gives health benefits, for example a lowered blood glucose response (Scazzina et al., 2009).
However, there are a large number of different sourdoughs available on the market, each one with different properties. A sourdough can be prepared with everything from wheat or rye flour to durum or maize flour. There can be differences in carbohydrate and protein content as well as in bread characteristics and the presence of organic acids. Therefore, it is important to evaluate if addition of a specific sourdough, in combination with other types of flour, can be used to design tortilla bread with high nutritional and functional qualities.
Some properties of sourdough are considered to have a larger influence than others when it comes to making a healthier final product. The amount of lactic, acetic and propionic acid available in the sourdough is believed to be the most determining because it has been reported that these acids can slow down the digestion of the bred and therefore make the release of sugars from the digested carbohydrates more slowly which will give positive effects on our health (Östman et al., 2002).
2
2. Objective
The objective of this thesis was to make a pilot study on how the in vitro starch hydrolysis differs between wheat tortilla breads with added freeze-dried sourdough powder, or when adding sourdough powder in combination with rye or oat flour. The tortillas was prepared in Santa Maria’s test kitchen and analysed at Chalmers University of Technology. The starting point of the experimental work was to assess the content of organic acids in the sourdough powders provided by Santa Maria AB, since it has been well documented that organic acids like acetic, propionic and especially lactic acid can make an impact on the rate of the starch hydrolysis.
To make this project manageable for one person in a short timeframe, it was decided that the two sourdough powders with the highest concentration of lactic acid should be selected and used for the preparation of tortilla bread. These sourdough powders would also be combined with the addition of rye and oat flour to the wheat tortilla. The use of liquid sourdough and pinto bean flakes in tortillas was also evaluated.
3
3. Background
One of the oldest biotechnological processes is the fermentation of cereals. In ancient Egypt, spontaneous fermentation with the help of yeast and lactic acid bacteria was used in bread making as well as in beer (Poutanen et al., 2009). These techniques are the predecessors to our modern baking yeast, Saccharomyces cerevisiae, and numerous sourdough cultures.
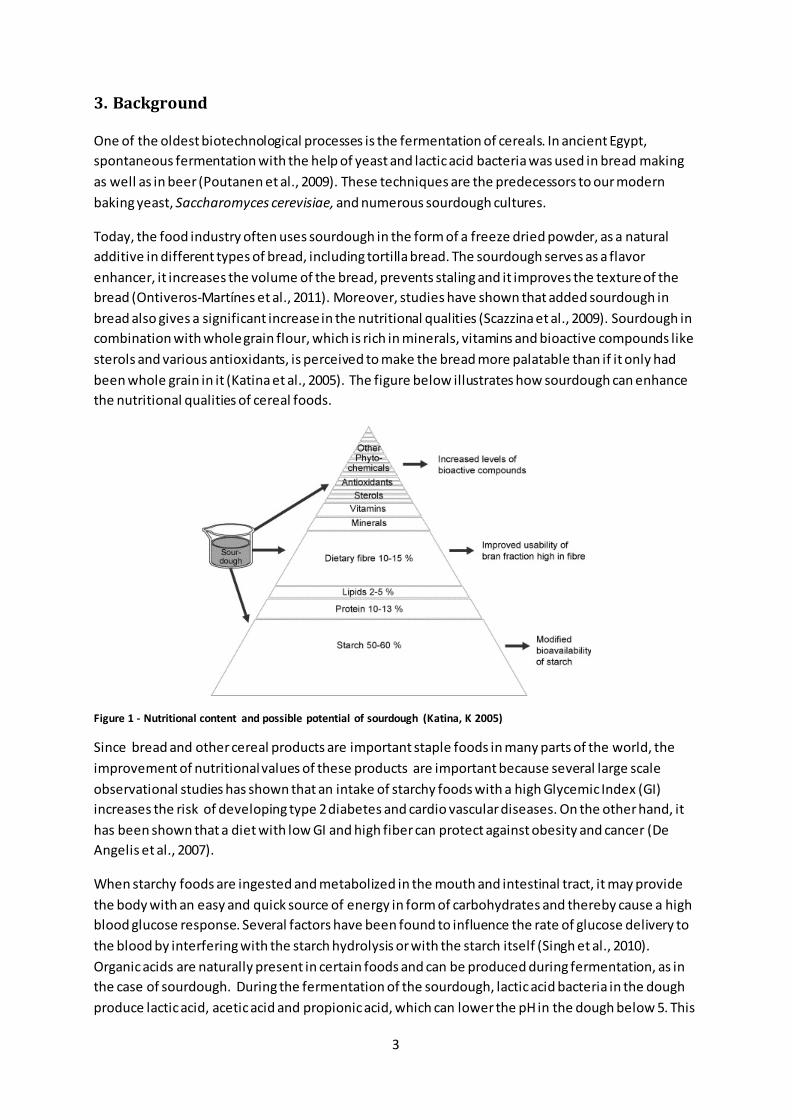
Today, the food industry often uses sourdough in the form of a freeze dried powder, as a natural additive in different types of bread, including tortilla bread. The sourdough serves as a flavor enhancer, it increases the volume of the bread, prevents staling and it improves the texture of the bread (Ontiveros-Martínes et al., 2011). Moreover, studies have shown that added sourdough in bread also gives a significant increase in the nutritional qualities (Scazzina et al., 2009). Sourdough in combination with whole grain flour, which is rich in minerals, vitamins and bioactive compounds like sterols and various antioxidants, is perceived to make the bread more palatable than if it only had been whole grain in it (Katina et al., 2005). The figure below illustrates how sourdough can enhance the nutritional qualities of cereal foods.
Figure 1 - Nutritional content and possible potential of sourdough (Katina, K 2005)
Since bread and other cereal products are important staple foods in many parts of the world, the improvement of nutritional values of these products are important because several large scale observational studies has shown that an intake of starchy foods with a high Glycemic Index (GI) increases the risk of developing type 2 diabetes and cardio vascular diseases. On the other hand, it has been shown that a diet with low GI and high fiber can protect against obesity and cancer (De Angelis et al., 2007).
When starchy foods are ingested and metabolized in the mouth and intestinal tract, it may provide the body with an easy and quick source of energy in form of carbohydrates and thereby cause a high blood glucose response. Several factors have been found to influence the rate of glucose delivery to the blood by interfering with the starch hydrolysis or with the starch itself (Singh et al., 2010). Organic acids are naturally present in certain foods and can be produced during fermentation, as in the case of sourdough. During the fermentation of the sourdough, lactic acid bacteria in the dough produce lactic acid, acetic acid and propionic acid, which can lower the pH in the dough below 5. This
4
change in pH in combination with the presence of the acids themselves can cause a reduction of the starch digestibility which results in a lowered glycemic response, but it can also affect enzymes and the bioavailability of minerals in the bread (Poutanen et al., 2009; Katina et al., 2005).
The way organic acids affect the body can generally be described by two different mechanisms. According to Östman et al. (2002), these mechanisms take place because the acids, especially the lactic acid, lowers the rate of starch hydrolysis and thus contributes to a more slow release of blood glucose. Or it can also be due to the acetic acid and propionic acid’s ability to reduce the gastric emptying rate, i.e. making the food stay in the intestines a longer time and help to make the release of glucose to the blood slower.
Östman also states that starch may undergo retrogradation, when the food is being heated and then cooled. This cause the starch to crystallize and form regions of highly ordered structures that are difficult to hydrolyze by the α-amylase. Sometimes the starch becomes so resistant to hydrolysis that the enzymes are unable to digest it at all. This is called resistant starch (RS). Bread, fermented with sourdough has shown a higher content of RS compared to bread without sourdough (Scazzina et al., 2009).
Addition of different types of flour, like rye or oat flour, in combination with sourdough can also decrease the starch hydrolysis and/or glucose uptake, as well as improve the content of essential nutrients as bioactive compounds and protein (Poutanen et al., 2009; Flander et al., 2011). Even some more unconventional flours can be used, for example black-bean flour. The addition of black-bean flour to maize tortilla has shown to lower the predicted GI-value by 8 points (from 87.97 to 79.76) and the hydrolysis rate by 10 percentage points, compared to a standard maize tortilla. This is according to an in vitro study made by Grajales-Garcia et al. (2012). Also, a higher antioxidant capacity and protein content could be shown.
It is clear that sourdough has a large potential when it comes to improve nutritional values of cereal products, and give positive effects on public health.
5
4. Theory
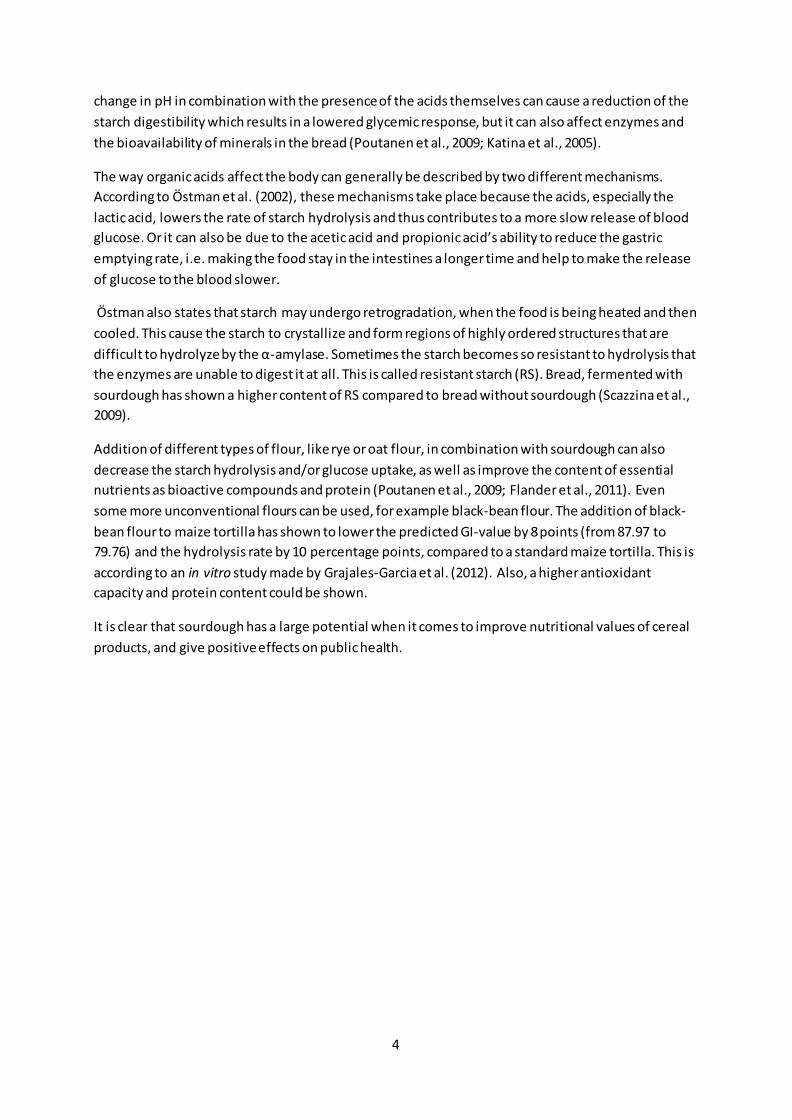
4.1 Starch hydrolysis Starch consists of numerous of D- glucose units made up by the linear amylose and the branched amylopectin polymers. Amylose is connected by α (1→4) glycosidic bonds only, while amylopectin has α (1→4) bonds in the backbone of the polymer as well as α (1→6) glycosidic bonds at the branch points. The images below demonstrate the different polymer structures.
Figure 2 – Amylose Figure 3 – Amylopectin
The starch hydrolysis begins in the mouth by the salivary enzyme, α-amylase. It works efficiently until the food reaches the stomach where the low pH decreases the rate of the enzyme activity. It is not until the food reaches the small intestine, where the pH environment is more favorable to α-amylase, the majority of starch hydrolysis is carried out by the α-amylase provided by the pancreas.
The enzyme breaks α (1→4) glycosidic bonds in the amylose and amylopectin and yields maltose units. However, α-amylase is not able to break α (1→6) glycosidic bonds and, due to steric hindrance, it is not able to break α (1→4) bonds near the branching points of the amylopectin.
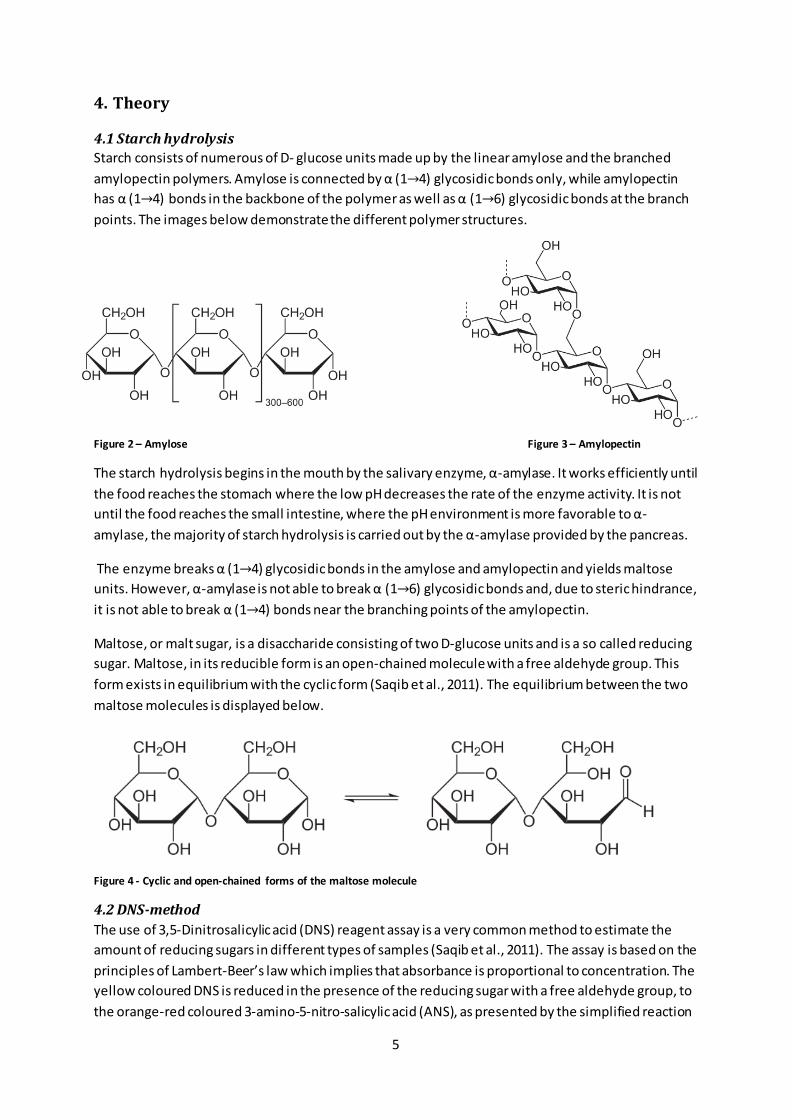
Maltose, or malt sugar, is a disaccharide consisting of two D-glucose units and is a so called reducing sugar. Maltose, in its reducible form is an open-chained molecule with a free aldehyde group. This form exists in equilibrium with the cyclic form (Saqib et al., 2011). The equilibrium between the two maltose molecules is displayed below.
Figure 4 - Cyclic and open-chained forms of the maltose molecule
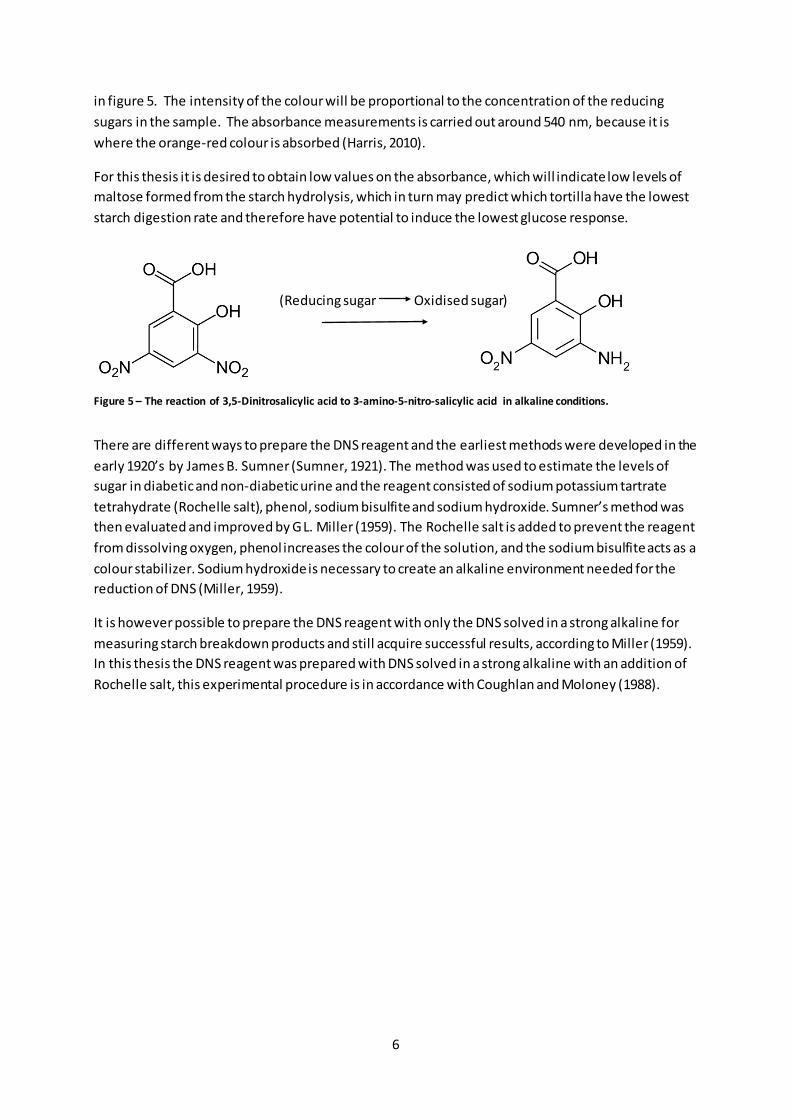
4.2 DNS-method The use of 3,5-Dinitrosalicylic acid (DNS) reagent assay is a very common method to estimate the amount of reducing sugars in different types of samples (Saqib et al., 2011). The assay is based on the principles of Lambert-Beer’s law which implies that absorbance is proportional to concentration. The yellow coloured DNS is reduced in the presence of the reducing sugar with a free aldehyde group, to the orange-red coloured 3-amino-5-nitro-salicylic acid (ANS), as presented by the simplified reaction
6
in figure 5. The intensity of the colour will be proportional to the concentration of the reducing sugars in the sample. The absorbance measurements is carried out around 540 nm, because it is where the orange-red colour is absorbed (Harris, 2010).
For this thesis it is desired to obtain low values on the absorbance, which will indicate low levels of maltose formed from the starch hydrolysis, which in turn may predict which tortilla have the lowest starch digestion rate and therefore have potential to induce the lowest glucose response.
Figure 5 – The reaction of 3,5-Dinitrosalicylic acid to 3-amino-5-nitro-salicylic acid in alkaline conditions.
There are different ways to prepare the DNS reagent and the earliest methods were developed in the early 1920’s by James B. Sumner (Sumner, 1921). The method was used to estimate the levels of sugar in diabetic and non-diabetic urine and the reagent consisted of sodium potassium tartrate tetrahydrate (Rochelle salt), phenol, sodium bisulfite and sodium hydroxide. Sumner’s method was then evaluated and improved by G L. Miller (1959). The Rochelle salt is added to prevent the reagent from dissolving oxygen, phenol increases the colour of the solution, and the sodium bisulfite acts as a colour stabilizer. Sodium hydroxide is necessary to create an alkaline environment needed for the reduction of DNS (Miller, 1959).
It is however possible to prepare the DNS reagent with only the DNS solved in a strong alkaline for measuring starch breakdown products and still acquire successful results, according to Miller (1959). In this thesis the DNS reagent was prepared with DNS solved in a strong alkaline with an addition of Rochelle salt, this experimental procedure is in accordance with Coughlan and Moloney (1988).
(Reducing sugar Oxidised sugar)
7
5. Method
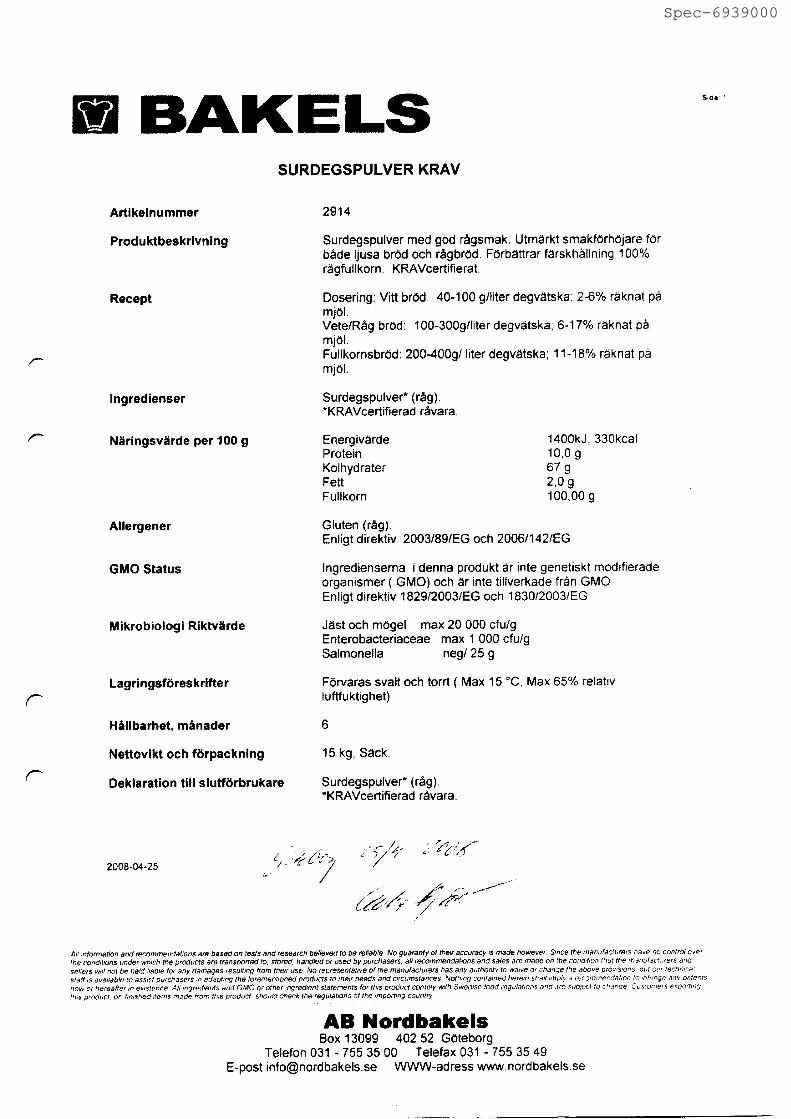
The 14 different sourdough powders used is presented in table 1, in the result section. The wheat, rye and oat flours used for the preparation of the tortillas were provided by Nord Mills (Lantmännen Mills AB, Malmö, Sweden) and product details are presented in appendix II.
5.1 Weighing of the sourdough powder Sourdough powders provided by Santa Maria AB were weighed up in duplicate samples in test-tubes with an amount of 0.5 g respectively. The samples were then diluted with 10 ml of water.
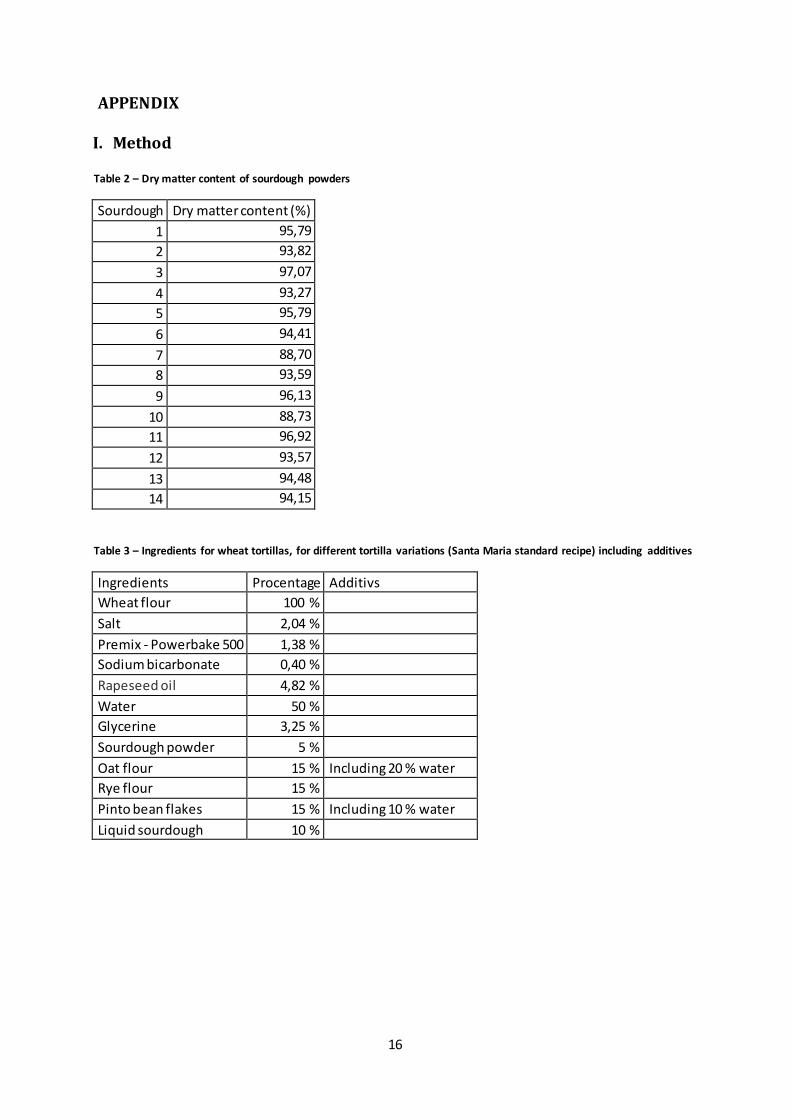
5.2 Dry matter content The dry matter content in the sourdough samples was measured with a moisture balance analyzer (Precisa HA 300). The sample size was 0.5 g and the duration of the analysis varied from 5 min up to 16 min. Complete data is available in appendix I.
5.3 pH measurement To measure the pH of the sourdough samples, 0.5 g of the sourdough powder was weighed up in test-tubes and diluted with 10 ml of water. The tubes were then vortexed and thoroughly mixed during at least 1 h, and the pH measurements were made with a pH meter (Metrohm, 827 pH lab).
5.4 Preparation of sourdough powder solutions for the HPLC analysis The samples prepared in 5.1 were vortexed and mixed well for 1-2 h and centrifuged for 5 min with a speed of 5000 rpm. The solutions were pipetted in aliquots of 0.1 ml in to auto-sample vials and 0.9 ml of water was added. Septum caps were fitted and sealed on the vials.
5.5 Dilution of standard solutions The standard solutions were prepared from lactic-, acetic- and propionic acid. They were all diluted to a concentration of 10 mg/ml. These acids formed the basis for the standard solutions in which equal amounts of all 3 acids were combined. 4 different solutions were prepared with concentrations of 0.01 mg/ml, 0.1 mg/ml, 0.5 mg/ml and 1 mg/ml.
5.6 HPLC procedure An ion-exclusion chromatography method was used for analysing concentration of organic acids in the sourdough powders. The difference in ionic charge (pKa value) between the organic acids will cause them to elute at different times. An acid with a high pKa value will be retained a longer time in the column because it will interfere more with the negatively charged particles in the column than an acid with a lower pKa value. The acids are deprotonated by the mobile phase, sulfuric acid (8 mM) was used in this analysis, and the flow of the mobile phase was 0.8 ml/min.
The apparatus used was made up by a pump (PU-2089 plus, Quaternary Pump) with an approximate pressure of 4.5 MPa and an auto sampler (AS-2057 plus, Intelligent Sampler), both from JASCO, Tokyo, Japan. The column was a 300 x 7.80 mm Rezex column (ROA-Organic Acid H+) from Phenomenex (www.phenomenex.com) and it was used with a column heater, Thermasphere (TS-130) at 65 °C, also from Phenomenex. An UV-VIS detector (SPD-10A, Shimadzu, Kyoto, Japan) detected presence of organic acids at 210 nm.
8
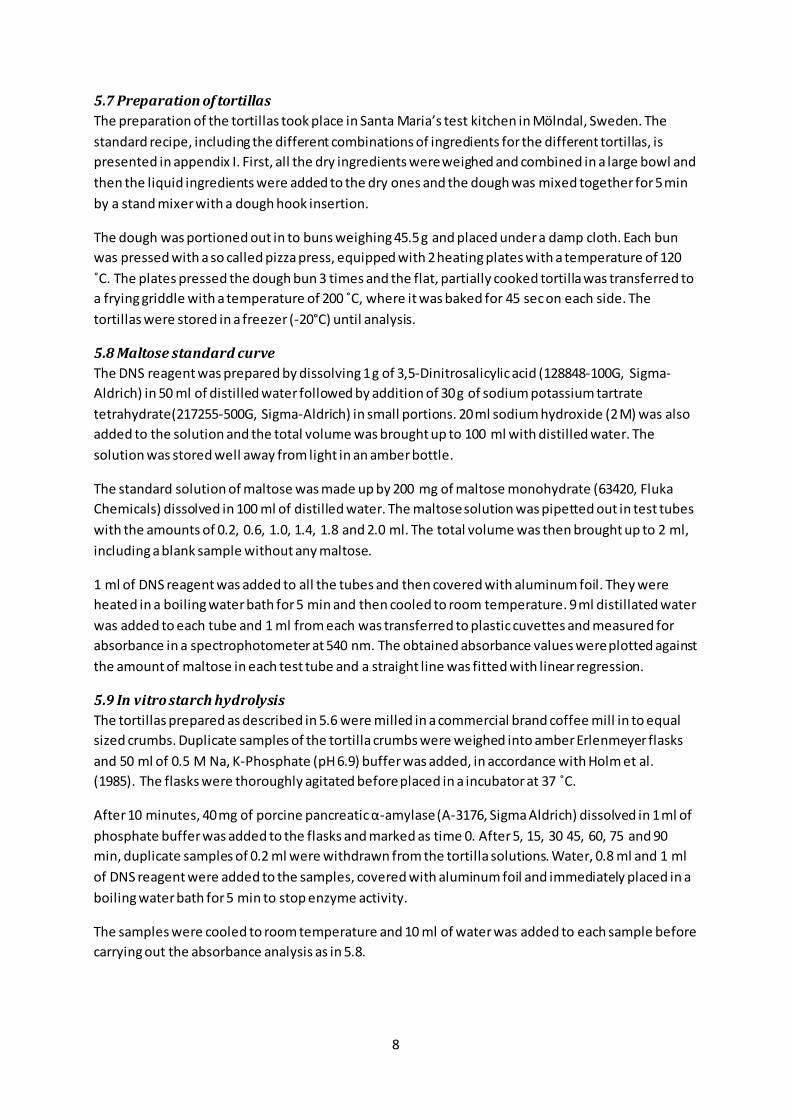
5.7 Preparation of tortillas The preparation of the tortillas took place in Santa Maria’s test kitchen in Mölndal, Sweden. The standard recipe, including the different combinations of ingredients for the different tortillas, is presented in appendix I. First, all the dry ingredients were weighed and combined in a large bowl and then the liquid ingredients were added to the dry ones and the dough was mixed together for 5 min by a stand mixer with a dough hook insertion.
The dough was portioned out in to buns weighing 45.5 g and placed under a damp cloth. Each bun was pressed with a so called pizza press, equipped with 2 heating plates with a temperature of 120 ˚C. The plates pressed the dough bun 3 times and the flat, partially cooked tortilla was transferred to a frying griddle with a temperature of 200 ˚C, where it was baked for 45 sec on each side. The tortillas were stored in a freezer (-20°C) until analysis.
5.8 Maltose standard curve The DNS reagent was prepared by dissolving 1 g of 3,5-Dinitrosalicylic acid (128848-100G, Sigma-Aldrich) in 50 ml of distilled water followed by addition of 30 g of sodium potassium tartrate tetrahydrate(217255-500G, Sigma-Aldrich) in small portions. 20 ml sodium hydroxide (2 M) was also added to the solution and the total volume was brought up to 100 ml with distilled water. The solution was stored well away from light in an amber bottle.
The standard solution of maltose was made up by 200 mg of maltose monohydrate (63420, Fluka Chemicals) dissolved in 100 ml of distilled water. The maltose solution was pipetted out in test tubes with the amounts of 0.2, 0.6, 1.0, 1.4, 1.8 and 2.0 ml. The total volume was then brought up to 2 ml, including a blank sample without any maltose.
1 ml of DNS reagent was added to all the tubes and then covered with aluminum foil. They were heated in a boiling water bath for 5 min and then cooled to room temperature. 9 ml distillated water was added to each tube and 1 ml from each was transferred to plastic cuvettes and measured for absorbance in a spectrophotometer at 540 nm. The obtained absorbance values were plotted against the amount of maltose in each test tube and a straight line was fitted with linear regression.
5.9 In vitro starch hydrolysis The tortillas prepared as described in 5.6 were milled in a commercial brand coffee mill in to equal sized crumbs. Duplicate samples of the tortilla crumbs were weighed into amber Erlenmeyer flasks and 50 ml of 0.5 M Na, K-Phosphate (pH 6.9) buffer was added, in accordance with Holm et al. (1985). The flasks were thoroughly agitated before placed in a incubator at 37 ˚C.
After 10 minutes, 40 mg of porcine pancreatic α-amylase (A-3176, Sigma Aldrich) dissolved in 1 ml of phosphate buffer was added to the flasks and marked as time 0. After 5, 15, 30 45, 60, 75 and 90 min, duplicate samples of 0.2 ml were withdrawn from the tortilla solutions. Water, 0.8 ml and 1 ml of DNS reagent were added to the samples, covered with aluminum foil and immediately placed in a boiling water bath for 5 min to stop enzyme activity.
The samples were cooled to room temperature and 10 ml of water was added to each sample before carrying out the absorbance analysis as in 5.8.
9
6. Results
The sourdough powders used in the analysis are as follows and they will be named according to their specific number. The product specifications are available in appendix II
Table 1 – Type, brand and assigned number of the sourdough powders. Abbreviations used: SM=Santa Maria, PS=Puratos Sapore
Number Sourdough 1 Wheat (M), Böcker 2 Oat, Böcker 3 Wheat, SM 4 Rye organic, PS Traviata 5 Rye, SM-standard 6 Wheat, PS Norma 7 Rye 350, Böcker 8 Bio wheat, Böcker 9 Maize, Böcker
10 Wheat (W200), Böcker 11 Durum, PS Tosca 12 Wheat, PS Nabucco 13 Bio wheat wholegrain, Böcker 14 Wheat, ferm. yeast, PS Rigoretto
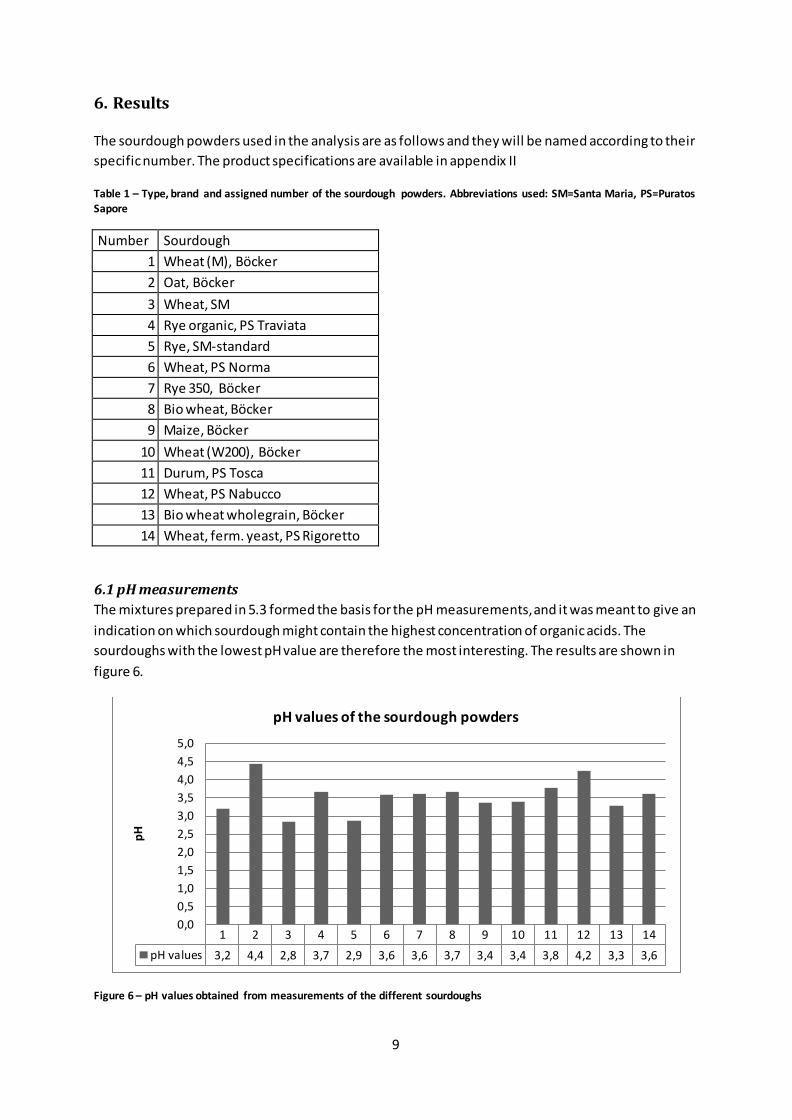
6.1 pH measurements The mixtures prepared in 5.3 formed the basis for the pH measurements, and it was meant to give an indication on which sourdough might contain the highest concentration of organic acids. The sourdoughs with the lowest pH value are therefore the most interesting. The results are shown in figure 6.
Figure 6 – pH values obtained from measurements of the different sourdoughs
1 2 3 4 5 6 7 8 9 10 11 12 13 14pH values 3,2 4,4 2,8 3,7 2,9 3,6 3,6 3,7 3,4 3,4 3,8 4,2 3,3 3,6
0,00,51,01,52,02,53,03,54,04,55,0
pH
pH values of the sourdough powders

10
The lowest pH values (2.8 and 2.9) were found in sourdough powder no. 3 and 5 respectively. Sourdough no. 2 and 12 had the highest pH values (4.4 and 4.2).
6.2 HPLC results The concentration of the organic acids in the sourdough powders was calculated using the standard solutions prepared in 5.5. The correspondence between the peak area and concentration gave the best coefficient of determination (R2) value from the linear regression, compared to the correspondence between the peak height and the concentration. However, the of the acetic and propionic acid concentration was very low or non-detectable and therefore not included in the calculations.
The lactic acid on the other hand, had high, well-separated peaks suitable for concentration determination. The lactic acid standard curve is presented in figure 9 in appendix II.
From the equation in plot 2, it was possible to calculate the concentration of lactic acid in the sourdough by solving the equation for x and taking the measured weight and dilution factor of 200 from 5.1 and 5.2 into consideration. All results are presented in figure 7.
Figure 7 – Average concentration of lactic acid in the sourdough powders
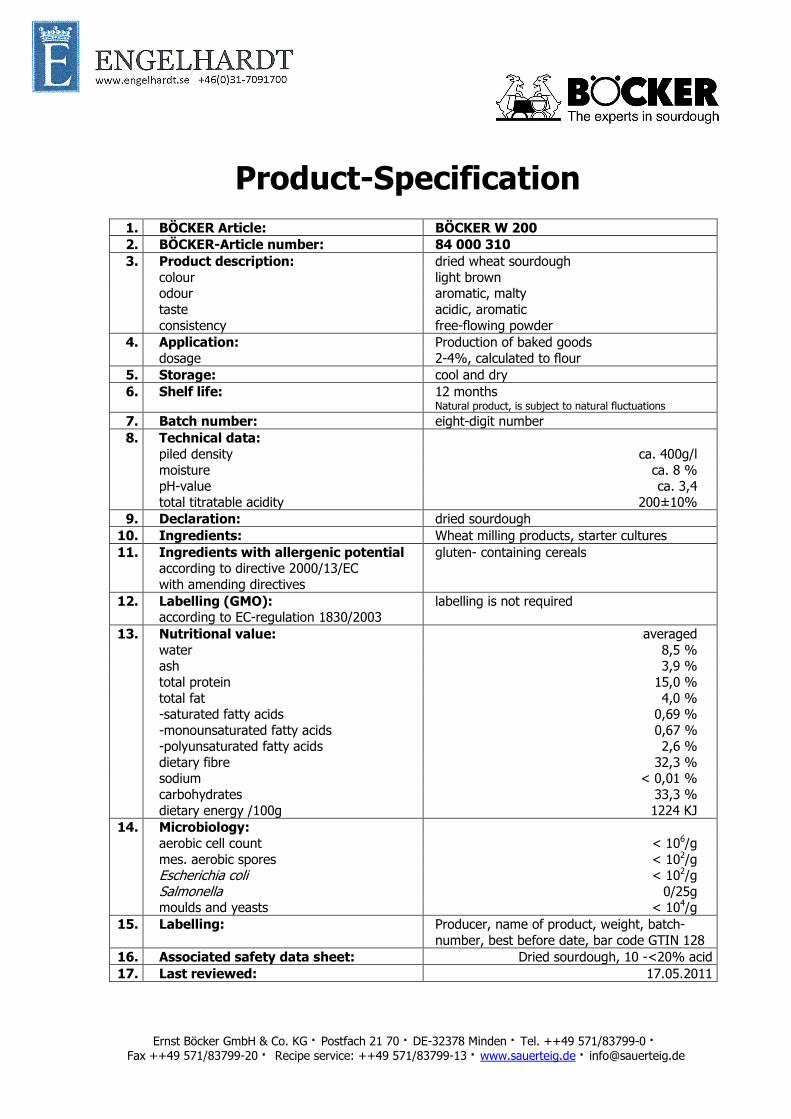
As shown in figure 7, large differences were found in the lactic acid concentrations in the sourdough powders. The two highest concentrations were obtained from sourdough number 5 (Rye, SM- standard) and 10 (Wheat (W200), Böcker) and these two were therefore selected for further evaluation during baking of tortilla bread. The tortilla breads were prepared as in 5.7 and the sourdough powders used will in the following text be referred as SM-standard and W200, respectively.
1 2 3 4 5 6 7 8 9 10 11 12 13 14Concentration 160 138 222 44 252 65 238 58 25 289 27 24 234 57
0
50
100
150
200
250
300
350
Conc
enta
rion
mg/
g so
urdo
ugh
pow
der
Average concentration of lactic acid (mg/g sourdough powder)
11
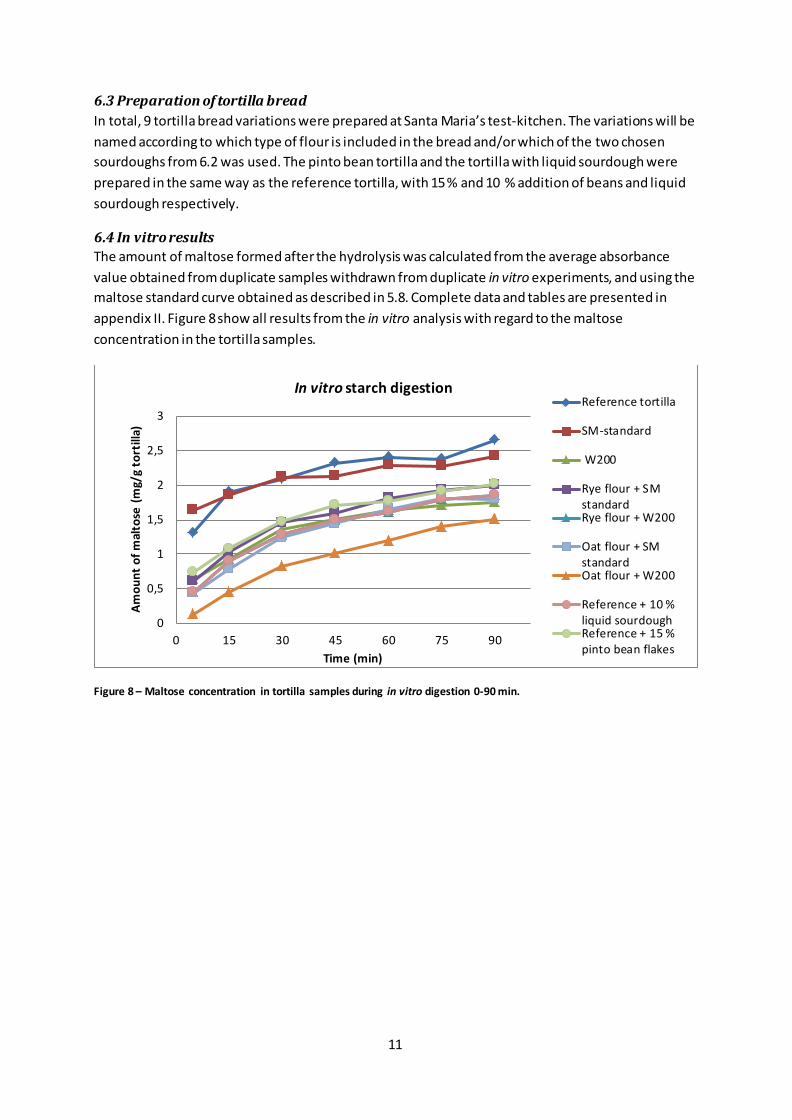
6.3 Preparation of tortilla bread In total, 9 tortilla bread variations were prepared at Santa Maria’s test-kitchen. The variations will be named according to which type of flour is included in the bread and/or which of the two chosen sourdoughs from 6.2 was used. The pinto bean tortilla and the tortilla with liquid sourdough were prepared in the same way as the reference tortilla, with 15 % and 10 % addition of beans and liquid sourdough respectively.
6.4 In vitro results The amount of maltose formed after the hydrolysis was calculated from the average absorbance value obtained from duplicate samples withdrawn from duplicate in vitro experiments, and using the maltose standard curve obtained as described in 5.8. Complete data and tables are presented in appendix II. Figure 8 show all results from the in vitro analysis with regard to the maltose concentration in the tortilla samples.
Figure 8 – Maltose concentration in tortilla samples during in vitro digestion 0-90 min.
0
0,5
1
1,5
2
2,5
3
0 15 30 45 60 75 90
Amou
nt o
f mal
tose
(mg/
g to
rtill
a)
Time (min)
In vitro starch digestion Reference tortilla
SM-standard
W200
Rye flour + SMstandardRye flour + W200
Oat flour + SMstandardOat flour + W200
Reference + 10 %liquid sourdoughReference + 15 %pinto bean flakes
12
7. Discussion
The HPLC analysis of the different sourdough powders showed that the lactic acid concentrations varied markedly between the sourdoughs. Also, significant differences (according to an unpaired t-test, p<0.05) were obtained in the in vitro starch hydrolysis for most of the tortilla variations, except for SM-standard , which did not display significantly different results compared with the from the reference tortilla (at 15, 30, 45, 60 and 75 min). However, the hydrolysis curve for the SM-standard is quite consistent with only small changes in the amount of maltose formed over time. This would, in theory, give a more even blood glucose response than the reference tortilla which is hydrolysed to maltose faster and to a greater extent.
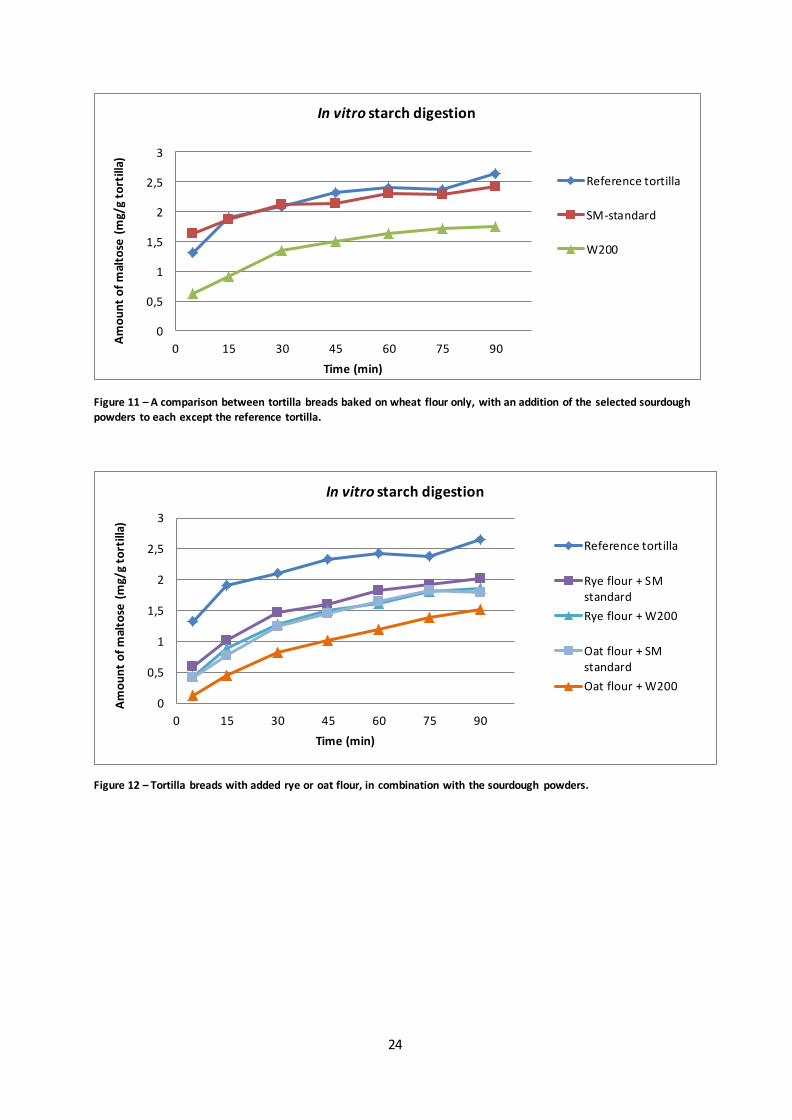
In figure 12 (appendix II) as well as in figure 8, it is apparent that the combination of W200 and oat flour is affecting the starch hydrolysis rate more than the other combinations. Possible reasons for this may be due to the higher protein content in the oat flour, 13 % compared to 10 % for the wheat and rye flour and because W200 had the highest lactic acid concentration. The carbohydrate content for the two sourdoughs also differs considerably, with 33.3 % and 67 % for W200 and SM-standard, respectively. Complete data for the flours and the two sourdough powders are available in appendix II. Oat flour also contains β-glucans, soluble dietary fibers, which has been reported to lower both cholesterol and postprandial glyceamic response by interfering with the starch hydrolysis (Flander et al. 2011).
As shown in figure 13, the addition of rye or oat flour entail a lowering of the starch hydrolysis, but the effect is more pronounced for the tortillas with SM-standard, and the tortilla with rye flour in combination with W200 was not significantly different from the tortilla combination made of only wheat flour and W200. This fact makes the markedly different result from the oat flour combined with W200 even more interesting.
The tortillas made from liquid sourdough and pinto bean flakes, more clearly displayed in figure 14 (appendix II), had very similar curves, although the liquid sourdough was significantly different (p<0.05) from the pinto bean tortilla, except at 60 min. The similarity may indicate that the low carbohydrate and relatively high protein content (7 %) of the pinto bean flakes can induce similar effects on the starch hydrolysis.
13
8. Concluding Remarks
The results and discussion above can be summarized in a few concluding points:
• The concentration of lactic acid differs within a wide range between the different sourdough powders.
• Addition of sourdough lowered the starch hydrolysis rate, in particular when using the wheat sourdough powder W200.
• Addition of rye and oat flour to the tortillas, in combination with sourdough powder, entailed a further lowering of the hydrolysis rate.
• The combination of W200 and oat flour presented the most promising result. • The pinto bean tortilla and the tortilla made from liquid sourdough displayed quite similar
results despite their different compositions. • The combination of sourdough and oat flour seems to be a possible mean for design of a
more healthy wheat tortilla.
14
9. Future perspectives
There are several ways to proceed from this thesis and a good place to start would be to carry out a more extensive in vitro analysis and include other types of enzymes, for example pepsin, to be able to assess more accurately how different levels of protein influence starch hydrolysis. It would be interesting to include a larger variety of sourdough powders, to be able to evaluate the mechanisms behind the lowered starch hydrolysis rate. These analyses should be made in combination with a total starch analysis, in order to determine the total amount of starch in each sample, and therefore obtaining more comparable results from the in vitro analysis.
A total starch analysis would also give a value on the amount of resistant starch (RS) available in the tortillas, and since the European Food Safety Authority (EFSA) has approved the health claim that carbohydrate containing foods with at least 14 % RS can be considered to reduce glyceamic response. This could be used for labeling products containing RS, to inform customers about possible health benefits.
An exciting tortilla combination would be to combine the pinto bean flakes with a sourdough powder and see how it would affect the starch hydrolysis rate. Also, it would be possible to add lactic acid on its own in the tortillas and find out if this has any effect.
Another important aspect is marketability of the finished product where taste and costumer receipt is crucial. Therefore, it would be important to perform sensorial evaluations on the various types of tortillas.
15
References
Coughlan, M.P and Moloney, A. P. (1988) Isolation of 1,4-β-d-glucan 4-glucanohydrolases of Talaromyces emersonii .Methods in enzymology, vol. 160, p. 365.
De Angelis, M et al. (2007) Use of sourdough lactobacilli and oat fibre to decrease the glycaemic index of white wheat bread. British Journal of nutrition, vol. 98, pp. 1196-1205.
Flander, L et al. (2011) Effects of wheat sourdough process on the quality of mixed oat-wheat bread. LWT – Food Science and Technology, vol. 44, issue 3, pp. 656–664.
Grajales-García, E. M et al. (2012) Chemical Composition, Starch Digestibility and Antioxidant Capacity of Tortilla Made with a Blend of Quality Protein Maize and Black Bean. International Journal of Molecular Sciences, vol. 13 issue 1, pp. 286-301.
Harris, D.C (2010) Quantitative Chemical Analysis. Eighth edition. Basingstoke, England: W. H Freeman and Company.
Holm, J et al. (1985) Starch Availability In Vitro and In Vivo After Flaking, Steam-cooking and Popping of Wheat. Journal of Cereal Science, vol. 3, pp. 193-206.
Katina, K et al. (2005) Potential of sourdough for healthier cereal products. Trends in Food Science & Technology, vol. 16, issues 1-3, pp. 104-112.
Miller, G.L. (1959) Use of dinitrosalicylic acid reagent for determination of reducing sugar. Analytical Chemistry, vol. 31, pp. 426-428.
Poutanen, K, Flander, L and Katina, K. (2009) Sourdough and cereal fermentation in a nutritional perspective. Food Microbiology, vol. 26, pp. 693-699.
Saqib, A. A. N and Whitney, P. J. (2009) Differential behaviour of the dinitrosalicylic acid (DNS) reagent towards mono- and di-saccharide sugars. Biomass and Bioenergy, vol. 35, issue 11, pp. 4748-4750.
Scazzina, F et al. (2009) Sourdough bread: Starch digestibility and postprandial glycemic response. Journal of Cereal Science, vol. 49, pp. 419-421.
Singh, J, Dartois, J and Lovedeep, K. (2010) Starch digestibility in food matrix: a review. Trends in Food Science & Technology, vol. 21, pp. 168-180.
Sumner, J.B. (1921) Dinitrosalicylic acid: a reagent for the estimation of sugar in normal and diabetic urine. The Journal of Biological Chemistry, vol. 47, issue 1, pp. 5-9.
Östman, E. M et al. (2002) On the Effect of Lactic Acid on Blood Glucose and Insulin Responses to Cereal Products: Mechanistic Studies in Healthy Subjects and In Vitro. Journal of Cereal Science, vol. 36, pp. 339-346.
16
APPENDIX
I. Method
Table 2 – Dry matter content of sourdough powders
Sourdough Dry matter content (%) 1 95,79 2 93,82 3 97,07 4 93,27 5 95,79 6 94,41 7 88,70 8 93,59 9 96,13
10 88,73 11 96,92 12 93,57 13 94,48 14 94,15
Table 3 – Ingredients for wheat tortillas, for different tortilla variations (Santa Maria standard recipe) including additives
Ingredients Procentage Additivs Wheat flour 100 % Salt 2,04 % Premix - Powerbake 500 1,38 % Sodium bicarbonate 0,40 % Rapeseed oil 4,82 % Water 50 % Glycerine 3,25 % Sourdough powder 5 % Oat flour 15 % Including 20 % water Rye flour 15 % Pinto bean flakes 15 % Including 10 % water Liquid sourdough 10 %

17
II. Results
Spec-6939000
Ernst Böcker GmbH & Co. KG · Postfach 21 70 · DE-32378 Minden · Tel. ++49 571/83799-0 · Fax ++49 571/83799-20 · Recipe service: ++49 571/83799-13 · www.sauerteig.de · [email protected]
Product-Specification 1. BÖCKER Article: BÖCKER W 200 2. BÖCKER-Article number: 84 000 310 3. Product description: dried wheat sourdough
colour light brown odour aromatic, malty
taste acidic, aromatic
consistency free-flowing powder
4. Application: Production of baked goods
dosage 2-4%, calculated to flour
5. Storage: cool and dry
6. Shelf life: 12 months Natural product, is subject to natural fluctuations
7. Batch number: eight-digit number
8. Technical data:
piled density ca. 400g/l
moisture ca. 8 % pH-value ca. 3,4
total titratable acidity 200±10%
9. Declaration: dried sourdough
10. Ingredients: Wheat milling products, starter cultures
11. Ingredients with allergenic potential according to directive 2000/13/EC
with amending directives
gluten- containing cereals
12. Labelling (GMO): according to EC-regulation 1830/2003
labelling is not required
13. Nutritional value: averaged
water 8,5 % ash 3,9 %
total protein 15,0 %
total fat -saturated fatty acids
-monounsaturated fatty acids -polyunsaturated fatty acids
4,0 % 0,69 %
0,67 % 2,6 %
dietary fibre 32,3 % sodium < 0,01 %
carbohydrates 33,3 %
dietary energy /100g 1224 KJ
14. Microbiology:
aerobic cell count < 106/g
mes. aerobic spores < 102/g Escherichia coli < 102/g
Salmonella 0/25g moulds and yeasts < 104/g
15. Labelling: Producer, name of product, weight, batch-
number, best before date, bar code GTIN 128
16. Associated safety data sheet: Dried sourdough, 10 -<20% acid
17. Last reviewed: 17.05.2011
Utskriftsdatum: 2010-05-19 Utgåva: 13
Bagerivete SM
ARTNR FÖRPACKNING EAN-KOD160234 Lös vikt
INGREDIENSERvetemjöl, vetegluten, mjölbehandlingsmedel (enzym)
ÅTERDEKLARATIONvetemjöl, vetegluten
EGENSKAPERVetemjöl med tämligen hög proteinhalt. Ger hög degtolerans och bra brödvolym.Askorbinsyra ej tillsatt.
ANVÄNDNINGSOMRÅDEKaffebröd, wienerbröd, smördeg, vitt matbröd, baguetter, frukostbröd.
FÖRVARINGFörvaras torrt, ej över normal rumstemperatur och avskilt från varor med stark lukt.Hållbarhet 9 månader. Leverans till kund tidigast 7 dygn efter malning.
TULLDEKLARATIONProduktkod 1101 00 15 9100Aska 513 m
g
NÄRINGSVÄRDE genomsnitt för 100 g SIKTANALYS riktvärde tolerans
Energivärde 1450 kJ > 400 µm 0 % - 340 kcal > 150 µm 8 % -
Protein 10 g > 112 µm 26 % - Kolhydrat 70 g > 85 µm 18 % - varav sockerarter 0,3 g < 85 µm 48 % - Fett 2 g varav mättat 0,3 gFiber 2,5 gNatrium 0 g
KEMISK/FYSIKALISK ANALYS riktvärde tolerans
Vattenhalt (AACC 44-15A) 14,5 % 14,0 - 15,0Protein (Kjeldahl, N*6,25) 12,0 % av ts 11,4 - 12,6
(Kjeldahl, N*5,7) 11,0 % av ts 10,4 - 11,5Askhalt (ICC 104/1) 0,60 % av ts 0,55 - 0,65Fiber (AOAC 991.43) 3,1 % av tsFalltal (ICC 107) 320 sek. 290 - 350
Vattenabsorption (ICC115) 55,0 % -
MIKROBIOLOGI (log cfu/g)
riktvärde tolerans SPÅRÄMNENi enlighet med gällande förordningar
metod standard
Totalantal bakterier < 5,0 < 5,7 Tungmetall Bly NMKL161 mod < 0,2 mg/kgE. coli < 1,0 < 1,7 Cadmium NMKL 139 < 0,1 mg/kgMögelsvampar < 3,0 < 3,7 Pesticider M914/M915 Under gränsvärdenSalmonella i 25g neg neg Mykotoxin Ochratoxin A NMKL 143 < 3 µg/kg
Utskriftsdatum: 2012-05-22 Utgåva: 6
Rågmjöl KRAV
ARTNR FÖRPACKNING EAN-KOD140554 Säck 20 kg 5701029223580
INGREDIENSERfullkornsmjöl av råg KRAV, maltmjöl av korn
ÅTERDEKLARATIONfullkornsmjöl av råg KRAV, maltmjöl av korn
EGENSKAPERMjöl från ekologiskt odlad råg. Produkten är godkänd av KRAV.
ANVÄNDNINGSOMRÅDEFör bakning av rågbröd och inblandning i vetedegar.
FÖRVARINGFörvaras torrt, ej över normal rumstemperatur och avskilt från varor med stark lukt.Hållbarhet 9 månader.
TULLDEKLARATIONProduktkod 1102 10 00 9700Aska 1548 m
g
NÄRINGSVÄRDE genomsnitt för 100 g
Energivärde 1350 kJ320 kcal
Protein 10 gKolhydrat 57 g varav sockerarter 2 gFett 2,5 g varav mättat 0,3 gFiber 15 gNatrium 0 g
KEMISK/FYSIKALISK ANALYS riktvärde tolerans
Vattenhalt (AACC 44-15A) 14,0 % 13,5 - 14,5Protein (Kjeldahl, N*6,25) 11,6 % av ts -
(Kjeldahl, N*5,7) 10,6 % av ts -Askhalt (ICC 104/1) 1,80 % av ts 1,60 - 2,00Fiber (AOAC 991.43) 17,0 % av tsFalltal (ICC 107) 250 sek. 200 - 300
MIKROBIOLOGI (log cfu/g)
riktvärde tolerans SPÅRÄMNENi enlighet med gällande förordningar
metod standard
Totalantal bakterier < 5,0 < 6,0 Tungmetall Bly NMKL161 mod < 0,2 mg/kgE. coli < 1,0 < 2,0 Cadmium NMKL 139 < 0,1 mg/kgMögelsvampar < 3,0 < 4,0 Pesticider M914/M915 Under gränsvärdenSalmonella i 25g neg neg Mykotoxin Ochratoxin A NMKL 143 < 3 µg/kgTråddragare < 0,7 < 1,3 Fusariumtoxiner LC DON < 750 µg/kg
ZEA < 75 µg/kg
Utskriftsdatum: 2011-05-11 Utgåva: 2
Havremjöl, KRAV
ARTNR FÖRPACKNING EAN-KOD
TULLDEKLARATION
Produktkod 1102 90 30 9100
Aska 1890 mg
140218 Säck 20 kg 07310130350009
INGREDIENSER
havremjöl KRAV
ÅTERDEKLARATION
havremjöl KRAV
EGENSKAPER
Autoklaverad, torkad och skalad ekologisk havre som malts till mjöl.
ANVÄNDNINGSOMRÅDE
Som inblandningsmjöl vid bakning av ekologiska limpor, hålkakor och bräck.
FÖRVARING
Förvaras torrt, ej över normal rumstemperatur och avskilt från varor med stark lukt. Hållbarhet 6 månader.
NÄRINGSVÄRDE genomsnitt för 100 g
SIKTANALYS riktvärde tolerans Energivärde 1550 kJ
> 710 µm < 1 % - 1
370 kcal
> 450 µm < 25 % - Protein 13 g
Kolhydrat 59 g
varav sockerarter 1 g
Fett 7 g
varav mättat 1,5 g
Fiber 9,5 g
Natrium g
KEMISK/FYSIKALISK ANALYS riktvärde
tolerans
Vattenhalt (AACC 44-15A) <13,0
% - 13,0 Protein (Kjeldahl, N*6,25) 14,0
% av ts -
(Kjeldahl, N*5,7) 12,8
% av ts - Askhalt (ICC 104/1) 2,10
% av ts - Fiber (AOAC 991.43) 10,8
% av ts

23
Figure 9 – Standard curve for lactic acid concentration with the equation from the linear regression and R2 value.
Figure 10 – Standard curve for maltose, including the linear regression equation and R2 value.
y = 557198x R² = 0.9994
0
100000
200000
300000
400000
500000
600000
0 0,5 1 1,5
Peak
are
a
Concentration (mg/ml)
Standard curve - Lactic acid
y = 0,348x R² = 0,999
0
0,2
0,4
0,6
0,8
1
1,2
1,4
1,6
0 0,5 1 1,5 2 2,5 3 3,5 4 4,5
Abro
banc
e (n
m)
Mg of maltose/g tortilla
Maltose standard curve
24
Figure 11 – A comparison between tortilla breads baked on wheat flour only, with an addition of the selected sourdough powders to each except the reference tortilla.
Figure 12 – Tortilla breads with added rye or oat flour, in combination with the sourdough powders.
0
0,5
1
1,5
2
2,5
3
0 15 30 45 60 75 90
Amou
nt o
f mal
tose
(mg/
g to
rtill
a)
Time (min)
In vitro starch digestion
Reference tortilla
SM-standard
W200
0
0,5
1
1,5
2
2,5
3
0 15 30 45 60 75 90
Amou
nt o
f mal
tose
(mg/
g to
rtill
a)
Time (min)
In vitro starch digestion
Reference tortilla
Rye flour + SMstandardRye flour + W200
Oat flour + SMstandardOat flour + W200

25
Figure 13 – A plot comparing the in vitro starch hydrolysis for the tortillas with added rye or oat flour to tortillas with only sourdough powders and wheat flour.
Figure 14 – This plot displays the lowering of the formed amount of maltose when adding liquid sourdough or pinto bean flakes to the reference tortilla.
0
0,5
1
1,5
2
2,5
3
0 15 30 45 60 75 90
Amou
nt o
f mal
tose
(mg/
g to
rtill
a)
Time (minutes)
In vitro starch digestion
Reference tortilla
SM-standard
W200
Rye flour + SMstandardRye flour + W200
Oat flour + SMstandard
0
0,5
1
1,5
2
2,5
3
0 15 30 45 60 75 90Amou
nt o
f mal
tose
(mg/
g to
rtill
a)
Time (min)
In vitro starch digestion
Reference tortilla
Reference + 10 %liquid sourdoughReference + 15 %pinto bean flakes
26
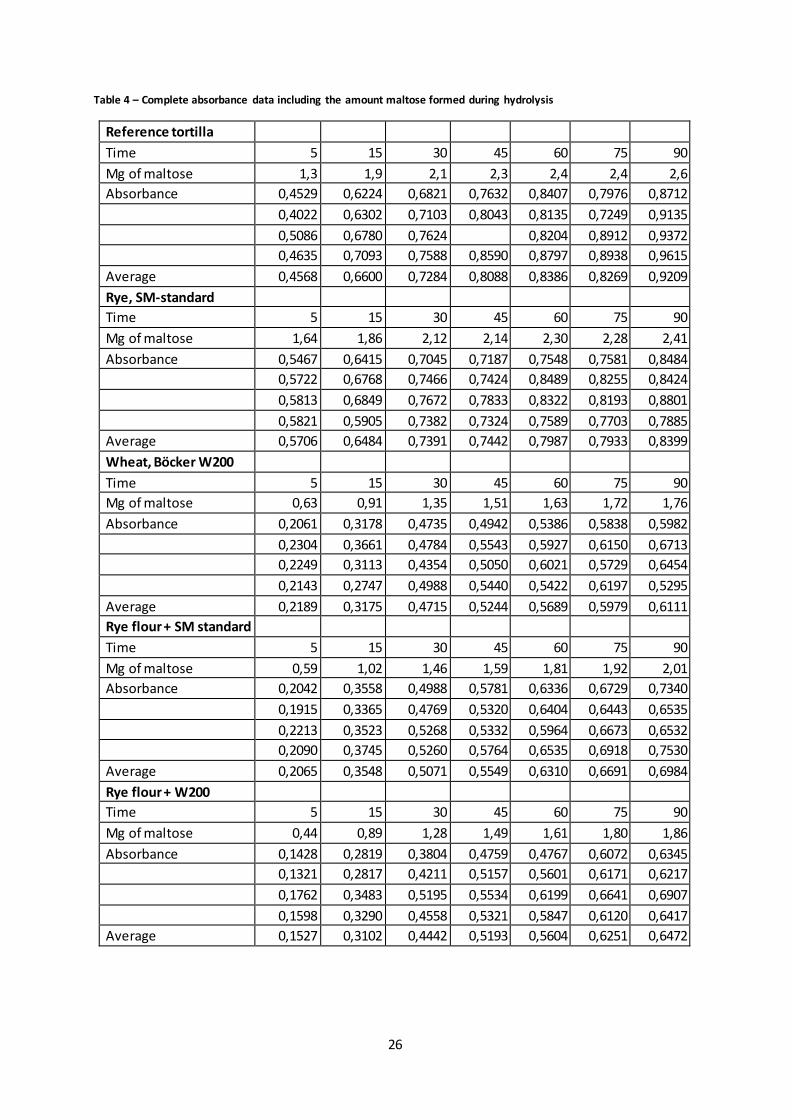
Table 4 – Complete absorbance data including the amount maltose formed during hydrolysis
Reference tortilla Time 5 15 30 45 60 75 90 Mg of maltose 1,3 1,9 2,1 2,3 2,4 2,4 2,6 Absorbance 0,4529 0,6224 0,6821 0,7632 0,8407 0,7976 0,8712 0,4022 0,6302 0,7103 0,8043 0,8135 0,7249 0,9135 0,5086 0,6780 0,7624 0,8204 0,8912 0,9372 0,4635 0,7093 0,7588 0,8590 0,8797 0,8938 0,9615 Average 0,4568 0,6600 0,7284 0,8088 0,8386 0,8269 0,9209 Rye, SM-standard Time 5 15 30 45 60 75 90 Mg of maltose 1,64 1,86 2,12 2,14 2,30 2,28 2,41 Absorbance 0,5467 0,6415 0,7045 0,7187 0,7548 0,7581 0,8484 0,5722 0,6768 0,7466 0,7424 0,8489 0,8255 0,8424 0,5813 0,6849 0,7672 0,7833 0,8322 0,8193 0,8801 0,5821 0,5905 0,7382 0,7324 0,7589 0,7703 0,7885 Average 0,5706 0,6484 0,7391 0,7442 0,7987 0,7933 0,8399 Wheat, Böcker W200 Time 5 15 30 45 60 75 90 Mg of maltose 0,63 0,91 1,35 1,51 1,63 1,72 1,76 Absorbance 0,2061 0,3178 0,4735 0,4942 0,5386 0,5838 0,5982 0,2304 0,3661 0,4784 0,5543 0,5927 0,6150 0,6713 0,2249 0,3113 0,4354 0,5050 0,6021 0,5729 0,6454 0,2143 0,2747 0,4988 0,5440 0,5422 0,6197 0,5295 Average 0,2189 0,3175 0,4715 0,5244 0,5689 0,5979 0,6111 Rye flour + SM standard Time 5 15 30 45 60 75 90 Mg of maltose 0,59 1,02 1,46 1,59 1,81 1,92 2,01 Absorbance 0,2042 0,3558 0,4988 0,5781 0,6336 0,6729 0,7340 0,1915 0,3365 0,4769 0,5320 0,6404 0,6443 0,6535 0,2213 0,3523 0,5268 0,5332 0,5964 0,6673 0,6532 0,2090 0,3745 0,5260 0,5764 0,6535 0,6918 0,7530 Average 0,2065 0,3548 0,5071 0,5549 0,6310 0,6691 0,6984 Rye flour + W200 Time 5 15 30 45 60 75 90 Mg of maltose 0,44 0,89 1,28 1,49 1,61 1,80 1,86 Absorbance 0,1428 0,2819 0,3804 0,4759 0,4767 0,6072 0,6345 0,1321 0,2817 0,4211 0,5157 0,5601 0,6171 0,6217 0,1762 0,3483 0,5195 0,5534 0,6199 0,6641 0,6907 0,1598 0,3290 0,4558 0,5321 0,5847 0,6120 0,6417 Average 0,1527 0,3102 0,4442 0,5193 0,5604 0,6251 0,6472
27
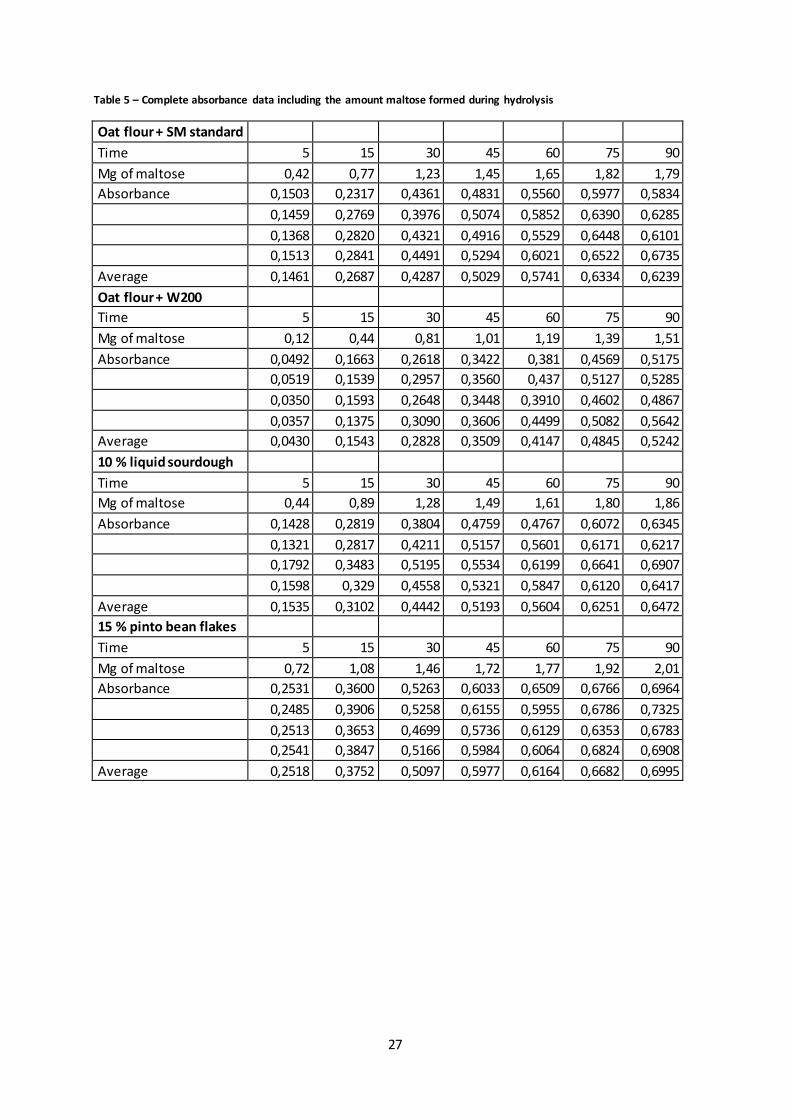
Table 5 – Complete absorbance data including the amount maltose formed during hydrolysis
Oat flour + SM standard Time 5 15 30 45 60 75 90 Mg of maltose 0,42 0,77 1,23 1,45 1,65 1,82 1,79 Absorbance 0,1503 0,2317 0,4361 0,4831 0,5560 0,5977 0,5834 0,1459 0,2769 0,3976 0,5074 0,5852 0,6390 0,6285 0,1368 0,2820 0,4321 0,4916 0,5529 0,6448 0,6101 0,1513 0,2841 0,4491 0,5294 0,6021 0,6522 0,6735 Average 0,1461 0,2687 0,4287 0,5029 0,5741 0,6334 0,6239 Oat flour + W200 Time 5 15 30 45 60 75 90 Mg of maltose 0,12 0,44 0,81 1,01 1,19 1,39 1,51 Absorbance 0,0492 0,1663 0,2618 0,3422 0,381 0,4569 0,5175 0,0519 0,1539 0,2957 0,3560 0,437 0,5127 0,5285 0,0350 0,1593 0,2648 0,3448 0,3910 0,4602 0,4867 0,0357 0,1375 0,3090 0,3606 0,4499 0,5082 0,5642 Average 0,0430 0,1543 0,2828 0,3509 0,4147 0,4845 0,5242 10 % liquid sourdough Time 5 15 30 45 60 75 90 Mg of maltose 0,44 0,89 1,28 1,49 1,61 1,80 1,86 Absorbance 0,1428 0,2819 0,3804 0,4759 0,4767 0,6072 0,6345 0,1321 0,2817 0,4211 0,5157 0,5601 0,6171 0,6217 0,1792 0,3483 0,5195 0,5534 0,6199 0,6641 0,6907 0,1598 0,329 0,4558 0,5321 0,5847 0,6120 0,6417 Average 0,1535 0,3102 0,4442 0,5193 0,5604 0,6251 0,6472 15 % pinto bean flakes Time 5 15 30 45 60 75 90 Mg of maltose 0,72 1,08 1,46 1,72 1,77 1,92 2,01 Absorbance 0,2531 0,3600 0,5263 0,6033 0,6509 0,6766 0,6964 0,2485 0,3906 0,5258 0,6155 0,5955 0,6786 0,7325 0,2513 0,3653 0,4699 0,5736 0,6129 0,6353 0,6783 0,2541 0,3847 0,5166 0,5984 0,6064 0,6824 0,6908 Average 0,2518 0,3752 0,5097 0,5977 0,6164 0,6682 0,6995