Embed Size (px)
Citation preview
Dialysis Facility Compare & The New Star Ratings
Special Open Door Forum
Coming Soon: Star Ratings on
Dialysis Facility Compare Monday, October 6, 2014
2:00 pm – 3:30 pm ET
Presenters
2
In order of appearance: • Elena Balovlenkov (CMS) • Christopher Harvey (UM-KECC) • Kate Goodrich (CMS) • Judy Hibbard (U. of Oregon) • Christine Bechtel (Bechtel Health) • Kathy Day (Consumer Union) • William Dant (Patient Subject Matter Expert)

Agenda
3
• Introduction (Elena Balovlenkov) • Star Rating Methodology (Christopher Harvey) • What We Have Learned from Stakeholders
(Kate Goodrich) • Star Ratings and Consumers (Judy Hibbard,
Christine Bechtel, Kathy Day, William Dant) • Question and Answer
Introduction
Elena Balovlenkov (CMS)
4
Why Star Ratings?
5
• National call for increased transparency and wider use of publicly reported data on health care quality – National Quality Strategy – Affordable Care Act – Obama Administration’s Digital Government
Strategy

The Compare Websites
6
• Official CMS source for information on health care provider quality
• Quality measures based on established scientific standards of rigor and accuracy
• Websites for 5 different health care settings: – Nursing Home Compare (1999) – Dialysis Facility Compare (2001) – Home Health Compare (2005) – Hospital Compare (2005) – Physician Compare (2010)

Compare Website Star Ratings
7
• Currently reported as part of: – Nursing Home Compare – Medicare Plan Finder – Physician Compare (for certain group practices)
• Future Releases: – Dialysis Facility Compare (January 2015) – Hospital Compare (CAHPS results only, April 2015) – Home Health Compare (July 2015)

Star Ratings: What Do They Mean?
8
• Facilities can earn between one and five stars • The more stars a facility has, the higher the
quality compared to other facilities and the higher the quality in relation to the current national average
• A rating of 3 stars reflects a facility providing a quality of care equal to the national average
Star Ratings and Consumers
9
• Provides an easily recognizable way to compare facilities
• Offers additional information that consumers can use to make better informed decisions along with: – Visiting the facility and asking questions – Talking with a doctor – Other quality measures

What to Remember When Comparing Dialysis Facilities
10
• Star ratings use quality information reported on the DFC website
• Star ratings are an estimate of the quality of clinical care, not of patient satisfaction
• Star ratings compare one facility to all the others – For example, one star does not necessarily mean that a facility
provides poor care, only that the facility rated in the bottom 10% on the DFC measures compared to all the others
• Star ratings should be used in combination with other information to choose facilities
Star Rating Methodology
Christopher Harvey (UM-KECC)
11

Goals and Meaning of Stars
12
• Score each facility on a scale 1-5 based on the DFC measures
• The scores are based on relative rankings, compared to the national average
• Interpretations 1: much below average 2: below average 3: average 4: above average 5: much above average
• Where “average” refers to national average facility performance
Summary of Rating Methodology
13
• Measure Scoring: Each measure value for a facility is scored from 1-100 based on national ranks
• Measure Grouping: Related measures were grouped into domains by using an analytic technique called factor analysis
• Facility Scoring: Create domain scores by averaging measure scores in each domain and create the final score by averaging the domain scores
• Star Rating: Assign star ratings based on the final score
DFC Quality Measures Used
14
DFC Quality Measures used in calculation of star ratings: • Standardized Outcome Domain
– Standardized Mortality Ratio (SMR) – Standardized Hospitalization Ratio (SHR) – Standardized Transfusion Ratio (STrR)
• Other Outcomes Domain 1 – Percentage of adult dialysis patients who received treatment
through arteriovenous fistula – Percentage of adult patients who had a catheter left in vein
longer than 90 days for their regular hemodialysis treatment

DFC Quality Measures Used
15
DFC Quality Measures used in calculation of star ratings:
Other Outcomes Domain 2 • Dialysis Adequacy
– Percentage of adult hemodialysis (HD) patients who had enough wastes removed from their blood during dialysis
– Percentage of pediatric hemodialysis (HD) patients who had enough wastes removed from their blood during dialysis
– Percentage of adult peritoneal dialysis (PD) patients who had enough wastes removed from their blood during dialysis
• Percentage of adult dialysis patients who had hypercalcemia NOTE: URR and Hemoglobin measures currently reported on DFC were not included in the star rating calculation because they are topped out (national averages are 99% and < 1% respectively)

Assignment of Star Ratings
16
• Star ratings are assigned according to final scores as follows: – Facilities with top 10% final scores are given a rating of 5
stars – Facilities with the next 20% of highest final scores are
given a rating of 4 stars – Facilities within the middle 40% of final scores are given a
rating of 3 stars – Facilities with the next 20% lowest of final scores are given
a rating of 2 stars – Facilities with bottom 10% final scores are given a rating of
1 star
Star Ratings Reflect Differences in Quality of Care
17
• On average, measure scores improve with a higher star rating, meaning facilities that perform better on individual measures tend to perform better overall
• Final scores were significantly different across star rating categories. This indicates that star ratings reflect true differences in the quality of care received – i.e., 4-star facilities are better than 3-star facilities, and 5-
star facilities are better than 4-star facilities

What We Have Learned from Stakeholders
Kate Goodrich(CMS)
18

Stakeholder Input
19
• Presented star rating methodology on July National Provider Call (NPC) with Q&As
• Posted responses to all comments received since the NPC
• Sought feedback from the Consumer Purchaser Alliance and ESRD patients through focus group calls
Answering Three Frequently Asked Questions about DFC Star Ratings
20
We would like to take this opportunity to address three questions that are frequently asked

Question #1
21
Does the star rating system use a “forced” bell curve methodology that will distort facility performance?
CMS Reply: • The scoring approach is a valid method that combines
measures with different scales and distributions • It is a relative ranking system, which objectively
characterizes the performance of a facility in comparison with all the facilities nationwide
Question #2
22
Are star ratings inconsistent with the ESRD QIP?
CMS Reply: • Star ratings and QIP are similar: All but one of the clinical
quality measures in the QIP (PY 2015 QIP) are used for the DFC star ratings – CMS uses a subset of publicly reported measures also
used in other programs (examples: ESRD QIP) – Note: STrR is proposed for the QIP PY 2018

Question #2 continued
23
Are star ratings inconsistent with the ESRD QIP?
CMS Reply: • Star ratings and QIP are complementary
– QIP is a value-based purchasing program that incentivizes achievement and improvement by linking quality scores to payment
– Star ratings were developed to provide information for patients and other consumers to compare dialysis facilities based on current national data
Question #3
24
Could patients get confused by the two different CMS programs, leading them to change dialysis facilities?
CMS Reply: • We have solicited ESRD patient feedback on readability and
ease of interpreting the star ratings • We will provide guidance to patients on using the star
ratings in conjunction with discussions with their physicians and site visits
• We welcome any suggestions you have for education and training of consumers on the use of the star ratings
Learning from Stakeholder Input
25
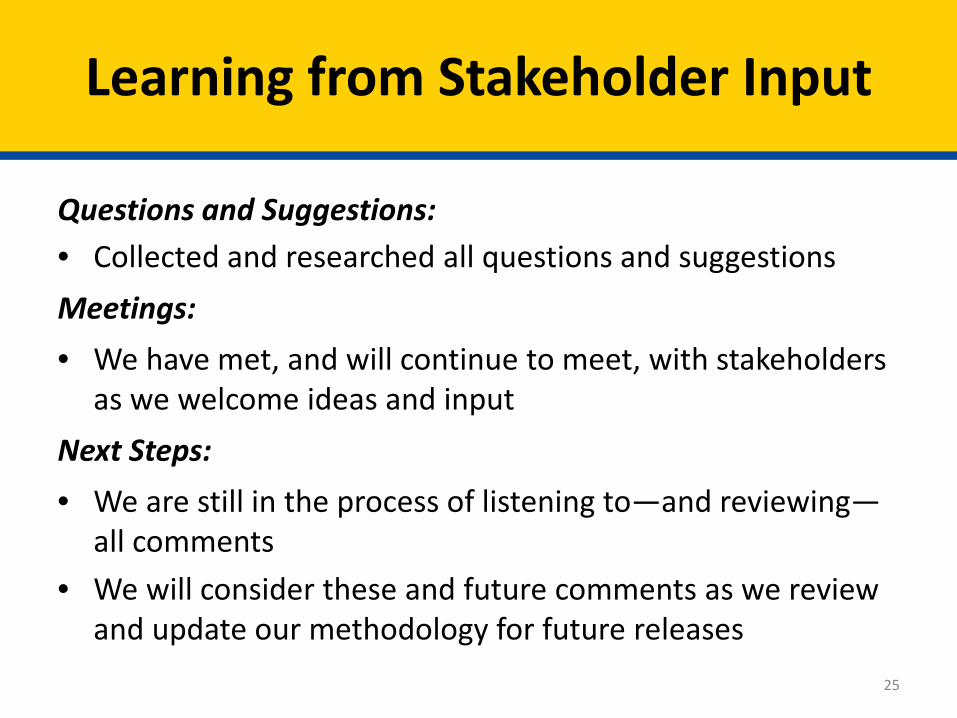
Questions and Suggestions: • Collected and researched all questions and suggestions Meetings: • We have met, and will continue to meet, with stakeholders
as we welcome ideas and input Next Steps: • We are still in the process of listening to—and reviewing—
all comments • We will consider these and future comments as we review
and update our methodology for future releases

Consumer Understanding
Judy Hibbard (U of Oregon)
26
Judy Hibbard, DrPh
27
• Dr. Hibbard is a Professor of Health Policy at the University of Oregon, lead author of the Patient Activation Measure® survey, and a recognized international expert on consumerism in healthcare
• For the past 25 years, she has focused her research on consumer choices and behavior in healthcare
• Her research interests examine such topics as: how consumers understand and use health care information, how health literacy affects choices, enrollee behavior within consumer-driven health plans, and assessments of patient and consumer activation

What Does the Choice Process Require?
28
• Understand options • Understand the implications of what the
different attributes mean for own situation • Be able to differentially weight attributes • Bring all factors together into a choice

Information Processing Challenges
29
• Processing information of multiple options each with multiple and varied attributes.
• Differentially weighting • Bringing together into a choice
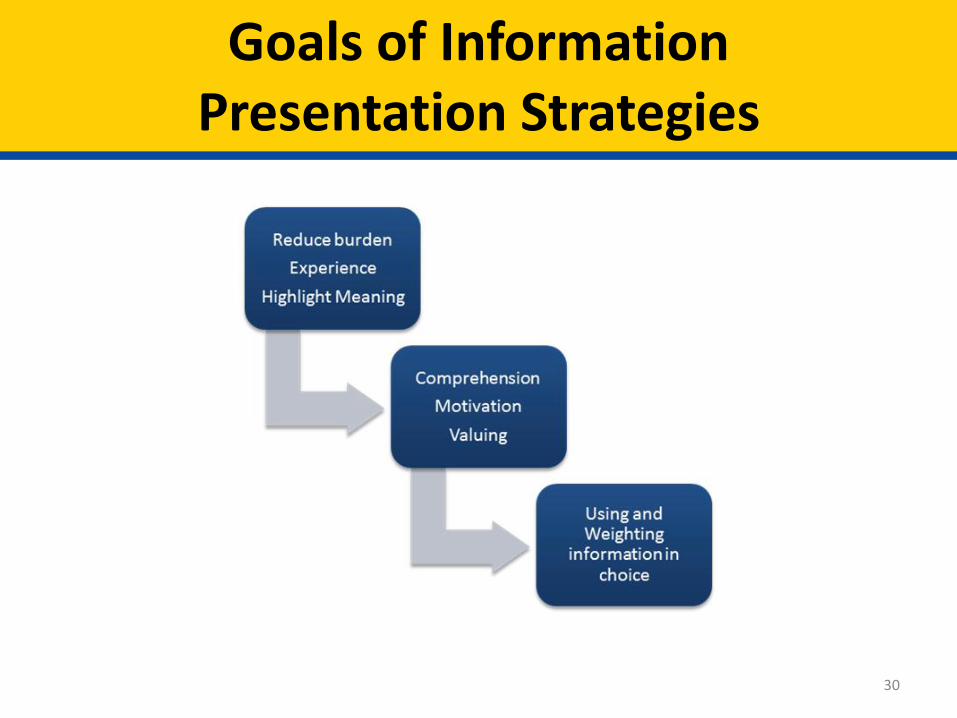
Goals of Information Presentation Strategies
30

Comparative Information Display
31
Center Mortality Rate Complication Rate
Evergreen .02 .17
Lakeview .00 .06
Woodland .07 .20
Sierra Vista .00 .07
Parkdale .02 .15

Highlighting Meaning and Reducing Burden
32
Center Prevention of Deaths Prevention of Complications
Evergreen
Lakeview
Woodland
Sierra Vista
Parkdale
Helping Consumers Choose Dialysis Facilities
Christine Bechtel (Bechtel Health Advisory Group)
33
Christine Bechtel
34
• President of the Bechtel Health Advisory Group, an organization founded out of a desire to implement advanced, patient-centered health policies in practice.
• Bechtel Health brings national credibility and health policy expertise to an array of issue areas including patient and family-centered care, patient-centered medical home (PCMH), health IT, patient engagement, and quality measurement.
• Christine advises the dialysis community on integrating patient and family centered care in the dialysis community and is advising a group of 16 dialysis facilities on including patients and families on their quality improvement teams, for example working to improve AVF rates (fistula).

Context for Consumers
35
• Consumers with kidney disease are a diverse group – Age, gender, race/ethnicity, disability status, literacy, etc. – Different resources supporting them in care (community,
family caregiver, friends, etc.) • Vast majority of patients on dialysis start in the hospital
– “emergent basis” • They are likely to have to choose a dialysis facility
during a stressful time, with lots of new information coming at them
• How can we make it easier for them? And for those supporting them?
Ratings Can Help- Key Criteria
36
1. Useful and Relevant to Consumers – Easy to understand picture of overall quality – Easy to understand how the picture was painted
(measures, methods, results) – Easy to navigate – Built on measures patients care about (experience,
outcomes, disparities, etc.) – Tested and developed in partnership with patients and
families 2. Comparable
– Avoid Lake Wobegon Syndrome - Highlight similarities and differences across facilities to enable decision making
Ratings Can Help- Key Criteria
37
3. Flexible – Enable consumers to drill down and see what measures were
used to create the rating – Easy to understand explanation of methods, measures, etc.
4. Connected and Contextual – Found not just on independent government sites, but where
consumers go online (YELP, CastLight, etc.) – Connected to other resources that support consumer decision
making – Convey to consumers with what they need to do/know if only
available facility(s) has low star rating • What questions to ask facility/doctor; what to look out for in site
visit, etc.

Tips
38
• Patients are resourceful – they will research, enlist friends/family, community resources
• Ratings sites are 1 piece of information – desired by consumers – Other sources: friends, family, doctor, site visits, talking
with other patients, measures of access, etc. • Must understand audiences and contexts in which
decisions are made: – First time dialysis patient – Experienced dialysis patient changing facilities – Family members/friends doing research – Facilities themselves – facilitating QI priorities, improving
experience, etc.
Patient Advocate Perspective on Public Reporting
39
Kathy Day RN
Patient Safety Advocate Consumer Union Safe Patient Project
Member

DFC Next Steps
40
• Currently has some good basic information for patients – Shifts after five – Distance patient will need to travel – 11 clinical quality measures on the DFC site currently
• Star ratings are a good next step in providing additional information to help patients understand the quality of care based what currently exists, but – More patient involvement in exploring measures that
affect outcomes is needed – Data needs to be accurate and complete. Some facilities do
not have any data reported on DFC
DFC Next Steps (Cont.)
41
• DFC and star ratings need to be expanded to include items such as: o Rates of infection, HAIs o Complications and hospital admissions o Involuntary discharges o Survey deficiencies o Patient-reported outcomes o Nurse-patient ratios, staffing mix, staff turnover o Does the clinic have a re-use program

Essentials for Future Reports
42
• Include patient voice in all aspects of care and at all levels of decisions regarding patient care
• Patient reporting with validation as a source of information for future ratings
• Patient surveys done for CMS, directly, not through clinic staff, could give great information about outcomes and patient centeredness
• Information about costs for patients. It is essential for patient choice
• More information for staff and patients about patient rights, and about the many forms patients sign

Experience as a Dialysis Patient
43
William Dant MS, Patient Educator and Speaker
Patient Activist
ESRD Subject Matter Expert
44
• Hemodialysis patient 18 years • Active in ESRD Network
– Member • ESRD Network Board of Directors • Medical Review Board- 20 years • Patient educator and speaker • Patient Advocacy Group
• Patient Activist
Patient Community Concerns
45
• Patient empowerment, • Provider transparency • Lack of information
Star Ratings
46
• ACA provider reporting initiative • CMS Dialysis Facility Compare Star Ratings
– Provider – What do star ratings offer patients
Moving Forward
47
What future star rating improvements are desirable?
Elena K Balovlenkov
48
Next Steps
Future Directions
49
• Adding patient-centered measures to DFC and the star ratings: – ICH CAHPS (patient experience) – New measures developed in partnership with patients
• In future releases, CMS will consider adding other aspects of quality to star ratings – Beneficiary grievances – State inspection results – Involuntary discharges

Updating Star Ratings Methodology in Future Years
50
• Issues and alternatives that may be explored for future updates: – Further explore using thresholds – Examine measure performance to assess if measures are “topped out” – Investigate the possibility of adding statistical uncertainty to the star ratings
• Process for soliciting input on potential updates to methodology: – Convene a technical expert panel (TEP) through public call for nominations
• 30% - 40% of TEP to be patients/patient family members • 20% consumer groups
– Soliciting TEP input on measures they would like to see included in the star rating • Patient-reported measures/patient-centered outcome measures; a measure of survey
deficiencies • Provide input on the interpretability of star ratings
• Consider approaches used in other Compare sites to update methodology • Continue to engage with community stakeholders

Questions?
51
Appendix
52

Additional Methodology Details
53
Before grouping the QMs using factor analysis: • Combined 3 dialysis adequacy QMs into a single score
– Adequacy as measured by Kt/V is reported on DFC separately for three groups of patients (children on HD, adults on HD, adults on PD)
– A single adequacy measure for all patients in the facility was calculated as the weighted average of the measures for the 3 groups
• Used Probit ranking to score the combined Kt/V measure and each of the other 6 QMs
– Probit ranking is a statistical technique that allows comparison across measures – Ranking of facility according to the measure calculated as a value from 0 to 100, with
better performance on the measure corresponding to higher values – Resulting standardized values are directly comparable in scale (0-100), distribution
(normal), and directionality (higher values indicate better performance)
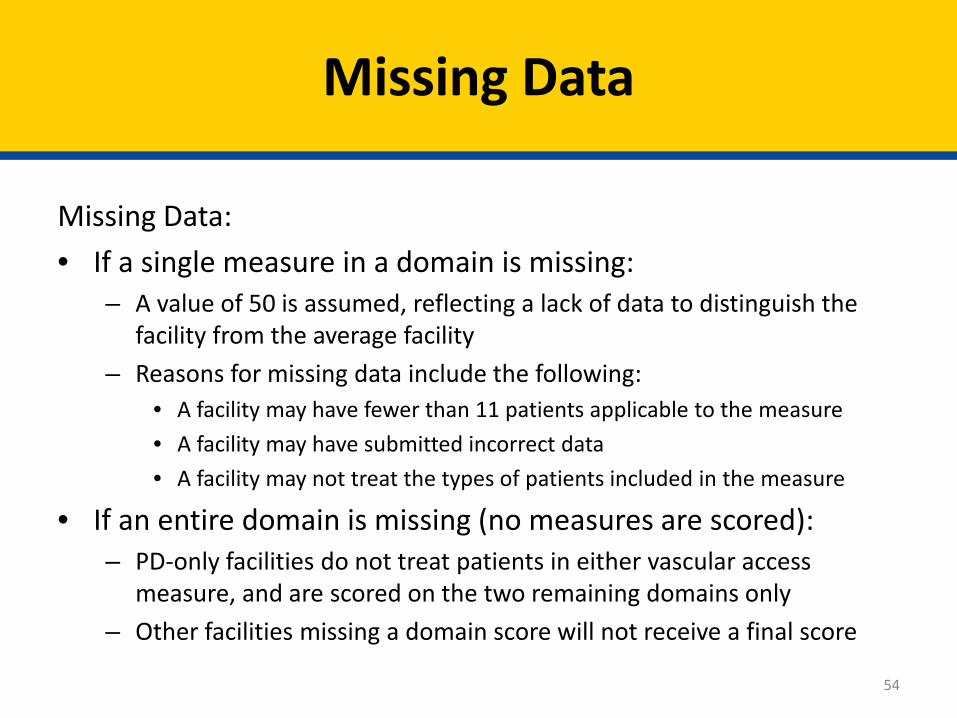
Missing Data
54
Missing Data: • If a single measure in a domain is missing:
– A value of 50 is assumed, reflecting a lack of data to distinguish the facility from the average facility
– Reasons for missing data include the following: • A facility may have fewer than 11 patients applicable to the measure • A facility may have submitted incorrect data • A facility may not treat the types of patients included in the measure
• If an entire domain is missing (no measures are scored): – PD-only facilities do not treat patients in either vascular access
measure, and are scored on the two remaining domains only – Other facilities missing a domain score will not receive a final score
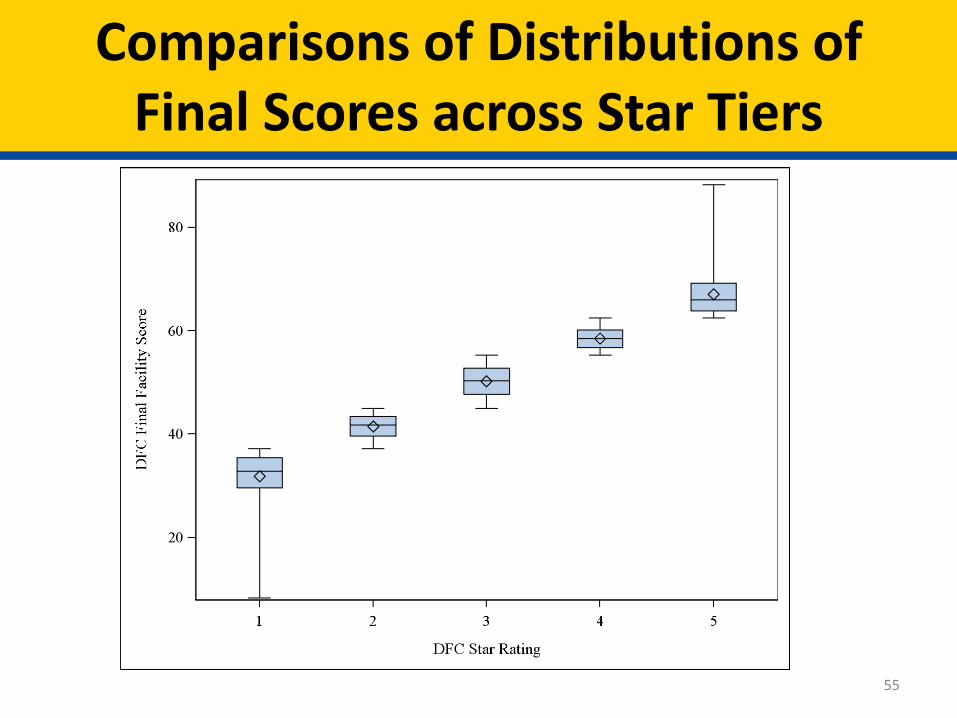
Comparisons of Distributions of Final Scores across Star Tiers
55

Comparisons of Averages of Individual Measures Across Star Tiers
56
Average Measure Values Within Star Rating Categories
Measure Mean (SE) Measure Values by Star Rating
STrR 1.50 (0.029) 1.20 (0.02) 1.00 (0.01) 0.81 (0.012) 0.63 (0.015)
SHR 1.28 (0.014) 1.12 (0.009) 0.99 (0.005) 0.86 (0.007) 0.75 (0.011)
SMR 1.34 (0.017) 1.11 (0.007) 1.02 (0.004) 0.93 (0.007) 0.84 (0.010)
All Kt/V 75.5 (0.78) 81.8 (0.42) 86.8 (0.20) 89.5 (0.24) 92.3 (0.27)
Hypercalcemia 5.7 (0.18) 4.6 (0.11) 3.4 (0.06) 2.3 (0.07) 1.8 (0.08)
AVF 48.6 (0.42) 56.0 (0.29) 62.1 (0.20) 67.3 (0.28) 73.2 (0.39)
Catheter > 90 days 20.3 (0.35) 14.7 (0.18) 10.6 (0.11) 7.6 (0.13) 5.2 (0.16)

Alternative Methods Considered
57
• Compared with the Hospital Compare Method for HCAHPS (patient experience survey) – Uses clustering technique to create star ratings for
each measure – Average measure ratings to create an overall rating – Very few facilities received 1 or 5 stars
• Applied Clustering Technique to the current DFC final facility scores – Distribution of the star ratings was bell-shaped
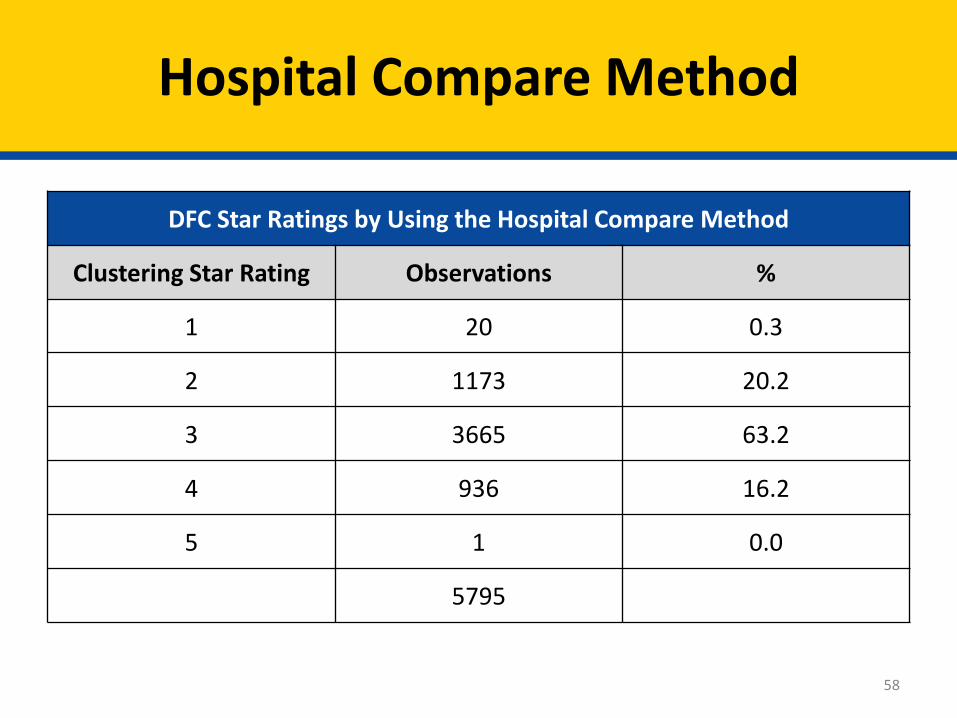
Hospital Compare Method
58
DFC Star Ratings by Using the Hospital Compare Method
Clustering Star Rating Observations %
1 20 0.3
2 1173 20.2
3 3665 63.2
4 936 16.2
5 1 0.0
5795
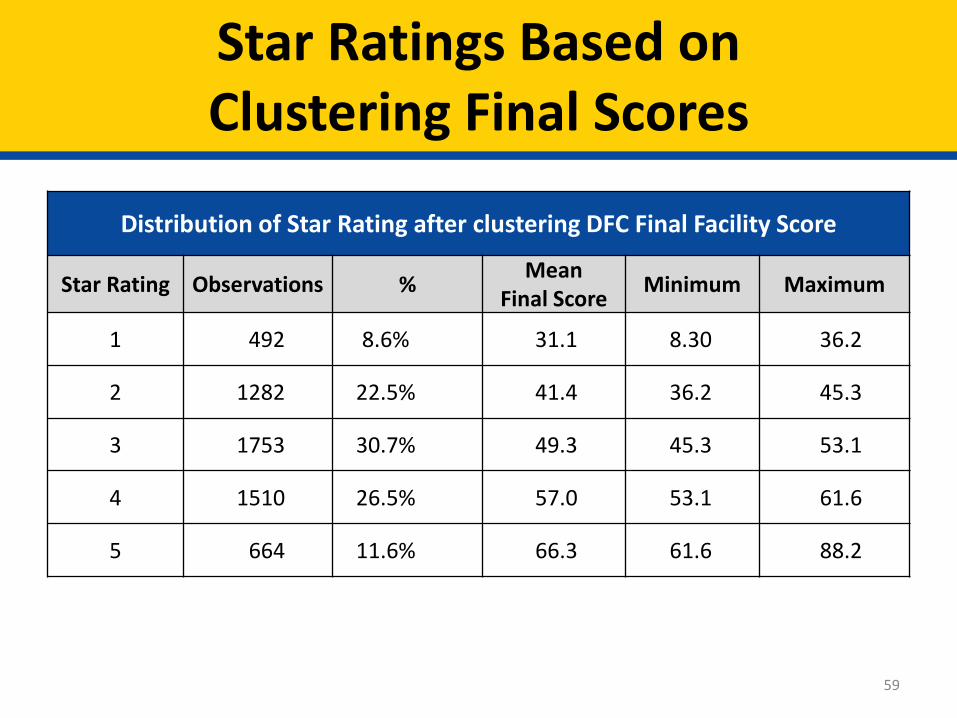
Star Ratings Based on Clustering Final Scores
59
Distribution of Star Rating after clustering DFC Final Facility Score
Star Rating Observations % Mean Final Score Minimum Maximum
1 492 8.6% 31.1 8.30 36.2
2 1282 22.5% 41.4 36.2 45.3
3 1753 30.7% 49.3 45.3 53.1
4 1510 26.5% 57.0 53.1 61.6
5 664 11.6% 66.3 61.6 88.2

Scoring Measures
60
• Final facility scores combined from probit ranked measures yield a symmetric distribution
• Combining the original measure values within a facility still yields a symmetric distribution
• Further evidence that star ratings should have equal facilities that are rated “above” and “below” average.

Sensitivity Analysis
61