Embed Size (px)
Citation preview

1
Home Health Compare (HHC) Star Ratings: Provider Preview Reports
Webinar Centers for Medicare & Medicaid Services
March 26, 2015
Agenda
2
• Introduction
• Implementation timeline
• Preview report components
• Agencies missing HHC Star Ratings
• Requesting review of an HHC Star Rating
• Questions and comments

Why Star Ratings for Home Health?
• The ACA calls for transparent, easily understood public reporting of quality of care information. – Star ratings present quality of care information in a way that is
easy for consumers for understand. – Public reporting is a key driver for improving health care quality
by supporting consumer choice and incentivizing provider quality improvement.
• Part of CMS’ plan to adopt star ratings across all Medicare.gov Compare websites. – Already in place on Nursing Home Compare, Dialysis Facility
Compare, Physician Compare and Medicare Plan Finder – Implementation in 2015 planned for Hospital Compare and
Home Health Compare
3
Implementation and Preview Timeline
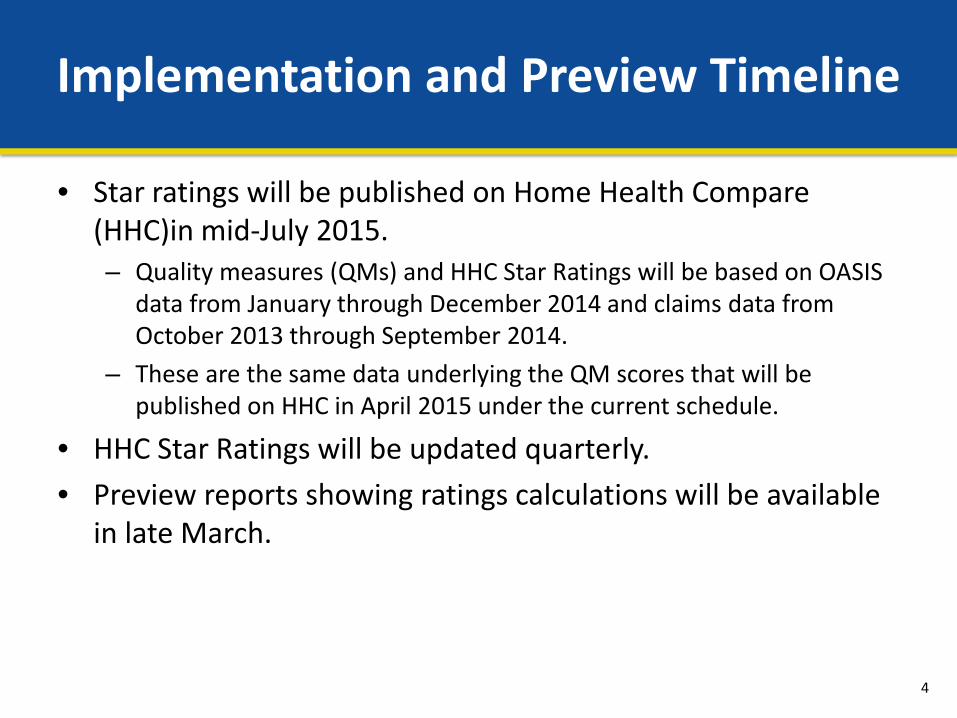
• Star ratings will be published on Home Health Compare (HHC)in mid-July 2015. – Quality measures (QMs) and HHC Star Ratings will be based on OASIS
data from January through December 2014 and claims data from October 2013 through September 2014.
– These are the same data underlying the QM scores that will be published on HHC in April 2015 under the current schedule.
• HHC Star Ratings will be updated quarterly. • Preview reports showing ratings calculations will be available
in late March.
4

Preview reports
Agencies will now receive two preview reports quarterly. 1) All QMs to be reported on Home Health Compare
– Same as preview report currently delivered annually – Will now include two new claims-based measures being added
to Home Health Compare in July 2015 • Rehospitalization During the First 30 Days of Home Health • Emergency Department Use without Hospital Readmission
During the First 30 Days of Home Health 2) HHC Star Ratings preview reports showing final rating and rating
calculation Both reports will be delivered to CASPER mailboxes as under current process.
5
Preview reports
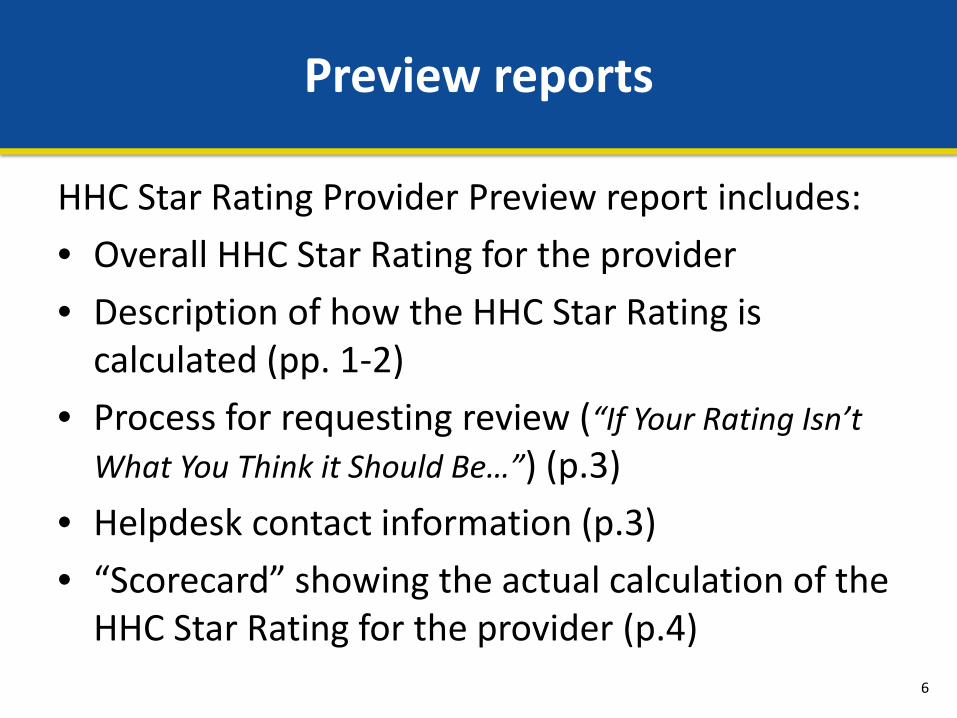
HHC Star Rating Provider Preview report includes: • Overall HHC Star Rating for the provider • Description of how the HHC Star Rating is
calculated (pp. 1-2) • Process for requesting review (“If Your Rating Isn’t
What You Think it Should Be…”) (p.3) • Helpdesk contact information (p.3) • “Scorecard” showing the actual calculation of the
HHC Star Rating for the provider (p.4) 6

Sample Report
7
• Overall HHC Star Rating (p.1):

Scorecard: Agency with HHC Star Rating
8
HHC Star Rating Scorecard1 Measure Score Cut Points by Initial Decile Rating
1 Initial Decile Rating
Timely initiation of
care
Drug education on
all medications
Received flu shot for current season
Improved walking or moving around
Improved getting in
and out of bed
Improved bathing
Had less pain moving
around Breathing improved
Admitted to hospital
2 0.5 0.0-79.6 0.0-79.7 0.0-44.0 0.0-43.3 0.0-34.9 0.0-45.7 0.0-43.7 0.0-33.0 20.1-100.0
3 1.0 79.7-85.4 79.8-87.7 44.1-58.1 43.4-50.0 35.0-42.8 45.8-54.5 43.8-53.7 33.1-46.1 18.3-20.0
4 1.5 85.5-88.8 87.8-91.6 58.2-66.1 50.1-54.6 42.9-48.1 54.6-59.5 53.8-59.2 46.2-54.3 17.1-18.2
5 2.0 88.9-91.0 91.7-94.0 66.2-71.3 54.7-57.8 48.2-52.3 59.6-63.2 59.3-63.0 54.4-59.9 16.2-17.0
6 2.5 91.1-92.8 94.1-95.7 71.4-75.4 57.9-60.4 52.4-55.4 63.3-66.3 63.1-66.4 60.0-64.1 15.3-16.1
7 3.0 92.9-94.4 95.8-97.0 75.5-79.0 60.5-62.7 55.5-58.5 66.4-69.0 66.5-69.8 64.2-67.7 14.4-15.2
8 3.5 94.5-95.9 97.1-98.0 79.1-82.4 62.8-65.5 58.6-61.6 69.1-71.9 69.9-73.7 67.8-71.1 13.4-14.3
9 4.0 96.0-97.2 98.1-98.9 82.5-86.5 65.6-68.7 61.7-65.2 72.0-75.3 73.8-78.7 71.2-75.0 11.9-13.3
10 4.5 97.3-98.6 99.0-99.9 86.6-92.2 68.8-74.0 65.3-70.9 75.4-80.7 78.8-86.6 75.1-80.3 10.0-11.8
11 5.0 98.7-100.0 100.0-100.0 92.3-100.0 74.1-100.0 71.0-100.0 80.8-100.0 86.7-100.0 80.4-100.0 0.0-9.9
12 Your HHA Score 94.6 95.6 75.6 57.8 51.8 63.5 70.1 57.9 17.3
13 Your Initial Decile Rating 3.5 2.5 3.0 2.0 2.0 2.5 3.5 2.0 1.5
14 Your Number of Cases (N) 4,919 4,860 2,966 3,397 3,246 3,420 2,309 2,883 1,881
15 National (All HHA) Median 93.1 96.3 75.5 60.7 56.2 66.4 67.6 64.8 15.9 16 Your Statistical Test Probability
Value (p-value) 0.000 0.264 0.397 0.080 0.000 0.000 0.062 0.000 0.010
17 Your Statistical Test Results (Is the p-value < 0.050?)
Yes No No No Yes Yes No Yes Yes
18 Your HHA Adjusted Rating 3.5 2.5 3.0 2.5 2.0 2.5 3.0 2.0 1.5
19 Your Average Adjusted Rating 2.5
20 Your Average Adjusted Rating Rounded 2.5
21 Your Overall Star Rating (1.0 to 5.0) *** (3.0 stars)
1OASIS data from January 1, 2014 through December 31, 2014 and claims data from October 1, 2013 through September 30, 2014

Preview Report Components: Scorecard, Rows 2-11
9
• HHC Star Ratings are based on 9 HHC quality measures. • For each of the 9 quality measures, all HHAs’ scores are
sorted low to high and divided into 10 approximately equal sized groups (deciles) of HHAs.
• The decile cut points for each measure are shown in the "Measure Score Cut Points by Initial Decile Rating " table in the HHC Star Rating Scorecard (Rows 2-11).
• The cut points will vary from quarter-to-quarter based on the performance of all HHAs during that performance period, and will apply to all agencies for the HHC Star Ratings for that quarter.

Scorecard Example: Rows 2-11
10
Row Initial Decile Rating Timely Initiation of Care
2 .5 0.0 - 79.6
3 1.0 79.7 - 85.4
4 1.5 85.5 – 88.8
5 2.0 88.9 – 91.0
6 2.5 91.1 – 92.8
7 3.0 92.9 – 94.4
8 3.5 94.5 – 95.9
9 4.0 96.0 – 97.2
10 4.5 97.3 – 98.6
11 5.0 98.7 – 100.0

Preview Report Components: Scorecard, Rows 12-13
11
• An HHA’s score on each measure is assigned its decile location as a preliminary rating.
• Each decile corresponds to a value between one-half and five stars, in half-star increments.
• Row 12 ("Your HHA Score" ) shows your HHA’s score for each measure.
• Row 13 (“Your Initial Decile Rating“) shows the corresponding initial decile rating based on the score.

Scorecard Example: Rows 12 -13
12
Row Initial Decile Rating Timely Initiation of Care
2 .5 0.0 – 79.6
3 1.0 79.7 – 85.4
4 1.5 85.5 – 88.8
5 2.0 88.9 – 91.0
6 2.5 91.1 – 92.8
7 3.0 92.9 – 94.4
8 3.5 94.5 – 95.9
9 4.0 96.0 – 97.2
10 4.5 97.3 – 98.6
11 5.0 98.7 – 100.0
12 Your HHA Score 94.5
13 Initial Decile Ranking 3.5

Preview Report Components: Scorecard, Rows 14-15
13
• Row 14 shows the number of quality episodes included in the HHA’s measure calculation
• Row 15 (“National [All HHA] Median”) shows the overall HHA median or middle score across all agencies.
• Each agency’s measure score (Row 12) is compared to the national median (Row 15) to determine if the difference between the two is statistically significant.

Preview Report Components: Scorecard, Rows 16-17
14
• The probability value from the statistical test is shown on Row 16: "Your Statistical Test Probability Value (p-value)."
• A probability value greater than 0.050 means an HHA’s measure score is not significantly different from the overall national agency median (at a standard 5 percent significance level).
• Row 17, "Your Statistical Test Results" indicates: – "Yes" if the HHA’s measure score IS statistically significantly different
from the overall national agency median (row 16 ≤ 0.050) – “No” if the HHA’s measure score IS NOT statistically significantly
different from the overall national agency median (row 16 >0.050)

Preview Report Components: Scorecard, Rows 17-18
15
• If Row 17 is “Yes” (HHA score differs from median), the initial rating is left unchanged.
• If Row 17 is “No” (HHA score is NOT statistically different from national median)
AND the initial rating is not already “in the middle” (2.5 or 3),
THEN the initial rating is moved one-half star closer to the
middle.
• Row 18 shows the ratings after this adjustment (if any). – Will be the same as the initial rating (Row 13) if no adjustment is made

Scorecard Example: Rows 12-18
16
Row Timely Initiation of Care
12 Your HHA Score 3.5
13 Initial Decile Ranking 94.5
14 Your Number of Cases (N) 4,919
15 National (All HHA) Median 93.1
16 Your Statistical Test Probability Value (p value) .000
17 Your Statistical Results (is the p-value ≤ 0.050?) Yes
18 Your HHA Adjusted Rating 3.5

Scorecard Example: Rows 12-18
17
Row Improved Walking or Moving Around
12 Your HHA Score 57.8
13 Initial Decile Ranking 2.0
14 Your Number of Cases (N) 3,397
15 National (All HHA) Median 60.7
16 Your Statistical Test Probability Value (p value) .080
17 Your Statistical Results (is the p-value ≤ 0.050?) No
18 Your HHA Adjusted Rating 2.5

Preview Report Components: Scorecard, Rows 19-21
18
• To obtain one overall score for each HHA, the adjusted ratings are averaged across the 9 measures (Row 19 “Your Average Adjusted Rating“) and rounded to the nearest half star (Row 20 “Your Average Adjusted Rating Rounded“).
• An Overall HHC Star Rating is then assigned so that ratings will range from 1.0 to 5.0 in half star increments; this is shown on Row 21. The “Average Adjusted Rating Rounded” value is translated into the HHA’s Overall HHC Star Rating using the table on the next slide.

Preview Report Components: Final Star Rating
19
Average Adjusted Rating Rounded (Row 20)
Overall HHC Star Rating (Row 21)
4.5 and 5.0 ***** (5.0) 4.0 ****1/2 (4.5) 3.5 **** (4.0) 3.0 ***1/2 (3.5) 2.5 *** (3.0) 2.0 **1/2 (2.5) 1.5 ** (2.0) 1.0 *1/2 (1.5) 0.5 * (1.0)

Scorecard Example: Rows 19 - 21
20
Row
19 Your Average Adjusted Rating 2.5
20 Your Average Adjusted Rating Rounded 2.5
21 Your Overall Star Rating (1.0 to 5.0) *** (3 Stars)

Missing HHC Star Ratings
21
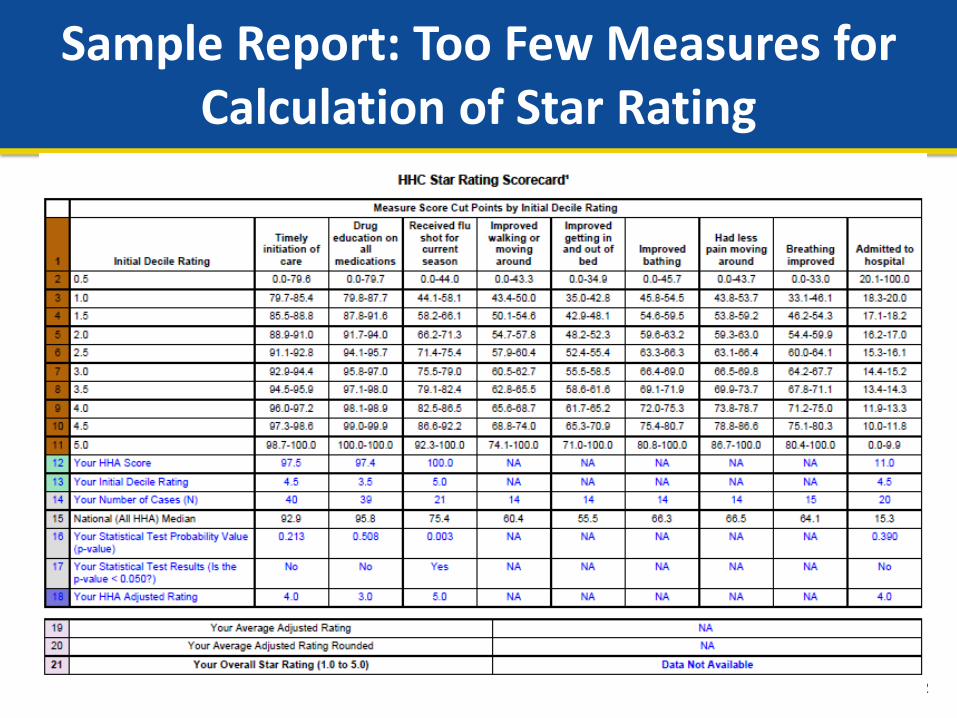
• To receive an HHC Star Rating, agencies must have sufficient quality episodes for at least 5 of the 9 measures in the calculation.
• Currently, HHAs must have at least 20 complete quality episodes for data on a measure to be reported on HHC. – Completed episodes are paired start or resumption of care
and end of care OASIS assessments. – Episodes must have discharge date within the 12-month
reporting period regardless of admission date. • HHAs that are new (< 6 months old) will also not have
star ratings displayed.
Sample Report: Too Few Measures for Calculation of Star Rating
22

Requesting Review of HHC Star Ratings
23
• HHAs will have about two and a half weeks to request review of their HHC Star Rating. – Must have evidence that missing or inaccurate data
have affected quality measure results* – Volume of missing or inaccurate data significant
enough to potentially affect the final HHC Star Rating
*Medicare Conditions of Participation require submission of accurate OASIS data for all qualifying episodes.

• Requests should be submitted by APRIL 17, 2015 to
Requesting Review of HHC Star Ratings
24
• Requests should include: – Provider name and CCN – Provider contact person – Name, Telephone #, email address – Measure(s) affected – Type of data error (inaccurate or missing assessments) – Date range for data errors – Volume (number of assessments affected) – Plan and timeline for submitted missing or corrected assessments – Any other information to assist CMS in determining if the data errors
have affected your star rating Do not send any identifiable patient information through email!

Requesting Review of HHC Star Ratings
25
• Receipt of request will be acknowledged by email to the contact provided in the request within two business days.
• CMS will review the request to determine if the HHC Star Rating was affected and if the plan for correction is acceptable. – May request additional information
• At CMS discretion, the HHC Star Rating and any affected measures may be suppressed for one quarter while corrections are made.
• Determinations will be made by June 30, 2015. – Agency will be notified by email to contact provided in
original request.

Posting of Star Ratings on Home Health Compare
26
• If an HHA’s review request results in data suppression, the HHC star rating and data for any of the affected measures will not appear on HHC in the next refresh. • Existing Footnote 8 “There were problems with the data and they are being
corrected” will be shown. • After evaluation of all requests, data will be re-processed to reflect CMS-
approved data suppression. • No recalculation of HHC Star Ratings for other agencies • No regeneration of provider preview reports
• The re-processed data will be posted on HHC in July, 2015. • The data collection period will be the same as for the provider preview reports
(OASIS data from January through December 2014 and claims data from October 2013 through September 2014).
• All subsequent postings on HHC will reflect this additional 3-month delay (to allow time for submission and processing of agency review requests.)

Questions and Comments
• Further reading and FAQs: • http://www.cms.gov/Medicare/Quality-
Initiatives-Patient-Assessment-Instruments/HomeHealthQualityInits/HHQIHomeHealthStarRatings.html
• Questions or comments about HHC star ratings – send email to: [email protected]
• Home Health Compare: http://www.medicare.gov/homehealthcompare
27