Embed Size (px)
Citation preview

50 µm
1
32
Stanford Stanford MicrofluidicsMicrofluidics LabLab
Activities:Activities:Miniature Bioanalytical Systems•Capillary zone electrophoresis•Capillary isoelectric focusing•CE Binding Assays
Research Examples:Research Examples:Juan G. Santiago Stanford Microfluidics LabStanford Universitymicrofluidics.stanford.edu
Microflow Devices•Micromixers•Electroosmotic pumps•Sample preconcentration•On-chip 2D assays
Applications•Drug discovery•Genetic studies•Proteomics•BW detection•Electronics cooling
Optimized Geometries:
Micromixers:
Diagnostics
OnOn--chip 2D Assay: chip 2D Assay: CIEF and CZECIEF and CZE
simulation experiment
simulation experiment
Optimized Injections:
1 µm

10 µm10 µm
Electrokinetics Microfluidics at Extreme Scales
Juan G. Santiago Stanford Microfluidics Laboratory
Mechanical Engineering DepartmentStanford University

Outline(time, concentration, length)
• Introduction MicrofluidicsElectrokinetic (EK) flows
• Electrokinetic instabilities (time)Mechanism and modelTransition to chaos
• ITP (concentration)Sensitivity and practiceExtreme concentration scales
• Nanochannel electrophoresis (length)Small ion separationsDNA sample separation Near-Future Work
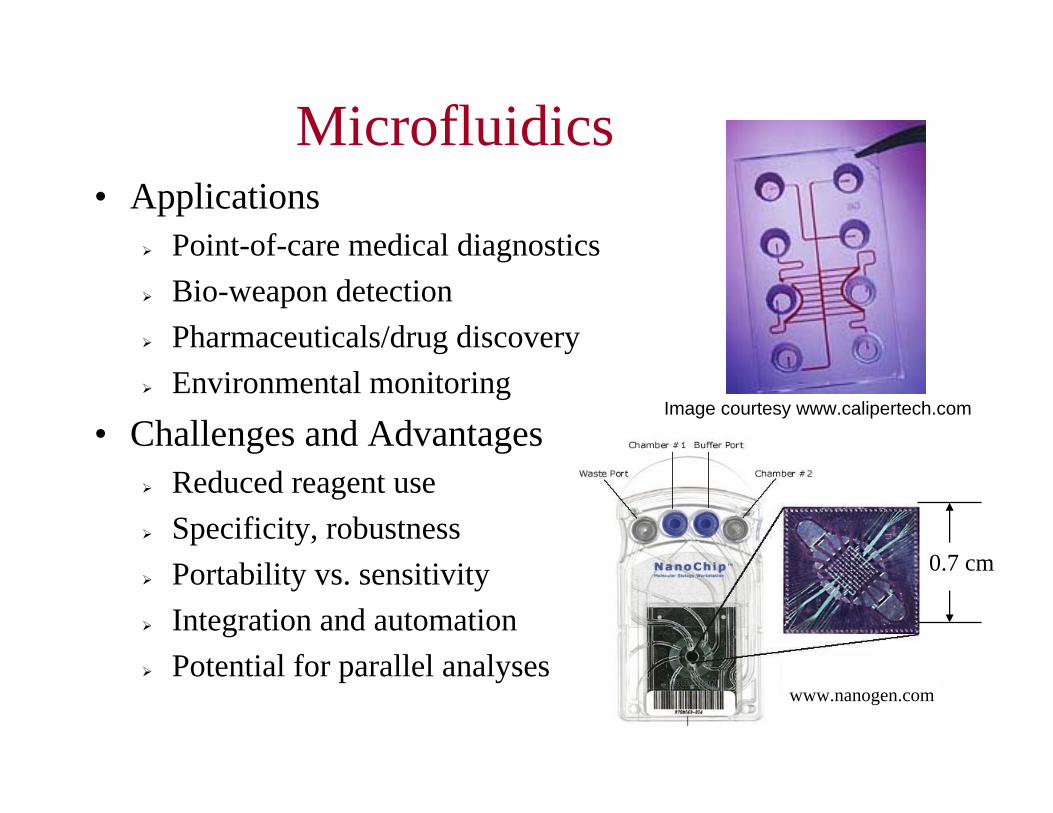
Microfluidics• Applications
Point-of-care medical diagnosticsBio-weapon detectionPharmaceuticals/drug discoveryEnvironmental monitoring
• Challenges and AdvantagesReduced reagent useSpecificity, robustnessPortability vs. sensitivityIntegration and automationPotential for parallel analyses
www.nanogen.com
Image courtesy www.calipertech.com
0.7 cm

0driftu∇ >i,1 ,2drift driftu u≠
Processes in microfluidics
Separation Stacking Hybridization Reaction
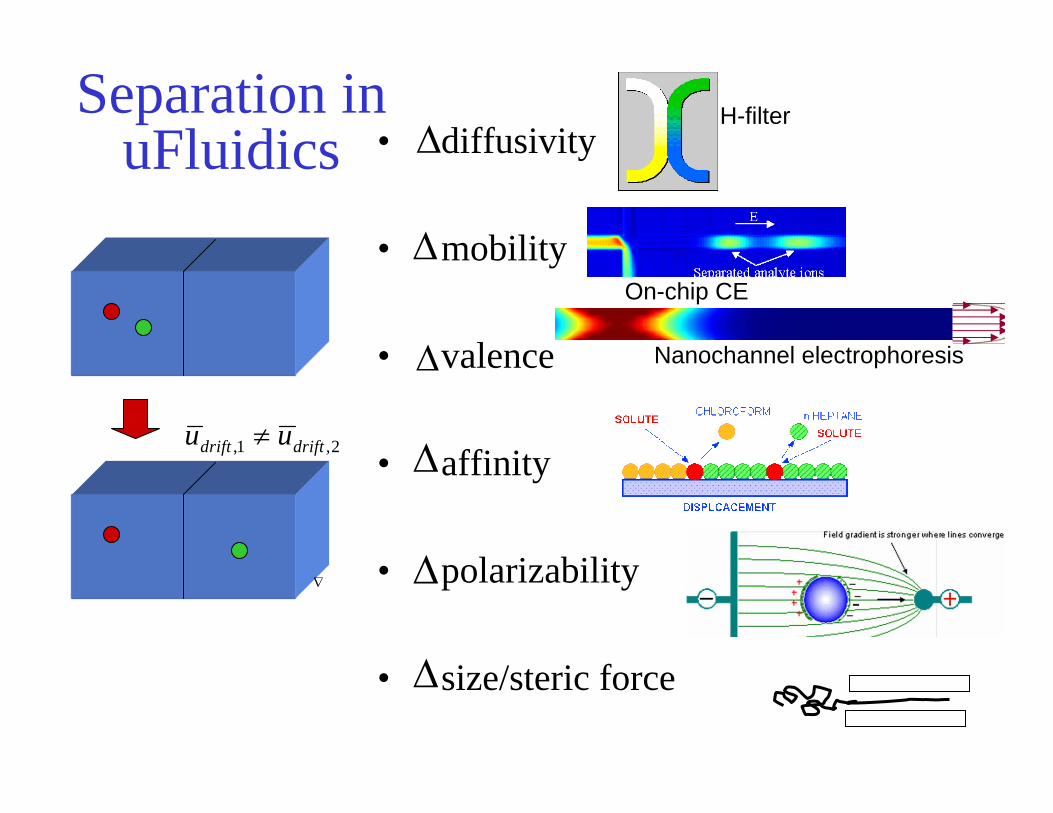
Separation inuFluidics
,1 ,2drift driftu u≠
∆
∇
• diffusivity
• mobility
• valence
• affinity
• polarizability
• size/steric force
∆
∆
∆
∆
∆
On-chip CE
Nanochannel electrophoresis
H-filter
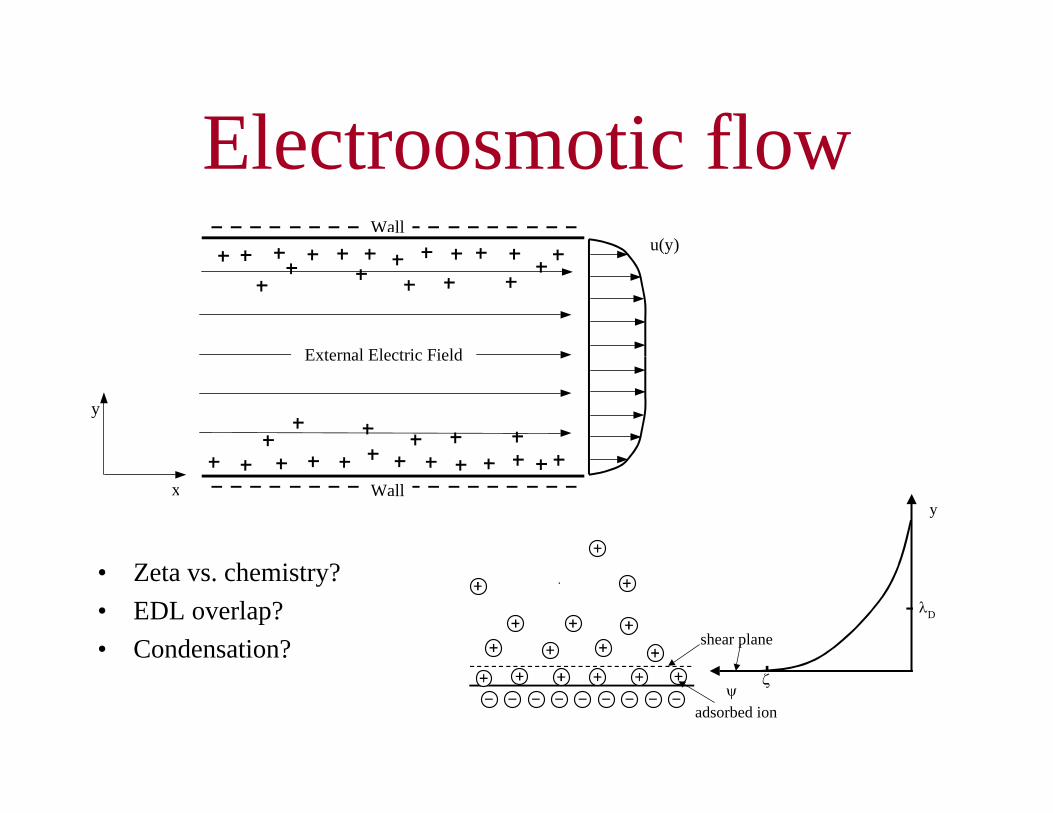
Electroosmotic flow
External Electric Field
u(y)
y
x Wall
Wall
adsorbed ion
y
ψ
shear plane
λD
ζ
• Zeta vs. chemistry?• EDL overlap?• Condensation?

Electrohydrodynamics and Electrokinetics History
Gilbert, ~1580s
Of the attraction exerted by amber
Reuss, F.F. 1809. Memoires de ls Societe Imperial des Naturalistes de Moscow. 2:327.

Electrokinetic Microfluidics
Pressure-driven Electrokinetic
Devasenathipathy S. and J. Santiago, Micro-and nano-scale diagnostics, Springer-Verlag, 2003
EOF
++
+ +
++
+ +
+
+ +
λd
λd
++
+
+
λd
Electrophoresis +
++
---
-
++ + +++ ++ ++ + +++ ++
Glass or fused-silica microchannel wall
Chargedouble-layer
Deprotonated silanol groups
+ -
100 um
100 um
• Electric control (no moving parts)
• Switching, valving• Low dispersion• Integrated w/ separation
techniques

ElectrokineticInstabilities

Complex electrokinetics• Sample preconcentration methods
Thermal gradient focusingField amplified sample stackingIsotachophoresis
• On-chip two-dimensional assays
• On-chip CE with unknown or poorly controlled sample chemistry
• On-chip mixing and buffer exchange
CE
dim
ensi
on (m
m)
1
2
3
4
5
6
∆x = 4IEF dimension (mm)
1
3
2
0
1 Signal (au)
Herr, A.E. et al. Analytical Chemistry, Vol. 75, No. 5, pp. 1180-1187, 2003
CA
W
B
D IEF/EOF

Major Challenge in HeterogenousEK Systems: Instabilities
Unstable, fluctuating concentrations in high-conductivity-gradient case
50 µm 1 mm
100 µm
Flows at Intersections:
Particle visualization
100 µm
Axial interface:
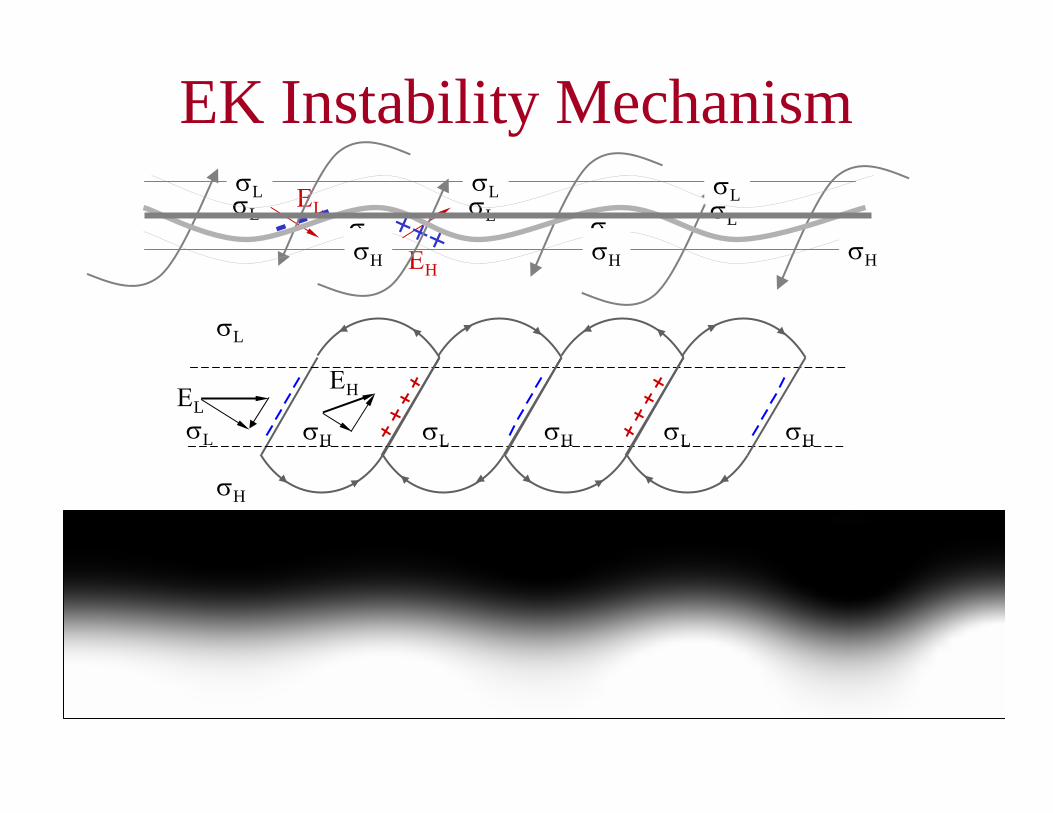
σL σH σL σH σL σH
ΕH
σL
σH
ΕL
EK Instability MechanismΕL
ΕH
- - - +++σL σH
σL σHσL
σH
σL
σH
σL
σH
σL
σH
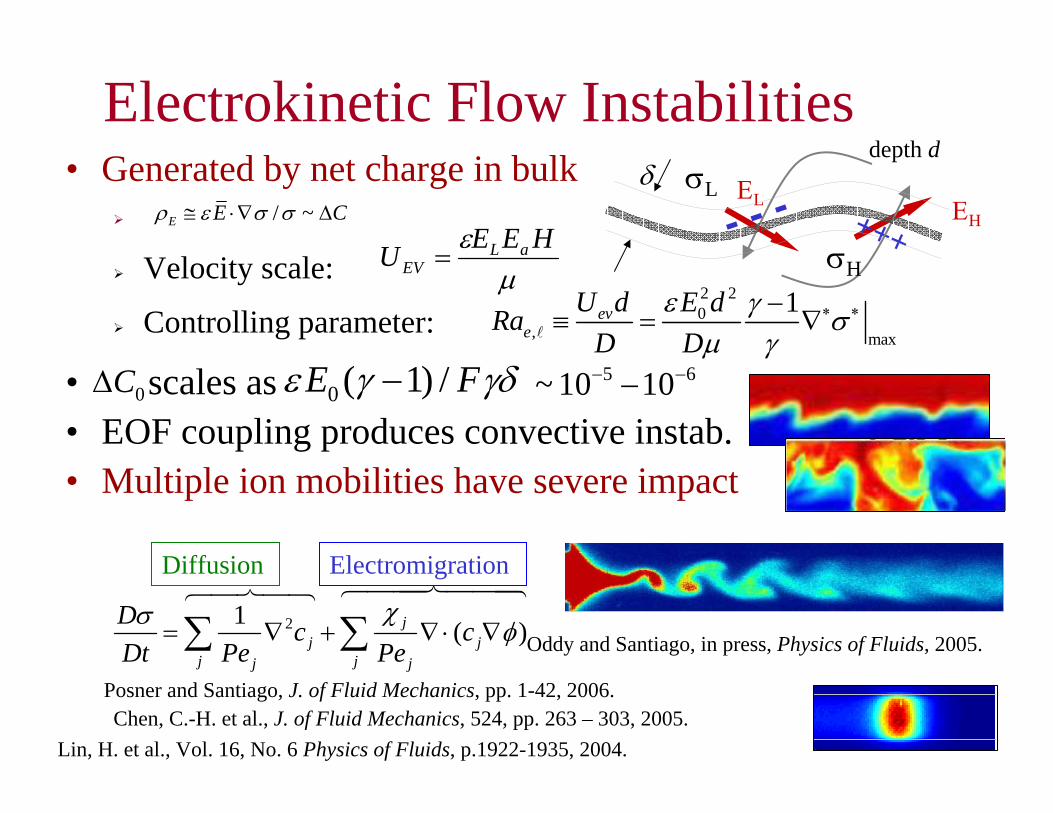
Electrokinetic Flow Instabilities• Generated by net charge in bulk
Velocity scale:
Controlling parameter:
• scales as • EOF coupling produces convective instab.• Multiple ion mobilities have severe impact
/ ~E E Cρ ε σ σ≅ ⋅∇ ∆ΕL ΕH- - - +++
σL
σHµε HEEU aL
EV =
00Lin, H. et al., Vol. 16, No. 6 Physics of Fluids, p.1922-1935, 2004. Chen, C.-H. et al., J. of Fluid Mechanics, 524, pp. 263 – 303, 2005.
2 20
, max
1eve
U d E dRaD D
ε γ σµ γ
∗ ∗−≡ = ∇
δdepth d
0 ( 1) /E Fε γ γδ−0C∆
Posner and Santiago, J. of Fluid Mechanics, pp. 1-42, 2006.
5 6~ 10 10− −−
21 ( )jj j
j jj j
D c cDt Pe Pe
χσ φ= ∇ + ∇⋅ ∇∑ ∑
ElectromigrationDiffusion
Oddy and Santiago, in press, Physics of Fluids, 2005.

Electrokinetic instabilities
ExperimentModel
t = 0.0 st = 0.5 s
t = 1.5 st = 2.0 st = 2.5 st = 3.0 st = 4.0 st = 5.0 s
t = 1.0 s
Storey, B.D. et al. Physics of Fluids, Vol. 16, No. 6, p.1922-1935, 2004.Lin et al., submitted to J. Fluid Mechanics, 2005.

f [1/sec]
Rae = 675
Rae = 800
Rae = 2,000
Rae = 2,700
Power spectraEKI in a cross intersection: Experiments
50 um
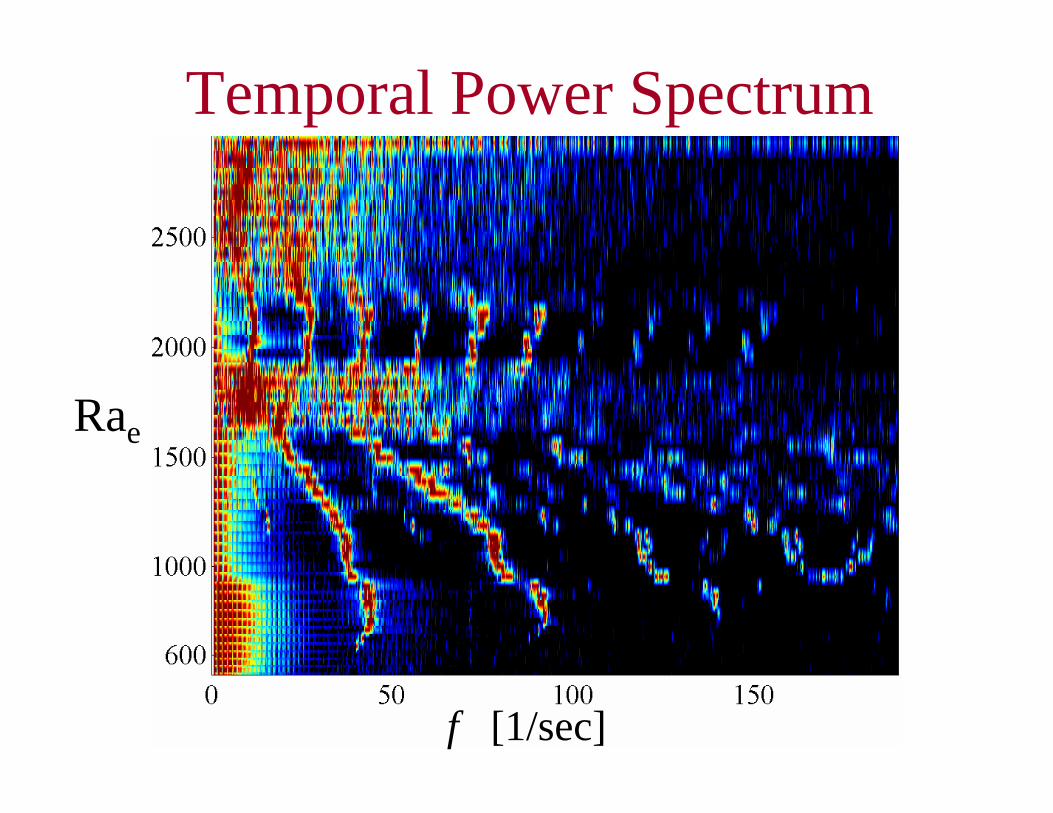
Temporal Power Spectrum
f [1/sec]
Rae

C2 C2
C1
Correlation plots
C1
Rae=675 Rae=800
Rae=2000 Rae=2600

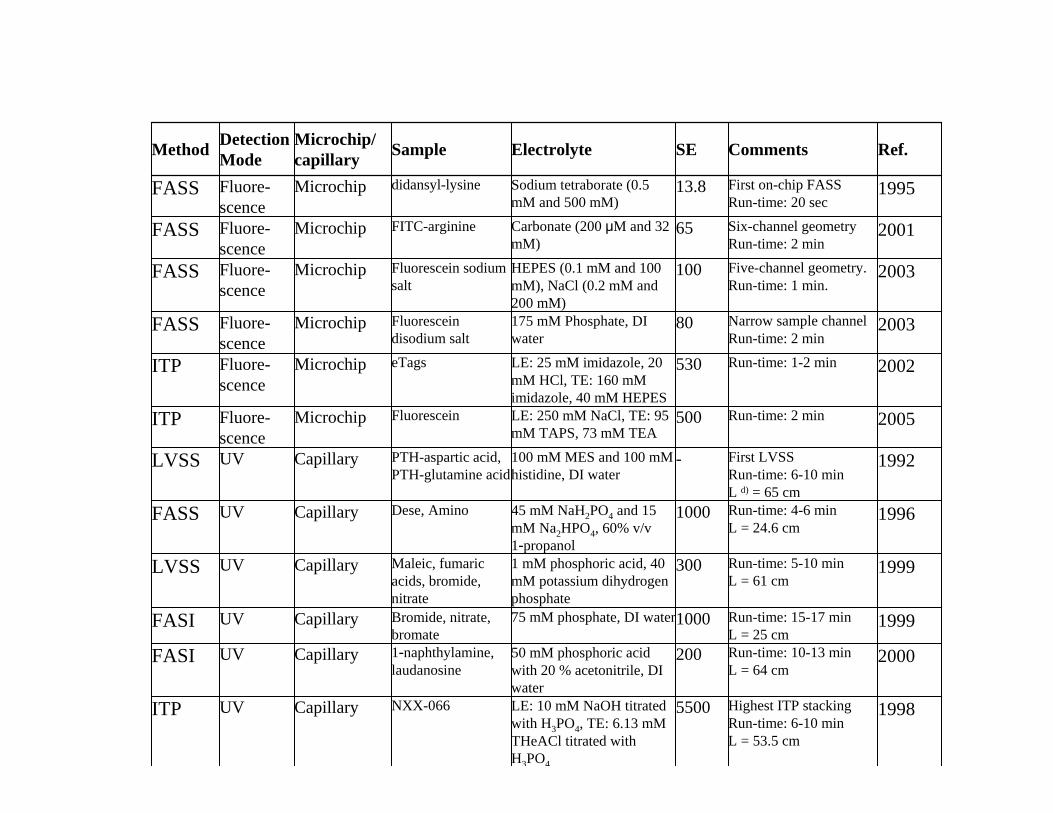
Isotachophoresis

ITP History
•Kohlrausch: KRF function in 1897.
•Tiselius: Moving boudnary electrophoresis, 1930
•Longsworth: Performed moving boundary electrophoresis in 1939.
•Martin AJP: Displacement electrophoresis (also called ITP) in 1942 for cation.
•Everaerts and Martin: First to perform ITP in thin capillaries (200 to 500 micron) in 1963. Used HEC to suppress EOF.
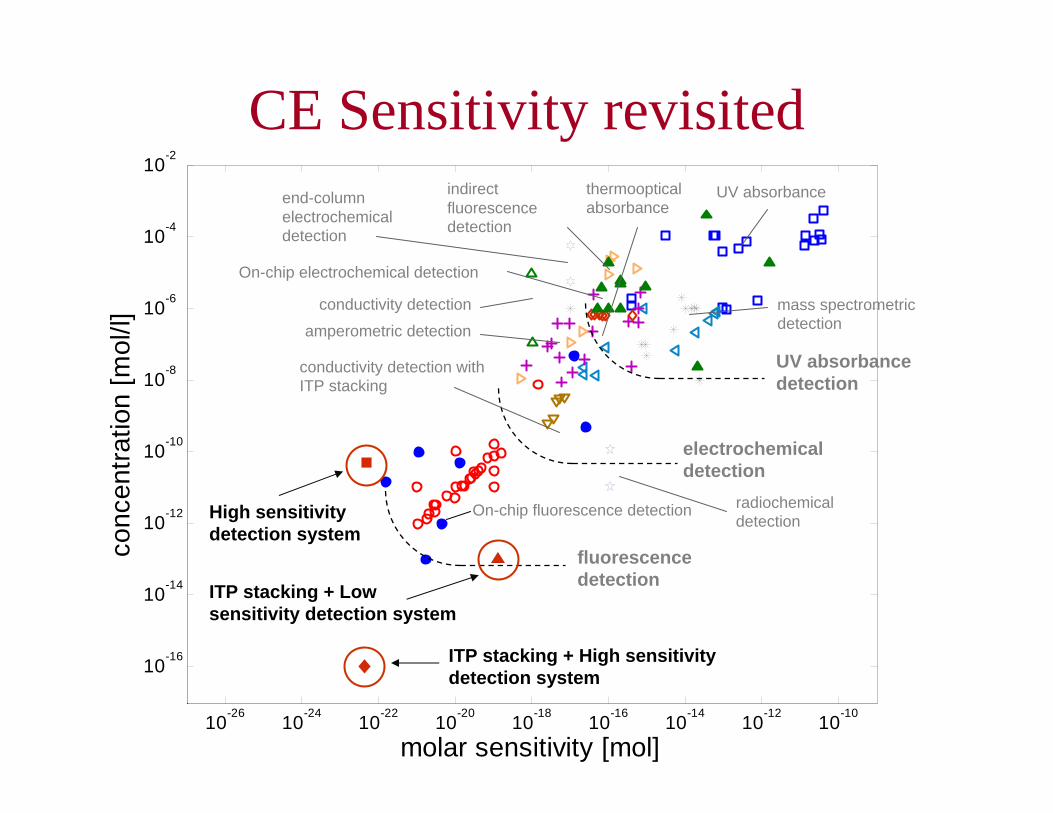
1998Highest ITP stackingRun-time: 6-10 minL = 53.5 cm
5500LE: 10 mM NaOH titrated with H3PO4, TE: 6.13 mMTHeACl titrated with H3PO4
NXX-066CapillaryUVITP
2000Run-time: 10-13 minL = 64 cm
20050 mM phosphoric acid with 20 % acetonitrile, DI water
1-naphthylamine, laudanosine
CapillaryUVFASI
1999Run-time: 15-17 minL = 25 cm
100075 mM phosphate, DI waterBromide, nitrate, bromate
CapillaryUVFASI
1999Run-time: 5-10 minL = 61 cm
3001 mM phosphoric acid, 40 mM potassium dihydrogenphosphate
Maleic, fumaricacids, bromide, nitrate
CapillaryUVLVSS
1996Run-time: 4-6 minL = 24.6 cm
100045 mM NaH2PO4 and 15 mM Na2HPO4, 60% v/v1-propanol
Dese, AminoCapillaryUVFASS
1992First LVSSRun-time: 6-10 minL d) = 65 cm
-100 mM MES and 100 mMhistidine, DI water
PTH-aspartic acid, PTH-glutamine acid
CapillaryUVLVSS
2005Run-time: 2 min500LE: 250 mM NaCl, TE: 95 mM TAPS, 73 mM TEA
FluoresceinMicrochipFluore-scence
ITP
2002Run-time: 1-2 min530LE: 25 mM imidazole, 20 mM HCl, TE: 160 mMimidazole, 40 mM HEPES
eTagsMicrochipFluore-scence
ITP
2003Narrow sample channelRun-time: 2 min
80175 mM Phosphate, DI water
Fluoresceindisodium salt
MicrochipFluore-scence
FASS
2003Five-channel geometry.Run-time: 1 min.
100HEPES (0.1 mM and 100 mM), NaCl (0.2 mM and 200 mM)
Fluorescein sodium salt
MicrochipFluore-scence
FASS
2001Six-channel geometryRun-time: 2 min
65Carbonate (200 μM and 32 mM)
FITC-arginineMicrochipFluore-scence
FASS
1995First on-chip FASS Run-time: 20 sec
13.8Sodium tetraborate (0.5 mM and 500 mM)
didansyl-lysineMicrochipFluore-scence
FASS
Ref.CommentsSEElectrolyteSampleMicrochip/ capillary
Detection ModeMethod

Sensitivity in Capillary Electrophoresis (no stacking)
1.E-14
1.E-12
1.E-10
1.E-08
1.E-06
1.E-04
1.E-02
1E-23 1E-21 1E-19 1E-17 1E-15 1E-13 1E-11molar sensitivity (mol)
conc
entra
tion
(mol
/l)
electrochemical detection
fluorescence detection
UV absorbance detection
UV absorbance
mass spectrometricdetection
UV absorbance withZ-shaped flow cells
radiochemical detection
conductivity detectionwith ITP stacking
conductivity detection
amperometricdetection
indirect fluorescencedetectionend-column
electrochemical detection
thermoopticalabsorbance
Chen et al. (1996)
Belder et al. (2002)
Ocvirk et al. (1998)

Leading Ion (LE)
Sample Ion
Trailing Ion (TE)
Counterion not shown
Order of mobility ν > ν > ν
Single Interface Isotachophoresis
• CharacteristicsSample zone grows with time.Stable concentration boundariesFinal Sample Concentration depends on Leading ion concentration
EE
ITP(S-) Alexa fluor (1 µM)HEPES (5mM)(TE)
HEPES (5mM)NaCl (large excess) (LE)
• Concentration enhancement greater than γ
• Buffer selections allow for both ITP and FASS
• ITP-type stacking with CE separation
50 µmγ = 393

50 µm
Stability under large disturbances
Stable over 1000+ diameters
Stable across flow geometries
5 mm
50 µm

ITP Optimization• Surface Chemistry: Suppressed EOF to minimize
advective dispersions.• High gradients: High LE concentration and very low
initial sample concentration (100 fM vs. 1 M or 1015
ratio)• Flow control: Injection protocol has
High TE concentration (maximizes local electric Peclet number)Requires no manual buffer exchange step (fast ITP to CZE transition w/ minimal dispersion)Large effective sample widthLE introduced within TE region, not end of capillary (this reduces time to overtake ITP zone)
• Achieved 1E6 stacking in < 2 minutesJung, B., Bharadwaj, R., Santiago, J.G., in press, Analytical Chemistry, 2005.
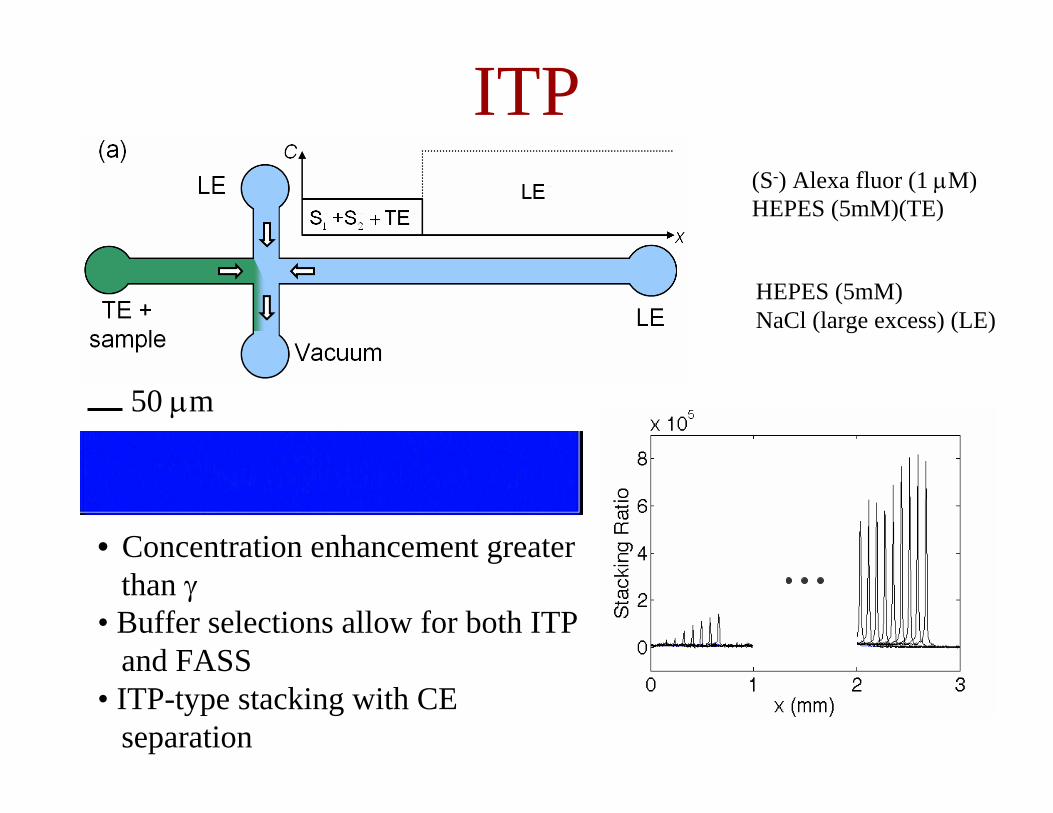
ITP and CE
50 µm0 1 2 3 4 5
x 10-4
0
200
400
600
800
1000
x (m)
Nor
mal
ized
Inte
nsity
γ = 393
(S-) Alexa fluor (1 µM)HEPES (5mM)(TE)
HEPES (5mM)NaCl (large excess) (LE)
Demonstrated >1e6-fold stacking on chipStacking achieved in less than 120 sec and < 1 cm
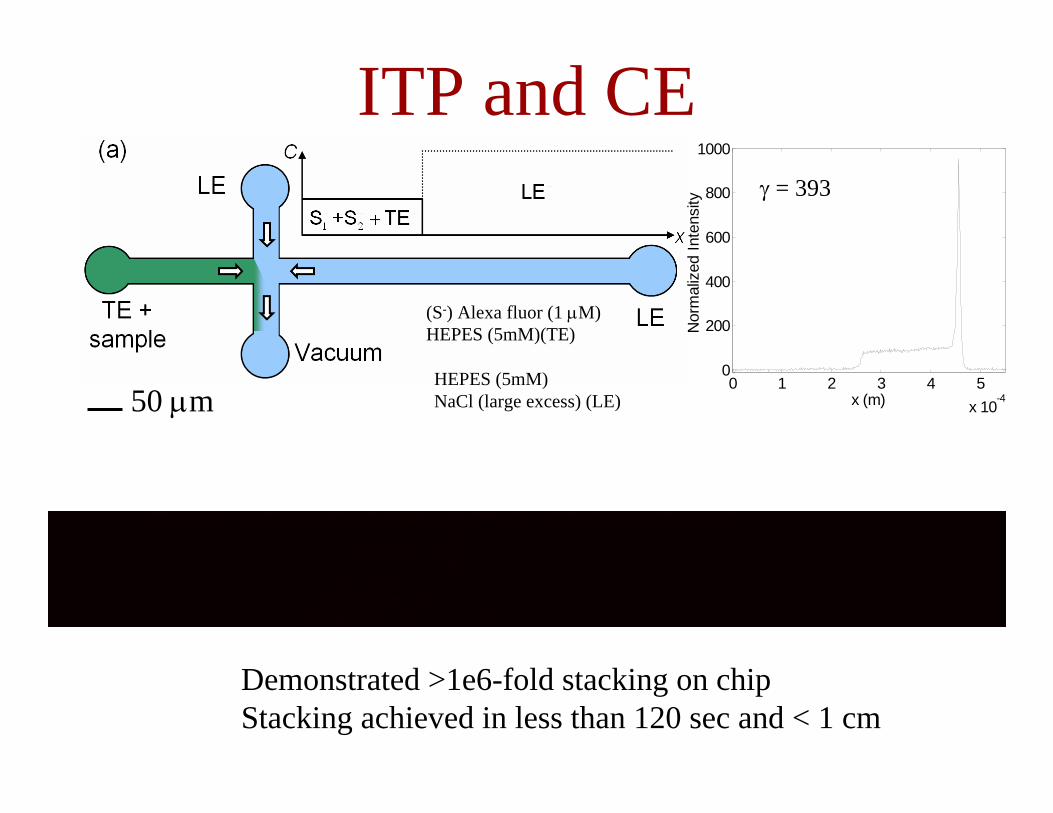
CE Sensitivity revisited
10-26 10-24 10-22 10-20 10-18 10-16 10-14 10-12 10-10
10-16
10-14
10-12
10-10
10-8
10-6
10-4
10-2
molar sensitivity [mol]
conc
entra
tion
[mol
/l]
UV absorbancethermoopticalabsorbance
indirect fluorescence detection
end-column electrochemical detection
conductivity detection
amperometric detectionmass spectrometric detection
UV absorbance detection
electrochemical detection
fluorescence detection
radiochemical detection
conductivity detection with ITP stacking
On-chip fluorescence detection
On-chip electrochemical detection
ITP stacking + High sensitivity detection system
ITP stacking + Low sensitivity detection system
High sensitivity detection system
72 73 74 75 76 77 78-5
0
5
10
15
20
25
30
time (sec)
CS (p
M)
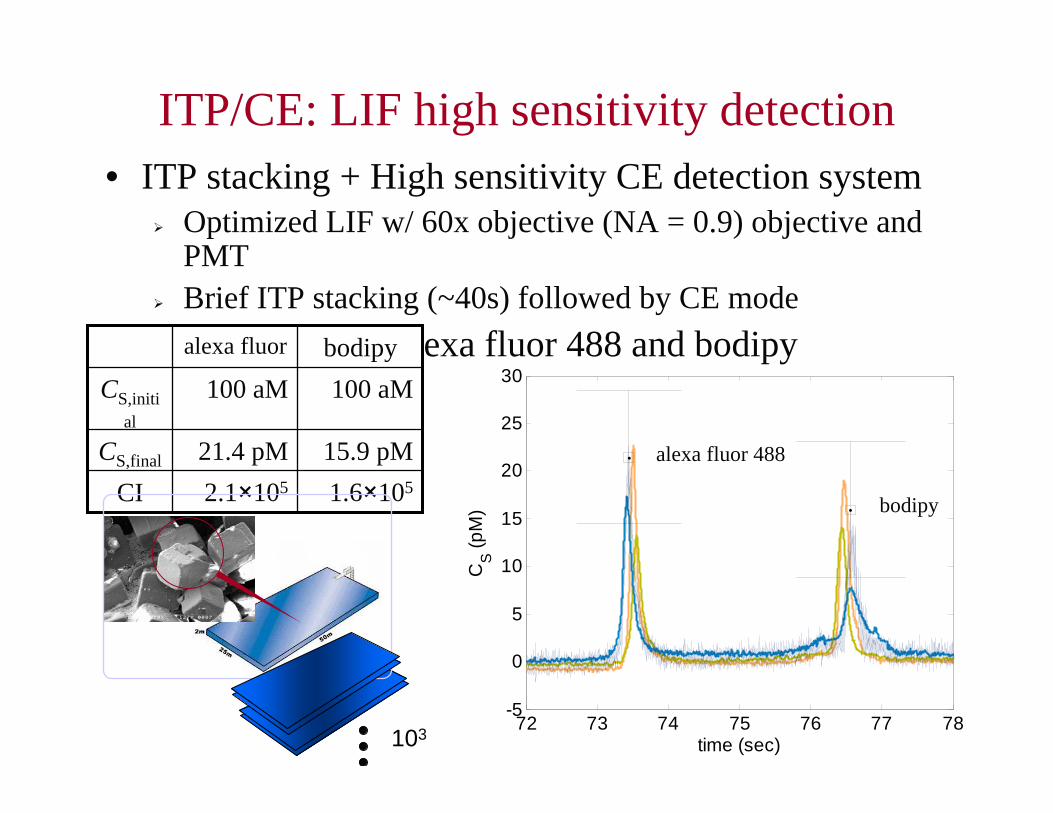
ITP/CE: LIF high sensitivity detection• ITP stacking + High sensitivity CE detection system
Optimized LIF w/ 60x objective (NA = 0.9) objective and PMTBrief ITP stacking (~40s) followed by CE mode
• Sample: 100 aM alexa fluor 488 and bodipy
alexa fluor 488
bodipy1.6×1052.1×105CI15.9 pM21.4 pMCS,final
100 aM100 aMCS,initial
bodipyalexa fluor
103

ITP SimulationsE = 500 V/cm
Buffer Counter-ion
Trailing
LeadingCollaboration with
Bijan Mohammadhi,Montpellier University, France
Lin, Storey, Santiago, submitted to Journal of Fluid Mechanics, 2006.Baldessari et al., under preparation, 2006
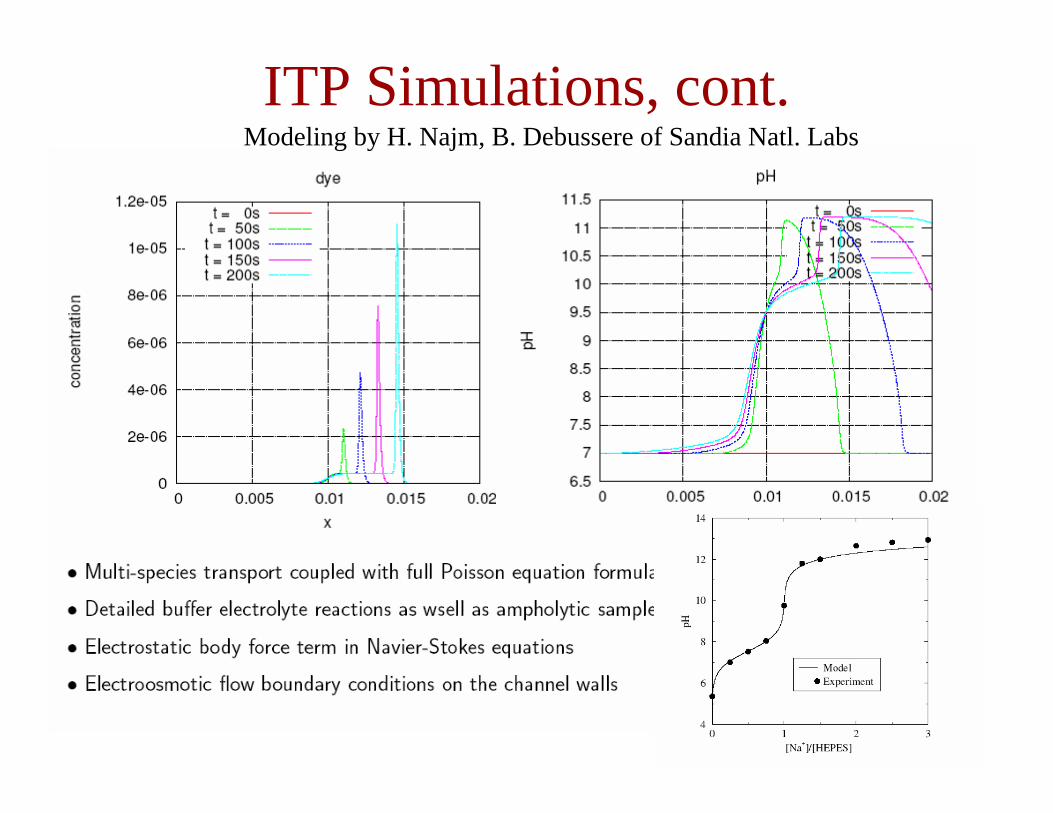
ITP Simulations, cont.Modeling by H. Najm, B. Debussere of Sandia Natl. Labs

Nanochannelelectrophoresis

Prior Work
Separation of DNA Petersen/Alarie/Jacobson/ Ramsey
Molecular dynamics simulationsQiao/Aluru
Ion depletion Pu/Yun/Datta/Gangopadhyay/ Temkin/Liu
Transport and dispersion of neutral species Griffiths/Nilson, Dutta/Kotamurthi
Conductance measurements Stein/Kruithof/Dekker
Analytical studies of flow Burgeen/Nakache, Rice/Whitehead
ExperimentalTheoretical
No work on charged species transport
No work separations or ion dispersion dynamics

• Nanofluidics Thick EDLEnables new functionality Method to determine both valence and mobility
Nanoscale Electrokinetics for small ions
Micro Nano
U(y)U(y)
Slower moving +2 ion Faster moving
+1 ion
h~10 µm
λd~20 nm h~100 nm
λd~20 nm
Ions moving at same speed
−
Eapplied
EEDL
+
− −+−
+
−+++
++
−
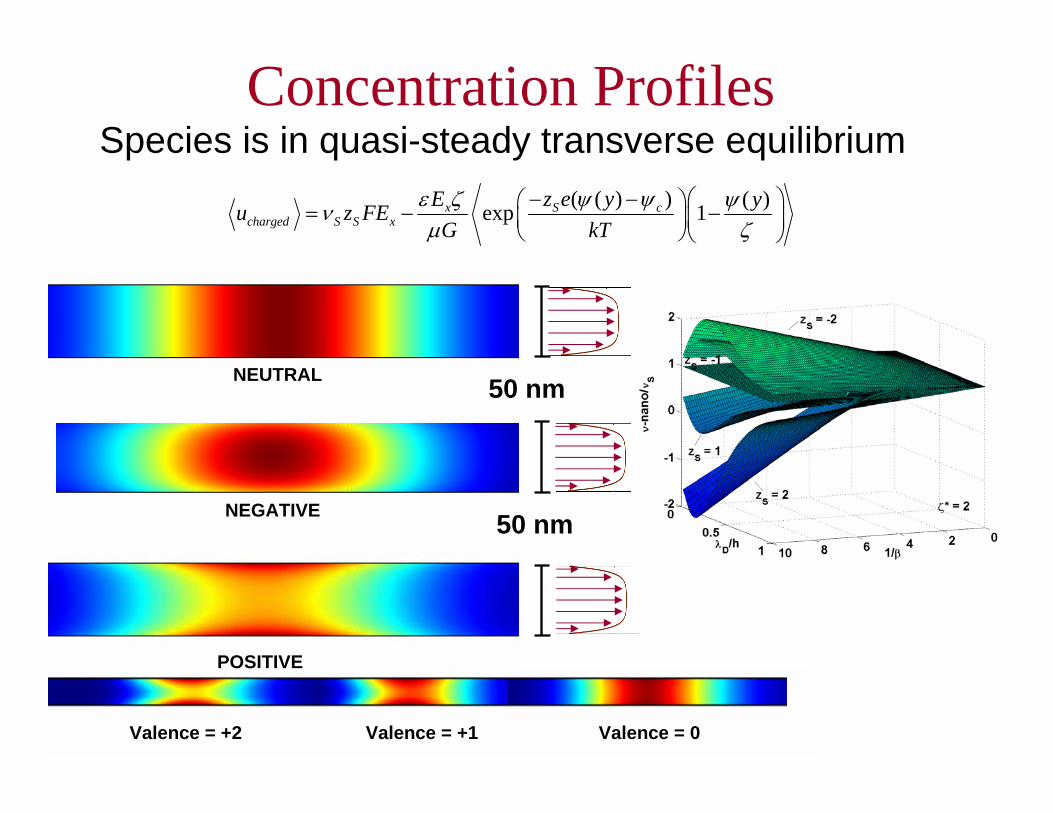
Concentration Profiles
NEUTRAL
NEGATIVE
POSITIVE
50 nm
50 nm
Species is in quasi-steady transverse equilibrium
Valence = +2 Valence = +1 Valence = 0
( ( ) ) ( ) exp 1x S ccharged S S x
E z e y yu z FEG kT
ε ζ ψ ψ ψνµ ζ
⎛ ⎞− −⎛ ⎞= − −⎜ ⎟⎜ ⎟⎝ ⎠⎝ ⎠

Nanochannel Fabrication
3um
• Techniques:• E-beam Lith < 500 nm• Photolith > 500 nm• Dry Plasma Etching• Fusion Bonding
detectionarea
7mm
nanochannel
tick marks

Species Transport
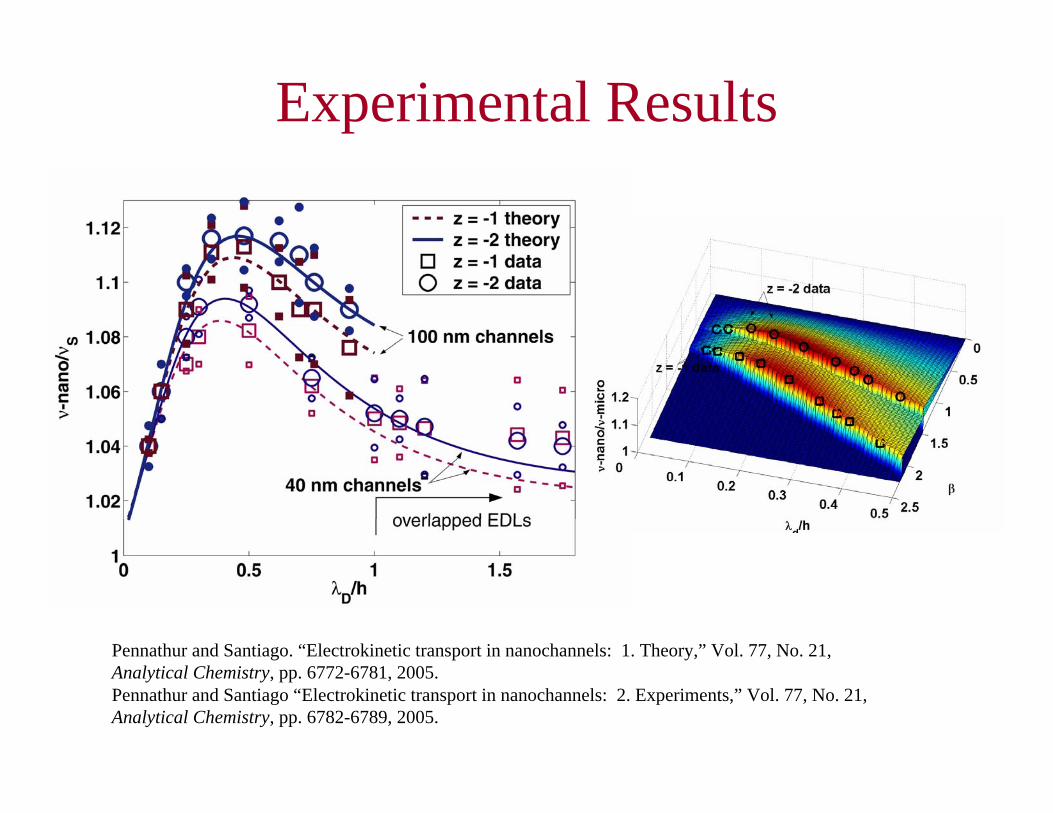
Experimental Results
Pennathur and Santiago. “Electrokinetic transport in nanochannels: 1. Theory,” Vol. 77, No. 21, Analytical Chemistry, pp. 6772-6781, 2005. Pennathur and Santiago “Electrokinetic transport in nanochannels: 2. Experiments,” Vol. 77, No. 21, Analytical Chemistry, pp. 6782-6789, 2005.

Oligonucleotide Separation• Length scales on same order
Nanochannel heightEDL thicknessDNA length
3 Length Scales:
λM
λD
L
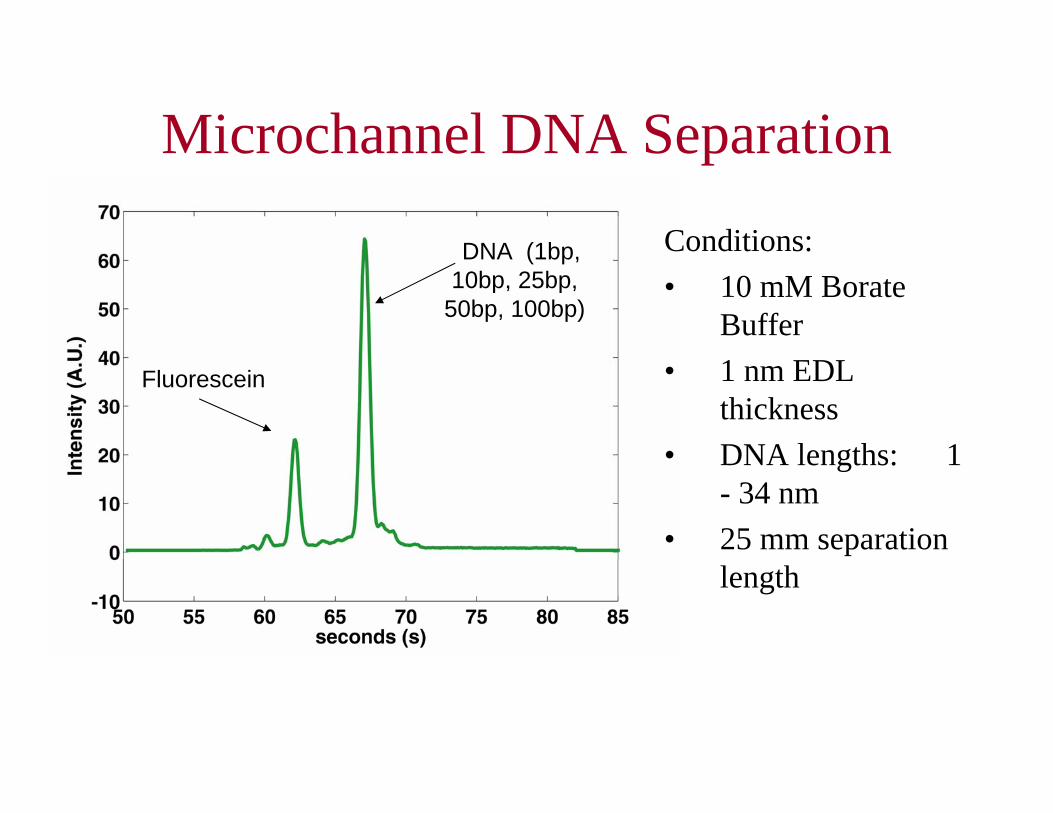
Microchannel DNA Separation
Fluorescein
DNA (1bp, 10bp, 25bp,
50bp, 100bp)
Conditions:• 10 mM Borate
Buffer• 1 nm EDL
thickness• DNA lengths: 1
- 34 nm• 25 mm separation
length
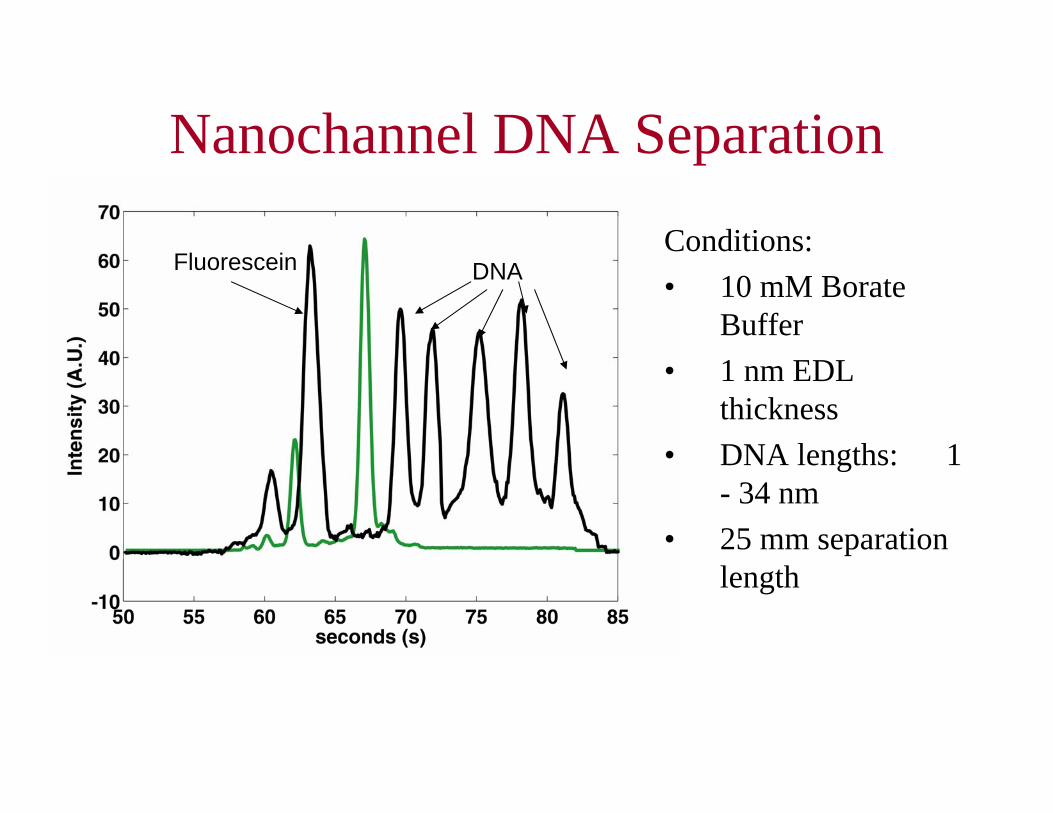
Nanochannel DNA Separation
Fluorescein
DNAFluorescein DNAConditions:• 10 mM Borate
Buffer• 1 nm EDL
thickness• DNA lengths: 1
- 34 nm• 25 mm separation
length
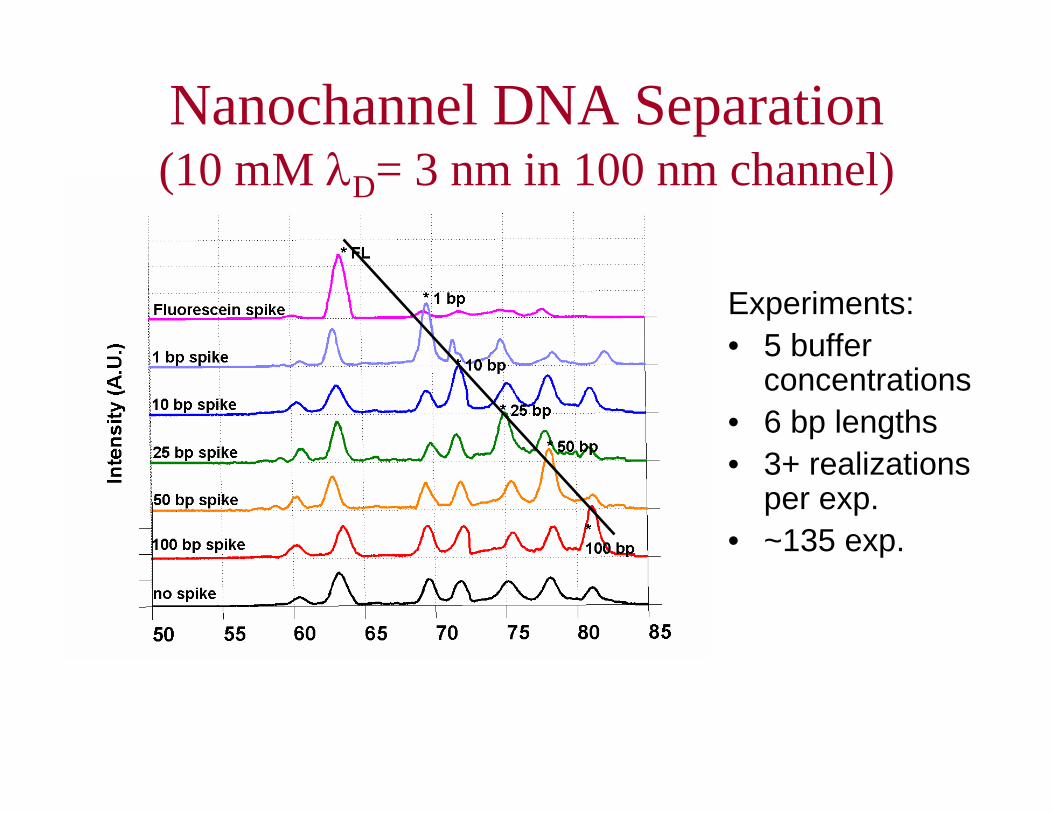
Nanochannel DNA Separation(10 mM λD= 3 nm in 100 nm channel)
Experiments:• 5 buffer
concentrations• 6 bp lengths • 3+ realizations
per exp.• ~135 exp.

Nanochannel DNA Separation(1 mM λD= 10 nm in 100 nm channel)
Conditions:• 1 mM Borate
Buffer• 10 nm EDL
thickness• DNA lengths: 1
- 34 nm• 25 mm separation
length

DNA separation in nanochannels
Small ion theory

Oligonucleotide Separation• Length scales on same order
Nanochannel heightEDL thicknessDNA length
3 Length Scales:
λM
λD
L
• Interaction betweenTransverse electromigrationNon-uniform velocity field/diffusion couplingSteric interactions with wallPolarization @105V/cm
• 3D electrokinetic instability modeling• ITP modeling
Analytical models for shock width and concentration increaseNumerical models including
• N species• Reaction kinetics of buffer• pH gradients
• DNA separation in nanochannelsSingle bp resolution DNA separation in nanochannels
• Roughly 1/3rd of human genome costs was reagents• Ultra high sensitivity
Molecular dynamics modeling (w/ Eric Shaqfeh)• Combine ITP and nanochannel electrophoresis
Near-Future Work

AcknowledgementsMicrofluidics Lab Members:• EK instabilities and micromixing
Dr. Michael Oddy*Dr. Chuan-Hua Chen *
Dr. Hao Lin *Dr. Jonathan Posner *David Hertzog *
• Sample pre-concentrationRajiv Bharadwaj *Byoungsok JungDavid HuberAlexandre Persat
• Particle tracking & controlKlint Rose(Shankar Devasenathipathy) *
• On-chip CE and nanochannel workTarun KhuranaDr. Fabio BaldessariSumita Pennathur *Alexandre PersatJulien Sellier
Funding Sources:• NSF PECASE/CAREER Award• NIH/NIHLB Proteomics Grant