Embed Size (px)
Citation preview

Stanford Exploration Project, Report 111, June 9, 2002, pages 393–401
392
Stanford Exploration Project, Report 111, June 9, 2002, pages 393–401
Short Note
Displaying seismic data with VTK
Elkin R. Arroyo and Robert G. Clapp1
INTRODUCTION
In exploration geophysics most simple targets have now been found and exploited. Newprospects are structurally complex requiring 3-D acquisition and imaging. The need to ef-fectively build a velocity model for 3-D imaging and to effectively view the resulting imagehas led to the need to build more sophisticated viewing software.
Over the years SEP has made several attempts to address this need. Ottolini (1983) built aneffective 3-D viewing program, later expanded upon in Clapp (2001). Later, several attemptswere made to use the proprietary Advance Visual System (AVS)2 package to build an inte-grated viewer (Biondi and van Trier, 1993; Clapp et al., 1994; Mora et al., 1995, 1996). Theseattempts were frustrated by the proprietary nature of the product, the hardware requirements toeffectively run it, and the programming expertise needed to use a package originally designedfor another field (chemistry).
In the last few years the need for an effective visualization software at SEP has increasedwhile many of the limitations that hampered previous attempts have been overcome. Withthe increased power and decreased cost of linux workstations with 3-D accelerated graphics,desktop viewing is more feasible. In addition, numerous 3-D visualization packages have be-come publically available. One such package, Visualization Toolkit(VTK)3 holds particularpromise. It has a diverse user base, C++, Python, Tcl, and Java interfaces, and an intuitivedesign. In this paper we build a cube and surface viewer using the VTK library. We begin bydiscussing some of the capabilities of VTK and general implementation design. We then de-scribe how to use it to view seismic data (VtkCubeplot ) and Gocad surfaces (VtkGocadplot ).We conclude with some future directions for the work to make it an even more effective re-search tool.
1email: [email protected],[email protected]://www.avs.com3http://www.kitware.com/vtk.html
393

394 Arroyo and Clapp SEP–111
VISUALIZATION AND VTK
Visualization is the transformation of data or information into pictures. Visualization usesgraphics to give insight into certain abstract data and symbols. Visualization is a necessarytool to make sense of the flood of information in today’s world of computers. Seismic dataacquisition system nowadays are capable of acquiring hundreds of gigabytes in a few days andseismic processing itself produces a lot of information that, without visualization, would stayunseen on computers disks and tapes.
There is another advantage of visualization, it utilizes the human vison system. With theintroduction of these new tools, it will be possible to use our highly developed visual sense,and therefore to better understand and analyze the seismic information.
Common visualization tools
There are many commercial and free visualization software packages. It is difficult to cate-gorize visualization tools because most have a variety of functions covering many differentapplications, and many have overlapping functions. Common visual programming system in-clude VTK, AVS/Express, Iris Explorer4, IBM Data Explorer5 and Khoros6, all of which arebased on low-level graphics libraries like OpenGL7, Direct3D8, Phigs9 and GKS-3D10.Themost widely accepted and used is of these OpenGL.
VTK interaction with SEP Data Structures
In the following section we explain basic concepts of the VTK data model and explain whichone we choose to represent the seismic information and which one to represent the GOCADsurfaces. For a more detailed description see?.
The VTK data model consists of two pieces: an organizing structure (the shape or geome-try ) and associated information to each element in the structured known as the attribute data.Examples of each are shown in the table below:
Organizing structure Data attribute
Points,triangles, Scalars,quadrilaterals, vectors, normals,tetrahedral, texture coordinates
4www.nag.co.uk/Welcome_IEC.html5www.ibm.com/dx6www.khoral.com7www.opengl.org8www.microsoft.com9http://www.gsi.de/computing/unix/primer/graphical_tools/subsection3.1.1.html
10web.ansi.org

SEP–111 VTK 395
Regular data has an inherent relationship between data points. For example, if we samplean evenly spaced set of points, we do not need to store all point coordinates, just the beginning(o), the spacing between points (d) and the total number of points (n). This is the case of2D/3D seismic information and also the way SEP structures a data cube.
For irregular data there is not a defined pattern between points or cells and therefore wecan represent arbitrary structures. This is the case of the GOCAD surfaces. A big advantageof irregular data is that we can represent information more densely where it changes quicklyand less densely where the changes are more subtle.
Attribute data is associated with each point in the structure and consists of scalars (whichare single value functions like trace amplitudes), vectors, normals, texture coordinates, tensors,etc.
For implementing our visualization tools we choose to use the classvtkStructuredPoints
to represent the seismic information and the classvtkUnstructuredGrid to represent the GO-CAD surfaces. CurrentlyVtkCubeplot only supports a single value attribute data for theseismic information which means that we use the VTK classvtkScalar to express the traceamplitudes or velocities. The SEP applicationvtkGocadplot currently supports scalar repre-sentations and 3D vectors.
Pipeline structure of VTK
SEPlib and VTK share the ability to send information from one program to others to processthe information and to obtain the final best image. This philosophy helps SEPlib and VTKusers to easily get acquired with the software. For developing the SEP programsVtkCubeplot
andVtkGocadplot , first we read the information using the set of SEP functions to read SEPdata cubessreed . This information is then reordered in the VTK way using the structuredstorage for theVtkCubeplot explained earlier and the unstructured storage format for theVtkGocadplot . After that, we implement a set of filters or functions that helps to constructthe cutting planes, using the classvtkCutter . This takes the seismic information and thedefined planes, cuts along the desired plane and interpolates the seismic amplitudes alongthe cutting surface. Input planes by default are located at center of the SEP data cube. Asimilar approach is used for the contour values in theVtkGocadplot program. We use theclassvtkContourFilter which takes as input the GOCAD surface, and the user defines thenumber of contour values and the color map to be used.
VIEWING SEISMIC DATA
The display of 3-D data is a challenging problem. SEP has developedCubeplot andRicksep
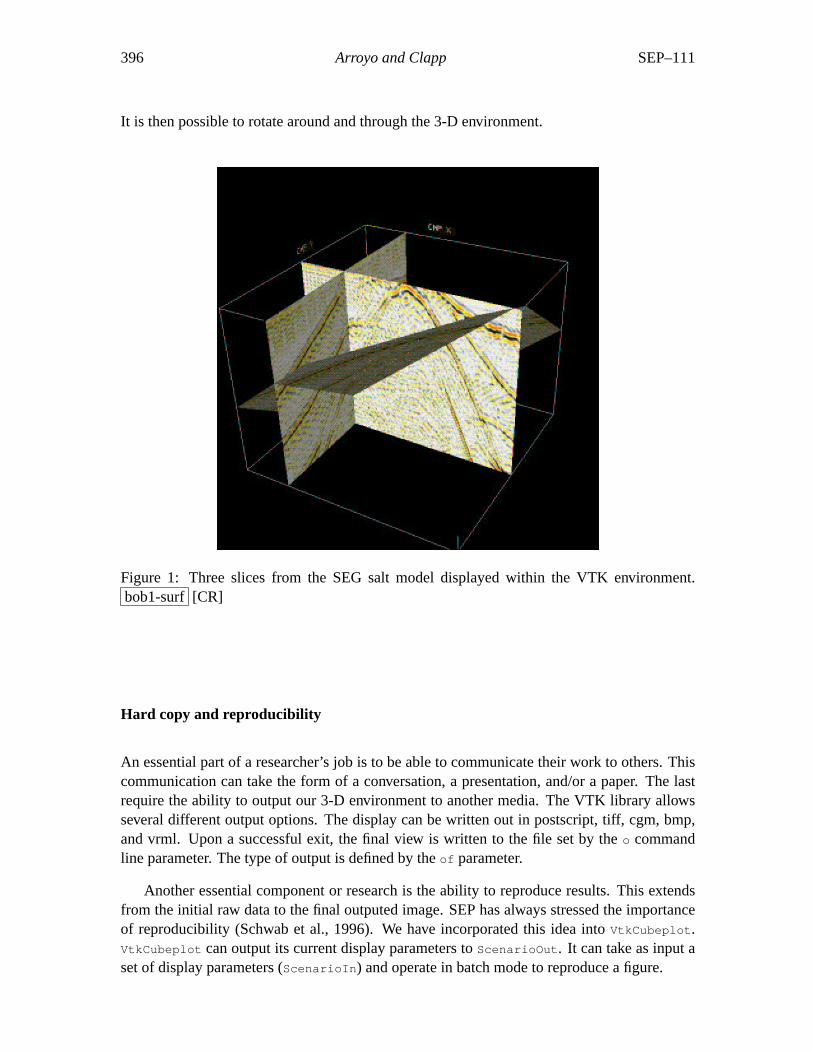
in order to facilitate the viewing of 3-D cubes. Both of these options are limited to viewingorthogonal slices of a cube with little concept of the 3-D nature of the data. Often viewing thedata in a true 3-D environment can offer additional insight.VtkCubeplot offers this ability. AsFigure 1 demonstrates theVtkCubeplot program can display arbitrary planes of a 3-D cube.
396 Arroyo and Clapp SEP–111
It is then possible to rotate around and through the 3-D environment.
Figure 1: Three slices from the SEG salt model displayed within the VTK environment.bob1-surf [CR]
Hard copy and reproducibility
An essential part of a researcher’s job is to be able to communicate their work to others. Thiscommunication can take the form of a conversation, a presentation, and/or a paper. The lastrequire the ability to output our 3-D environment to another media. The VTK library allowsseveral different output options. The display can be written out in postscript, tiff, cgm, bmp,and vrml. Upon a successful exit, the final view is written to the file set by theo commandline parameter. The type of output is defined by theof parameter.
Another essential component or research is the ability to reproduce results. This extendsfrom the initial raw data to the final outputed image. SEP has always stressed the importanceof reproducibility (Schwab et al., 1996). We have incorporated this idea intoVtkCubeplot .VtkCubeplot can output its current display parameters toScenarioOut . It can take as input aset of display parameters (ScenarioIn ) and operate in batch mode to reproduce a figure.
SEP–111 VTK 397
Additional command line options
The user can press key ‘3’ and get a sterescopic view through inexpensive polarized glasses.It can easily switch between normal viewing and stereoscopic view. A 3D image is like anordinary picture, but a stereo image gives a stronger sense of depth. This is generated byproviding two slightly different images of the same object to each eye separately. Other optionsinclude:
co Colormap
bg Background color
pcn1,pcn2,pcn3Location of the three cutting planes
env1,env2,env3The orientation of the cutting plane.
op Opacity
sc1,sc2,sc3Value to scale (x,y, and z) of the surface
VIEWING SURFACES
In addition to being able to slice through regular cubes in a 3-D environment a 3-D vieweroffers the ability to display surfaces. The surface can be either a 2-D regular mesh or an irreg-ular mesh with connectivity information. The regular mesh option might be used to displayan impulse response, where the z axis is used for the amplitude at various locations. To someextent this would duplicate the functionality of the SEPlib programThplot but with surfacerather than line displays and interactivity.
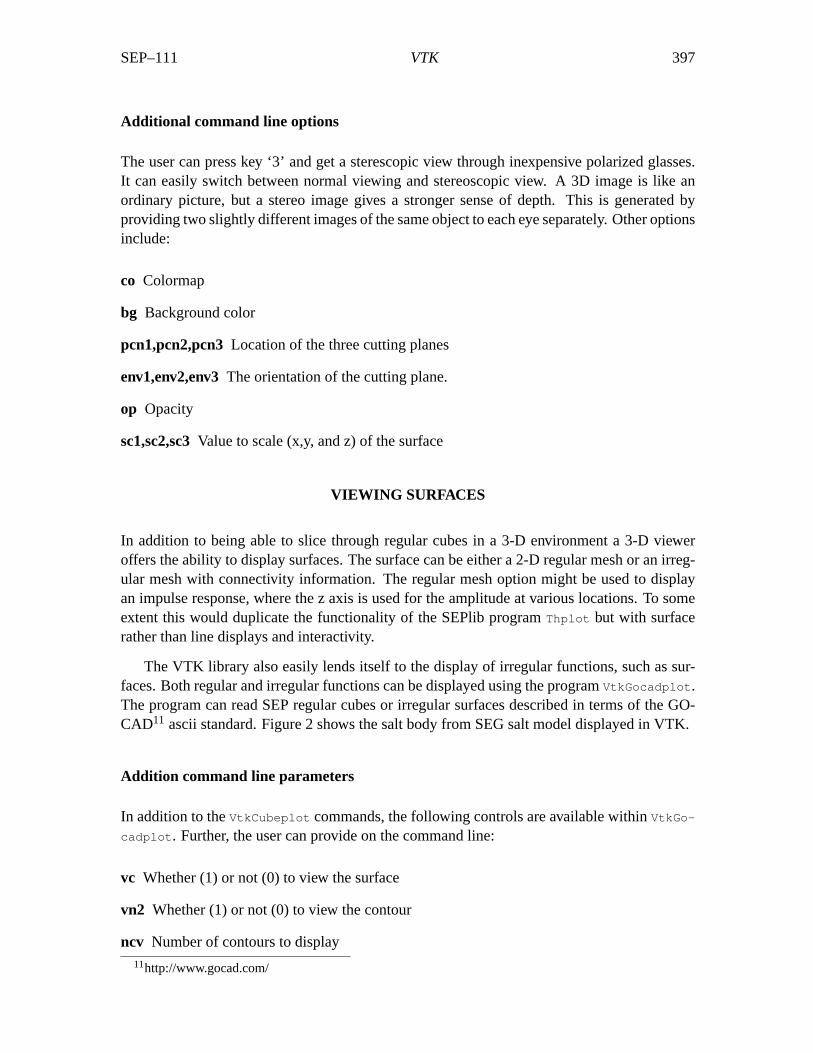
The VTK library also easily lends itself to the display of irregular functions, such as sur-faces. Both regular and irregular functions can be displayed using the programVtkGocadplot .The program can read SEP regular cubes or irregular surfaces described in terms of the GO-CAD11 ascii standard. Figure 2 shows the salt body from SEG salt model displayed in VTK.
Addition command line parameters
In addition to theVtkCubeplot commands, the following controls are available withinVtkGo-
cadplot . Further, the user can provide on the command line:
vc Whether (1) or not (0) to view the surface
vn2 Whether (1) or not (0) to view the contour
ncv Number of contours to display11http://www.gocad.com/
398 Arroyo and Clapp SEP–111
cc Whether (1) or not (0) to display color line with its own color
smooth Whether (1) or not (0) to smooth the surface
nis Number of laplacian smoothing to perform
Figure 2: VTK displaying the GOCAD salt surface of the SEG salt model.bob1-gocad[CR]
CONCLUSIONS AND FUTURE WORK
We built both a cube viewer and a surface viewer using the VTK library. To make theseviewers more effective research tools, several additions need to be made.
• Geophysical data sets are generally very large. Due to this, SEP has a long backgroundin developing parallel algorithms. One of the next steps in the development of theVtkCubePlot andVtkGocadPlot therefore will be to take advantage of the parallel ca-pabilities of VTK with MPI.
• The ability to interactively slice through the cube rather than requiring slice selection atinitiation.
• The ability to pick and store locations within the space.
SEP–111 VTK 399
• The ability to have an interactive list of multiple objects (planes, triangulated surfaces,lines) which can be displayed and/or not displayed interactively.
• The ability to modify objects such as triangulated surfaces.
• The ability to do texture mapping (e.g. velocity surface model with seismic amplitudesoverlayed).
• The ability to annotate in the 3-D environment.
• Arbitrary number of cutting planes, and orientation for each plane, currently only 3 cut-ting planes are supported and only the time plane has arbitrary orientation capabilities.
• Texture mapping of the seismic data over the GOCAD surfaces.
REFERENCES
Biondi, B., and van Trier, J., 1993, Visualization of multi-dimensional seismic datasets withCM-AVS: SEP–79, 1–12.
Clapp, R. G., Biondi, B., and Karrenbach, M., 1994, AVS as a 3-D seismic data visualizingplatform: SEP–82, 97–106.
Clapp, R., 2001, Ricksep: Interactive display of multi-dimensional data: SEP–110, 163–172.
Mora, C. B., Clapp, R. G., and Biondi, B., 1995, Velocity model building in avs: SEP–89,133–144.
Mora, C. B., Clapp, R. G., and Biondi, B., 1996, Visualization of irregularly sampled seismicdata with AVS: SEP–93, 75–86.
Ottolini, R., 1983, Movie cubes: SEP–35, 235–240.
Schwab, M., Karrenbach, M., and Claerbout, J., 1996, Making scientific computations repro-ducible: SEP–92, 327–342.

400


![home [Stanford Exploration Project]sep › sep › berryman › PS › partsat.pdf · )+*-, .0/21 3546.0787:9;, *-=@? ACBED *GF(.IHJ7LKNM *PO;*RQTSTK(< *-UWVX](https://img.pdfslide.us/doc/110x75/60c3aaca00cc4423283776fe/home-stanford-exploration-project-a-sep-a-berryman-a-ps-a-partsatpdf.jpg)


![An AVO analysis project - home [Stanford Exploration Project]](https://img.pdfslide.us/doc/110x75/6189935a5dca41757e37189c/an-avo-analysis-project-home-stanford-exploration-project.jpg)