Embed Size (px)
Citation preview
1
Stanford CEE 226: Life Cycle Analysis Project
San Francisco Presidio Façade Panels: FRP vs. Limestone
John Basbagill, Carolyn Galayda, Kelly Ju, Daniel Moreno, Ben Welle
December 4, 2009
2
Abstract
Kreysler and Associates, a manufacturer of fiber reinforced polymer (FRP) materials, is replacing limestone cladding panels with FRP panels on the Public Health Services Hospital in San Francisco’s Presidio Park. Buildings consume a significant amount of energy in the United States1, and Kreysler wants to validate their belief that FRP is a greener material than limestone as well as to pinpoint modifications to FRP panels’ life cycle inputs that will result in a greener material. This paper provides a recommendation to Kreysler as well as determines the effectiveness of process-based life cycle analysis (LCA) in meeting Kreysler’s objectives.
LCA was used to compare the limestone and FRP panels. Process flow diagrams outlined scope and boundaries, a 1’x1’ panel was chosen as a functional unit, and Simapro was used to model the life cycle of the two panels. Results showed that the environmental impact of FRP panels was greater in many categories, and medium density fiber (MDF) particle board used to mold the FRP panels was the biggest contributor. Replacing MDF with plywood resulted in lower environmental impacts than limestone for all categories. The paper recommends FRP panels as the greener material after this modification and concludes that process-based LCA is an effective method of comparing building materials and optimizing inputs to create greener materials.
3
Table of Contents
Abstract ......................................................................................................................................................... 2
Table Summary ............................................................................................................................................. 4
Introduction................................................................................................................................................... 5
FRP Production, Transportation, and Installation Processes ........................................................................ 7
FRP: Material Components....................................................................................................................... 7
FRP: Production Process........................................................................................................................... 7
FRP: Panel Electricity Requirements...................................................................................................... 10
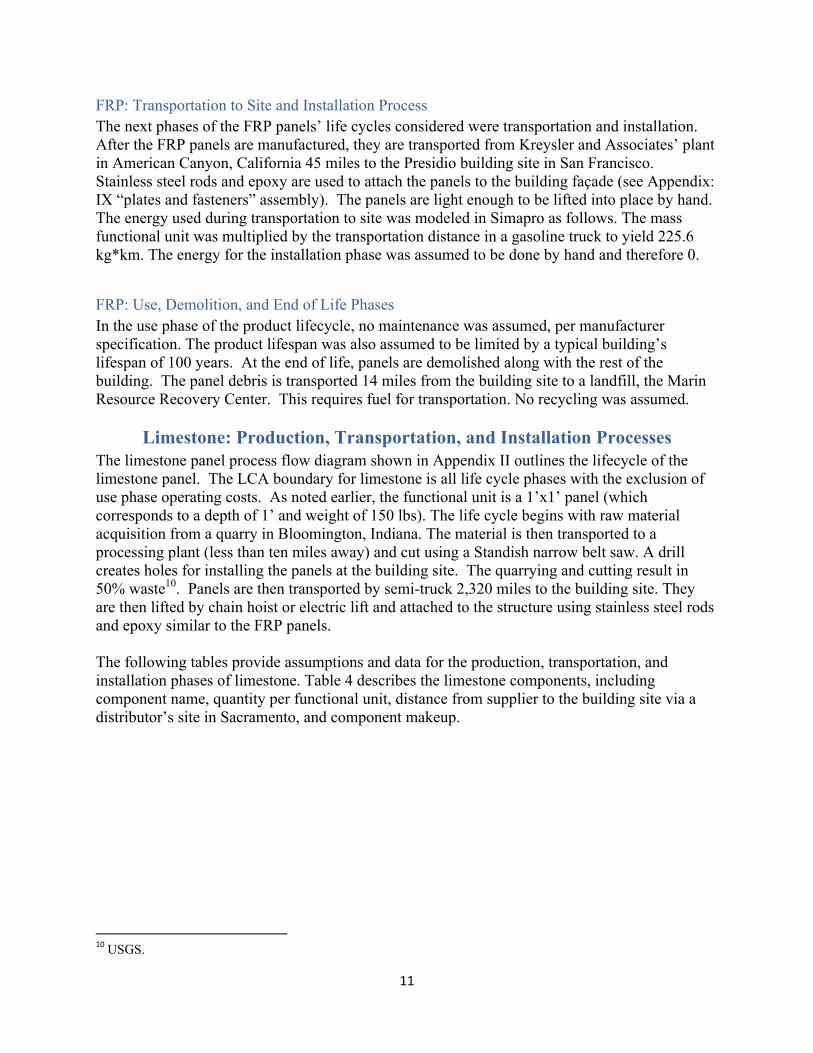
FRP: Transportation to Site and Installation Process.............................................................................. 11
FRP: Use, Demolition, and End of Life Phases ...................................................................................... 11
Limestone: Production, Transportation, and Installation Processes ........................................................... 11
Limestone: Use, Demolition, and End of Life Phases ............................................................................ 13
FRP and Limestone: Use Phase Operating Costs ....................................................................................... 13
Impact Assessment Results and Analysis ................................................................................................... 13
Life Cycle Cost Analysis ............................................................................................................................ 14
FRP Life Cycle Cost Analysis ................................................................................................................ 15
Limestone Life Cycle Cost Analysis ...................................................................................................... 15
Regulatory and Performance Drivers.......................................................................................................... 15
Conclusions and Recommendations ........................................................................................................... 16
Appendix I – FRP Facade Process Flow Diagram...................................................................................... 17
Appendix II – Limestone Facade Process Flow Diagram........................................................................... 18
Appendix III – Shop Drawings ................................................................................................................... 19
Appendix IV – FRP 2% MDF Molds Results............................................................................................. 20
Appendix V – FRP 100% Plywood Molds Results .................................................................................... 23
Appendix VI – Limestone Results .............................................................................................................. 26
Appendix VII – FRP vs. Limestone Results ............................................................................................... 29
Appendix VIII – FRP Component Data Sheets .......................................................................................... 33
Appendix IX – Panel Fasteners................................................................................................................... 37
Bibliography................................................................................................................................................ 39

4
Table Summary
Table 1: FRP Component Assemblies .......................................................................................................... 8
Table 2: Electricity Assumptions for FRP Panels....................................................................................... 10
Table 3: Electricity Requirements Per Category for FRP Panels ............................................................... 10
Table 4: Limestone Component Assemblies .............................................................................................. 12
Table 5: Limestone Panel Process Requirements ....................................................................................... 12
Table 6: Electricity Requirements Per Category for Limestone Panels...................................................... 13
Table 7: FRP & Limestone Life Cycle Cost Analysis ................................................................................ 15
5
Introduction
Buildings are a significant source of energy consumption in the United States, accounting for 40% of all energy used1. Materials contribute greatly to this rate due to the cost of excavating, processing, and transporting the materials to the building site. Several types of materials may be chosen depending on the particular building application, and each material has a unique emissions profile. For example, a variety of exterior cladding materials exists including glass, wood, stone, clay, metal, composites, and brick. Which material will contribute least to a building’s energy footprint? Can those inputs to the life cycle phases of a material that contribute the most to this footprint be identified, then modified, to create a greener material?
Process-based life cycle analysis (LCA) is a method of answering these questions by comparing building materials. The process determines which material results in a lower energy and emissions footprint for a building. Another potential benefit of this method arises when designing green building materials. Inputs within phases of materials’ life cycles can be identified then modified to yield greener materials.
This process-based approach to comparing and “greening” building materials can be applied to a current project of Kreysler and Associates. The company fabricates composite building materials at their headquarters in American Canyon, California, about 45 miles northeast of San Francisco. Currently they are replacing 277 cladding panels on the Public Health Services Hospital (PHSH) in San Francisco’s Presidio Park and would like to know whether their replacement material is greener than the old material.
The PHSH is a certified historic structure undergoing a transformation from hospital to luxury apartments. Built in 1931, the hospital was abandoned from 1988 to 2009. Renovation has recently begun to transform the 220,000 square foot building into 154 LEED Silver apartments. Historic windows and facades are being refurbished. The project also qualifies for the Federal Historic Preservation Tax Incentives program: the owner receives a tax credit equal to 20% of the amount spent in the certified rehabilitation of the structure. Materials must either be replaced with identical materials or government-approved substitutions2.
Kreysler’s fiber reinforced polymer (FRP) material, made primarily of unsaturated polyester resin and manufactured at Kreysler’s headquarters, has been approved as a replacement for the old limestone cladding material. Kreysler is mid-way through the panel replacement process and has two objectives, to: 1) seek validation that their product is greener than limestone and 2) determine ways in which their FRP panels’ life cycle may be modified in order to create a greener material. Kreysler wishes to use the results to create greener building materials. This paper’s goals are to provide a recommendation to Kreysler and determine whether process-based LCA is effective in meeting Kreysler’s two objectives.
1 US Department of Energy. Annual Energy Review 2008, 26 June 2009, accessed 26 November 2009.2 National Park Service, US Department of the Interior. Historic Preservation Tax Incentives, 2009.

6
Process Flow Diagrams
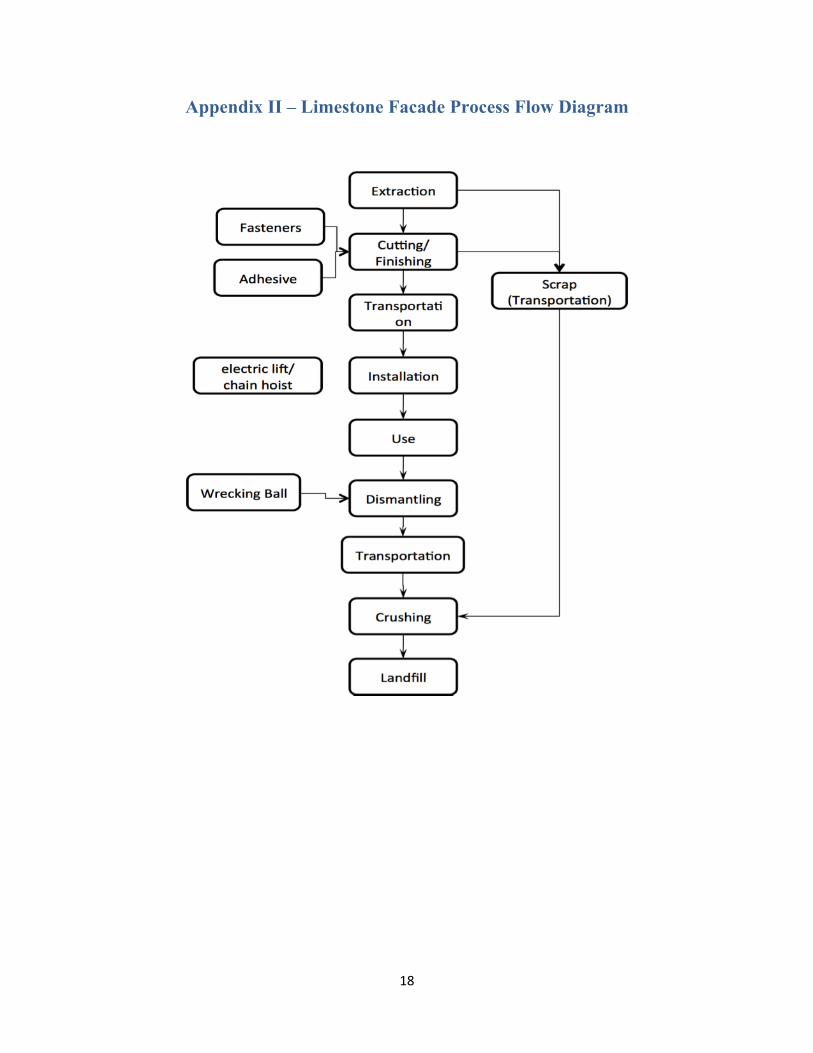
The first step in determining process-based LCA’s effectiveness in evaluating building materials’ environmental impacts is to construct process flow diagrams of the materials’ life cycles. Since the life cycle of a given material can have an infinite loop of process inputs, process flow diagrams are a visual way of mapping out scope and boundaries for a life cycle analysis. Appendix I and II show the process flow diagrams constructed for FRP and limestone, respectively. The diagrams identify the key stages of limestone’s and FRP’s life cycles that were included in the analysis: raw material acquisition and transportation, material processing, panel fabrication, transportation to the Presidio, installation, use, demolition, and end of life. The diagrams also identify the materials that go into manufacturing, finishing, assembling, and installing the two panels as well as equipment and transportation needs at each stage. All phases were considered - from acquisition to end of life - except for the use phase operating costs. Boundaries were also drawn to exclude the following: energy requirements for machinery used in raw material acquisition and components accounting for less than 1% of energy inputs, such as FRP molds that Kreysler uses to manufacture the FRP panels.
Functional Unit
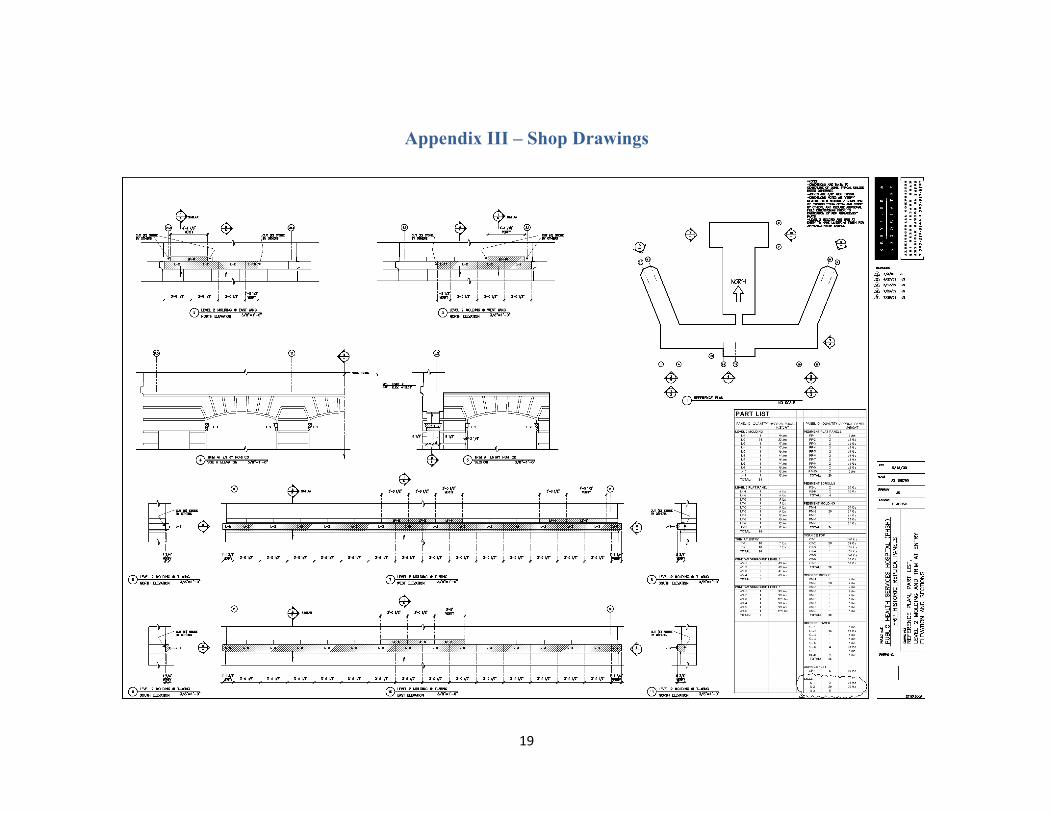
A functional unit of a 1’x1’ flat panel was then chosen to compare the two materials. Since the FRP panels are fabricated into complicated shapes with varying weights, depths, and ornamentation details, the panel weights were averaged by referring to shop drawings (see Appendix III). The mean panel weight was 3 lbs, and the average depth was 9 mm. By comparison, the limestone panels all consist of a uniform, flat shape lacking ornamentation details. The limestone panels are 1’ deep, and a 1’x1’ panel weighs 135 lb.
Methods and Key Assumptions
Simapro was then used to model the life cycle of the two materials in order to obtain data on energy inputs and emissions outputs. Surrogates were used for some of the materials, including low density poly ethylene for the initiator (methyl-ehtyl-ketone peroxide). Outputs from the software program Building for Environmental and Economic Sustainability (BEES) were also used as inputs in Simapro in order to model the production of MDF and plywood molds used to make the FRP panels.
Major assumptions included the functional unit accounted for the complicated shapes of the FRP panels. For example, whereas the old limestone panels are simple flat pieces, the new FRP panels assume more custom shapes: some are flat and some are highly decorative with complicated ornamentation. A second assumption was that reasonably accurate surrogates were modeled in Simapro, and a third assumption was that 50% was an accurate waste percentage for limestone.
Simapro results were then compared for the two materials. The quantities compared were greenhouse gas emissions, ozone emissions, acidification, eutrophication, heavy metals, carcinogens, pesticides, summer smog, winter smog, energy resources, and solid waste. Modifications were then made in Simapro by replacing MDF with plywood. These results were then used to determine whether process-based LCA is an effective method of evaluating building materials and optimizing inputs to create greener materials.
7
Application and Data Sources FRPs are composite materials made of a polymer matrix reinforced with fibers. Their biggest advantages are that they are lightweight and durable. The application is 277 cladding panels for San Francisco’s Public Health Service Hospital (PHSH) to replace the same number of limestone panels. The FRP panels are fabricated to closely mimic the texture and color of the existing limestone. The comparison material is Indiana limestone. Raw limestone is quarried near Bloomington, Indiana then cut into 1’x1’x1’ blocks. As mentioned in the key assumptions, flat panels of each material type were chosen for comparison. Kreysler and Associates was the major source of data. Kreysler provided data sheets for the FRP component materials including filler, chopped strand mat, Gel Coat, and resin. Kreysler also provided labor and overhead costs, construction method details, and modes of transportation. Kreysler also supplied shop drawings for the FRP panels’ installation on the PHSH, as well as the limestone panel fastener system manufactured by R. Cunningham and Co., Inc. BEES (Building for Environmental and Economic Sustainability) 4.0 was used to generate data on the energy and emissions of the production of the plywood and MDF molds for the FRP panels.
FRP Production, Transportation, and Installation Processes
FRP: Material Components FRP panels’ material inputs were considerably more complex than limestone panels’ inputs. One functional unit (1ft2, or 3 lbs) consisted of the following percentages (by mass): 16.67% glass fibers in the form of a chopped strand mat, 16.67% sand (for texture), 16.67% Gelcoat, 25% resin, and 25% filler. In addition, a small amount (1.5% of the resin mass) of initiator (methyl-ethyl-ketone peroxide) was used.
FRP: Production Process Production of the FRP panels is a complicated process involving four sub-processes. The first phase of the FRP life cycle considered was raw material acquisition, in which the raw materials for the basic components listed above were processed then transported from various locations to Kreysler and Associates for fabrication.
The second sub-process involved in making the FRP panels was the production of molds. Kreysler uses two mold types: plywood is used to make 272 (about 98%) flat FRP panels. The plywood molds are constructed using basic hand tools. The remaining 5 panels (about 2%) are highly ornamental and are molded from MDF molds that are produced on a CNC machine.
The third sub-process is manufacturing of the FRP panels. The basic materials are mixed and applied in layers by hand to the molds at Kreyler’s plant. The initiator reacts with the resin to create chemical heat, which cures the panel inside of a nylon vacuum bag. Stainless steel nuts are welded to stainless steel plates 1/8” x 3” x 3”; four of these are typically embedded into the
8
FRP panel. After curing, the panel is ground to expose the nuts, which are used to fasten the panels to the building.
A fourth sub-process is sandblasting. Approximately 50% of the FRP panels are sandblasted at Kreysler’s plant to replicate the texture of limestone. Sandblasting completes the FRP production process.
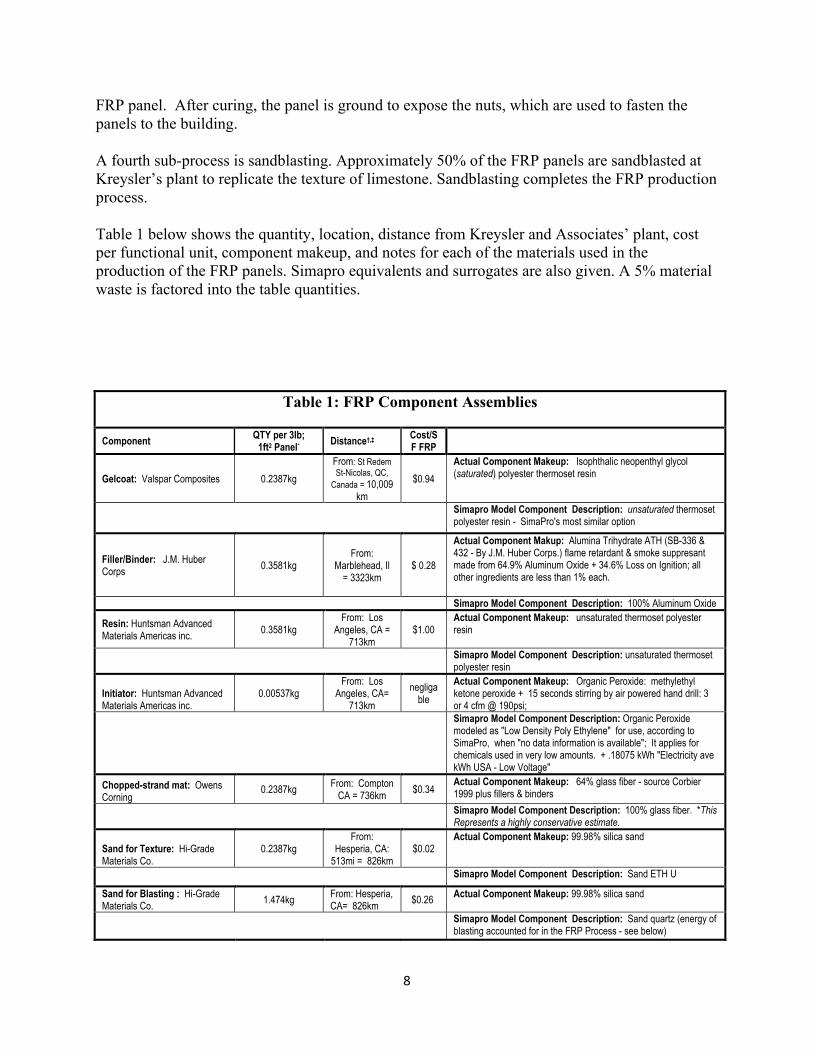
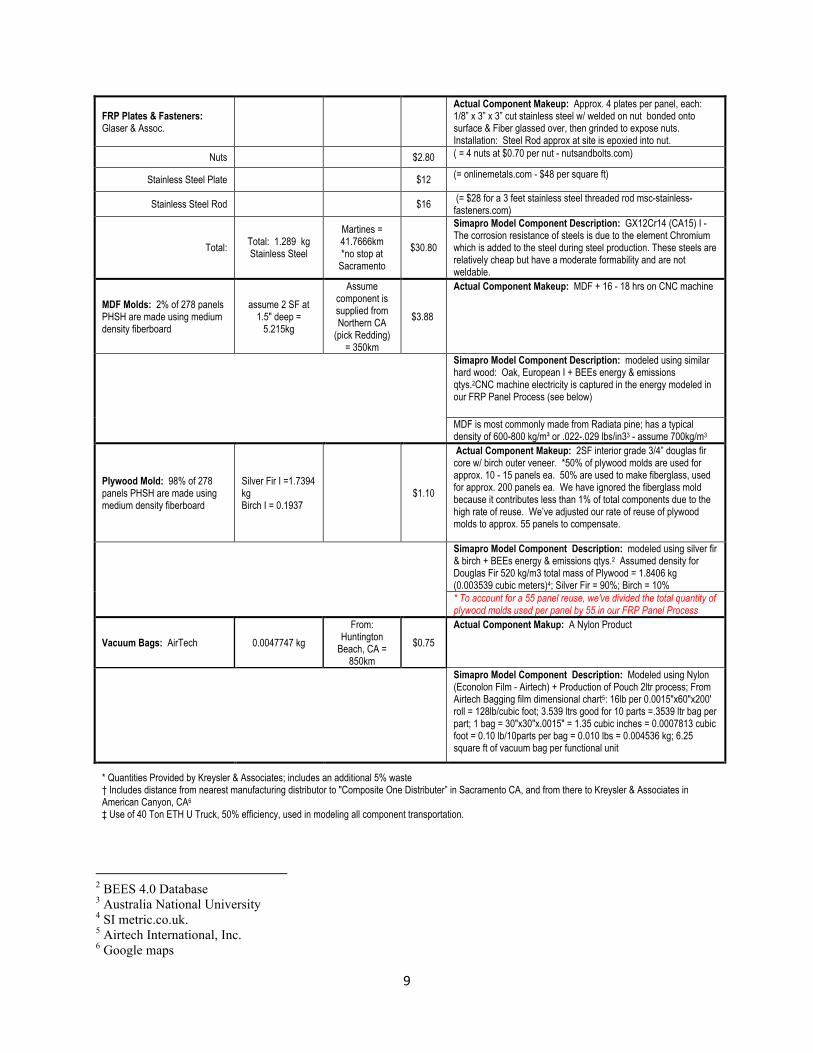
Table 1 below shows the quantity, location, distance from Kreysler and Associates’ plant, cost per functional unit, component makeup, and notes for each of the materials used in the production of the FRP panels. Simapro equivalents and surrogates are also given. A 5% material waste is factored into the table quantities.
Table 1: FRP Component Assemblies
Component QTY per 3lb; 1ft2 Panel* Distance†,‡ Cost/S
F FRP
Gelcoat: Valspar Composites 0.2387kg
From: St Redem St-Nicolas, QC,
Canada = 10,009 km
$0.94
Actual Component Makeup: Isophthalic neopenthyl glycol (saturated) polyester thermoset resin
Simapro Model Component Description: unsaturated thermoset polyester resin - SimaPro's most similar option
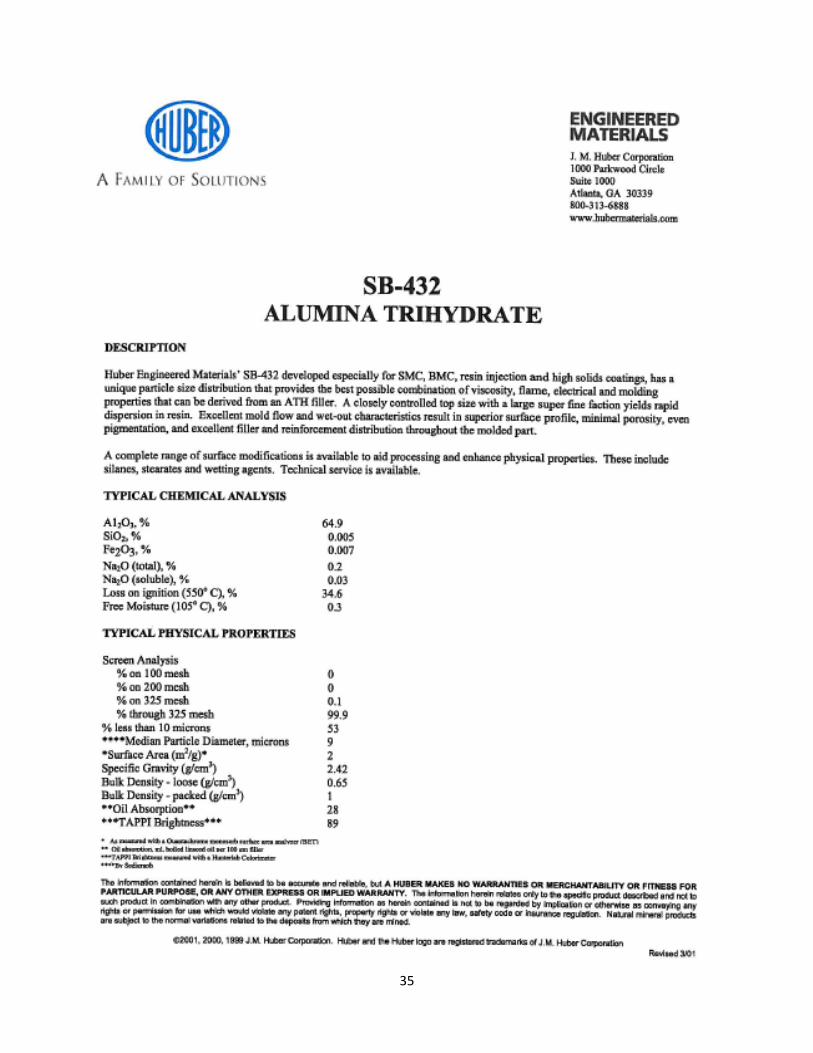
Filler/Binder: J.M. Huber Corps
0.3581kg From:
Marblehead, Il = 3323km
$ 0.28
Actual Component Makup: Alumina Trihydrate ATH (SB-336 & 432 - By J.M. Huber Corps.) flame retardant & smoke suppresant made from 64.9% Aluminum Oxide + 34.6% Loss on Ignition; all other ingredients are less than 1% each.
Simapro Model Component Description: 100% Aluminum Oxide
Resin: Huntsman Advanced Materials Americas inc.
0.3581kg From: Los
Angeles, CA = 713km
$1.00 Actual Component Makeup: unsaturated thermoset polyester resin
Simapro Model Component Description: unsaturated thermoset polyester resin
Initiator: Huntsman Advanced Materials Americas inc.
0.00537kg From: Los
Angeles, CA= 713km
negligable
Actual Component Makeup: Organic Peroxide: methylethyl ketone peroxide + 15 seconds stirring by air powered hand drill: 3 or 4 cfm @ 190psi;
Simapro Model Component Description: Organic Peroxide modeled as "Low Density Poly Ethylene" for use, according to SimaPro, when "no data information is available"; It applies for chemicals used in very low amounts. + .18075 kWh "Electricity ave kWh USA - Low Voltage"
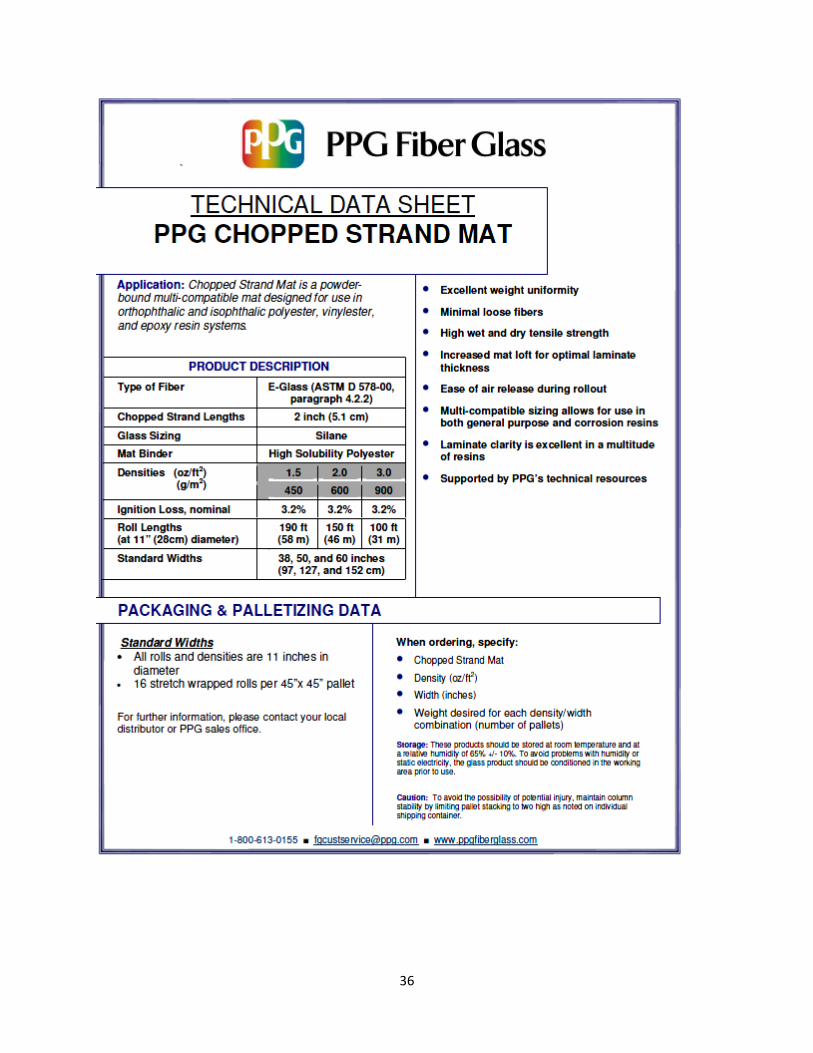
Chopped-strand mat: Owens Corning
0.2387kg From: Compton
CA = 736km $0.34
Actual Component Makeup: 64% glass fiber - source Corbier 1999 plus fillers & binders
Simapro Model Component Description: 100% glass fiber. *This Represents a highly conservative estimate.
Sand for Texture: Hi-Grade Materials Co.
0.2387kg From:
Hesperia, CA: 513mi = 826km
$0.02 Actual Component Makeup: 99.98% silica sand
Simapro Model Component Description: Sand ETH U
Sand for Blasting : Hi-Grade Materials Co. 1.474kg
From: Hesperia, CA= 826km
$0.26 Actual Component Makeup: 99.98% silica sand
Simapro Model Component Description: Sand quartz (energy of blasting accounted for in the FRP Process - see below)
9
FRP Plates & Fasteners: Glaser & Assoc.
Actual Component Makeup: Approx. 4 plates per panel, each: 1/8” x 3” x 3” cut stainless steel w/ welded on nut bonded onto surface & Fiber glassed over, then grinded to expose nuts. Installation: Steel Rod approx at site is epoxied into nut.
Nuts $2.80 ( = 4 nuts at $0.70 per nut - nutsandbolts.com)
Stainless Steel Plate $12 (= onlinemetals.com - $48 per square ft)
Stainless Steel Rod
$16 (= $28 for a 3 feet stainless steel threaded rod msc-stainless-fasteners.com)
Total: Total: 1.289 kg Stainless Steel
Martines = 41.7666km *no stop at
Sacramento
$30.80
Simapro Model Component Description: GX12Cr14 (CA15) I - The corrosion resistance of steels is due to the element Chromium which is added to the steel during steel production. These steels are relatively cheap but have a moderate formability and are not weldable.
MDF Molds: 2% of 278 panels PHSH are made using medium density fiberboard
assume 2 SF at 1.5" deep =
5.215kg
Assume component is supplied from Northern CA
(pick Redding) = 350km
$3.88
Actual Component Makeup: MDF + 16 - 18 hrs on CNC machine
Simapro Model Component Description: modeled using similar hard wood: Oak, European I + BEEs energy & emissions qtys.2CNC machine electricity is captured in the energy modeled in our FRP Panel Process (see below)
MDF is most commonly made from Radiata pine; has a typical density of 600-800 kg/m³ or .022-.029 lbs/in33 - assume 700kg/m3
Plywood Mold: 98% of 278 panels PHSH are made using medium density fiberboard
Silver Fir I =1.7394 kg Birch I = 0.1937
$1.10
Actual Component Makeup: 2SF interior grade 3/4” douglas fir core w/ birch outer veneer. *50% of plywood molds are used for approx. 10 - 15 panels ea. 50% are used to make fiberglass, used for approx. 200 panels ea. We have ignored the fiberglass mold because it contributes less than 1% of total components due to the high rate of reuse. We’ve adjusted our rate of reuse of plywood molds to approx. 55 panels to compensate.
Simapro Model Component Description: modeled using silver fir & birch + BEEs energy & emissions qtys.2 Assumed density for Douglas Fir 520 kg/m3 total mass of Plywood = 1.8406 kg (0.003539 cubic meters)4; Silver Fir = 90%; Birch = 10%
* To account for a 55 panel reuse, we've divided the total quantity of plywood molds used per panel by 55 in our FRP Panel Process
Vacuum Bags: AirTech 0.0047747 kg
From: Huntington
Beach, CA = 850km
$0.75
Actual Component Makup: A Nylon Product
Simapro Model Component Description: Modeled using Nylon (Econolon Film - Airtech) + Production of Pouch 2ltr process; From Airtech Bagging film dimensional chart5: 16lb per 0.0015"x60"x200' roll = 128lb/cubic foot; 3.539 ltrs good for 10 parts =.3539 ltr bag per part; 1 bag = 30"x30"x.0015" = 1.35 cubic inches = 0.0007813 cubic foot = 0.10 lb/10parts per bag = 0.010 lbs = 0.004536 kg; 6.25 square ft of vacuum bag per functional unit
* Quantities Provided by Kreysler & Associates; includes an additional 5% waste † Includes distance from nearest manufacturing distributor to "Composite One Distributer” in Sacramento CA, and from there to Kreysler & Associates in American Canyon, CA6 ‡ Use of 40 Ton ETH U Truck, 50% efficiency, used in modeling all component transportation.
2 BEES 4.0 Database3 Australia National University4 SI metric.co.uk. 5 Airtech International, Inc.6 Google maps

10
FRP: Panel Electricity RequirementsTable 2 summarizes the key assumptions for the various electricity requirements throughout the FRP panel manufacturing phase. The result is 10.611 kWh of power per panel.
Table 2: Electricity Assumptions for FRP Panels 1. Part-load factor of 0.8 for all equipment. 2. Motor efficiency of 0.85. 3. 0.746 kW/hp 4. Air compressor runs 4 times per day, with 1/20 being used for a plywood piece 5. 4 hp equivalent running for 2 hours for jig saw 6. Electric router runs 1 hour per plywood piece. 7. 5 of 78 panels made using CNC machine. CNC machine runs 16-18 hrs per piece. 8. Air Compressor is 35 hp; powers down to 120 psi when at rest 9. Electric Vacuum Pump rated at 7.1 amps @ 115 volts 10. CNC machine has a 2hp motor and a 3 hp motor. 11. Electric router is 3.5 hp. 12. Drill time for 4 holes for limestone is 10 minutes of air compressor 13. Grinding time for FRP is 1 min of air compressor 14. Sand Blasting for FRP is 1 min of air compressor
Using Table 2, Table 3 gives the calculation results for all of the processes in the production of the FRP panels which require electricity. The first column gives the tool used, the second column gives the power usage result, the third column gives the units, and the fourth column gives notes.
Table 3: Electricity Requirements Per Category for FRP Panels
Tool kWh Units Notes CNC machine - 2hp motor for drill; 3hp motor for conveyor 63.191 Per piece
Electric Vacuum Pump 1.921 Per piece 2 hrs per part (Note: same time is necessary for any size part)
Air Compressor - 35 HP =26.1 kw 98.296 Per day Installation by hand 0.000 hand tools (all pneumatic):
pneumatic sand blaster 0.435 Per plywood mold
26.1 kW air; 125 psi (modeled on mid-priced sandblaster7 -compressor used for 1 min.
pneumatic jig saw 7.021 Per plywood mold
90psi (modeled on mid priced jig saw8)
electric router 3.072 Per plywood mold
3 1/2 HP, 22,000 RPM, 15 Amp (modeled on mid priced router9)
Total kWh per ft2 panel 10.611
7Northern Tool and Equipment Catalog Co., Marco.8Tool Orbit, Bosch.9Northern Tool and Equipment Catalog Co., Milwaukee.
11
FRP: Transportation to Site and Installation Process The next phases of the FRP panels’ life cycles considered were transportation and installation. After the FRP panels are manufactured, they are transported from Kreysler and Associates’ plant in American Canyon, California 45 miles to the Presidio building site in San Francisco. Stainless steel rods and epoxy are used to attach the panels to the building façade (see Appendix: IX “plates and fasteners” assembly). The panels are light enough to be lifted into place by hand. The energy used during transportation to site was modeled in Simapro as follows. The mass functional unit was multiplied by the transportation distance in a gasoline truck to yield 225.6 kg*km. The energy for the installation phase was assumed to be done by hand and therefore 0.
FRP: Use, Demolition, and End of Life PhasesIn the use phase of the product lifecycle, no maintenance was assumed, per manufacturer specification. The product lifespan was also assumed to be limited by a typical building’s lifespan of 100 years. At the end of life, panels are demolished along with the rest of the building. The panel debris is transported 14 miles from the building site to a landfill, the Marin Resource Recovery Center. This requires fuel for transportation. No recycling was assumed.
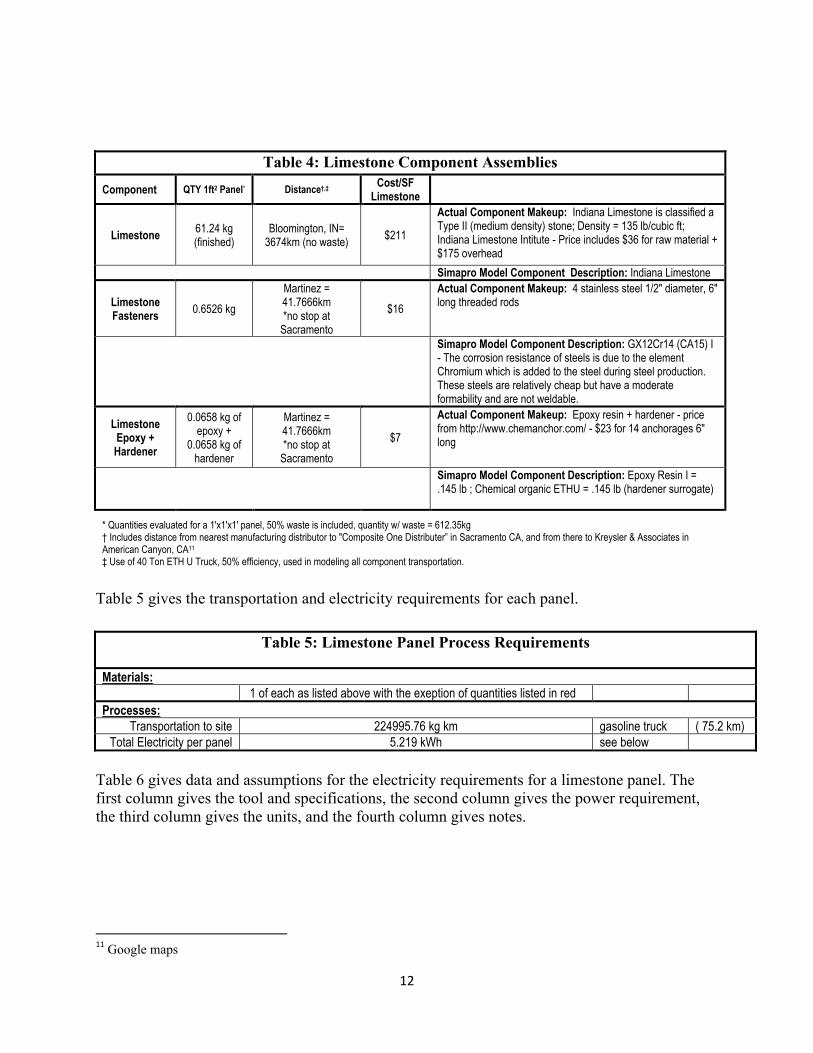
Limestone: Production, Transportation, and Installation Processes The limestone panel process flow diagram shown in Appendix II outlines the lifecycle of the limestone panel. The LCA boundary for limestone is all life cycle phases with the exclusion of use phase operating costs. As noted earlier, the functional unit is a 1’x1’ panel (which corresponds to a depth of 1’ and weight of 150 lbs). The life cycle begins with raw material acquisition from a quarry in Bloomington, Indiana. The material is then transported to a processing plant (less than ten miles away) and cut using a Standish narrow belt saw. A drill creates holes for installing the panels at the building site. The quarrying and cutting result in 50% waste10. Panels are then transported by semi-truck 2,320 miles to the building site. They are then lifted by chain hoist or electric lift and attached to the structure using stainless steel rods and epoxy similar to the FRP panels. The following tables provide assumptions and data for the production, transportation, and installation phases of limestone. Table 4 describes the limestone components, including component name, quantity per functional unit, distance from supplier to the building site via a distributor’s site in Sacramento, and component makeup.
10USGS.
12
Table 4: Limestone Component Assemblies Component QTY 1ft2 Panel* Distance†,‡ Cost/SF
Limestone
Limestone 61.24 kg (finished)
Bloomington, IN= 3674km (no waste)
$211
Actual Component Makeup: Indiana Limestone is classified a Type II (medium density) stone; Density = 135 lb/cubic ft; Indiana Limestone Intitute - Price includes $36 for raw material + $175 overhead
Simapro Model Component Description: Indiana Limestone
Limestone Fasteners 0.6526 kg
Martinez = 41.7666km *no stop at
Sacramento
$16
Actual Component Makeup: 4 stainless steel 1/2" diameter, 6" long threaded rods
Simapro Model Component Description: GX12Cr14 (CA15) I - The corrosion resistance of steels is due to the element Chromium which is added to the steel during steel production. These steels are relatively cheap but have a moderate formability and are not weldable.
Limestone Epoxy + Hardener
0.0658 kg of epoxy +
0.0658 kg of hardener
Martinez = 41.7666km *no stop at
Sacramento
$7
Actual Component Makeup: Epoxy resin + hardener - price from http://www.chemanchor.com/ - $23 for 14 anchorages 6" long
Simapro Model Component Description: Epoxy Resin I = .145 lb ; Chemical organic ETHU = .145 lb (hardener surrogate)
* Quantities evaluated for a 1'x1'x1' panel, 50% waste is included, quantity w/ waste = 612.35kg † Includes distance from nearest manufacturing distributor to "Composite One Distributer” in Sacramento CA, and from there to Kreysler & Associates in American Canyon, CA11 ‡ Use of 40 Ton ETH U Truck, 50% efficiency, used in modeling all component transportation.
Table 5 gives the transportation and electricity requirements for each panel.
Table 5: Limestone Panel Process Requirements
Materials: 1 of each as listed above with the exeption of quantities listed in red
Processes: Transportation to site 224995.76 kg km gasoline truck ( 75.2 km)
Total Electricity per panel 5.219 kWh see below
Table 6 gives data and assumptions for the electricity requirements for a limestone panel. The first column gives the tool and specifications, the second column gives the power requirement, the third column gives the units, and the fourth column gives notes.
11Google maps

13
Table 6: Electricity Requirements Per Category for Limestone Panels
Tool kWh Units Notes Cutting/Finishing @ 1 fpm - 50hp = 37.29 kW 0.621 per panel 1 minute to cut/finish 1 ft long panel Electric lift/hoist - 2 HP = 1.491 kW 0.248 per panel 10 minutes (1/6 hr) use of the lift to hold the piece for epoxy inyection Installation by hand 0.000 Air Compressor - 35 HP = 26.1 kW hand tools (all pneumatic):
Hand Drill 4.350 per panel 10 minutes use of the compressor for drilling 4 holes 6 inches long Total kWh per panel 5.219
Total kWh per ft2 panel 5.219
Limestone: Use, Demolition, and End of Life PhasesNo maintenance is assumed during the limestone panels’ use phase. Similar to the FRP panels, the lifespan is assumed to be equal to the lifespan of the building, or 100 years. At the end of life, a wrecking ball smashes the panels and transports them to the landfill in Marin. No recycling or reuse of limestone is assumed; 100% of the material goes to the landfill as solid waste.
FRP and Limestone: Use Phase Operating Costs Use phase operating costs of the FRP and limestone panels were considered as follow. The R-value of an FRP panel was assumed to be 2 BTU/(h °F ft²) less than that of limestone12,13. This is a relatively small difference. In addition, these R-values do not take into consideration the additional R-values of the PHSH walls. Furthermore, the thermal mass properties of the limestone would likely reduce operational costs of the limestone option somewhat; this would compensate, to some extent, for the variance in R-value. For these reasons, the impact that this R-value difference would have on heating and cooling costs was considered negligible and is therefore not considered.
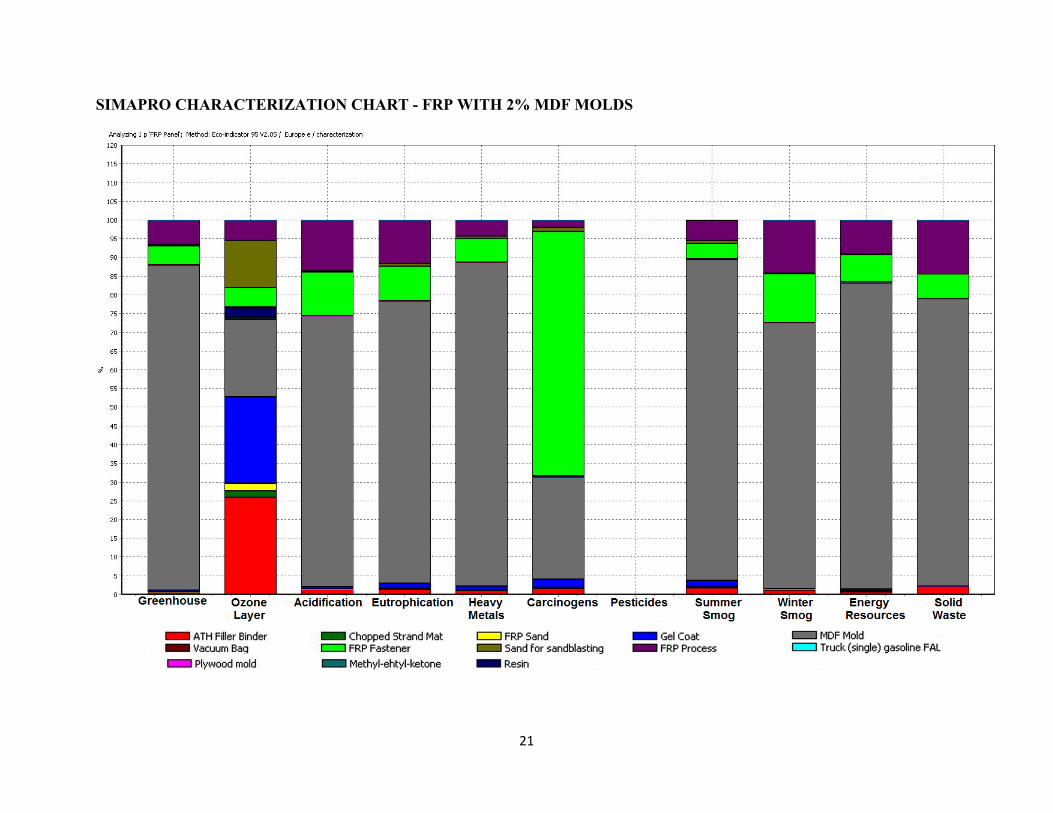
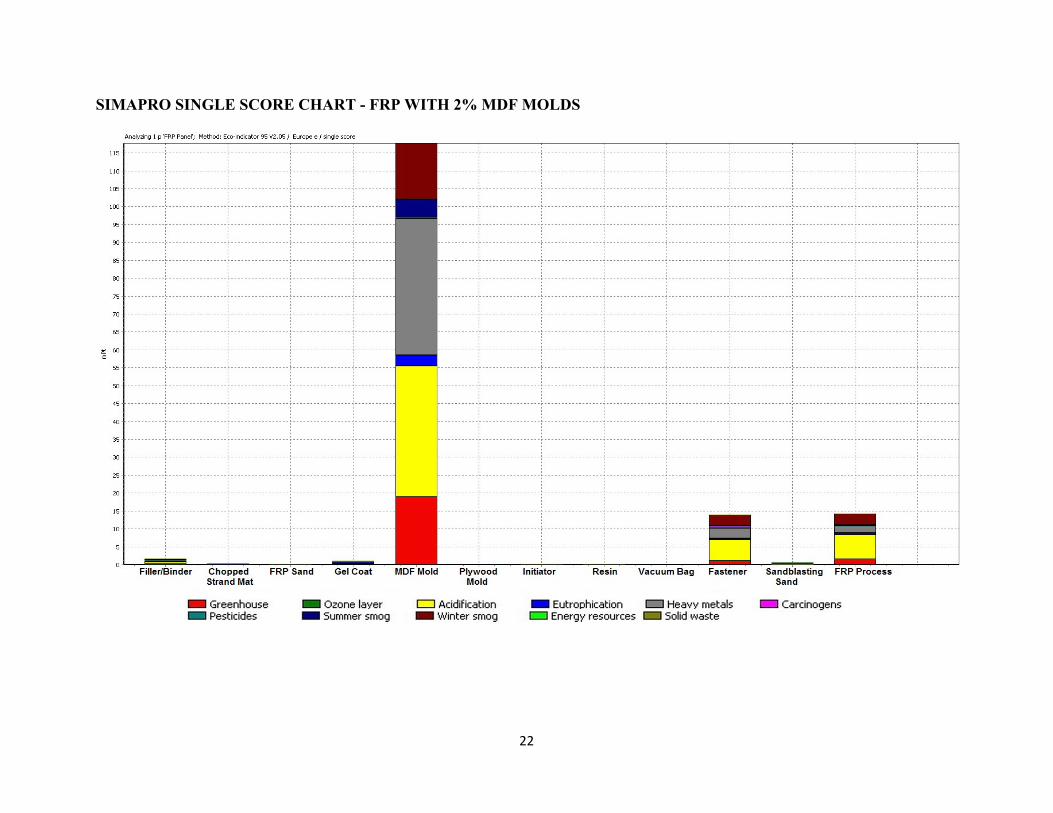
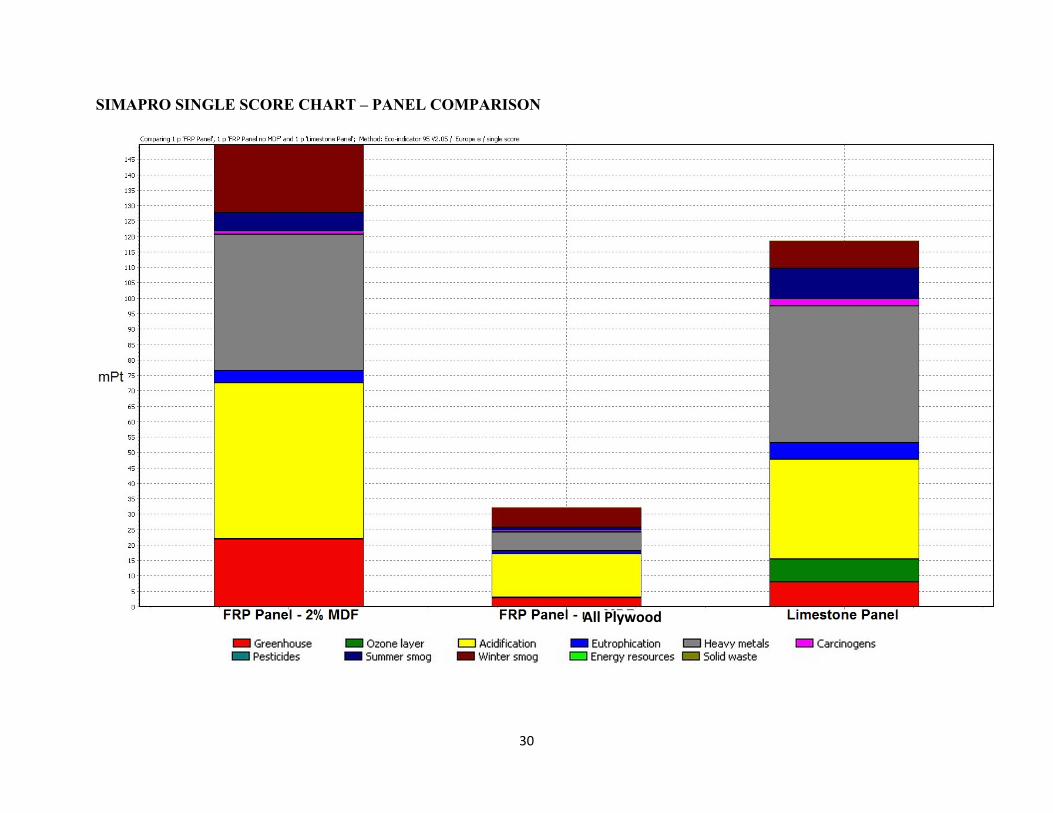
Impact Assessment Results and Analysis Simapro models for both FRP and limestone panels were constructed using the data in Tables 1 through 6. A functional unit of a 1’x1’ panel was used. Results showed that the MDF board used in the FRP production process was the material requiring the most significant energy inputs and yielding the highest waste and emissions outputs. Even though the material is used in only 2% of the FRP panel molds, it is the highest contributor of greenhouse gases, energy resources, N0x, and S0x (see Appendix IV). The single score chart shows that this small amount of MDF results in a single score eight times greater than any other panel component. When compared with the production of limestone panels, this product produces almost four times the amount of C02 equivalent (greenhouse gases) and consumes twice the amount of energy as the production and use of a limestone panel. FRP panels made with MDF molds score 30 points higher than limestone on a single score scale (see Appendix VI, Appendix VII).
12Glacier Bay Inc.13Marble Institute of America

14
Since the results from the FRP panels made with MDF were worse than limestone in most of the impact categories, a second scenario was considered: FRP panels made with 100% plywood. The assumption is that Kreysler could replace MDF with plywood, and a Simpro model was constructed.
Results showed that the stainless steel fasteners and the FRP process (comprised of the energy required to make the plywood molds and the transportation costs to the building site) were the most impactful components. Appendix VII shows that FRP panels made with 100% plywood molds emit about one-third the greenhouse gases and consume about one-sixth the energy of the limestone option. This modification resulted in an FRP single score reduction of 78%, or 3 ½ times less than that of limestone.
Appendix VII also shows that FRP panels’ low weight is a significant advantage. For example, transportation of the limestone panels from Indiana to the Presidio carries the greatest environmental impact in its lifecycle: this step consumes 4½ times the amount of energy consumed in extracting the stone and releases 77% of the total greenhouse gases. The panels’ low weight therefore conserves gasoline during transportation as well as yields less solid waste at end of life. Assuming 50% waste, limestone results in the production of seven times more waste than either FRP option.
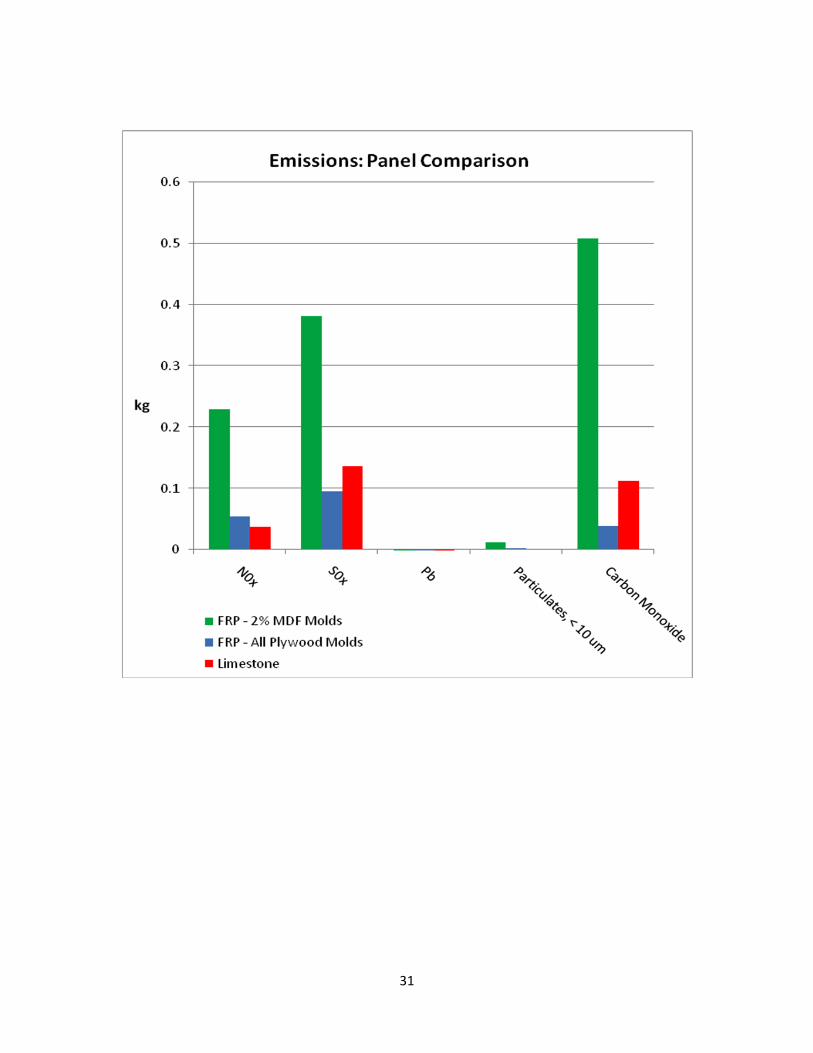
In terms of emissions (N0x, S0x, Pb, Particulates < 10��, and C0), the FRP panels made with 2% MDF board are the largest contributor among the three options (see Appendix VII, Emissions: Panel Comparison Chart). They emit 7 1/2 times more N0x, three times more S0x, and five times more CO than the limestone panels. FRP panels made with 100% plywood molds yield N0x and S0x emissions that differ by less than .05 kg from the limestone emissions. FRP panels made with 100% plywood molds also yield CO emissions that are ¼ that of the limestone CO emissions.
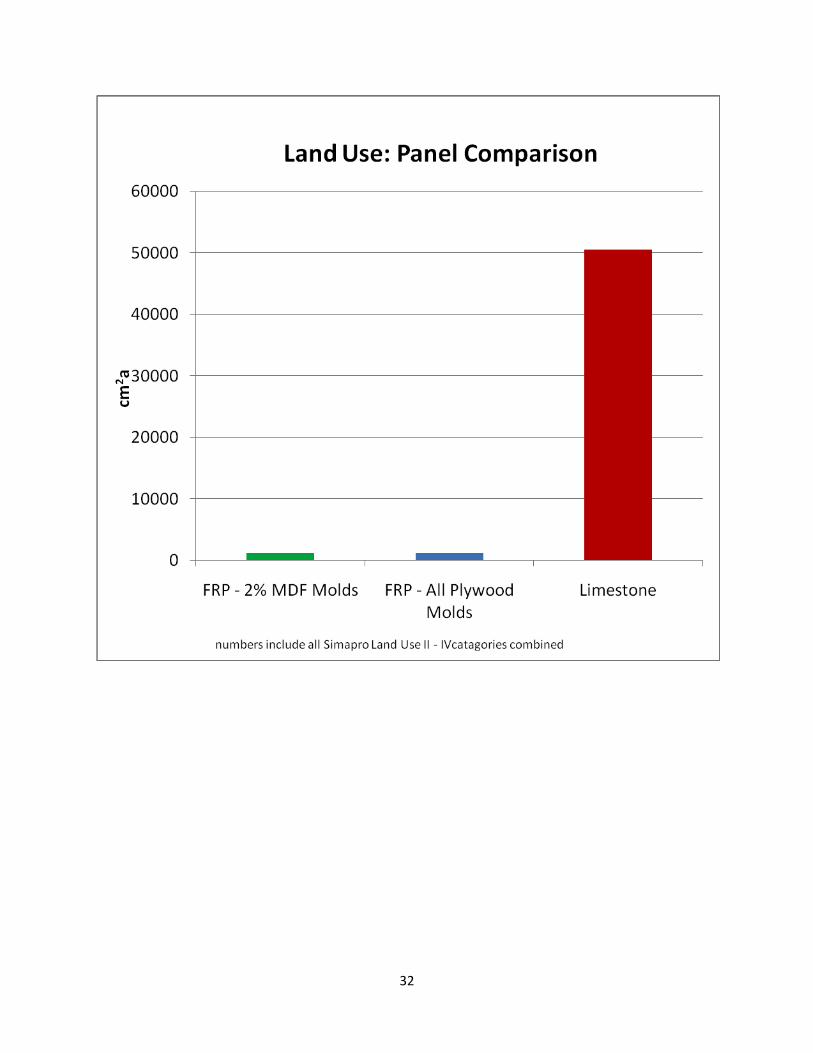
Land use can also be compared. Appendix VII, Land Use: Panel Comparison Chart shows that the quantity of land use remains approximately the same for the FRP made with MDF molds and 100% plywood molds: 1,200 cm2a. The limestone panel uses over 42 times this amount at about 5,050 cm2a. Therefore, choosing an FRP panel over a Limestone panel will significantly reduce land use.
Life Cycle Cost Analysis
15
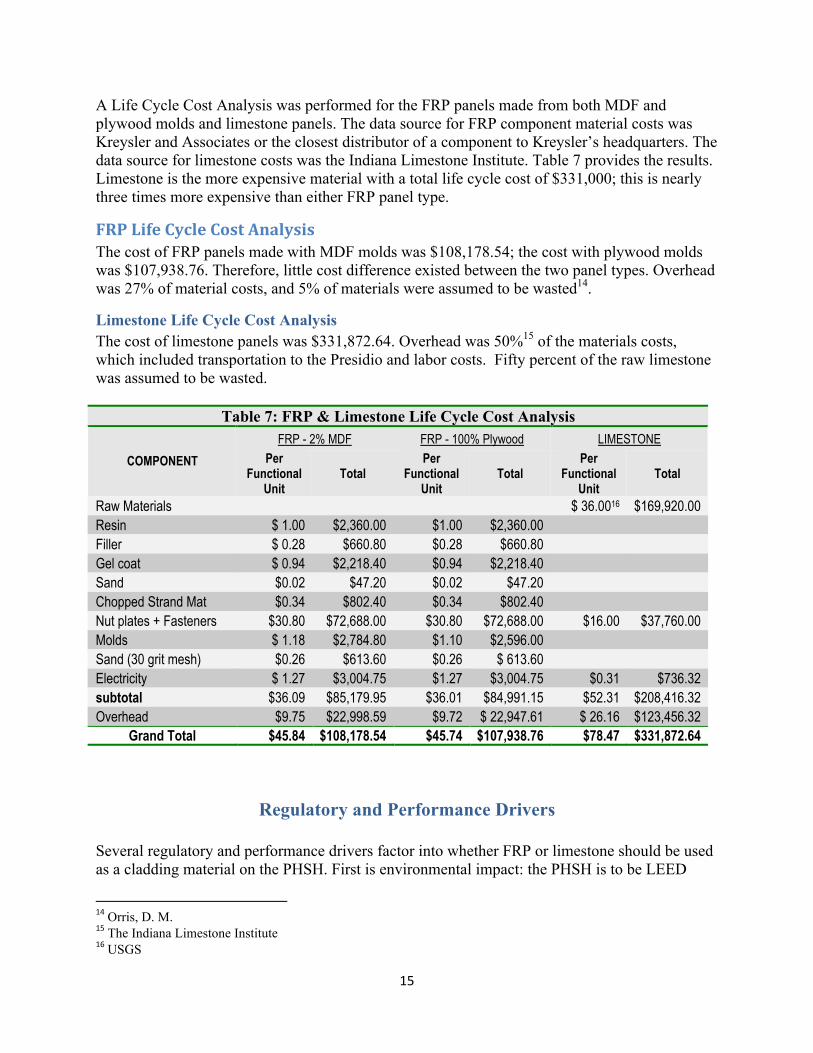
A Life Cycle Cost Analysis was performed for the FRP panels made from both MDF and plywood molds and limestone panels. The data source for FRP component material costs was Kreysler and Associates or the closest distributor of a component to Kreysler’s headquarters. The data source for limestone costs was the Indiana Limestone Institute. Table 7 provides the results. Limestone is the more expensive material with a total life cycle cost of $331,000; this is nearly three times more expensive than either FRP panel type.
FRPLifeCycleCostAnalysisThe cost of FRP panels made with MDF molds was $108,178.54; the cost with plywood molds was $107,938.76. Therefore, little cost difference existed between the two panel types. Overhead was 27% of material costs, and 5% of materials were assumed to be wasted14.
Limestone Life Cycle Cost AnalysisThe cost of limestone panels was $331,872.64. Overhead was 50%15 of the materials costs, which included transportation to the Presidio and labor costs. Fifty percent of the raw limestone was assumed to be wasted.
Table 7: FRP & Limestone Life Cycle Cost Analysis FRP - 2% MDF FRP - 100% Plywood LIMESTONE
COMPONENT Per Functional
Unit Total
Per Functional
Unit Total
Per Functional
Unit Total
Raw Materials $ 36.0016 $169,920.00 Resin $ 1.00 $2,360.00 $1.00 $2,360.00 Filler $ 0.28 $660.80 $0.28 $660.80 Gel coat $ 0.94 $2,218.40 $0.94 $2,218.40 Sand $0.02 $47.20 $0.02 $47.20 Chopped Strand Mat $0.34 $802.40 $0.34 $802.40 Nut plates + Fasteners $30.80 $72,688.00 $30.80 $72,688.00 $16.00 $37,760.00 Molds $ 1.18 $2,784.80 $1.10 $2,596.00 Sand (30 grit mesh) $0.26 $613.60 $0.26 $ 613.60 Electricity $ 1.27 $3,004.75 $1.27 $3,004.75 $0.31 $736.32 subtotal $36.09 $85,179.95 $36.01 $84,991.15 $52.31 $208,416.32 Overhead $9.75 $22,998.59 $9.72 $ 22,947.61 $ 26.16 $123,456.32
Grand Total $45.84 $108,178.54 $45.74 $107,938.76 $78.47 $331,872.64
Regulatory and Performance Drivers Several regulatory and performance drivers factor into whether FRP or limestone should be used as a cladding material on the PHSH. First is environmental impact: the PHSH is to be LEED
14Orris, D. M.15The Indiana Limestone Institute16USGS

16
Silver certified. Even though LEED does not explicitly reward the choice of a greener material over another, FRP panels made from plywood molds would make the most sense as the more sustainable option. A second driver relates to the National Park Service’s 20% tax incentive program for historical buildings. This factor would favor the limestone, since bureaucratic red tape must be fought through in order for a change of material to be permitted from the old material (limestone) to the new material (FRP). A third driver is cost, which favors either FRP option by about a factor of ten. A fourth driver is ease of transportation, installation, and disposal, factors which heavily favor FRP given the lightweight nature and low volume of the material. Finally, a fifth driver is energy savings for the future condo owners: FRP has the higher R-value and will therefore save the owners money over the limestone option.
Conclusions and Recommendations
Process-based LCA analysis of FRP and limestone façade panels provides an effective method of comparing the environmental costs and benefits attributable to each option. The individual LCA results pinpointed components and processes that created the greatest impact in terms of energy and land use, emissions, and energy inputs for each panel type. This method also allows easy estimation of reductions in environmental impacts after changes were made to material and process inputs. Comparison of LCA results for the two materials showed that the environmental impact of FRP panels made from MDF particle board is greater in many categories, including greenhouse gas emissions, energy resources, NOx, SOx, and CO. The most significant environmental impacts are contributed by the MDF particle board. In conclusion, Kreysler’s FRP panels cannot be validated as a greener material when compared with limestone panels in terms of these emissions and energy resources. It should be noted, however, that limestone panels produce more solid waste and use more land than FRP Panels by far. In addition, life cycle cost analysis shows that the upfront financial cost of the limestone panels is nearly three times that of either FRP option. FRP panels made with 100% plywood resulted in lower environmental impacts than limestone across all categories. For this option, the stainless steel fasteners and the FRP process itself were the greatest contributors. Therefore, the recommendation to Kreysler and Associates is to modify the production process of FRP panels so that an alternate mold material than MDF, such as plywood, is used.

17
Appendix I – FRP Facade Process Flow Diagram
18
Appendix II – Limestone Facade Process Flow Diagram
19
Appendix III – Shop Drawings
20
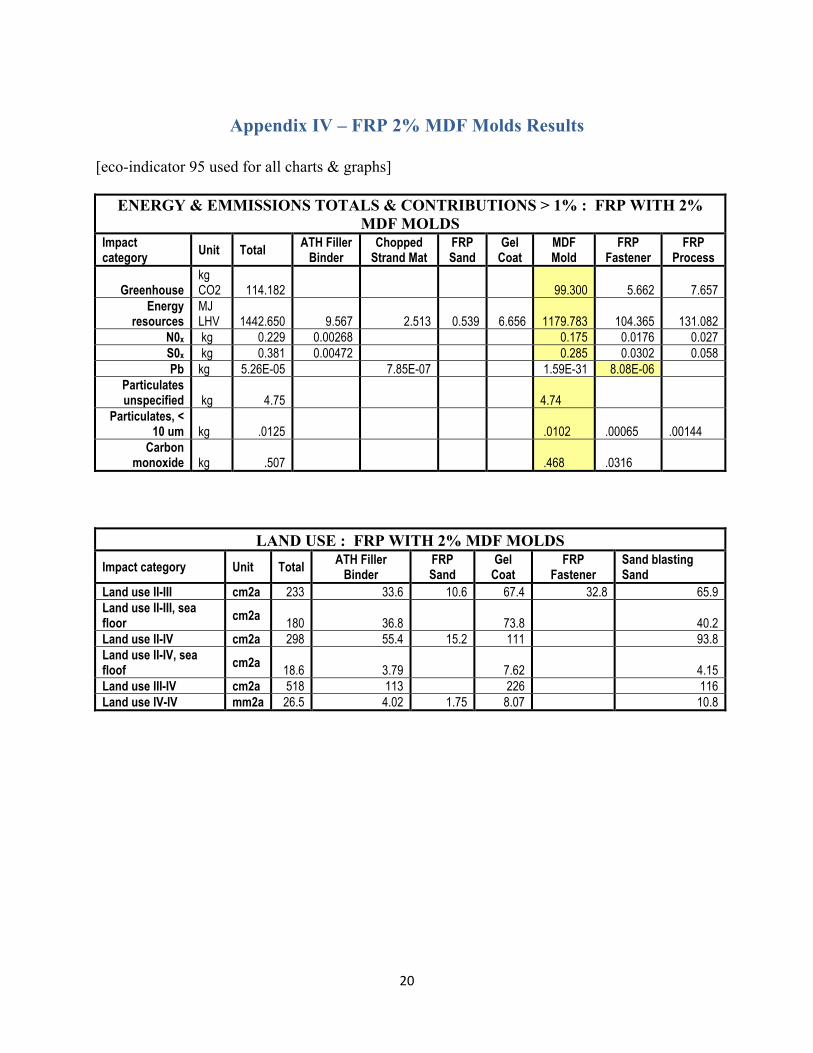
Appendix IV – FRP 2% MDF Molds Results [eco-indicator 95 used for all charts & graphs]
ENERGY & EMMISSIONS TOTALS & CONTRIBUTIONS > 1% : FRP WITH 2% MDF MOLDS
Impact category Unit Total ATH Filler
Binder Chopped
Strand Mat FRP Sand
Gel Coat
MDF Mold
FRP Fastener
FRP Process
Greenhouse kg CO2 114.182 99.300 5.662 7.657
Energy resources
MJ LHV 1442.650 9.567 2.513 0.539 6.656 1179.783 104.365 131.082
N0x kg 0.229 0.00268 0.175 0.0176 0.027 S0x kg 0.381 0.00472 0.285 0.0302 0.058 Pb kg 5.26E-05 7.85E-07 1.59E-31 8.08E-06
Particulates unspecified kg 4.75 4.74
Particulates, < 10 um kg .0125 .0102 .00065 .00144
Carbon monoxide kg .507 .468 .0316
LAND USE : FRP WITH 2% MDF MOLDS Impact category Unit Total ATH Filler
Binder FRP Sand
Gel Coat
FRP Fastener
Sand blasting Sand
Land use II-III cm2a 233 33.6 10.6 67.4 32.8 65.9 Land use II-III, sea floor cm2a
180 36.8 73.8 40.2 Land use II-IV cm2a 298 55.4 15.2 111 93.8 Land use II-IV, sea floof cm2a
18.6 3.79 7.62 4.15 Land use III-IV cm2a 518 113 226 116 Land use IV-IV mm2a 26.5 4.02 1.75 8.07 10.8
21
SIMAPRO CHARACTERIZATION CHART - FRP WITH 2% MDF MOLDS
22
SIMAPRO SINGLE SCORE CHART - FRP WITH 2% MDF MOLDS
23
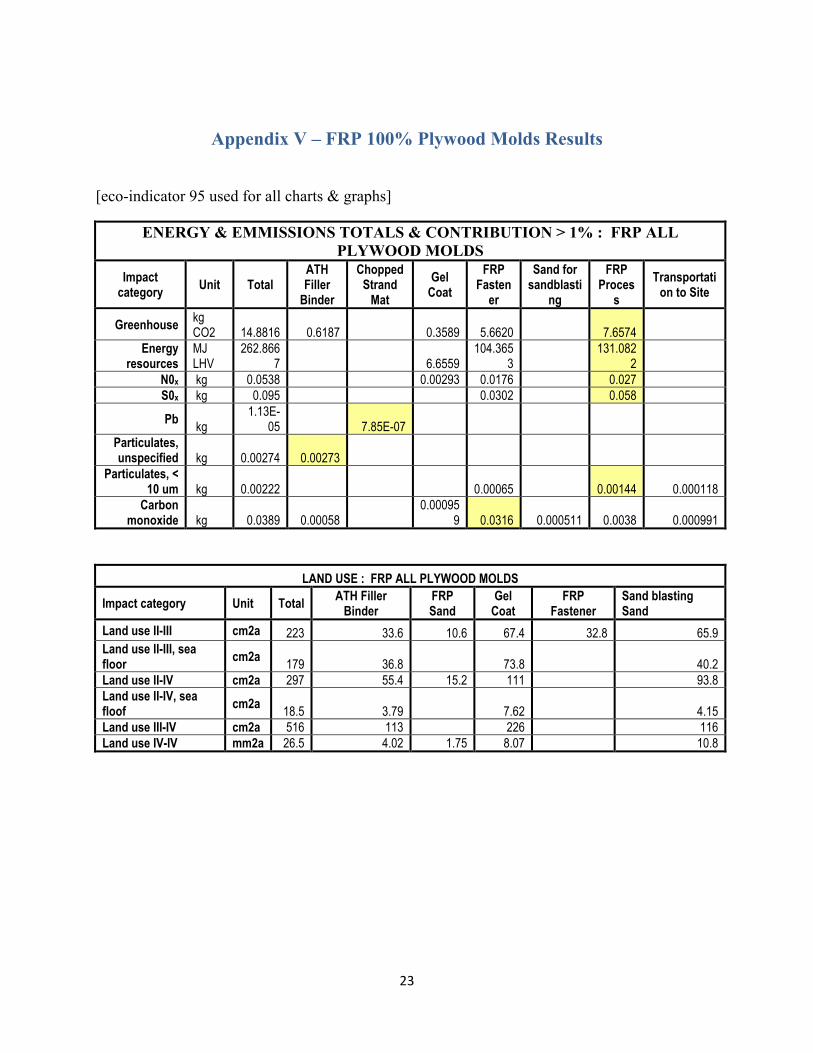
Appendix V – FRP 100% Plywood Molds Results
[eco-indicator 95 used for all charts & graphs]
ENERGY & EMMISSIONS TOTALS & CONTRIBUTION > 1% : FRP ALL PLYWOOD MOLDS
Impact category Unit Total
ATH Filler
Binder
Chopped Strand
Mat Gel
Coat FRP
Fastener
Sand for sandblasti
ng
FRP Proces
s Transportati
on to Site
Greenhouse kg CO2 14.8816 0.6187 0.3589 5.6620 7.6574
Energy resources
MJ LHV
262.8667 6.6559
104.3653
131.0822
N0x kg 0.0538 0.00293 0.0176 0.027 S0x kg 0.095 0.0302 0.058
Pb kg
1.13E-05 7.85E-07
Particulates, unspecified kg 0.00274 0.00273
Particulates, < 10 um kg 0.00222 0.00065 0.00144 0.000118
Carbon monoxide kg 0.0389 0.00058
0.000959 0.0316 0.000511 0.0038 0.000991
LAND USE : FRP ALL PLYWOOD MOLDS
Impact category Unit Total ATH Filler Binder
FRP Sand
Gel Coat
FRP Fastener
Sand blasting Sand
Land use II-III cm2a 223 33.6 10.6 67.4 32.8 65.9 Land use II-III, sea floor cm2a
179 36.8 73.8 40.2 Land use II-IV cm2a 297 55.4 15.2 111 93.8 Land use II-IV, sea floof cm2a
18.5 3.79 7.62 4.15 Land use III-IV cm2a 516 113 226 116 Land use IV-IV mm2a 26.5 4.02 1.75 8.07 10.8

24
SIMAPRO CHARACTERIZATION CHART - FRP ALL PLYWOOD MOLDS
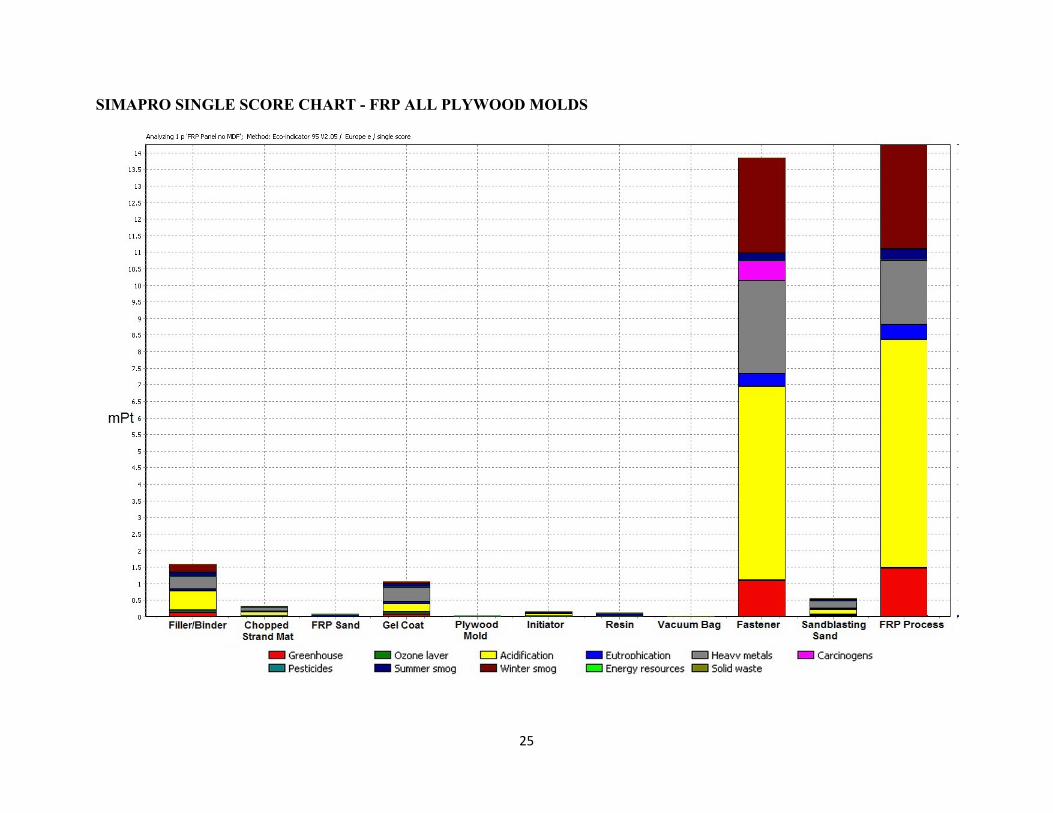
25
SIMAPRO SINGLE SCORE CHART - FRP ALL PLYWOOD MOLDS

26
Appendix VI – Limestone Results [eco-indicator 95 used for all charts & graphs]
ENERGY & EMMISSIONS TOTALS & CONTRIBUTION > 1% : LIMESTONE PANEL
Impact category Unit Total
Limestone Fasteners
Limestone Raw Material
Transportation to Site
Limestone Process
Transportation to Landfill
Greenhouse kg CO2 41.6453903 32.152754
Energy resources
MJ LHV 754.397738 127.8180793 574.59019
N0x kg 0.037 0.282 S0x kg 0.136 0.0421 0.0899 Pb kg 0.0000938 0.0000888 Particulates kg 0.00351 0.00334 .000167 Particulates, < 10 um kg .000709 .000675 3.37E-5 Carbon monoxide kg .112 .015 .00503 .0919
LAND USE : LimestoneImpact category Unit Total Limestone
Fasteners Limestone Raw Material
Transportation to Site
Transportation to Landfill
Land use II-III cm2a 9120 73.5 2560 6360 1250 Land use II-III, sea floor cm2a
7600 15.2 478 6970 137 Land use II-IV cm2a 11200 3.07 298 10500 206 Land use II-IV, sea floof cm2a
784 1.57 49.3 719 14.1 Land use III-IV cm2a 21800 4.72 47.9 21300 418 Land use IV-IV cm2a 23.6 0.00639 15.8 7.62 0.149

27
SIMAPRO CHARACTERIZATION CHART – LIMESTONE PANELS
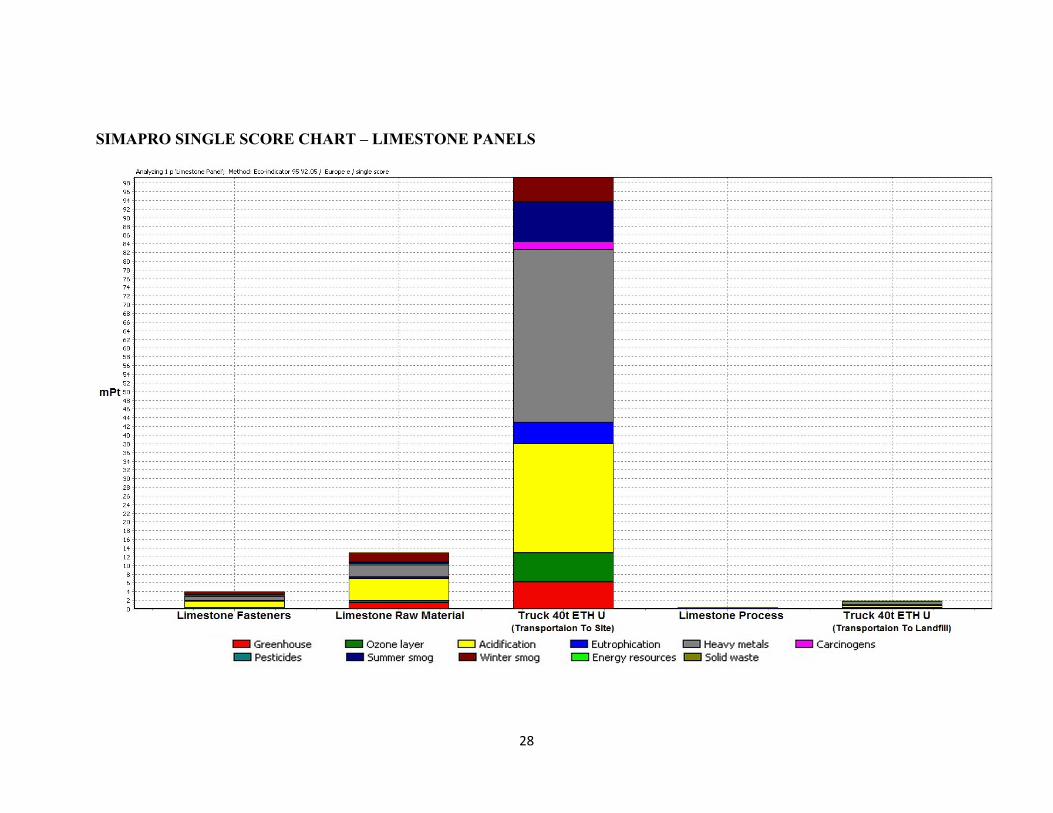
28
SIMAPRO SINGLE SCORE CHART – LIMESTONE PANELS
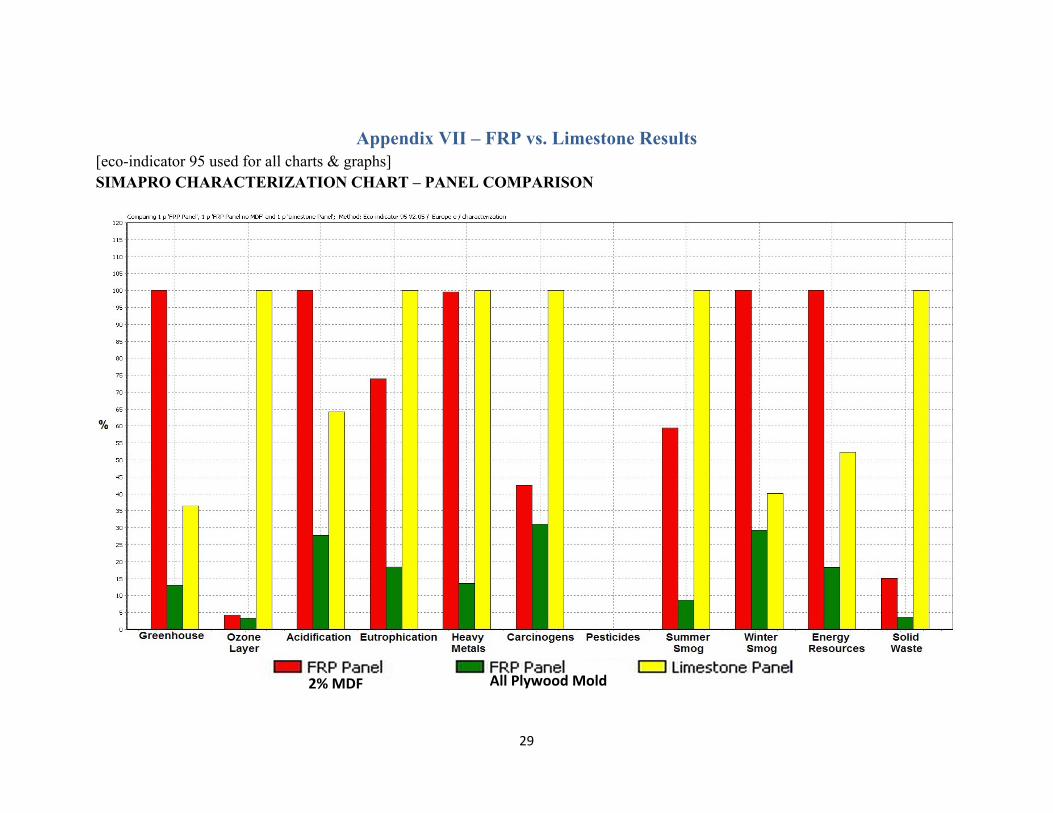
29
Appendix VII – FRP vs. Limestone Results [eco-indicator 95 used for all charts & graphs] SIMAPRO CHARACTERIZATION CHART – PANEL COMPARISON
AllPlywoodMold2%MDF
30
SIMAPRO SINGLE SCORE CHART – PANEL COMPARISON
AllPlywoodMold
31
32
33
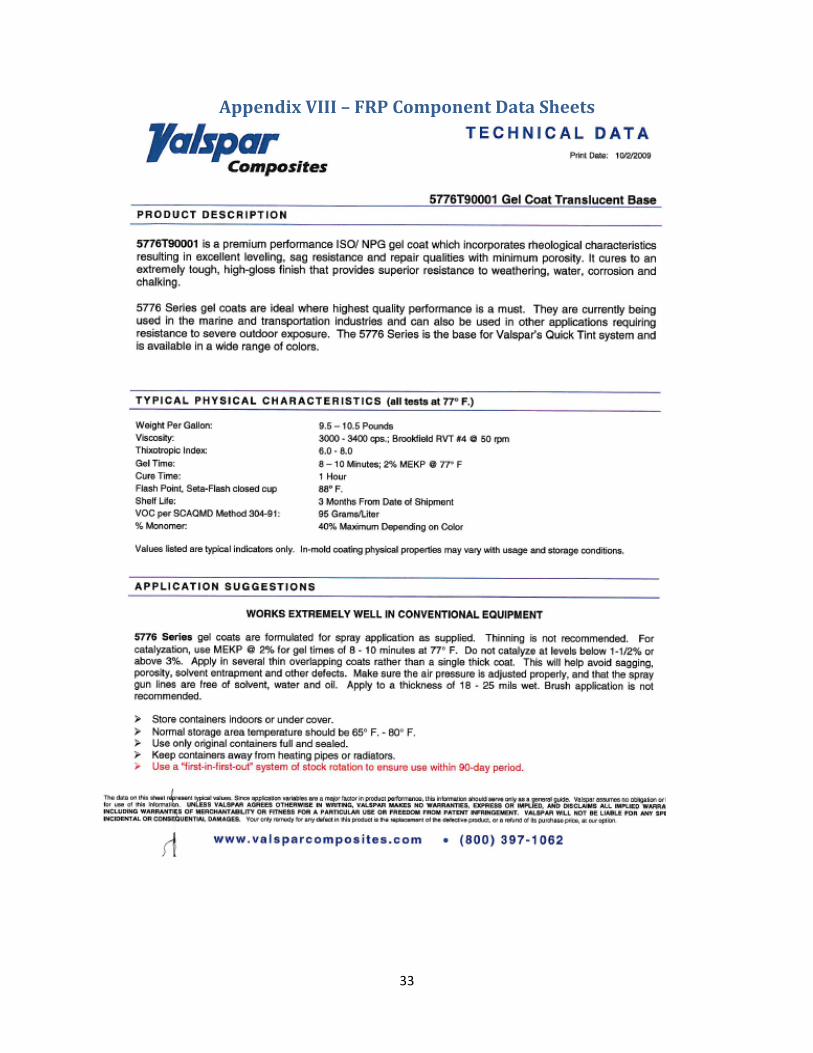
AppendixVIII–FRPComponentDataSheets

34
35
36

37
Appendix IX – Panel Fasteners
TYPICAL FRP FASTENER DETAIL
38
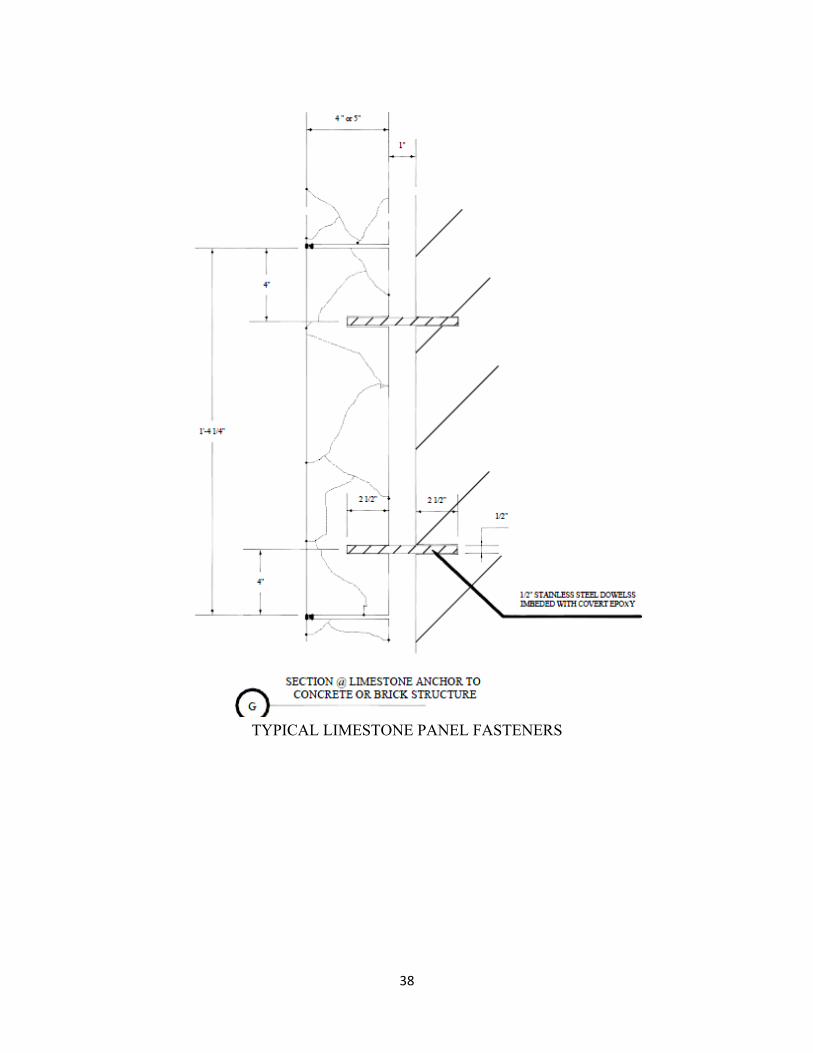
TYPICAL LIMESTONE PANEL FASTENERS
39
Bibliography
Airtech International, 2003. Accessed 20 November 2009, https://www.airtechonline.com/htm/defaultnetscape.htm.
Australia National University, The Manufacturing Process: Medium Density Fibreboard. 1 November 1996. Accessed 30 November 2009. http://sres-associated.anu.edu.au/fpt/mdf/manufacture.html. BEES 4.0 Database. National Institute of Standards and Technology, Building and Fire Research, 2007.
Bosch. (2009). Retrieved November 2009, from Tool Orbit: http://www.toolorbit.com/Bosch/Bosch-7561-118.html.
Energy, U. D. (2009, June 19). Accessed 25 November 2009, http://www.eia.doe.gov/aer/pdf/aer.pdf.
Glacier Bay Inc. Transmission of Heat Conduction, Convection and Radiation, 2009. Accessed 25 November 2009, http://www.glacierbay.com/Heatprop.asp.
Google. (2009). Google maps. Accessed 20 November 2009, http://maps.google.com/maps?f=s&utm_campaign=en&utm_source=en-ha-na-us-bk-gm&utm_medium=ha&utm_term=google%20maps.
The Indiana Limestone Institute of America, Inc. The Indiana Limestone Handbook, 2009.
Kreysler, B. (2009, Sept - Dec.). CEO, Kreysler & Associates. (CEE 226 Group 9, Interviewer).
Marble Institute of America. (2009). R-Value for Natural Stone. Accessed 14 November 2009, http://www.marble-institute.com/industryresources/rvalue.cfm.
Metric, S. (2009, April). SI metric.co.uk. Accessed 12 November 2009, http://www.simetric.co.uk/si_wood.htm.
Northern Tool + Equipment Catalog Co., “Milwaukee”, 2009. Accessed 15 November 2009, http://www.northerntool.com/webapp/wcs/stores/servlet/product_6970_200190674_200190674.
Northern Tool and Equipment Catalog Co., “Marco”, 2009. Accessed 15 November 2009, http://www.northerntool.com/webapp/wcs/stores/servlet/product_6970_200229924_200229924.
Orris, D. M. (2007). Dimension Stone. Retrieved November 2009, from USGS Publication Warehouse: http://pubs.usgs.gov/of/2007/1214/PDF/11.0-dimension-stone-FINAL.pdf
Pre Consultants, Simapro Software, 2009.

40
USGS. (2008, November 17). Stone (dimension) statistics U.S. Geological Survey. Retrieved November 2009, from USGS: http://minerals.usgs.gov/ds/2005/140/stonedimension.pdf