Embed Size (px)
Citation preview
RESOURCE Schoen, H. L., & Hirsch, C. R. (2003). The Core-Plus Mathematics Project: Perspectives and student achievement. In S. Senk and D. Thompson (Eds.), Standards-Based School Mathematics Curricula: What Are They? What Do Students Learn? pp. 311–344. Hillsdale, NJ: Lawrence Erlbaum Associates, Inc. ABSTRACT This chapter provides an overview of the CPMP curriculum in terms of its theoretical framework and a profile of student outcomes. Achievement results are reported from the three-year Core-Plus Mathematics field test (1994–97) for each subtest of the standardized Ability to Do Quantitative Thinking (ATDQT) test and for students who scored in the top, middle, and bottom third on the ATDQT pretest. Results on measures of students’ understanding of algebraic and geometric concepts and methods and of statistics, probability and discrete mathematics are also presented. Students’ perceptions and attitudes about mathematics and about their mathematics course are summarized. Finally, SAT and ACT scores of students in CPMP are compared to those in more conventional curricula. On all measures except paper-and-pencil algebra skills, students in CPMP do as well as or better than those in more conventional curricula.

In S. Senk and D. Thompson (Eds.), Standards-Based School Mathematics Curricula: What are They? What DoStudents Learn? Pp. 311-343. Hillsdale, NJ: Lawrence Earlbaum Associates, Inc.
CHAPTER 14
The Core-Plus Mathematics Project:Perspectives and Student Achievement
Harold L. SchoenUniversity of Iowa
Christian R. HirschWestern Michigan University
The Core-Plus Mathematics Project (CPMP) curriculum is designed to make important andbroadly useful mathematics meaningful and accessible to a wide range of students. Thecurriculum consists of a single core sequence for both college-bound and employment-boundstudents during the first 3 years of high school. This organization is intended to keep post-highschool education and career options open for all students. A flexible fourth-year course continuesthe preparation of students for college mathematics. The completed curriculum is publishedunder the title Contemporary Mathematics in Context A Unified Approach (Coxford, Fey,Hirsch, Schoen, Burrill, et al., 1997, 1998, 1999; Coxford, Fey, Hirsch, Schoen, Hart, et al.,2001).
This chapter provides a brief overview of the CPMP curriculum in terms of its design andtheoretical framework, and a profile of the mathematical achievement of students who partici-pated in the national field test of the curriculum.1 Other focused research studies conducted inCPMP classrooms are reported elsewhere (cf. Huntley, Rasmussen, Villarubi, Sangtong, & Fey,2000; Kett, 1997/1998; Lloyd & Wilson, 1998; Truitt, 1998/1999; Walker, 199/2000).
The profile of CPMP student achievement continues to evolve over time. In Fall 1997,CPMP embarked on a longitudinal summative evaluation of the complete curriculum imple-mented with students who have completed middle school mathematics programs funded by theNational Science Foundation and described elsewhere in this volume. Mathematical performanceand attitudes of Fall 1997 high school freshmen have been monitored from Grade 9 through theirfirst year of post-high school education or work. A summary of the findings of the longitudinalstudy is in progress.
BACKGROUND AND PERSPECTIVES
Each CPMP course was developed in consultation with an international advisory board, mathe-maticians, instructional specialists, and classroom teachers. In creating the CPMP three-year corecurriculum (typically completed by students in Grades 9–11), the authors used a “zero-based”process (Mathematical Sciences Education Board, 1990) in which the inclusion of a topic wasbased on it own merits. In designing each course, we always asked and debated: “If this is thelast mathematics students will have the opportunity to learn, is the most important mathematicsincluded?” This approach resulted in the elimination or de-emphasis of some topics found in
CORE-PLUS MATHEMATICS PROJECT 14-3
traditional curricula, a reordering of other topics, and the inclusion of what the authors believedto be the most broadly useful and important mathematical ideas. As a result, statistics, proba-bility, and discrete mathematics have assumed a central position in each year of the curriculum.Course 4 formalizes and extends the core program with a focus on the mathematics needed to besuccessful in college mathematics and statistics courses.
In each year of the CPMP curriculum, mathematics is developed along interwoven strands ofalgebra and functions, geometry and trigonometry, statistics and probability, and discrete math-ematics. Each of these strands is developed in focused units connected by common topics such assymmetry, functions, matrices, and data analysis and curve fitting. The strands also are con-nected across units by mathematical habits of mind such as visual thinking, recursive thinking,searching for and explaining patterns, making and checking conjectures, reasoning with multiplerepresentations, inventing mathematics, and providing convincing arguments and proofs. Thestrands are unified further by fundamental themes of data, representation, shape, and change. Thechoice of curriculum organization was influenced by the importance of connections amongrelated concepts and procedures in developing deep understanding of mathematics (Skemp,1987). This curriculum organization breaks down the artificial compartmentalization of tradi-tional “layer cake” curricula in the Unites States and addresses weaknesses identified (Schmidt,1998) in the findings from the Third International Mathematics and Science Study (TIMSS). Inaddition, developing mathematics each year along multiple strands capitalizes on the differentinterests and talents of students and helps to develop diverse mathematical insights (Hirsch &Coxford, 1997).
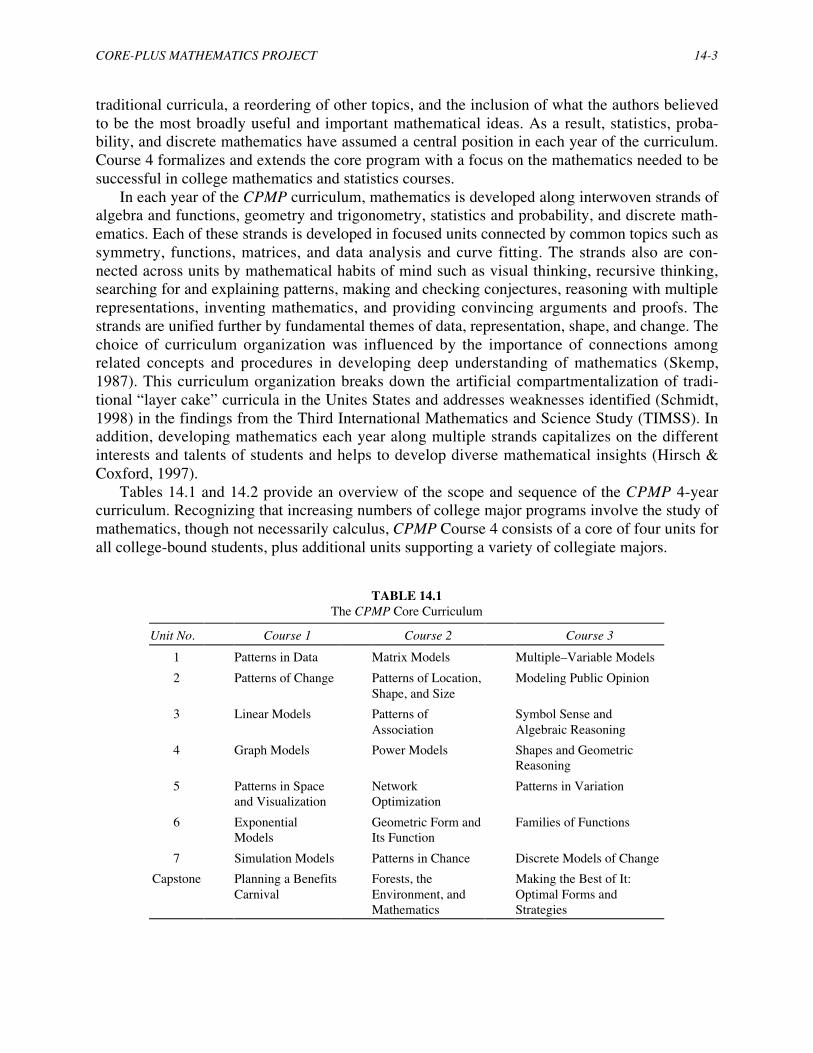
Tables 14.1 and 14.2 provide an overview of the scope and sequence of the CPMP 4-yearcurriculum. Recognizing that increasing numbers of college major programs involve the study ofmathematics, though not necessarily calculus, CPMP Course 4 consists of a core of four units forall college-bound students, plus additional units supporting a variety of collegiate majors.
TABLE 14.1The CPMP Core Curriculum
Unit No. Course 1 Course 2 Course 3
1 Patterns in Data Matrix Models Multiple–Variable Models2 Patterns of Change Patterns of Location,
Shape, and SizeModeling Public Opinion
3 Linear Models Patterns ofAssociation
Symbol Sense andAlgebraic Reasoning
4 Graph Models Power Models Shapes and GeometricReasoning
5 Patterns in Spaceand Visualization
NetworkOptimization
Patterns in Variation
6 ExponentialModels
Geometric Form andIts Function
Families of Functions
7 Simulation Models Patterns in Chance Discrete Models of ChangeCapstone Planning a Benefits
CarnivalForests, theEnvironment, andMathematics
Making the Best of It:Optimal Forms andStrategies

CORE-PLUS MATHEMATICS PROJECT 14-4
TABLE 14.2CPMP Course 4 Units
Additional Units for Students Intending to Pursue Programs in:
Core UnitsMathematical, Physical and Biological
Sciences or EngineeringSocial, Management, and Health
Sciences or Humanities
1. Rates of Change 6. Polynomial and RationalFunctions
5. Binomial Distributions andStatistical Inference
2. Modeling Motion 7. Functions and SymbolicReasoning
9. Informatics
3. Logarithmic Functionsand Data Models
8. Space Geometry 10. Problem Solving, Algorithms,and�Spreadsheets
4. Counting Models
Curriculum Development PrinciplesSeveral key principles guided the design of the CPMP curriculum. First and foremost is thebelief that mathematics is a vibrant and broadly useful subject that should be explored andunderstood as an active science of patterns (Steen, 1990). As a result, experimentation, dataanalysis, and seeking and verifying patterns are pervasive in the curriculum. For instance, inCourse 1 (Unit 2), CPMP students conduct experiments that simulate bungee jumping and ana-lyze patterns in the relation between jumper weight and bungee cord stretch as a prelude to thestudy of algebraic expressions and equations. In Course 1 (Unit 7) they explore patterns ingender distribution of juries and multi-child families as an entrée to the concepts and techniquesof probability and statistics. In Course 2 (Unit 2) they study patterns in computer graphic imagesand then the related ideas of coordinate geometry, transformations, congruence, and similarity.An analysis of patterns in transportation and communication networks in Course 2 (Unit 5) leadsto important concepts in graph theory that are widely used in computer and managementsciences.
A second principle underlying the curriculum is that problems provide a context fordeveloping student understanding of mathematics (Hiebert, et al., 1996; Schoenfeld, 1992). Assuggested by the unit titles, mathematical modeling and related concepts of data collection,representation, interpretation, prediction, and simulation are emphasized.
Third, consistent with our view of mathematics as a science of patterns, exploration andexperimentation necessarily precede and complement theory. Investigations are always accom-panied by opportunities for students to analyze and abstract underlying mathematical structuresthat can be applied in other contexts and that, themselves, often are the subject of furtherinvestigations.
A fourth underlying principle is the incorporation of graphics calculators and project-developed calculator software as tools for developing mathematical understanding and for solv-ing authentic problems. Graphics calculators permit the CPMP curriculum and instruction toemphasize multiple representations (verbal, numerical, graphical, and symbolic) and to focus ongoals in which mathematical thinking is central. The use of graphics calculators promotesversatile ways of dealing with realistic situations and, for some students, reduces the manipu-lative skill filter that would have prevented them from studying significant mathematics.

CORE-PLUS MATHEMATICS PROJECT 14-5
The design of the CPMP curriculum was also informed by pedagogical principles, the mostcentral of which is that classroom cultures of sense-making shape students’ understanding of thenature of mathematics as well as the ways in which they can use the mathematics they havelearned (Lave, Smith & Butler, 1988; Resnick, 1987, 1988;). Investigations of real-life contextslead to (re)invention of important mathematics that makes sense to students and that, in turn,enables them to make sense of new situations and problems.
Integrated Instruction and AssessmentThe CPMP curriculum was developed not only to reshape what mathematics all students have anopportunity to learn, but also to influence the manner in which learning occurs and is assessed.Each unit in the curriculum is developed around a series of four or five lessons in which majorideas are developed through student investigations of rich applied problem situations. Each les-son focuses on several interrelated mathematical concepts and often spans 4 or 5 days.
The CPMP instructional materials recognize the pivotal roles played by small-groupcollaborative learning, social interaction, and communication in the construction of mathematicalideas, particularly in cases involving females and underrepresented minorities. Each CPMP les-son is introduced by a problem situation which the entire class is asked to think about such asthat in Figure 14.1. In this case, the context is an experiment that simulates pollution of a lake bysome contaminant and the following clean-up efforts.
Think About This Situation
One of the problems of our complex modern society is the risk of chemical or sewage spillsthat can pollute rivers and lakes. Correction requires action of natural or human cleanup processes,but both take time. The graphs below show two possible outcomes of a pollution cleanup effortfollowing an oil spill.
(a). What pattern of change in pollution level is shown by each graph?(b). Which graph shows the pattern of change that you would expect from a pollution cleanup
effort? Test your idea by running the pollution clean-up experiment several times andplotting the (time, pollutant remaining)
(c). What sort of equations relating pollution P and time t would you expect to match your plot ofdata? Test your idea using a graphing calculator or computer.
FIG. 14.1. Launching the Study of Exponential Decay (Exponential Models Unit, Course 1)

CORE-PLUS MATHEMATICS PROJECT 14-6
Once launched, a lesson usually involves students working together collaboratively in smallgroups or pairs as they investigate more focused problems and questions related to the launchingsituation. This investigative work is followed by a teacher-moderated class discussion in whichstudents share mathematical ideas developed by their groups and together construct a commonunderstanding of important mathematical concepts, methods, and approaches. Sharing, andagreeing as a class, on the mathematical ideas groups are developing is promoted by Checkpointsin the instructional materials. The sample Checkpoint in Figure 14.2 is the third of three Check-points in the lesson referenced in Figure 14.1. In Courses 1 and 2, students use NOW-NEXTlanguage to describe linear and exponential patterns of change recursively. Each Checkpoint isfollowed by a related On Your Own assessment task to be completed individually by students.
√ Checkpoint
In this lesson, you have seen that patterns of exponential change can be modeled by equations ofthe form y = a(bx).
(a). What equation relates NOW and NEXT y values of this model?
(b). What does the value of a tell you about the situation being modeled? About the tables andgraphs of (x, y) values?
(c). What does the value of b tell you about the situation being modeled? About the tables andgraphs of (x, y) values?
(d). How is the information provided by values of a and b in exponential equations likey�=�a(bx) similar to, and different from, that provided by a and b in linear equations likey�= a + bx?
Be prepared to compare your responses with those from other groups.
FIG. 14.2. Summarizing and Formalizing Mathematical Discoveries
Each lesson is accompanied by additional tasks to engage students in modeling with (M),organizing (O), reflecting on (R), and extending (E) their mathematical understanding developedthrough the investigations. MORE tasks are primarily for individual work outside of class.
Assessment is embedded in the CPMP curriculum materials and is an integral part ofinstruction. The instructional materials support continuous assessment of group and individualprogress through observing and listening to students during the exploring and summarizingphases of instruction. In addition, there are individual assessments that measure understanding ofmathematical concepts, methods, and skills. Each of the core courses also includes a thematiccapstone as seen in Table 14.1. These project-oriented capstones provide rich mathematical prob-lems whose solutions require the use of mathematics from each of the four strands studied duringthe year. This is an opportunity for students to review and consolidate their learning as well asdemonstrate their mathematical growth over the year. For more detail on CPMP pedagogicalperspectives and on the instructional model embedded in the curriculum, see Hirsch, Coxford,Fey, & Schoen (1995) and Schoen, Bean, & Ziebarth (1996).

CORE-PLUS MATHEMATICS PROJECT 14-7
SELECTED STUDIES OF STUDENT OUTCOMES
The CPMP evaluation has three interrelated goals: first, to provide a data-based guide for thedevelopment of the curriculum; second, to test the feasibility of the curriculum; and third, toidentify strengths and weaknesses of the curriculum. Following the initial development andsmall-scale local tryouts of each course, the materials were pilot tested for 1 year, revised, andthen field tested in the following year. The pilot test focused on providing data to guide thedevelopment of the curriculum.
Feasibility, strengths, and weaknesses were more the focus of the field test, although field-test data continued to guide the revisions of each course until publication. The feasibility of theCPMP curriculum was determined by how easily teachers and students could use the materialsand by the impact of the materials on students’ learning of important mathematical content.Strengths and weaknesses were addressed by measuring a variety of student outcomes and byanalyzing those outcomes in comparison with those of students using more traditional curricula.
The CPMP evaluation model combines a large-scale field test with more focused researchstudies. In this chapter, results are drawn from the evaluation in order to paint a picture ofstudents’ mathematical achievement after completing each course in the CPMP curriculum. Theoutcomes for CPMP students are compared to those of students in more traditional mathematicscurricula in some of the same field-test schools or to nationally representative norm groups.
Each of the first three CPMP courses was field tested in 36 high schools, and Course 4 wasfield tested in 28 high schools. Field-test schools were located in 11 states – Alaska, California,Colorado, Georgia, Idaho, Iowa, Kentucky, Michigan, Ohio, South Carolina, and Texas. A broadcross-section of students from urban, suburban, and rural communities with ethnic and culturaldiversity were represented.
The field-test schools were encouraged to include students with a wide range of achievementand interest in mathematics and, where possible, to group students heterogeneously. Limitationsat local sites did not always make this possible. Approximately one-fifth of the Course 1 teachersreported that their classes included all ninth-grade students, including honors students. The mostcommon CPMP class (as reported by 43.0% of the teachers) was composed of students with awide range of prior mathematics achievement and interest; however, accelerated students weregenerally not included because they completed a traditional ninth-grade course in Grade 8 andcontinued with the next course in the sequence in Grade 9. Thus, accelerated students are prob-ably underrepresented in the CPMP field-test sample
Comparative Studies of Courses 1 and 2
Design and Methodology
The goal of these studies was to compare the mathematical achievement of students exper-iencing the CPMP curriculum with that of students with similar mathematical aptitude andinterest who were studying more traditional high school mathematics curricula. We administeredsome of the same pretests and end-of-year posttests to both CPMP students and to comparisonstudents in more traditional curricula. The pretest provided a baseline for matching students inthe two groups on their entering aptitude and the posttests served as outcome measures followingthe different curricular experiences.

CORE-PLUS MATHEMATICS PROJECT 14-8
Population
At the beginning of the first field-test year (1994-95), invitations were issued to lead teachersin each CPMP field-test school inviting them to identify, if possible, a set of students in moretraditional ninth-grade mathematics courses in their school who were comparable in mathemat-ical background and aptitude to their CPMP Course 1 students. For the first year, we envisionedcomparison students coming mostly from ninth-grade algebra courses with some fromPrealgebra. Thus, participation was limited to schools that offered both CPMP and a more tradi-tional mathematics curriculum and that were willing to devote a class period in comparisonclasses for pretesting in September and two periods for posttesting in May or early June.
Eleven schools accepted the invitation. Six were from the Midwest, one urban, one rural andfour suburban; three were from the West, one urban and two rural; one was urban and from theeast; and the last was rural and from the South. At each site there were from two to five CPMPteachers and from one to three comparison teachers. The comparison classes for Course 1 studywere composed of 20 Algebra, five Prealgebra, three General Mathematics, and two ninth-gradeaccelerated Geometry classes.
For the Course 2 study, we asked these 11 schools to posttest as many of the samecomparison students as was feasible in May or June of the second year. This proved to beproblematic for many schools because the comparison students had enrolled in a variety ofmathematics classes in their sophomore year and were difficult to locate and to posttest at theend of the second year. As a result, only 5 of the 11 schools who had comparison groups in year1 agreed to test their comparison students at the end of the second year—two suburban,Midwestern schools and three urban schools, one from the South and two from the West. Thecomparison students for the Course 2 study were a subset of the Course 1 comparison studentsand were enrolled in either Algebra, Geometry, or Accelerated Advanced Algebra.
Classroom Instruction
Because the CPMP curriculum and its teaching and assessment methods were new, at leastone CPMP teacher from each school attended a 2-week workshop during the summer prior toteaching a CPMP course. In this workshop, teachers worked through the CPMP course materialsby using a small-group investigative approach similar to that they would be using with their ownstudents in the Fall. The comparison teachers had no special inservice program, because theywere presumably accustomed to the curriculum and teaching method that they used.
Although what is reported are naturalistic studies occurring in classrooms with intact groupsof students, the primary explanatory variable is the nature of the curriculum, including thecurriculum-inspired pedagogy and assessment methods. The CPMP classes were composed ofstudents with a wide range of entering mathematics achievement, including ninth-graders whonormally would not have taken Algebra. Consequently, teachers commonly finished five or sixof the seven units in Course 1, failing to complete Exponential Models in some cases andSimulation Models in nearly all cases. Survey data from 27 CPMP Course 1 teachers in these 11schools indicate that a mean of 48.9% of class time (min. = 17%; max. = 80%) was spent insmall group work. Approximately 80% indicated that calculators were available 100% of thetime, and the most common restriction on calculator use was their unavailability for homework
The nature of the instruction in the comparison classes was not specified in advance, but atthe end of the year comparison teachers described what transpired. Approximately 80% of thecomparison teachers reported small group work was used either not at all or less than once aweek. Approximately 74% of the comparison teachers reported that their students used a calcu-

CORE-PLUS MATHEMATICS PROJECT 14-9
lator more than once per week, although there are no data about how it was used. Understandingand solving linear equations in one variable was the main instructional goal for Course�1comparison classes; teachers indicated a mean of 23% of the yearly class time spent on this topicand up to 50% of the time in some algebra classes.
Instruments
Two main instruments were used in the Course 1 and Course 2 comparative studies: first, anationally standardized high school mathematics achievement test, and second, project-devel-oped open-ended posttests for each CPMP course measuring important CPMP outcomes judgedto overlap with goals of the comparison curricula.
Standardized Achievement. The standardized test was the mathematics subtest of the IowaTests of Educational Development (ITED), called Ability to Do Quantitative Thinking, or ITED-Q (Feldt, Forsyth, Ansley & Alnot, 1993). Rather than testing outcomes of a particular highschool curriculum, the focus of ITED-Q is on quantitative thinking processes that are importantfor anyone with at least a high school education. In particular, the ITED-Q assesses high schoolstudents’ ability to use appropriate mathematical reasoning in situations requiring the inter-pretation of data, charts, or graphs that represent information related to business, social andpolitical issues, medicine, and science. It consists of three subtests.
1. Understanding Mathematical Concepts and Procedures (UMCP):These items require students to select appropriate procedures, make connections amongvarious concepts, and identify examples and counterexamples of concepts.
2. Interpreting Information (Int. Inf.):These items require students to make inferences or predictions based on data or infor-mation often given in graphs or tables.
3. Solving Problems (Solve Probs.):These items require students to apply quantitative procedures to relatively novelsituations, reason quantitatively, and evaluate reasonableness of solutions.
The mathematical content includes whole numbers, exponents, fractions, decimals, percents,ratios, geometry, measurement, estimation, rounding, statistics, probability, tables, and graphs.Although very little symbolic algebra is required, the ITED-Q is quite demanding for the fullrange of high school students. For example, on ITED-Q (Form K, Level 16) the median of thenationally representative norm group in Spring of Grade 10 is approximately 15 of 40 itemscorrect, and the 99th percentile is approximately 35 of 40 items correct.
The ITED-Q correlates highly with other well-known measures of mathematical achieve-ment, such as the Iowa Test of Basic Skills (ITBS), the ACT Mathematics test, and the Schol-astic Achievement (SAT) Mathematics test.2 A form of the ITED-Q was administered as a pre-test to all CPMP and comparison students at the beginning of Course 1, and alternative forms asposttests at the end of Courses 1 and 2.
CPMP Posttests. In order to obtain a measure of students’ attainment of specific curriculumobjectives, the CPMP evaluation team developed open-ended achievement tests, called theCourse 1 Posttest and Course 2 Posttest, each in two parts. Part 1 was designed to be a test ofcontent that both CPMP and comparison students would have had an opportunity to learn thatyear, namely algebraic content for Course 1 and both algebraic and geometric content for Course2. Part 2 of each CPMP Posttest included subtests of Data Analysis, Discrete Mathematics,

CORE-PLUS MATHEMATICS PROJECT 14-10
Probability, and (in Course 1) Geometry; that is, content that the comparison students probablydid not have the opportunity to study. Comparison students completed only Part 1 of the CPMPPosttest at the end of each year, and CPMP students completed both parts. These tests requiredstudents to construct their responses and to show and often explain their work. Only results fromPart 1 are reported here.
Course 1 Posttest (Part 1) is composed of two contextual subtests, each requiring algebraicmethods, and a third subtest of procedural algebra. The first two standards-oriented subtestsrequire students to show that they understand algebraic concepts by applying them in realisticsettings and interpreting their meaning in those settings. In particular, students translate betweenproblem situations and algebraic representations, including linear equations and inequalities,tables, and graphs. These subtests also require students to rewrite algebraic expressions, solveequations that provide insights into the problem context, and explain how solutions or equivalentforms represent new information in the problem context. The third, more traditional subtest,requires students to solve linear equations in one variable and simplify linear expressions with nocontext.
The Course 2 Posttest (Part 1) also contains two contextual subtests, one algebraic and theother geometric, and a procedural algebra subtest. The contextual algebra and procedural algebrasubtests are similar in design to their counterparts on the Course 1 Posttest but include somework with exponents and quadratic expressions. The geometry subtest presents a situation over-laid on a coordinate system; students are required to apply concepts and methods of coordinategeometry and explain the meaning of the results. Concepts and methods include finding anequation of a line given two points on it, the point of intersection of a vertical line and a secondline, the midpoint of a segment, the distance between two points, an estimate of the area of anirregular closed region, and the reflection image of a figure across a given line. A relatedcontextual problem requires the use of right triangle trigonometry to solve a triangle for theunknown length of a side.
Data Collection and Analysis
The lead teacher in each field-test school was responsible for testing at that site. Pretests wereadministered during regular class periods within the first 2 weeks of school and posttests duringthe last 2 weeks of school. Students had 40 minutes to complete the 40 item, multiple-choiceITED-Q, and 45 minutes to complete each part of the open-ended CPMP Posttests. Graphicscalculators were allowed on all tests.
For the CPMP Posttests, a 5-point general scoring rubric was used:• 4 for a “complete, correct response with clear unambiguous work or explanation”;• 3 for a “good response with minor error of execution but not of understanding”;• 2 for a “complete response showing understanding of some important ideas but misunder-
standing of other ideas”;• 1 for an “incomplete response that omitted important parts or included major errors”; and• 0 for “no response or an irrelevant response.”
Graduate and advanced undergraduate Secondary Mathematics Education students were trainedto use the rubrics to score the posttests. Training and practice on the scoring of each task contin-ued until the inter-scorer agreement was 90% or higher. No scorers were aware of whether aparticular test paper belonged to a CPMP or to a comparison student.

CORE-PLUS MATHEMATICS PROJECT 14-11
Matching CPMP and Comparison Groups
It makes sense to compare outcomes of groups whose previous achievement and aptitudewere similar. To establish this similarity in the Course 1 study, the comparison students wereseparated into three subgroups according to whether they were just completing Prealgebra-General Mathematics, Algebra, or Accelerated Geometry. Each of these subgroups was matchedto a subgroup of the CPMP Course 1 students. The matching variables were ITED-Q pretestscore, school, and gender, in that order. If a match on pretest score could not be made with thesame gender, then a student of opposite gender in the same school was chosen. If a match couldnot be made in the same school, a student of the same gender was chosen randomly from amongpotential pretest score matches in one of the other 10 schools. Only two comparison studentscould not be well matched in this way.
A similar process was used to match CPMP Course 2 students to the comparison studentswho were enrolled in Algebra, Geometry or Accelerated Advanced Algebra in Grade 10. All butseven comparison students were well matched with CPMP Course 2 students. As Tables 14.3and 14.4 show, pretest means and standard deviations for matched groups were nearly identical.
Matching on one preachievement measure has the limitation that outcomes and character-istics not tested by the matching measure do not enter into the match. For example, theAccelerated Geometry students had completed 2 years of college-preparatory high schoolmathematics, whereas the CPMP Course 1 matched students were just completing their first highschool mathematics course.
Matched Group Comparisons
ITED-Q Posttests. The ITED-Q Posttest (Form L, Level 15) results for the three matchedgroups of students in the Course 1 study are given in Table 14.3. The test developers providestandard scores for the entire test but not for the subtests, so means and standard deviations of thenumber of items correct on each subtest are presented. For the Prealgebra students and theirCPMP matched sample, the mean scores of the CPMP students were significantly higher on theentire test, Interpreting Information Subtest, and Solving Problems Subtest. For the Algebrastudents and their CPMP matched sample, the mean scores of the CPMP students were signi-ficantly higher on the entire test and Interpreting Information Subtest. The accelerated Geometrystudents’ ITED-Q and subtest means did not differ significantly from those of the matched groupof CPMP students.

CORE-PLUS MATHEMATICS PROJECT 14-12
TABLE 14.3ITED-Q Pretest and Posttest Information for Matched Groups of CPMP
Course 1 and Comparison Students
ITED-QPretest
ITED-QPosttest Total
UMCP(5 items)
Int. Inf.(18 items)
Solve Probs.(17 items)
Course n Mean SD Mean SD No.a SD No.a SD No.a SDPrealgebra 109 230.8 31.0 218.8 40.2 1.6 1.3 3.9 2.5 5.4 3.0CPMP 1 (Match) 109 230.8 31.0 240.4* 35.5 2.0 1.4 5.1* 2.2 6.9* 3.0Algebra 367 261.5 33.2 262.2 42.0 2.6 1.4 6.5 3.0 8.6 3.8CPMP 1 (Match) 367 261.5 33.2 269.2* 37.9 2.7 1.2 6.9* 3.0 9.1 3.6Acc. Geometry 49 294.6 22.1 304.0 21.6 3.6 1.0 9.4 3.0 12.6 2.6CPMP 1 (Match) 49 294.6 21.8 299.1 23.7 3.6 0.8 9.3 3.1 11.6 2.9All Comparison 525 258.3 36.1 257.1 46.2 2.5 1.4 6.2 3.3 8.3 4.0All CPMP 1 (Match) 525 258.3 36.1 266.0* 39.5 2.7 1.3 6.8* 3.0 8.9* 3.6
Note. ITED-Q results were obtained by converting each student’s raw score to a standard score using conver-sion tables for norm groups who took the test with a calculator. The standard score describes a student’s location onan achievement continuum, regardless of the ITED-Q test form or the student's grade level. As an example, on theITED-Q pretest (Form K, Level 15) the maximum standard score is 353, the minimum is 154, and the median is255. The standard deviation is about 25 standard score points.
aThe values in this column represent mean number of items correct.*The t statistics for significant matched group mean comparisons in Table 3 are as follows: Prealgebra: ITED-Q
Posttest Total, t = –4.19, p <.001; Interpreting Information, t = –3.86, p < .001; Solving Problems, t = –3.80,p�<�.001. Algebra: ITED-Q Posttest Total, t = –2.38, p = .017; Interpreting Information, t = –1.96, p = .05. Allmatched students: ITED-Q Posttest Total, t = –3.37, p = .001; Interpreting Information, t = –2.80, p = .005; SolvingProblems, t = –2.50, p = .013.
The ITED-Q Posttest (Form K, Level 16) results for the three matched groups of students inthe Course 2 study are given in Table 14.4. The results for the Algebra and Accelerated Advan-ced Algebra students should be viewed with caution because they are each based on a smallnumber of students. With that caution, the available data show no significant differences inmatched group means on the ITED-Q or any of its subtests.
TABLE 14.4ITED-Q Pretest and Posttest Information for Matched Groups of CPMP
Course 2 and Comparison Students
ITED-QPretest
ITED-QPosttest Total
UMCP(7 items)
Int. Inf.(18 items)
Solve Probs.(15 items)
Course n Mean SD Mean SD No.a SD No.a SD No.a SDAlgebra 31 227.4 29.2 248.6 22.0 2.7 1.2 5.4 2.3 5.0 1.7CPMP 2 (Match) 31 227.3 29.2 252.0 33.2 2.6 1.4 6.2 2.4 4.9 2.7Geometry 139 265.0 29.8 281.4 30.1 3.5 1.4 8.2 3.0 7.6 2.9CPMP 2 (Match) 139 265.0 30.4 283.7 28.3 3.4 1.3 8.4 3.0 7.8 2.7Acc. Adv. Algebra 25 291.9 17.6 311.4 17.5 4.6 1.5 11.3 2.5 10.4 2.5CPMP 2 (Match) 25 291.8 17.5 305.0 23.8 4.4 1.5 10.6 2.8 9.8 2.5All Comparison 195 262.5 33.4 280.0 32.3 3.5 1.5 8.1 3.3 7.5 3.0All CPMP 2 (Match) 195 262.4 33.8 281.4 32.0 3.4 1.4 8.4 3.1 7.6 3.0aThe values in this column represent mean number of items correct.

CORE-PLUS MATHEMATICS PROJECT 14-13
It is important to note that the samples for the Course 1 and Course 2 studies are differentfrom one another. The results in Table 14.3 are for one study and those in Table 14.4 are foranother study with a different student sample. No inferences about 2 years of growth on theITED-Q can be made from the two tables.
Table 14.5 contains data from all students in the five schools that had Course 2 comparisonclasses who completed the ITED-Q Pretest, the ITED-Q Posttest for Course 1, and the ITED-QPosttest for Course 2. The 2-year trends in the means show that the comparison students startedat a higher level on the pretest (59th compared with 46th national student percentile). The CPMPstudents grew 10 percentile points on the posttest administered after Course 1, compared to a 2-point increase for the comparison students. Both groups maintained their first-year increase inthe second year.
Table 14.5ITED-Q Means and Standard Deviations for All CPMP
and Comparison Students
ITED-Q Pretest ITED-Q Posttest (Course 1) ITED-Q Posttest (Course 2)Course n Percentile Mean SD Percentile Mean SD Percentile Mean SDComparison 186 59 264.7 35.3 61 272.5 43.9 61 281.6 33.8CPMP 287 46 250.9 35.4 56 266.8 36.5 56 274.9 33.1
Note. Means are standard scores. Percentiles are national student percentiles. Data are for all students in the 5schools with comparison classes who completed the ITED-Q pretest, the ITED-Q posttest for Course 1, and theITED-Q posttest for Course 2.
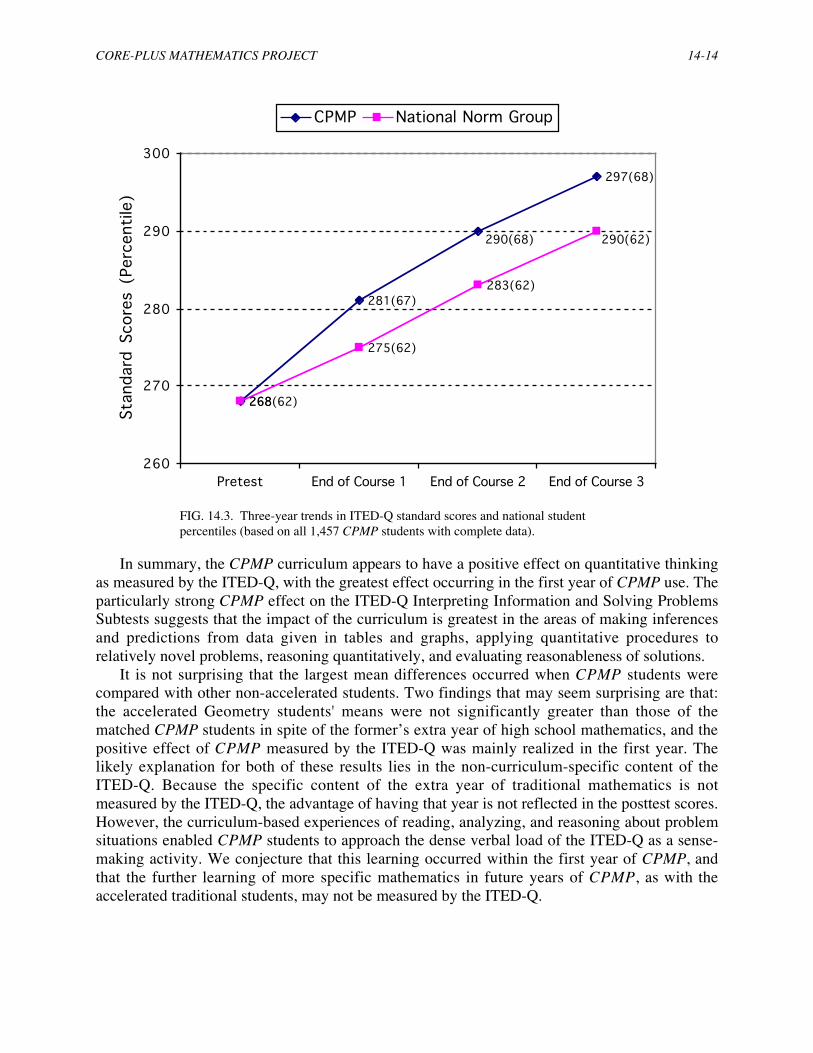
A similar 3-year pattern emerges when the ITED-Q pretest and ITED-Q posttest means forCourses 1, 2, and 3 are analyzed for all 1,457 CPMP field-test students with complete data.There was no Course 3 comparison group. For students with 3 years of CPMP, means over the 3years are compared with the growth of the nationally representative norm group’s growth at the62nd percentile, the pretest level of the CPMP students. As Figure 14.3 indicates, CPMP growthwas strong in the first year, and the first-year increase was built on slightly in Course 2 andmaintained in Course 3. This 3-year pattern is consistent, on average, in rural, urban, and sub-urban schools, for males and females, for various minority groups traditionally underrepresentedin mathematics-related occupations, and for students for whom English was not their firstlanguage (Schoen, Hirsch & Ziebarth, 1998).
CORE-PLUS MATHEMATICS PROJECT 14-14
268
297(68)
290(68)
281(67)
290(62)
283(62)
275(62)
268(62)
260
270
280
290
300
Pretest End of Course 1 End of Course 2 End of Course 3
Stan
dard
Sco
res
(Per
cent
ile)
CPMP National Norm Group
FIG. 14.3. Three-year trends in ITED-Q standard scores and national studentpercentiles (based on all 1,457 CPMP students with complete data).
In summary, the CPMP curriculum appears to have a positive effect on quantitative thinkingas measured by the ITED-Q, with the greatest effect occurring in the first year of CPMP use. Theparticularly strong CPMP effect on the ITED-Q Interpreting Information and Solving ProblemsSubtests suggests that the impact of the curriculum is greatest in the areas of making inferencesand predictions from data given in tables and graphs, applying quantitative procedures torelatively novel problems, reasoning quantitatively, and evaluating reasonableness of solutions.
It is not surprising that the largest mean differences occurred when CPMP students werecompared with other non-accelerated students. Two findings that may seem surprising are that:the accelerated Geometry students' means were not significantly greater than those of thematched CPMP students in spite of the former’s extra year of high school mathematics, and thepositive effect of CPMP measured by the ITED-Q was mainly realized in the first year. Thelikely explanation for both of these results lies in the non-curriculum-specific content of theITED-Q. Because the specific content of the extra year of traditional mathematics is notmeasured by the ITED-Q, the advantage of having that year is not reflected in the posttest scores.However, the curriculum-based experiences of reading, analyzing, and reasoning about problemsituations enabled CPMP students to approach the dense verbal load of the ITED-Q as a sense-making activity. We conjecture that this learning occurred within the first year of CPMP, andthat the further learning of more specific mathematics in future years of CPMP, as with theaccelerated traditional students, may not be measured by the ITED-Q.

CORE-PLUS MATHEMATICS PROJECT 14-15
Course 1 CPMP Posttest. Although the matched groups were formed from the set of allstudents who had completed both the ITED-Q Pretest and the ITED-Q Posttest for each course,not all students in the matched groups completed the CPMP Posttests. Rather than make newmatches, the following results are presented for all students in the matched groups who alsocompleted the Course 1 CPMP Posttest. The groups formed in this way were still well matchedon the ITED-Q Pretest.
The algebra strand of the CPMP curriculum emphasizes development of algebraic ideasthrough modeling of quantitative relationships in contextual problems, so it might be expectedthat CPMP students would perform well on such tasks. Similarly, the comparison students mightbe expected be fluent in algebraic symbolic manipulation with no context given. With someexceptions, the pattern of results in Table 14.6 aligns well with these expectations. Notice thatmean differences on the contextual algebra subtests are approximately 0.5 to 1.0 standarddeviation, favoring CPMP students. Mean differences on the procedural algebra subtests areapproximately 0.5 standard deviation, favoring the comparison group for all but the Prealgebrastudents.
Table 14.6Subtest Means and Standard Deviations for Matched Groups of CPMP
Course 1 and Comparison Students
ITED-Q Pretest Context. Alg. I Context. Alg. II Proced. Alg.Course n Mean SD Mean SD Mean SD Mean SDPrealgebra 100 228.99 30.61 3.07 2.42 1.37 1.16 5.53 3.94CPMP 1 (Match) 101 231.20 31.14 7.51* 4.04 2.95* 2.34 6.13 3.93Algebra 338 262.76 32.47 6.98 4.07 3.43 2.25 11.90* 4.74CPMP 1 (Match) 317 263.40 32.73 10.60* 3.99 4.56* 2.49 9.41 5.04Acc. Geometry 47 295.00 22.44 9.60 4.14 4.23 2.29 14.89* 3.77CPMP 1 (Match) 44 295.16 21.44 12.48* 3.33 5.91* 3.05 11.75 4.80All Comparison 485 258.91 36.03 6.42 4.22 3.09 2.26 10.87* 5.32All CPMP 1 (Match) 462 259.39 35.98 10.11* 4.20 4.34* 2.64 8.92 5.05
Note. Subtest means and standard deviations are on the Course 1 Posttest. Maximum scores are as follow:Contextual Algebra I, 16; Contextual Algebra II, 12; Procedural Algebra, 20.
*The t statistics for significant matched group mean comparisons are as follows. Prealgebra: ContextualAlgebra I, t = –9.45, p < .001; Contextual Algebra II, t = –6.06, p < .001. Algebra: Contextual Algebra I, t =–11.47, p < .001; Contextual Algebra II, t = –6.06, p < .001; Procedural Algebra, t = 6.51, p < .001. AcceleratedGeometry: Contextual Algebra I, t = –3.64, p < .001; Contextual Algebra II, t = –2.98, p = .004; ProceduralAlgebra, t = 3.48, p = .001. All matched students: Contextual Algebra I, t = –13.44, p < .001; Contextual AlgebraII, t = –7.84, p < .001; Procedural Algebra, t = 5.80, p < .001.
A more detailed analysis of particular tasks may illuminate the pattern of results and suggestways that curriculum developers can refine materials and teachers can modify implementation toimprove student learning. As an illustration of the nature of the group differences in algebraicunderstanding and reasoning, the four-part task referred to in Table 14.6 as Contextual Algebra Iis given in Figure 14.4. Means of the matched groups on each part of this task are also given.Numbers of students in the groups are the same as those given in Table 14.6.
In part (a) of this task, the intent was for students to indicate that 18 is the number of gallonsof gasoline the boat had on board at the start and –2 indicates that 2 gallons of gasoline are usedby the boat for each mile it travels. Such a response was given a score of 4. A score of 3 meanseither that both parts of the question were answered but with some vagueness such as “18 is the

CORE-PLUS MATHEMATICS PROJECT 14-16
starting point” or “–2 is the slope” or that one question was answered at a 4 level and the otherwas vague or incorrect. A score of 2 was assigned if one part of the response was vague butrelevant, that is, at the 3 level, but the other part was incorrect, or if one part of the question wasanswered at the 4 level but the other part was missing. Parts (b), (c), and (d) can be interpreted ina similar manner.
The number of gallons (y) of gasoline left in a large motor boat after traveling x miles since filling the tank isgiven by y = 18 – 2x.
CPMP CPMP Acc. CPMPPrealg Match Alg. Match Geo. Match
(a). Explain what 18 and –2 in the equation tell about 1.1 2.2 2.1 2.8 2.6 3.2the number of gallons.
(b). Graph this equation. Explain the role of 18 and –2 0.4 1.6 1.3 2.3 1.4 2.8in the graph.
(c). After filling the gasoline tank, Helen drove the boat 0.6 1.7 1.5 2.6 2.4 3.2until there were 10 gallons left. How many mileshad she driven? Explain how you can tell from theequation and how you can tell from the graph.
(d). How many gallons of gasoline were left after 1.0 2.1 2.1 2.9 3.1 3.2Helen had driven the boat 8 miles? Show orexplain your work.
FIG. 14.4. Contextual Algebra I Task from the CPMP Course 1 Posttest (Means Based on 4 Points for Each Part)
The CPMP means are generally much higher than those of the matched comparison group.However, there is room for improvement by all student groups.
Course 2 CPMP Posttest. As in Course 1, rather than form new matched groups the follow-ing results are presented for all students in the original matched groups who also completed theCourse 2 CPMP Posttest. The groups formed in this way were still well matched on the ITED-QPretest. Unfortunately, one of the five schools that administered the ITED-Q Posttest tocomparison students in the Course 2 field test decided not to disrupt classes for a second day toadminister the Course 2 CPMP Posttest to comparison students. This accounts for the largedecrease in numbers in the geometry matched groups.
As indicated in Table 14.7, Course 2 CPMP students performed much better than matchedcomparison students on the contextual tasks and not as well on the procedural tasks, although thelatter differences were only statistically significant in comparison to the Accelerated AdvancedAlgebra students who were completing their second full year of algebra.

CORE-PLUS MATHEMATICS PROJECT 14-17
Table 14.7Subtest Means and Standard Deviations for Matched Groups of CPMP
Course 2 and Comparison Students
ITED-Q Pretest Coord. Geom. Context. Alg. Proced. Alg.Course n Mean SD Mean SD Mean SD Mean SDAlgebra 31 227.35 29.17 8.26 3.41 2.54 2.05 6.26 2.86CPMP 2 (Match) 27 227.33 30.72 13.15* 3.75 7.04* 4.05 7.23 4.41Geometry 67 261.52 30.76 10.97 4.19 3.99 2.83 7.51 3.19CPMP 2 (Match) 69 260.72 33.05 16.84* 4.66 6.70* 3.99 7.23 4.41Acc. Adv. Algebra 25 291.88 17.57 15.16 3.70 5.64 2.36 12.88* 3.43CPMP 2 (Match) 18 289.50 16.48 17.33 4.33 8.83* 3.62 9.50 2.83All Comparison 123 259.08 35.51 11.13 4.53 3.94 2.74 8.30 3.94All CPMP 2(Match) 114 257.36 36.09 16.10* 4.70 7.14* 3.97 7.54 4.05
Note. Subtest means and standard deviations are on the Course 2 Posttest. Maximum scores are as follows:Coordinate Geometry, 24; Contextual Algebra, 12; Procedural Algebra, 16.
*The t statistics for significant matched group mean comparisons are as follows. Algebra: CoordinateGeometry, t = –5.20, p < .001; Contextual Algebra, t = –5.43, p < .001. Geometry: Coordinate Geometry, t = –7.72,p < .001; Contextual Algebra, t = –4.56, p < .001. Accelerated Advanced Algebra: Contextual Algebra, t = –3.50,p�= .001; Procedural Algebra, t = 3.42, p = .001. All matched students: Coordinate Geometry, t = –8.25, p < .001;Contextual Algebra, t = –7.27, p < .001.
CPMP CPMP Adv. CPMPAlg Match Geo. Match Alg. Match
Solve 126 = 84 – 14x. Explain your work and how to 1.9 2.2 2.6 2.3 3.6 2.9check it.
For the equation below, write an equivalent equation 1.2 0.7 1.0 1.1 2.8 1.4in the form y = a + bx. Explain how you are sure thatthe new equation is equivalent to the given one.
y = 52 + 20(x – 4)
If 23 = 8, 25 = 32, and (8)(32) = 2n, then n = ____. 1.5 2.0 1.8 1.9 3.3 2.4
(0 - 2 points for each part)
• Find 3(2x) if x = 4. 1.1 1.2 1.5 1.2 1.9 1.7
• Does 3(2x) = 6x for any given x? Explain. 0.6 1.0 0.6 0.7 1.2 1.0
FIG. 14.5. Algebraic Procedural Tasks from the CPMP Course 2 Posttest (Means Based on 4 Points for Each Task)
The procedural algebra tasks from the CPMP Course 2 Posttest are given in Figure 14.5,together with means of the CPMP and comparison groups. Numbers of students in the groups arethe same as those given in Table 14.7. Again, there is room for improvement for all groups ofstudents, but differences in Course 2 group means are small. Consistent with the data presentedin Table 14.7, means of the Accelerated Advanced Algebra group are greater than those of theCPMP matched group on the procedural algebra subtest; means of the Algebra and Geometrygroups are similar to those of their CPMP matched group.
The results on the Course 1 and Course 2 Posttests are consistent with the differing emphasesof the CPMP and traditional curricula. CPMP students probably had an advantage on thecontextual problems as they were in a familiar form. However, individual interviews of CPMPand comparison students suggest that CPMP students are indeed better able to handle math-

CORE-PLUS MATHEMATICS PROJECT 14-18
ematical ideas in context and that CPMP students are less automatic and efficient with paper-and-pencil algebra procedures than some comparison students (Schoen, Hirsch & Ziebarth,1998). The finding on contextual problem solving is consistent with extensive research evidencedocumenting the inability of many traditionally-educated students to move between symbolicand contextual situations and to solve verbally stated mathematics problems (Boaler, 1997;Schoenfeld, 1988, 1992).
Course 3 NAEP-based Achievement Results
Procedures
The National Assessment of Educational Progress (NAEP) is administered periodically tomonitor U.S. students’ achievement levels in various subject areas. In 1990 and 1992, a NAEPmathematics assessment was administered at several grades, including Grade 12. As anothermeasure of CPMP students’ achievement, a 30-item test was constructed by using releasedNAEP items from the five content categories and three process categories.
The NAEP-based test was administered in May 1997 to CPMP students at the end of Course3. A total of 1,292 students in 22 CPMP field-test schools completed this test.3 Six of the schoolswere urban, six were rural, and ten were suburban. In the presentation of the results, comparisonsare made between the CPMP students and students in the nationally representative sample of8,499 twelfth-grade students who took the NAEP in Fall 1990 or 1992 (Kenney & Silver, 1997).
The pattern of mathematics course-taking of the NAEP sample and the CPMP Course 3group differed considerably. Students in the NAEP sample reported having taken the followingmathematics courses: Calculus (10%), Precalculus (19%), Advanced Algebra (61%), Geometry(76%), or Algebra (87%). Thus, the sample included some students who had not enrolled in amathematics course within the year prior to the NAEP testing and others who were takingcalculus. In contrast, all of the CPMP students were just completing CPMP Course 3.
Testing conditions were not equivalent to the original administration of these same items byNAEP. For example, items were not administered in the same order, possibly affecting the itemstatistics. Further, the CPMP students had a graphics calculator available for the entire test; forthe NAEP sample, a calculator was required for 11 of the 30 items and was not available for theothers. Instead of a focus on comparing means, the item data from the NAEP sample are used asa benchmark of the difficulty of an item or of all items in a content, process, or NAEP-samplecalculator category.
Results
The results from the NAEP-based test are given in Table 14.8. Of the five content categories,the mean percent differences between CPMP and NAEP sample students was greatest on dataanalysis, statistics and probability, a content strand of the CPMP curriculum that is not em-phasized in most of the more traditional mathematics curricula.

CORE-PLUS MATHEMATICS PROJECT 14-19
Table 14.8Mean Percent Correct and Mean Percent Differences by Group on
NAEP-Based Test
Calculator, Content, orProcess�Type
No. ofItems
National(% correct)
CPMP 3(% correct)
% Difference(CPMP–Nat.) CPMP 3 SD
Content CategoriesData, Statistics & Probability 4 44.5 67.0 22.5 24.5Measurement 8 42.9 58.6 15.7 23.3Algebra & Functions 6 41.5 53.2 11.7 21.8Geometry 7 48.6 59.6 11.0 22.7Numbers & Operations 5 34.1 43.8 9.7 25.7
Process CategoriesConceptual 10 44.3 60.8 16.5 18.4Problem Solving 12 39.5 53.3 13.8 21.2Procedural 8 45.4 55.6 10.2 23.4
Calculator AccessCalculator Available (All) 11 39.1 56.4 17.3 22.7No Calculator (NAEP sample) 19 44.7 56.4 11.7 17.3 Total 30 42.7 56.4 13.7 17.9
Note. For CPMP, N = 1,292; for the national NAEP sample, N = 8,499.
Of the process categories, CPMP students’ performance relative to the NAEP sample wasbest on conceptual items. This outcome is consistent with CPMP’s emphasis on sense making,applications, and problem solving with an accompanying deemphasis on procedural skillpractice.
It might be expected that CPMP students would be relatively advantaged on the 19 items forwhich students in the national NAEP sample had no calculator available, but the data suggest theopposite. In fact, the difference between the performance of CPMP students and the nationalNAEP sample is greater on those items for which a calculator was permitted in the NAEPtesting. Perhaps part of the explanation is that a graphics calculator is an essential tool in theCPMP curriculum, and students are taught its various uses as the need arises. Thus, CPMPstudents may become more proficient at using a calculator than students in many traditionalclasses in which the calculator often has a supplementary or enrichment role. This greatercalculator proficiency is likely a positive factor for CPMP students on items for which acalculator is needed or potentially useful.
Sample tasks with percent correct for the CPMP and NAEP sample are presented in Figure14.6 to illustrate the content, process and NAEP sample calculator-availability categories.
The NAEP-based test results show a pattern similar to the one that emerged from theITED-Q and CPMP Posttest results. CPMP students demonstrate strengths in areas of conceptualunderstanding and problem solving in realistic contexts; they demonstrate somewhat lessersuccess with paper-and-pencil procedures and memory-based tasks.

CORE-PLUS MATHEMATICS PROJECT 14-20
Performance on College Entrance ExaminationsMost universities and colleges require applicants to complete either the SAT or the ACT collegeentrance examinations, and the results are usually used in the admission process as one indicatorof potential for success in college. Such examinations are important to both students and theirparents.
Sample NAEP Item CPMP NAEP
[Data, Statistics & Probability, Problem Solving, NC] From a shipment of 500 batteries, asample of 25 was selected at random and tested. If 2 batteries in the sample were found to bedead, how many dead batteries would be expected to be in the sample?
(a) 10 (b) 20 (c) 30 *(d) 40 (e) 50
3O
80% 51%
[Measurement, Problem Solving, C] In the figure above, a circle with center O and radius oflength 3 is inscribed in a square. What is the area of the shaded region?
(a) 3.86 *(b) 7.73 (c) 28.27 (d) 32.86 (e) 36.00
64% 37%
[Algebra & Functions, Conceptual, C] For what value of x is 812 = 16x?
(a) 3 (b) 4 (c) 8 *(d) 9 (e) 12
3
4
A C
B
82% 34%
[Algebra & Functions, Procedural, NC] In right triangle ABC above, cos A =
*(a) 35
(b) 34
(c) 45
(d) 43
(e) 53
34% 30%
[Geometry, Conceptual, NC] Which of the following is NOT a property of every rectangle?(a) The opposite sides are equal in length. (b) The opposite sides are parallel.
(c) All angles are equal in measure. *(d) All sides are equal in length.
(e) The diagonals are equal in length.
86% 71%
[Number & Operations, Procedural, C] A savings account earns 1 percent per month on thesum of the initial amount deposited plus any accumulated interest. If a savings account isopened with an initial deposit of $1,000 and no other deposits or withdrawals are made, whatwill be the amount in this account at the end of 6 months?
(a) $1,060.00 *(b) $1,061.52 (c) $1,072.14 (d) $1,600.00 (e) $6,000.00
36% 15%
FIG. 14.6. Sample NAEP-Based Items of Various Types with Average Percent Correct by Group (C means studentsin the NAEP sample used a calculator on that item and NC that they did not.).

CORE-PLUS MATHEMATICS PROJECT 14-21
The SAT college entrance examination (SAT I) comprises two subtests, Verbal andMathematics. The SAT Mathematics test measures mathematical reasoning and symbol sense,drawing on content from arithmetic, algebra and geometry. It requires understanding of basicalgebraic and geometric concepts typical of the first 2 years of traditional high schoolmathematics but measures little standard paper-and-pencil algebraic symbolic manipulation. Thescores on both subtests are standardized with a mean of 500 and standard deviation of 100.
The ACT college entrance examination consists of four subtests: English, Mathematics,Reading, and Science Reasoning. The ACT also reports a Composite score, the average of thefour subtest scores. The ACT Mathematics subtest measures achievement on the content of thetraditional college preparatory mathematics curriculum, including topics from elementaryalgebra, intermediate algebra, coordinate geometry, plane geometry and trigonometry. ACTMathematics items test algebraic, geometric and trigonometric concepts and procedures andstandard word problems usually intended to be solved by using equations or inequalities. ACTsubtest and composite scores are reported on a scale ranging from 1 to 36.
Both the ACT and SAT allow, but do not require, students to use graphics calculators.Virtually no statistics, probability, or discrete mathematics are tested on either test.
Comparative Studies
One field-test school, referred to by the pseudonym Southeast High School, provided eighth-grade ITBS scores as baseline data. This school is in a suburban district in the South in whichfamilies are primarily middle to upper-middle income and parents are well educated. Approx-imately 89% of students are Caucasian and others are from various minority groups. Three yearsof high school mathematics are required for graduation.
At the beginning of the CPMP field test, Fall 1994, all students who qualified for Prealgebraor nonhonors Algebra were randomly assigned to CPMP Course 1 or to the appropriatePrealgebra or Algebra class. Many of these students completed Advanced Algebra or CPMPCourse 3 in their junior year and took the SAT either in Spring or Summer of their junior year orin Fall of their senior year. Results for this set of CPMP and traditional students are given inTable 14.9. Both groups of students were comparable in mathematics achievement at the begin-ning of Grade 9. The difference between SAT Mathematics means is not statistically significantat the 0.05 level for students studying from the two different curricula.
Table 14.9ITBS and SAT Information for�CPMP�and�Traditional Students
ITBS Math (Percentile) SAT MathGroup n Mean SD Mean SD�CPMP 54 57.1 20.4 484.6 53.8Traditional 44 57.5 17.9 467.0 67.5Note. Information is for students at Southeast High School.
One urban school district in the Midwest provided ACT Mathematics and ACT Compositescores along with sixth-grade California Achievement Test (CAT) scores. This district does notgive standardized mathematics tests to students in grades 7 or 8. The pseudonym, Midwest HighSchool, is used, although the data come from two similar high schools in the same district in acity with a population of several hundred thousand. The students come from a mix of socio-

CORE-PLUS MATHEMATICS PROJECT 14-22
economic backgrounds, and approximately 30% of students are either Hispanic or AfricanAmerican. Midwest High School requires 3 years of high school mathematics for graduation.
At the beginning of the CPMP field test (Fall 1994), all students who qualified for remedialmathematics through algebra were randomly assigned by computer to CPMP Course 1 or to theappropriate traditional class. Many of these students completed Advanced Algebra or CPMPCourse 3 in their junior year and took the ACT either in spring or summer of their junior year orin Fall of their senior year. Results for these students are given in Table 14.10. Students in thetwo curricula had comparable mathematical backgrounds at the beginning of high school. TheACT Mathematics mean for the CPMP group was almost identical to that of the traditionalgroup.
In both Southeast and Midwest High Schools, the CPMP and traditional students were well-matched on before high school standardized mathematics test means. At each site, the onlyapparent systematic difference is that one group learned high school mathematics in the contextof the CPMP curriculum and the active learning environment it promotes. Class observations,student and teacher interviews, and teacher surveys provide evidence that teachers in bothschools implemented CPMP in a way that was well aligned with the project team’s recommend-ations. Together the SAT and ACT Mathematics results suggest that well-matched CPMP andtraditional students do not differ significantly on these college entrance examinations.
Table 14.10Sixth-Grade Information for�CPMP and Traditional Students
CAT Math (Percentile) ACT Math ACT CompositeGroup n Mean SD Mean SD Mean SDCPMP 71 66.3 24.2 18.3 3.1 20.3 3.6Traditional 42 68.5 26.4 18.4 3.5 19.1 3.6Note. Information is for students at Midwest High School.
ACT Trends
By Fall 1999, eight CPMP field-test schools had adopted CPMP for all their Grade 9–12students. Seven of the eight schools are midwestern schools where most of the students who planto attend college take the ACT. Three of the eight schools are rural, two are urban, and three aresuburban. Seven of the eight schools were also pilot-test schools, so beginning in 1995–1996nearly all their students (mainly juniors) who took the ACT college entrance examination hadexperienced CPMP as their high school mathematics program. By 1996–1997, all students in alleight schools had experienced CPMP rather than the traditional mathematics program that hadbeen in place in previous years.
The trend data in Table 14.11 are compiled from the 1997–1998 ACT school reports fromthese eight schools. ACT Science Reasoning scores are reported because this subtest requiresreasoning in contextual, quantitative and graphical settings. The decrease in the number ofCPMP students taking the ACT in 1997–1998 was due to the opening of a new high school inthe town with the largest of the eight schools, thereby cutting the enrollment in the CPMP schoolby nearly one half. National means are those of all students who took the ACT each year, anumber that has steadily increased over the 5 years from 891,714 in 1993–1994 to 995,039 in1997–1998.
The all-CPMP schools may differ demographically from those in the national ACT sample,so the magnitude of a mean difference on a particular subtest at any given time is of little

CORE-PLUS MATHEMATICS PROJECT 14-23
interest. However, a comparison of the annual trends for the CPMP students and the nationalACT sample is informative. First, mean scores in the CPMP schools nearly all held steady orincreased since 1995–1996 when examinees in those schools first completed CPMP rather than atraditional program. Second, the annual ACT Mathematics trends in the CPMP schools aresimilar to those in the ACT national sample. ACT Mathematics means in CPMP schoolsincreased by 0.3 points from 1993–1994 to 1997–1998 compared with 0.6 in the national ACTsample. Over the same period, ACT Science Reasoning and ACT Composite means increasedmore in the all-CPMP schools than in the national sample (increases of 0.6 and 0.5, respectively,compared with an increase of 0.2). Although student populations may have changed in ways thataffect ACT scores over this 5-year period, these longitudinal trends are consistent with aconclusion that the CPMP curriculum prepares students for the ACT at least as well as trad-itional mathematics curricula.
Table 14.11Five-year Trends of ACT Means
ACT Mathematics ACT Science Reasoning ACT CompositeYear CPMP N CPMP National CPMP National CPMP National1993–1994 1,067 21.3 20.2 22.2 20.9 21.9 20.81994–1995 1,107 21.8 20.2 22.4 21.0 22.1 20.81995–1996 1,040 21.9 20.2 22.7 21.1 22.3 20.91996–1997 1,150 21.5 20.6 22.6 21.1 22.3 21.01997–1998 971 21.6 20.8 22.8 21.1 22.4 21.0
Note. ACT means are across 8 schools using the CPMP curriculum with all students beginning in either1995–1996 or 1996–1997.
Performance on a College Mathematics Placement TestA mathematics placement test that is currently used at a major university was administered tostudents in field-test schools in May 1999 at the end of CPMP Course 4 and at the end oftraditional Precalculus. The university’s mathematics department uses this placement test,compiled from a bank of items developed by the Mathematical Association of America, to makerecommendations to entering freshmen concerning the college mathematics course in which theyshould enroll. This test contains three subtests—Basic Algebra (15 items), Advanced Algebra(15 items), and Calculus Readiness (20 items). The first two subtests consist almost entirely ofsymbolic manipulation tasks such as simplifying and factoring algebraic expressions, solvingequations and inequalities, and finding equations for lines given sufficient conditions. The thirdsubtest measures some of the important concepts and processes that underlie calculus, such aslogarithmic and exponential equations, trigonometric functions and identities, composition offunctions, rational functions and their domains, systems of nonlinear equations, and area of arectangle under a curve. A graphing calculator (that does not do symbolic manipulation) isallowed on this test.
The CPMP Course 4 students included in the comparison that follows are all those in the1998–1999 Course 4 field test who completed at least six of the seven “preparation for calculus”units of Course 4 as the last course in their sequence of CPMP Course 1–4. The Precalculusstudents, also from field-test schools, completed a traditional Precalculus course to end asequence of Algebra, Geometry and Advanced Algebra. The two groups were further restrictedto those students who indicated on a written survey their intention to attend a four-year college or

CORE-PLUS MATHEMATICS PROJECT 14-24
university in the next school year. Both groups are composed of students who fell mainly in the75th to 95th national percentiles, on average approximately 85th, on standardized mathematicalachievement tests at the beginning of high school. Means and standard deviations by group andsubtest are reported in Table 14.12.
Table 14.12Placement Subtest Information for CPMP and Traditional
Precalculus Students
Beginning Algebra Intermediate Algebra Calculus ReadinessGroup N Mean SD Mean SD Mean SDPrecalculus 177 11.4 2.3 9.6 3.2 10.5 4.3CPMP 4 164 11.5 2.6 9.2 3.4 12.9* 4.7*The t statistics for the significant Calculus Readiness group mean comparison are t = –4.93, p�<�.001.
The CPMP Course 4 mean is significantly greater than the Precalculus mean on the CalculusReadiness subtest, whereas the group means do not differ significantly on the Basic Algebra andAdvanced Algebra subtests. This is more content-specific evidence to combine with the SAT andACT findings presented earlier that CPMP students are at least as well prepared for enteringcollege mathematics as students from more traditional curricula. An area of particular strengthfor the CPMP Course 4 students is understanding of the concepts and processes that underlieCalculus.
Performance in College Mathematics CoursesThe first students who have experienced the entire four courses of CPMP in the field-test
version entered college in Fall 1999. However, some preliminary evidence on how high schoolgraduates who experienced the CPMP curriculum in its pilot version perform in collegiatemathematics courses is available. Freshmen mathematics course grade data for each year from1995-1996 through 1998-1999 were gathered for all graduates of two similar high schools in onemidwestern, suburban school district who enrolled at the University of Michigan. For purposesof this report, the pseudonyms East High School and West High School are used. Both East andWest High School’s 1995 and 1996 graduates experienced a traditional high school college-preparatory mathematics program with offerings through AP Calculus. This program continuedat West High School. At East High School, all 1997 graduates who were not in an acceleratedmathematics program and all 1998 graduates completed the CPMP pilot curriculum. Acceleratedstudents among 1998 East graduates took AP Calculus as seniors after completing CPMPCourses 1 through 4 in previous years.
Located in a suburb with many affluent, well-educated residents, East and West High Schoolbuildings (enrollments of about 840 and 1,070, respectively) are 2 miles apart and demograph-ically similar. Many adults in the community are professionals in upper management positions.Over 80% of the students are White, with Asian Americans comprising the largest of severalminority groups. Fewer than 10 students in each school are eligible for the free lunch program.Freshman college mathematics course grades of graduates from these two schools who matric-ulated at the University of Michigan were analyzed by using computer data files with schoolnames, but no student names, attached. Thus, the form of the data precludes any connecting ofdata to individual students, but it allows for analysis of 4-year school trends in college math-ematics course-taking and grades.

CORE-PLUS MATHEMATICS PROJECT 14-25
Pertinent mathematics courses at the University are Precalculus, Calculus I, Calculus II,Calculus III, Introduction to Differential Equations, and honors (all honors math courses open tofreshmen). Precalculus is the most basic mathematics course offered. Typically, freshmenenrolled in precalculus have completed 3 to 4 years of college-preparatory high school math-ematics but not AP Calculus. Freshmen enrolled in Calculus I in fall semester have usuallycompleted at least 4 years of high school mathematics through Precalculus or CPMP Course 4,and some may have taken a high school AP Calculus course. Spring-semester Calculus I classesinclude some students who successfully completed Precalculus in the Fall semester. Freshmen inCalculus II or Calculus III are placed there mainly because of high AP Calculus Examinationscores or success in the preceding college calculus course in fall semester. Freshmen with excep-tionally strong high school mathematics backgrounds and high AP Calculus Examination scoresmay take Calculus III in the Fall semester and Differential Equations in the Spring semester.
Table 14.13 gives the number of matriculants at the University of Michigan among the 1995,1996, 1997 and 1998 graduates of East and West High Schools, the numbers of these graduatescompleting each mathematics course in their freshman year, together with grade point averages,and course averages. The grade point averages were calculated by using the University’s systemas follows: A+ (4.3), A (4), A- (3.7), B+ (3.3), B (3), …, D (1), D- (0.7), E+ 0.3), and E (0).
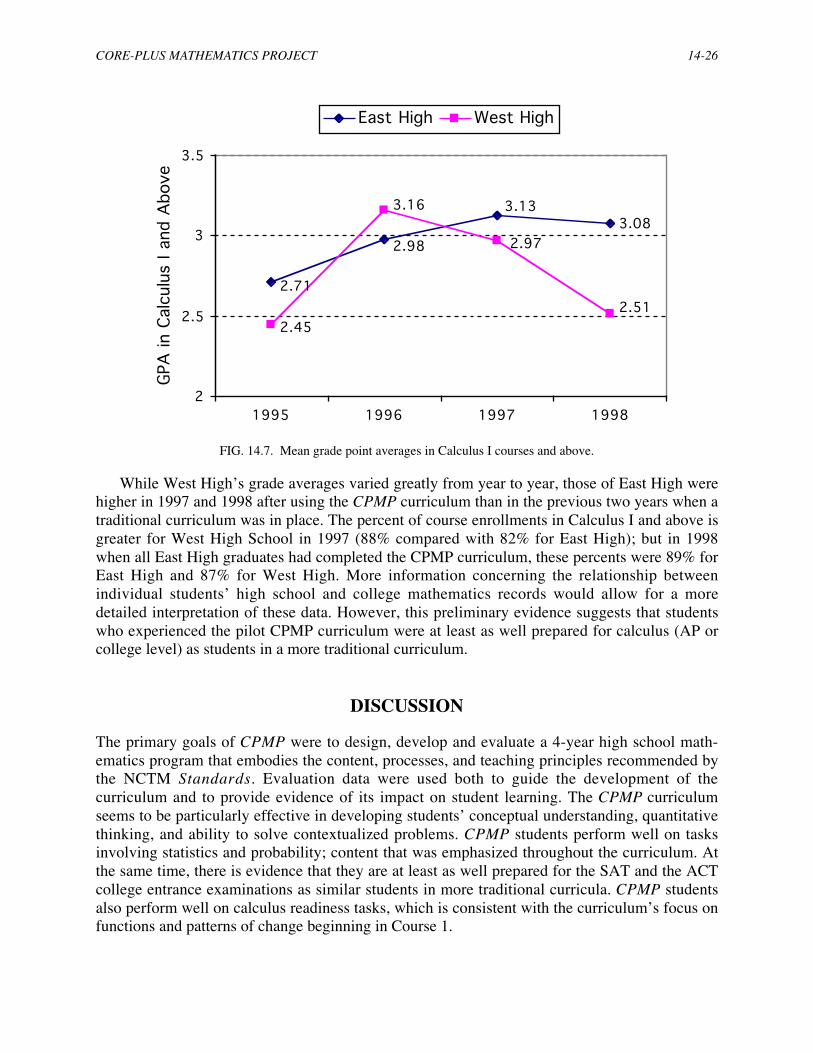
University mathematics course grades of East High School graduates for 1997 and 1998,when the CPMP pilot curriculum was in place, are generally higher than both pre-CPMP (that is,1995 and 1996) East graduates and 1997 and 1998 West High School graduates. The number of1997 and 1998 East High School graduates matriculating at the University of Michigan is greaterthan for the previous 2 years. As for courses in Calculus I and above, school trends in grade pointaverages (GPA) are shown in Figure 14.7.
Table 14.13College Mathematics Mean Grade-Point Averages by School, Course,
and Year
���������������East High School��������������� ���������������West High School���������������
College Class1995(50)
1996(74)
1997(87)
1998(72)
1995(34)
1996(57)
1997(45)
1998(35)
Precalculus 3.18(4)
2.29(6)
2.74(13)
2.98(6)
1.46(7)
3.00(4)
2.60(5)
2.97(3)
Calculus I 2.86(14)
2.60(19)
3.08(32)
2.89(25)
2.33(7)
2.82(13)
2.58(15)
2.87(7)
Calculus II 2.67(14)
3.33(12)
3.17(19)
3.49(12)
2.45(6)
3.21(18)
2.63(8)
2.29(8)
Calculus III 2.66(5)
3.10(4)
2.95(6)
2.99(8)
2.50(2)
3.17(11)
3.34(6)
2.34(5)
Intro. to Diff. Equ. 2.15(2)
4.00(1)
4.00(2)
3.30(2)
— 3.67(3)
3.65(2)
—
Honors — 3.28(5)
— — 3.30(1)
3.77(3)
4.23(4)
—
All Courses 2.76(39)
2.89(47)
3.06(72)
3.07(53)
2.15(23)
3.15(52)
2.92(40)
2.57(23)
Note. Number of students is shown parenthetically; years denote year of graduation. East HighSchool used CPMP in 1997 and 1998; West High used traditional curricula in all 4 years.
CORE-PLUS MATHEMATICS PROJECT 14-26
3.083.13
2.98
2.71
2.45
3.16
2.51
2.97
2
2.5
3
3.5
1995 1996 1997 1998
GPA
in C
alcu
lus
I and
Abo
ve
East High West High
FIG. 14.7. Mean grade point averages in Calculus I courses and above.
While West High’s grade averages varied greatly from year to year, those of East High werehigher in 1997 and 1998 after using the CPMP curriculum than in the previous two years when atraditional curriculum was in place. The percent of course enrollments in Calculus I and above isgreater for West High School in 1997 (88% compared with 82% for East High); but in 1998when all East High graduates had completed the CPMP curriculum, these percents were 89% forEast High and 87% for West High. More information concerning the relationship betweenindividual students’ high school and college mathematics records would allow for a moredetailed interpretation of these data. However, this preliminary evidence suggests that studentswho experienced the pilot CPMP curriculum were at least as well prepared for calculus (AP orcollege level) as students in a more traditional curriculum.
DISCUSSION
The primary goals of CPMP were to design, develop and evaluate a 4-year high school math-ematics program that embodies the content, processes, and teaching principles recommended bythe NCTM Standards. Evaluation data were used both to guide the development of thecurriculum and to provide evidence of its impact on student learning. The CPMP curriculumseems to be particularly effective in developing students’ conceptual understanding, quantitativethinking, and ability to solve contextualized problems. CPMP students perform well on tasksinvolving statistics and probability; content that was emphasized throughout the curriculum. Atthe same time, there is evidence that they are at least as well prepared for the SAT and the ACTcollege entrance examinations as similar students in more traditional curricula. CPMP studentsalso perform well on calculus readiness tasks, which is consistent with the curriculum’s focus onfunctions and patterns of change beginning in Course 1.

CORE-PLUS MATHEMATICS PROJECT 14-27
Symbolic manipulation in algebra is an area of concern for critics of Standards-orientedcurricula. Results of the CPMP Posttests in Courses 1 and 2 and the NAEP-based test in Course3 consistently show that CPMP students are stronger than comparison students in moretraditional curricula in conceptual understanding, interpretation of algebraic representations andcalculations, and problem solving in realistic contexts, but somewhat weaker in out-of-context,paper-and-pencil symbolic manipulation. This general pattern of algebraic learning is alsoconfirmed by a study of matched groups of CPMP Course 3 and comparison students inAdvanced Algebra in six field-test schools who were tested with a researcher-developed measureof a broad range of algebraic outcomes (Huntley, el al, 2000).
The CPMP development team used this evidence in the development of the field-test versionof Course 4. For example, a section providing additional symbolic manipulation skill practicewas included at the end of each lesson of each unit. The intent was to improve the proceduralalgebra outcomes while maintaining the curriculum’s identified strengths. The college math-ematics placement test results presented earlier suggest that this goal was achieved.
Evidence from the field tests of Courses 1–3 was also used to shape the final publishedversion of each of these courses. As part of CPMP’s longitudinal study of the published curricu-lum mentioned at the beginning of this chapter, the Educational Testing Service’s Algebra End-of-Course Examination was administered to 586 CPMP Course 2 students in May 1999. This testis developed, distributed, and scored by Educational Testing Service. The CPMP students wereall the Course 2 students in the three longitudinal study schools (one suburban and two rural) inwhich all students have experienced a Standards-oriented mathematics curriculum in middleschool and the CPMP curriculum in high school. Compared with 7,235 traditional first-timealgebra students using traditional curricula who took this test in May 1999, the scores for CPMPstudents’ were 9% higher in Concepts, 7% higher in Process, 10% higher in Algebraic Represen-tations, and 6% higher in Functions. However, CPMP students were just 1% higher in bothAlgebraic Skills and Algebraic Expressions and Equations.
We believe that the CPMP evaluation provides strong evidence in support of the feasibilityof the curriculum and of Standards-oriented reform generally. Nonetheless, because potentiallyimportant changes were made in the CPMP curriculum following its field test, new research isneeded to study the effect of the “final” curriculum on student achievement outcomes in highschool and post-high school settings. Ideally, such research would involve schools that have usedCPMP for at least a few years so that teachers understand the full scope and sequence of thecurriculum and that both teachers and students are accustomed to the expectations of the CPMPclassroom environment.
REFERENCESBoaler, J. (1997). Experiencing school mathematics: Teaching styles, sex and setting. Bristol, PA: Open University
Press.Charles, R. I. & Silver, E. A. (Eds.) (1988). The teaching and assessing of mathematical problem solving. Reston, VA:
National Council of Teachers of Mathematics.Coxford, A. F., Fey, J. T., Hirsch, C. R., Schoen, H. L., Burrill, G., Hart, E. W., Watkins, A. E. with Messenger, M. J., &
Ritsema, B. (1997). Contemporary mathematics in context: A unified approach (Course 1). Columbus, OH:Glencoe/McGraw-Hill.
Coxford, A. F., Fey, J. T., Hirsch, C. R., Schoen, H. L., Burrill, G., Hart, E. W., Watkins, A. E. with Messenger, M. J., &Ritsema, B. (1998). Contemporary mathematics in context: A unified approach (Course 2). Columbus, OH:Glencoe/McGraw-Hill.

CORE-PLUS MATHEMATICS PROJECT 14-28
Coxford, A. F., Fey, J. T., Hirsch, C. R., Schoen, H. L., Burrill, G., Hart, E. W., Watkins, A. E. with Messenger, M. J., &Ritsema, B. (1999). Contemporary mathematics in context: A unified approach (Course 3). Columbus, OH:Glencoe/McGraw-Hill.
Coxford, A.F., Fey, J.T., Hirsch, C.R., Schoen, H.L., Hart, W.W., Keller, B.A., Watkins, A.E. with Ritsema, B., &Walker, R.K. (2001). Contemporary mathematics in context: A unified approach (Course 4). Columbus, OH:Glencoe/McGraw-Hill.
Feldt, L. S., Forsyth, R. A., Ansley, T. N., & Alnot, S. D. (1993). Iowa tests of educational development (Forms K & L).Chicago: The Riverside Publishing Company.
Hiebert, J., Carpenter, T. P., Fennema, E., Fuson, K., Human, P., Murray, H., Olivier, A., & Wearne, D. (1996). Problemsolving as a basis for reform in curriculum and instruction: The case of mathematics. Educational Researcher, 25(4), 12-21.
Hirsch, C. R., Coxford A. F., Fey, J. T., & Schoen, H. L. (1995). Teaching sensible mathematics in sense-making wayswith the CPMP. Mathematics Teacher 88, 694-700.
Hirsch, C. R., & Coxford, A. F. (1997). Mathematics for all: Perspectives and promising practices. School Science andMathematics, 97, 232-241.
Huntley, M. A., Rasmussen, C. L., Villarubi, R. S., Sangtong, J., & Fey, J. T. (2000). Effects of Standards-basedmathematics education: a study of the Core-Plus Mathematics Project algebra and functions strand. Journal forResearch in Mathematics Education, 31(3), 328-361.
Kenney, P. A., & Silver, E. A. (1997). Results from the sixth mathematics assessment of the National Assessment ofEducational Progress. Reston, VA: National Council of Teachers of Mathematics.
Kett, J. R. (1997). A portrait of assessment in mathematics reform classrooms. Unpublished doctoral dissertation,Western Michigan University.
Lave, J., Smith, S., & Butler, M. (1988). Problem solving as everyday practice. In R. I. Charles & E. A. Silver (Eds.).The Teaching and Assessing of Mathematical Problem Solving. (pp. 61-81). Reston, VA: National Council ofTeachers of Mathematics.
Lloyd, G., & Wilson, M. R. (1998). Supporting innovation: The impact of a teacher’s conceptions of functions on hisimplementation of a reform curriculum. Journal for Research in Mathematics Education, 29(3), 248-274.
Mathematical Sciences Education Board (1990). Reshaping school mathematics: A philosophy and framework forcurriculum. Washington, D. C.: National Academy Press.
National Research Council (1989). Everybody counts: A report to the nation on the future of mathematics education.Washington, D. C.: National Academy Press.
Resnick, L. B. (1987). Education and learning to think. National Research Council. Washington, D. C.: NationalAcademy Press.
Resnick, L. B. (1988). Treating mathematics as an ill-structured discipline. In R. I. Charles & E. A. Silver (Eds.). TheTeaching and Assessing of Mathematical Problem Solving. (pp. 32-60) Reston, VA: National Council of Teachers ofMathematics.
Schmidt, W. H. (1998). Facing the consequences: Using TIMSS for a closer look at united states mathematics education.Boston, MA: Kluwer.
Schoen, H. L., Bean, D. L., & Ziebarth, S. W. (1996). Embedding communication throughout the curriculum. In P. C.Elliott & M. J. Kenney (Eds.), Communication in Mathematics: K-12 and Beyond, 1996 yearbook (pp. 170-179).Reston, VA: National Council of Teachers of Mathematics.
Schoen, H. L., Hirsch, C. R., & Ziebarth, S. W. (1998). An emerging profile of the mathematical achievement of studentsin the Core-Plus Mathematics Project. Paper presented at the Annual Meeting of the American EducationalResearch Association. San Diego, CA. ERIC 421 351.
Schoen, H. L., & Ziebarth, S. W. (1997). A progress report on student achievement in the Core-Plus MathematicsProject field test. Unpublished manuscript, University of Iowa.
Schoen, H. L., & Ziebarth, S. W. (1998). Mathematical achievement on standardized tests: A Core-Plus MathematicsProject field-test progress report. Unpublished manuscript, University of Iowa.
Schoenfeld, A. H. (1988). Problem solving in context(s). In R. I. Charles & E. A. Silver (Eds.). The Teaching andAssessing of Mathematical Problem Solving (pp. 82-92). Reston, VA: National Council of Teachers of Mathematics.
Schoenfeld, A. H. (1992). Learning to think mathematically: Problem solving, metacognition, and sense making inmathematics. In D. A. Grouws (Ed.). Handbook of research on mathematics teaching and learning (pp. 334-370).Reston, VA: National Council of Teachers of Mathematics.
Silver, E. A. (Ed.). (1985). Teaching and learning mathematical problem solving: Multiple research perspectives.Hillsdale, NJ.: Lawrence Erlbaum Associates.
Skemp, R. R. (1987). The psychology of learning mathematics. Hillsdale, NJ: Lawrence Erlbaum Associates.

CORE-PLUS MATHEMATICS PROJECT 14-29
Steen, L. A.. (Ed.). (1990). On the shoulders of giants: New approaches to numeracy. Washington, D. C.: NationalAcademy Press.
Truitt, B. A. (1998). How teachers implement the instructional model in a reformed high school mathematics classroom.Doctoral dissertation, University of Iowa.
Walker, R.K. (1999). Students’ conceptions of mathematics and the transition from a standards-based reform curriculumto college mathematics. Doctoral dissertation, Western Michigan University. (Dissertaton Abstracts International, 61(02B), 887, August 2000).
ENDNOTES
1. The research and development was funded in part by grants from the National Science Foundation (MDR-9255257 and ESI-9618193).
2. When given in Grade 9, correlation of the ITED-Q with the ITBS Mathematics total score in Grade 8 is 0.81,with students’ final cumulative high school grade point average in mathematics courses is 0.59, with the ACTMathematics test is 0.84, and with the SAT Mathematics test is 0.82. The ACT and SAT are college entranceexaminations, usually completed in 11th or 12th grade.
3. Of these 1,292 students, 1,104 (85.4%) also took the ITED-Q Pretest at the beginning of Grade 9, indicatingthey had completed all of CPMP Courses 1–3. It is likely that most of the remaining 188 students transferredinto CPMP sometime during Courses 1–3. The 1,104 students’ mean score on the total NAEP-based test differ-ed very little from that of all 1,292 students (56.1% compared with 56.4% as given in Table 14.9). Furthermore,means on the various subtests for the two groups of CPMP students all differed by less than 1 percentage point.