Embed Size (px)
Citation preview
Standardized Tests: Best Practices for the TI-84 Plus CE
©2016 Texas Instruments Incorporated Page i Best Practices for the TI-84 Plus CE
The role of TI technology in the classroom is intended to enhance student learning and deepen understanding. However, efficient and effective use of graphing calculator technology on high stakes tests might differ from best pedagogical practices in the classroom. This guide is intended to help students learn to use TI technology efficiently and effectively on high stakes tests. Test security is of utmost importance to Texas Instruments. While students must familiarize themselves with the calculator policy for their exam and, if required, perform any necessary calculator preparation procedures, Texas Instruments provides graphing calculator preparation guides to help. To learn more about methods to prepare TI graphing calculators for exams, see the information at this link: https://education.ti.com/en/us/solutions/test-preparation-tools.
Table of Contents
Page Number
1. Calculator Features
a. Settings ..................................................................................................................................... 1
b. Entering Numerical Expressions ........................................................................................... 2
i. Order of operations ....................................................................................................... 2
ii. Saving time ................................................................................................................... 2
iii. Exponents ..................................................................................................................... 4
iv. Roots ............................................................................................................................ 6
v. Absolute Value .............................................................................................................. 7
vi. Logs .............................................................................................................................. 7
vii. Fractions and decimals ................................................................................................. 8
viii. Complex numbers ......................................................................................................... 9
ix. Greatest common factor ................................................................................................ 10
x. Least common multiple ................................................................................................. 11
c. Equations and Expressions - Saving Time and Avoiding Mistakes ................................... 11
i. Checking for equivalence ............................................................................................. 11
ii. Using the store feature ................................................................................................. 12
iii. Using the numeric solver feature ................................................................................... 13
d. Using APPS ............................................................................................................................... 14
i. Using the Polysmlt APP ................................................................................................ 14
ii. Using the Conics APP ................................................................................................... 17
2. Graphing Features
a. Graph Setup .............................................................................................................................. 19
b. Graphing functions .................................................................................................................. 20
i. Graphing a single function ............................................................................................ 20
ii. Using the trace feature .................................................................................................. 20
iii. Finding the point of intersection of two graphs .............................................................. 21
iv. Finding the minimum or maximum value of a graph ..................................................... 23
v. Finding the x-intercept, zeros or roots of a graph .......................................................... 24
c. Using APPS ............................................................................................................................... 25
i. Using the Inequalz APP ................................................................................................ 25
3. Statistics Features
a. Entering and ordering data ..................................................................................................... 27
b. Finding the mean and median ................................................................................................. 27
c. Determining a least squares regression line ........................................................................ 28
Standardized Tests: Best Practices for the TI-84 Plus CE
©2016 Texas Instruments Incorporated Page 1 Best Practices for the TI-84 Plus CE
Calculator features
z Settings
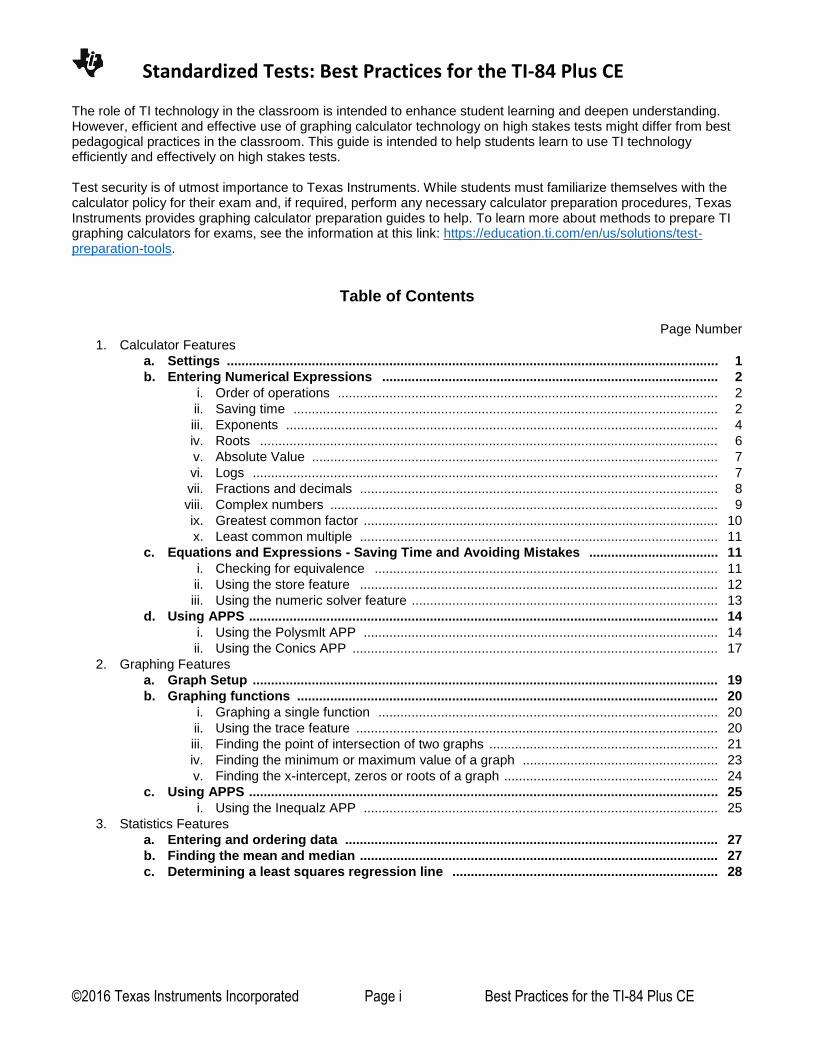
Press z to become familiar with the options as displayed to the right. Make sure the settings on your TI-84 Plus CE match those shown to the right in order to be compliant for most testing.
To change a setting, arrow down to the appropriate row, highlight the selection, and press enter.
Note: Other models have similar z settings menus Overview of Options MATHPRINT option is best for standardized tests. NORMAL SCI ENG allows you to display values using standard, scientific, or engineering form. Scientific notation will be discussed later.
FLOAT allows you to set the number of digits displayed on the screen. FLOAT option is best for standardized tests. RADIAN option is best for standardized tests. FUNCTION option is best for standardized tests. THICK refers to the thickness of a graphed line and this option is best for standardized tests. SEQUENTIAL refers to graphing lines one at a time and is the best option is best for standardized tests. REAL a+bi allows you to view both real and imaginary expressions and will be discussed later. FULL HORIZONTAL GRAPH-TABLE controls the ability to view a table side-by-side with a graph and is usually not needed for standardized tests. FRACTION TYPE is best left as a fraction n/d versus a mixed number Un/d. Fractions will be discussed later. ANSWERS Auto option is best for standardized tests. Converting between fractions and decimals will be discussed later. STAT DIAGNOSTIC allows you to view the regression correlation when running a regression. This may be appropriate to turn on for certain standardized tests. STAT WIZARDS option is best for standardized tests. SET CLOCK sets the date and time for the calculator. LANGUAGE allows the language to be adjusted to preferred language.
Standardized Tests: Best Practices for the TI-84 Plus CE
©2016 Texas Instruments Incorporated Page 2 Best Practices for the TI-84 Plus CE
Entering numerical expressions
Order of Operations
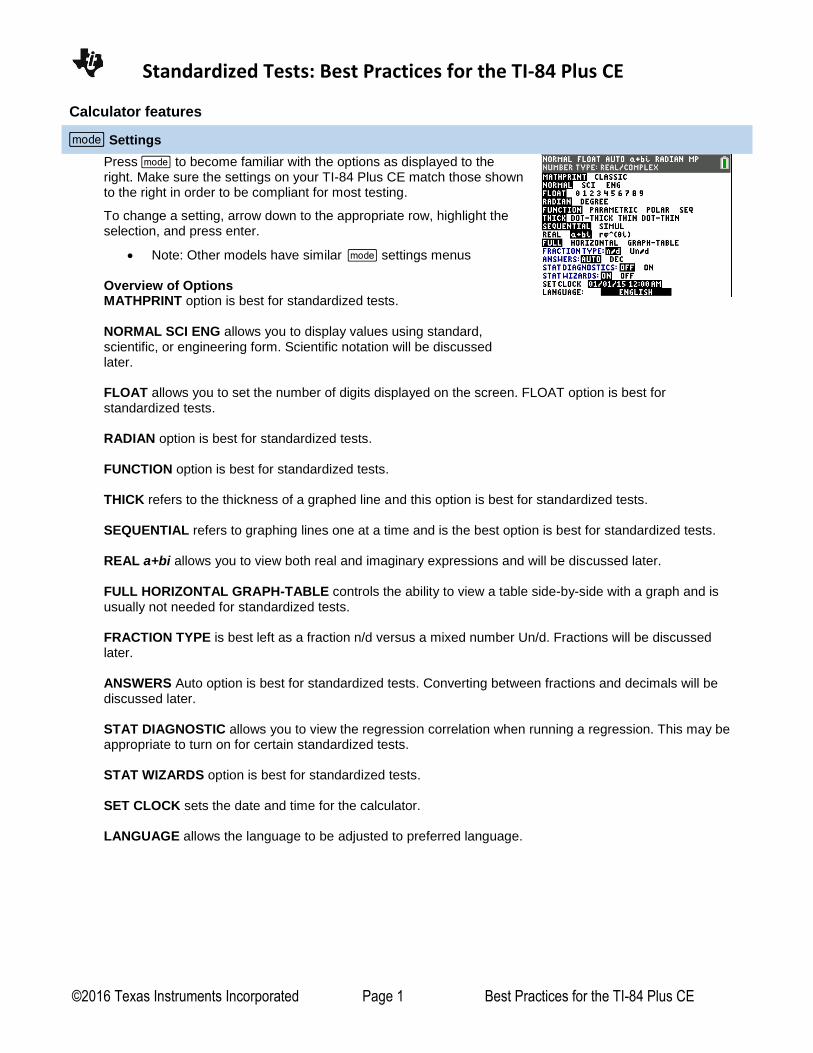
Avoiding Mistakes
The TI-84 follows the order of operations rule. It saves time and is more
efficient to enter an expression all at one time, versus one calculation at
a time. In addition, it makes it easier to view the string of operations at
one time.
Example: Evaluate 2(3.75) + 4 · 10/5
Note: there are multiple ways to imply the multiplication of 2
and 3.75.
Saving Time
Using the Ans Feature
The TI-84 stores the answer to the previous expression.
Example: To multiply the answer 15.5 by 2, just press the multiplication
key and the calculator will show Ans *. Type in 2 and the calculator
multiplies the previous answer by 2.
This can save time and help avoid careless mistakes when entering a
number.
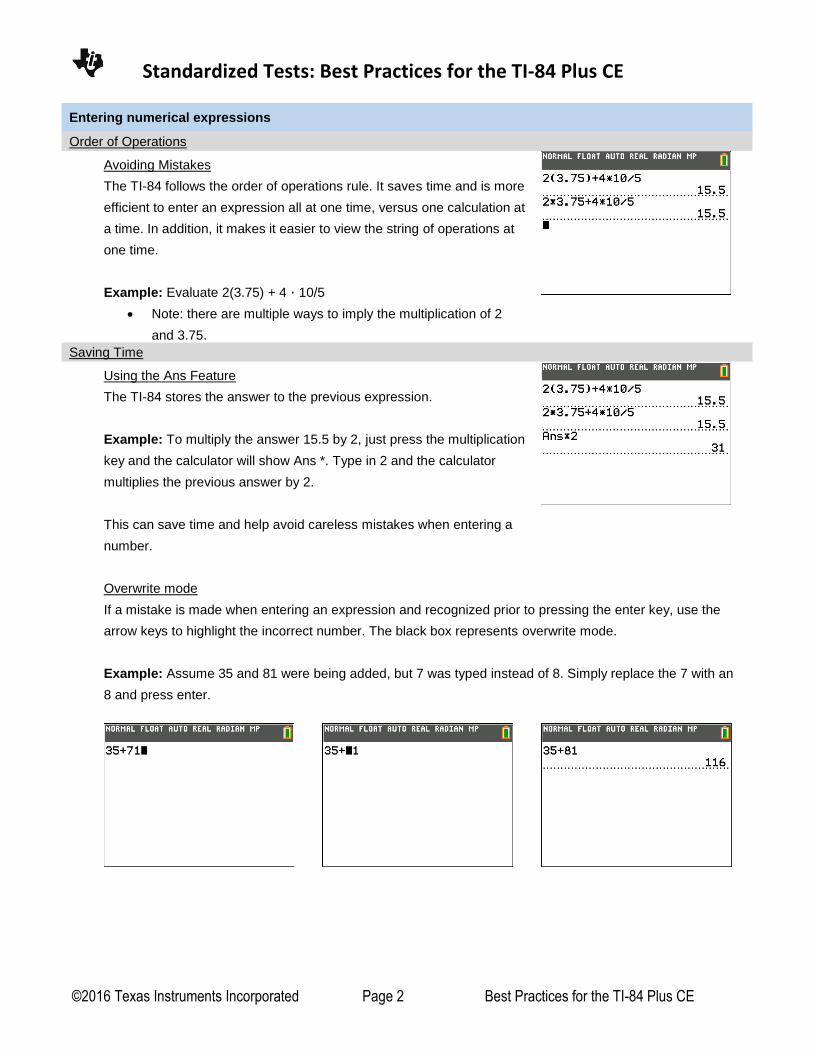
Overwrite mode
If a mistake is made when entering an expression and recognized prior to pressing the enter key, use the
arrow keys to highlight the incorrect number. The black box represents overwrite mode.
Example: Assume 35 and 81 were being added, but 7 was typed instead of 8. Simply replace the 7 with an
8 and press enter.
Standardized Tests: Best Practices for the TI-84 Plus CE
©2016 Texas Instruments Incorporated Page 3 Best Practices for the TI-84 Plus CE
Saving Time (continued)
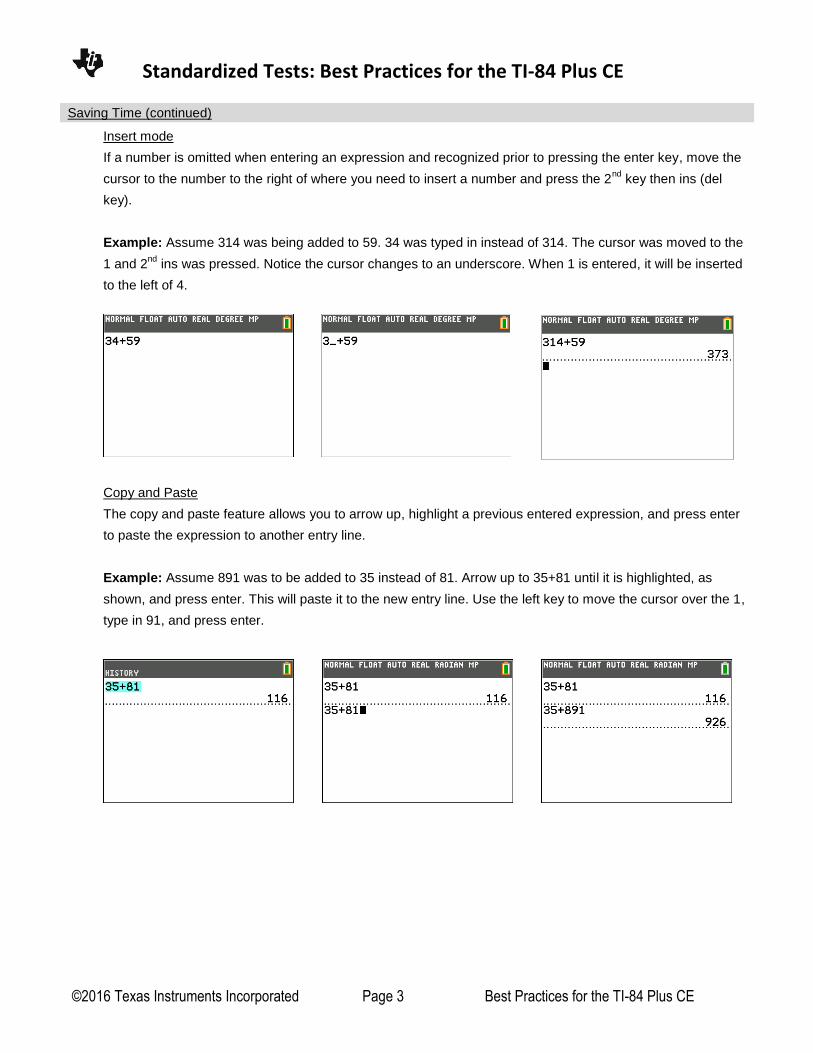
Insert mode
If a number is omitted when entering an expression and recognized prior to pressing the enter key, move the
cursor to the number to the right of where you need to insert a number and press the 2nd
key then ins (del
key).
Example: Assume 314 was being added to 59. 34 was typed in instead of 314. The cursor was moved to the
1 and 2nd
ins was pressed. Notice the cursor changes to an underscore. When 1 is entered, it will be inserted
to the left of 4.
Copy and Paste
The copy and paste feature allows you to arrow up, highlight a previous entered expression, and press enter
to paste the expression to another entry line.
Example: Assume 891 was to be added to 35 instead of 81. Arrow up to 35+81 until it is highlighted, as
shown, and press enter. This will paste it to the new entry line. Use the left key to move the cursor over the 1,
type in 91, and press enter.
Standardized Tests: Best Practices for the TI-84 Plus CE
©2016 Texas Instruments Incorporated Page 4 Best Practices for the TI-84 Plus CE
Exponents
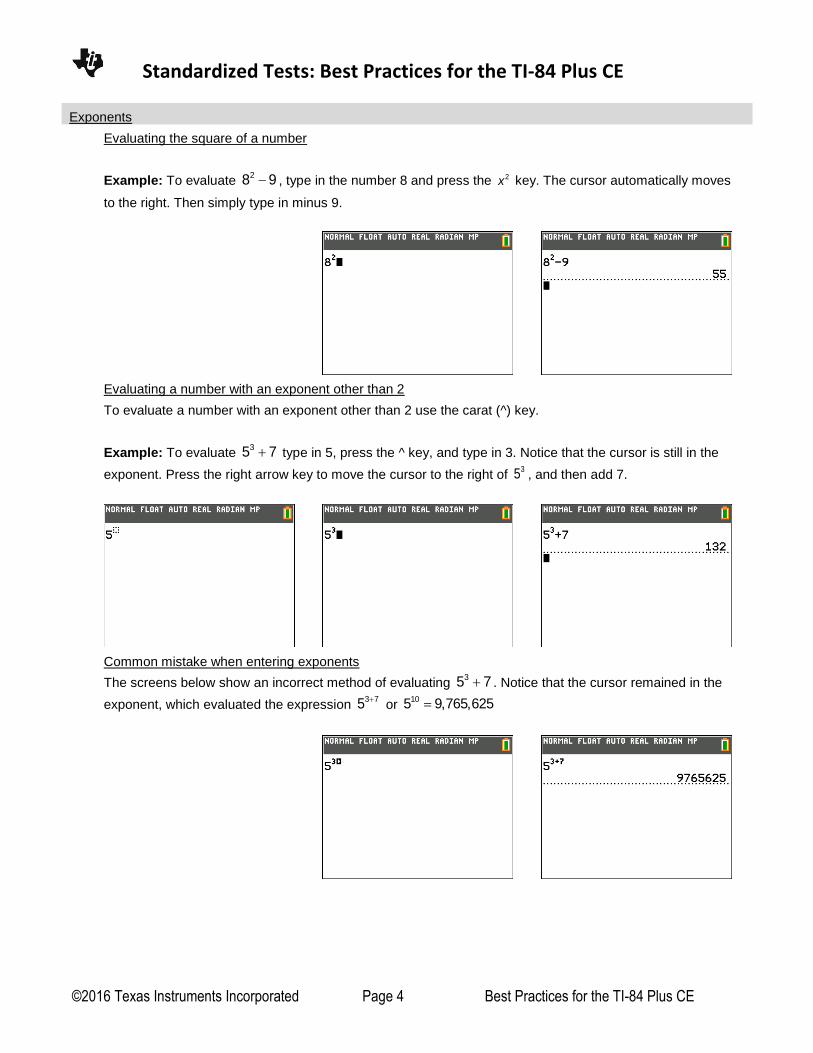
Evaluating the square of a number
Example: To evaluate 28 9 , type in the number 8 and press the 2x key. The cursor automatically moves
to the right. Then simply type in minus 9.
Evaluating a number with an exponent other than 2
To evaluate a number with an exponent other than 2 use the carat (^) key.
Example: To evaluate 35 7 type in 5, press the ^ key, and type in 3. Notice that the cursor is still in the
exponent. Press the right arrow key to move the cursor to the right of 35 , and then add 7.
Common mistake when entering exponents
The screens below show an incorrect method of evaluating 35 7 . Notice that the cursor remained in the
exponent, which evaluated the expression 3 75
or 105 9,765,625
Standardized Tests: Best Practices for the TI-84 Plus CE
©2016 Texas Instruments Incorporated Page 5 Best Practices for the TI-84 Plus CE
Exponents (continued)
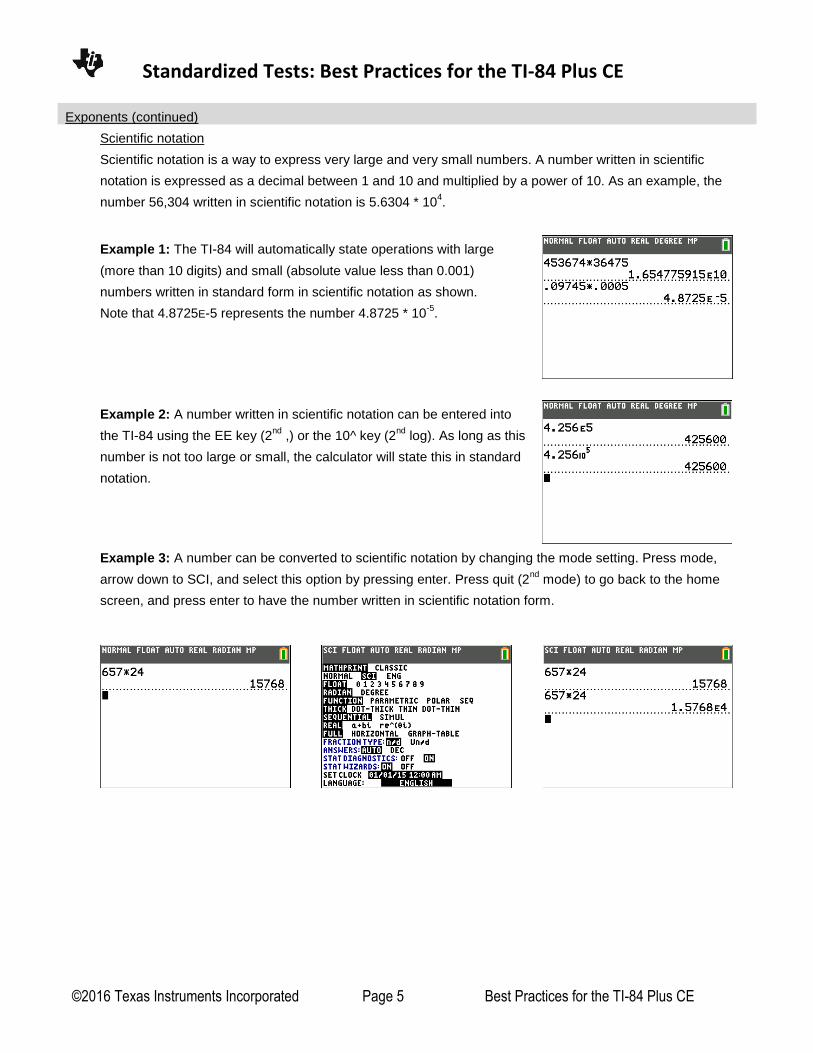
Scientific notation
Scientific notation is a way to express very large and very small numbers. A number written in scientific
notation is expressed as a decimal between 1 and 10 and multiplied by a power of 10. As an example, the
number 56,304 written in scientific notation is 5.6304 * 104.
Example 1: The TI-84 will automatically state operations with large
(more than 10 digits) and small (absolute value less than 0.001)
numbers written in standard form in scientific notation as shown.
Note that 4.8725E-5 represents the number 4.8725 * 10-5
.
Example 2: A number written in scientific notation can be entered into
the TI-84 using the EE key (2nd
,) or the 10^ key (2nd
log). As long as this
number is not too large or small, the calculator will state this in standard
notation.
Example 3: A number can be converted to scientific notation by changing the mode setting. Press mode,
arrow down to SCI, and select this option by pressing enter. Press quit (2nd
mode) to go back to the home
screen, and press enter to have the number written in scientific notation form.
Standardized Tests: Best Practices for the TI-84 Plus CE
©2016 Texas Instruments Incorporated Page 6 Best Practices for the TI-84 Plus CE
Roots
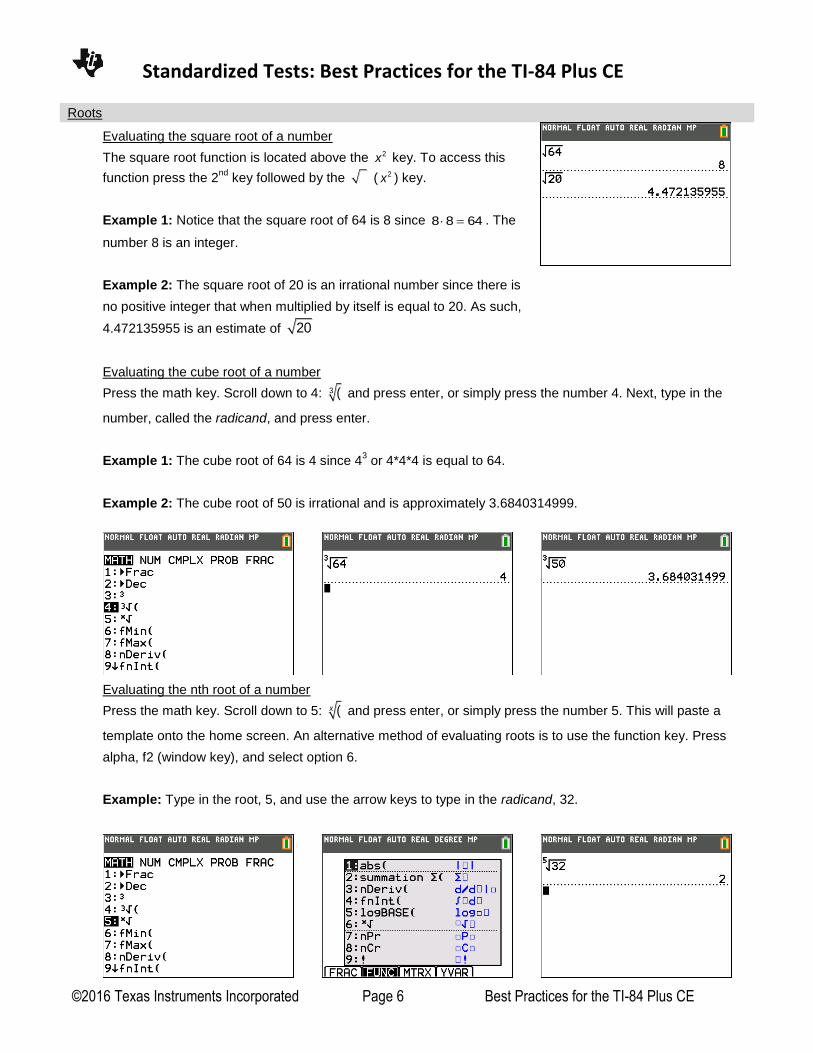
Evaluating the square root of a number
The square root function is located above the 2x key. To access this
function press the 2nd
key followed by the ( 2x ) key.
Example 1: Notice that the square root of 64 is 8 since 8 8 64 . The
number 8 is an integer.
Example 2: The square root of 20 is an irrational number since there is
no positive integer that when multiplied by itself is equal to 20. As such,
4.472135955 is an estimate of 20
Evaluating the cube root of a number
Press the math key. Scroll down to 4: 3 ( and press enter, or simply press the number 4. Next, type in the
number, called the radicand, and press enter.
Example 1: The cube root of 64 is 4 since 43 or 4*4*4 is equal to 64.
Example 2: The cube root of 50 is irrational and is approximately 3.6840314999.
Evaluating the nth root of a number
Press the math key. Scroll down to 5: (x and press enter, or simply press the number 5. This will paste a
template onto the home screen. An alternative method of evaluating roots is to use the function key. Press
alpha, f2 (window key), and select option 6.
Example: Type in the root, 5, and use the arrow keys to type in the radicand, 32.
Standardized Tests: Best Practices for the TI-84 Plus CE
©2016 Texas Instruments Incorporated Page 7 Best Practices for the TI-84 Plus CE
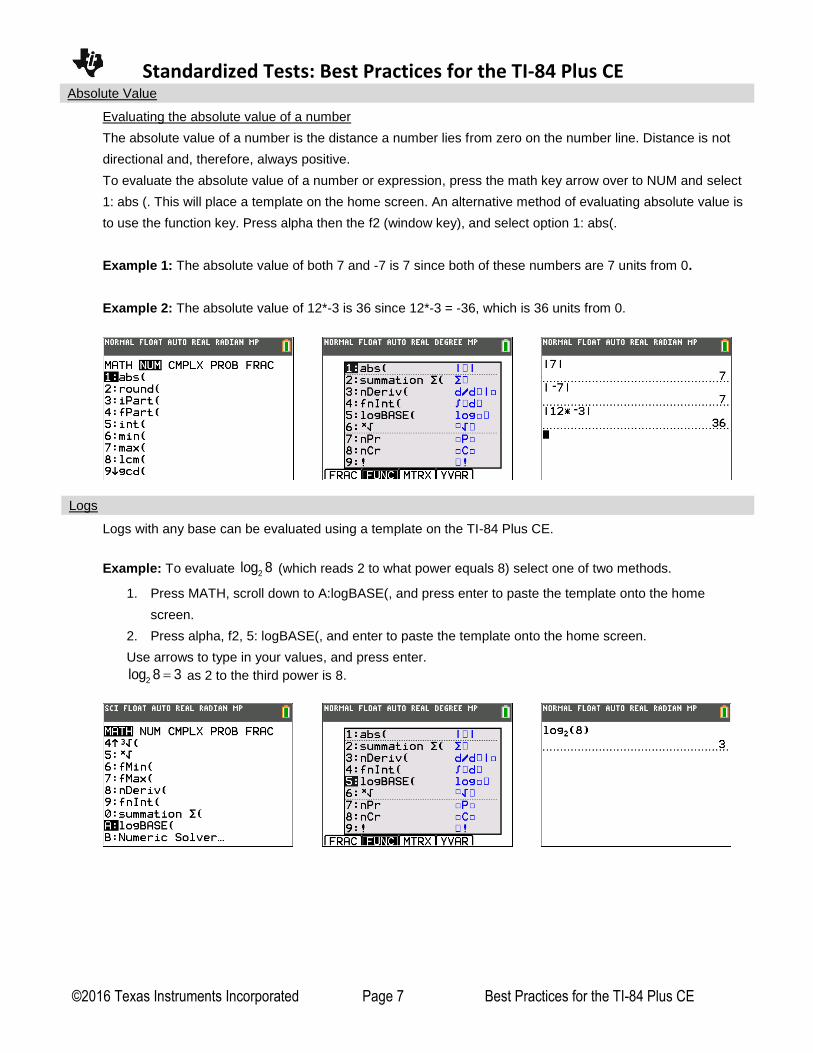
Absolute Value
Evaluating the absolute value of a number
The absolute value of a number is the distance a number lies from zero on the number line. Distance is not
directional and, therefore, always positive.
To evaluate the absolute value of a number or expression, press the math key arrow over to NUM and select
1: abs (. This will place a template on the home screen. An alternative method of evaluating absolute value is
to use the function key. Press alpha then the f2 (window key), and select option 1: abs(.
Example 1: The absolute value of both 7 and -7 is 7 since both of these numbers are 7 units from 0.
Example 2: The absolute value of 12*-3 is 36 since 12*-3 = -36, which is 36 units from 0.
Logs
Logs with any base can be evaluated using a template on the TI-84 Plus CE.
Example: To evaluate 2log 8 (which reads 2 to what power equals 8) select one of two methods.
1. Press MATH, scroll down to A:logBASE(, and press enter to paste the template onto the home
screen.
2. Press alpha, f2, 5: logBASE(, and enter to paste the template onto the home screen.
Use arrows to type in your values, and press enter.
2log 8 3 as 2 to the third power is 8.
Standardized Tests: Best Practices for the TI-84 Plus CE
©2016 Texas Instruments Incorporated Page 8 Best Practices for the TI-84 Plus CE
Fractions and Decimals
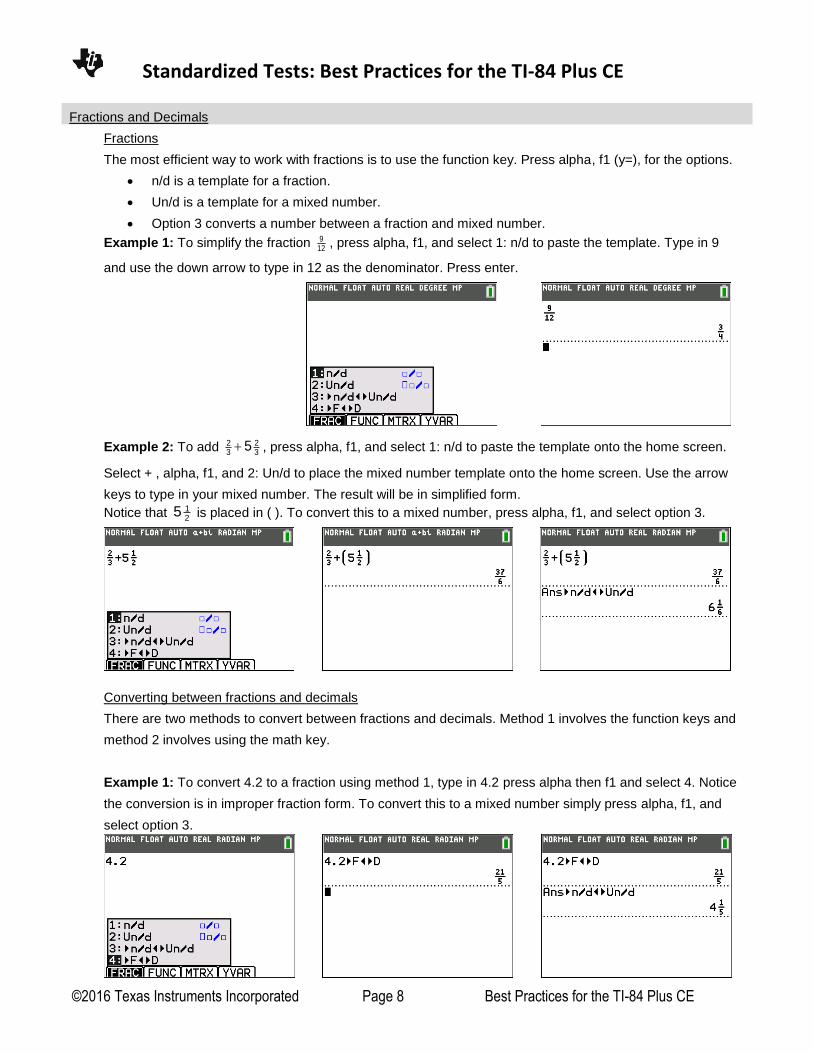
Fractions
The most efficient way to work with fractions is to use the function key. Press alpha, f1 (y=), for the options.
n/d is a template for a fraction.
Un/d is a template for a mixed number.
Option 3 converts a number between a fraction and mixed number.
Example 1: To simplify the fraction 912 , press alpha, f1, and select 1: n/d to paste the template. Type in 9
and use the down arrow to type in 12 as the denominator. Press enter.
Example 2: To add 2 23 3
5 , press alpha, f1, and select 1: n/d to paste the template onto the home screen.
Select + , alpha, f1, and 2: Un/d to place the mixed number template onto the home screen. Use the arrow
keys to type in your mixed number. The result will be in simplified form.
Notice that 12
5 is placed in ( ). To convert this to a mixed number, press alpha, f1, and select option 3.
Converting between fractions and decimals
There are two methods to convert between fractions and decimals. Method 1 involves the function keys and
method 2 involves using the math key.
Example 1: To convert 4.2 to a fraction using method 1, type in 4.2 press alpha then f1 and select 4. Notice
the conversion is in improper fraction form. To convert this to a mixed number simply press alpha, f1, and
select option 3.
Standardized Tests: Best Practices for the TI-84 Plus CE
©2016 Texas Instruments Incorporated Page 9 Best Practices for the TI-84 Plus CE
Fractions and Decimals (continued)
Converting between fractions and decimals (continued)
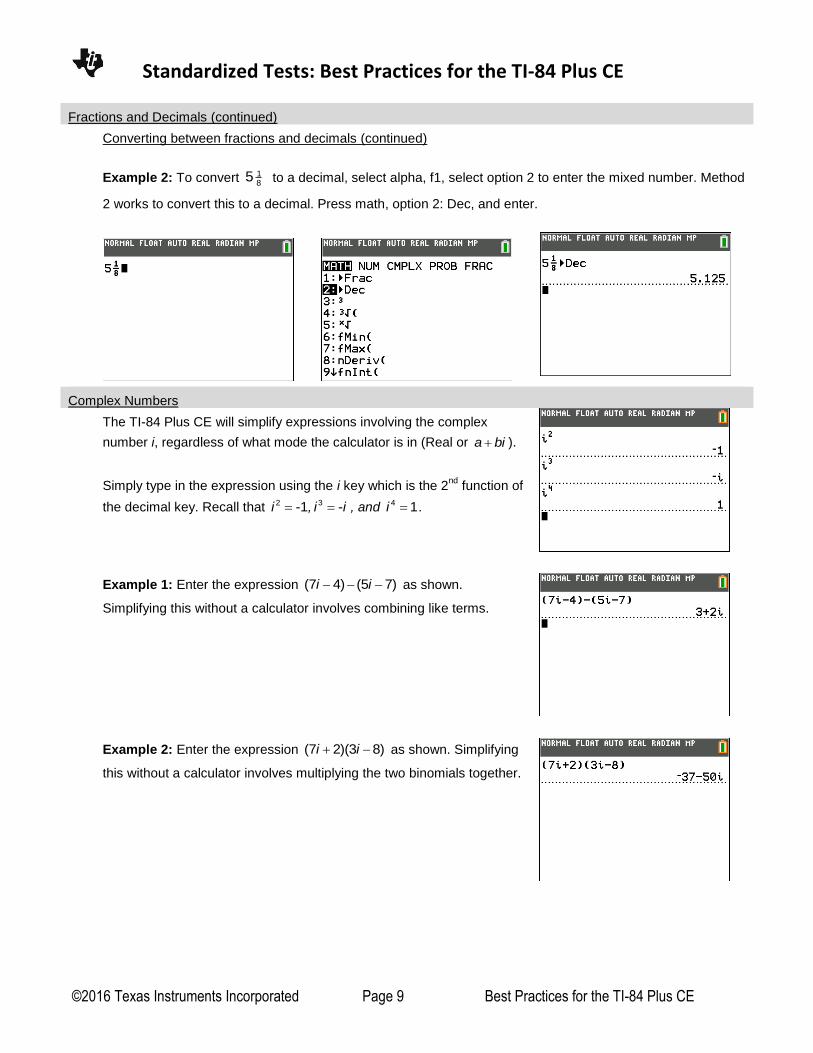
Example 2: To convert 18
5 to a decimal, select alpha, f1, select option 2 to enter the mixed number. Method
2 works to convert this to a decimal. Press math, option 2: Dec, and enter.
Complex Numbers
The TI-84 Plus CE will simplify expressions involving the complex
number i, regardless of what mode the calculator is in (Real or a bi ).
Simply type in the expression using the i key which is the 2nd
function of
the decimal key. Recall that 2 -1i , 3 -i i , and 4 1i .
Example 1: Enter the expression (7 4) (5 7)i i as shown.
Simplifying this without a calculator involves combining like terms.
Example 2: Enter the expression (7 2)(3 8)i i as shown. Simplifying
this without a calculator involves multiplying the two binomials together.
Standardized Tests: Best Practices for the TI-84 Plus CE
©2016 Texas Instruments Incorporated Page 10 Best Practices for the TI-84 Plus CE
Complex Numbers (continued)
Example 3: Enter the expression 62 9i using one of two methods as
shown to the right. Simplifying this expression without a calculator
would involve multiplying the numerator and denominator by the
conjugate of the denominator (2 9)i in order to rationalize the
denominator.
The 1st method involves using the fraction template.
The 2nd
method uses the division symbol (/) and order of
operations. With the 2nd
method, the answer will most likely
need to be converted to a fraction as shown.
Example 4: Enter powers of i as shown to the right. Notice that once a
power greater than 100 is entered, the calculator gives an estimate. In
the example shown, i101
is shown as 4.9 -12E i , which is given in
scientific notation form and represents -124.9 *10 i .
-124.9 *10 is a very small number close to zero, so i101
is equal to i.
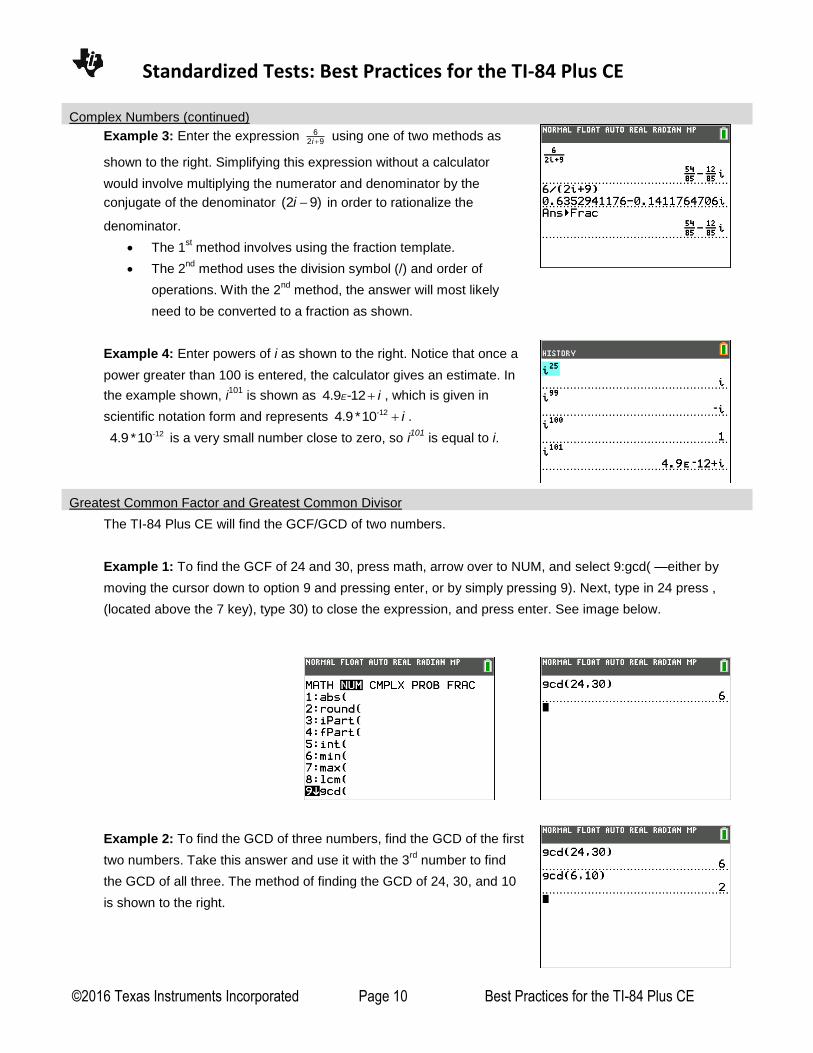
Greatest Common Factor and Greatest Common Divisor
The TI-84 Plus CE will find the GCF/GCD of two numbers.
Example 1: To find the GCF of 24 and 30, press math, arrow over to NUM, and select 9:gcd( —either by
moving the cursor down to option 9 and pressing enter, or by simply pressing 9). Next, type in 24 press ,
(located above the 7 key), type 30) to close the expression, and press enter. See image below.
Example 2: To find the GCD of three numbers, find the GCD of the first
two numbers. Take this answer and use it with the 3rd
number to find
the GCD of all three. The method of finding the GCD of 24, 30, and 10
is shown to the right.
Standardized Tests: Best Practices for the TI-84 Plus CE
©2016 Texas Instruments Incorporated Page 11 Best Practices for the TI-84 Plus CE
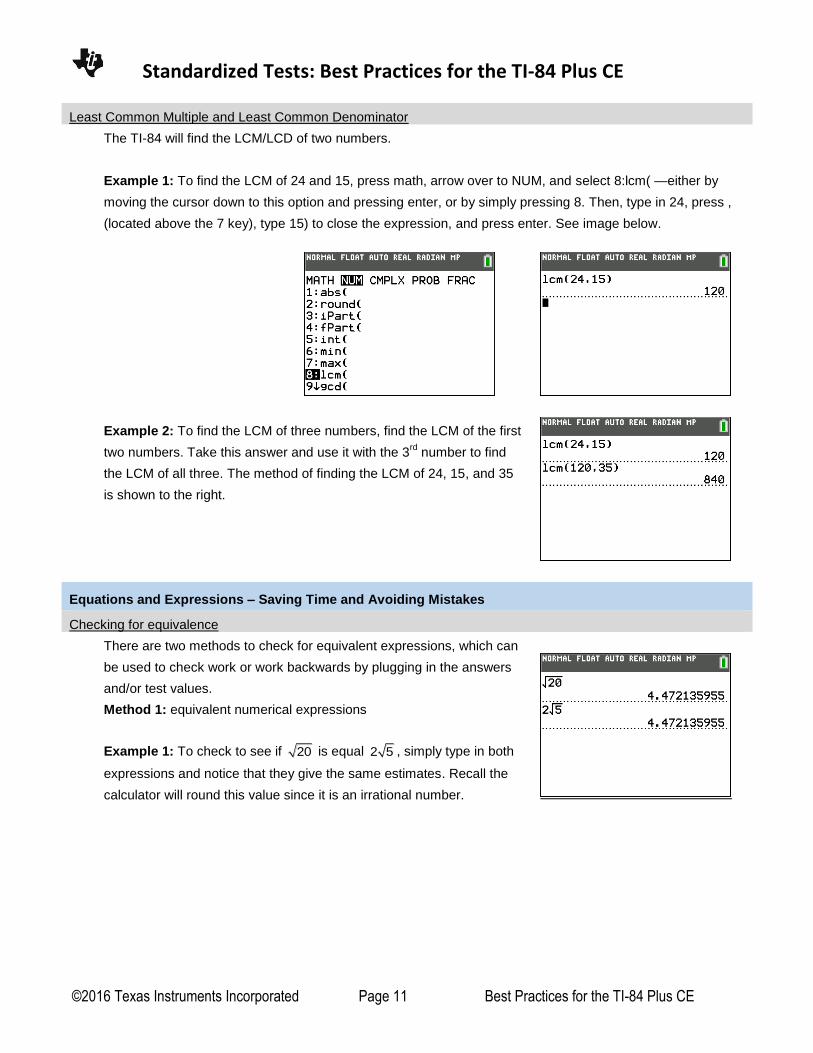
Least Common Multiple and Least Common Denominator
The TI-84 will find the LCM/LCD of two numbers.
Example 1: To find the LCM of 24 and 15, press math, arrow over to NUM, and select 8:lcm( —either by
moving the cursor down to this option and pressing enter, or by simply pressing 8. Then, type in 24, press ,
(located above the 7 key), type 15) to close the expression, and press enter. See image below.
Example 2: To find the LCM of three numbers, find the LCM of the first
two numbers. Take this answer and use it with the 3rd
number to find
the LCM of all three. The method of finding the LCM of 24, 15, and 35
is shown to the right.
Equations and Expressions – Saving Time and Avoiding Mistakes
Checking for equivalence
There are two methods to check for equivalent expressions, which can
be used to check work or work backwards by plugging in the answers
and/or test values.
Method 1: equivalent numerical expressions
Example 1: To check to see if 20 is equal 2 5 , simply type in both
expressions and notice that they give the same estimates. Recall the
calculator will round this value since it is an irrational number.

Standardized Tests: Best Practices for the TI-84 Plus CE
©2016 Texas Instruments Incorporated Page 12 Best Practices for the TI-84 Plus CE
Checking for equivalence (continued)
Method two: Testing for equivalence
Example 1: To check to see if 20 is equal 2 5 , type in 20 , press 2nd
test (math) to access the test
menu, select 1:=, and then type in 2 5 . If they are equal, the calculator will return a 1. If they are not equal,
as shown in the second example, the calculator will return a 0.
Example 2: The test feature can also be used to compare the value of two numbers/expressions as shown
below.
Using the store feature
The store feature allows you to store values for variables which allow for checking work when evaluating or
comparing expressions. The test feature is accessed by pressing 2nd
test. When substituting numerical
values for a variable, it is best to use a real, rational non-integer value such as 12.3.
Example 1: Evaluate 22 3x y when 5x and 6y using the
store feature. First, store x as 5 by pressing 5, the ¿ key and „
key for x, and enter. Next, store -6 as y by typing -6, the ¿ key, and
alpha 1 for y. Then simply type in 22 3x y , and press enter.
Another option is to substitute the values in directly for x and y. Always
be careful with negative values and place them in parenthesis as
shown to the right.
Example 2: Factor 2 25x and check your answer using the store
feature. The factored form of 2 25x is ( 5)( 5)x x . To confirm this,
first store x as 12.3 by typing 12.3, the ¿ key and „ key for x,
and enter. Next, type in 2 25 ( 5)( 5)x x x . Recall that the = sign
is accessed using the test feature by pressing 2nd
test.
Standardized Tests: Best Practices for the TI-84 Plus CE
©2016 Texas Instruments Incorporated Page 13 Best Practices for the TI-84 Plus CE
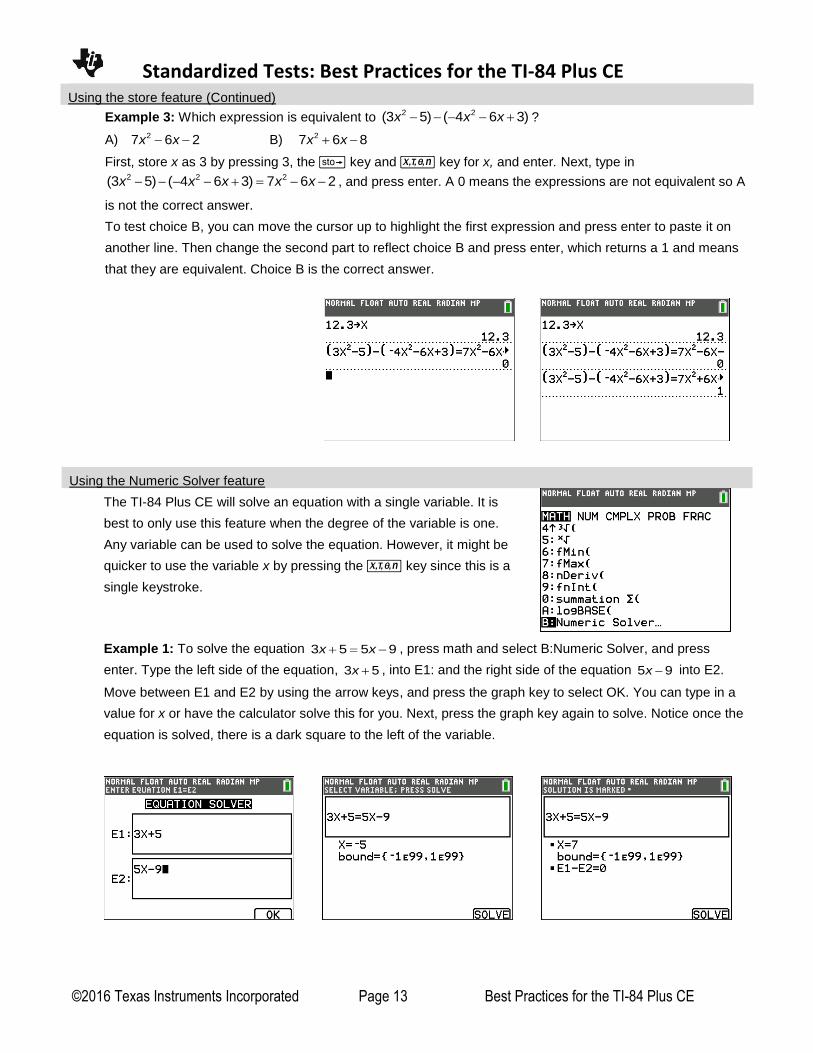
Using the store feature (Continued)
Example 3: Which expression is equivalent to 2 2(3 5) ( 4 6 3)x x x ?
A) 27 6 2x x B) 27 6 8x x
First, store x as 3 by pressing 3, the ¿ key and „ key for x, and enter. Next, type in 2 2 2(3 5) ( 4 6 3) 7 6 2x x x x x , and press enter. A 0 means the expressions are not equivalent so A
is not the correct answer.
To test choice B, you can move the cursor up to highlight the first expression and press enter to paste it on
another line. Then change the second part to reflect choice B and press enter, which returns a 1 and means
that they are equivalent. Choice B is the correct answer.
Using the Numeric Solver feature
The TI-84 Plus CE will solve an equation with a single variable. It is
best to only use this feature when the degree of the variable is one.
Any variable can be used to solve the equation. However, it might be
quicker to use the variable x by pressing the „ key since this is a
single keystroke.
Example 1: To solve the equation 3 5 5 9x x , press math and select B:Numeric Solver, and press
enter. Type the left side of the equation, 3 5x , into E1: and the right side of the equation 5 9x into E2.
Move between E1 and E2 by using the arrow keys, and press the graph key to select OK. You can type in a
value for x or have the calculator solve this for you. Next, press the graph key again to solve. Notice once the
equation is solved, there is a dark square to the left of the variable.
Standardized Tests: Best Practices for the TI-84 Plus CE
©2016 Texas Instruments Incorporated Page 14 Best Practices for the TI-84 Plus CE
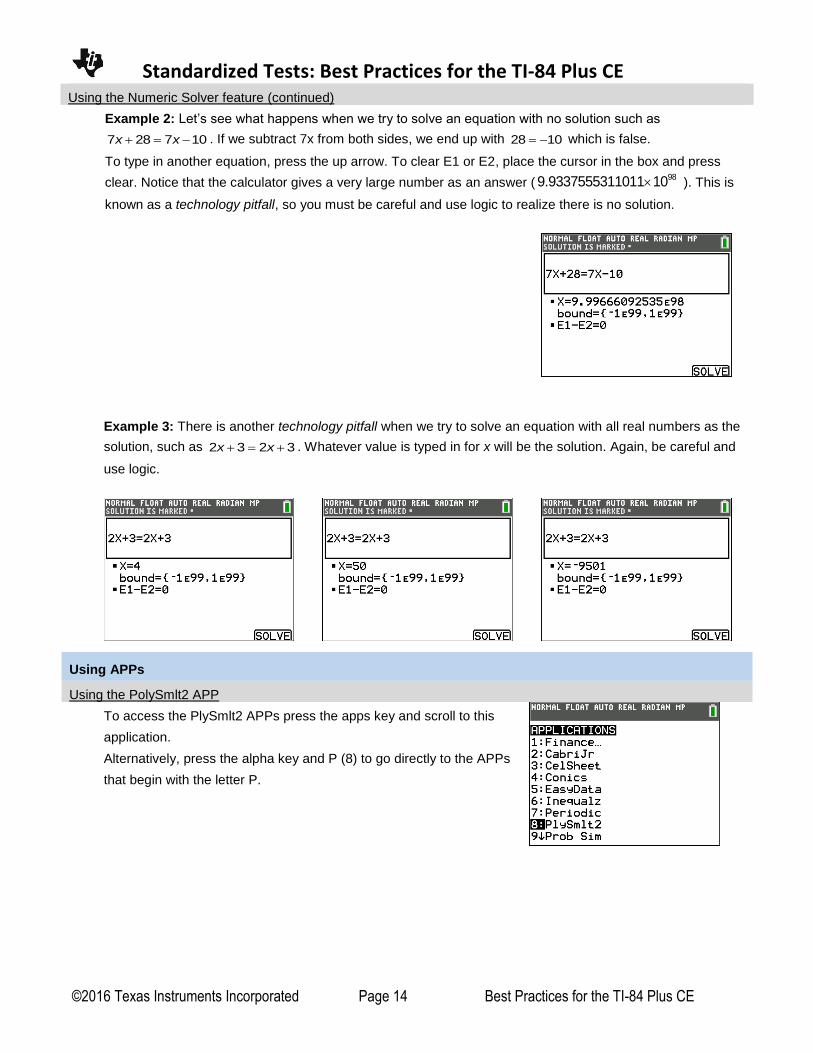
Using the Numeric Solver feature (continued)
Example 2: Let’s see what happens when we try to solve an equation with no solution such as
7 28 7 10x x . If we subtract 7x from both sides, we end up with 28 10 which is false.
To type in another equation, press the up arrow. To clear E1 or E2, place the cursor in the box and press
clear. Notice that the calculator gives a very large number as an answer (989.9337555311011 10 ). This is
known as a technology pitfall, so you must be careful and use logic to realize there is no solution.
Example 3: There is another technology pitfall when we try to solve an equation with all real numbers as the
solution, such as 2 3 2 3x x . Whatever value is typed in for x will be the solution. Again, be careful and
use logic.
Using APPs
Using the PolySmlt2 APP
To access the PlySmlt2 APPs press the apps key and scroll to this
application.
Alternatively, press the alpha key and P (8) to go directly to the APPs
that begin with the letter P.
Standardized Tests: Best Practices for the TI-84 Plus CE
©2016 Texas Instruments Incorporated Page 15 Best Practices for the TI-84 Plus CE
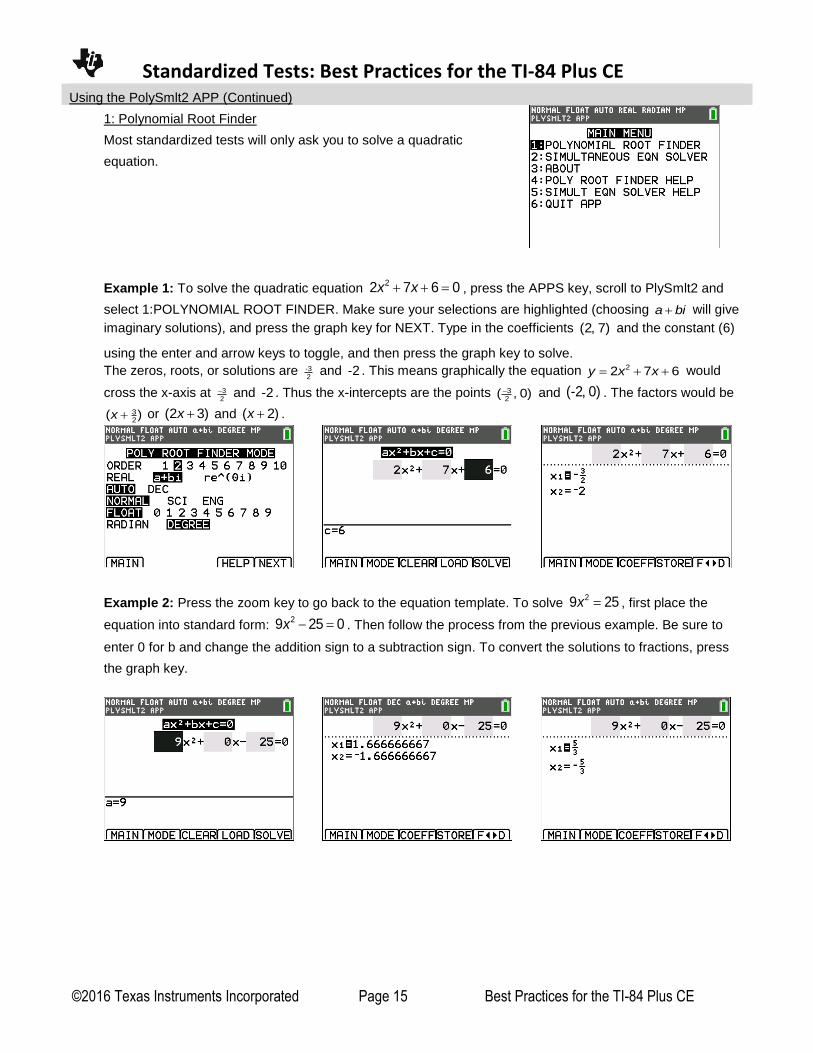
Using the PolySmlt2 APP (Continued)
1: Polynomial Root Finder
Most standardized tests will only ask you to solve a quadratic
equation.
Example 1: To solve the quadratic equation 22 7 6 0x x , press the APPS key, scroll to PlySmlt2 and
select 1:POLYNOMIAL ROOT FINDER. Make sure your selections are highlighted (choosing a bi will give
imaginary solutions), and press the graph key for NEXT. Type in the coefficients (2, 7) and the constant (6)
using the enter and arrow keys to toggle, and then press the graph key to solve.
The zeros, roots, or solutions are -32
and -2 . This means graphically the equation 22 7 6y x x would
cross the x-axis at 32 and -2 . Thus the x-intercepts are the points 3
2( , 0) and (-2, 0) . The factors would be
32
( )x or (2 3)x and ( 2)x .
Example 2: Press the zoom key to go back to the equation template. To solve 29 25x , first place the
equation into standard form: 29 25 0x . Then follow the process from the previous example. Be sure to
enter 0 for b and change the addition sign to a subtraction sign. To convert the solutions to fractions, press
the graph key.
Standardized Tests: Best Practices for the TI-84 Plus CE
©2016 Texas Instruments Incorporated Page 16 Best Practices for the TI-84 Plus CE
Using the PolySmlt2 APP (Continued)
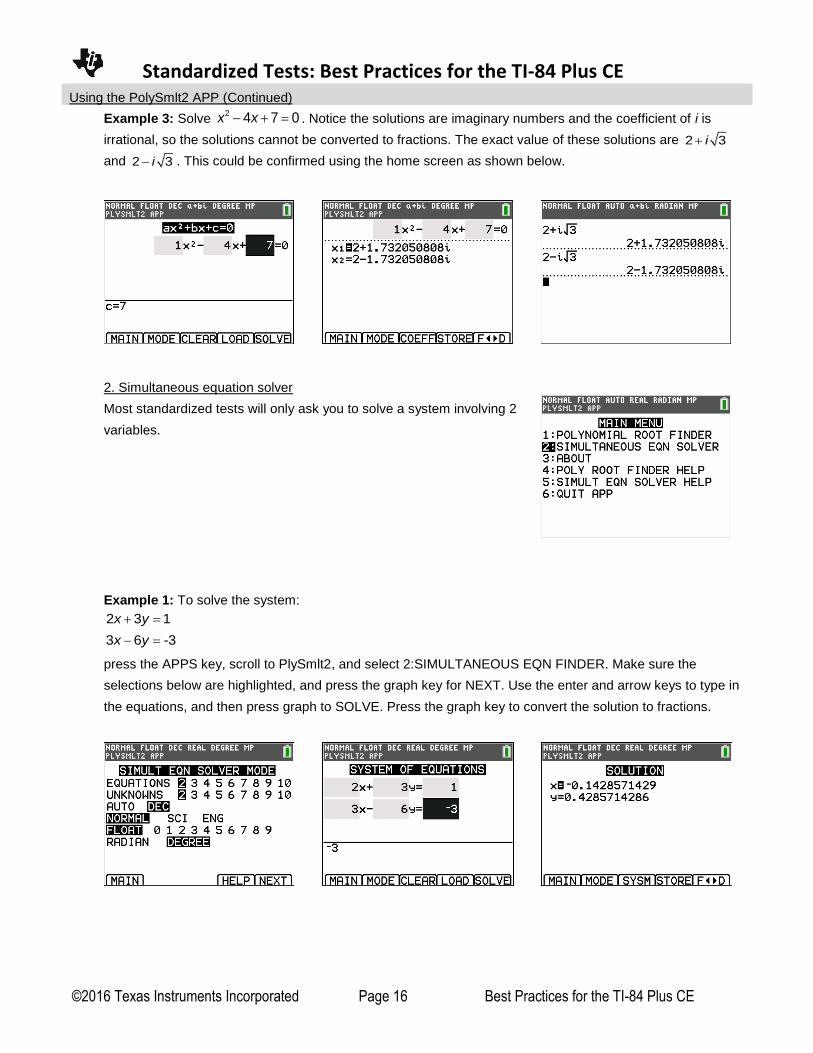
Example 3: Solve 2 4 7 0x x . Notice the solutions are imaginary numbers and the coefficient of i is
irrational, so the solutions cannot be converted to fractions. The exact value of these solutions are 2 3i
and 2 3i . This could be confirmed using the home screen as shown below.
2. Simultaneous equation solver
Most standardized tests will only ask you to solve a system involving 2
variables.
Example 1: To solve the system:
2 3 1x y
3 6 -3x y
press the APPS key, scroll to PlySmlt2, and select 2:SIMULTANEOUS EQN FINDER. Make sure the
selections below are highlighted, and press the graph key for NEXT. Use the enter and arrow keys to type in
the equations, and then press graph to SOLVE. Press the graph key to convert the solution to fractions.
Standardized Tests: Best Practices for the TI-84 Plus CE
©2016 Texas Instruments Incorporated Page 17 Best Practices for the TI-84 Plus CE
Using the PolySmlt2 APP (Continued)
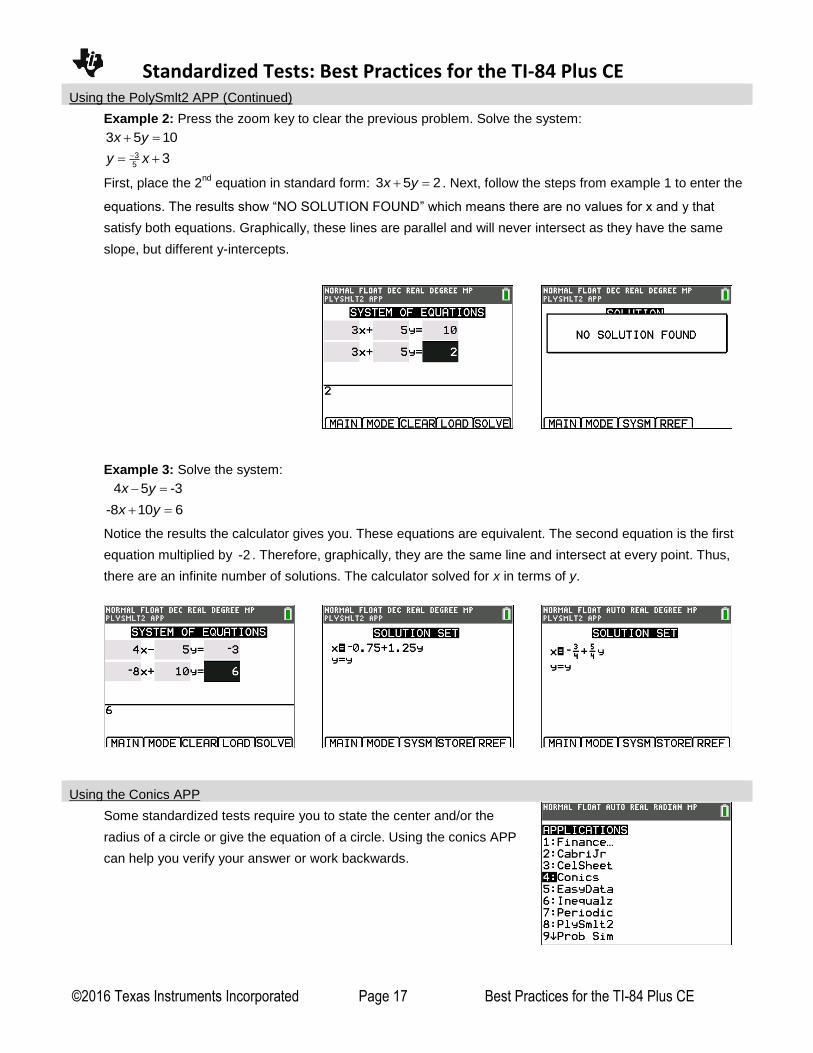
Example 2: Press the zoom key to clear the previous problem. Solve the system:
3 5 10x y
35
3y x
First, place the 2nd
equation in standard form: 3 5 2x y . Next, follow the steps from example 1 to enter the
equations. The results show “NO SOLUTION FOUND” which means there are no values for x and y that
satisfy both equations. Graphically, these lines are parallel and will never intersect as they have the same
slope, but different y-intercepts.
Example 3: Solve the system:
4 5 -3x y
-8 10 6x y
Notice the results the calculator gives you. These equations are equivalent. The second equation is the first
equation multiplied by -2 . Therefore, graphically, they are the same line and intersect at every point. Thus,
there are an infinite number of solutions. The calculator solved for x in terms of y.
Using the Conics APP
Some standardized tests require you to state the center and/or the
radius of a circle or give the equation of a circle. Using the conics APP
can help you verify your answer or work backwards.
Standardized Tests: Best Practices for the TI-84 Plus CE
©2016 Texas Instruments Incorporated Page 18 Best Practices for the TI-84 Plus CE
Using the Conics APP (continued)
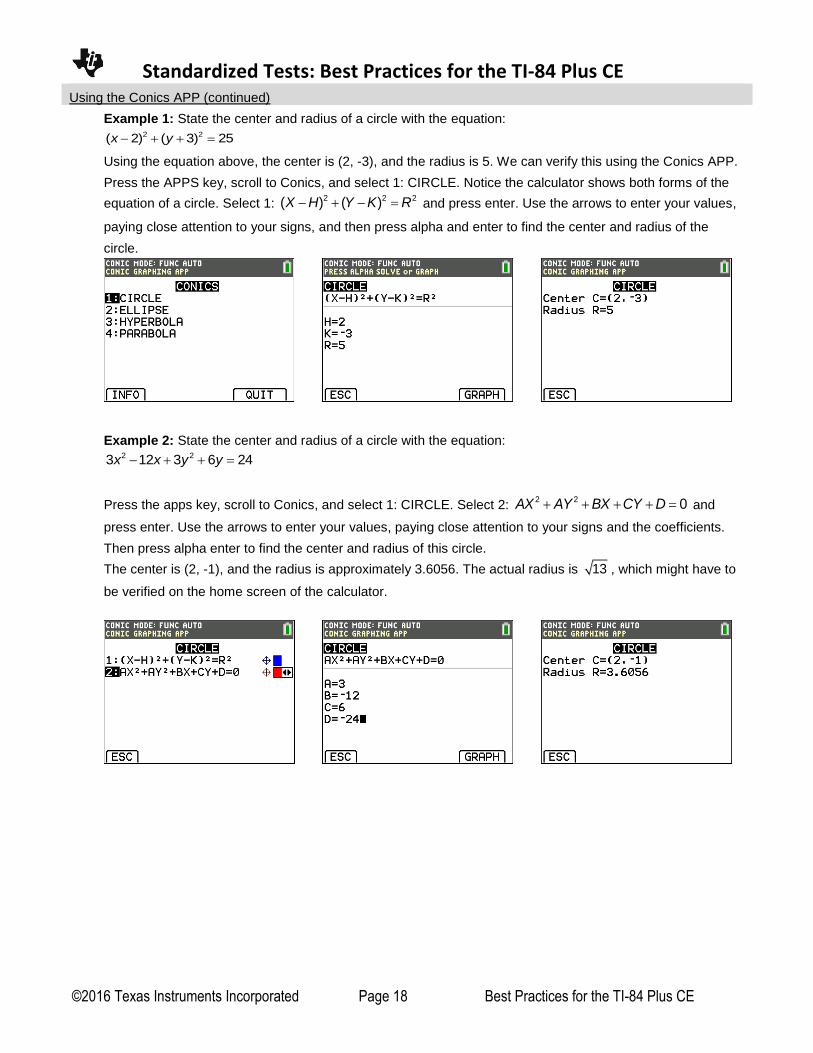
Example 1: State the center and radius of a circle with the equation: 2 2( 2) ( 3) 25x y
Using the equation above, the center is (2, -3), and the radius is 5. We can verify this using the Conics APP.
Press the APPS key, scroll to Conics, and select 1: CIRCLE. Notice the calculator shows both forms of the
equation of a circle. Select 1: 2 2 2( ) ( )X H Y K R and press enter. Use the arrows to enter your values,
paying close attention to your signs, and then press alpha and enter to find the center and radius of the
circle.
Example 2: State the center and radius of a circle with the equation: 2 23 12 3 6 24x x y y
Press the apps key, scroll to Conics, and select 1: CIRCLE. Select 2: 2 2 0AX AY BX CY D and
press enter. Use the arrows to enter your values, paying close attention to your signs and the coefficients.
Then press alpha enter to find the center and radius of this circle.
The center is (2, -1), and the radius is approximately 3.6056. The actual radius is 13 , which might have to
be verified on the home screen of the calculator.
Standardized Tests: Best Practices for the TI-84 Plus CE
©2016 Texas Instruments Incorporated Page 19 Best Practices for the TI-84 Plus CE
Graphing Features
Graph Setup
Utilizing the graphing capabilities on the TI-84 Plus CE provides the opportunity to save time, avoid mistakes,
check for equivalence, work backwards, and verify answers.
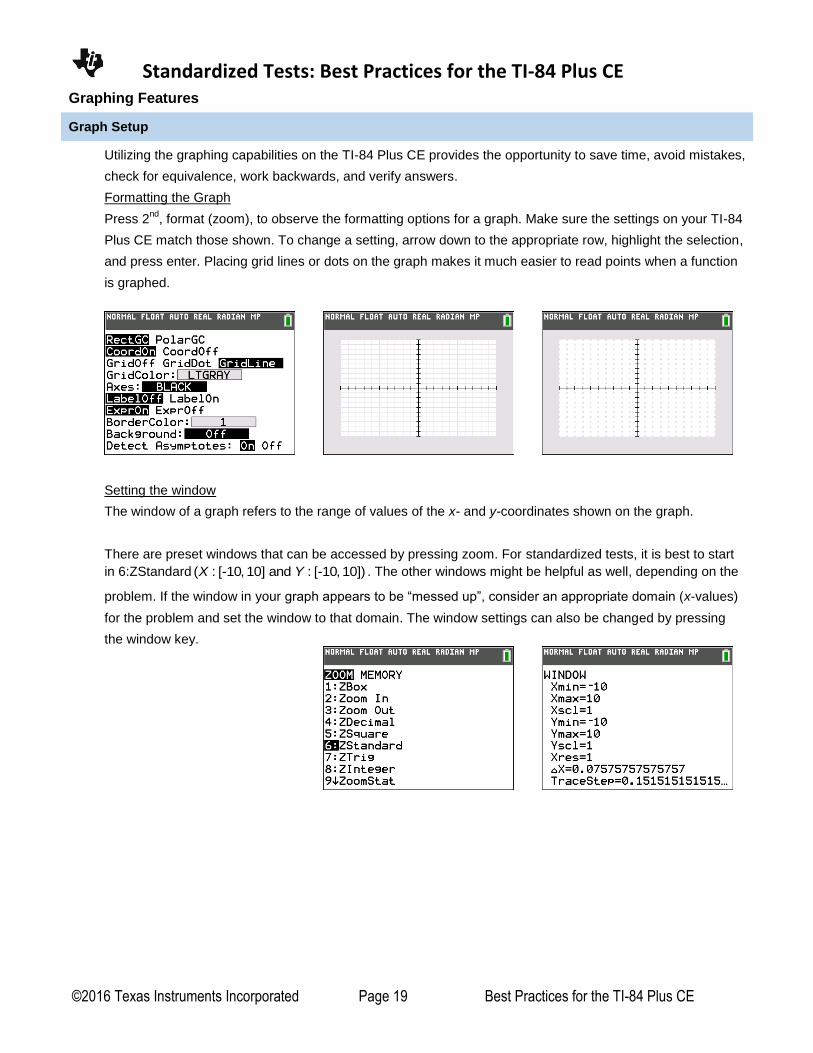
Formatting the Graph
Press 2nd
, format (zoom), to observe the formatting options for a graph. Make sure the settings on your TI-84
Plus CE match those shown. To change a setting, arrow down to the appropriate row, highlight the selection,
and press enter. Placing grid lines or dots on the graph makes it much easier to read points when a function
is graphed.
Setting the window
The window of a graph refers to the range of values of the x- and y-coordinates shown on the graph.
There are preset windows that can be accessed by pressing zoom. For standardized tests, it is best to start
in 6:ZStandard ( : [-10, 10] and : [-10, 10])X Y . The other windows might be helpful as well, depending on the
problem. If the window in your graph appears to be “messed up”, consider an appropriate domain (x-values)
for the problem and set the window to that domain. The window settings can also be changed by pressing
the window key.
Standardized Tests: Best Practices for the TI-84 Plus CE
©2016 Texas Instruments Incorporated Page 20 Best Practices for the TI-84 Plus CE
Graphing functions
Graphing a single function
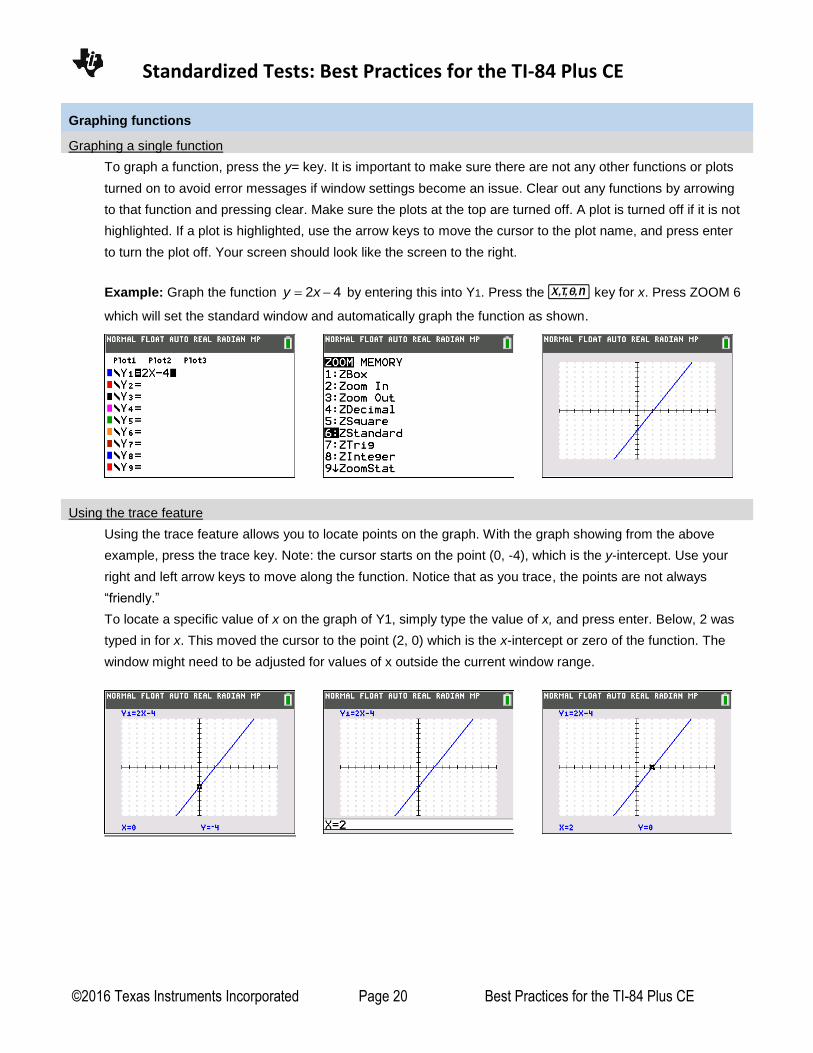
To graph a function, press the y= key. It is important to make sure there are not any other functions or plots
turned on to avoid error messages if window settings become an issue. Clear out any functions by arrowing
to that function and pressing clear. Make sure the plots at the top are turned off. A plot is turned off if it is not
highlighted. If a plot is highlighted, use the arrow keys to move the cursor to the plot name, and press enter
to turn the plot off. Your screen should look like the screen to the right.
Example: Graph the function 2 4y x by entering this into Y1. Press the „ key for x. Press ZOOM 6
which will set the standard window and automatically graph the function as shown.
Using the trace feature
Using the trace feature allows you to locate points on the graph. With the graph showing from the above
example, press the trace key. Note: the cursor starts on the point (0, -4), which is the y-intercept. Use your
right and left arrow keys to move along the function. Notice that as you trace, the points are not always
“friendly.”
To locate a specific value of x on the graph of Y1, simply type the value of x, and press enter. Below, 2 was
typed in for x. This moved the cursor to the point (2, 0) which is the x-intercept or zero of the function. The
window might need to be adjusted for values of x outside the current window range.
Standardized Tests: Best Practices for the TI-84 Plus CE
©2016 Texas Instruments Incorporated Page 21 Best Practices for the TI-84 Plus CE
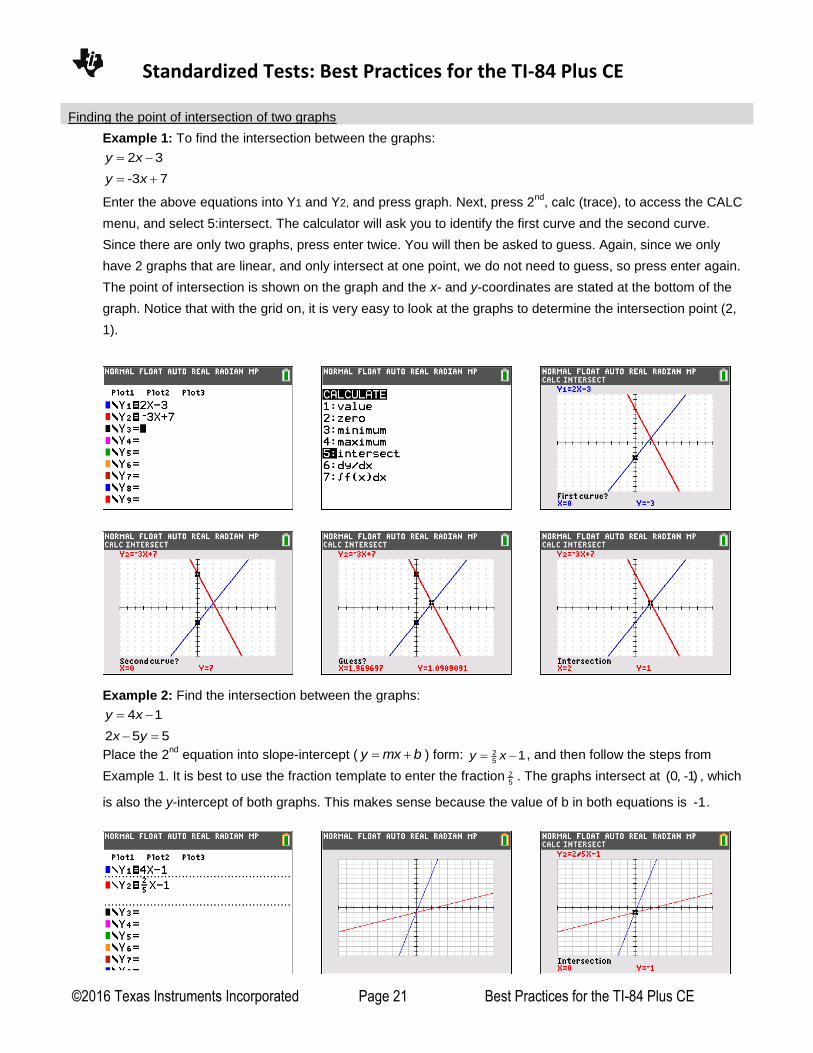
Finding the point of intersection of two graphs
Example 1: To find the intersection between the graphs:
2 3y x
-3 7y x
Enter the above equations into Y1 and Y2, and press graph. Next, press 2nd
, calc (trace), to access the CALC
menu, and select 5:intersect. The calculator will ask you to identify the first curve and the second curve.
Since there are only two graphs, press enter twice. You will then be asked to guess. Again, since we only
have 2 graphs that are linear, and only intersect at one point, we do not need to guess, so press enter again.
The point of intersection is shown on the graph and the x- and y-coordinates are stated at the bottom of the
graph. Notice that with the grid on, it is very easy to look at the graphs to determine the intersection point (2,
1).
Example 2: Find the intersection between the graphs:
4 1y x
2 5 5x y
Place the 2nd
equation into slope-intercept ( y mx b ) form: 25
1y x , and then follow the steps from
Example 1. It is best to use the fraction template to enter the fraction 25
. The graphs intersect at (0, -1) , which
is also the y-intercept of both graphs. This makes sense because the value of b in both equations is -1.
Standardized Tests: Best Practices for the TI-84 Plus CE
©2016 Texas Instruments Incorporated Page 22 Best Practices for the TI-84 Plus CE
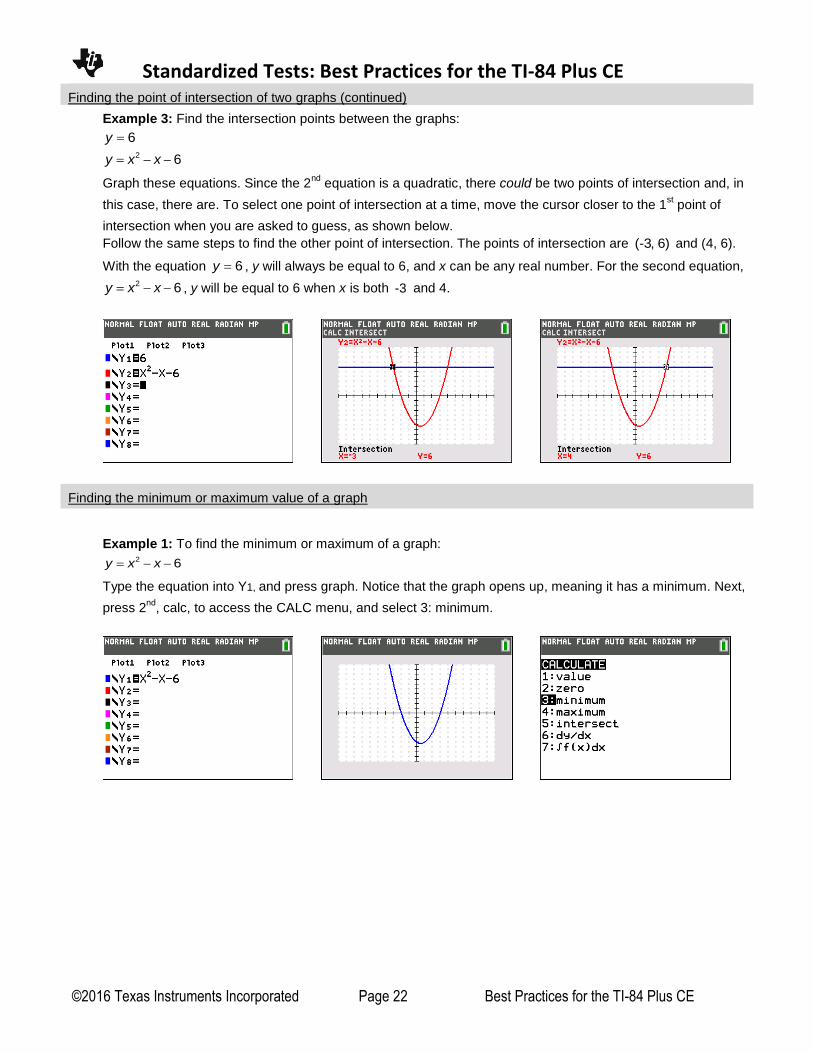
Finding the point of intersection of two graphs (continued)
Example 3: Find the intersection points between the graphs:
6y
2 6y x x
Graph these equations. Since the 2nd
equation is a quadratic, there could be two points of intersection and, in
this case, there are. To select one point of intersection at a time, move the cursor closer to the 1st point of
intersection when you are asked to guess, as shown below.
Follow the same steps to find the other point of intersection. The points of intersection are (-3, 6) and (4, 6).
With the equation 6y , y will always be equal to 6, and x can be any real number. For the second equation,
2 6y x x , y will be equal to 6 when x is both -3 and 4.
Finding the minimum or maximum value of a graph
Example 1: To find the minimum or maximum of a graph: 2 6y x x
Type the equation into Y1, and press graph. Notice that the graph opens up, meaning it has a minimum. Next,
press 2nd
, calc, to access the CALC menu, and select 3: minimum.
Standardized Tests: Best Practices for the TI-84 Plus CE
©2016 Texas Instruments Incorporated Page 23 Best Practices for the TI-84 Plus CE
Finding the minimum or maximum value of a graph (continued)
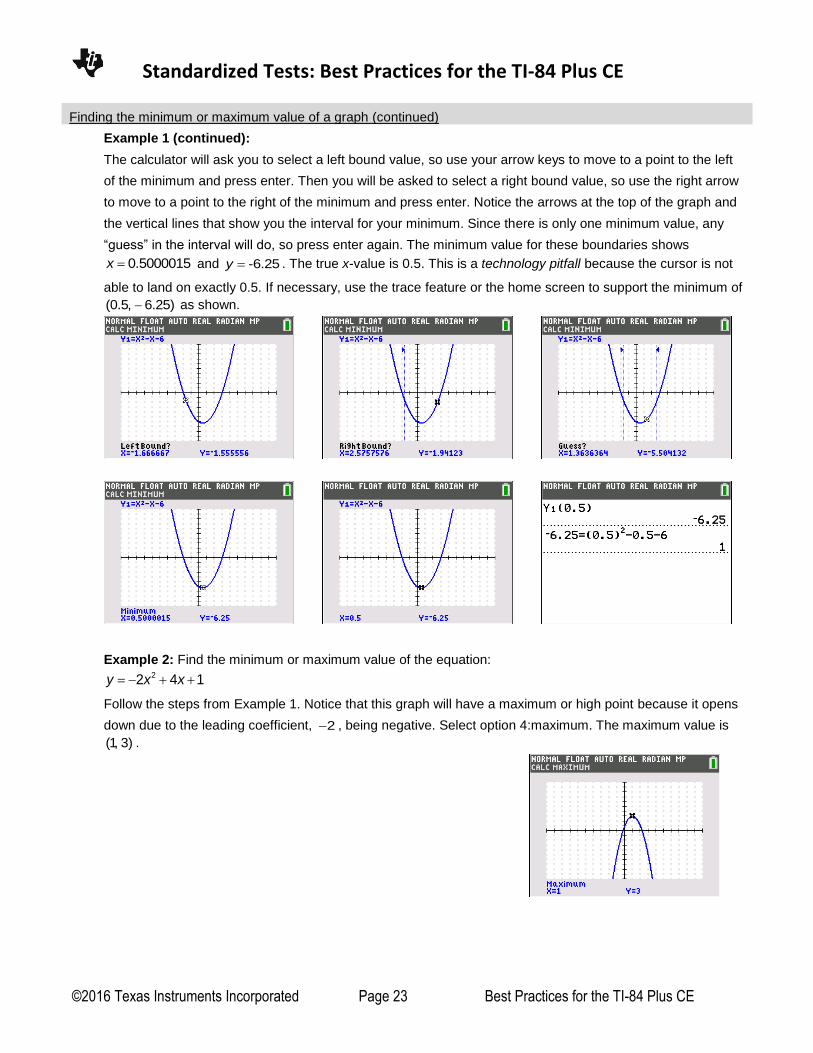
Example 1 (continued):
The calculator will ask you to select a left bound value, so use your arrow keys to move to a point to the left
of the minimum and press enter. Then you will be asked to select a right bound value, so use the right arrow
to move to a point to the right of the minimum and press enter. Notice the arrows at the top of the graph and
the vertical lines that show you the interval for your minimum. Since there is only one minimum value, any
“guess” in the interval will do, so press enter again. The minimum value for these boundaries shows
0.5000015x and -6.25y . The true x-value is 0.5. This is a technology pitfall because the cursor is not
able to land on exactly 0.5. If necessary, use the trace feature or the home screen to support the minimum of
(0.5, 6.25) as shown.
Example 2: Find the minimum or maximum value of the equation: 22 4 1y x x
Follow the steps from Example 1. Notice that this graph will have a maximum or high point because it opens
down due to the leading coefficient, 2 , being negative. Select option 4:maximum. The maximum value is
(1, 3) .
Standardized Tests: Best Practices for the TI-84 Plus CE
©2016 Texas Instruments Incorporated Page 24 Best Practices for the TI-84 Plus CE
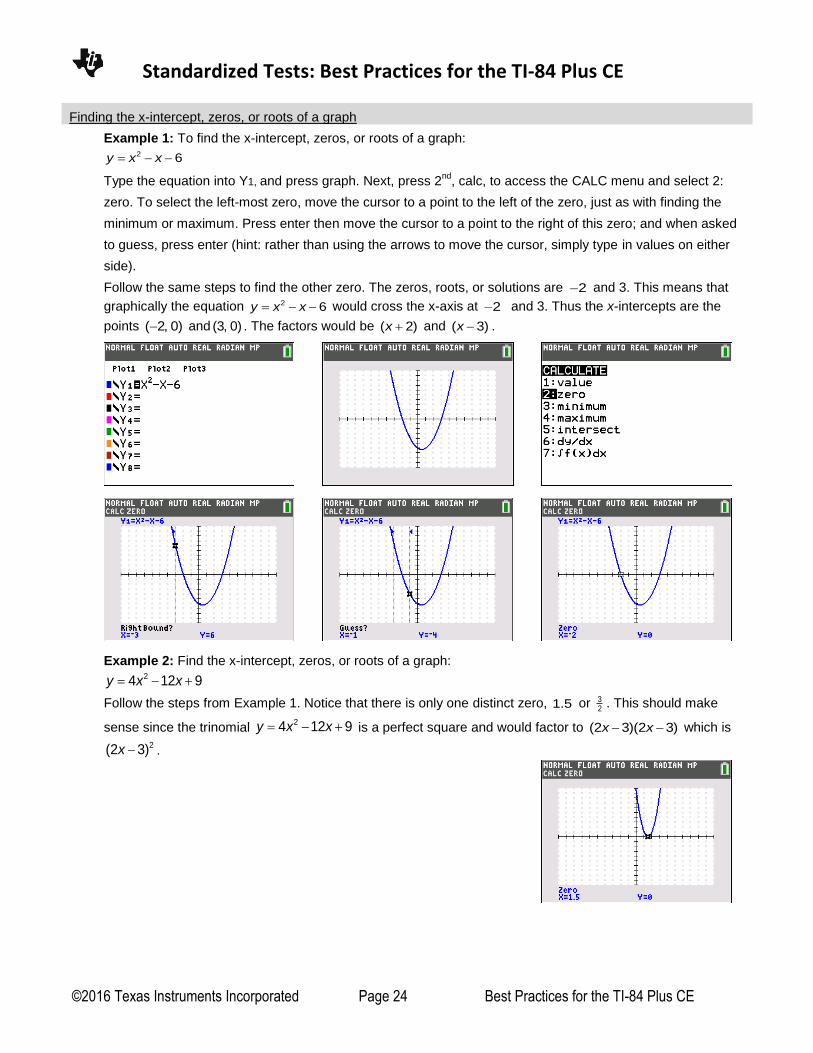
Finding the x-intercept, zeros, or roots of a graph
Example 1: To find the x-intercept, zeros, or roots of a graph: 2 6y x x
Type the equation into Y1, and press graph. Next, press 2nd
, calc, to access the CALC menu and select 2:
zero. To select the left-most zero, move the cursor to a point to the left of the zero, just as with finding the
minimum or maximum. Press enter then move the cursor to a point to the right of this zero; and when asked
to guess, press enter (hint: rather than using the arrows to move the cursor, simply type in values on either
side).
Follow the same steps to find the other zero. The zeros, roots, or solutions are 2 and 3. This means that
graphically the equation 2 6y x x would cross the x-axis at 2 and 3. Thus the x-intercepts are the
points ( 2, 0) and (3, 0) . The factors would be ( 2)x and ( 3)x .
Example 2: Find the x-intercept, zeros, or roots of a graph: 24 12 9y x x
Follow the steps from Example 1. Notice that there is only one distinct zero, 1.5 or 32 . This should make
sense since the trinomial 24 12 9y x x is a perfect square and would factor to (2 3)(2 3)x x which is
2(2 3)x .
Standardized Tests: Best Practices for the TI-84 Plus CE
©2016 Texas Instruments Incorporated Page 25 Best Practices for the TI-84 Plus CE
Finding the x-intercept, zeros, or roots of a graph (continued)
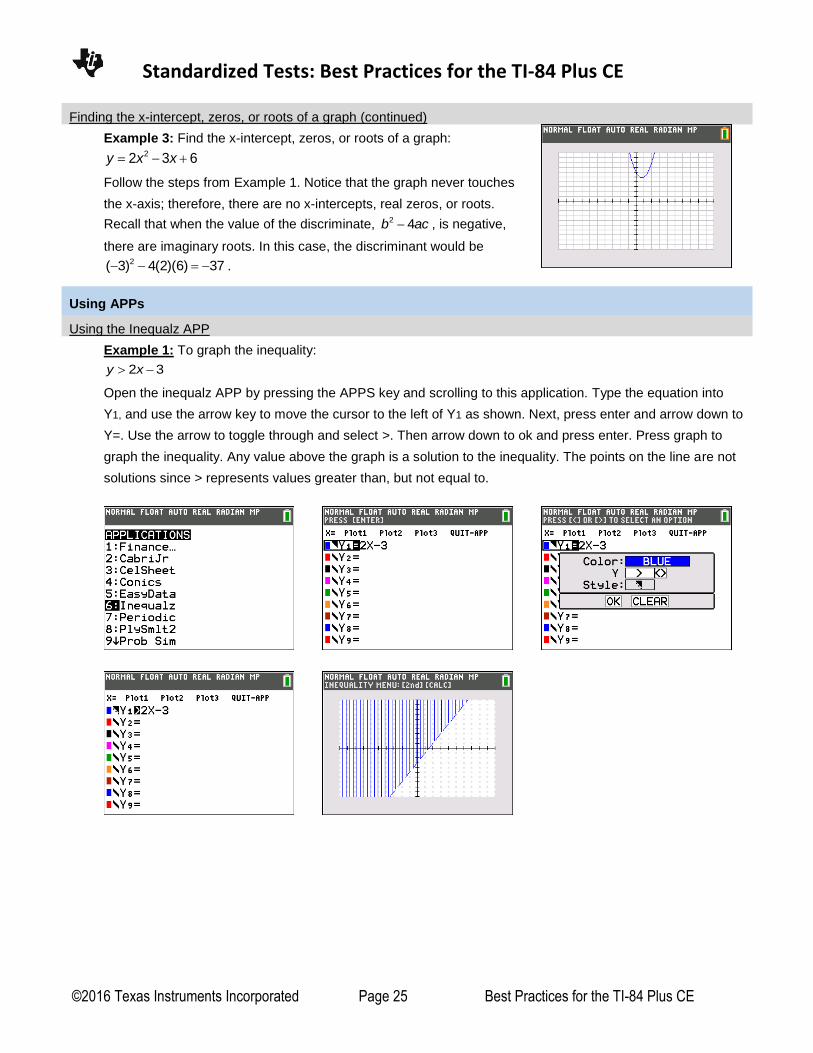
Example 3: Find the x-intercept, zeros, or roots of a graph: 22 3 6y x x
Follow the steps from Example 1. Notice that the graph never touches
the x-axis; therefore, there are no x-intercepts, real zeros, or roots.
Recall that when the value of the discriminate, 2 4b ac , is negative,
there are imaginary roots. In this case, the discriminant would be 2( 3) 4(2)(6) 37 .
Using APPs
Using the Inequalz APP
Example 1: To graph the inequality:
2 3y x
Open the inequalz APP by pressing the APPS key and scrolling to this application. Type the equation into
Y1, and use the arrow key to move the cursor to the left of Y1 as shown. Next, press enter and arrow down to
Y=. Use the arrow to toggle through and select >. Then arrow down to ok and press enter. Press graph to
graph the inequality. Any value above the graph is a solution to the inequality. The points on the line are not
solutions since > represents values greater than, but not equal to.
Standardized Tests: Best Practices for the TI-84 Plus CE
©2016 Texas Instruments Incorporated Page 26 Best Practices for the TI-84 Plus CE
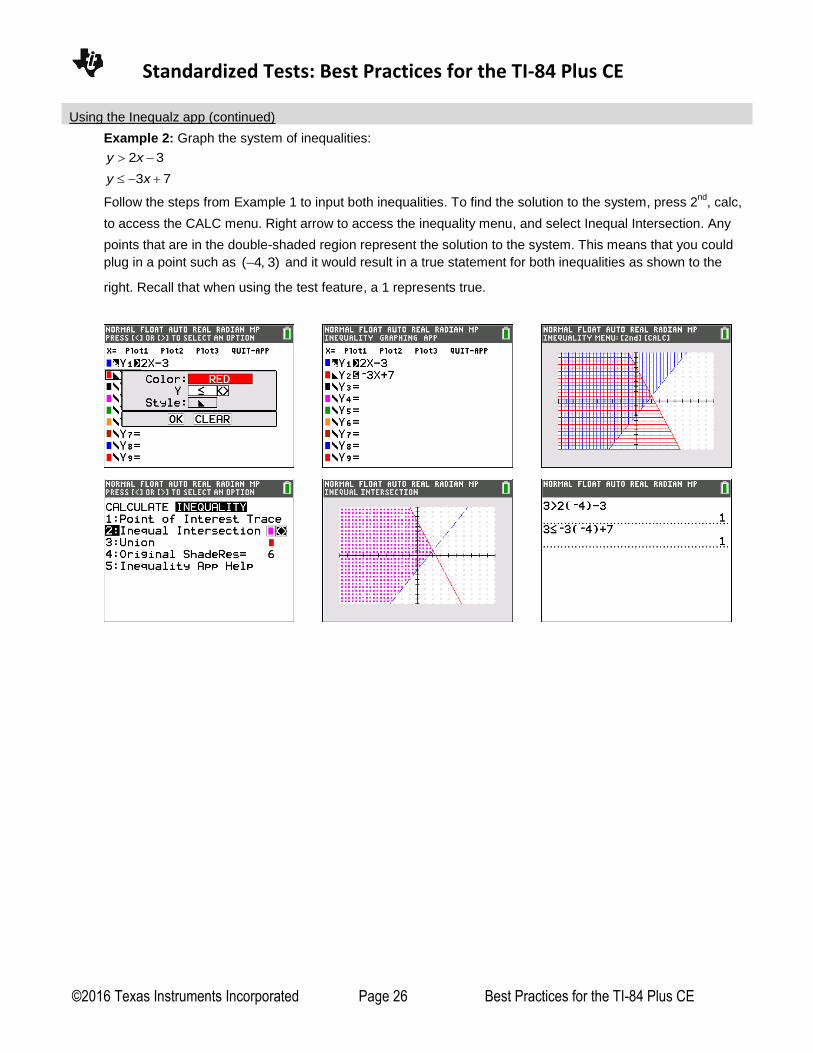
Using the Inequalz app (continued)
Example 2: Graph the system of inequalities:
2 3y x
3 7y x
Follow the steps from Example 1 to input both inequalities. To find the solution to the system, press 2nd
, calc,
to access the CALC menu. Right arrow to access the inequality menu, and select Inequal Intersection. Any
points that are in the double-shaded region represent the solution to the system. This means that you could
plug in a point such as ( 4, 3) and it would result in a true statement for both inequalities as shown to the
right. Recall that when using the test feature, a 1 represents true.
Standardized Tests: Best Practices for the TI-84 Plus CE
©2016 Texas Instruments Incorporated Page 27 Best Practices for the TI-84 Plus CE
Statistics Features
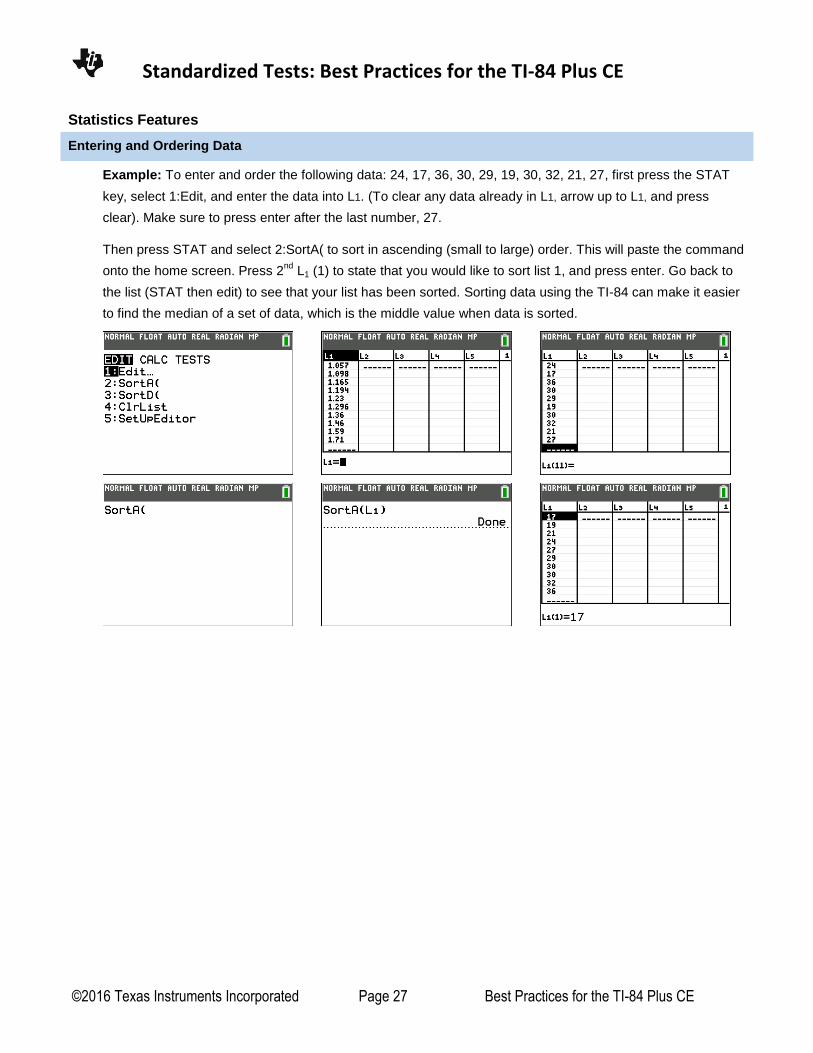
Entering and Ordering Data
Example: To enter and order the following data: 24, 17, 36, 30, 29, 19, 30, 32, 21, 27, first press the STAT
key, select 1:Edit, and enter the data into L1. (To clear any data already in L1, arrow up to L1, and press
clear). Make sure to press enter after the last number, 27.
Then press STAT and select 2:SortA( to sort in ascending (small to large) order. This will paste the command
onto the home screen. Press 2nd
L1 (1) to state that you would like to sort list 1, and press enter. Go back to
the list (STAT then edit) to see that your list has been sorted. Sorting data using the TI-84 can make it easier
to find the median of a set of data, which is the middle value when data is sorted.
Standardized Tests: Best Practices for the TI-84 Plus CE
©2016 Texas Instruments Incorporated Page 28 Best Practices for the TI-84 Plus CE
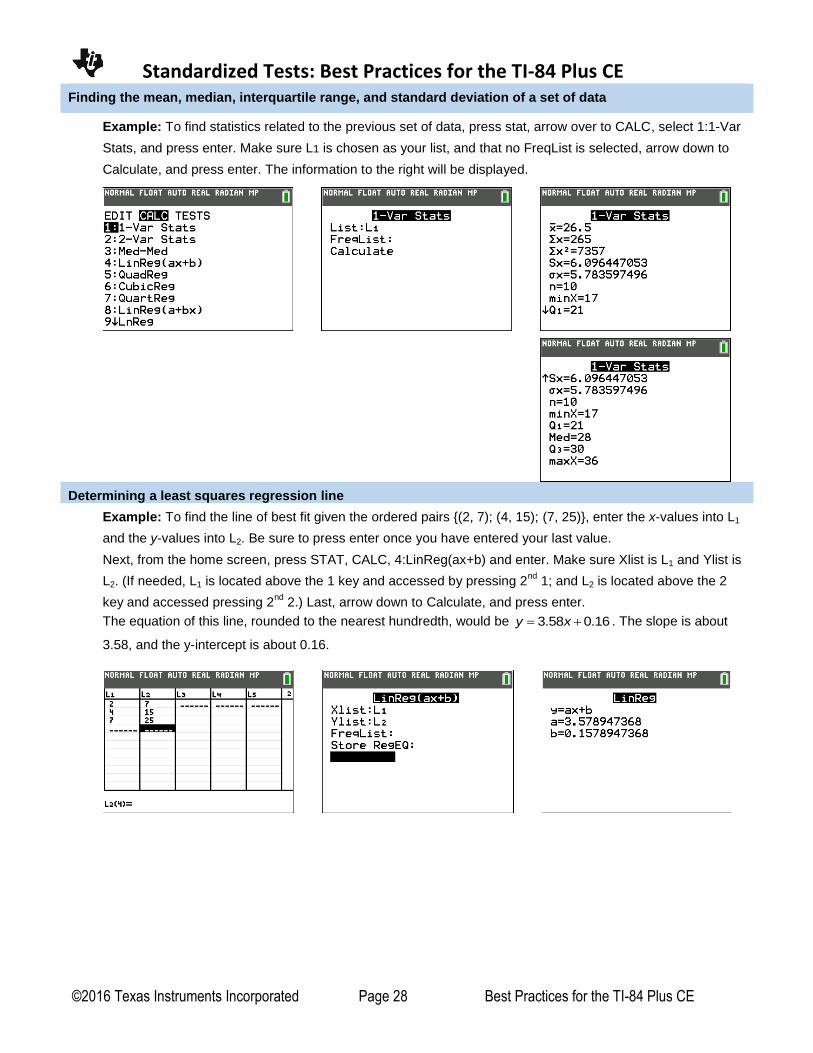
Finding the mean, median, interquartile range, and standard deviation of a set of data
Example: To find statistics related to the previous set of data, press stat, arrow over to CALC, select 1:1-Var
Stats, and press enter. Make sure L1 is chosen as your list, and that no FreqList is selected, arrow down to
Calculate, and press enter. The information to the right will be displayed.
Determining a least squares regression line
Example: To find the line of best fit given the ordered pairs {(2, 7); (4, 15); (7, 25)}, enter the x-values into L1
and the y-values into L2. Be sure to press enter once you have entered your last value.
Next, from the home screen, press STAT, CALC, 4:LinReg(ax+b) and enter. Make sure Xlist is L1 and Ylist is
L2. (If needed, L1 is located above the 1 key and accessed by pressing 2nd
1; and L2 is located above the 2
key and accessed pressing 2nd
2.) Last, arrow down to Calculate, and press enter.
The equation of this line, rounded to the nearest hundredth, would be 3.58 0.16y x . The slope is about
3.58, and the y-intercept is about 0.16.