Embed Size (px)
Citation preview
TI-84 Tutorial
Graphs of Linear Functions
Summary• In this tutorial, you’ll be graphing linear
functions. The steps in the tutorial include:– Input three linear functions.– Graph the functions.– Use TRACE to find the coordinates along the graphs
of the functions.
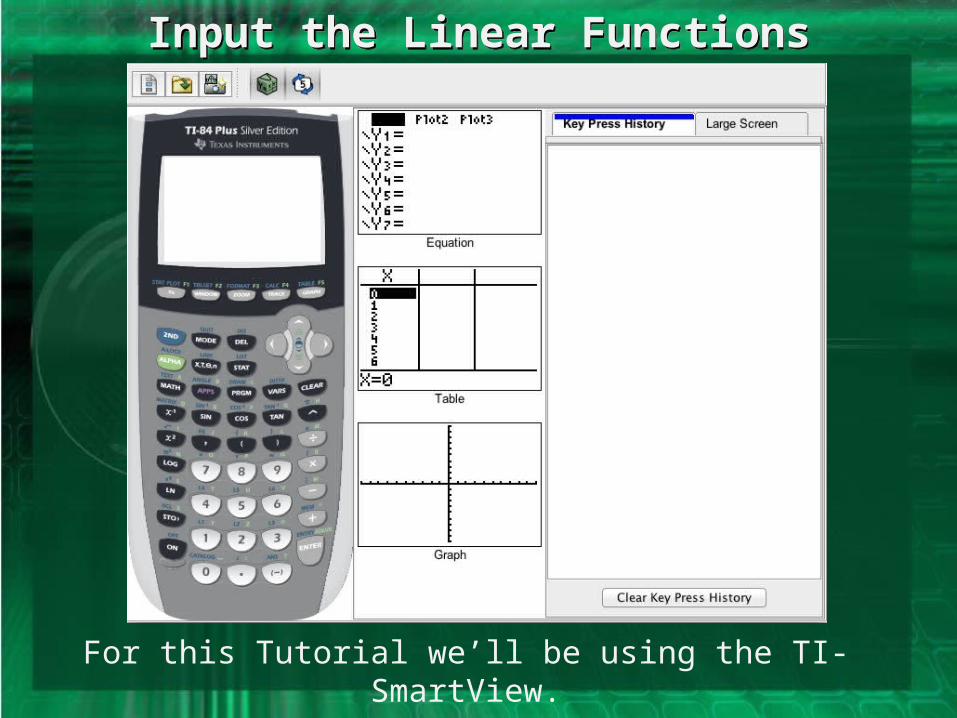
Input the Linear FunctionsInput the Linear Functions
For this Tutorial we’ll be using the TI-SmartView.
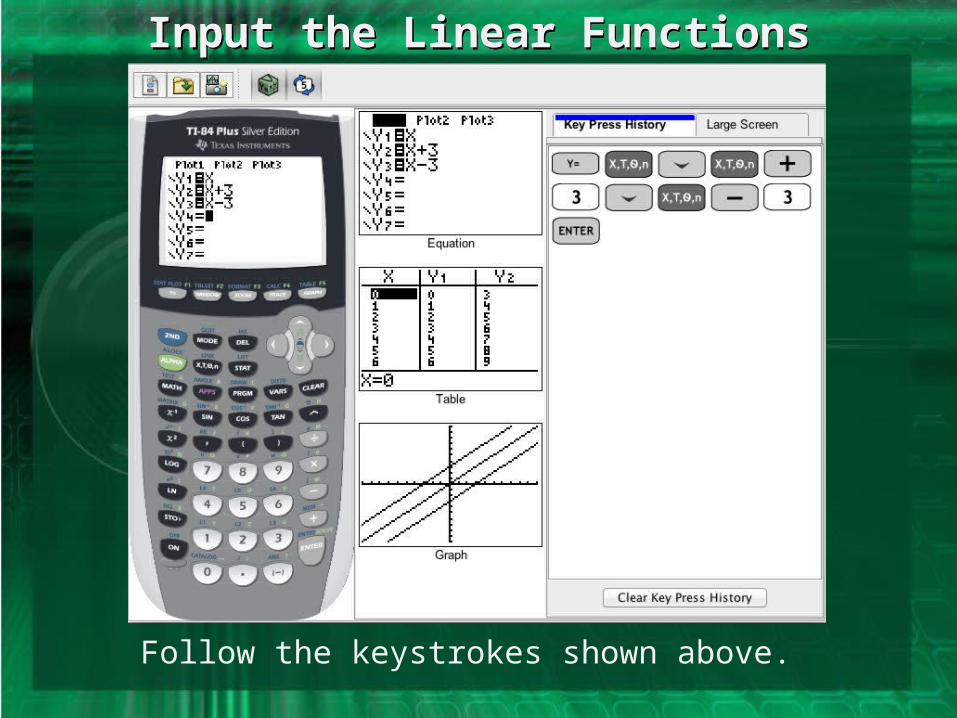
Input the Linear FunctionsInput the Linear Functions
Follow the keystrokes shown above.
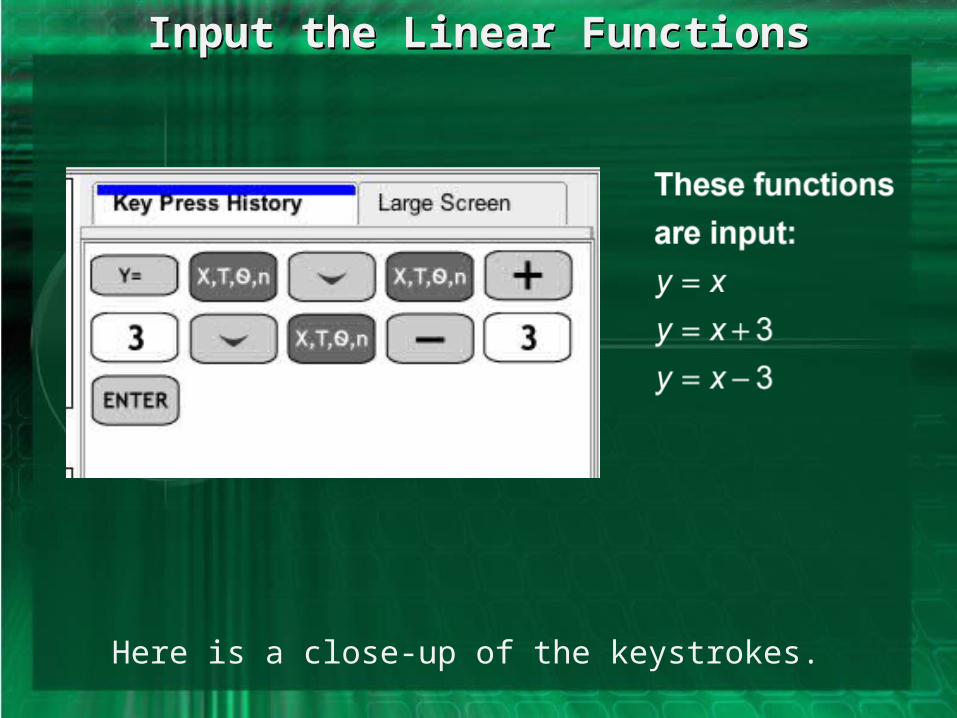
Input the Linear FunctionsInput the Linear Functions
Here is a close-up of the keystrokes.
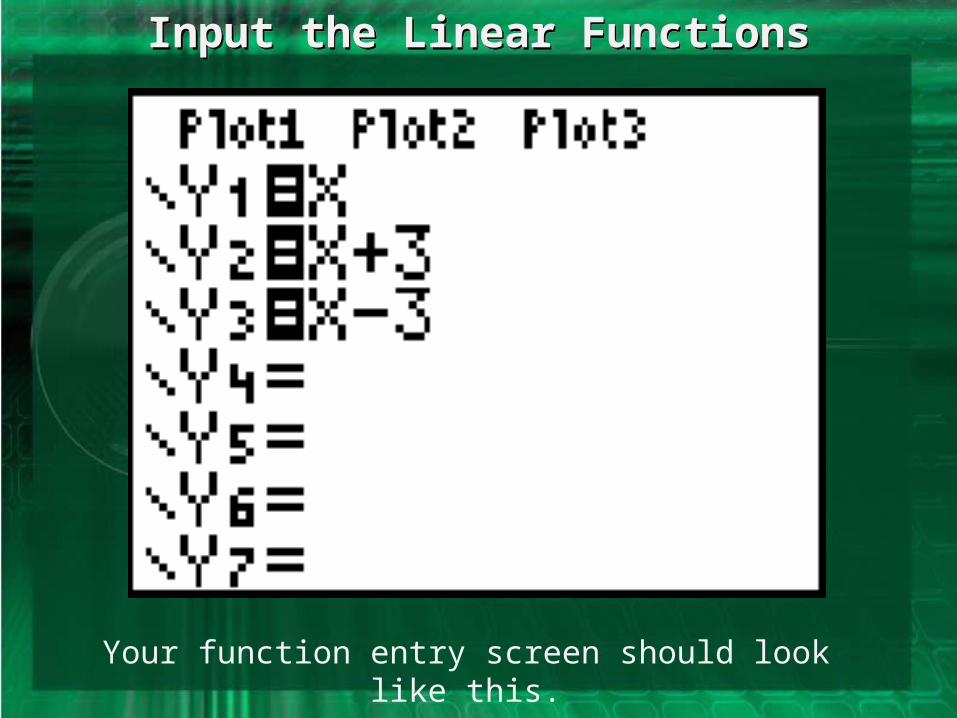
Input the Linear FunctionsInput the Linear Functions
Your function entry screen should look like this.
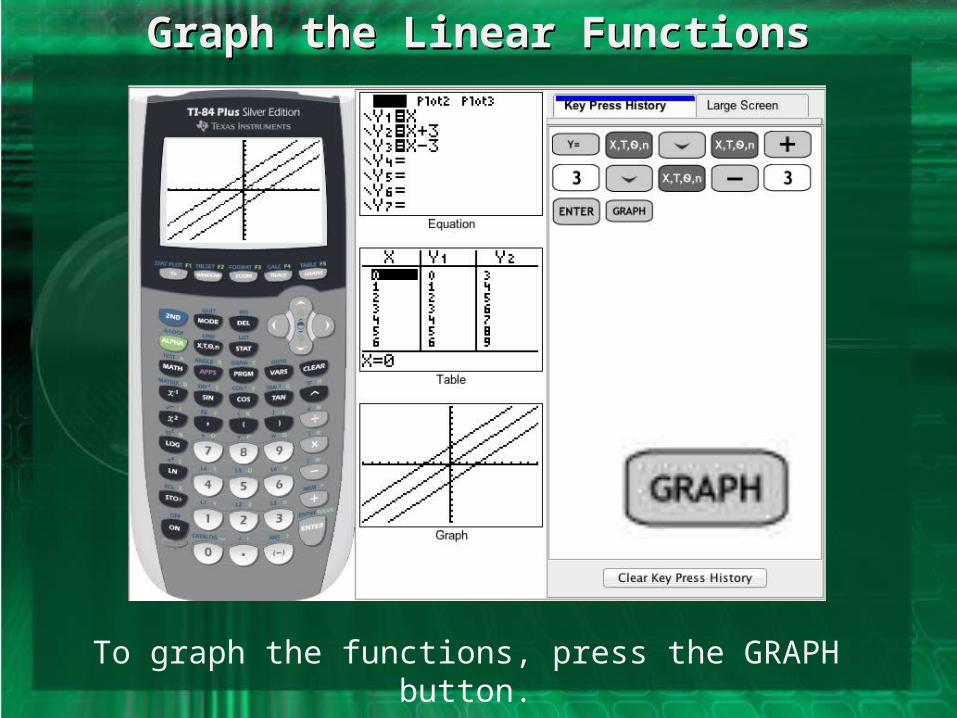
Graph the Linear FunctionsGraph the Linear Functions
To graph the functions, press the GRAPH button.
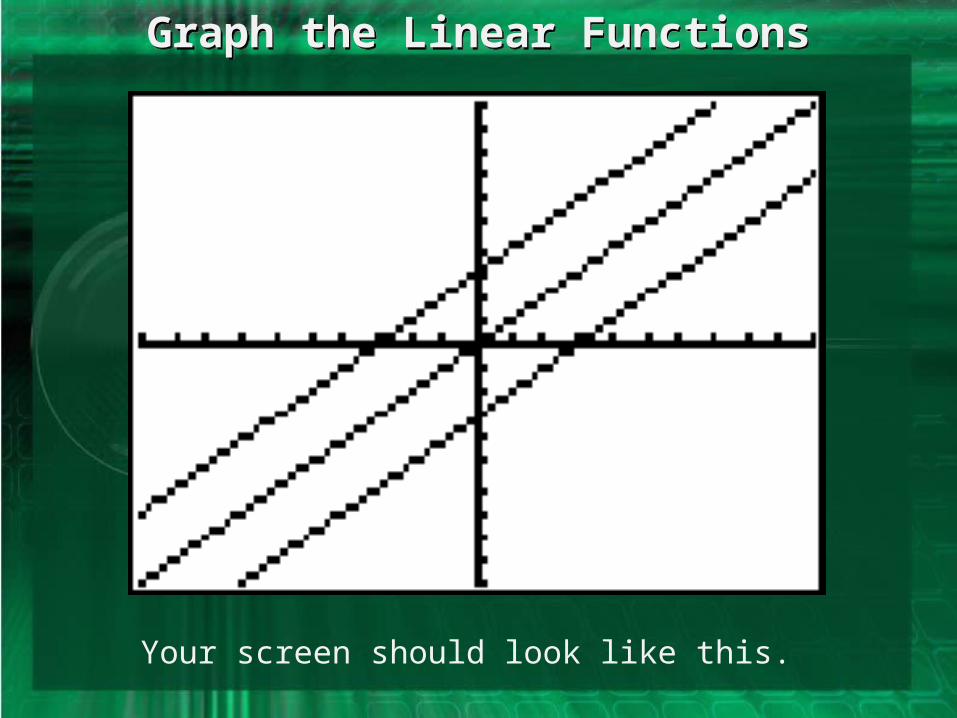
Graph the Linear FunctionsGraph the Linear Functions
Your screen should look like this.
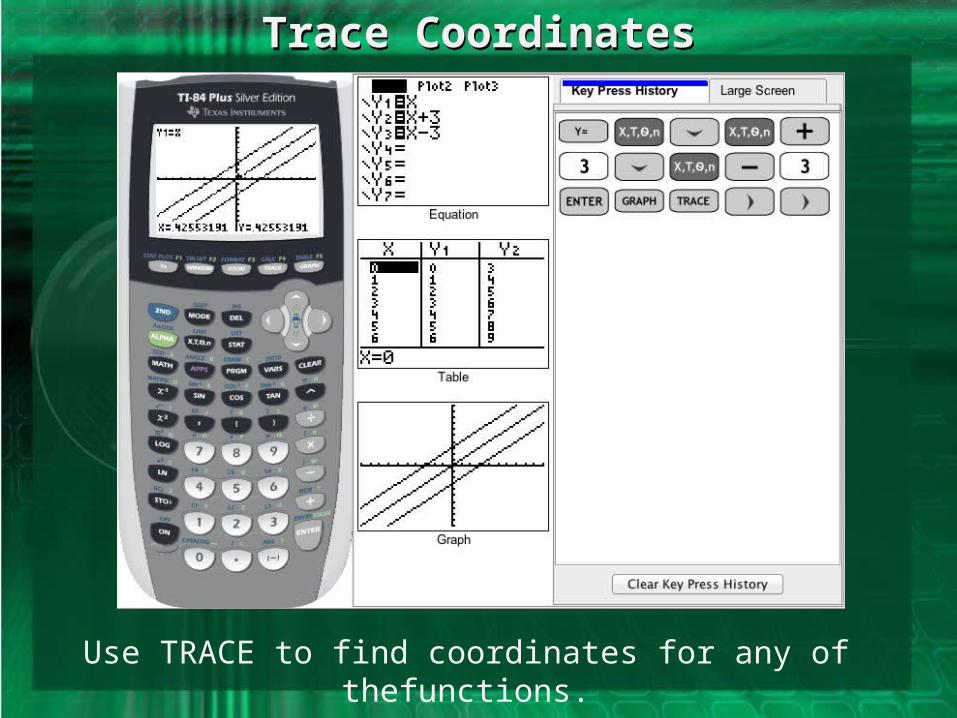
Trace CoordinatesTrace Coordinates
Use TRACE to find coordinates for any of thefunctions.
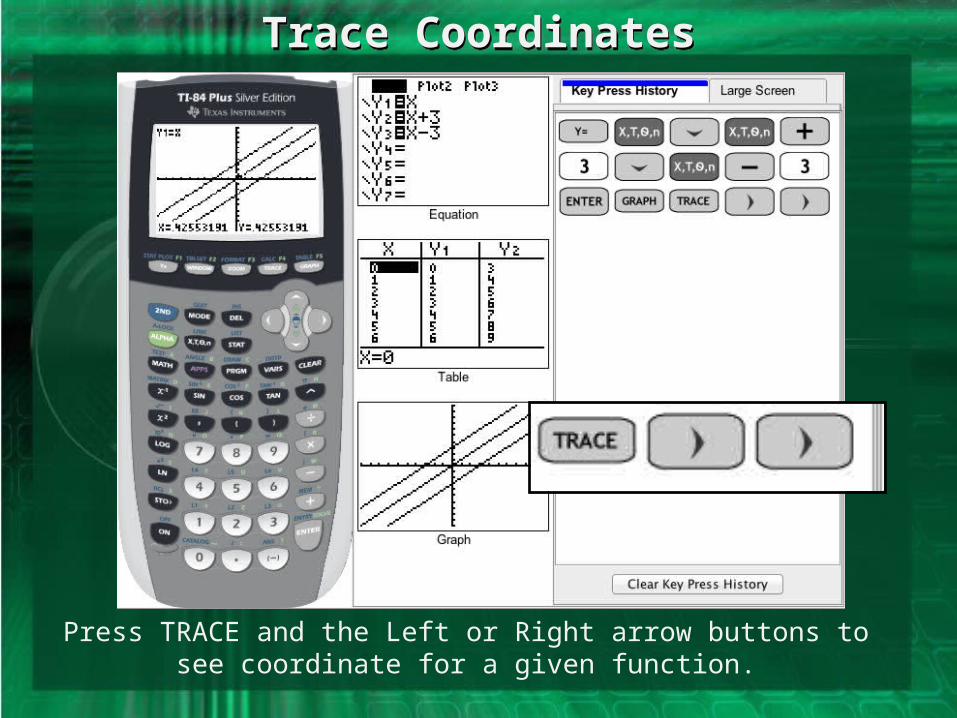
Trace CoordinatesTrace Coordinates
Press TRACE and the Left or Right arrow buttons to see coordinate for a given function.
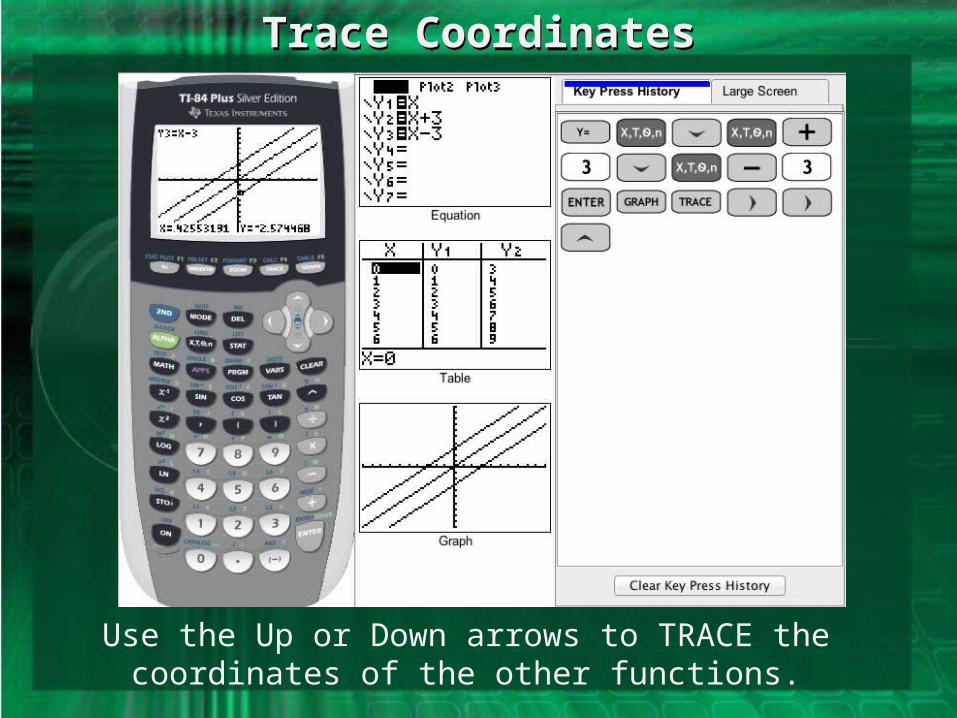
Trace CoordinatesTrace Coordinates
Use the Up or Down arrows to TRACE the coordinates of the other functions.
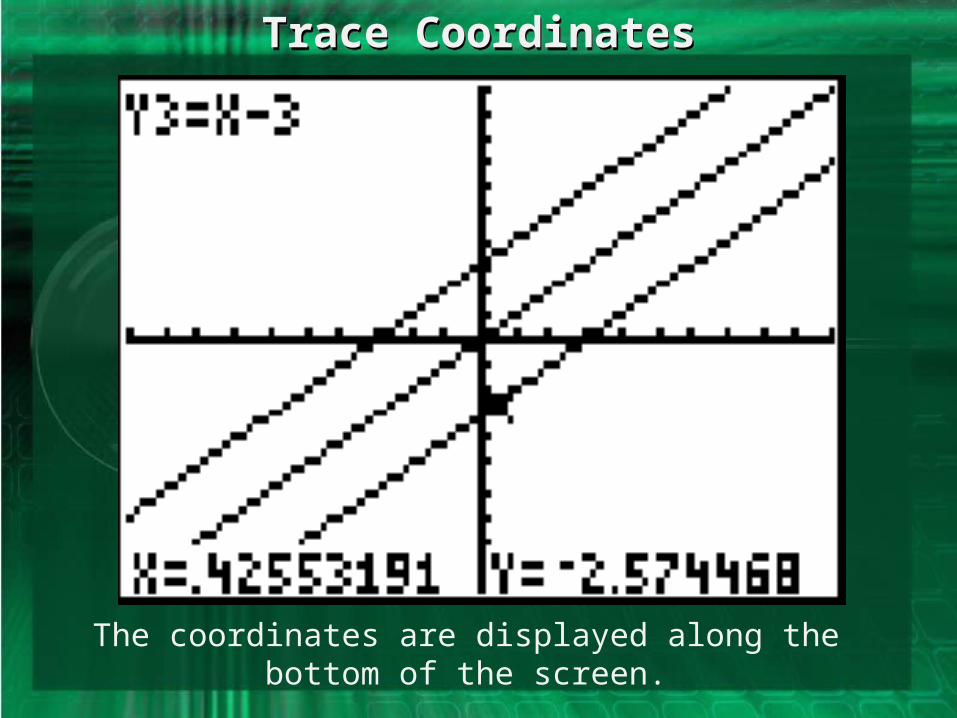
Trace CoordinatesTrace Coordinates
The coordinates are displayed along the bottom of the screen.