Embed Size (px)
Citation preview
STANDARD WORK PROCEDURES AND COMPLIANCE IN THE OR: A STUDY
ON THE EFFECT OF STANDARD WORK IN ALL SURGERY TYPES
By
Virginia Evelyn Cosgriff
A thesis submitted in partial fulfillment
of the requirements for the degree
of
Master of Science
in
Industrial and Management Engineering
MONTANA STATE UNIVERSITY
Bozeman, Montana
January 2013
©COPYRIGHT
by
Virginia Evelyn Cosgriff
2013
All Rights Reserved
ii
APPROVAL
of a thesis submitted by
Virginia Evelyn Cosgriff
This thesis has been read by each member of the thesis committee and has been
found to be satisfactory regarding content, English usage, format, citation, bibliographic
style, and consistency and is ready for submission to The Graduate School.
Dr. David Claudio
Approved for the Department of Mechanical and Industrial Engineering
Dr. Chris Jenkins
Approved for The Graduate School
Dr. Ronald W. Larsen
iii
STATEMENT OF PERMISSION TO USE
In presenting this thesis in partial fulfillment of the requirements for a master’s
degree at Montana State University, I agree that the Library shall make it available to
borrowers under rules of the Library.
If I have indicated my intention to copyright this thesis by including a copyright
notice page, copying is allowable only for scholarly purposes, consistent with “fair use”
as prescribed in the U.S. Copyright Law. Requests for permission for extended quotation
from or reproduction of this thesis in whole or in parts may be granted only by the
copyright holder.
Virginia Evelyn Cosgriff
January 2013

iv
ACKNOWLEDGEMENTS
To Dr. David Claudio and Shelly Satterthwait, my valuable and guiding mentors
through this long process. They were very encouraging and positive despite some rough
times during implementation in the OR. Without them, I would not be able to complete
this thesis. Additionally, I would like to thank Bozeman Deaconess Hospital for allowing
me the opportunity to conduct research and accomplish a real-world process
improvement at their facility. I would also like to thank my thesis committee, Dr.
Durward Sobek and Dr. Nic Ward for agreeing to be part of the research.
v
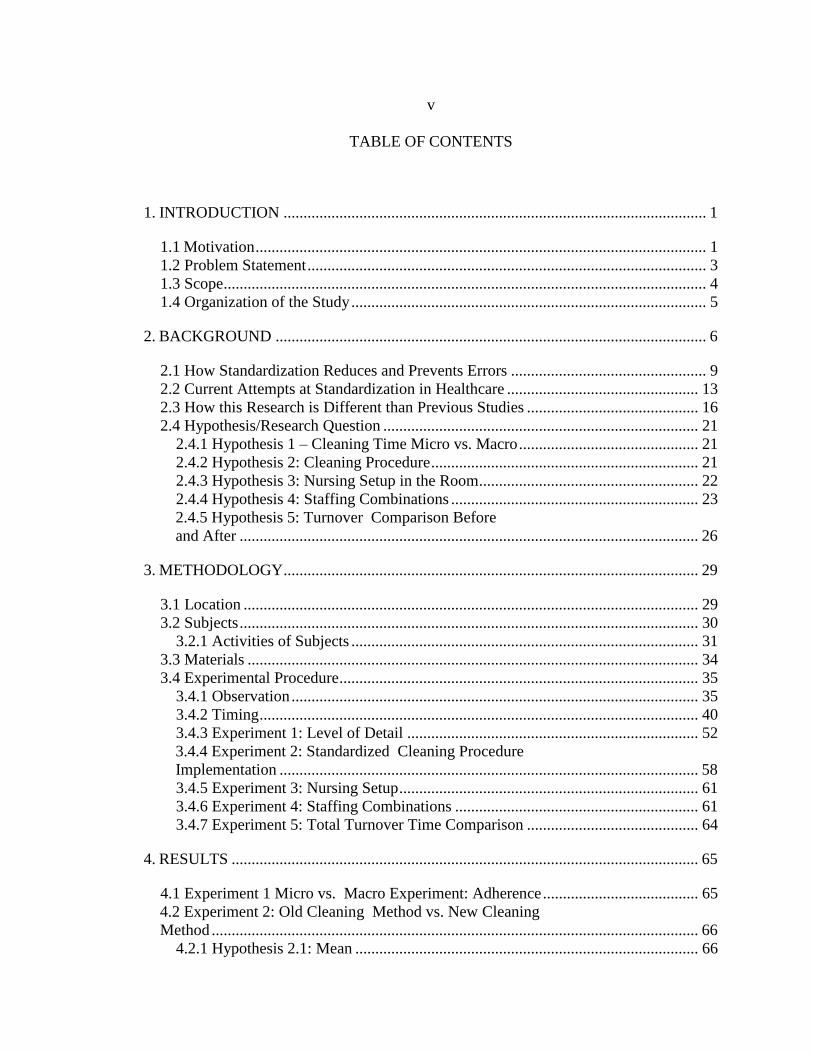
TABLE OF CONTENTS
1. INTRODUCTION .......................................................................................................... 1
1.1 Motivation ................................................................................................................. 1 1.2 Problem Statement .................................................................................................... 3
1.3 Scope ......................................................................................................................... 4 1.4 Organization of the Study ......................................................................................... 5
2. BACKGROUND ............................................................................................................ 6
2.1 How Standardization Reduces and Prevents Errors ................................................. 9
2.2 Current Attempts at Standardization in Healthcare ................................................ 13 2.3 How this Research is Different than Previous Studies ........................................... 16 2.4 Hypothesis/Research Question ............................................................................... 21
2.4.1 Hypothesis 1 – Cleaning Time Micro vs. Macro ............................................. 21 2.4.2 Hypothesis 2: Cleaning Procedure ................................................................... 21
2.4.3 Hypothesis 3: Nursing Setup in the Room ....................................................... 22 2.4.4 Hypothesis 4: Staffing Combinations .............................................................. 23
2.4.5 Hypothesis 5: Turnover Comparison Before
and After ................................................................................................................... 26
3. METHODOLOGY ........................................................................................................ 29
3.1 Location .................................................................................................................. 29 3.2 Subjects ................................................................................................................... 30
3.2.1 Activities of Subjects ....................................................................................... 31 3.3 Materials ................................................................................................................. 34
3.4 Experimental Procedure .......................................................................................... 35 3.4.1 Observation ...................................................................................................... 35 3.4.2 Timing .............................................................................................................. 40 3.4.3 Experiment 1: Level of Detail ......................................................................... 52
3.4.4 Experiment 2: Standardized Cleaning Procedure
Implementation ......................................................................................................... 58 3.4.5 Experiment 3: Nursing Setup ........................................................................... 61 3.4.6 Experiment 4: Staffing Combinations ............................................................. 61 3.4.7 Experiment 5: Total Turnover Time Comparison ........................................... 64
4. RESULTS ..................................................................................................................... 65
4.1 Experiment 1 Micro vs. Macro Experiment: Adherence ....................................... 65
4.2 Experiment 2: Old Cleaning Method vs. New Cleaning
Method .......................................................................................................................... 66 4.2.1 Hypothesis 2.1: Mean ...................................................................................... 66
vi
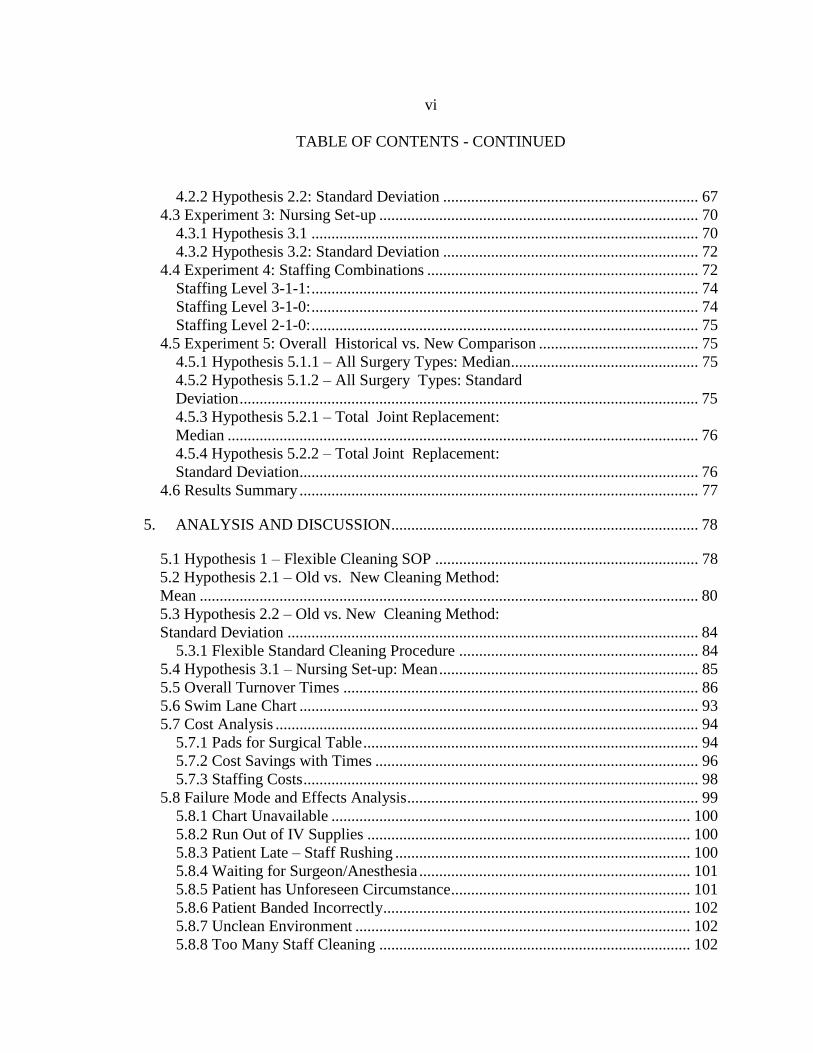
TABLE OF CONTENTS - CONTINUED
4.2.2 Hypothesis 2.2: Standard Deviation ................................................................ 67 4.3 Experiment 3: Nursing Set-up ................................................................................ 70
4.3.1 Hypothesis 3.1 ................................................................................................. 70 4.3.2 Hypothesis 3.2: Standard Deviation ................................................................ 72
4.4 Experiment 4: Staffing Combinations .................................................................... 72
Staffing Level 3-1-1: ................................................................................................. 74
Staffing Level 3-1-0: ................................................................................................. 74 Staffing Level 2-1-0: ................................................................................................. 75
4.5 Experiment 5: Overall Historical vs. New Comparison ........................................ 75 4.5.1 Hypothesis 5.1.1 – All Surgery Types: Median ............................................... 75
4.5.2 Hypothesis 5.1.2 – All Surgery Types: Standard
Deviation ................................................................................................................... 75
4.5.3 Hypothesis 5.2.1 – Total Joint Replacement:
Median ...................................................................................................................... 76 4.5.4 Hypothesis 5.2.2 – Total Joint Replacement:
Standard Deviation.................................................................................................... 76
4.6 Results Summary .................................................................................................... 77
5. ANALYSIS AND DISCUSSION............................................................................. 78
5.1 Hypothesis 1 – Flexible Cleaning SOP .................................................................. 78
5.2 Hypothesis 2.1 – Old vs. New Cleaning Method:
Mean ............................................................................................................................. 80
5.3 Hypothesis 2.2 – Old vs. New Cleaning Method:
Standard Deviation ....................................................................................................... 84 5.3.1 Flexible Standard Cleaning Procedure ............................................................ 84
5.4 Hypothesis 3.1 – Nursing Set-up: Mean ................................................................. 85
5.5 Overall Turnover Times ......................................................................................... 86 5.6 Swim Lane Chart .................................................................................................... 93 5.7 Cost Analysis .......................................................................................................... 94
5.7.1 Pads for Surgical Table .................................................................................... 94 5.7.2 Cost Savings with Times ................................................................................. 96
5.7.3 Staffing Costs ................................................................................................... 98 5.8 Failure Mode and Effects Analysis ......................................................................... 99
5.8.1 Chart Unavailable .......................................................................................... 100 5.8.2 Run Out of IV Supplies ................................................................................. 100 5.8.3 Patient Late – Staff Rushing .......................................................................... 100
5.8.4 Waiting for Surgeon/Anesthesia .................................................................... 101 5.8.5 Patient has Unforeseen Circumstance ............................................................ 101
5.8.6 Patient Banded Incorrectly ............................................................................. 102 5.8.7 Unclean Environment .................................................................................... 102 5.8.8 Too Many Staff Cleaning .............................................................................. 102
vii
TABLE OF CONTENTS - CONTINUED
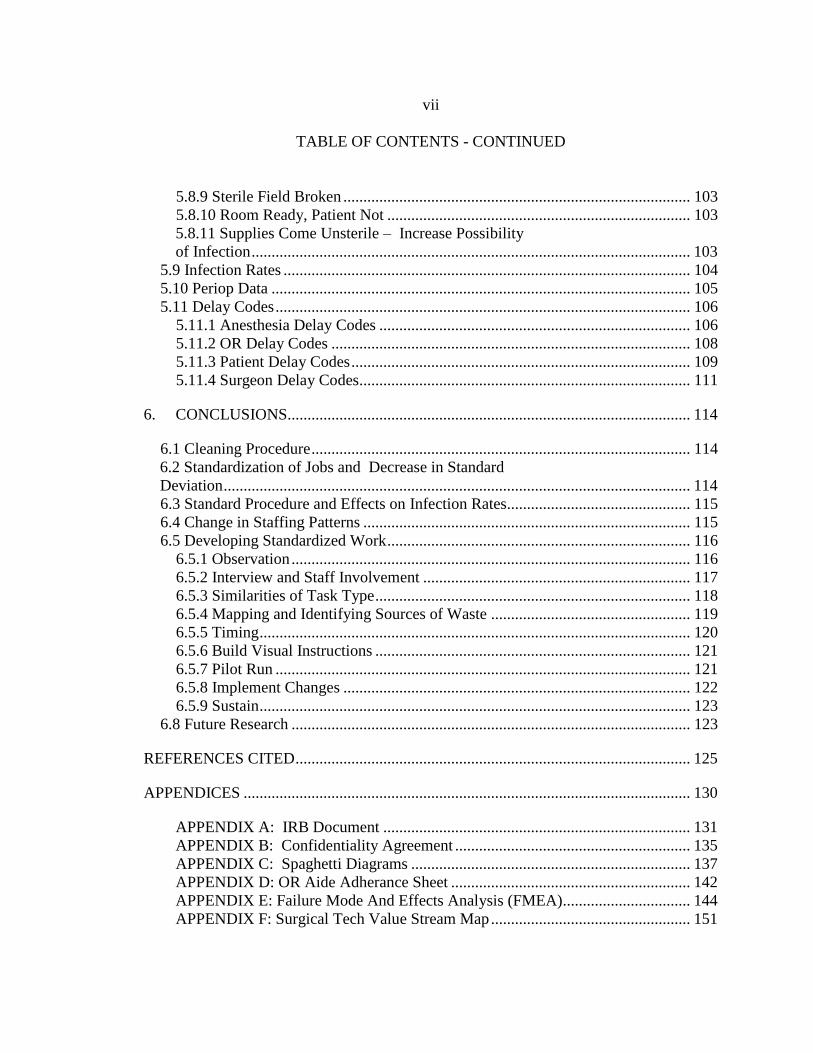
5.8.9 Sterile Field Broken ....................................................................................... 103 5.8.10 Room Ready, Patient Not ............................................................................ 103 5.8.11 Supplies Come Unsterile – Increase Possibility
of Infection .............................................................................................................. 103
5.9 Infection Rates ...................................................................................................... 104
5.10 Periop Data ......................................................................................................... 105
5.11 Delay Codes ........................................................................................................ 106 5.11.1 Anesthesia Delay Codes .............................................................................. 106 5.11.2 OR Delay Codes .......................................................................................... 108 5.11.3 Patient Delay Codes ..................................................................................... 109
5.11.4 Surgeon Delay Codes ................................................................................... 111
6. CONCLUSIONS..................................................................................................... 114
6.1 Cleaning Procedure ............................................................................................... 114 6.2 Standardization of Jobs and Decrease in Standard
Deviation ..................................................................................................................... 114 6.3 Standard Procedure and Effects on Infection Rates.............................................. 115
6.4 Change in Staffing Patterns .................................................................................. 115 6.5 Developing Standardized Work ............................................................................ 116
6.5.1 Observation .................................................................................................... 116
6.5.2 Interview and Staff Involvement ................................................................... 117 6.5.3 Similarities of Task Type ............................................................................... 118
6.5.4 Mapping and Identifying Sources of Waste .................................................. 119 6.5.5 Timing ............................................................................................................ 120 6.5.6 Build Visual Instructions ............................................................................... 121
6.5.7 Pilot Run ........................................................................................................ 121
6.5.8 Implement Changes ....................................................................................... 122 6.5.9 Sustain ............................................................................................................ 123
6.8 Future Research .................................................................................................... 123
REFERENCES CITED ................................................................................................... 125
APPENDICES ................................................................................................................ 130
APPENDIX A: IRB Document ............................................................................. 131 APPENDIX B: Confidentiality Agreement ........................................................... 135
APPENDIX C: Spaghetti Diagrams ...................................................................... 137 APPENDIX D: OR Aide Adherance Sheet ............................................................ 142 APPENDIX E: Failure Mode And Effects Analysis (FMEA)................................ 144 APPENDIX F: Surgical Tech Value Stream Map .................................................. 151
viii
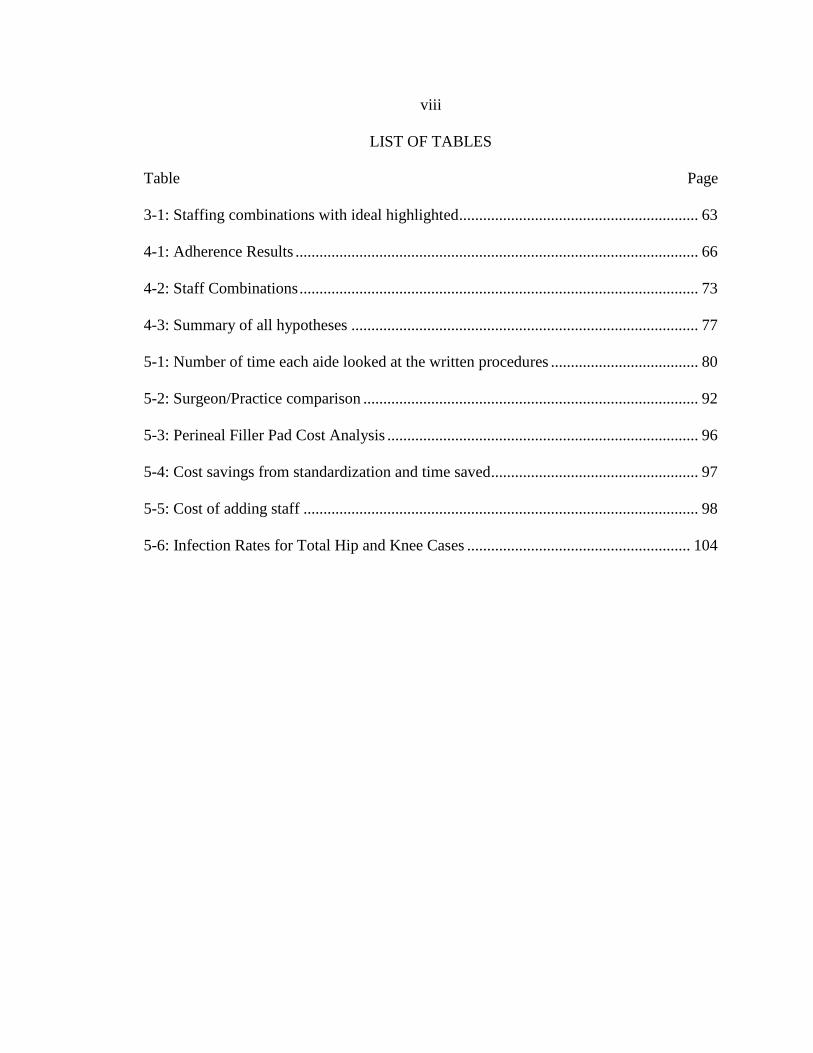
LIST OF TABLES
Table Page
3-1: Staffing combinations with ideal highlighted............................................................ 63
4-1: Adherence Results ..................................................................................................... 66
4-2: Staff Combinations .................................................................................................... 73
4-3: Summary of all hypotheses ....................................................................................... 77
5-1: Number of time each aide looked at the written procedures ..................................... 80
5-2: Surgeon/Practice comparison .................................................................................... 92
5-3: Perineal Filler Pad Cost Analysis .............................................................................. 96
5-4: Cost savings from standardization and time saved.................................................... 97
5-5: Cost of adding staff ................................................................................................... 98
5-6: Infection Rates for Total Hip and Knee Cases ........................................................ 104
ix
LIST OF FIGURES
Figure Page
2-1: Method of Standardized Work Literature Review Search ........................................ 18
2-2: Flexible Standardized Work Literature Search ......................................................... 20
3-1: OR Department layout, excluding procedure rooms ................................................. 30
3-2: Staff interactions during a turnover ........................................................................... 41
3-3: CRN observation times.............................................................................................. 43
3-4: Surgical Tech observation times ............................................................................... 46
3-5: OR Aide observation times ....................................................................................... 48
3-6: CPM for original cleaning method ............................................................................ 50
3-7: CPM modified with trash and linens assumption ...................................................... 51
3-8: Micro written cleaning procedure ............................................................................. 54
3-9: Macro written cleaning procedure ............................................................................. 55
3-10: Cleaning procedure room reminder ......................................................................... 60
4-1: Test for normality method for statistical tests to be used .......................................... 65
4-2: OR Aide Current (or Original) State Value Stream Map .......................................... 68
4-3: OR Aide Future (Implemented) State Value Stream Map ........................................ 69
4-4: CRN Original State Value Stream Map .................................................................... 71
5-1: Cleaning Procedure Experiment ................................................................................ 79
5-2: Turnover Cleaning Times Comparison ..................................................................... 81
5-3: CPM with bed configuration change ......................................................................... 83
5-4: CPM with no bed configuration change .................................................................... 83
x
LIST OF FIGURES - CONTINUED
Figure Page
5-5: How the flexibility works on the in-room reminder .................................................. 85
5-6: Nursing setup comparison ......................................................................................... 86
5-7: Average Turnover Time by Week ............................................................................. 87
5-8: Average Standard Deviation by Week ...................................................................... 88
5-9: Turnaround time weekly average boxplot ................................................................. 89
5-10: Average Monthly Turnaround Time by Specialty ................................................... 91
5-11: Average TOT by Surgeon/Practice ......................................................................... 92
5-12: Swimlane chart for a turnover ................................................................................. 95
5-13: The perineal filler pad ............................................................................................. 96
5-14: Periop Data Example ............................................................................................. 105
5-15: Anesthesia Delay Codes ........................................................................................ 107
5-16: OR Delay Codes .................................................................................................... 108
5-17: Patient Delay Codes .............................................................................................. 110
5-18: Surgeon Delay Codes ............................................................................................ 112

xi
NOMENCLATURE
Add-on – A surgery added to the schedule of surgeries for the day. Usually these
surgeries are emergent cases.
Aide – A non-professional staff type, who cleans the rooms between surgeries, runs
specimens to the lab, runs errands, and keeps peripherals clean.
Anesthesiologist – A doctor who is responsible for monitoring the patient’s vitals during
surgery – Blood pressure (BP), airways, heart rate, and oxygen levels.
AORN – Association of Perioperative Registered Nurses
Arthroplasty – A surgical reconstruction of a joint using implants
Bovie Pad – A grounding pad placed on the patient when a cautery is used.
C-Arm – An X-Ray machine with arms in a C-shape to allow the device to be above and
below a surgical bed.
Case – A surgery for one patient
Case Cart – The cart used to hold all of the supplies and instruments for one surgical
case.
Charge Nurse – A high-level, experienced nurse who runs the OR for the day, adding
cases, helping rooms, and solving problems.
Circuit and Suction – A circuit is a breathing device to help monitor and assist patients
breathing. Suction is a device used to suction small amounts of fluid form a
patient – usually from the mouth. These two are both on the anesthesia machine
and referred to together.
Circulating Nurse (CRN) – The registered nurse responsible for patients in their assigned
room; trained specifically for the OR.
Core – A central room connected to multiple ORs which has a negative pressure to allow
staff to enter and exit a room during surgery without affecting the flow of air in
the OR and preventing cross contamination.
Dirty/Clean Elevators – Elevators going to and from the OR and sterile processing
department (SPD). Dirty indicates that the instruments are contaminated.
EHR – Electronic Health Records
xii
NOMENCLATURE – CONTINUED
Gown – A garment worn by anyone who will be scrubbed in and involved in surgery,
including putting on gloves.
Hood – A garment worn over a ventilation helmet, concurrently with a gown, for high
risk surgeries such as total joint replacement and spine surgery
H&P – A document with a patient’s health history and physical information.
Joint Commission – An independent, not-for-profit organization who accredits healthcare
organizations in the United States: www.jointcommission.org
Mayo (Mayo Stand) – A table designed in such a way that it can be over a patient to ease
the use of tools and instruments
Meds – Medicine needed for a surgery, usually from an Omnicell.
Neptune – A large suction device used for dealing with liquids. It can hold up to 4L and
20L separately and has a pole to help hold irrigation bags.
Omnicell – A machine which holds medicine requiring a login and scanning of
medication to safely store and track medications.
On-Call – A status of a staff member who is available to come into the hospital when
called for an emergency
OR – Operating Room
PA – Physician’s Assistant – a trained professional, much like a surgical tech who works
for a specific surgeon did assists them with surgeries.
PACU – Post Anesthesia Care Unit
Periop – The pre and post-operative department where patients check-in, are admitted,
prepped for surgery, recover, and are discharged.
Positioner/patient positioner – A device to help position a patient for a specific surgery
and to prevent pressure ulcers
Sterile Processing Department (SPD) – The department which cleans, washes,
decontaminates, and sterilizes instruments while also reassembling instrument
trays to send back up to the OR.
xiii
NOMENCLATURE – CONTINUED
Sterile Drape – A one-time use cloth which comes sterile and is placed or draped over the
patient prior to surgery to create a sterile field. It may also be draped over a table
to create a sterile area for instruments.
Sterile Field – The areas around and on the patient which are sterile and can only be
touched by those who have scrubbed and gowned.
Surgical Technician (Surg tech, surgical tech) – A certified staff member who assists
surgeons and setup the sterile field in the OR on the tables and opens all supplies
and instruments.
Surgeon – A doctor trained to perform surgeries with the help of an anesthesiologist and
surgical team.
Surgery Types – Different surgery specialties: Dental, Ears-Nose-Throat (ENT), General,
GYN, Othropedics (ortho), and Spine. Total joint replacements fall in a sub-
category of ortho.
TAT/TOT – Turn around time or turnover time
Timeout Board – A board available in all ORs which posts the patient’s information:
name, procedure being performed, allergies, meds given, and any important notes.
This board helps to check that the correct procedure is being performed on the
correct patient. Everyone in the room is supposed to take a “timeout” and go over
the timeout board prior to an incision.
Totals – Total joint arthroplasties – hip, shoulder, knee
Tray/Instrument Tray – A sterile pan of instruments which usually is unwrapped by a
separate individual than the scrub tech to check for holes in the sterile wrapping
which would indicate that the pan is unsterile.
Turnover/turnaround – The time between surgeries which includes: taking the patient to
PACU, cleaning the room, setting up for the next surgery, and getting the next
patient.
Vindicator – A solution used to clean the OR which kills bacterial and viral
contamination. Gloves are required to be worn when using, and this solution may
not be in a spray bottle because the particles breathed in can cause adverse effects
Zoom/gurney – A bed that has electronic assistance for moving and maneuvering a
patient from one location to another.
xiv
ABSTRACT
The operating room (OR) department is one of the most expensive area to run in a
hospital. The cost per minute to run the OR is $33/minute, so decreasing the time will
save the hospital a significant amount, even if it is a minute per turnover. This research
looks at to reducing the turnover time (non-operative time) and variation in the OR by
using standardization. Data collection consisted of observation and interviews of the
circulating nurses, surgical techs, and aides to identify causes of delays and long
turnovers. It was determined that the turnover could be divided into two stages: cleaning
of the room and setting up for the next surgery. With this in mind, the research team met
with the cleaning staff (aides) to create a standard operating procedure. Preliminary tests
with the cleaning procedure proved to be promising, and a full-scale implementation in
all ORs and surgery types was carried out. Along with a cleaning procedure,
standardization of tasks for the three staff types helped to decrease the time of cleaning
the OR, setup of a room, and the overall time. The overall turnover time decreased by
two minutes and standard deviation decreased by almost two minutes for all surgery
types throughout the OR department. The decrease in time will allow the OR to hire more
staff to increase the efficiency of setup for the turnovers. A decrease in standard deviation
signifies more consistent turnovers which create more predicable times for scheduling in
the future.
1
1. INTRODUCTION
1.1 Motivation
Standardized work can be defined in many ways. Krichbaum (2008) defines it as
“a detailed and documented system in which production workers both develop and follow
a repeatable sequence of tasks within a work assignment.” The standardized work
sequence represents the best known way to complete a task for the operator to follow in
the completion of his/her job. Standardization is important as it serves to maintain order
and consistency in the operations (Freivalds, 2009). Graban (2012) describes
standardized work as “the current best way to safely complete an activity with the proper
outcome and the highest quality, using the fewest possible resources.” There are benefits
of standardized work which consist of documenting the current process, variability
reduction, training of new operators is easier, and a baseline for improvements (Lean
Lexicon, 2008). For the purpose of the research, the definition of standardized work is
finding the optimal way to complete a task or activity each time the activity is performed.
Similarly, standardization is defined in this work as the process to develop standardized
work.
All of these authors describe how standardized work is obtained and performed,
and are all important because standardized work has been used to improve quality and
safety records in many industries, including hospital settings. For example, Lehmann and
Miller (2004) state that, “standardization reduces variation in clinical treatment and
patient outcome and thus improves the quality of patient care making it safer as well by
2
reduction of potential errors.” In another case, a study in an Illinois medical center on
patient hand-offs between shifts found that standardized work allowed for less
interruptions and distractions during the handoffs which resulted in a decrease in
reporting time by over 70% and improved compliance with Joint Commission standards
(Mikos, 2007; Dais et al., 2007). However, implementation of standardized work is often
difficult. Cabana et al. (1999) found 76 published studies finding 10 barriers to
standardization. They found that lack of awareness, lack of familiarity, and lack of
agreement were among the barriers.
Productivity and efficiency are very important in the operating room (OR), and
related departments, because they are large contributors to a hospital’s revenue (Cima et
al., 2011). Processes which are economical, sustainable, and applicable across entire
surgical specialties or OR departments have not been reported (Cima et al., 2011). One
aspect of OR cost which does not create revenue is the turnover, or turnaround, time.
Turnaround time is the time interval from when the patient exits the room until the next
patient enters the room (Worley & Doolen, 2011). It includes the time it takes for
cleaning and setup of an operating room for the next patient. In Industrial Engineering,
the term turnover is known as changeover.
There are concerns for too fast of a turnover. The goal is to decrease the amount
of time and increase efficiency, but not at the cost of patient safety. Typically, there are
three categories of staff in an OR; those staffing categories are:
- Circulating Nurse – A registered nurse who is in charge of the patient
from the time they meet the patient in periop until they drop the patient off
at PACU (Post Anesthesia Care Unit).

3
- Surgical Technician – Also known as a “scrub tech”, “surg tech”, or
“surgical tech” – A certified staff member who scrubs-in to help surgeons
(and their assistants) with surgeries. They are knowledgeable in sterile
techniques and learn all surgical procedures while trying to anticipate the
needs of the surgeon.
- Operating Room Aide – Also known as “OR Aide”, or “aide” – is an
individual with minimal medical training who cleans the operating rooms
between surgeries, maintains the operating room department, and runs
errands for surgical staff who cannot leave the room during a procedure.
These three staff categories work together to turn over a room and their
interactions will be discussed in more depth in a later section This research deals with the
three staff types and their interactions in order to develop standardized work and
documenting that work within the OR department to decrease turnover times without
negatively impacting patient safety.
1.2 Problem Statement
Bozeman Deaconess Hospital (BDH) is an 86 bed trauma level III acute care
facility within a rural community setting with seven operating rooms (Bozeman
Deaconess Hospital, n.d.). Turnovers are the focus of this research due to the cost of
running the OR department. According to the data provided by BDH, the cost of running
an OR is approximately $33/minute. When a patient is in the room, the hospital is
charging the patient or insurance, making up the operating costs. However, the time
between surgeries is an opportunity cost which is translated into money not earned by the
hospital. Therefore, the goal is to minimize the time for turnovers. Decreasing the
4
turnovers will not only decrease time and cost, but increase the available time in the
operating rooms for more surgeries, thus, increasing the hospital’s profits. In addition to
looking at average time, the standard deviation is also going to be measured. Standard
deviation can be used as a good indicator on how accurate a staff is performing the
operations. Thus, creating predicable turnovers will increase patient and staff satisfaction
if everything is running on time.
This research is looking at how standardized work in OR department operations
decreases standard deviation and how it works across all types of surgeries’ turnovers. It
also investigates how to effectively implement standardized work and explore in what
way those standards affect patient safety rates, productivity, and adherence. The initial
focus is on total knee and hip arthroplasties (total knee and hip joint replacement) due to
complexity, but were expanded later to include all surgery types. Past successful process
improvements in other operating rooms will influence and guide the research and staff
meetings to assure that best practices are being used. By using these available resources,
new standard procedures will be created to help reduce the variation in all OR suites. It
should be noted that the BDH OR department has not done a process improvement
project prior to this research, thus a cultural change will also need to take place in order
to obtain sustainable changes.
1.3 Scope
The scope of the research is on the activities that need to occur during the
turnover time at the OR. The research will not look at activities that occur outside the
5
OR in parallel while the turnover is in process nor the activities that occur once the
patient enters the room. The research will only focus on the turnover time which, as
previously defined, encompass the time between a patient leaving the OR room until the
time the next patient enters the room. The standardized work will be documented in the
form of a Standard Operating Procedures (SOPs). These SOPs help understand how well
they reduce standard deviation in processes and how they affect patient safety, adherence,
and infection rates. SOPs being tested in the operating rooms with staff members allows
for feedback and improvements.
1.4 Organization of the Study
The next chapter will discuss the background of the research and how it is related
to multiple fields outside of healthcare, and what experiments will be performed. It also
explains how this research is different than other healthcare research.
Chapter three will discuss the methodology of the research, explaining the
location, subjects, materials, and experimental procedures. The procedure will clarify the
steps for observation, timing, and the experiments.
Chapter four shows the results from the experiments/hypothesis. The analysis and
discussion in chapter five discusses a few of the hypothesis, the overall turnover times
and standard deviation, and the swimlane chart created for the turnovers.
Finally chapter six describes conclusions from the research and offers
recommendations for future implementation and research.

6
2. BACKGROUND
Many researchers have reported the benefits of standardized work in operations
(Lehmann and Miller, 2004; Simpson, 2009; Peleg et al., 2004; Bakken, 2004; Pere and
Porres, 2010). However, to the best of the author’s knowledge, standardized work has not
been documented very well in ORs. Some researchers have argued that healthcare should
move towards the creation and implementation of more standardized procedures
(Lehmann and Miller, 2004). The definition of standardized work for this research is
finding the optimal way to complete a task or activity each time it is performed.
Many industries have reported the successful implementation of standardized work in
their operations. For example, the aviation industry uses many standardized work to
ensure safety of staff and passengers along with a culture of safety. To reduce medical
errors, some safety practices commonly used in the aviation industry have been adapted
for healthcare (Kao and Thomas, 2008) but there are limitations due to lack of research
and understanding of aviation-based safety strategies. Researchers argue that simulators,
which is the common tool used in the aviation industry, can be used to study how
standard operating procedures (SOP) can improve patient safety (Kao and Thomas,
2008). An SOP is the written, documented standardized work. However, different to the
aviation industry, the healthcare industry has a hard time providing simulations due to
humans being more complex than airplanes and the amount of uncertainty involved in
each case.
Aviation and healthcare may seem like they do not have a lot in common, but
there are many similarities: safety as a primary goal, multiple threats to safety, and that
7
working on teams is vital (Helmreich and Davies, 2004). Therefore, learning from the
aviation industry should be a natural step.
The aviation industry inspired healthcare by creating a safety culture with
effective standard procedures to eliminate errors. Checklists are the most prominent form
of standardizing a procedure, especially in the cockpit. At Boeing, they have created a
culture which governs how their cockpit crew flies planes. This includes their routines,
how much they do manually or with computers, and what their reaction is to the
unexpected (Gawande, 2009). They started making checklists back with the B-17 bomber
in 1944, and have been ever since. Some of the checklists are now shown on the
computers, but there are also binders for the less common cases in the cockpits.
There are different types of checklists: DO-CONFIRM or READ-DO. DO-
CONFIRM checklists allow more flexibility and faster application time because the
person does what they remember from the list, and then stop to check that they did not
forget anything (Gawande, 2009). Boeing’s rule of thumb is 5-9 items obeys the limit of
working memory and the checks must be short and exact. This fits with George Miller’s
study that found the limits on the capacity of processing information are 7±2, which are
5-9 items (Miller 1956). They also do extensive tests on checklists prior to putting them
into work on a plane, but the feedback is one of the most important mechanisms in
creating an effective checklist and making sure that the operator is using them correctly.
Checklist errors constituted the highest number of errors in rule-compliance in aviation
(Rantz et al., 2009), so ensuring understanding with training and testing is worthwhile.
8
Healthcare has used aviation-like checklists to help reduce errors and increase
communication. The first well-known use of standardization in healthcare is the central
line insertion checklist. Central line infections were causing hospitals to spend around
$45,000 per patient, and there were 28,000 cases per year nationwide (Pronovost et al.,
2006). Before the Provonost et al.(2006) study, the median rate of catheter-related
bloodstream infections per 1000 catheter-days was 2.7. After implementing the checklist
in 103 ICUs throughout the country, the infections per 1000 catheter-days after three
months was zero (Pronovost et al., 2006). Even after 18 months, the infection rate was
zero or just slightly above. The checklist consisted of (Pronovost et al., 2006):
- Hand washing
- Using full-barrier precautions during the insertion of central venous catheters
- Cleaning the skin with chlorhexidine
- Avoiding the femoral site if possible
- Removing unnecessary catheters (Check every day to see if the catheter was
needed)
Another instance is a study done by the World Health Organization (WHO),
which had eight hospitals from around the world test a 19-item surgical safety checklist
(Haynes et al., 2009). The checklist was inspired by the aviation industry’s checklists
used mainly in the cockpits. The WHO’s team also learned from the Provonost et al.
(2006) central line checklist, which started in 2001, that worked even in low income
facilities (Gwande, 2009).The proposed surgical checklist reduced complications from
11% to 7%, mortality from 1.5% to 0.8%, and surgical site infection from 6.2% to 3.4%
(Haynes et al., 2009).
In addition to the extensive use of checklists for standardized work, the aviation
industry has also created a safety culture. Crew Resource Management (CRM) was
9
developed by the aviation industry to help with communication primarily with teams and
decision-making systems (Kosnik et al., 2007). It worked on issues such as: reducing
hierarchy, team communication and coordination, monitoring and cross-checking, system
knowledge, briefings and debriefings and correction of known problems and issues
(Kosnik et al., 2007). When an error occurs in healthcare similar issues can be the source
of error. Kosnik et al. (2007) give an example of how CRM can be used in healthcare to
create “overlapping knowledge of roles and tasks” to enhance cross-check monitoring
and back up team members across disciplines. Healthcare workers depend on
communication, and creating consistent and dependable ways is important and allows all
team members to speak freely, give ideas, and an objective conflict resolution (Kosnik et
al., 2007).
2.1 How Standardization Reduces and Prevents Errors
The results from the studies of Gawande (2009) and Provonost et al. (2006), show
how standardization of tasks can help improve patient safety, save hospitals money, and
increase efficiency, but standardization of procedures, policies, and guidelines also help
prevent errors. Friesdorf et al. (2007) argue that the reasons for human errors are caused
by: missing standards, organizational deficits, communication errors, time pressure, and
ergonomics of systems which affect quality and efficiency. It was found that a safe
patient treatment requires the use of standardized work and monitoring by using
benchmarks so that if the process deviates, it is caught early (Friesdorf et al. 2007). As
originally stated by Tomey (2000), policies and procedures may be used as the basis for
10
future decisions and actions. They may be helpful in coordinating plans, controlling
performance, and increasing consistency by ensuring that the same decisions every time
when others face similar situations (Randolph, 2006). Bakken et al. (2004) also identified
four areas for the role of informatics, one of which is standardization of practice patterns.
Even back in 1917, Frank and Lillian Gilbreth worked in hospitals and placed emphasis
on “working smarter and not working harder,” (Towill, 2009). Therefore, by creating
standardized work and having guidelines to which the procedure should be written, there
should be a higher percentage of consistency when performing a task, and lower risk of
error when performing the procedure.
However, even if a standard procedure is in place, adherence is the next big issue
because if the procedure is not done properly, errors may still occur, with a possibility of
causing harm to a patient. Klundert et al. (2010) studied adherence to clinical pathways
and found that there is a great need to improve the organization and documentation. The
Health and Safety Executive of the United Kingdom agrees that written procedures are
important in order to maintain consistency and ensure that everyone has the same basic
level of information. Written procedures are a key element of a safety management
system and can be used as a training tool. However, poorly written procedures can be a
reason for people not following recommended actions (HSE, 2009).
Nurses and staff are not the only people that are required to follow policies,
guidelines, and standardized work; physicians are supposed to as well. However,
physicians are sometimes contributors to non-compliance. Cabana et al. (1999) found 76
published studies between 1966 and 1998 that had described at least one barrier to
11
adherence to clinical practice guidelines, practice parameters, clinical policies, or national
consensus statements. They found ten barriers to standardization with physicians
(Cabana et al. 1999). This provides evidence that just having documentation of
standardized work will not make a system work well. The organizational culture highly
influences how well an implementation will work because if staff, especially managers,
do not believe in the new process it has a lower chance of success (Stock et al., 2006).
Holtman (2011) discusses joining aviation and military research with healthcare
to express how errors occur and the overall methodology through a literature review. The
two paradoxes found are: 1) Professionalism and error are deeply rooted in expertise; 2)
Professionalism can create organizational blind spots. Social and cultural values and
professionalism affect the outcome goals and are the cause of errors (Holtman, 2011).
The Institute of Medicine (IOM) Committee on Quality of Health Care in
America has identified information technology as a critical role when designing a health
system. Technology produces care that is safe, effective, patient-centered, timely,
efficient, and affordable (Bakken et al., 2004). The informatics infrastructure for patient
safety and evidence-based practice involves standardized terminologies, healthcare data
standards, rule repositories, and more. Healthcare data standards help in the development
and implementation of informatics infrastructures for patient safety and has been creating
alerts, sharing knowledge, and assuring confidentiality and security of health information
(Bakken, 2004). Improving information access helps with improving the information to
promote patient safety and improve quality of care through reduction of medical errors.
Standardization of practice patterns has shown an increased compliance with preventative

12
care guidelines and adherence to clinical practice guidelines which have the potential to
improve patient outcomes (Bakken, 2004).
Ineffective communication is also a large source of error. Alvarez and Coiera
(2006) found from multiple sources (Harvard Medical Practice Study, Quality in
Australian Health Care Study, and IOM report) that ineffective communication is a
significant factor in medical error. They also identified three classifications of errors in
communication: 1) clinical communication patterns, 2) communication studies in the
intensive care, and 3) How could communication be a source of latent error. The last
classification shows that clinicians spend most of their time communicating, and if
ineffective communication is used or there are many interruptions, there are more
chances for errors. It was concluded that the probability of latent error increases as the
more complex, opaque, and tightly coupled a system becomes (Alvarez and Coiera,
2006). A study in an Illinois Medical Center on patient hand offs between shifts found
that standardizing the work allowed for less interruptions and distractions during the
handoffs which resulted in a decrease in reporting time by over 70% and improved
compliance with Joint Commission standards (Mikos, 2007; Dais et al., 2007).
Adler (1997) suggests that teamwork is important, or as it is called a “work-
organization.” This is the foundation upon which industrial relations are built, and defines
the task assignments. Graban (2012) also points out that understanding the reasoning
behind the procedures increases the likelihood of following the standardized work.
Graban (2012) also argues that employees should rely on peer enforcement instead of
authority. In this research, the staff members will be used in the improvement efforts
13
towards standardization as suggested. This should encourage a feedback loop discussed
earlier with aviation checklists (Rantz et al., 2009).
This research will look at the communication during setup for a surgery during a
turnover. The different staffing types, specifically the nurses, need to communicate in
order to get tasks done simultaneously in different locations. Standardized work will be
used in order to accomplish parallel processing, and a swimlane chart will document it.
2.2 Current Attempts at Standardization in Healthcare
Checklists have proved to be an effective method of documenting the
standardization of a procedure/task/policy. The central-line and surgical safety checklists
are the most recognized. However, checklists are not the only way to document
standardized work. Clinical guidelines/practices, policies, and warning signs/reminders
are other ways of communicating standardized work. The American College of
Physicians (ACP) created clinical algorithms which used IOM guidelines to write clinical
descriptive guidelines.
Standardization of practice patterns has shown an increased compliance with
preventative care guidelines and adherence to clinical practice guidelines that have the
potential to improve patient outcomes (Bakken et al., 2004). Clinical guidelines are a
form of standardization, however, they are not standard for each procedure or task. Along
with inconsistency, guidelines are not always followed or adhered to, thus improvement
on how a procedure is written is needed (Klundert et al., 2010). Peleg et al. (2006) did a
study on interpretation of descriptive (or clinical) guidelines written with the American
14
College of Physicians (ACP) guidelines finding that there are many possible explanations
for sources of errors. Peleg et al. (2006) studied these guidelines when writing clinical
practice guidelines and found that there are multiple possible explanations of error in a
descriptive guideline:
1) Missing definitions of branching points and interaction among guidelines
2) Problem with negation and implication
3) Confusing AND with OR
4) Over learning may lead to errors
5) Confusing different situations may lead to errors
6) Implications to GLIF3 (Guideline Interchange Format v. 3)
A study done by Klundert et al. (2010) found that just using a clinical pathway was not
enough, adherence of the procedures needed to improve.
Not only do procedures need to be written properly, but they need to be
comprehended in such a way that they can be adhered to correctly. Written procedures
are sometimes hard to read and comprehend. The wording, amount of pictures, order of
steps, length, not enough detail, and non-experts writing procedures are all factors that
contribute to comprehension. There are quite a few articles which state that standard
procedures are important, and should be written in standard vocabularies (Peleg et al.,
2006; Bakken, 2004; Pérez and Porres, 2010). However, there is not a standard
vocabulary throughout the country or even in states, and no standard for how to write the
guidelines to be used in different facilities (clinical guidelines are usually hospital or
campus specific). If nothing else, have the guidelines/pathways/procedures/policies
written in such a way that they can be easily modified for a facility.
Since wording has been established in previous research, the key focus of this
study in finding the most effective way to write a procedure is level of detail. Two main

15
levels of detail are tested first: micro vs. macro. One procedure is written in a high level
(macro) of detail, and the other is very detailed (micro) level.
Peleg et al. (2006) also found that a non-expert may use guidelines inaccurately or
make incorrect inferences. Clinical guidelines have the ability to be written by and
verified without experts, so there needs to be a system to make sure that the guidelines
are understandable for the application (Pérez and Porres, 2010). Pérez and Porres used
the work of Domínguez, et al. (2007, 2008) and continued to work on how to verify
ability of a guideline and how to make them more understandable. The verification
properties are: good medical practice, particularities of the hospital, guideline goal, and
patient specific clinical condition. Pérez and Porres (2010) have created a good starting
point, but there still needs to be more work for this approach to be used in hospitals.
Frank Gilbreth suggested that there were five crucial steps which would increase
the effectiveness with the method study approach (Towill, 2009):
1. Write the current practice into a document
2. Find the deviations which create the same result
3. Observe the work
4. Document the relationships in the organization
5. Analyze motions of each work type
In other words, a clinical pathway cannot be written without the help of the workers
involved. Towill (2009) suggests that using a “walking the process” approach can reveal
and may expose for the first time what actually happens. Documenting the current
practice is number one on the list, showing how important written procedures can be
when it comes to consistency.
16
2.3 How this Research is Different than Previous Studies
Productivity and efficiency are very important in the OR, and related departments,
because they are usually the organization’s largest financial contributors (Cima et al.,
2011). One aspect of OR cost which does not create revenue is the turnover time.
Turnaround time is the time interval from when the patient exits the room until next
patient enters the room (Worley & Doolen, 2011), which includes the time it takes for
cleaning and setup of an operating room for the next patient. In Industrial Engineering,
changeover is the equivalent to the term turnover.
There have not been recorded processes which can be used across an entire OR or
surgical specialty which is sustainable and affordable (Cima et al., 2011). This is due to
difficulty of multiple contributing factors: infrastructure, human resource management
issues, scheduling variation, process flow, technology issues, information management
limitations, undefined responsibilities, and inventory management (Cima et al., 2011;
Leslie et al., 2006).
This research looks at how standardization of the turnover decreases standard
deviation and how it works across all types of surgeries. Past successful process
improvements in operating rooms and motivation from manufacturing will influence and
guide the research and staff meetings to assure that “best practices” are being used. By
using these available resources, new standardized work will be created to help reduce the
standard deviation in all OR suites. In addition, as previously stated, this work will also
look at the most effective way to write a procedure in terms of the level of detail. Two
main levels are tested: micro vs. macro.
17
According to Nembhard et al. (2009), research suggests that many health-care
professionals are afraid of implementing new practices because they are preoccupied
about the potential of causing harm to patients. In addition, they do not respond well to
being told what to do by management instead of coming up with the solution themselves
(Graban 2012). However, there are success stories in ORs increasing efficiency by (Cima
et al., 2011; Patterson, 2009; Krasner et al., 1999, Harders et al., 2006):
- Increasing the percentage of patients arriving on time;
- Parallel processing of tasks;
- Moving tasks from setup time during turnovers to external setup;
- Using staff as a source for ideas;
- Assigning available staff to ensure the patient is ready for surgery; and
- Giving advance notification of turnovers
Parallel processing and moving tasks from internal to external are two of the
methods which are used to help the nurses. In this research there will be two nurses
working at the same time on tasks that were previously performed by only one nurse.
Along with adding a nurse, there will be an experiment to test which staffing combination
works best with all three staff types with standardized work, documented by a swimlane
chart. The chart states that the 3-1-1 combination (meaning 3 people cleaning, 1 nurse
facilitator, and 1 surgical tech facilitator) is best for complicated surgeries and the 3-1-0
(3 people cleaning, 1 nurse facilitator, and no surgical tech facilitator) is best for all other
surgeries. The standardized work for the staff allows for testing between the original and
new state.
The preceding improvement projects listed in the literature above were not
research based and had little evidence to base the process improvements on. Searching in
the Montana State University database, which searches multiple databases

18
simultaneously, provided that these are the best known successful OR efficiency
improvement efforts. As seen below in Figure 2-1, the literature search was performed to
find standardized work in healthcare, specifically operating rooms. The search results
showed hundreds of thousands of articles and books for each key word. Some of the key
words were: standardization, standard work, standardized work, standardized work in
healthcare, standardized work in operating room, checklists in healthcare, and clinical
guidelines.
Figure 2-1: Method of Standardized Work Literature Review Search
19
The search results were easily decreased by modifying the results to be in English,
refining subject terms, and content type. Many articles were not applicable to the intent of
the search such as government policies, department of defense, and chemistry. After the
results were narrowed down to only a few hundred sources the titles and abstracts were
read to narrow down the field even further. If the abstract did not show adequate evidence
of being a useful article, it was not kept. All of the articles that made it past the abstract
stage were fully read and considered. Not only were articles obtained through database
searching, but also through the references of the sources found.
This research looks at the effect of standardized work on the processes in the OR;
specifically at the turnover time of all surgeries before and after the implementation of
standardized work. It also looks at the total hip and knee replacements by itself since this
is a very complex surgery.
The type of standardized work being created is new in the way the procedure can
be used. It is called a “flexible SOP,” where SOP means “standard operating procedure.”
The flexible SOP will allow the process to be completed the same way every time
effectively with any a specific range of people. Any number of specified range of people
can perform the procedure, but also the fact that the number can change during the
process of performing the SOP and still accomplish the same tasks makes this a novel
way to look at operations.
The literature search, as seen in Figure 2-2, consisted of eleven key words and
four databases: Cinahl, Web of Science, Inspec, and Compendex. The original search
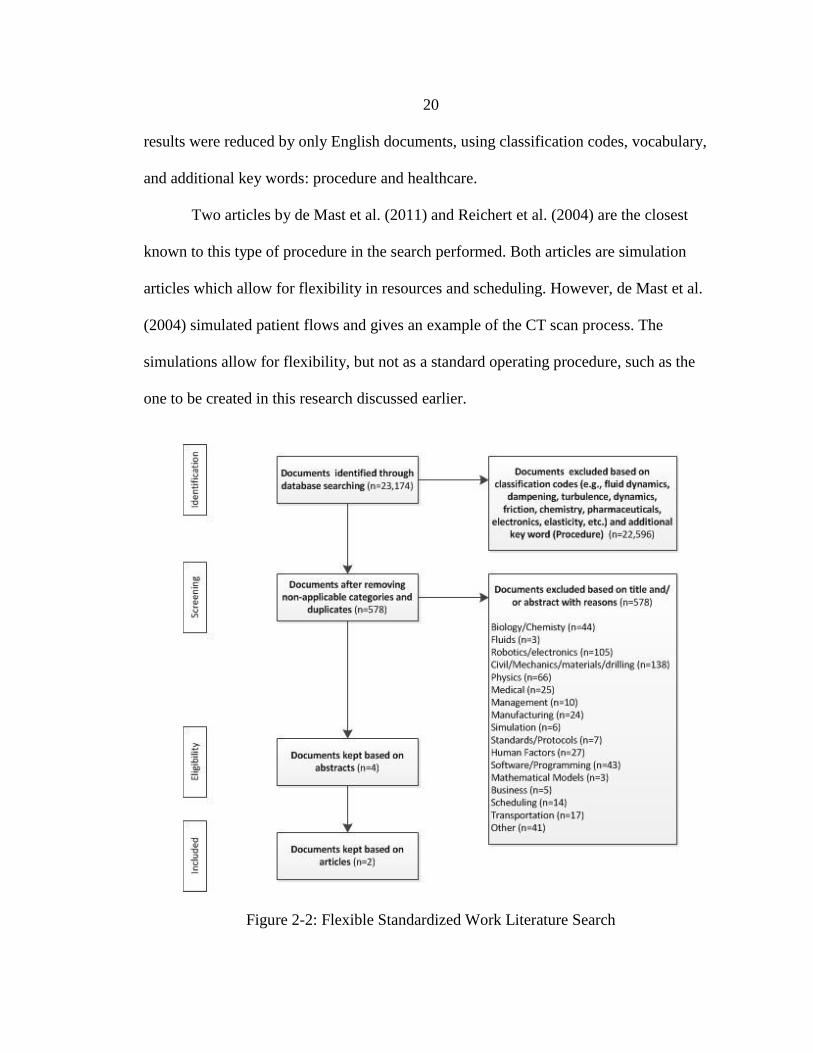
20
results were reduced by only English documents, using classification codes, vocabulary,
and additional key words: procedure and healthcare.
Two articles by de Mast et al. (2011) and Reichert et al. (2004) are the closest
known to this type of procedure in the search performed. Both articles are simulation
articles which allow for flexibility in resources and scheduling. However, de Mast et al.
(2004) simulated patient flows and gives an example of the CT scan process. The
simulations allow for flexibility, but not as a standard operating procedure, such as the
one to be created in this research discussed earlier.
Figure 2-2: Flexible Standardized Work Literature Search
21
2.4 Hypothesis/Research Question
There are five main hypotheses. They are related to the impact of standardized
work in: cleaning, nursing setup, staffing combinations, and overall turnover time.
2.4.1 Hypothesis 1 – Cleaning Time Micro vs. Macro
The time it takes to perform the micro-level of detail in a written procedure will be
longer than the time it takes to perform the macro-level of detail in a written procedure.
The procedure is presented in two forms. One procedure is written in a high level (macro)
of detail, and the other is at a micro level. According to Frisdord et al. (2007), the more
details that the subjects are required to remember, the longer it will take to perform the
task. Experiment 1 tests this hypothesis. The hypothesis claims for statistical purposes
are:
H1o: The mean time of the micro-level written procedure (µ1) is equal to the mean time
of the macro-level written procedure (µ2)
H11: The mean time of the micro-level written procedure (µ1) is greater than the mean
time of the macro-level written procedure (µ2)
The equations for the claims are:
H1o: µ1 - µ2 = 0
H11: µ1 - µ2 > 0
2.4.2 Hypothesis 2: Cleaning Procedure
The time and standard deviation will decrease after the implementation of the
flexible cleaning SOP. Experiment 2 will test these two hypotheses.
22
Hypothesis 2.1 – Cleaning Time with Mean: The time of turnovers will decrease
based on the level of detail of the standard procedure of cleaning. Once the level of detail
which heeds the most adherence is found, the procedure should be consistently faster than
the current turnaround times. Thus the hypothesis claims the following:
H20: The difference of the mean of the current cleaning process (µ3) and the standard
cleaning process (µ4) is equal to zero.
H21: The difference of the mean of the current cleaning process (µ3) and the standard
cleaning process (µ4) is greater than zero.
In equation form the hypothesis are as follows:
H2o: µ3 - µ4 = 0
H21: µ3 - µ4 > 0
Hypothesis 2.2 – Cleaning Time with Standard Deviation: If a standardized
cleaning procedure is put in place, the standard deviation of the times for cleaning will
decrease.
H30: The difference of the standard deviation of the current cleaning process (S1) and the
standard cleaning process (S2) is equal to zero.
H31: The difference of the standard deviation of the current cleaning process (S1) and the
standard cleaning process (S2) is greater than zero.
In equation form the hypothesis are as follows:
H3o: S1 – S2 = 0
H31: S1 – S2 > 0
2.4.3 Hypothesis 3: Nursing Setup in the Room
The time to set-up a room for a turnover starts when the patient leaves and ends when
the circulating nurse leaves the OR to get the patient in periop. The setup time includes
23
the standardized cleaning procedure, but depends on having a nurse facilitator.
Experiment 3 will test the two hypotheses.
Hypothesis 3.1 – Nursing Setup with Means
H4o: The historical mean to set-up a room (µ5) is equal to the mean of the new method of
setting up a room (µ6).
H41: The difference between the historical mean to set-up a room (µ5) and the mean of
the new method of setting up a room (µ6) is greater than zero.
The equation for Ho and H1 are as follows:
H4o: µ5 - µ6 = 0
H41: µ5 - µ6 > 0
Hypothesis 3.2 – Nursing Setup with Standard Deviation
H5o: The historical standard deviation of the nurse setting up a room (S3) is equal to the
standard deviation of the new method (S4).
H51:The difference of the historical standard deviation of the nurse setting up a room (S3)
and the new method standard deviation (S4) is greater than zero.
The hypothesis can be represented as follows:
H5o: S3 – S4 = 0
H51: S3 – S4 > 0
2.4.4 Hypothesis 4: Staffing Combinations
The staffing combinations tried during the research were different amounts of
people cleaning, a nurse facilitator, and a surgical tech facilitator. In the combinations,
only 1, 2, or 3 people can help clean, 0 or 1 nurse facilitators, and 0 or 1 surgical
technician. For example, the combination denoted in the form of 3-1-1 means 3 people

24
cleaned, 1 nurse facilitator, and 1 surgical tech facilitator. This is different than the
previous way of setting up a room where no one was assigned to do specific tasks, and
the nurse helped clean.
All of the combinations will be compared to historical data. The 3-1-1
combination will be compared to the total joint historical data because the surgical tech
facilitator is required for those cases. All other combinations, 3-1-0 and 2-1-0, will be
compared to the historical data of all surgery types. Experiment 4 will include the
collection of the staffing combinations to be compared against the original state for all six
hypotheses.
Hypothesis 4.1.1 – Combination 3-1-1: Mean
H6o: The historical mean of total joint turnovers (µ7) is equal to the mean of the 3-1-1
staffing combination (µ8).
H61: The difference of the historical mean of total joint turnovers (µ7) and the mean of
the 3-1-1 staffing combination (µ8) is greater than zero.
The equation forms of the hypothesis are:
H6o: µ7 - µ8 = 0
H61: µ7 - µ8 > 0
Hypothesis 4.1.2 – Combination 3-1-1:
Standard Deviation
H7o: The historical standard deviation of total joint turnovers (S5) is equal to the standard
deviation of the 3-1-1 staffing combination (S6).
H71: The difference of the historical standard deviation of total joint turnovers (S5) and
the standard deviation of the 3-1-1 staffing combination (S6) is greater than zero.
The equation forms of the hypothesis are:
25
H7o: S5 – S6 = 0
H71: S5 – S6 > 0
Hypothesis 4.2.1 – Combination 3-1-0: Mean
H8o: The historical mean of turnovers (µ9) is equal to the mean of the 3-1-0 staffing
combination (µ10).
H81: The difference of the historical mean of turnovers (µ9) and the mean of the 3-1-0
staffing combination (µ10) is greater than zero.
The equation forms of the hypothesis are:
H8o: µ9 - µ10 = 0
H81: µ9 - µ10 > 0
Hypothesis 4.2.2 – Combination 3-1-0:
Standard Deviation
H9o: The historical standard deviation of turnovers (S7) is equal to the standard deviation
of the 3-1-0 staffing combination (S8).
H91: The difference of the historical standard deviation of turnovers (S7) and the standard
deviation of the 3-1-0 staffing combination (S8) is greater than zero.
The equation forms of the hypothesis are:
H9o: S7 – S8 = 0
H91: S7 – S8 > 0
Hypothesis 4.3.1 – Combination 2-1-0: Mean
H10o: The historical mean of turnovers (µ11) is equal to the mean of the 2-1-0 staffing
combination (µ12).
H101: The difference of the historical mean of turnovers (µ13) and the mean of the 2-1-0
staffing combination (µ12) is greater than zero.
26
The equation forms of the hypothesis are:
H10o: µ11 - µ12 = 0
H101: µ11 - µ12 > 0
Hypothesis 4.3.2 – Combination 2-1-0:
Standard Deviation
H11o: The historical standard deviation of turnovers (S9) is equal to the standard
deviation of the 2-1-0 staffing combination (S10).
H111: The difference of the historical standard deviation of turnovers (S9) and the
standard deviation of the 2-1-0 staffing combination (S10) is greater than zero.
The equation forms of the hypothesis are:
H11o: S9 – S10 = 0
H111: S9 – S10 > 0
2.4.5 Hypothesis 5: Turnover
Comparison Before and After
An experiment will be performed with the data before and after for the next four
hypotheses. The data for comparison, both historical and new, are from the hospital’s
database. The data compared will be for all surgeries and for total knee and hip
arthroplasties.
Hypothesis 5.1.1 – Standardization with
Mean Time of All Surgery Turnovers: The mean time of all surgery types will be
significantly smaller after the process has been standardized. The hypothesis will be
expressed as follows:
H120: The mean turnaround time for the original process (µ13) is equal to the mean of the
standardized process’ turnaround data (µ14).
27
H121: The mean of the original turnaround data (µ13) is larger than the mean of the
standardized process’ turnaround data (µ14).
The hypothesis can be represented as:
H14o: µ13- µ14=0
H141: µ13- µ14>0
Hypothesis 5.1.2 – Standardization with
Standardization of All Surgery Turnovers: The standard deviation of all surgery
types will be significantly smaller after the process has been standardized.
H130: The standard deviation for turnaround time for the original process (S11) is equal to
the standard deviation of the standardized process’ turnaround times (S12).
H131: The standard deviation of the original turnaround time (S11) is larger than the
standard deviation of the standardized process’ turnaround times (S12).
The hypothesis can be represented as:
H15o: S11- S12=0
H151: S11- S12>0
Hypothesis 5.2.1 – Standardization with
Mean Time of Total Joint Turnovers: The mean time of turnarounds for total knee
and hip arthroplasties and revisions will be significantly smaller after the process has
been standardized. The historical mean is µ1= 43.15 minutes. The current mean is from
April 2012 – July 2012 which includes the standardized processes. The hypothesis can be
expressed as follows:
H14o: The mean turnaround time for the original process (µ15) is equal to the mean of the
standardized process’ turnaround data (µ16).
H141: The mean of the original turnaround data (µ15) is larger than the mean of the
standardized process’ turnaround data (µ16).

28
The hypothesis can be represented as:
H14o: µ15- µ16=0
H141: µ15- µ16>0
Hypothesis 5.2.2 –Standardization with
Standard Deviation of Total Joint Turnovers: The standard deviation of
turnarounds for total knee and hip arthroplasties and revisions will be significantly
smaller after the process has been standardized.
The standard deviation of turnarounds is a historical standard deviation. The
current standard deviation is from April 2012 – July 2012 which includes the
standardized process. The hypothesis can be expressed as follows:
H15o: The standard deviation for turnaround time for the original process (S13) is equal to
the standard deviation of the standardized process’ turnaround times (S14).
H151: The standard deviation of the original turnaround time (S13) is larger than the
standard deviation of the standardized process’ turnaround times (S14).
The hypothesis can be represented as:
H15o: S13- S14=0
H151: S13- S14>0
29
3. METHODOLOGY
3.1 Location
The research described takes place at BDH in Bozeman, Montana with permission
of Liz Lewis, VP of Operations at BDH; Shelly Satterthwait, OR department manager;
and Dr. David Claudio, advisor to Virginia and assistant professor at Montana State
University.
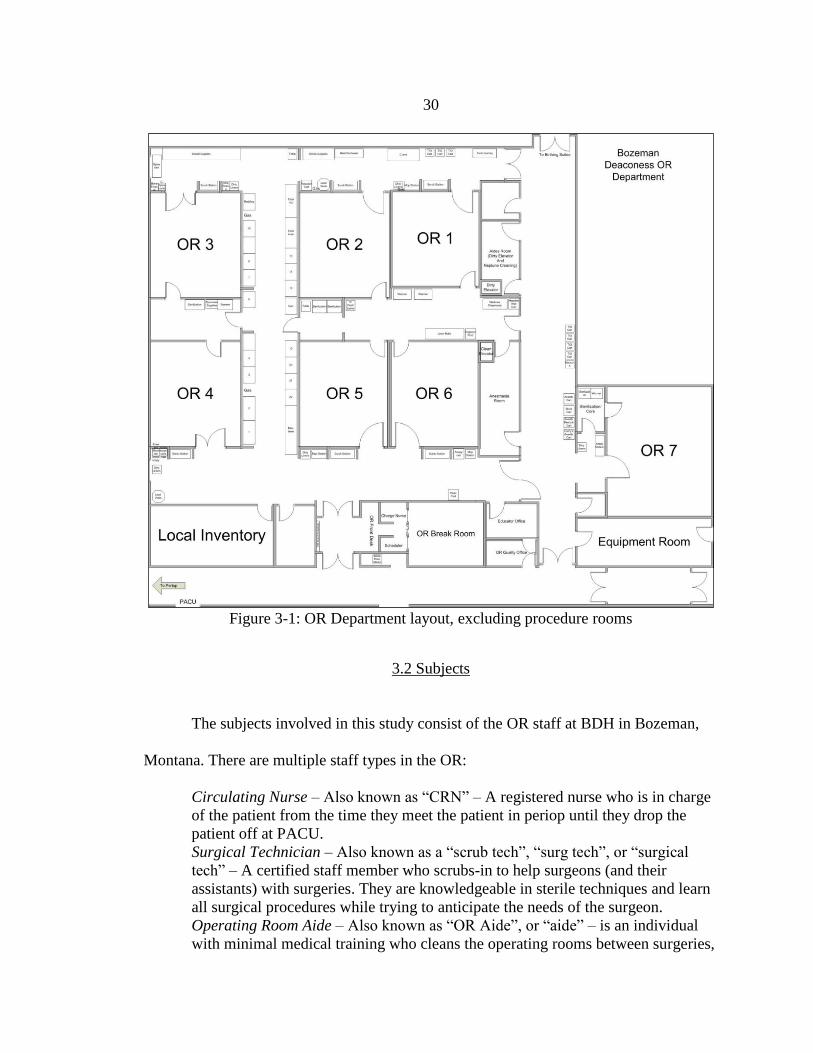
BDH consists of seven ORs and one procedure room (two starting in July 2012),
and the layout of the OR department can be seen below in Figure 3-1. They operate 5
days a week from 6:30am to 3pm according to daily surgical schedules, and have staff
and doctors on call 24-7. There are OR rules and manners that must be learned including
when to wear a mask, shoe covers, and surgical hats, how to behave around a surgical
field, and how to enter an OR before, during, and after surgeries.
For scheduling, each practice has at least one block of time throughout the week
in a particular OR, and some individual surgeons have blocks of time because they have
such a high case-load. The seven ORs and procedure rooms have block times available.
Each block is between 8-10 hours. This schedule helped the researcher know generally
what days the type of surgery chosen would occur.
30
Figure 3-1: OR Department layout, excluding procedure rooms
3.2 Subjects
The subjects involved in this study consist of the OR staff at BDH in Bozeman,
Montana. There are multiple staff types in the OR:
Circulating Nurse – Also known as “CRN” – A registered nurse who is in charge
of the patient from the time they meet the patient in periop until they drop the
patient off at PACU.
Surgical Technician – Also known as a “scrub tech”, “surg tech”, or “surgical
tech” – A certified staff member who scrubs-in to help surgeons (and their
assistants) with surgeries. They are knowledgeable in sterile techniques and learn
all surgical procedures while trying to anticipate the needs of the surgeon.
Operating Room Aide – Also known as “OR Aide”, or “aide” – is an individual
with minimal medical training who cleans the operating rooms between surgeries,

31
maintains the operating room department, and runs errands for surgical staff who
cannot leave the room during a procedure.
These subjects are:
- To be observed;
- Asked for input and feedback;
- Willing to participate in standard procedure trials;
- To follow standard procedures agreed upon;
- To be trained on the standard procedures;
- Instructed when not adhering to the agreed standard procedure; and
- To continue performing the changes and standard procedures after the researcher
is no longer in the hospital.
The staff at BDH, at the time, happened to be about half traveling nurses and
techs. “Travelers” stay for anywhere from 3 months to 11 months. These temporary staff
help fill positions which require a large amount of training, and make do until a
permanent employee can be hired or trained. These travelers have been to multiple
hospitals, if not dozens throughout their career. Seeing that they had experience in
multiple environments, they were a good source of ideas of things that have worked in
different places and possibly what could work at BDH.
3.2.1 Activities of Subjects
Each staff category also had different cycle start and stop points. This is due to the
nature of each type of job. Circulating nurses deal exclusively with the patient, while the
other two staff types do not interact with patients while the patients are awake. Also
during this time, Value Stream Maps of each of the staff categories were created. These
were the current-state maps so that there is a visual and tangible comparison to the future
state of the process.
32
Circulating Nurse: The circulating nurse cycle starts when the nurse calls for a
turnover (overhead or through the pager system) after surgery (usually when the wound
dressing is being applied), and ends when the next patient enters the OR. The tasks that
were timed between those start and stop points can be seen in the value stream map (seen
later in the results section), and the tasks are described as follows:
1. Prepare patient to move from surgical bed to patient bed
2. Move patient to the bed (includes at least two other people due to patient
safety)
3. Walk the patient to PACU with the anesthesiologist
4. Hand-off the patient in PACU and leave when patient is stable
5. Paperwork for chart and implants
6. Leave PACU for OR and drop off implant paperwork on the way
7. Finish any charting for previous patient and prepare the room for the next
patient
a. Help surgical tech or OR aides if needed
8. Walk to Periop – to get the next patient
9. Find the chart (and room) of the next patient in periop
10. Read chart and prepare antibiotics, and any other medications indicated
11. Wait for patient to be available (varied and sometimes did not happen)
12. Patient interview (check patient identifiers, check procedure being performed
and where, hang antibiotics, give medication, put booties and hat on patient)
13. Take patient to the OR (includes goodbye for patient’s family members)
14. Check the patient off at OR desk
15. Take the patient to their assigned OR
Since patients are not allowed to eat after midnight the day before, surgeries start
early. Most nurses and techs start work at 6:30am in the OR, and they want the patient in
the room at 7:15am. Some staff members work 8-hour shifts, while others work 10-hour
shifts, so this means that most of the surgeries need to occur in that 8-10 hour time frame
before the cost of the staff goes up due to being “on-call.” That means the goal for all
scheduled surgeries is to finish by 3pm.
Surgical Technician: The surgical tech’s process starts when the circulating nurse
calls for a turnover and ends when the tech is done organizing their sterile table or when
33
the surgeon starts draping the patient. Once the patient is being draped, the surgical tech
does not have any more time to organize their table because the procedure is about to
begin. The process for surgical techs is as follows:
1) Get cart, or wait for the cart, to put dirty instruments that will go to sterile
processing
2) Load the cart from sterile field
3) Gather the trash and linen bags from the room
4) Take the cart and bags to the dirty elevator
5) Walk back to the operating room
6) Help clean (if needed)
All of the previous steps, including the whole room being cleaned, must be done
before the next case’s cart enters the room.
7) Get next case cart and sort supplies into what is needed for the surgery
8) Drape tables and open supplies (usually someone else helping)
9) Get headgear and scrub and gown (someone else required to close gown)
10) Organize the table and make room for sterile trays
11) Open sterile trays (two people required, one of them is the scrubbed in tech)
12) Helper searches for supplies still needed for case
13) Organize supplies and trays on table(s)
OR Aides: OR Aides do more than just clean the room, but for the turnover
process, they clean and help move the patient. More than just the OR aides clean the
room; other staff members who are not assigned to the room help where necessary. The
process starts when a turnover is called (overhead or by the paging system), and ends
when the last person cleaning/prepping leaves the room. The observer timed past the
point when the last aide or helper left the room because sometimes they were called back
in to get something from the store or supply room. The OR aide tasks are as follows:
1) Bring the bed into the OR to move the patient to
2) Get warm blankets and prepare the patient to be moved
3) Move the patient (requires at least three people, usually includes nurse and
anesthesiologist)

34
The next steps are in no particular order because there is no set method or procedure
for cleaning the rooms after a surgery. There are precedence to some tasks, but not
always followed.
4) Throw away old breathing circuit
5) Gather linens
6) Pick up trash
7) Clean lights
8) Clean bed
9) Clean “silver” (clean the tables, mayo stands, trash and linen holders, and
surgical bed bottom
10) Clean wires for anesthesia
11) Check /change/clean the Neptune (A suction and reservoir device for fluids)
12) Get the mop
13) Mop (including moving the bed and tables out of the way)
14) Put the mop away (Includes taking the old mop head off and putting a new
one on for the next person.)
15) Change the bed (needed for only 2 out of the 12 observations)
16) Put a new breathing circuit and prepare the wires to be used for anesthesia
17) Get bedroll (includes all sheets and trash bags needed for the room) – this is
not supposed to be in the room until mopping is finished and must be completed
before sterile supplies can be opened
18) Drape the bed, arm boards, put bags in trash, bag for linens
19) Do a final check on the room
a. Circuit
b. Suction
c. Bed locked
d. Neptune
e. Kick buckets have bags
f. Sharps containers not full
3.3 Materials
The materials needed for this study were:
- The hospital’s database;
- Scrubs, masks, surgical caps, and a locker to the researcher;
- A stopwatch; and
- The university’s computer.

35
3.4 Experimental Procedure
This study got approval from the Montana State IRB before starting the
observations. The proposal also doubled as the IRB proposal. The IRB approval may be
seen in Appendix A. The researcher was required to train for HIPAA and NIH and sign a
confidentiality agreement at BDH, as seen in Appendix B. Each staff member also had to
sign consent forms as “subjects” participating in the research – this is also in Appendix
A.
3.4.1 Observation
Observation is the most important step in learning the processes and the details of
interactions and communication. Every process requires some sort of observation, but
learning the operations of the OR is a very complex process and required a significant
amount of time. Observation occurred between the months of September through
November. However, before starting observation in the operating room training was
required. The training took about 2 days to make sure that the observer did not interfere
with sterile fields or general operations.
Bozeman Deaconess Hospital has a database which tracks several measures for
the Operating Room Department. The data collected in the hospital’s database is in
integers, and the time manually collected was with a stop watch with two decimal places.
The times needed for this research were the historical data for turnarounds without
delays. Delays occur when a surgeon can only be at the OR at a specific time, holding up
an OR room, or if an extreme circumstance occurs creating a longer than normal delay
36
between surgeries (e.g. patient tests are delayed, a patient did not show up, or equipment
failure in the OR). Each surgery for the months of August through January was entered.
The delays were counted as outliers and were not included in the final turnaround times.
Each surgery is performed by at least one surgeon, and the turnaround times were
calculated for each surgeon. This was indicated by a surgeon performing multiple
surgeries in a row. If a surgeon performed the first surgery and the second was followed
by a different surgeon, this was not counted as a turnaround for either surgeon. This
created less data points for certain surgeons, but for the most part the surgeons had
enough surgeries back to back to have adequate turnaround times. Some medical groups
share a time block and go after one another frequently which causes different
circumstances than when individual surgeons have a block. Therefore, the turnarounds
for medical groups were also calculated in the same manner.
In order to collect accurate data for this research, one type of surgery was to be
chosen; later on the test was to be done on a second type. Most people claim that each type
of surgery is different, so the rationale behind choosing one type of surgery is to eliminate
the variability of the turnovers in the study. The type of surgery to choose needed to occur
often enough that it was easy to collect data. This would allow more standard observations
when taking data, and a place to start with implementations.
The seven types of surgery which are performed at BDH are: dental, ENT,
general, GYN, orthopedics, spine, and urology. Orthopedic cases which had a total knee
or hip arthroplasty (also known as totals or replacements) and revisions were chosen.
This was chosen due to the amount of instruments in use and the frequency of
37
occurrence. These types of surgeries occur at least ten times a week by multiple surgeons.
There are five surgeons who perform these procedures, two of which perform total knee
and hip procedures exclusively. The second type of surgery chosen was “general”.
However, due to the common characteristics of the turnovers, after the initial tests were
done on totals the next step was to implement the changes in all types of surgery.
The commonalities of the turnovers are mainly due to the tasks which need to be
done, while the differences are mainly on the type of equipment and bed configurations.
Focusing on the general tasks instead of the specifics allowed the standard procedures to
be transferable between surgery types. Every turnover has:
- Taking the patient to PACU
- Cleaning/picking up the instruments from the case and taking them to the dirty
elevator;
- Picking up the trash and linens, separating them, and taking the bags of each
to the dirty elevator;
- Cleaning of the room – which came down to about 12 tasks, to be discussed
later;
- Setting up the room’s equipment and sterile field and instruments;
- Prepping for the next case; and
- Retrieving the next patient
After finding the commonalities, a flow map was created to show the staff and ask
for input on whether the researcher fully understood the process. This map was displayed
for over two weeks to allow the staff adequate time to review it due to the small time
frames they have throughout the day.
Each of the three categories was observed individually so that when the timing
phase of data collection occurred, there would be minimal surprises. This individual
observation occurred on different days throughout week due to different types of surgery
being scheduled on different days.

38
Each 8-10 hour block is appointed by a scheduler in the OR department. The
database kept by BDH keeps track of how long each surgery done by each surgeon takes.
This is tracked by both patient in-room time, and incision-to-close time. Surgeries are
scheduled according to the moving average of the last five surgeries done by that
particular surgeon. The scheduling program also has specific time frames for each type of
surgery and how long turnovers should take. The surgeries and turnovers create all of the
time used in the OR; from those numbers a schedule can be create. The scheduler and
charge nurse then move the patients around within the days due to age, acuity,
complexity, and difficulty. Age is a determining factor because small children do not do
as well not eating for as long, so the youngest patients are usually placed first for each
OR. For the most part, if a surgery is not as predictable as another in the same OR block,
then it will go last to avoid holding up other cases. Non-predictable cases are ones such
as total hip arthroplasty revisions, where they need to possibly re-do the entire surgery or
have to fix something that has gone wrong. During the time the researcher was at BDH,
there were some recalls on some hip implants which required replacing implants in the
patient with possible infections. Thus increasing the number of complicated/non-
predictable cases.
Along with travelers input about other hospital setups, the researcher visited two
other hospitals’ ORs. One was in Indianapolis in September 2011. This hospital has 31
ORs with 5 cores, each group of ORs on a core was used for different specialties. The
surgery types observed were cardiac and ENT. They asked how BDH works and
explained how theirs worked. Both hospitals worked very similarly in that their staff also
39
has to clean up the rooms between each case, and the schedule only allows a certain
amount of time – which is not known how that number was come up with.
The turnovers were also very similar to BDH:
- The staff members also had communication issues, so things got cleaned
multiple times or minimally.
- They used disinfecting wipes instead of bottles of cleaner and towels.
- The linens and trash bags for the rooms were in a cabinet in each room instead
of in the core.
- Their mops were completely dry and became wet in the room instead of
tracking a wet mop across the floor prior to entering the OR.
The other hospital visited slightly bigger hospital in Montana in April. The OR
was claiming 24 minutes for total knee cases, and needed to find out if it is true and how
they did it if it was. They did have the turnover time they claimed, but had more help than
BDH is able to have – two nurses and two techs per room. However, the surgeon did not
have a PA, requiring the second tech, and the second nurse was not in the room the whole
time.
During the surgery, the patient was handed off at least three times between the
two nurses so that the primary circulator could take a break, see the next patient, and stay
in the room while the other nurse took the patient to PACU. Handoffs have been a proven
spot to miss information and lose track of certain details, so this might not be the safest
practice for the patient (Mikos, 2007; Dais et al., 2007).
During the turnover, the two techs cleaned up their trash and instruments, the
nurse helped turnover patient related materials, a separate person came in and took care
of all of the anesthesia equipment, and one other helper was mopping. This is mainly due
to the rush to get the next patient may have caused not as through cleaning. However
when it comes to patient safety, there should be special care taken to make sure no

40
contamination is left from the previous patient. Like some staff members at BDH say,
“clean it like your mother is going to be the next patient.” This hospital gave respect as to
how safe the staff at BDH are and how they care for their patients.
3.4.2 Timing
After the observation period, timing of the tasks occurred from mid-November
through early February. The timing observations were done with the same person and
stopwatch throughout all staff categories. The order of timing the staff categories is 1)
circulating nurse, 2) surgical tech, 3) OR aides. This order of observing was due to the
number of staff being observed the same time. The people in an operating room during
the turnaround time are:
1. One circulating nurse per OR,
2. One surgical tech with one helper some of the time, and
3. OR aides range from 1-3 at a time. Also, anyone who is available can help
clean, so there could be up to 5 people to observe at the same time.
The number of staff being observed simultaneously creates difficulty in accurate
timing, thus the most difficult (OR aides) was saved for last. However, the OR aides were
also the most observed initially, therefore their actions were more predictable. It should
be noted that there could have been an effect on the staff’s behavior, known as the
Hawthorn effect (Freivalds, 2009), which had the potential to observe faster times. The
observer was in the department for a long enough time that this effect should be
negligible. However, if any behavior modification occurred during timed observation, the
time was thrown out.
Another reason for separately timing is due to the fact that each staff type have
different cycles and start/stop points. However, the times that have different start and stop
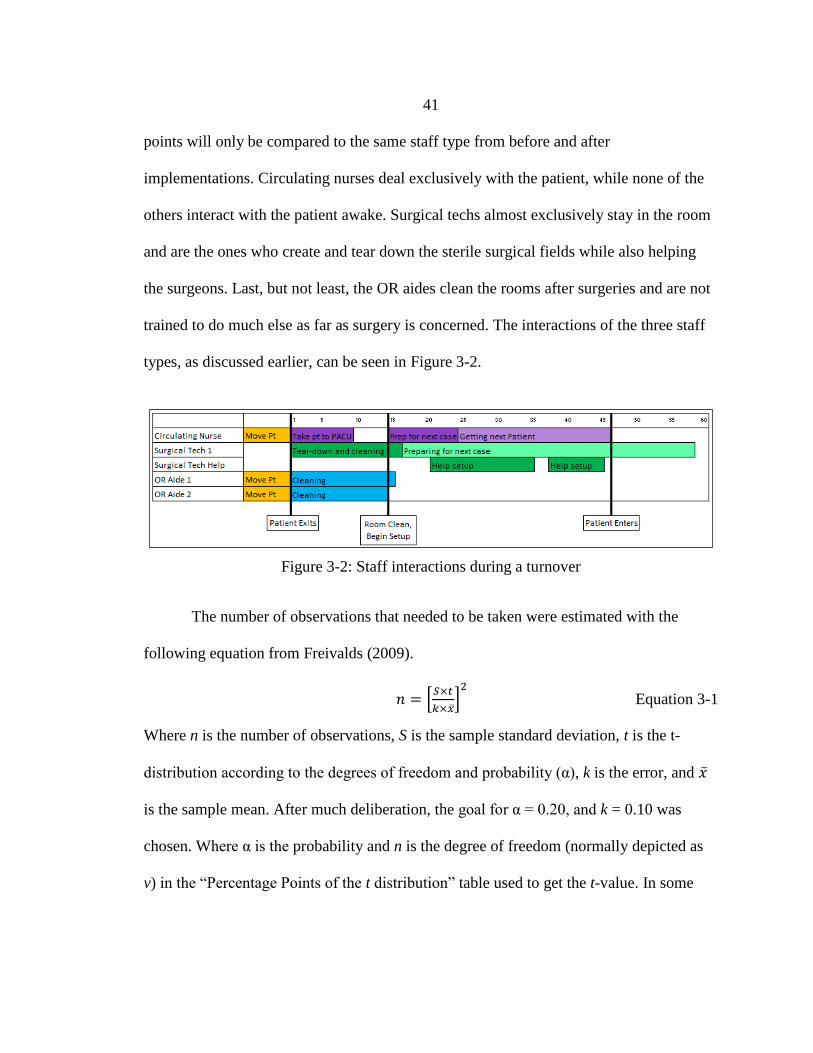
41
points will only be compared to the same staff type from before and after
implementations. Circulating nurses deal exclusively with the patient, while none of the
others interact with the patient awake. Surgical techs almost exclusively stay in the room
and are the ones who create and tear down the sterile surgical fields while also helping
the surgeons. Last, but not least, the OR aides clean the rooms after surgeries and are not
trained to do much else as far as surgery is concerned. The interactions of the three staff
types, as discussed earlier, can be seen in Figure 3-2.
Figure 3-2: Staff interactions during a turnover
The number of observations that needed to be taken were estimated with the
following equation from Freivalds (2009).
[
]
Equation 3-1
Where n is the number of observations, S is the sample standard deviation, t is the t-
distribution according to the degrees of freedom and probability (α), k is the error, and
is the sample mean. After much deliberation, the goal for α = 0.20, and k = 0.10 was
chosen. Where α is the probability and n is the degree of freedom (normally depicted as
v) in the “Percentage Points of the t distribution” table used to get the t-value. In some
42
cases, discussed later in each staff type, these numbers were smaller due to less deviation
in the observation times.
Circulating Nurse: The circulating nurse cycle starts when the nurse calls for a
turnover (overhead or through the pager system) after surgery (usually when the dressing
is being applied), and ends when the next patient enters the OR.
Seven nurses were observed, and the number of observations performed to be
statistically viable is 9.08 with α=0.15 and k=0.1. The entire process ranged from 35.53-
61.91 minutes, which means that the data collection process takes a lot of time.
Therefore, 10 observations were used.
Freivalds (2009) also give suggested number of observations for different cycle
times. According to the CRN cycle time of 42.47 minutes, “20-40 minutes” should have
5 recorded observations and “40+ minutes” requires 3 recorded observations. Therefore,
only 3 observations are required, but 10 recorded observations were taken. Figure 3-3,
below, shows the calculations in Excel for the number of observations required.
Along with a value stream map, spaghetti diagrams were created by following the
nurses and others involved in setting up the rooms for the next case. These diagrams
show how much extra walking is involved in the room setup and how much work they
were doing. The setup for the day and a turnover were documented in the diagrams, seen
below in Appendix C.
Although these diagrams show a lot of required walking, they allowed the
observer to see how many extra tasks (non-nurse related) were being performed by the

43
nurses. Also the fact that other staff were available and around during the time that nurses
were doing these tasks. The timing and diagrams were done between 11/8/11 – 12/13/11.
Figure 3-3: CRN observation times
Meeting: The meeting with the nursing staff took place in April before the start of
the day at 6am, so the participation was small – 4 nurses. However, they are ones that
have good attitudes towards change and are respected among the staff. The goal was to
discuss items in the value stream map: show waiting time in periop, if there can be some
sort of signal for when the patient is ready to get from periop, searching for the patient’s
chart in periop, and setup time in the room; and discuss options about who is supposed to
do what in the room during turnovers.

44
They decided that there should be a facilitating role created where a second nurse
comes into the room during a turnover, especially while the circulating nurse is taking the
patient to PACU, to help with the nursing aspect of turning over a room. These extra
nurses are assigned to more than one room to help specifically for turnovers and related
activities. This included having equipment ready outside the room to take in after the
room was clean, to help eliminate searching and walking to and from the equipment
storage room during the turnover. This is referred to as moving internal activities to
external so eliminate time during the internal turnover (Shingo, 1989). During the
turnover, this facilitating nurse would help with items like changing the Timeout board,
getting rid of previous patient identifiers, and pulling meds from the omnicell if not
pulled already. The overall goal of using a facilitating nurse is to allow the circulating
nurse to not have to worry about the room and only worry about the patient aspect of the
turnover.
One of the problems with the facilitating role is that it requires an extra person for
a specified number of rooms, and due to staffing patterns and case load it is sometimes
hard to have extra nursing staff. The other complication with the facilitators was how
many nurses per room should be assigned: 3 nurses to 2 rooms or 4 nurses to 3 rooms. It
was decided that due to the load of the type and number of cases, it would be best if 3
nurses were assigned to 2 rooms. However, it was rare to have that many nurses extra.
Many of the staff members have worked in different hospitals and mentioned
multiple times that they had more untrained (non-nursing/registered) staff who knew how
to set up equipment and rooms. They suggested that instead of having another nurse
45
come in and help, the OR department should have more aides to help with the equipment
changeover. The problem with that idea is that the aides are usually pre-med students
who are waiting to get into med school, and are different every year. In conversations
with the management, they had no problem with this type of job and would be willing to
help train them every year because it might be more effective and cheaper. Nurses make
anywhere from $24-30/hour, while aides cost about $11/hour.
After some analysis, the following tasks were identified to what tasks should be
done by the facilitator:
Prior to Turnovers:
- Prepare Equipment needed for the next case
- Get details if necessary for next case (e.g., setup of room)
During Turnovers:
- Prepare the room for the next case, such as:
o Timeout board
o Get meds from omnicell
o Bed configuration/positioners
o Irrigation
o Help open supplies and trays for next case with facilitating
surgical tech
o Perform counts with surgical tech
- Help clean – if no aide available
General tasks:
- Clean and put away unneeded equipment from the previous case
- Breaks/lunch during surgery
- Facilitate for multiple rooms (2—3) at a time
Surgical Technicians: The surgical tech’s process started when the circulating
nurse calls for a turnover and ends when the tech is done organizing their sterile table or
when the surgeon starts draping the patient. Once the patient is being draped, the surgical
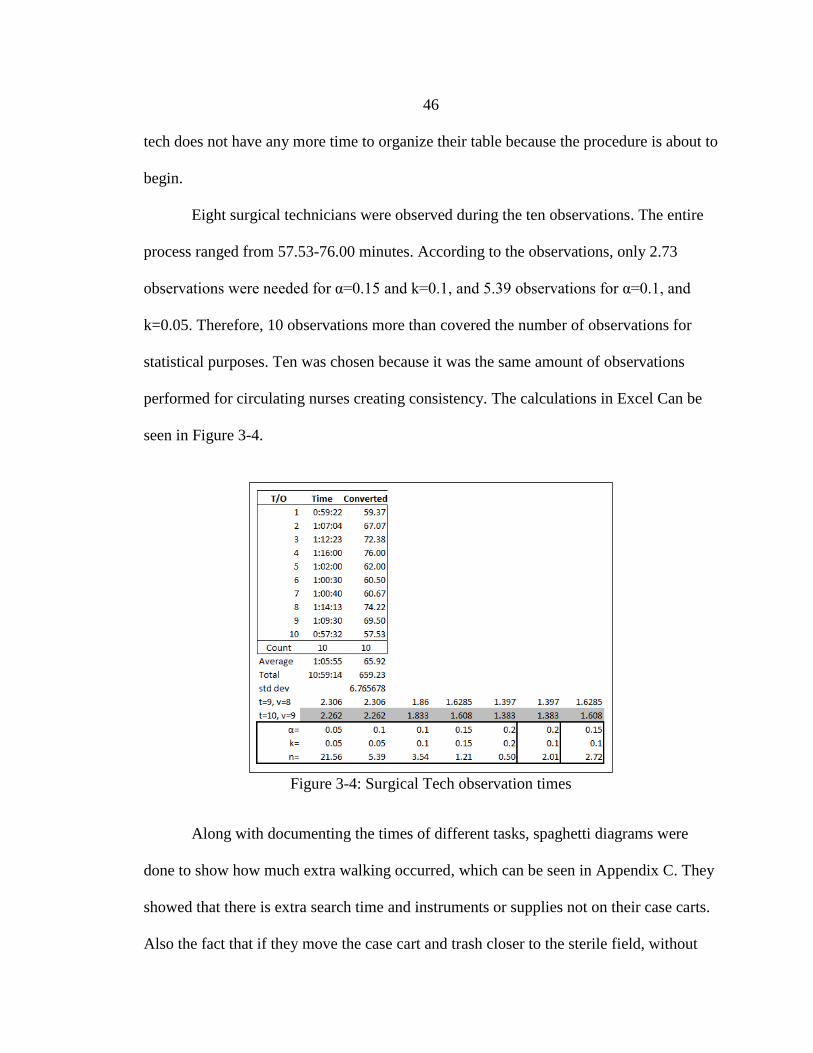
46
tech does not have any more time to organize their table because the procedure is about to
begin.
Eight surgical technicians were observed during the ten observations. The entire
process ranged from 57.53-76.00 minutes. According to the observations, only 2.73
observations were needed for α=0.15 and k=0.1, and 5.39 observations for α=0.1, and
k=0.05. Therefore, 10 observations more than covered the number of observations for
statistical purposes. Ten was chosen because it was the same amount of observations
performed for circulating nurses creating consistency. The calculations in Excel Can be
seen in Figure 3-4.
Figure 3-4: Surgical Tech observation times
Along with documenting the times of different tasks, spaghetti diagrams were
done to show how much extra walking occurred, which can be seen in Appendix C. They
showed that there is extra search time and instruments or supplies not on their case carts.
Also the fact that if they move the case cart and trash closer to the sterile field, without

47
breaking the sterile field, they will do less walking. This was an eye opener for most of
the surgical tech staff to see how inefficient they were being.
OR Aides: OR Aides do more than just clean the room, but for the turnover
process, they clean and help move the patient. More than just the OR aides clean the
room; sometimes nurses or surgical techs who are not assigned to the room help their
perspective type of staff first, then help clean the room. The process starts when a
turnover is called (overhead or by the paging system), and ends when the last person
cleaning/prepping leaves the room. The observer timed past the point when the last aide
or helper left the room because sometimes they were called back in to get something
from the store or supply room.
The times were taken between 1/23/12 – 2/6/12. As seen in Figure 3-5, if the
same α and k values from nurses and surgical techs are used the number of observations
is 13.79, but if the k value is changed just a little the number of observations goes down.
The length of time also came into play for this decision because the total time for this
process ranged from around 13.55 minutes to over 30 minutes. According to Freivalds
(2009), if the cycle time for a process is between 10-20 minutes the recommended
number of cycles for data collection is eight. Therefore, it was decided to do 12 timed
observations.
Four of the five OR aides plus at least 5 other staff members (nurse or surgical
tech) were observed cleaning and performing OR aide duties during the turnovers. The
number of people in the room ranged from 1-5 depending on availability for the turnover
because multiple turnovers can occur at the same time. The fifth OR aide was not
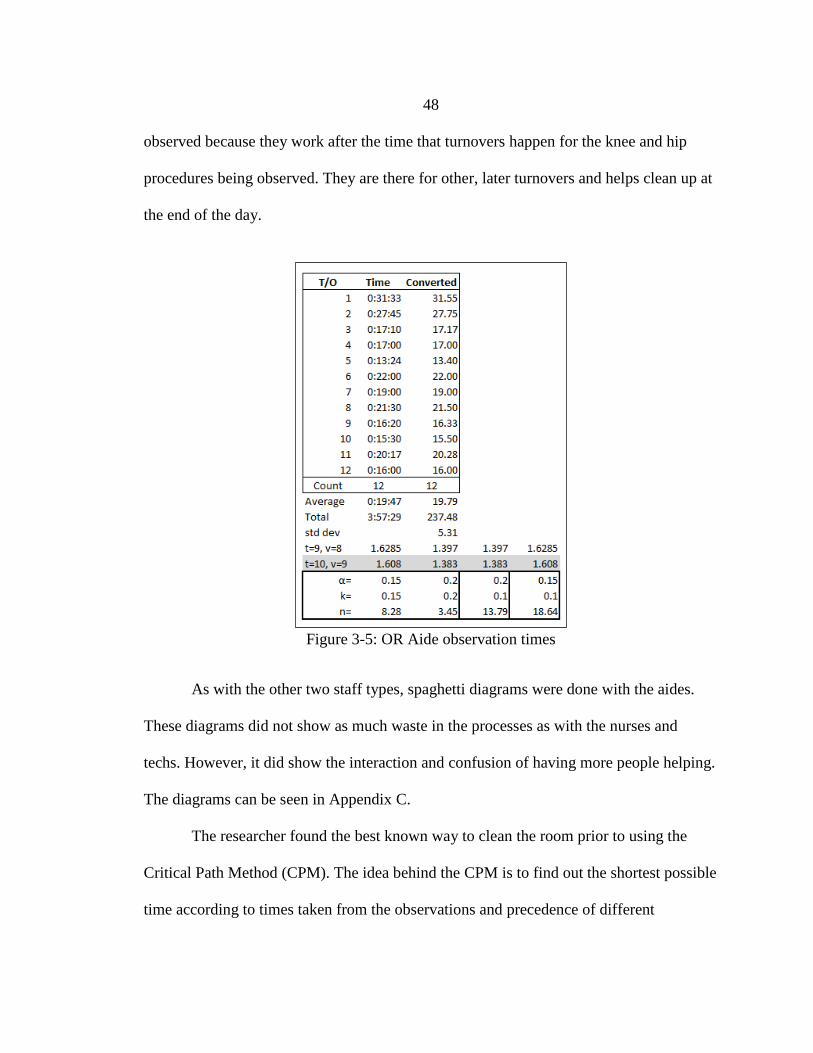
48
observed because they work after the time that turnovers happen for the knee and hip
procedures being observed. They are there for other, later turnovers and helps clean up at
the end of the day.
Figure 3-5: OR Aide observation times
As with the other two staff types, spaghetti diagrams were done with the aides.
These diagrams did not show as much waste in the processes as with the nurses and
techs. However, it did show the interaction and confusion of having more people helping.
The diagrams can be seen in Appendix C.
The researcher found the best known way to clean the room prior to using the
Critical Path Method (CPM). The idea behind the CPM is to find out the shortest possible
time according to times taken from the observations and precedence of different
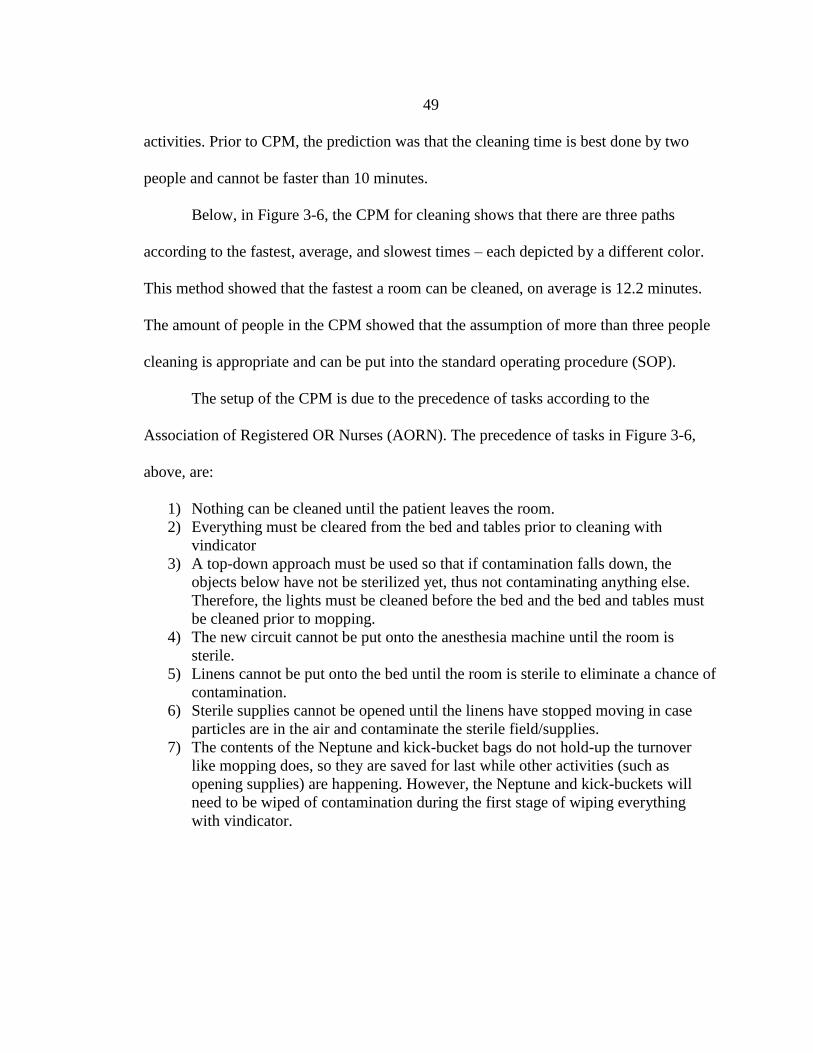
49
activities. Prior to CPM, the prediction was that the cleaning time is best done by two
people and cannot be faster than 10 minutes.
Below, in Figure 3-6, the CPM for cleaning shows that there are three paths
according to the fastest, average, and slowest times – each depicted by a different color.
This method showed that the fastest a room can be cleaned, on average is 12.2 minutes.
The amount of people in the CPM showed that the assumption of more than three people
cleaning is appropriate and can be put into the standard operating procedure (SOP).
The setup of the CPM is due to the precedence of tasks according to the
Association of Registered OR Nurses (AORN). The precedence of tasks in Figure 3-6,
above, are:
1) Nothing can be cleaned until the patient leaves the room.
2) Everything must be cleared from the bed and tables prior to cleaning with
vindicator
3) A top-down approach must be used so that if contamination falls down, the
objects below have not be sterilized yet, thus not contaminating anything else.
Therefore, the lights must be cleaned before the bed and the bed and tables must
be cleaned prior to mopping.
4) The new circuit cannot be put onto the anesthesia machine until the room is
sterile.
5) Linens cannot be put onto the bed until the room is sterile to eliminate a chance of
contamination.
6) Sterile supplies cannot be opened until the linens have stopped moving in case
particles are in the air and contaminate the sterile field/supplies.
7) The contents of the Neptune and kick-bucket bags do not hold-up the turnover
like mopping does, so they are saved for last while other activities (such as
opening supplies) are happening. However, the Neptune and kick-buckets will
need to be wiped of contamination during the first stage of wiping everything
with vindicator.
50
Figure 3-6: CPM for original cleaning method
A modified version of the critical path for cleaning, seen in Figure 3-7, assumes
that nothing can start until all of the trash and linens are taken off of the items needing to
be cleaned. It also shows more clearly that if four people were cleaning, there would not
be enough for the fourth person to do according to the precedence of tasks.
Meeting: In February, the researcher met with the OR aides and SPD manager
who is also in charge of the aides. The meeting took place in an OR so that everyone
could see what was being discussed and give ideas. The spaghetti diagrams and the value
stream map were discussed with the five aides. They also discussed work areas in the OR
so that they could start thinking about how to split up tasks without getting in each
other’s way.
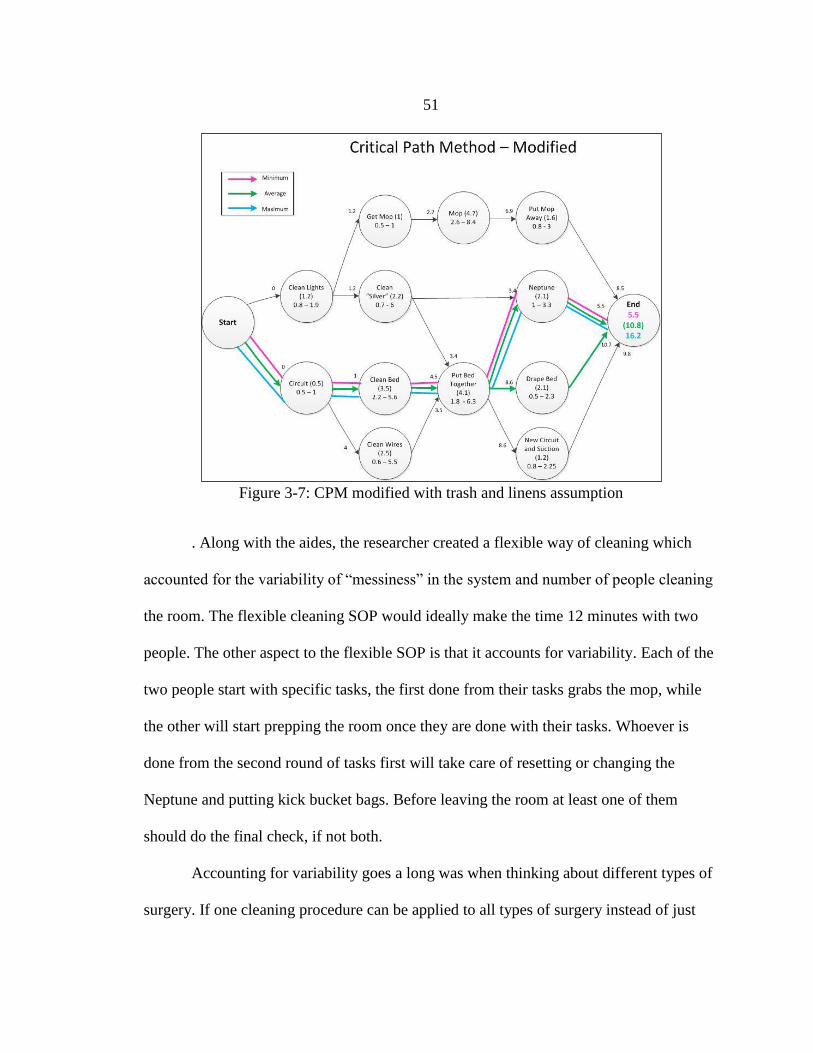
51
Figure 3-7: CPM modified with trash and linens assumption
. Along with the aides, the researcher created a flexible way of cleaning which
accounted for the variability of “messiness” in the system and number of people cleaning
the room. The flexible cleaning SOP would ideally make the time 12 minutes with two
people. The other aspect to the flexible SOP is that it accounts for variability. Each of the
two people start with specific tasks, the first done from their tasks grabs the mop, while
the other will start prepping the room once they are done with their tasks. Whoever is
done from the second round of tasks first will take care of resetting or changing the
Neptune and putting kick bucket bags. Before leaving the room at least one of them
should do the final check, if not both.
Accounting for variability goes a long was when thinking about different types of
surgery. If one cleaning procedure can be applied to all types of surgery instead of just
52
one or two types, that would be of great help to everyone both time and remembering
what to do.
The researcher also wanted to make sure that there was a final check prior to
leaving the room so that there was a way to catch a mistake before setting up for the next
case. The key items that need to be checked are: circuit on and working, suction
available, bed locked, Neptune, kick bucket bags, and sharps containers not full. These
are key things that will hold up a case if not done, and can be large patient safety issues.
3.4.3 Experiment 1: Level of Detail
After a flexible cleaning SOP was created by the aides, an experiment on micro
vs. macro was performed. The researcher came up with a visual representation of the
standard procedure so that everyone would be able to read it. As discussed earlier, two
versions of the procedure were created for the level of detail the experiment is testing.
The level of detail tested is the amount of pictures and words – macro vs. micro. Two
levels would be the best, to help avoid bias. If the aides were performing the same tasks
multiple times, regardless of complexity, they were going to learn throughout the first
one and will be better at the ones which follow. Experiment 1 will test hypothesis 1.
Micro-level – Many pictures and a descriptive narrative of tasks in the procedure.
Macro-level – Minimal pictures and as little words/phrases as needed.
Testing the Level of Detail: The improvements suggested from the timing data
and observations are problems throughout the OR department and not related to just one
53
type of surgery. Therefore, the historical turnover data and future turnover data will apply
to all surgeries instead of just total knee and hip arthroplasty and revisions.
Testing the two levels starts with the OR aide cleaning process. It is currently a
process with large variation, but not all variation is due to the cleanliness of the room. A
standard procedure which optimizes the cleaning steps is created and verified by the OR
aide staff and the written procedure will be created by the researcher. The procedure will
be written in the two levels of detail discussed.
There were five OR aides, and two pairs work together most often. This is due to
the times that they are schedule to work. The aides work a staggered schedule working
for an 8-hour shift starting at: 6:30am, 8am, 10am, 12noon, and 2pm. The two groups
identified for improvement are the 6:30am, 8am, and 10am aides; and the second are
the12noon and 2pm aides. A pair is used in the written procedure because a critical path
analysis of the times of each cleaning activity showed that three people would be optimal
for cleaning, but two is more realistic for the work environment.
The micro-version of the procedure is in Figure 3-8 and the macro in Figure 3-9.
The pictures for the procedures were taken during actual turnovers. Permission was given
by the OR managers and staff to take the pictures needed as long as they did not show
any patient identifiers or patients. The two procedures were designed for 11”x17” paper
to allow details to be viewed.
While creating the written part of the standard procedure, other aspects of the
turnover are analyzed to see where time can be reduced. Some of the items identified
were:
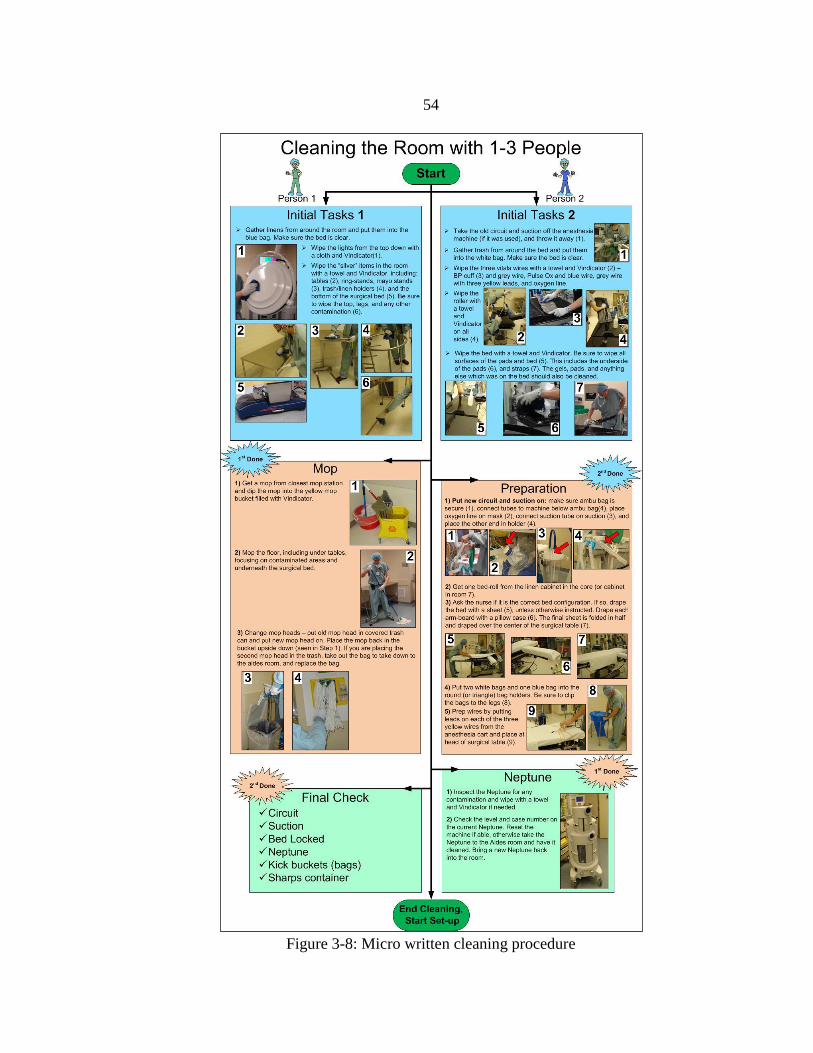
54
Figure 3-8: Micro written cleaning procedure
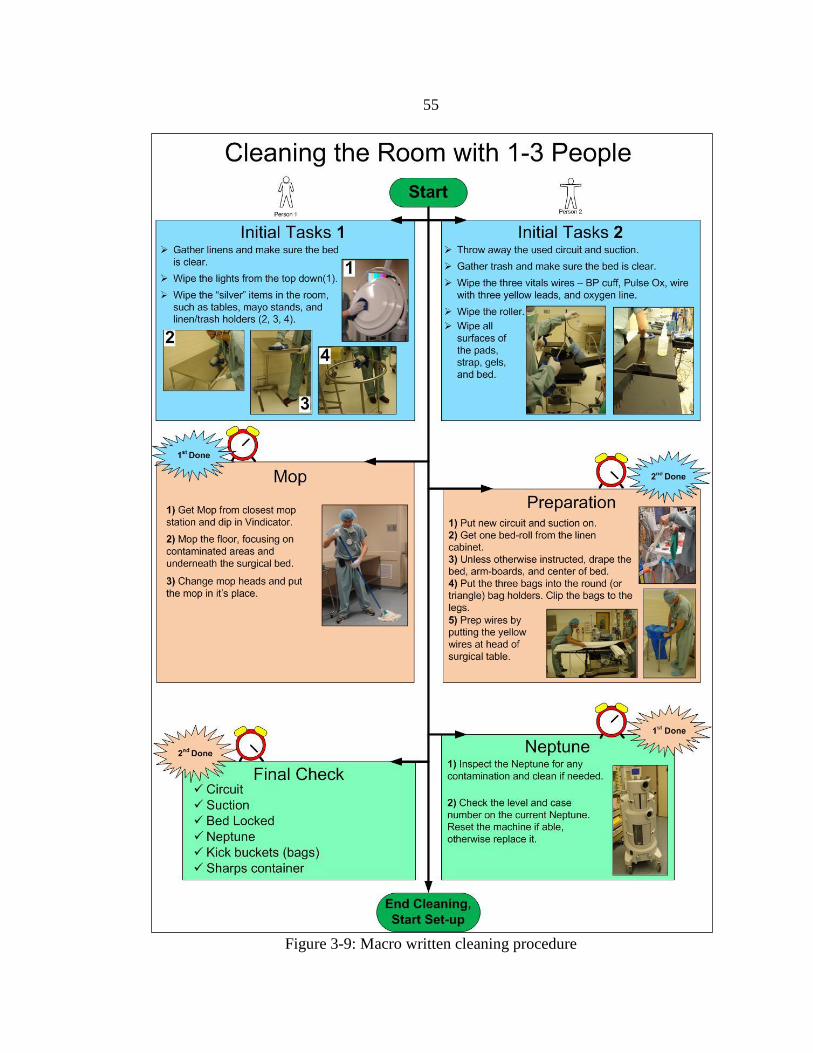
55
Figure 3-9: Macro written cleaning procedure

56
1. The surgeons are taping positioners to the bed which need to be removed during
the turnover. Depending on how much tape, it can take anywhere from 30seconds
to a few minutes. The tape residue can also build up on the positioners and on the
bed which has to be cleaned periodically. The time that it takes to remove the
residue is also costing the OR department with time. When it comes down to it,
they are spending anywhere form $33-$132 to remove tape per turnover plus the
cost of the aides to clean to clean the residue from positioners and beds.
2. The cleanliness of the surgeons and PAs affects how long it takes to clean and
decontaminate the room. Some messes are unavoidable due to the type of surgery,
but various surgeons and PAs do things that make the clean-up harder. If these
individuals were to pay attention and appreciate the fact that if they are making a
larger mess, it directly affects their own turnover times.
3. There is a small pad that goes on the OR bed which is sometimes taken out for
different surgeries. During turnovers which require the pad to be in the bed, the
staff was looking for it for 1-3 minutes each time they needed it. This was costing
the OR $33-$99 each turnover, multiple times a day. The suggestion was made to
get some more, since there were not enough for all of the beds.
The experiment to test the adherence for different levels of detail started with
three aides, still hoping to get the other two who are on the later shifts. The first group
will be given the macro written procedure and will perform it on a Monday and Tuesday
of the week for all procedures, but especially total hip and knee arthroplasty and
revisions. For the rest of the week, Wednesday-Friday, the staff was allowed to clean the
rooms as they had previously. The number of times was recorded because it was thought
that it might be an indicator of how difficult it was to remember the procedure.
The aides were allowed to look at the written flexible cleaning SOP as many
times as needed, and were given the rule that only two aides (no more, no less) were
allowed to clean the room at any given time. This rule was also told to the staff, which
had mixed reactions. The two-aide rule was to help show that the room can still be

57
cleaned quickly and efficiently with less people. Two days of testing with over 15
turnovers attempted were timed.
The adherence was measured by using a checklist for each turnover in both the
macro and micro tests, as seen in Appendix D. An X represented the correct aide doing
their task, a circle around the box meant that the other aide did the task, a circle with an X
() indicates that both aides performed the task, partially done was indicated as X with
“partial” written, and nothing means that it was not performed. When analyzing the
adherence, two methods were used for both the micro and macro tests.
Method 1 – Scoring the adherence was done by awarding points to the individual
aides’ tasks according to what they performed. Then, both point totals were combined to
create the total turnover score. This was done so that if a task was not required to be
performed, it was not counted, and if the task was done but by another aide, the task was
still given some points. The scoring method point breakdown is:
X = 4 points
= 3
= 2
Nothing = 0
The total number of points divided by the total possible number calculated the score as a
percentage. The intent behind scoring was that the importance of getting all the tasks
done for patient safety reasons was higher than who performed the task.
Method 2 – Yes or No adherence was scored according to if they did the task or
not. Each task for the individual aides was scored as a one or zero respectively. If the task
was fulfilled by the other aide, it did not count for the aide that was supposed to have
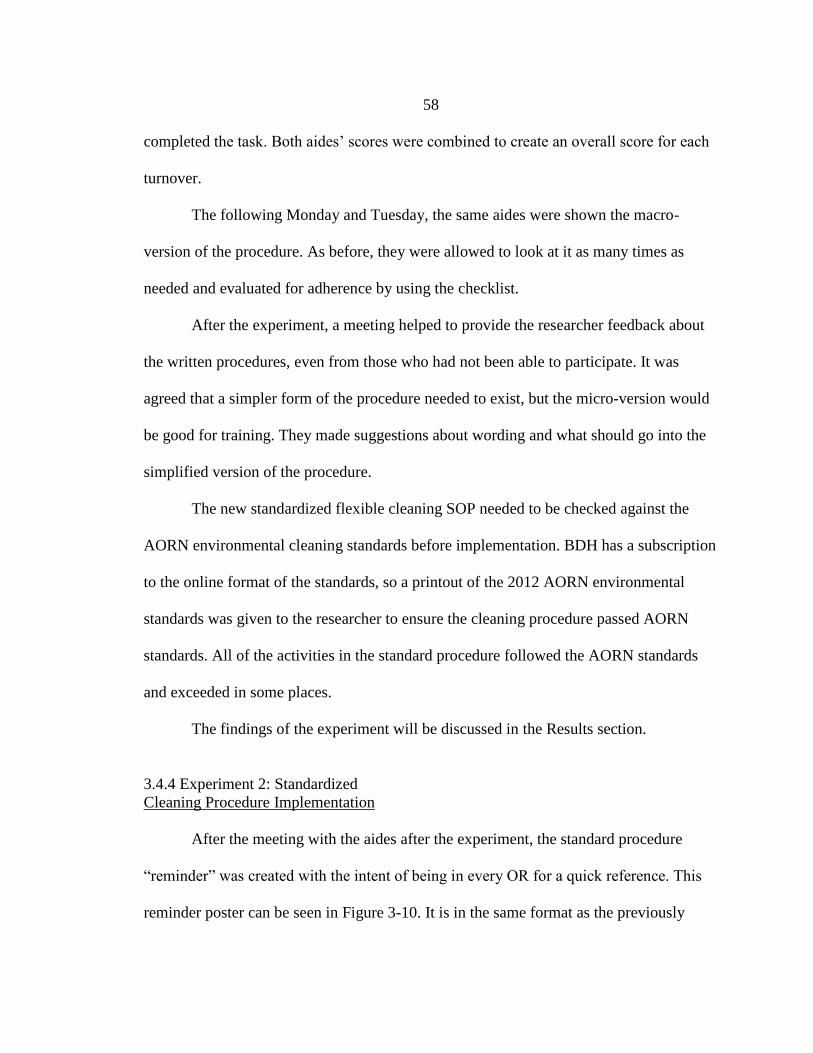
58
completed the task. Both aides’ scores were combined to create an overall score for each
turnover.
The following Monday and Tuesday, the same aides were shown the macro-
version of the procedure. As before, they were allowed to look at it as many times as
needed and evaluated for adherence by using the checklist.
After the experiment, a meeting helped to provide the researcher feedback about
the written procedures, even from those who had not been able to participate. It was
agreed that a simpler form of the procedure needed to exist, but the micro-version would
be good for training. They made suggestions about wording and what should go into the
simplified version of the procedure.
The new standardized flexible cleaning SOP needed to be checked against the
AORN environmental cleaning standards before implementation. BDH has a subscription
to the online format of the standards, so a printout of the 2012 AORN environmental
standards was given to the researcher to ensure the cleaning procedure passed AORN
standards. All of the activities in the standard procedure followed the AORN standards
and exceeded in some places.
The findings of the experiment will be discussed in the Results section.
3.4.4 Experiment 2: Standardized
Cleaning Procedure Implementation
After the meeting with the aides after the experiment, the standard procedure
“reminder” was created with the intent of being in every OR for a quick reference. This
reminder poster can be seen in Figure 3-10. It is in the same format as the previously

59
written procedures, but only used key-words and showed how a third person, if available,
would be able to help. Along with this reminder, the staff was informed that no more than
three people cleaning were allowed so that communication would increase and allow
others to do other tasks which they were more qualified for.
The times taken for both the before and after implementation are taken by the
researcher. The timeframe is from the time the patient leaves the room until the room is
clean, signified by the last aide who leaves the room.
The staff was informed as to why the decision of no more than three people
cleaning came into existence, and were educated on the actual cleaning procedure. The
current aides attempted to train the rest of the staff since they had created the cleaning
procedure. However, one of the problems with the aide position is that the people who fill
these positions are usually students who will be going on to med school or nursing school
the following year that they start, so they are the lowest, least respected position.
Along with the researcher teaching the new aides, the educator of the OR
department learned the flexible cleaning SOP and became very involved in the training
session. The educator is the person who normally trains the new employees, so she is
going to be one of the trainers for the cleaning procedure to all new staff members. The
other person helping with the cleaning and facilitator training will be the OR department
manager.
60
Figure 3-10: Cleaning procedure room reminder
61
3.4.5 Experiment 3: Nursing Setup
As mentioned above, in the timing section, the nurse’s times were taken for their
process – from the time the patient physically leaves the room until the next patient enters
the room. Part of their process includes setup (not including the setup of the surgical
tech), which is from the time they return to the room until they leave to get the next
patient. The times that will be compared for nursing setup are from the time the patient
leaves the OR until the nurse is able to go to periop to get the next patient. The time when
they are able to go and get the patient will be affected by the improvements for nurses
and the standardized cleaning procedure.
3.4.6 Experiment 4: Staffing Combinations
The turnover aspects for all three staff types were analyzed and improvements
started, but the optimal number of each type of staff member needed to be found.
According to the improvements done previously, a multi-activity swimlane chart was
created. It contains all of the staff members required to complete a turnover in an efficient
and effective manner, and it will be discussed later.
A new role for the staff was introduced in May which was called a “facilitator.”
One of the roles is a nurse facilitator where a nurse is assigned to rooms to help with
turnovers and assure that while the circulating nurse is gone, the room is being set up for
the next case. The other role is a surgical tech facilitator who is also assigned to help the
in-room surgical tech. These two roles should be used for every turnover to help move
faster and assure that certain activities are occurring due to each role being standardized

62
by assigning specific tasks. The two roles plus the cleaning tasks identified above should
be working together to efficiently and effectively turnover a room.
The goal from this point is to find how much the turnover can stray from the
swimlane chart and still be effective. In one sense, it is finding the adherence level, but
another way of looking at it is the staffing levels needed to have an effective turnover.
Seven people are needed to have a good turnover for a large case: three people cleaning
(according to the flexible cleaning SOP), one circulating nurse, one facilitating nurse, one
surgical tech, and one facilitating tech. Since one surgical tech and one circulating nurse
are required for a room, the notation will be [number of people cleaning] – [nurse
facilitator] – [surg tech facilitator]. For example, three people cleaning, one nurse
facilitator, and no surgical tech facilitator is: 3-1-0. Ideally, especially for large cases, the
combination of 3-1-1 should be occurring for every turnover. However, since the staff
available does not allow that, an acceptable combination needs to be found for
recommendation purposes.
Data needs to be taken to show how different combinations of staff members
participating during the turnovers affect the time. The times to be taken are:
1) Time the patient leaves the room;
2) Time done cleaning/next case cart enters (signifying that the room is clean
enough to start setting up);
3) Time the nurse leaves to get the patient from periop; and
4) The time the next patient enters the room.
As far as the data about type of staff, the number of staff in the turnover for three
categories will be documented: How many people help clean the room (and are they
following the cleaning procedure), if there is a nurse facilitator, and if there is a surgical
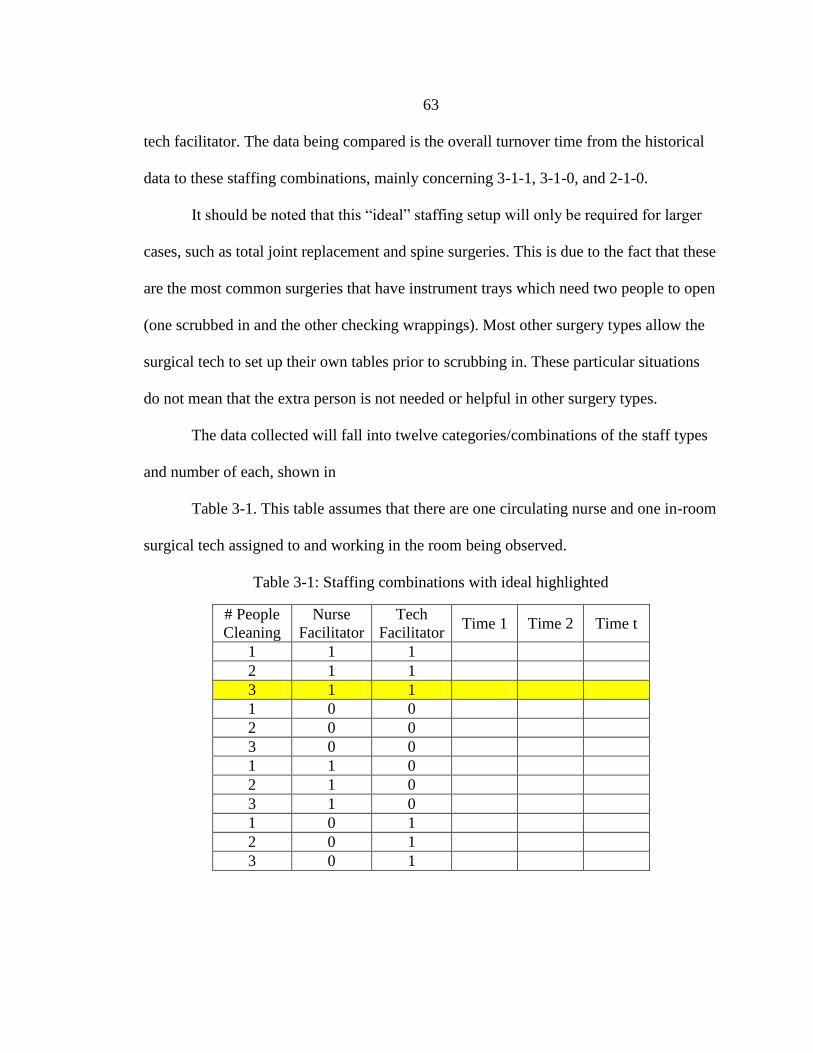
63
tech facilitator. The data being compared is the overall turnover time from the historical
data to these staffing combinations, mainly concerning 3-1-1, 3-1-0, and 2-1-0.
It should be noted that this “ideal” staffing setup will only be required for larger
cases, such as total joint replacement and spine surgeries. This is due to the fact that these
are the most common surgeries that have instrument trays which need two people to open
(one scrubbed in and the other checking wrappings). Most other surgery types allow the
surgical tech to set up their own tables prior to scrubbing in. These particular situations
do not mean that the extra person is not needed or helpful in other surgery types.
The data collected will fall into twelve categories/combinations of the staff types
and number of each, shown in
Table 3-1. This table assumes that there are one circulating nurse and one in-room
surgical tech assigned to and working in the room being observed.
Table 3-1: Staffing combinations with ideal highlighted
# People
Cleaning
Nurse
Facilitator
Tech
Facilitator Time 1 Time 2 Time t
1 1 1
2 1 1
3 1 1
1 0 0
2 0 0
3 0 0
1 1 0
2 1 0
3 1 0
1 0 1
2 0 1
3 0 1
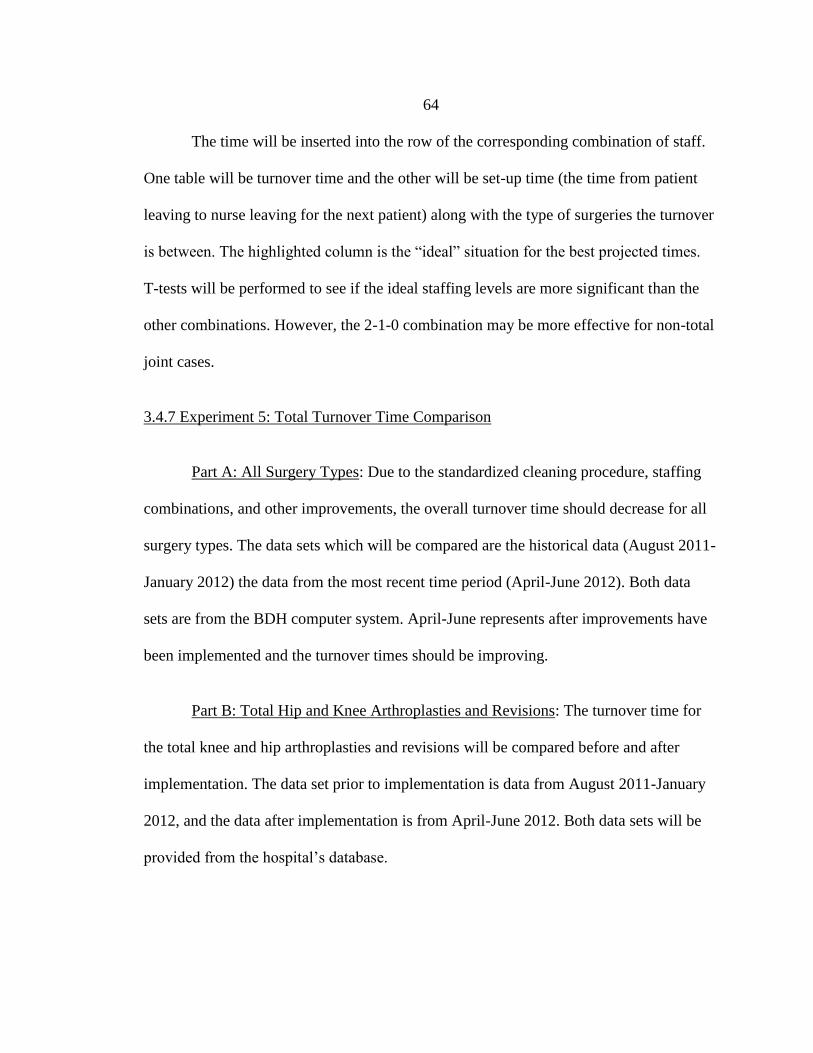
64
The time will be inserted into the row of the corresponding combination of staff.
One table will be turnover time and the other will be set-up time (the time from patient
leaving to nurse leaving for the next patient) along with the type of surgeries the turnover
is between. The highlighted column is the “ideal” situation for the best projected times.
T-tests will be performed to see if the ideal staffing levels are more significant than the
other combinations. However, the 2-1-0 combination may be more effective for non-total
joint cases.
3.4.7 Experiment 5: Total Turnover Time Comparison
Part A: All Surgery Types: Due to the standardized cleaning procedure, staffing
combinations, and other improvements, the overall turnover time should decrease for all
surgery types. The data sets which will be compared are the historical data (August 2011-
January 2012) the data from the most recent time period (April-June 2012). Both data
sets are from the BDH computer system. April-June represents after improvements have
been implemented and the turnover times should be improving.
Part B: Total Hip and Knee Arthroplasties and Revisions: The turnover time for
the total knee and hip arthroplasties and revisions will be compared before and after
implementation. The data set prior to implementation is data from August 2011-January
2012, and the data after implementation is from April-June 2012. Both data sets will be
provided from the hospital’s database.
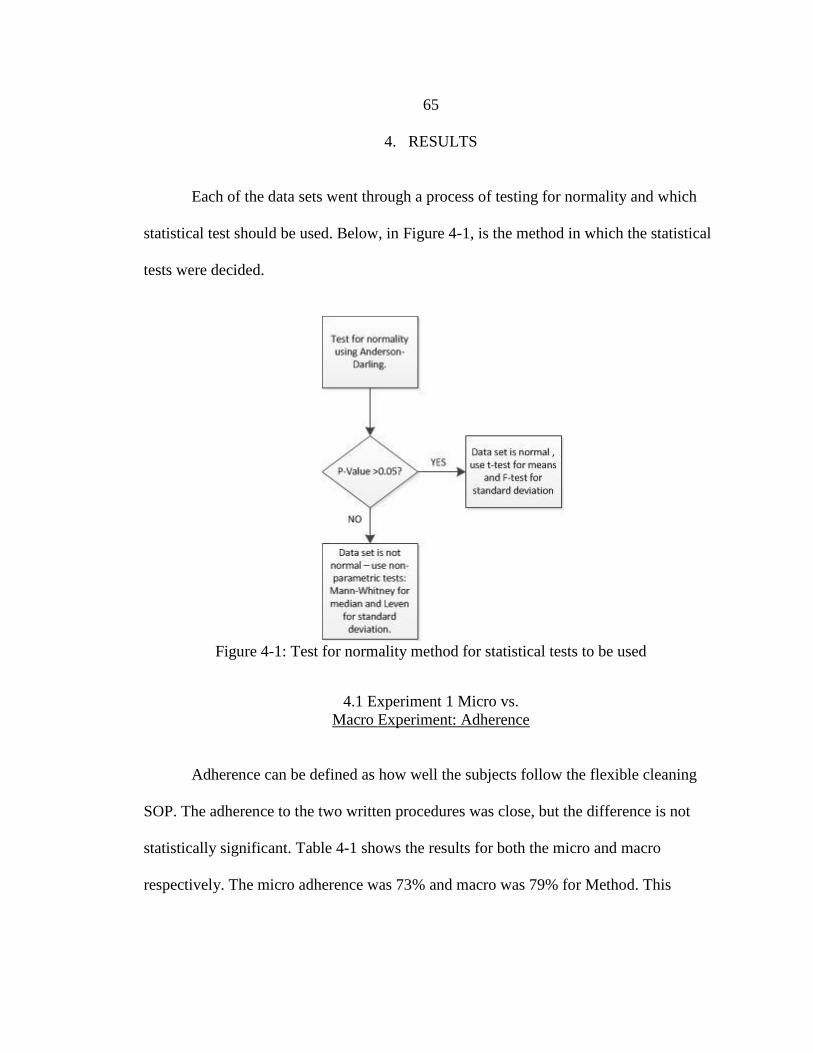
65
4. RESULTS
Each of the data sets went through a process of testing for normality and which
statistical test should be used. Below, in Figure 4-1, is the method in which the statistical
tests were decided.
Figure 4-1: Test for normality method for statistical tests to be used
4.1 Experiment 1 Micro vs.
Macro Experiment: Adherence
Adherence can be defined as how well the subjects follow the flexible cleaning
SOP. The adherence to the two written procedures was close, but the difference is not
statistically significant. Table 4-1 shows the results for both the micro and macro
respectively. The micro adherence was 73% and macro was 79% for Method. This
66
showed that the more classic way of measuring adherence showed more of a difference
between the two written procedures.
Table 4-1: Adherence Results
Avg
Time
Adherence
Method 2
Macro (minutes)
10.42 79%
Micro (minutes)
10.12 73%
4.2 Experiment 2: Old Cleaning
Method vs. New Cleaning Method
4.2.1 Hypothesis 2.1: Mean
The old cleaning method consisted of: how many people were available;
equipment in the room got cleaned many times or not at all, depending on the
communication; and getting help in the room was hard because no one really knew what
was happening as far as the cleaning or set-up process. Therefore, the benefit of
standardized work was allowing more communication with less people so that everything
got cleaned every time. These factors showed in the difference of the means of the old
and new cleaning methods. The P-Value is 0.197 which indicates that the methods are not
statistically different.
The value stream map, seen in Figure 4-2 is created from the observations and
timing. It shows the “current” state, or the now original state of the aides cleaning. The
cycle starts when a turnover is called and ends when the room is clean. The times used
for analysis are from the time the patient leaves until the room is clean. They now clean
67
using the flexible cleaning SOP, as discussed earlier, and is expressed in a value stream
map in Figure 4-3. It can be seen that the process is much more linear and less chaotic.
The value-added time decreases, but the non-value added time also decreases. Therefore,
the overall total time decreases, plus the standard deviation decrease due to the
standardized work.
4.2.2 Hypothesis 2.2: Standard Deviation
The importance of the flexible cleaning SOP improved the standard deviation which
decreased from 5.22 minutes to 1.93 minutes. This difference is statistically significant
with a P-Value of 0.001. This is one of the most significant finds which came from
creating flexible cleaning SOP and experiment.

68
Figure 4-2: OR Aide Current (or Original) State Value Stream Map

69
Figure 4-3: OR Aide Future (Implemented) State Value Stream Map
70
4.3 Experiment 3: Nursing Set-up
4.3.1 Hypothesis 3.1
Along with the flexible cleaning SOP, the nurse facilitator was a way of
standardizing part of the turnover by identifying which type of staff does what task. It
created some tension with trusting each other to set up ORs, but the fact that it helped
more than hindered kept them using the new role. Improvement was also noticed by a
few surgeons and anesthesiologists without fully knowing about the implementation of
the nurse facilitator.
The set up for the nurse is statistically different with a P-Value of 0.033. Nurse
setup is from the time the patient leaves the room until the nurse goes to get the next
patient at periop. In theory, when the circulating nurse leaves, either the room should be
completely ready or there is a nurse facilitator to help setup the room while the
circulating nurse is gone.
Below, in Figure 4-4, the times from the nursing cycle are documented in a value
stream map. This is the result of all the times from the original, or “current,” state. It
shows the times starting from when the nurse calls a turnover until the next patient enters
the room. The surgical techs help with setup a little bit, but not to the extent that a
circulating nurse and facilitator do. However, the value stream map of the surgical techs
can be seen in Appendix F.
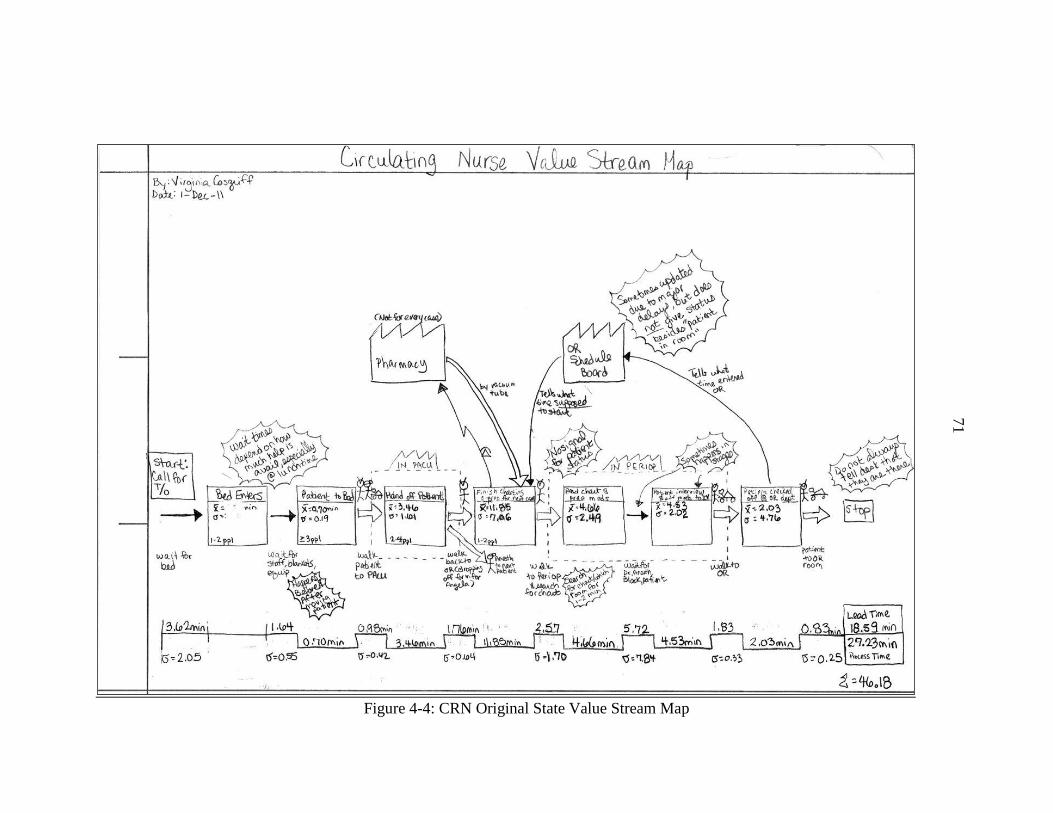
71
Figure 4-4: CRN Original State Value Stream Map
72
4.3.2 Hypothesis 3.2: Standard Deviation
The standard deviation for nursing setup in the room was statistically significant
with a P-value of 0.026. However, it should be stated that the nurse facilitator was used
concurrently with the flexible cleaning SOP in all of the “with facilitator” times. The F-
test proved that the difference in standard deviation between the old and new ways of
setting up a room was statistically different. The old way had a standard deviation of
6.312 minutes and the new way with a nurse facilitator is 3.16 minutes.
Once again, the standard deviation decreased and the mean decreased, but not to
such a degree that the overall turnover time was affected. Speculation is that some
aspects of the turnover did not show their variability in original observations due to other
factors affecting each other, such as taking a patient to PACU, getting a patient from
periop, and the surgeons and anesthesiologists not being available when needed for
surgery.
4.4 Experiment 4: Staffing Combinations
The staffing combinations discussed are the three that show the difference
between having a nurse facilitator, or someone to help setup the room who is not a nurse,
and the historical data where no system or task standardization existed. This analysis
should help to show that the extra person for turnovers is statistically significant and how
staff should be scheduled. Part of the problem with scheduling is when low census is
needed, which makes the decision hard as to who should stay to keep the productivity
score high.
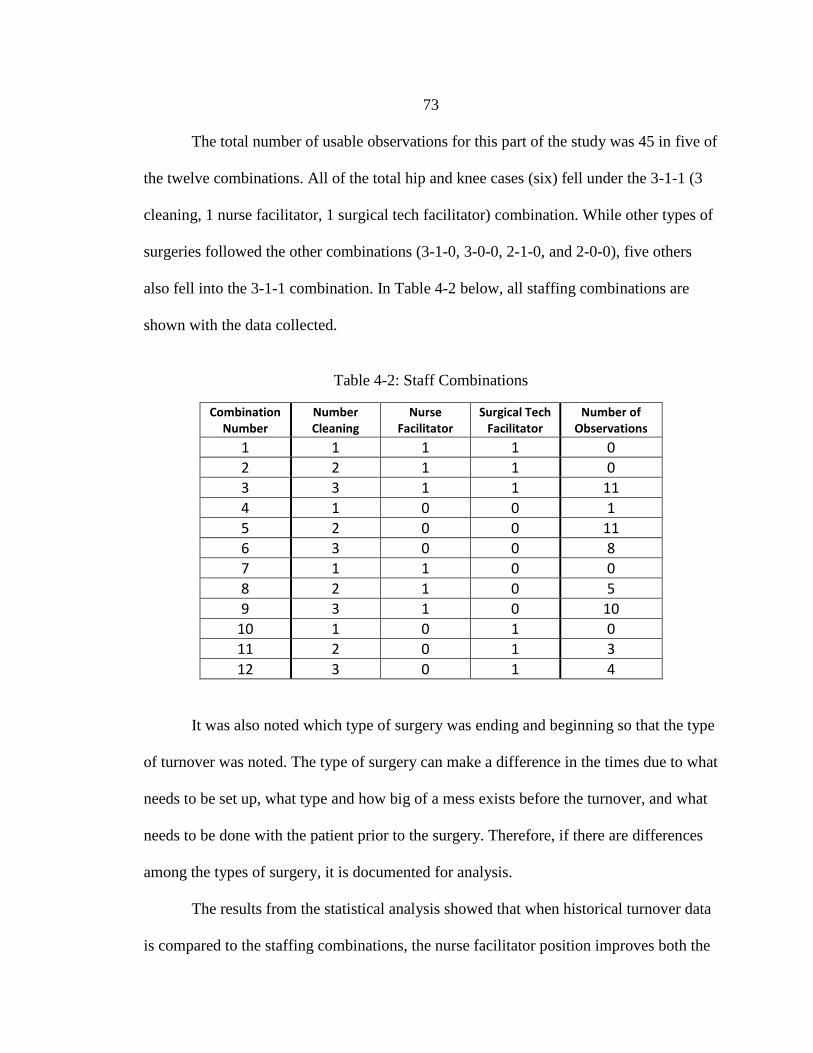
73
The total number of usable observations for this part of the study was 45 in five of
the twelve combinations. All of the total hip and knee cases (six) fell under the 3-1-1 (3
cleaning, 1 nurse facilitator, 1 surgical tech facilitator) combination. While other types of
surgeries followed the other combinations (3-1-0, 3-0-0, 2-1-0, and 2-0-0), five others
also fell into the 3-1-1 combination. In Table 4-2 below, all staffing combinations are
shown with the data collected.
Table 4-2: Staff Combinations
Combination Number
Number Cleaning
Nurse Facilitator
Surgical Tech Facilitator
Number of Observations
1 1 1 1 0
2 2 1 1 0
3 3 1 1 11
4 1 0 0 1
5 2 0 0 11
6 3 0 0 8
7 1 1 0 0
8 2 1 0 5
9 3 1 0 10
10 1 0 1 0
11 2 0 1 3
12 3 0 1 4
It was also noted which type of surgery was ending and beginning so that the type
of turnover was noted. The type of surgery can make a difference in the times due to what
needs to be set up, what type and how big of a mess exists before the turnover, and what
needs to be done with the patient prior to the surgery. Therefore, if there are differences
among the types of surgery, it is documented for analysis.
The results from the statistical analysis showed that when historical turnover data
is compared to the staffing combinations, the nurse facilitator position improves both the
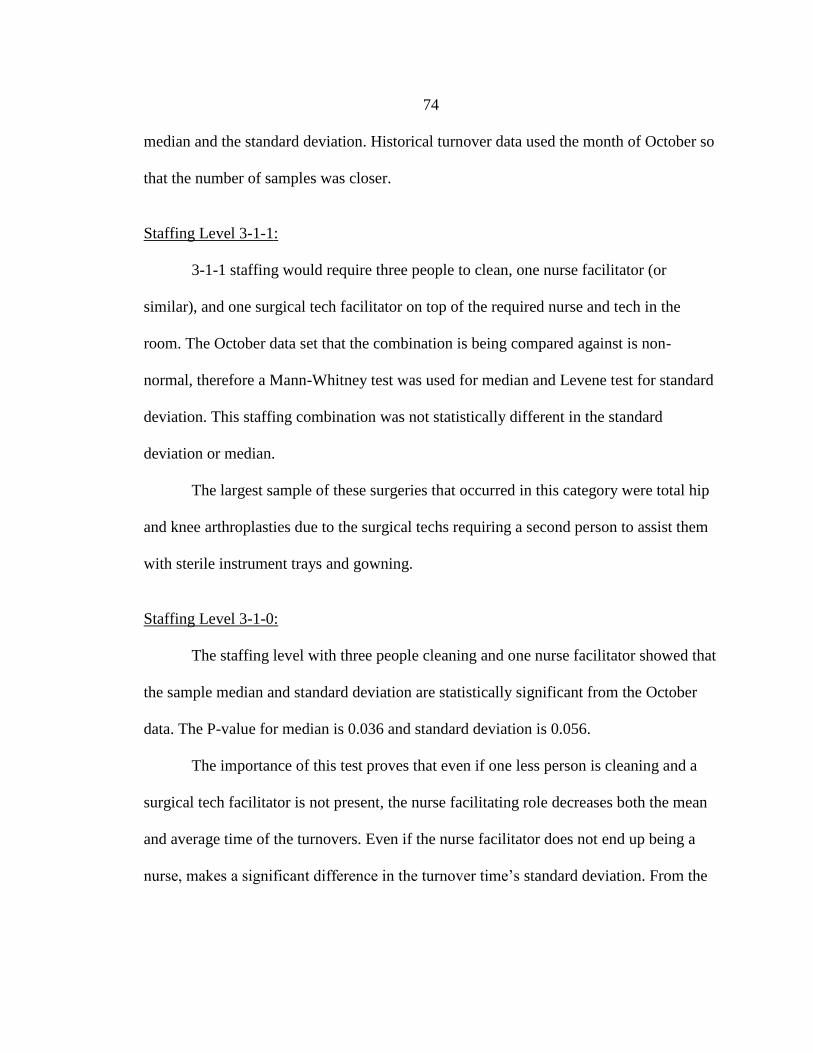
74
median and the standard deviation. Historical turnover data used the month of October so
that the number of samples was closer.
Staffing Level 3-1-1:
3-1-1 staffing would require three people to clean, one nurse facilitator (or
similar), and one surgical tech facilitator on top of the required nurse and tech in the
room. The October data set that the combination is being compared against is non-
normal, therefore a Mann-Whitney test was used for median and Levene test for standard
deviation. This staffing combination was not statistically different in the standard
deviation or median.
The largest sample of these surgeries that occurred in this category were total hip
and knee arthroplasties due to the surgical techs requiring a second person to assist them
with sterile instrument trays and gowning.
Staffing Level 3-1-0:
The staffing level with three people cleaning and one nurse facilitator showed that
the sample median and standard deviation are statistically significant from the October
data. The P-value for median is 0.036 and standard deviation is 0.056.
The importance of this test proves that even if one less person is cleaning and a
surgical tech facilitator is not present, the nurse facilitating role decreases both the mean
and average time of the turnovers. Even if the nurse facilitator does not end up being a
nurse, makes a significant difference in the turnover time’s standard deviation. From the

75
staffing hypothesis, hiring an extra person to help setup the room during a turnover would
decrease the setup time and turnover time.
Staffing Level 2-1-0:
Having two staff members cleaning and one nurse facilitator proved to almost be
statistically significant against the October data in both the mean and variance. The P-
Value is 0.144.
4.5 Experiment 5: Overall
Historical vs. New Comparison
4.5.1 Hypothesis 5.1.1 – All Surgery Types: Median
Both data sets were found to be non-normal. The Mann-Whitney test was used to
test the data for statistical significance. The P-Value is 0.018, therefore there is a
statistical difference between the median historical time and the new median time for
TAT.
4.5.2 Hypothesis 5.1.2 – All Surgery
Types: Standard Deviation
As stated above, the data was found to be non-normal, so the Levene test was
used to find statistical significance. The results gave a P-Value of 0.021 which provides
evidence that the historical and new data are statistically different for turnovers of all
surgery types.

76
4.5.3 Hypothesis 5.2.1 – Total
Joint Replacement: Median
The data from BDH proved to be non-normal, so the Mann-Whitney non-
parametric statistical test was performed for this hypothesis. The historical median of
total hip and knee arthroplasties was not found to be statistically different from the new
method of turnovers. The historical median from August 2011-January 2012 was 40.00
minutes and the new time from April –July 2012 was 39.00 minutes. Originally, the
thought was that the mean would be statistically different since the goal for all turnovers
was 30 minutes, but it turned out to only save approximately two minutes. However, the
variance is statistically different, which will be discussed in the next section.
One aspect of the turnovers which affected the entire turnover was getting the
patient from periop. When the cleaning procedure was implemented and the nurse
facilitator used, the first half of the turnover was faster and more consistent. However,
getting the patient was taking anywhere from 10-30 minutes. Due to this large variability,
the overall turnovers were not noticeably or statistically different.
4.5.4 Hypothesis 5.2.2 – Total Joint
Replacement: Standard Deviation
As stated above, the data are non-normal; therefore a Levene test was performed
to statistically test the hypothesis. The P-value for the difference between the historical
total hip and knee arthroplasties standard deviations is 0.278 provides evidence that the
two standard deviations are not significantly different.
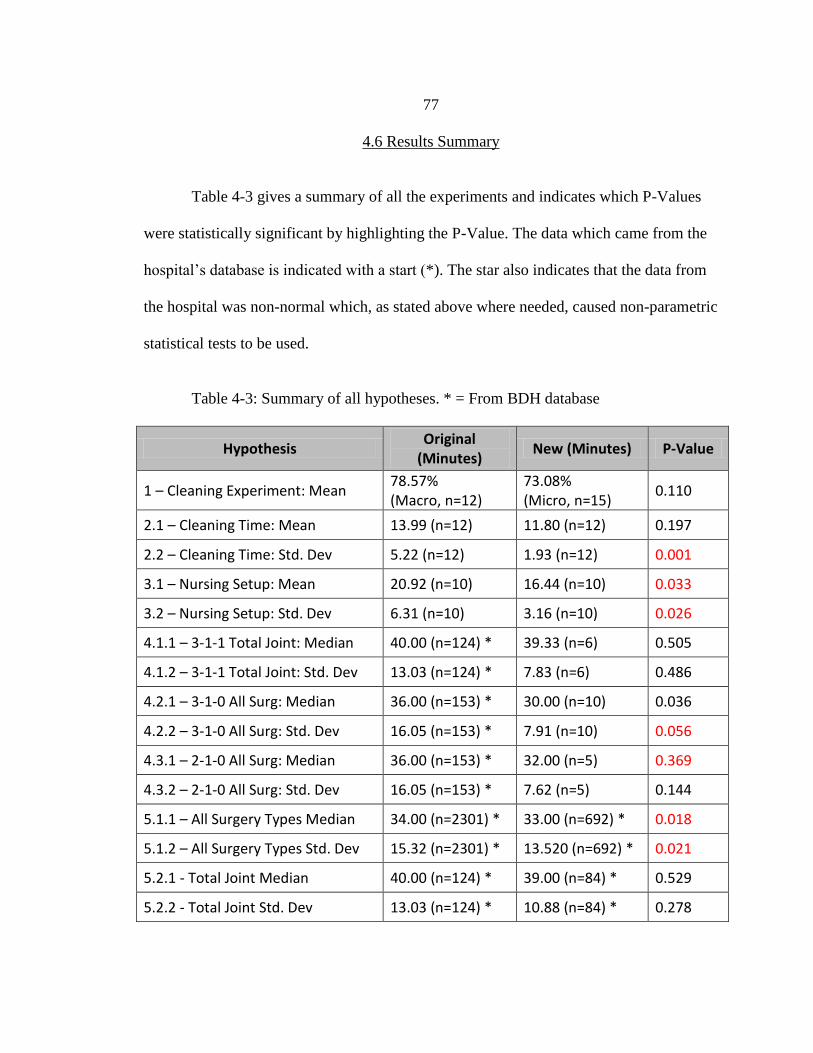
77
4.6 Results Summary
Table 4-3 gives a summary of all the experiments and indicates which P-Values
were statistically significant by highlighting the P-Value. The data which came from the
hospital’s database is indicated with a start (*). The star also indicates that the data from
the hospital was non-normal which, as stated above where needed, caused non-parametric
statistical tests to be used.
Table 4-3: Summary of all hypotheses. * = From BDH database
Hypothesis Original
(Minutes) New (Minutes) P-Value
1 – Cleaning Experiment: Mean 78.57% (Macro, n=12)
73.08% (Micro, n=15)
0.110
2.1 – Cleaning Time: Mean 13.99 (n=12) 11.80 (n=12) 0.197
2.2 – Cleaning Time: Std. Dev 5.22 (n=12) 1.93 (n=12) 0.001
3.1 – Nursing Setup: Mean 20.92 (n=10) 16.44 (n=10) 0.033
3.2 – Nursing Setup: Std. Dev 6.31 (n=10) 3.16 (n=10) 0.026
4.1.1 – 3-1-1 Total Joint: Median 40.00 (n=124) * 39.33 (n=6) 0.505
4.1.2 – 3-1-1 Total Joint: Std. Dev 13.03 (n=124) * 7.83 (n=6) 0.486
4.2.1 – 3-1-0 All Surg: Median 36.00 (n=153) * 30.00 (n=10) 0.036
4.2.2 – 3-1-0 All Surg: Std. Dev 16.05 (n=153) * 7.91 (n=10) 0.056
4.3.1 – 2-1-0 All Surg: Median 36.00 (n=153) * 32.00 (n=5) 0.369
4.3.2 – 2-1-0 All Surg: Std. Dev 16.05 (n=153) * 7.62 (n=5) 0.144
5.1.1 – All Surgery Types Median 34.00 (n=2301) * 33.00 (n=692) * 0.018
5.1.2 – All Surgery Types Std. Dev 15.32 (n=2301) * 13.520 (n=692) * 0.021
5.2.1 - Total Joint Median 40.00 (n=124) * 39.00 (n=84) * 0.529
5.2.2 - Total Joint Std. Dev 13.03 (n=124) * 10.88 (n=84) * 0.278
78
5. ANALYSIS AND DISCUSSION
5.1 Hypothesis 1 – Flexible Cleaning SOP
The means of the micro and macro written standard operating procedure were
found not to be statistically significant, as shown in the Results section. However, the
standard deviation is statistically different. This is contrary to what Randolph (2006)
suggests: having simple language, consistent format, and easy to use. The author’s
application was for developing policies and procedures for nurses, while this research
was for a standardized cleaning procedure for multiple staff types.
The times from this study indicated that the standard deviation of the cleaning
was starting to decrease from the original data collected. Figure 5-1 shows the old data
compared to the micro and macro times taken in the study. It shows that if a standard
procedure is put into place and followed, the standard deviation decreases. However, it is
interesting that the macro has a higher standard deviation than the micro since it had a
higher adherence. There is a larger range of the types of surgeries that are before and
after the cleaning, which could contribute to an increase in variation.
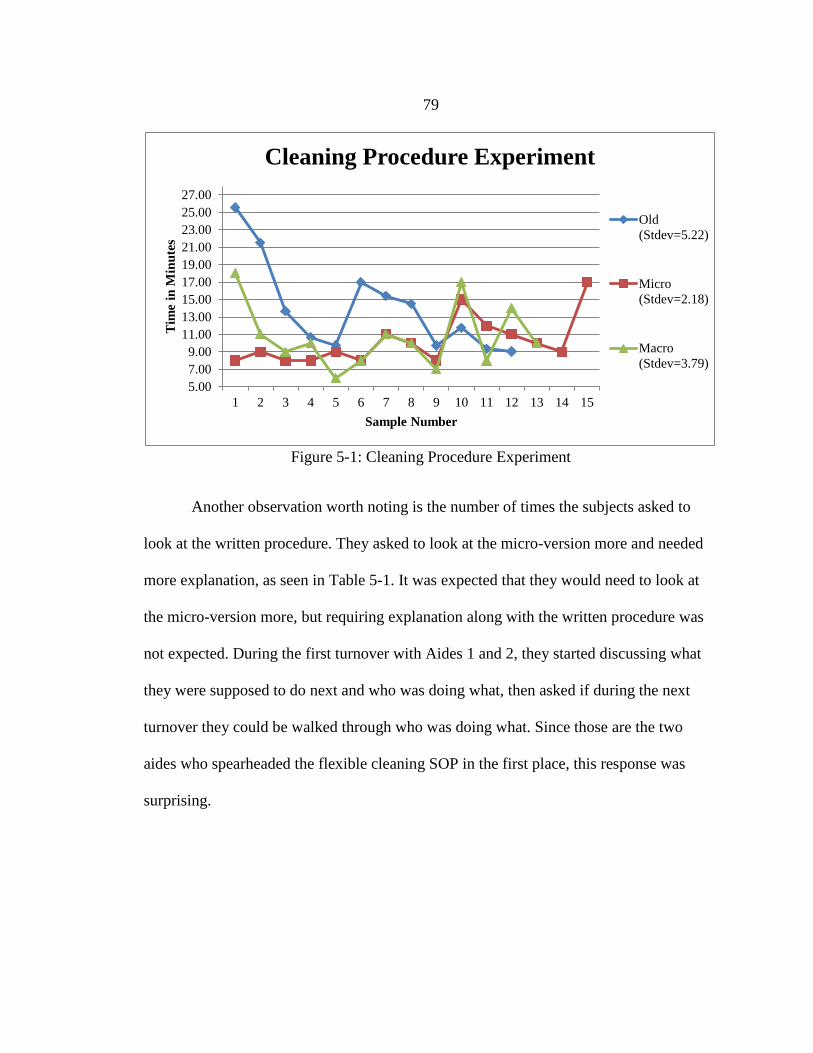
79
Figure 5-1: Cleaning Procedure Experiment
Another observation worth noting is the number of times the subjects asked to
look at the written procedure. They asked to look at the micro-version more and needed
more explanation, as seen in Table 5-1. It was expected that they would need to look at
the micro-version more, but requiring explanation along with the written procedure was
not expected. During the first turnover with Aides 1 and 2, they started discussing what
they were supposed to do next and who was doing what, then asked if during the next
turnover they could be walked through who was doing what. Since those are the two
aides who spearheaded the flexible cleaning SOP in the first place, this response was
surprising.
5.00
7.00
9.00
11.00
13.00
15.00
17.00
19.00
21.00
23.00
25.00
27.00
1 2 3 4 5 6 7 8 9 10 11 12 13 14 15
Tim
e in
Min
ute
s
Sample Number
Cleaning Procedure Experiment
Old
(Stdev=5.22)
Micro
(Stdev=2.18)
Macro
(Stdev=3.79)
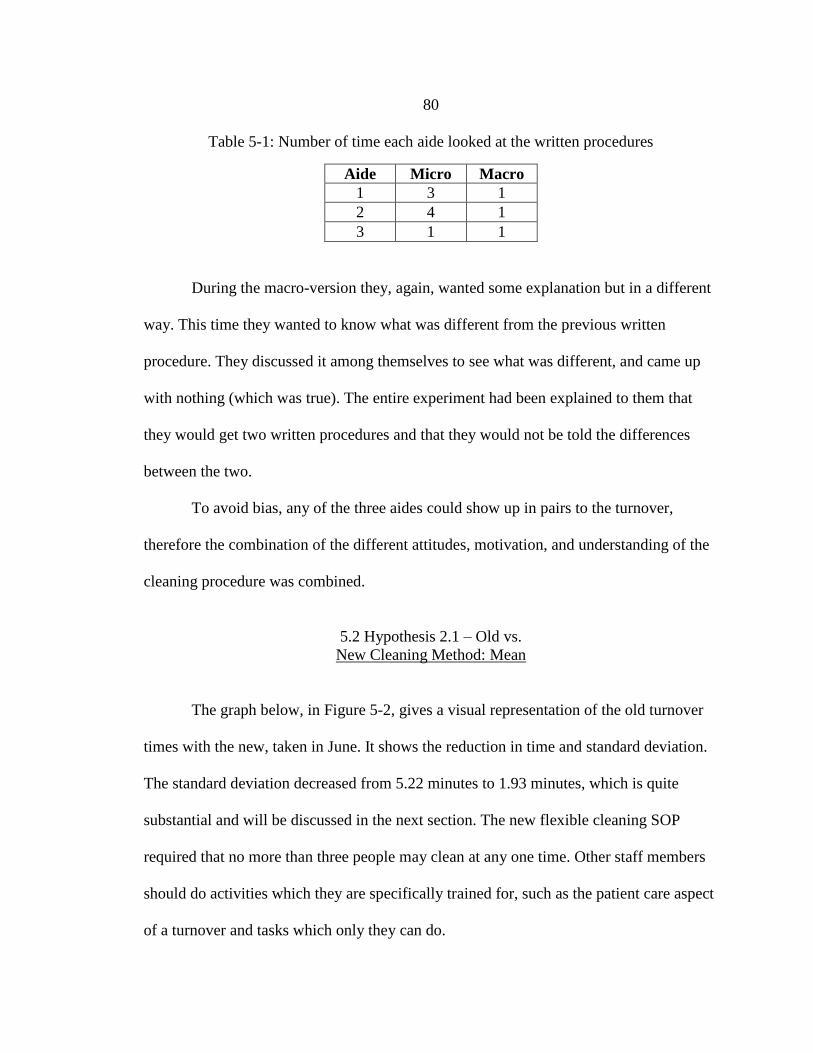
80
Table 5-1: Number of time each aide looked at the written procedures
Aide Micro Macro
1 3 1
2 4 1
3 1 1
During the macro-version they, again, wanted some explanation but in a different
way. This time they wanted to know what was different from the previous written
procedure. They discussed it among themselves to see what was different, and came up
with nothing (which was true). The entire experiment had been explained to them that
they would get two written procedures and that they would not be told the differences
between the two.
To avoid bias, any of the three aides could show up in pairs to the turnover,
therefore the combination of the different attitudes, motivation, and understanding of the
cleaning procedure was combined.
5.2 Hypothesis 2.1 – Old vs.
New Cleaning Method: Mean
The graph below, in Figure 5-2, gives a visual representation of the old turnover
times with the new, taken in June. It shows the reduction in time and standard deviation.
The standard deviation decreased from 5.22 minutes to 1.93 minutes, which is quite
substantial and will be discussed in the next section. The new flexible cleaning SOP
required that no more than three people may clean at any one time. Other staff members
should do activities which they are specifically trained for, such as the patient care aspect
of a turnover and tasks which only they can do.
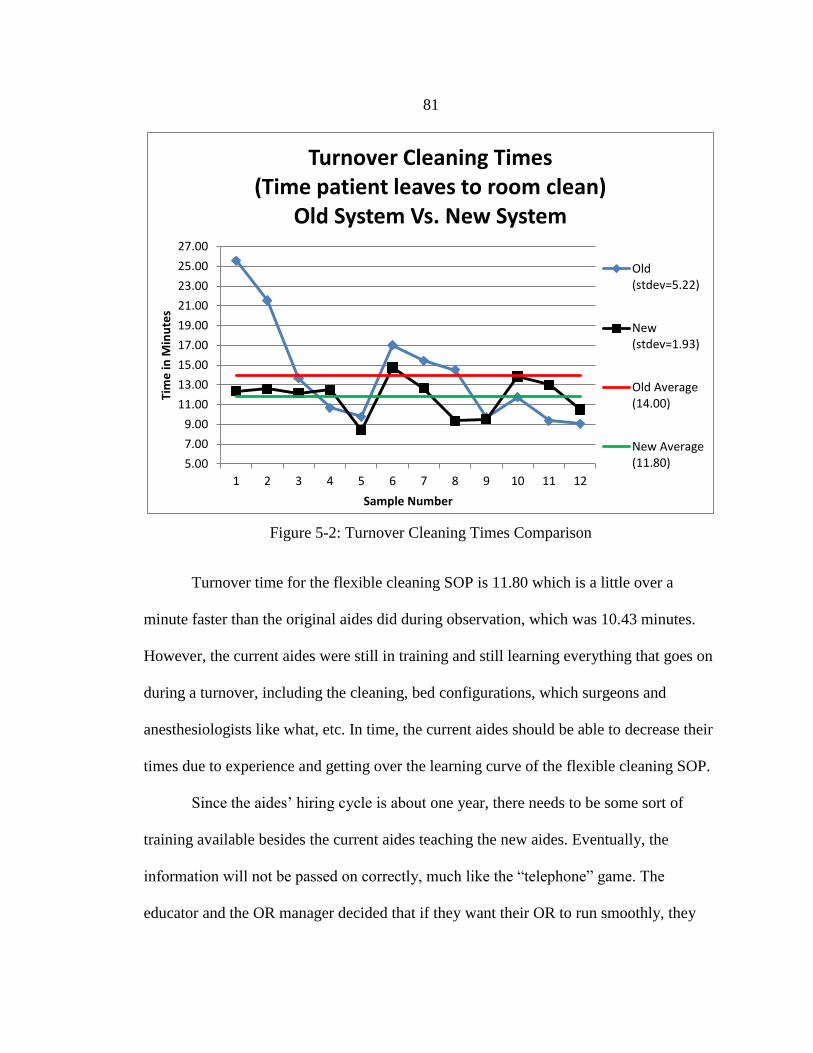
81
Figure 5-2: Turnover Cleaning Times Comparison
Turnover time for the flexible cleaning SOP is 11.80 which is a little over a
minute faster than the original aides did during observation, which was 10.43 minutes.
However, the current aides were still in training and still learning everything that goes on
during a turnover, including the cleaning, bed configurations, which surgeons and
anesthesiologists like what, etc. In time, the current aides should be able to decrease their
times due to experience and getting over the learning curve of the flexible cleaning SOP.
Since the aides’ hiring cycle is about one year, there needs to be some sort of
training available besides the current aides teaching the new aides. Eventually, the
information will not be passed on correctly, much like the “telephone” game. The
educator and the OR manager decided that if they want their OR to run smoothly, they
5.00
7.00
9.00
11.00
13.00
15.00
17.00
19.00
21.00
23.00
25.00
27.00
1 2 3 4 5 6 7 8 9 10 11 12
Tim
e in
Min
ute
s
Sample Number
Turnover Cleaning Times (Time patient leaves to room clean)
Old System Vs. New System
Old(stdev=5.22)
New(stdev=1.93)
Old Average(14.00)
New Average(11.80)

82
need to do the training. The educator got an intensive training session with the current
OR aides presented by the researcher. The OR manager was involved in the process of
improving the cleaning process, so she is also qualified for doing the training.
According to the CPM of the original system and precedence, the original
cleaning method could “not be faster” than 12.22 minutes, or 10.70 assuming trash and
linens picked up. While the new flexible cleaning SOP is a bit longer at 12.70 minutes, in
Figure 5-3, the CPM does not show the variability of the system which has decreased.
Figure 5-4 shows the same flexible cleaning SOP using CPM, but the bed configuration
is not included since it does not occur in every turnover. Thus, the CPM in Figure 5-4
makes it more realistic, as long as they are following the cleaning procedure at 10
minutes. This backs up the original timing of the flexible cleaning SOP where the aides
had an average of 10.43 minutes.
As discussed in the background section, Cima et al. (2011) stated that there was
no documented case of creating a process which worked across all surgery types or OR
suites. However, this cleaning procedure is able to be applied across all surgery types,
while decreasing time and standard deviation at the same time.
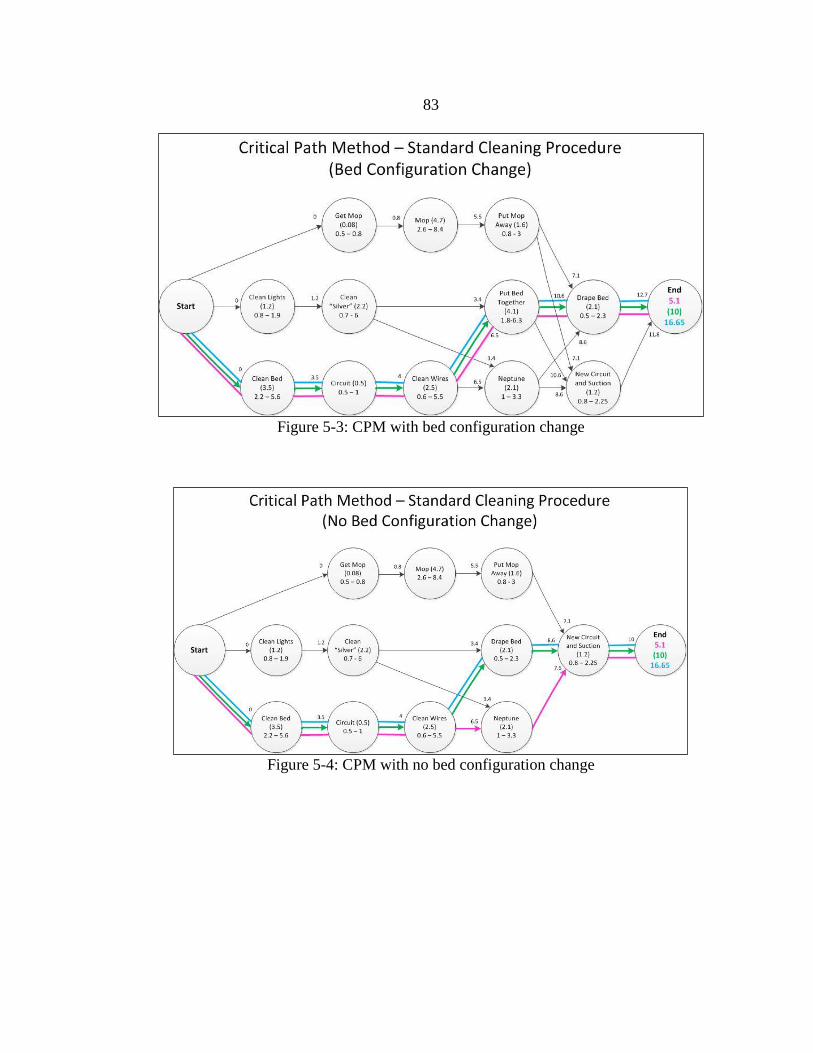
83
Figure 5-3: CPM with bed configuration change
Figure 5-4: CPM with no bed configuration change
84
5.3 Hypothesis 2.2 – Old vs. New
Cleaning Method: Standard Deviation
A standard deviation decrease was the first sign of the improvements actually
affecting the everyday activities and turnover times. What this means is that if the
standard deviation of the entire turnover can be decreased, not just the cleaning, the
schedule will become more accurate because turnovers are only scheduled for specific
amounts of time depending on the surgery. The flexible cleaning SOP is only one step,
but if the entire turnover can become predictable, new turnover times for the computer
schedule can be made to help more the scheduled surgeries occur on time.
5.3.1 Flexible Standard Cleaning Procedure
The reason that the flexible cleaning SOP is considered flexible is that the same
work is getting done every time, but the number of people performing the work can vary.
Anywhere from 1-3 people at any time are able to still complete the standardized
cleaning procedure. Below, in Figure 5-5, the procedure is shown as flexible for 1, 2, or 3
people. However, there can be different combinations of 1, 2, or 3 while the procedure is
being performed as well. The adapatability of the procedure also allows any combination
of 1, 2, or 3 people to come in and out of the cleaning process. For example, the turnover
might start with 1 person and end with 3 people, or 3 people may start and the cleaning
ends with 1 because the others had to go take care of multiple turnovers.

85
Figure 5-5: How the flexibility works on the in-room reminder
The reason that the cleaning SOP needs to be flexible is due to the nature of the
work. Aides are not always readily available due to: multiple turnovers happening at the
same time, other duties that take them away, lunches/breaks, and time of day – the
staggered schedule of the 5 aides. It is also unknown if there will be a staff member
available to be the third person cleaning because they might have to get supplies for the
next case, help with a patient, or the staffing is low for the day.
5.4 Hypothesis 3.1 – Nursing Set-up: Mean
Nurses were timed originally for their current state VSM, so a second set of times
was taken in June to check the progress. Figure 5-6 shows how the time and standard
deviation have decreased. The old average was 20.92 minutes to set up a room, and the
new average is 16.44 minutes. This average difference of 4.49 minutes has potential to
save at least this much off of a turnover when used concurrently with the flexible
If one person cleaning: If two people cleaning: If three people cleaning:
1 2
First
person
done from
initial
tasks,
usually
person 1
2nd done
from
initial
tasks
1 2
3
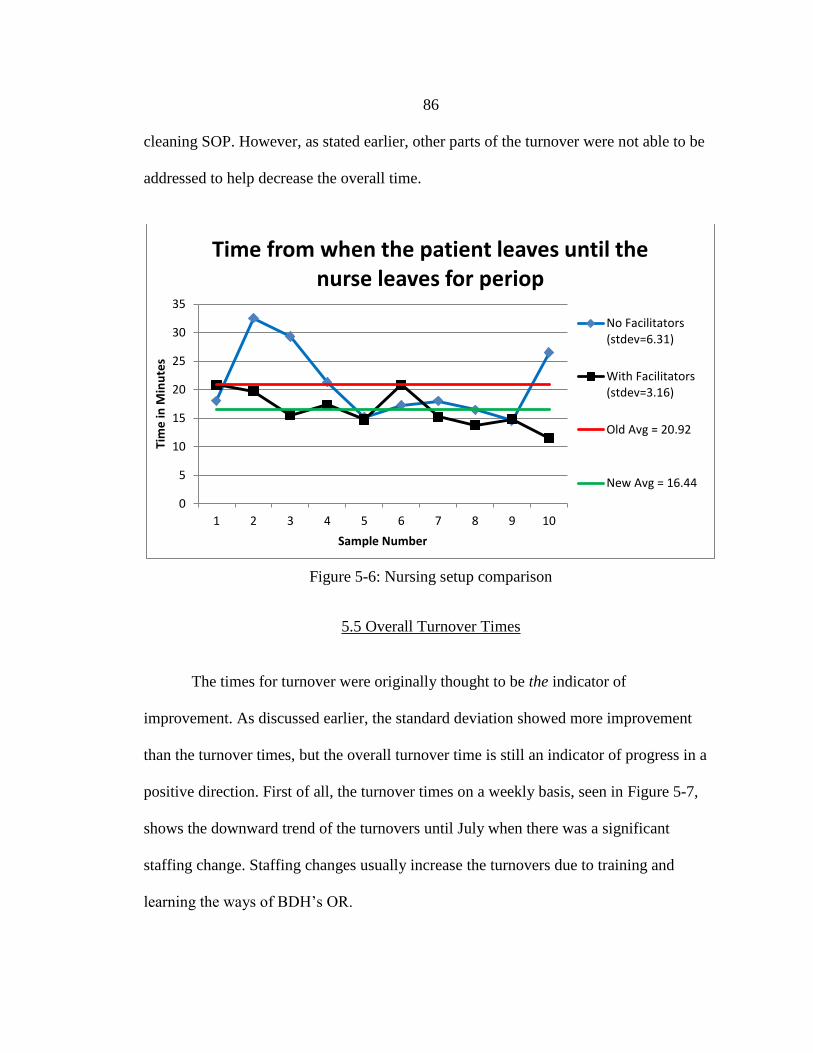
86
cleaning SOP. However, as stated earlier, other parts of the turnover were not able to be
addressed to help decrease the overall time.
Figure 5-6: Nursing setup comparison
5.5 Overall Turnover Times
The times for turnover were originally thought to be the indicator of
improvement. As discussed earlier, the standard deviation showed more improvement
than the turnover times, but the overall turnover time is still an indicator of progress in a
positive direction. First of all, the turnover times on a weekly basis, seen in Figure 5-7,
shows the downward trend of the turnovers until July when there was a significant
staffing change. Staffing changes usually increase the turnovers due to training and
learning the ways of BDH’s OR.
0
5
10
15
20
25
30
35
1 2 3 4 5 6 7 8 9 10
Tim
e in
Min
ute
s
Sample Number
Time from when the patient leaves until the nurse leaves for periop
No Facilitators(stdev=6.31)
With Facilitators(stdev=3.16)
Old Avg = 20.92
New Avg = 16.44

87
Figure 5-7: Average Turnover Time by Week
April signifies when the improvements started, and can be seen by the continued
overall decrease in time until July. The researcher was inside the OR monitoring the
process and ensuring that the changes implemented were being followed from April until
the end of July. The first week of April, the flexible cleaning SOP was introduced
department wide, and the third week of April the nurse facilitating role was implemented.
Otherwise, the times were staying consistently lower than previously in the historical
data.
The average, weekly standard deviation in Figure 5-8 shows that the times were
becoming more consistent as time went on. However, July increased as it did with the
mean. April through June has a visible downward trend which indicates that the
standardization of jobs, tasks, and some procedures was helping.
28
30
32
34
36
38
40
42
44W
eek 1
Wee
k 3
Wee
k 5
Wee
k 2
Wee
k 4
Wee
k 2
Wee
k 4
Wee
k 1
Wee
k 3
Wee
k 1
Wee
k 3
Wee
k 5
Wee
k2
Wee
k4
Wee
k 2
Wee
k 4
Wee
k 1
Wee
k 3
Wee
k 1
Wee
k 3
Aug Oct Nov Dec Jan April May June July
TA
T i
n m
inu
tes
Average Turnover Times by Week
Avg
TAT
TAT
Goal
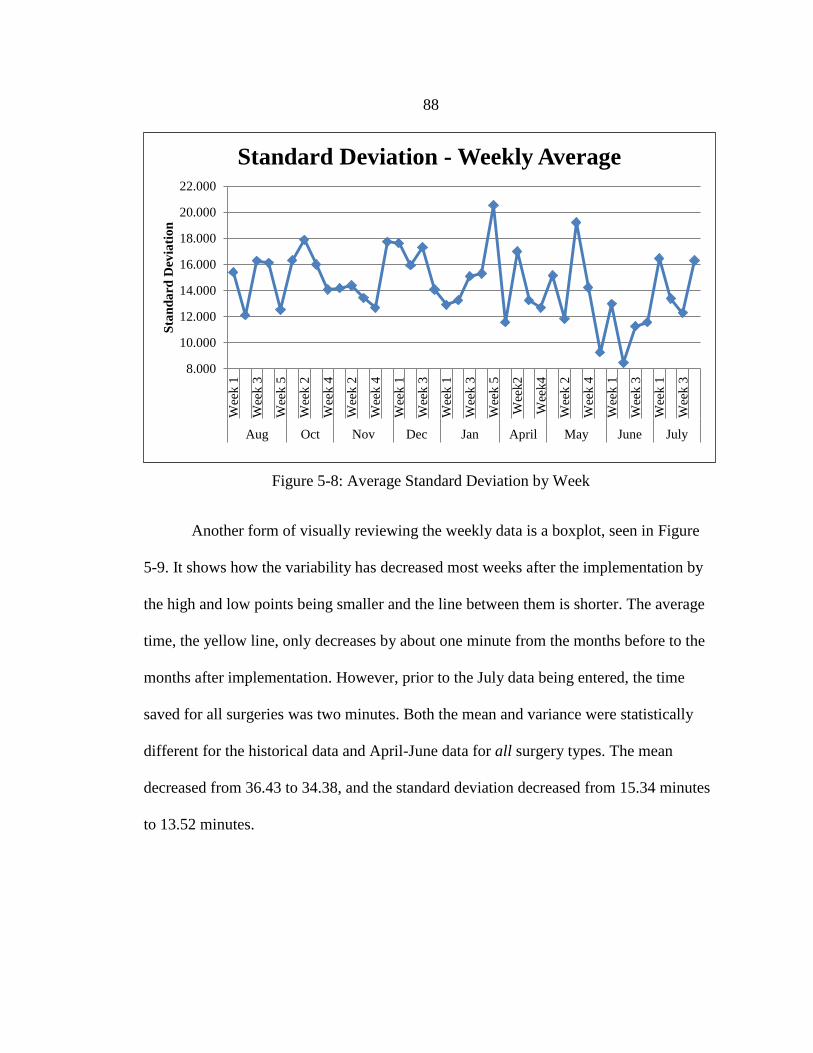
88
Figure 5-8: Average Standard Deviation by Week
Another form of visually reviewing the weekly data is a boxplot, seen in Figure
5-9. It shows how the variability has decreased most weeks after the implementation by
the high and low points being smaller and the line between them is shorter. The average
time, the yellow line, only decreases by about one minute from the months before to the
months after implementation. However, prior to the July data being entered, the time
saved for all surgeries was two minutes. Both the mean and variance were statistically
different for the historical data and April-June data for all surgery types. The mean
decreased from 36.43 to 34.38, and the standard deviation decreased from 15.34 minutes
to 13.52 minutes.
8.000
10.000
12.000
14.000
16.000
18.000
20.000
22.000
Wee
k 1
Wee
k 3
Wee
k 5
Wee
k 2
Wee
k 4
Wee
k 2
Wee
k 4
Wee
k 1
Wee
k 3
Wee
k 1
Wee
k 3
Wee
k 5
Wee
k2
Wee
k4
Wee
k 2
Wee
k 4
Wee
k 1
Wee
k 3
Wee
k 1
Wee
k 3
Aug Oct Nov Dec Jan April May June July
Sta
nd
ard
Dev
iati
on
Standard Deviation - Weekly Average

89
Figure 5-9: Turnaround time weekly average boxplot
There are at least 23% less high points above the 80 and 60 minute lines, which
indicates that the standard procedures are working and decreasing the number of
extremely high turnovers. However, the staff are also much more aware of longer
turnovers and try to prevent them from happening or help out when a turnover is taking a
long time to figure out why.
Besides the weekly overall averages, individual surgeons and surgery types were
also analyzed to see if times were only improving in certain areas. First, the eight surgery
types show, in Figure 5-10, that most surgery types were decreasing in time and all types
were veering towards a common time until June. Once again, July shows its upward
0
20
40
60
80
100
120
140W
eek 1
Wee
k 3
Wee
k 5
Wee
k 2
Wee
k 4
Wee
k 2
Wee
k 4
Wee
k 1
Wee
k 3
Wee
k 1
Wee
k 3
Wee
k 5
Wee
k 2
Wee
k 4
Wee
k 2
Wee
k 4
Wee
k 1
Wee
k 3
Wee
k 1
Wee
k 3
August October November December January April May June July
Tim
e o
f T
urn
ov
er i
n m
inu
tes
Weely turnovers
TAT Boxplot for August - January and
April - July
75%tile
Median
25%tile
High
Low
Average
90
trend, but shows that it was not just one type of surgery affected. They were all effected
and in a similar way due to the slope of the increase.
The strange max and min in January is due to dental having only one turnover
which was 13 minutes. Spine had five turnovers which were around 50 minutes, but the
sixth one was very large at 109 minutes increasing the overall average. The spine cases
usually have a lot of equipment to change over and the patients have a lot of labs and
preparation prior to surgery, therefore it is not surprising that these cases have a higher
average than most. However, this long turnover was from inpatient, which also tends to
take longer than getting the patient from periop.
Next, the surgeons and practices were analyzed. Some of the practices share a
block, while other individual surgeons have their own block. The surgeons which share
blocks in the schedule were combined because their turnover times were not as clear due
to different surgeons following each other. Figure 5-11 shows the surgeons and practice
blocks with monthly turnovers, and Table 5-2 shows the averages and decreases for each
one.
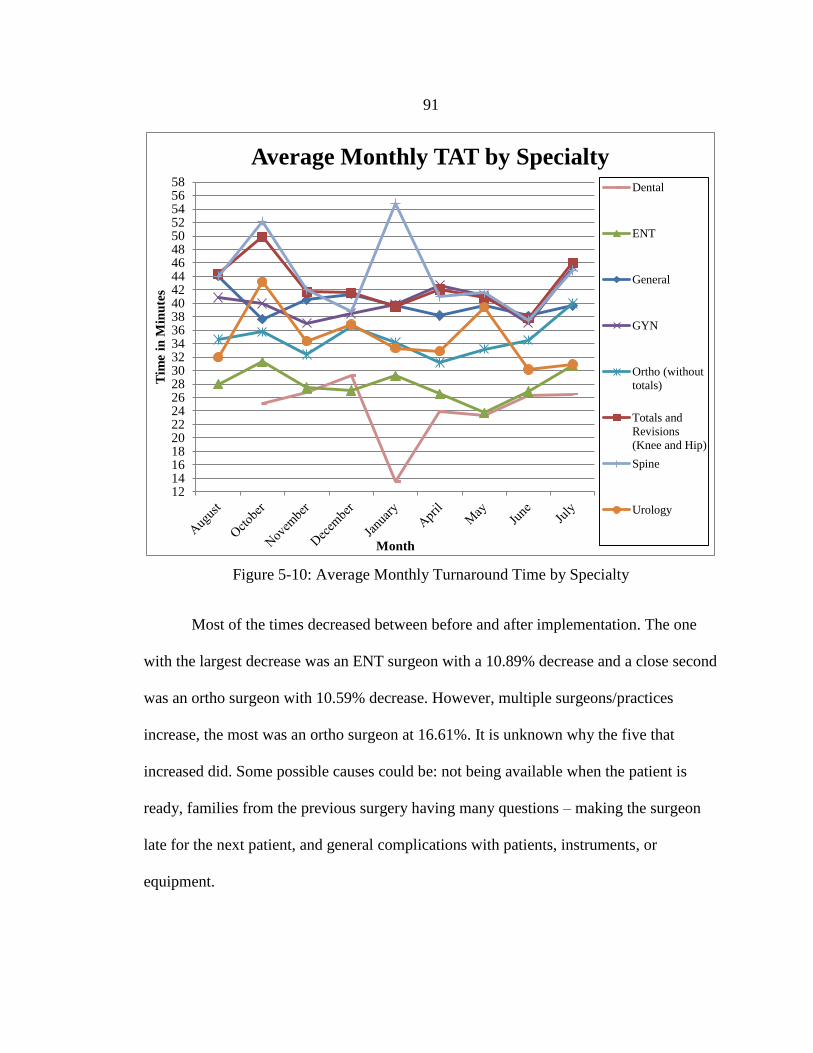
91
Figure 5-10: Average Monthly Turnaround Time by Specialty
Most of the times decreased between before and after implementation. The one
with the largest decrease was an ENT surgeon with a 10.89% decrease and a close second
was an ortho surgeon with 10.59% decrease. However, multiple surgeons/practices
increase, the most was an ortho surgeon at 16.61%. It is unknown why the five that
increased did. Some possible causes could be: not being available when the patient is
ready, families from the previous surgery having many questions – making the surgeon
late for the next patient, and general complications with patients, instruments, or
equipment.
121416182022242628303234363840424446485052545658
Tim
e in
Min
ute
s
Month
Average Monthly TAT by Specialty
Dental
ENT
General
GYN
Ortho (without
totals)
Totals and
Revisions
(Knee and Hip)
Spine
Urology
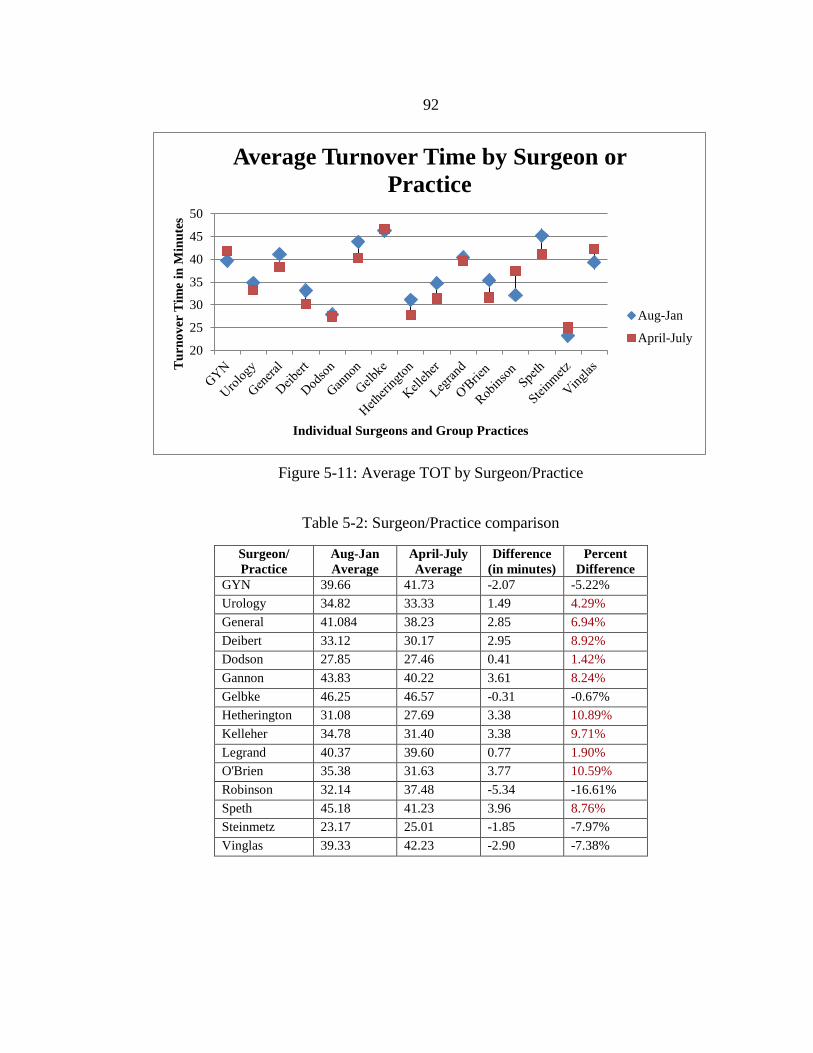
92
Figure 5-11: Average TOT by Surgeon/Practice
Table 5-2: Surgeon/Practice comparison
Surgeon/
Practice
Aug-Jan
Average
April-July
Average
Difference
(in minutes)
Percent
Difference
GYN 39.66 41.73 -2.07 -5.22%
Urology 34.82 33.33 1.49 4.29%
General 41.084 38.23 2.85 6.94%
Deibert 33.12 30.17 2.95 8.92%
Dodson 27.85 27.46 0.41 1.42%
Gannon 43.83 40.22 3.61 8.24%
Gelbke 46.25 46.57 -0.31 -0.67%
Hetherington 31.08 27.69 3.38 10.89%
Kelleher 34.78 31.40 3.38 9.71%
Legrand 40.37 39.60 0.77 1.90%
O'Brien 35.38 31.63 3.77 10.59%
Robinson 32.14 37.48 -5.34 -16.61%
Speth 45.18 41.23 3.96 8.76%
Steinmetz 23.17 25.01 -1.85 -7.97%
Vinglas 39.33 42.23 -2.90 -7.38%
20
25
30
35
40
45
50
Tu
rno
ver
Tim
e in
Min
ute
s
Individual Surgeons and Group Practices
Average Turnover Time by Surgeon or
Practice
Aug-Jan
April-July

93
5.6 Swim Lane Chart
A swim lane chart was created to show the staff who is doing what and when. It
was intended to help all individuals involved in the turnover process see who they need to
communicate with and how others are also assigned to specific tasks. Figure 5-12 shows
the goal for all turnovers is 30 minutes: 10 minutes for cleaning and 20 minutes to
completely get the room ready for the next case after cleaning. During the 20 minute
setup period, 10 of those minutes is when the nurse in the room goes to get the patient
while help sets up the room and surgical techs prepare their sterile areas. At any given
time, this chart should show who is doing what if a particular point in time was chosen to
audit the process.
The colors represent activities which are done at the same time with at least one
other person. As an example, what is supposed to be happening right the turnover starts:
- The nurse is helping move the patient;
- The core nurse (or facilitator) is helping move the patient;
- The surgical tech is clearing supplies from the sterile field; and
- At least one of the OR aides is helping move the patient
This chart’s primary function is for large case turnover such as total knees, hips,
shoulders, and spine. The timeline at the bottom shows 30 minutes because the long-term
goal is to get all turnovers at or under that time. Each type of surgery will be slightly
different depending on how messy the room is, what needs to be setup, and what the
patient needs in order to be ready for surgery. However, it should be possible to create
goal times for each type or similar types of surgeries. All of the improvements and times
had been previously discussed and implemented or piloted prior to the creation of this
chart.
94
5.7 Cost Analysis
5.7.1 Pads for Surgical Table
During turnovers, multiple members of the staff were looking for the perineal
filler pad, seen in Figure 5-13. It usually took multiple people, 2-3 minutes to find the pad
because there were not enough for each bed in the OR department. They got stolen from
different rooms, misplaced, or hidden so that they could not be found when needed.
When this small detail was noticed, it was recommended to do an inventory of the pads
and order the amount needed to eliminate this problem. It was also suggested to create a
standard place to put it in rooms when not in use to eliminate searching within the room.
The cost of these pads was $300 each, and the department needed five. As seen in
Table 5-3, the total cost of these pads was $1500. However, when the cost is analyzed,
the time saved from not having to search makes up the cost of the pad in 1-3 weeks. This
is assuming that it happens 5-10 times a week.

95
Figure 5-12: Swimlane chart for a turnover
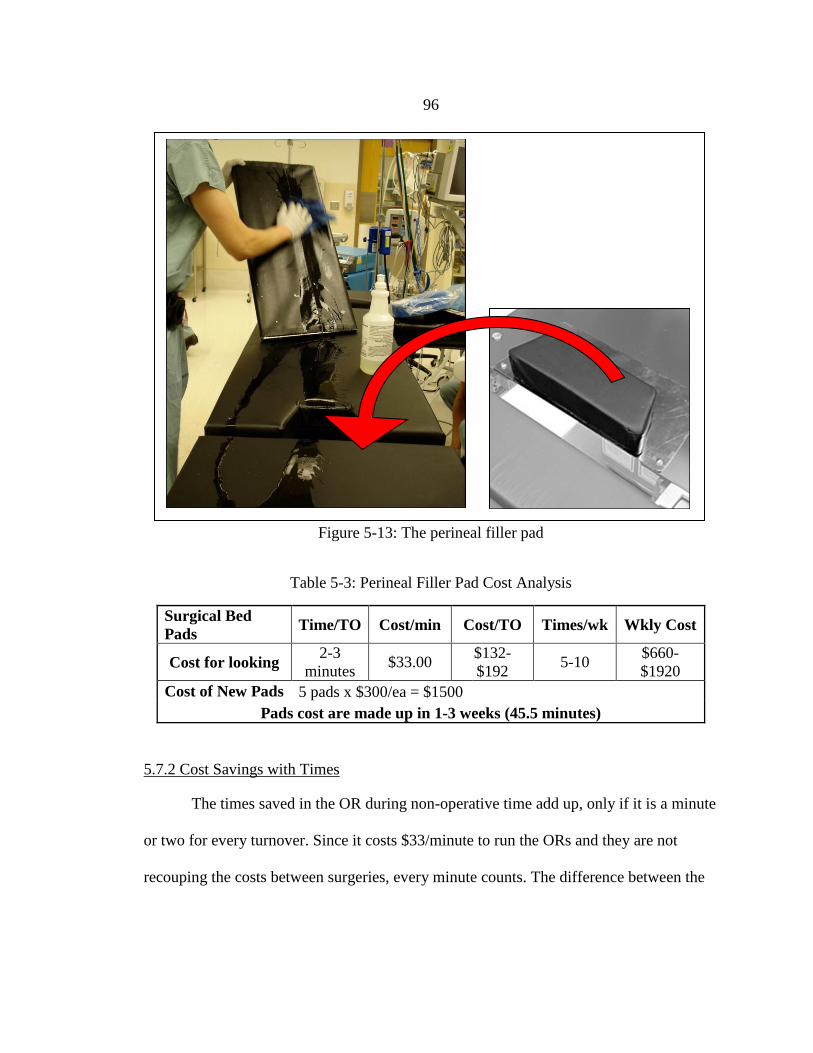
96
Figure 5-13: The perineal filler pad
Table 5-3: Perineal Filler Pad Cost Analysis
Surgical Bed
Pads Time/TO Cost/min Cost/TO Times/wk Wkly Cost
Cost for looking 2-3
minutes $33.00
$132-
$192 5-10
$660-
$1920
Cost of New Pads 5 pads x $300/ea = $1500
Pads cost are made up in 1-3 weeks (45.5 minutes)
5.7.2 Cost Savings with Times
The times saved in the OR during non-operative time add up, only if it is a minute
or two for every turnover. Since it costs $33/minute to run the ORs and they are not
recouping the costs between surgeries, every minute counts. The difference between the
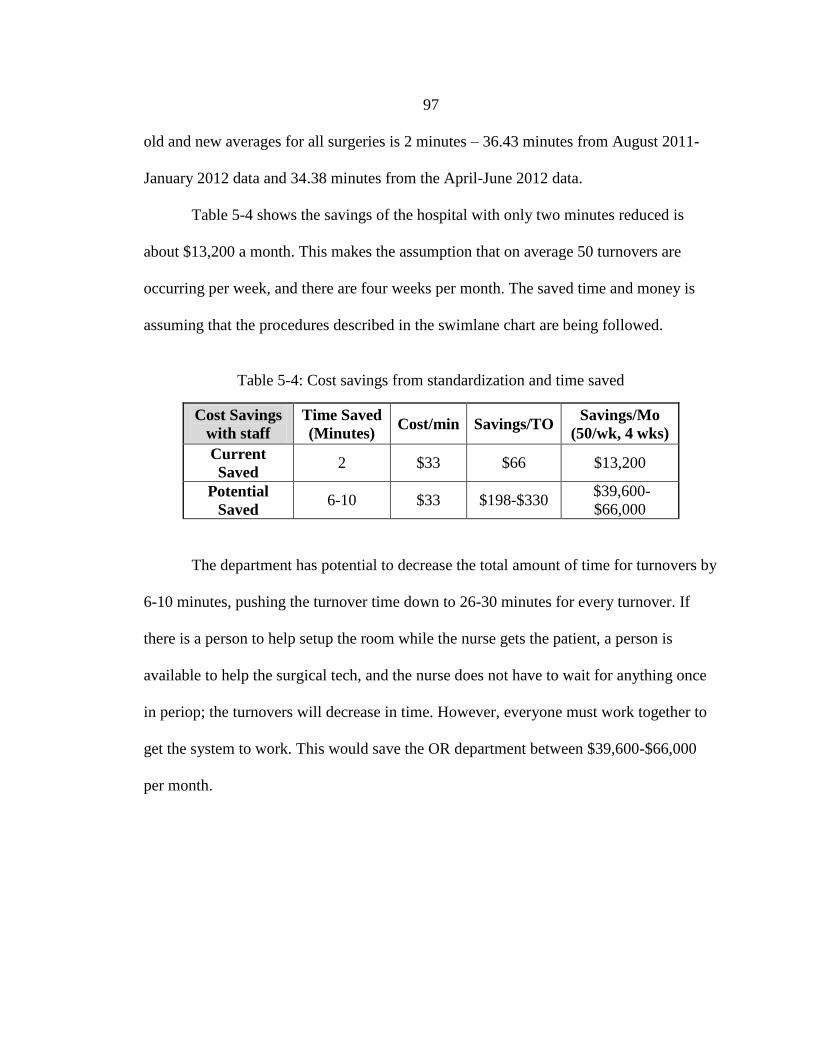
97
old and new averages for all surgeries is 2 minutes – 36.43 minutes from August 2011-
January 2012 data and 34.38 minutes from the April-June 2012 data.
Table 5-4 shows the savings of the hospital with only two minutes reduced is
about $13,200 a month. This makes the assumption that on average 50 turnovers are
occurring per week, and there are four weeks per month. The saved time and money is
assuming that the procedures described in the swimlane chart are being followed.
Table 5-4: Cost savings from standardization and time saved
Cost Savings
with staff
Time Saved
(Minutes) Cost/min Savings/TO
Savings/Mo
(50/wk, 4 wks)
Current
Saved 2 $33 $66 $13,200
Potential
Saved 6-10 $33 $198-$330
$39,600-
$66,000
The department has potential to decrease the total amount of time for turnovers by
6-10 minutes, pushing the turnover time down to 26-30 minutes for every turnover. If
there is a person to help setup the room while the nurse gets the patient, a person is
available to help the surgical tech, and the nurse does not have to wait for anything once
in periop; the turnovers will decrease in time. However, everyone must work together to
get the system to work. This would save the OR department between $39,600-$66,000
per month.
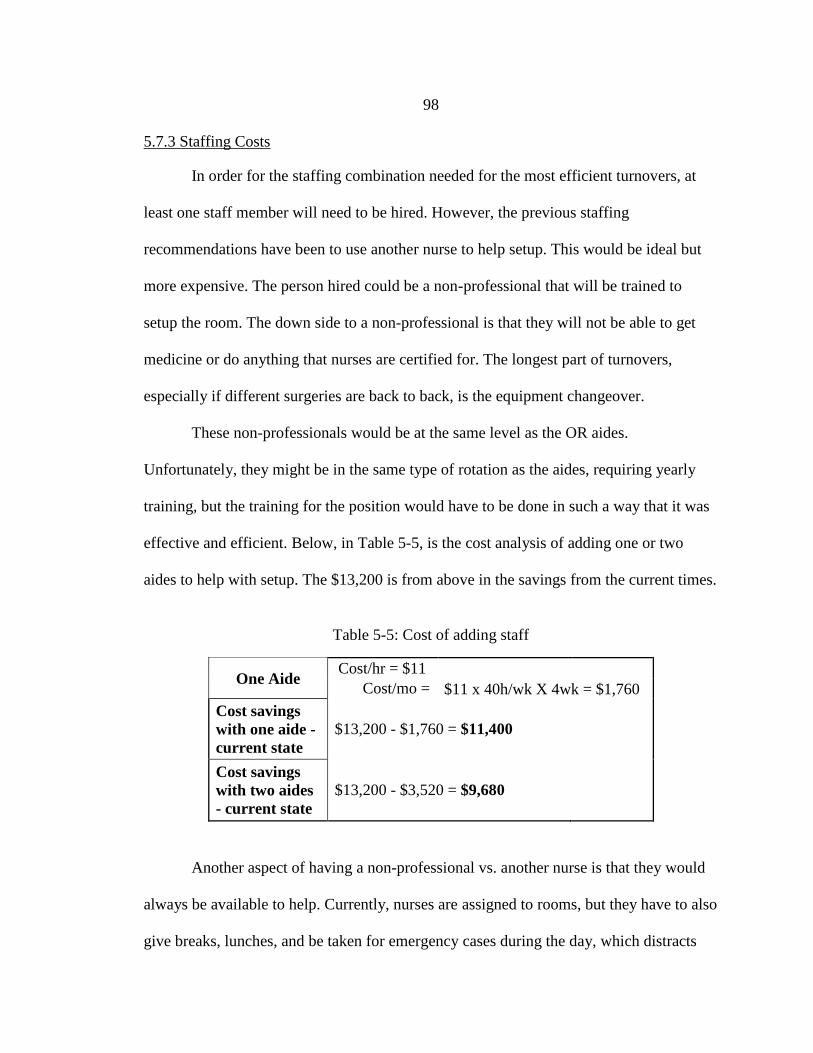
98
5.7.3 Staffing Costs
In order for the staffing combination needed for the most efficient turnovers, at
least one staff member will need to be hired. However, the previous staffing
recommendations have been to use another nurse to help setup. This would be ideal but
more expensive. The person hired could be a non-professional that will be trained to
setup the room. The down side to a non-professional is that they will not be able to get
medicine or do anything that nurses are certified for. The longest part of turnovers,
especially if different surgeries are back to back, is the equipment changeover.
These non-professionals would be at the same level as the OR aides.
Unfortunately, they might be in the same type of rotation as the aides, requiring yearly
training, but the training for the position would have to be done in such a way that it was
effective and efficient. Below, in Table 5-5, is the cost analysis of adding one or two
aides to help with setup. The $13,200 is from above in the savings from the current times.
Table 5-5: Cost of adding staff
One Aide Cost/hr = $11
Cost/mo = $11 x 40h/wk X 4wk = $1,760
Cost savings
with one aide -
current state
$13,200 - $1,760 = $11,400
Cost savings
with two aides
- current state
$13,200 - $3,520 = $9,680
Another aspect of having a non-professional vs. another nurse is that they would
always be available to help. Currently, nurses are assigned to rooms, but they have to also
give breaks, lunches, and be taken for emergency cases during the day, which distracts
99
from their original tasks. Just as the current aides are available for all turnovers, aside
from rotating one out at a time for breaks and lunches, this new position would be
similar. The job description would have to be defined, but it is assumed that they would
have extra tasks on top of doing turnovers to make sure they are used well.
5.8 Failure Mode and Effects Analysis
The Failure Mode and Effects Analysis (FMEA) done on the setup process in the
OR proved to show some interesting results. The FMEA tables can be seen in Appendix
E and have the topics which are discussed highlighted. For healthcare, FMEA is slightly
different because even when a score is low, if the severity is high, it is a failure. The
severity index will most likely be directly related to a patient or staff’s safety. The
Occurrence is different due to the non-manufacturing environment. A 10, meaning that it
happens more than once a day, which can be a high percentage, but not necessarily an
“inevitable failure” or >30% as it is described in the criteria of occurrence. The criterion
for a critical failure in this FMEA is: if the Severity is a 9 or 10, or if the Risk Priority
Number (RPN) is greater than 300.
The FMEA backs up observations that there are multiple problem areas adding to
turnover time and complexity. Also, the fact that some of the smaller failures could lead
to large patient safety issues was an important point to understand. Due to the time period
and focus of this research, all of the problems were not able to be addressed. The
following several potential problems identified by the FMEA:
100
5.8.1 Chart Unavailable
Having the chart unavailable is not a severe situation, but due to the frequency
and how well it is not detected leads to it becoming a problem for the setup and prep of
the turnover. Usually someone else in periop has the patient’s chart and a different person
needs it. There is no indicator of if it is missing or who took it, so when someone needs it
they do not know if it is with someone or if it was just left in the patient’s room.
5.8.2 Run Out of IV Supplies
If periop were to run out of IV supplies (tubing, needles, or solution), it would
take time to get more from central supply – thus delaying cases. However, if central
supply was out, then multiple problems throughout the hospital would occur. OR related
problems would include delaying or canceling surgeries which are critical to a patient’s
health, especially if it was an emergency.
5.8.3 Patient Late – Staff Rushing
While the OR staff are always running around rushing to get things done because
cases are consistently running over or behind, if a patient is late this affects their speed
even more. When a patient shows up late, the staff has to work harder and faster to try to
get the patient ready because if the patient is not ready when the doctors are, the surgeons
will be upset at the staff– even if it is not their fault. When healthcare workers (periop or
OR nurses in this case) are rushed to get their job done, they could miss steps. Missed
steps in the healthcare field can sometimes mean life or death. Therefore, if the staff
101
member is rushing, there is more of a chance of a mistake or failure trying get everything
correct and finished.
5.8.4 Waiting for Surgeon/Anesthesia
Waiting for surgeons or anesthesiologist numbers were high, but mainly due to
the fact that it happens frequently and there is not a current control measure in place to
prevent them from happening: patient asking too many questions, patient in the
bathroom, and labs are late. The patient should be allowed to ask as many questions as
they want or need to both the surgeon and anesthesiologist. Patients should also be
allowed to go the restroom before going into surgery, but technically someone should ask
them prior to the OR nurse arriving so that they are not held up with this delay. Labs
being late are due to the lab and their ability to deal with larger volumes and get them
back to the “customer” (different departments) in a timely manner. This is a separate
issue due to the fact that the lab is a separate department on the other side of the hospital.
5.8.5 Patient has Unforeseen Circumstance
When a patient has an unforeseen circumstance, it increases the turnover time,
and when it is combined with lab tests, the delay can be greater. An unforeseen
circumstance with a patient could be: that they have an extra implant that was not
discussed prior to arrival and needs to be dealt with in a special way, or they have a
different health problem during admittance – such as an odd heartbeat. The circumstance
of having an implant is, for the most part, a solvable issue. The surgery center across the
street from the hospital asks each patient a slew of questions prior to coming in for
102
surgery, and it is not known currently what types of questions are asked at BDH.
However, this would be a suggestion for BDH to look into because if they can ask
patients ahead of time some of the admittance questions they might be able to solve some
issues before the patient even arrives.
5.8.6 Patient Banded Incorrectly
A patient being banded incorrectly can become a very large patient safety issue
because they are banded with patient identifiers and allergies. If any of those pieces of
information are wrong or missing, the patient could, for example, get the wrong
procedure or receive the wrong medicine, causing severe conditions.
5.8.7 Unclean Environment
Any part of an unclean environment in an OR is dangerous, but if a step is missed
in the cleaning or setup, there could be a risk of contamination. Contamination between
patients of different surgeries can contribute to blood borne diseases or infections. Thus
setting up the hospital for legal difficulties and paying for more patient care than they
otherwise would if it was the hospital’s fault.
5.8.8 Too Many Staff Cleaning
When too many staff help clean the room between surgeries, there is the risk of
communication breakdowns and equipment being missed during cleaning. If this
happened, there is, again, risk of contamination which increases danger for patients.

103
5.8.9 Sterile Field Broken
If a sterile field is broken, especially during surgery, this is an increased risk of
contamination or infection for the patient. If something is dropped, it is not used for that
surgery (it gets reprocessed), and possibly thrown away – depending on the instrument.
There is nothing that can be put into place for this problem, but vigilance on the both
ends, the person holding items and the nurse in the room, is required.
5.8.10 Room Ready, Patient Not
When a patient is not ready for their OR, it will increase the turnover time, thus
increasing the cost to the hospital. When staff wait for labs and have unforeseen
complications with the patient, there may be larger delays. One thing about delays is that
they are usually not severe to the patient, unless it is a trauma and the tests, labs, etc. are
not getting done in a timely manner
5.8.11 Supplies Come Unsterile –
Increase Possibility of Infection
There have been times when items from suppliers come unsterile to the hospital,
but other situations such as SPD not cleaning completely OR the flash sterilizers not
getting hot enough occur. However, these conditions do not happen often. When they do
happen, it can be a large hazard to the patient either through contamination, infection, or
blood borne illnesses.

104
5.9 Infection Rates
Infection rates are one of the measures to see the effects on the system for
changes. Even though it is not used for a hypothesis test, it is important to see if or how
the changes in the OR effected possible hospital-borne infections. Hip and knee
arthroplasty infections are very expensive and complicated if acquired. They are
especially expensive if it is acquired in the hospital because the hospital has to cover
those costs. Overall, the infection rates of total hip and knee arthroplasties went down, as
seen in Table 5-6. However, the infection rate for knees had a slight increase.
Table 5-6: Infection Rates for Total Hip and Knee Cases
Jan-Aug 2011 # of Infections ∑ Surgeries % Infections
Hip 2 135 1.48%
Knee 3 168 1.78%
Total 5 303 3.26%
April-June 2012
Hip 0 56 0%
Knee 1 47 2.13%
Total 1 103 2.13%
These data show that the improvements in the OR did not make the infections
worse. It cannot be said that the flexible cleaning SOP decreased the infection rates due
to so many other factors which can contribute to an infection. Some other elements which
can contribute to infections are: breaking the sterile field, patient statistics and history,
number of people in the room, length of surgery, equipment/supplies used to close the
patient, and the surgeon’s techniques.

105
5.10 Periop Data
Since the standard deviation in the cleaning and nurse setup had decreased, the
variant in the turnover was getting the patient. Therefore, observation in periop and in the
OR simultaneously was performed to help understand the cause. The researcher had two
assistants in periop observe the process of getting the patients admitted until the patient
leaves for the OR, and one assistant to watch the turnovers. The two data were combined
into one swimlane chart to help see the interactions. An example of them is seen in
Figure 5-14, below.
Figure 5-14: Periop Data Example
The results from the observations did not show anything that would be either
easily fixable in the amount of time available, or that contributed to a large amount of the
problem. This data combined with the delay codes confirmed that there are multiple
aspects of this process that are currently highly variable and need further study.
106
5.11 Delay Codes
Delay codes are reasons for a surgery being held up and entered into the patient’s
EHR by the circulating nurse. BDH has four categories of delays: Anesthesia, OR,
Patient, and Surgeon. Each of the four categories has between 10-20 different codes.
However, the problem with delay codes is that only some of the nurses use them, they
might not have all of the information about the delay, or the delay codes are so vague that
the nurse may mean something different than specified.
5.11.1 Anesthesia Delay Codes
Anesthesia codes do not have anything significant that was dealt with in the
improvement efforts, but they certainly point out areas for improvement. Figure 5-15
shows the anesthesia delay codes, and the greatest one is a block injection for the patient
– at over 50%. Most of the time, patients who are getting joint replacement, spinal
surgery, or other major surgeries, a nerve block is done to help with pain management.
Most cases are known ahead of time, at least the day before, whether or not a patient will
be getting a block. Therefore, there should be a system in place which decreases the
amount of setup time and has the patient completely ready to go when the
anesthesiologist gets to periop to perform the procedure.
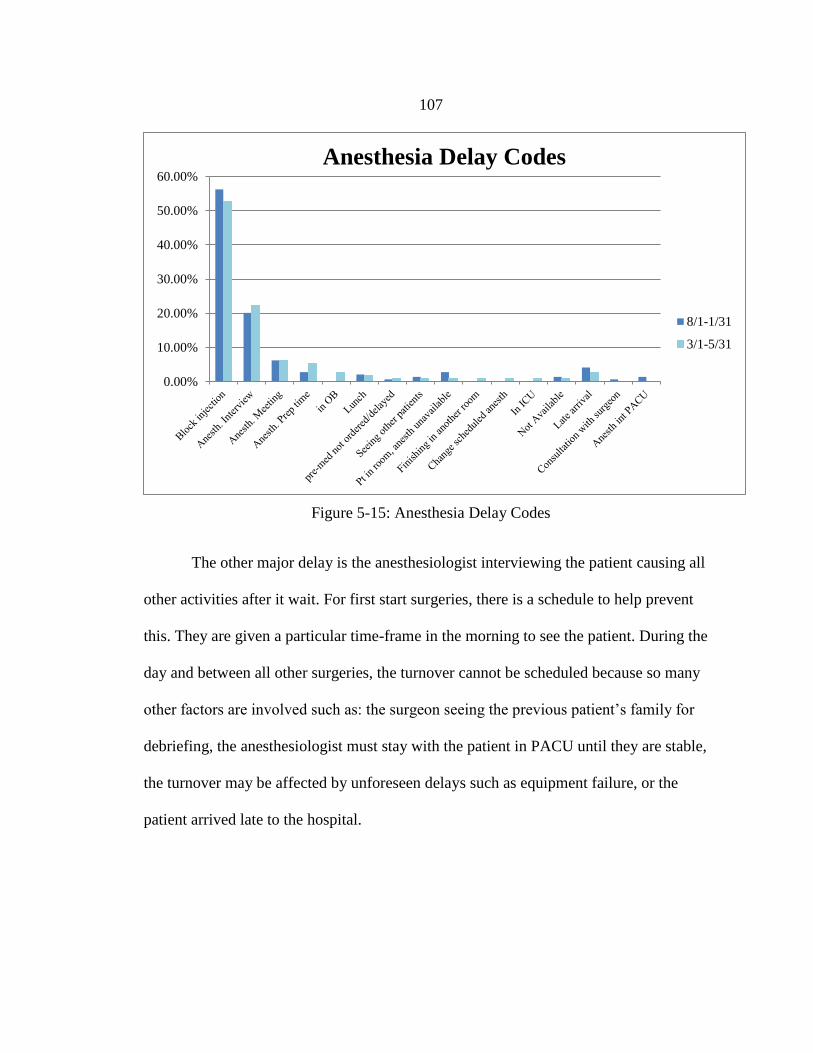
107
Figure 5-15: Anesthesia Delay Codes
The other major delay is the anesthesiologist interviewing the patient causing all
other activities after it wait. For first start surgeries, there is a schedule to help prevent
this. They are given a particular time-frame in the morning to see the patient. During the
day and between all other surgeries, the turnover cannot be scheduled because so many
other factors are involved such as: the surgeon seeing the previous patient’s family for
debriefing, the anesthesiologist must stay with the patient in PACU until they are stable,
the turnover may be affected by unforeseen delays such as equipment failure, or the
patient arrived late to the hospital.
0.00%
10.00%
20.00%
30.00%
40.00%
50.00%
60.00%
Anesthesia Delay Codes
8/1-1/31
3/1-5/31
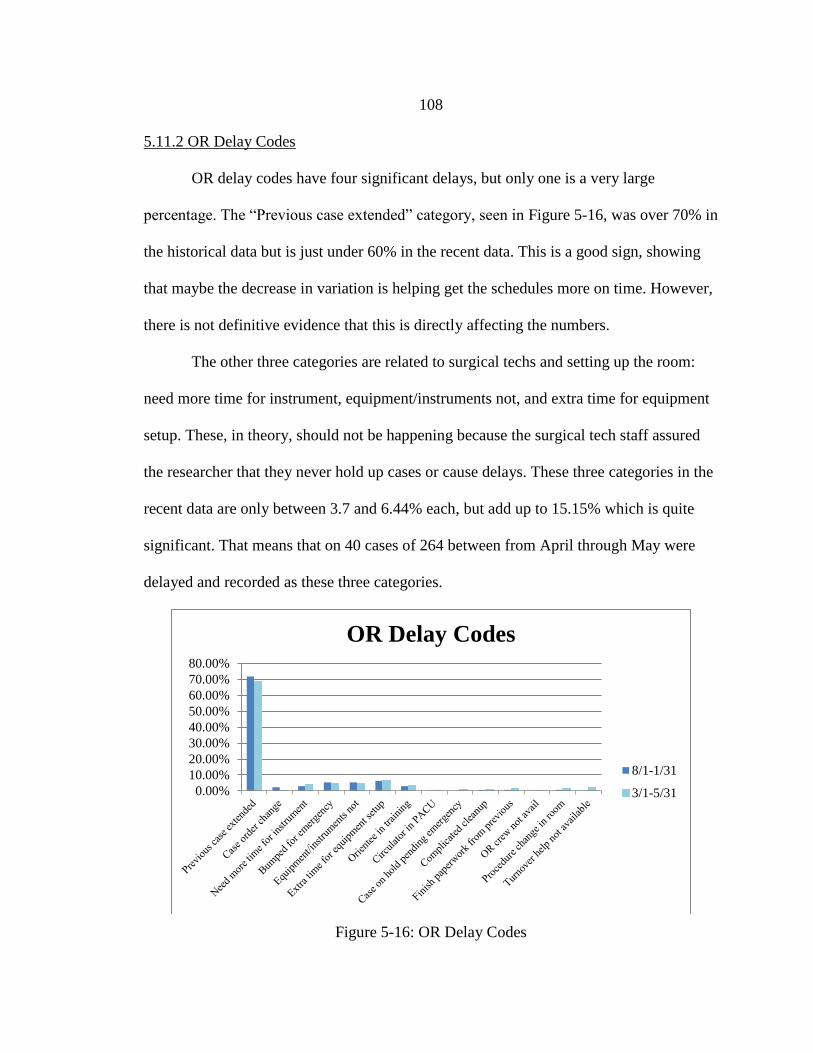
108
5.11.2 OR Delay Codes
OR delay codes have four significant delays, but only one is a very large
percentage. The “Previous case extended” category, seen in Figure 5-16, was over 70% in
the historical data but is just under 60% in the recent data. This is a good sign, showing
that maybe the decrease in variation is helping get the schedules more on time. However,
there is not definitive evidence that this is directly affecting the numbers.
The other three categories are related to surgical techs and setting up the room:
need more time for instrument, equipment/instruments not, and extra time for equipment
setup. These, in theory, should not be happening because the surgical tech staff assured
the researcher that they never hold up cases or cause delays. These three categories in the
recent data are only between 3.7 and 6.44% each, but add up to 15.15% which is quite
significant. That means that on 40 cases of 264 between from April through May were
delayed and recorded as these three categories.
Figure 5-16: OR Delay Codes
0.00%
10.00%
20.00%
30.00%
40.00%
50.00%
60.00%
70.00%
80.00%
OR Delay Codes
8/1-1/31
3/1-5/31
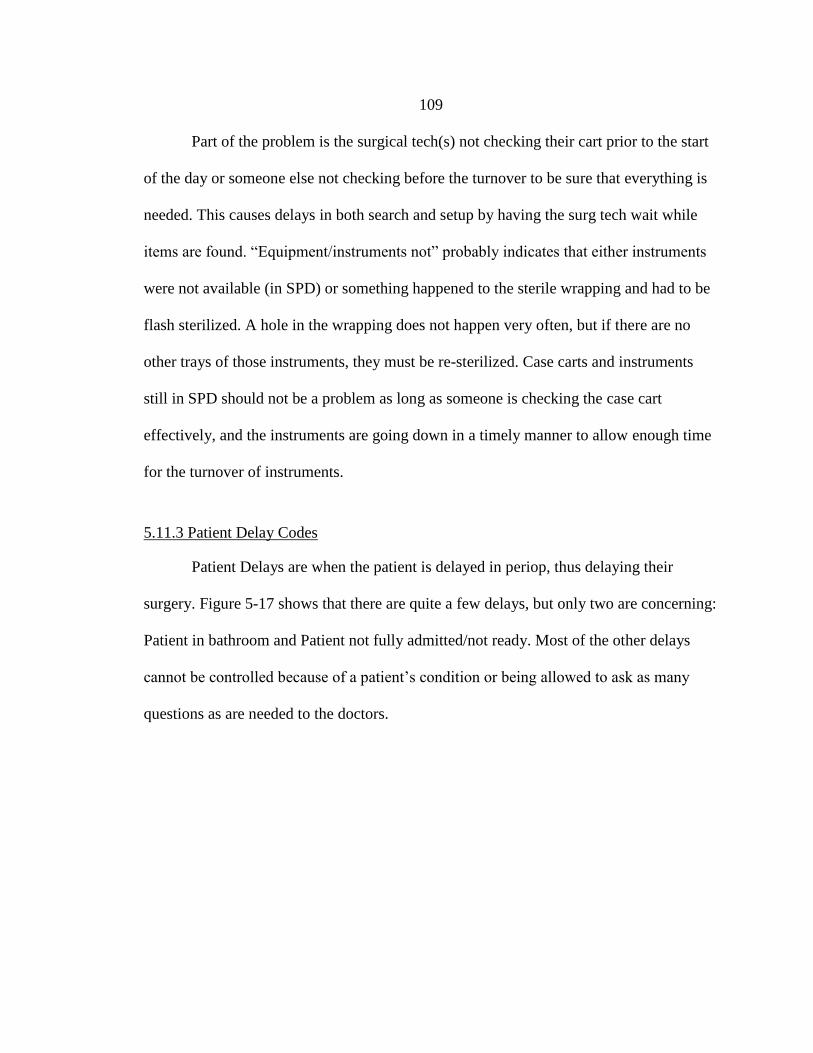
109
Part of the problem is the surgical tech(s) not checking their cart prior to the start
of the day or someone else not checking before the turnover to be sure that everything is
needed. This causes delays in both search and setup by having the surg tech wait while
items are found. “Equipment/instruments not” probably indicates that either instruments
were not available (in SPD) or something happened to the sterile wrapping and had to be
flash sterilized. A hole in the wrapping does not happen very often, but if there are no
other trays of those instruments, they must be re-sterilized. Case carts and instruments
still in SPD should not be a problem as long as someone is checking the case cart
effectively, and the instruments are going down in a timely manner to allow enough time
for the turnover of instruments.
5.11.3 Patient Delay Codes
Patient Delays are when the patient is delayed in periop, thus delaying their
surgery. Figure 5-17 shows that there are quite a few delays, but only two are concerning:
Patient in bathroom and Patient not fully admitted/not ready. Most of the other delays
cannot be controlled because of a patient’s condition or being allowed to ask as many
questions as are needed to the doctors.
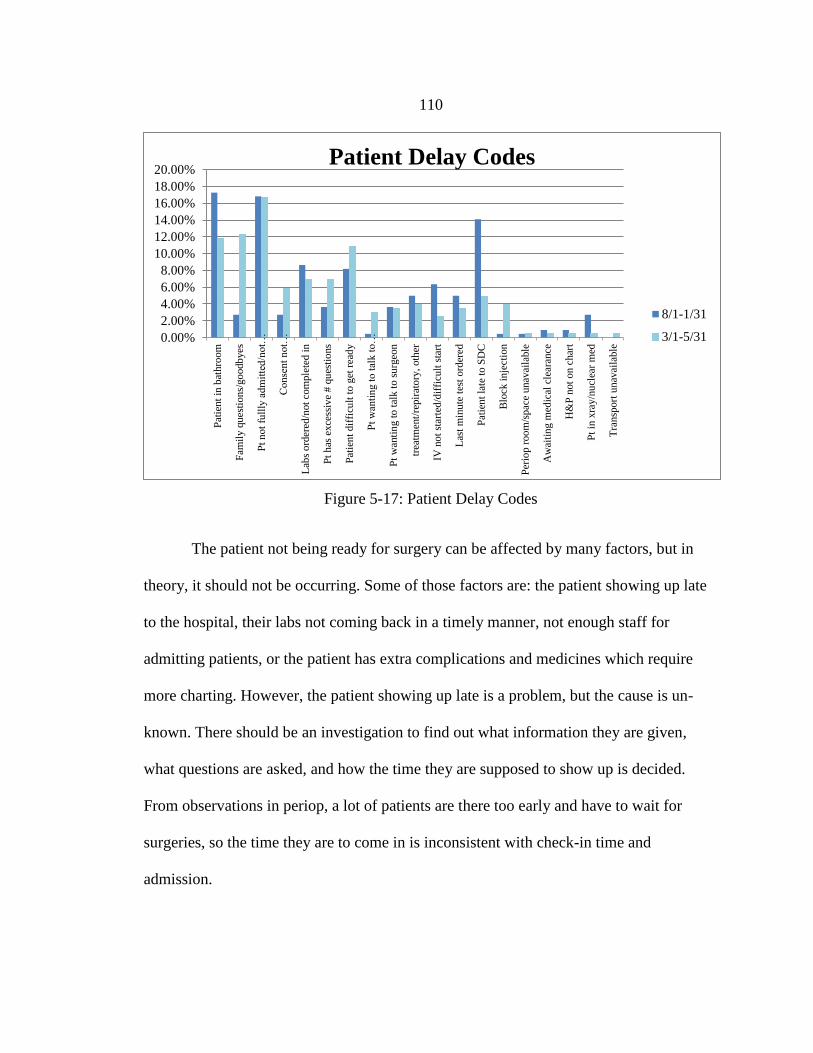
110
Figure 5-17: Patient Delay Codes
The patient not being ready for surgery can be affected by many factors, but in
theory, it should not be occurring. Some of those factors are: the patient showing up late
to the hospital, their labs not coming back in a timely manner, not enough staff for
admitting patients, or the patient has extra complications and medicines which require
more charting. However, the patient showing up late is a problem, but the cause is un-
known. There should be an investigation to find out what information they are given,
what questions are asked, and how the time they are supposed to show up is decided.
From observations in periop, a lot of patients are there too early and have to wait for
surgeries, so the time they are to come in is inconsistent with check-in time and
admission.
0.00%
2.00%
4.00%
6.00%
8.00%
10.00%
12.00%
14.00%
16.00%
18.00%
20.00%
Pat
ien
t in
bat
hro
om
Fam
ily q
ues
tion
s/go
odb
yes
Pt
not
full
ly a
dm
itte
d/n
ot…
Co
nse
nt
not…
Lab
s o
rder
ed/n
ot
com
ple
ted i
n
Pt
has
ex
cess
ive
# q
ues
tio
ns
Pat
ien
t dif
ficu
lt t
o g
et r
ead
y
Pt
wan
tin
g t
o t
alk t
o…
Pt
wan
tin
g t
o t
alk t
o s
urg
eon
trea
tmen
t/re
pir
ato
ry,
oth
er
IV n
ot
star
ted
/dif
ficu
lt s
tart
Las
t m
inu
te t
est
ord
ered
Pat
ien
t la
te t
o S
DC
Blo
ck i
nje
ctio
n
Per
iop r
oo
m/s
pac
e unav
aila
ble
Aw
aiti
ng m
edic
al c
lear
ance
H&
P n
ot
on c
har
t
Pt
in x
ray/n
ucl
ear
med
Tra
nsp
ort
un
avai
lable
Patient Delay Codes
8/1-1/31
3/1-5/31

111
The “patient in bathroom” delay code indicates that the patient needed to go to the
bathroom either right before the OR nurse arrived, or asked the nurse if they could go
before they left for the OR. The patient going to the bathroom cuts into the turnover time,
thus increasing it. There is some uncertainty in this due to patients being nervous or the
patient’s age, but it should be more manageable. The patient should have enough time
right before the OR nurse comes down to get the patient so they do not have to wait.
5.11.4 Surgeon Delay Codes
The delay codes for surgeons are fewer than the others, but the top delays have
fairly high percentages, as seen in Figure 5-18. After a surgery is completed and the
patient is being closed, most surgeons leave the room and their PA finishes the job.
Therefore, since they are the first people out of the room, they should not be the person
the OR is waiting for to get the patient to surgery. However, the fact that OR nurses have
to wait for the surgeons to finish talking with the patients still happens often. It is true
that the patient should be allowed as much time as they want to ask questions, but the
surgeon should technically arrive earlier.
112
Figure 5-18: Surgeon Delay Codes
The surgeons have to talk to the patient’s family from the surgery they just
completed and record their dictation of the surgery, but from the time they leave the room
until the time the OR nurse is getting the patient is usually more than 20 minutes. During
this time, surgeons also seem to disappear. The largest delay is “surgeon not available”
which either means they have to be called overhead (hoping they are still in the OR
department) or called on their phone to let them know their patient is ready for them.
They have been known to go back to their offices in the hospital and lose track of time,
thus needing to be called.
Surgeons are not needed as soon as the patient enters the room, they go in when
the patient is prepped ready for surgery, which can be another 10-20 minutes after the
patient is in the room. Overall, the surgeon has between 30-50 minutes between the time
0.00%
10.00%
20.00%
30.00%
40.00%
50.00%
60.00%
Surgeon Delay Codes
8/1-1/31
3/1-5/31
113
they leave the room until they are needed again, if everything is running smoothly.
However, surgeons are the ones who complain the most if the turnovers are taking a long
time and if cases are getting held up. Even though the surgeons not being available does
not hold up the turnovers and cost the hospital money, they are causing their own case to
go longer which in turn will affect all other cases after it.
114
6. CONCLUSIONS
6.1 Cleaning Procedure
The flexible cleaning SOP successfully decreased the time and standard deviation
of the cleaning part of the turnover. The procedure decreased the time from 11.80
minutes to 10.43 minutes with potential to improve even more once the new aides are off
of the learning curve. Along with the time decrease, the standard deviation decreased
from 5.22 minutes to 1.93 minutes. This helped with reducing the overall turnover
variability, especially when used concurrently with the swimlane chart identifying which
staff are to do the specified tasks required for a turnover. The flexible cleaning SOP also
proved to work in all types of surgery, not just certain types, which is not currently
documented in literature.
6.2 Standardization of Jobs and
Decrease in Standard Deviation
Prior to any implementations, the staff essentially had a free-for-all during the
turnover between the amount of staff available, who performed the tasks required, and
the lack of communication for all aspects. The key phrase that was used with the staff
was “work smarter, no harder” indicating that if they thought about their actions and
thought ahead for cases, they would not be “fighting fires” during the turnovers, adding
time. When the swimlane chart is followed and all of the staff members are available for
turnovers, the times and variability decrease. The swimlane mostly depends on three key
points:

115
1. There is a nurse facilitator, or similar, to help with equipment and setup,
2. At least two aides are available for cleaning and follow the cleaning SOP, and
3. There is a surgical tech facilitator available to help with equipment and the in-
room surgical tech needs.
The overall turnovers decreased by about two minutes, from 36.43 to 34.38. This
is not very much time, but when repeated 50 times a week and with a cost of $33/minute,
savings can be significant. The standard deviation decreased from 15.34 minutes to 13.52
minutes. This decrease will be good in the future for scheduling. If the turnovers are more
predictable, then the scheduled times should not veer as much as they had been.
However, the scheduling of the surgeries themselves and the accuracy in which they are
scheduled is something to be looked at in the future to help the OR run more efficiently.
6.3 Standard Procedure and Effects on Infection Rates
The cleaning SOP did not have a negative effect on the infection rates of patients,
but it cannot be said that the cleaning procedure directly affected the infection rates.
There are multiple factors which can influence the outcomes of a patient, but the cleaning
method might have contributed to less contamination between cases.
6.4 Change in Staffing Patterns
As discussed, the ideal staffing pattern would have 3 people cleaning, 1 person
helping the nurse (or nurse facilitator), and 1 surgical tech helping the in-room tech (3-1-
1). The data collected backed up that if there is a person helping the CRN with equipment
and setup, the turnover will be statistically faster, as long as there are 2 or 3 people
following the flexible cleaning SOP. Concurrent use of the standardized cleaning
116
procedure and an extra person to help with equipment and setup is important. If these two
tasks are done by different people and use effective communication, the staff will have
the potential to decrease turnover times even further.
As of July, the staffing patterns were still being worked out for a nursing
facilitator. However, in the future, it looks like they are going to move the way of more
“un-skilled” labor for helping setup and turnover of equipment. The cost analysis shows
that as long as the current improvement is maintained and possibly improved, the OR
department should be able to hire 1-2 more aides.
6.5 Developing Standardized Work
This section is to help understand the methods which an improvement team would
go through and use to create and implement standardized work for a process. There are
also lessons learned from the author to help improve the methods.
6.5.1 Observation
When starting to create standardized work, observation is the first step. It allows
the improvement team to understand what is going on, how different staff types interact,
the culture, tasks that are performed, and the difference between policy (what they think
they do) versus what people actually do. If there is no observation, it may lead to the
improvement team creating the wrong standardized work or policies that do not apply to
the jobs/staff/tasks involved.
During this period, the team/observer(s) should be documenting all of the
observations so that it can be reviewed with the improvement team and be in a useful way

117
such as: listing tasks from start to finish of the process, splitting up the tasks into
categories, and what the different staff types do and their interactions. This is also a good
time to find out if there is data that can be acquired to help with the understanding of the
process. The data can be from a database of times, required forms, schedules, etc.
Visual tools are very useful in this stage. Some examples of visual tools include:
spaghetti diagrams, frequency tables, among others. For example, Appendix C presents
spaghetti diagrams performed for this research.
6.5.2 Interview and Staff Involvement
Once the improvement team understand the process, it is important to discuss
with the staff what was observed. This facilitates a discussion with the staff about the
differences between what was observed and what is supposed to be happening (if it is
even defined). It also allows clarification for an observation and if some of the actions are
required, personal preferences, or “how it is done.” This should also let the improvement
team know if there are precedence to tasks, and if there are precedences then ask why
they are there or where did they come from. Critical path diagrams are good to record and
display such precedence. There might also be other factors that affect the observations,
such as: department interaction, staff types, policies, and schedules.
One example from this research that made a difference when involving the staff is
talking about following the flexible cleaning SOP. They were not completely following
the steps, but when the flexible cleaning SOP and the patient safety issues were talked
about together with the staff, it opened their eyes to the fact that following a procedure

118
that did the same thing every time would help them create a safer environment for their
patients. It wasn’t just about money any more, like they had heard their manager discuss
multiple times, they were making a difference for their patients by following this new
procedure.
6.5.3 Similarities of Task Type
One phrase that can be heard about healthcare is that standardization and
standardized work are hard to implement because “every patient is different.” There is no
way to predict what can happen or be able to make every process the same. With this in
mind for the cleaning procedure, higher level tasks were observed and documented that
happen in every turnover. Yes, there is going to be different equipment, different setups
because each nurse or doctor likes their room a particular way, and patient complications
happen, but these tasks were not surgery specific. Every room needed to be cleaned,
linens on the bed needed to be changed, contaminated supplies, instruments, and trash
needed to leave the room; and every room needed to be mopped. The only thing about
each task is that there is variability in how long each individual task takes depending on
the case. The importance of understanding how to unlink the prejudices of the staff from
the everyday work was important in getting the standardized cleaning procedure to be
created.
If an experiment/pilot is going to be performed, see if there are similar tasks that
can be used before going into all aspects (in this case, types of surgery). The
documentation from the observation period is useful at this time. The tasks in the process
should be categorized by surgery type. If the tasks take place for all, then it is a universal

119
task, and if it only happens for specific surgeries it belongs in that category. Other
categories for different aspects of the hospital could be similar to: types of x-rays/scans,
need to take samples (blood, urine, etc.) for tests, triage level, or admitting different types
of patients. For this research, the researcher was looking for universal tasks so that all
turnovers could be improved.
The data provided by the hospital will also help to see any patterns or similarities
for the different categories. Large data sets can give trends or suggestions for the
categories by the number of times the category occurs, the time frame in which the
categories occur, or a specific provider. The data provided frequency to help the
researcher find out the most common surgeries so that data collection was easier, would
take less time, and a larger sample size would be available.
6.5.4 Mapping and Identifying Sources of Waste
After observing the tasks of the process, map the activities so that sources of
waste can be found. Mapping will also visually show the staff and improvement team
what is going on. There are different types of mapping, but use what works best for the
process. Some types of mapping are value stream mapping, flow chart and swimlane. If
multiple departments are in a process, use the swimlane or value stream map. The key to
the value stream map is that the process being mapped is from the customer’s, or
patient’s, point of view.
Once the process is mapped, start looking for elements of waste such as:
searching, walking, and duplication of tasks. DOWNTIME is a good way to remember
waste:
120
- Defects and errors
- Overproduction
- Waiting
- Not using human potential
- Transportation
- Inventory
- Motion
- Excess processing
Other things to think about when looking at the map are things that can be
controlled. If activities or tasks are happening out of order according to a policy or
guideline, it is able to be changed? In the case of turnovers, it was finding tasks that
happened during the turnover that could be moved to before or after the turnover. For
example, preparing equipment beforehand or putting equipment away after a turnover did
not have to happen during a turnover.
6.5.5 Timing
After mapping the tasks, times need to be collected for each of the individual
tasks. The tools needed for timing are minimal: stopwatch, paper, pen/pencil, and the
tasks to be timed. To make timing easier, come up with a standardized list of tasks which
will be timed to make sure that the same tasks are being timed every time. This list will
also help to know what signifies the end of one task and the beginning of another.
There are multiple troubles to look out for when timing. One thing to keep an eye
on is waiting time; it should not be considered a task. As mentioned above, it is a waste.
It is important to keep track of the waiting time, but it is not a value to the patient or the
staff member. Secondly, one person might do a task differently than another, so keep this
in mind when timing them to make sure that they are actually doing the same task. Lastly,

121
keeping track of how many people are doing a task or the number of people actually
needed to perform a task is important. This will also help identify wasted time and
resources.
6.5.6 Build Visual Instructions
Part of creating standardized work is documenting the work. In the case of the
OR, visual documentation was done. It was done in a way that could be easily understood
by anyone. The flowchart-like document showed the flow and tasks to be done by each
individual. If a flowchart or simple instructions with pictures work better for the process,
then use what works best to help the staff remember. Test out the visual instructions with
multiple staff and staff types before implementing because the purpose of visual
instructions is to help the staff easily know how to perform the standardized work and be
able to remember it.
6.5.7 Pilot Run
After visual instructions have been written, it is important to test the standardized
work that the improvement team wants to implement. This pilot is the reason different
categories were identified earlier. Making changes throughout an entire department
before even trying the improvement could cause large problems in flow, patient
satisfaction, patient safety, or staff satisfaction. Choose a category, for example knee and
hip arthroplasties in the OR department, to do the pilot implementation with that the team
thinks will be able to take change for a specified period of time well.
122
During the implementation, it is important to be timing the tasks and checking
that the visual instructions are actually being followed. This pilot will let the team know
if the improvement is making the difference that they set out to do according to the
measures chosen such as: time, number of infections, decreasing wait time, number of
patients per nurse, number of procedures a day, etc. Along with timing, be sure to get
feedback from the staff about the changes so that the improvement team understands the
effects that the pilot is having on the process.
6.5.8 Implement Changes
Implementing changes full scale is able to happen after a successful pilot. The
staff should have given sufficient feedback to help make changes, if needed, to the visual
instructions to make the complete implementation more successful. Prior to the
implementation, it is important that everyone involved in the department or area knows
what is going on and has received training if needed. Having the staff who were involved
in the pilot doing the training will help facilitate a culture which encourages change and
facilitating communication between the staff members. Management must also be
completely on board to fund and support the implementation if needed. If the
organizational structure does not support the changes, then they will not stay in place for
long. The goal of the standardized work is to improve the process and stay in place for
continuous improvement.
123
6.5.9 Sustain
Finally, the management has an important role to play in getting the staff to
comply with the standardized work. As with any process improvement model (e.g.,
DMIAC, PDCA) there is a step which sets the standards into place and are monitored to
make sure that it is still the best way to do the work. If the process is not checked every
so often, there is no feedback to tell the workers how they are doing and if the changes
are working. The hospital does not currently have a way of monitoring the process. The
database collects the data, but it is not easily extracted or used of it has been extracted.
The other problem with the lack of monitoring is accountability. Currently, there is no
accountability of the work (getting done correctly or not) once inside the OR. The culture
needs to be one that is supportive of change and encourages each other instead of a blame
culture.
After the implementation, it is not only important to sustain the improvement
effort, but also to re-check the process for other improvements. The process is not going
to stay the same forever. Therefore, making updates and changes to the standardized
work is important for keeping the process as efficient as possible. This can be done by
starting over at step one and completely re-evaluating the system, or by keeping an
informed team member on the monitoring process for changes that need to be addressed.
6.8 Future Research
With the decrease in variability, the turnovers should help the surgery schedule to
become more accurate and minimize the delays. However, the actual surgeries are not

124
being scheduled correctly because they are always over or far under the expected times,
thus throwing off all other departments which interact with the OR. Scheduling should be
addressed, along with how long turnovers for each type of surgery should take so that
staff members know if they are taking too long.
Periop should also be studied for how patient arrivals are decided and how long it
takes to check a patient in. The observations in periop showed that the patients were
waiting for longer than it took to check them in most of the time. It is understandable that
having a patient ready for surgery early is helpful because if the previous case is early,
the patient is ready and not holding up the turnover. This waiting probably does not lead
to satisfied patients because there is no indication as to why they are sitting in a room for
an undisclosed period of time.

125
REFERENCES CITED
126
Adler, P.S. (1997). “Work Organization: From Taylorism to Teamwork.” Draft for IRRA.
Adler, P.S., B. Goldoftas, and D.I. Levine (1999). “Flexibility Versus Efficiency? A Case
Study of Model Changeovers in the Toyota Production System.” Organization Science
10(1): 43-68.
Alverez, G. and E. Coiera (2006). “Interdisciplinary communication: An uncharted
source of medical error?” Journal of Critical Care 21: 236-242.
Bakken, S. J.J. Cimino, and G. Hripcsak (2004). “Promoting Patient Safety and Enabling
Evidence-Based Practice Through Informatics.” Medical Care 42(2): 1149-1156.
Beyea, S. (1999). “Standardized Language – Making Nursing Practice Count.” AORN
70(5): 831-838.
Bozeman Deaconess Hospital (n.d.) About Us. Retrieved from:
//www.bozemandeaconess.org
Cabana, M.D., C.S. Rand, N.R. Powe, A.W. Wu, M.H. Wilson, P.C. Abboud, H.R. Rubin
(1999). “Why Don’t Physicians Follow Clinical Practice Guidelines?” Journal of the
American Medical Association 282(15): 1458-1465.
Cima, R. R., M.J. Brown, J.R. Hebl, R. Moore, J.C. Rogers, A. Kollengode, G.J Amstutz,
C.A. Weisbrod, B.J. Narr, C. Deschamps (2011). “Use of Lean and Six Sigma
Methodology to Improve Operating Room Efficiency in a High-Volume Tertiary-Care
Academic Medical Center.” The Journal of American College of Surgeons 213(1): 83-92.
Danis, D., Klinker, G., Malec, A., and Rees, S. (2007). Improving Patient Safety by
Standardizing Handoff Communications. Clinical Nurse Specialist, 21 (2), 106.
de Mast, J., B. Kemper, R.J.M.M. Does, M. Mandjes, Y. van der Bijl (2011). “Process
Improvement in Healthcare: Overall Resource Efficiency.” Quality and Reliability
Engineering International 27: 1095-1106.
Dittel, A., S. Göttlich, U. Ziegler (2011). “Optimal design of capacitated production
networks.” OPTIM Proceedings of the International Conference 12: 583-602.
Freivalds, A. (2009). Niebel’s Methods, Standards, and Work Design (12th
edition).
McGraw-Hill, New York, NY.
Friesdorf, W., B Buss, I. Marsolek (2007). “Patient safety by treatment standardization
and process navigation – a systems ergonomics management concept.” Theoretical Issues
in Ergonomics Science 8(5): 469-479.
127
Gawande, A. (2009). The Checklist Manifesto: How to Get Things Right. New York,
New York, Picador.
Graban, M. (2012). Lean Hospitals. Boca Raton, Florida, CRC Press.
Harders, M., M.A. Mlangoni, S. Weight, T. Sidhu (2006). “Improving operating room
efficiency through process redesign.” Surgery 140(4): 509-516.
Haynes A.B, T.G. Weiser, W.R. Berry, S.R. Lipsitz, A.S. Breizat, E. Patchen Dellinger,
T. Herbosa, S. Joseph, P.L. Kibatala, M.C.M. Llapitan, A.F. Merry, D. Moorthy, R.K.
Reznick, B.Taylor, A.A. Gawande (2009). “A Surgical Safety Checklist to Reduce
Morbidity and Mortality in a Global Population.” The New England Journal of Medicine
360(5): 491-499.
Helmreich, R.L. and J.M Davies (2004). “Culture, threat, and error: lessons learned from
aviation.” Canadian Journal of Anesthesia 51(6): R1-R4.
Holtman, M.C. (2011). “Paradoxes of professionalism and error in complex systems.”
Journal of Biomedical Informatics 44: 395-401.
Health and Safety Executive (2009). Reducing error and influencing behavior. Health and
Safety Executive of the United Kingdom.
Krichbaum, B.D. (2008). Standardized Work: Creating Continuous Flow. A seminar by
Process Coaching Incorporated,
www.processcoachinginc.com/Forms/Standardized%20Work.ppt , retrieved July, 2011.
Kosnik, L.K., J. Brown, R. Maund (2007). “Patient Safety: Learning from the aviation
industry.” Nursing Management 38(1): 25-31.
Lehmann, C.U., M.R. Miller (2004). “Standardization and the Practice of Medicine.”
Journal of Perinatology 24: 135-136.
Leslie, M., C. Haghood, A. Royer, C.P. Reece, S. Maloney (2006). “Using lean methods
to improve OR turnover times.” Practical Innovations 84(5): 849-855.
Liu, L., M. Min, S. Jian, Y. Fengyu, Z. Wei (2009). “Synchronization Schedule and Date
Sharing of Activity Multi-Instance Based on Workflow.” Second International
Symposium on Electric Commerce and Security 2: 441-445.
Kao L.S. and E.J. Thomas (2008). “Navigating Towards Improved Surgical Safety Using
Aviation-Based Strategies.” Journal of Surgical Research 145(2): 327-335.
128
Klundert J. van de, P. Gorissen, S. Zeemering (2010). “Measuring clinical pathway
adherence.” Journal of Biomedical Informatics 43: 861-872.
Krasner, H., N.R. Connelly, J. Flack, A. Weintraub (1999). “A Multidisciplinary Process
to Improve the Efficiency of Cardiac Operating Rooms.” Journal of Cardiothoracic and
Vascular Anesthesia 13(6): 661-685.
Mikos, K. (2007). “Monitoring handoffs for standardization.” Nursing Management
38:16-20.
Miller, G.A. (1956). “The Magical Number Seven, Plus or Minus Two: Some Limits on
our Capacity for Processing Information.” The Psychological Review 63(2): 81-97.
Nembhard, I.M., A.L. Tucker (2011). “Deliberate Learning to Improve Performance in
Dynamic Service Settings: Evidence from Hospital Intensive Care Units.” Organization
Science 22(4): 907-922.
Patterson, P. (2009). “Using Lean to steer a department.” OR Manager 25(5): 21-23.
Peleg, M, L.A Gutnik, V. Snow, V.L. Patel (2006). “Interpreting procedures from
descriptive guidelines.” Journal of Biomedical Informatics 39: 184-195.
Pérez, B., I Porres (2010). “Authoring and verification of clinical guidelines: A model
driven approach.” Journal of Biomedical Informatics 43: 520-536.
Perioperative Standards and Recommended Practices: For Inpatient and Ambulatory
Settings (AORN, 2012).
Price, L.S.M, D.J. Birnbach, D.A. Lubarsky, K.L. Arheart, Y. Fajardo-Aquino, M.
Rosalsky, R. Cleary, D. DePascale, G. Coro, N. Namias, and P. Carling (2012).
“Decreasing Operating Room Environmental Pathogen Contamination through Improved
Cleaning Practice.” Infection Control and Hospital Epidemiology 33(9): 897-904.
Provonost, P., D. Needham, S. Berenholtz, D. Sinopoli, H. Chu, S. Cosgrove, B. Sexton,
R. Hyzy, R. Welsh, G. Roth, J. Bander, J. Kepros, C. Geoschel ((2006). “An Intervention
to Decrease Catheter-Related Bloodstream Infections in the ICU.” The New England
Journal of Medicine 355(26): 2725-2732.
Randolph, S.A. (2006). “Developing Policies and Procedures.” Business and Leadership
54(11): 501-504.
Rantz, W.G., A.M. Dickinson, G.A. Sinclair, and R. Van Houten (2009). “The effect of
feedback on the accuracy of checklist completion during instrument flight training.”
Journal of Applied Behavior Analysis 42(3): 497-509.
129
Reichert, M., P. Dadam, T. Bauer (2004). “Dealing with forward and backward jumps in
workflow management systems.” Informatik 118: 132-151.
Shingo, S. (1989). A Study of the Toyota Production System from an Industrial
Engineering Viewpoint. Cambridge, Massachusetts, Productivity Press.
Simpson, K. R. (2009). “Standardization.” The American journal of maternal child
nursing 34(1): 72.
Stock, G.N., McFadden, K.L., and Gowen, C.R. (2006). Organizational culture, critical
success factors, and the reduction of hospital errors. International Journal of Production
Economics, 106, 368-392.
Towill, D.R (2009). “Frank Gilbreth and health care delivery method study driven
learning.” International Journal of Health Care 22(4): 417-440.
Veillette, P.D. (2008). “The Benefits of Proper Checklist Design.” Business &
Commercial Aviation 103(2): 58-63.
Worley, J.M. and T.L. Doolen (2011). Turnovers and Turnarounds in the Healthcare
System. In Y. Yih (Ed), Handbook of Healthcare Delivery Systems (pp. 37-1 – 37-8).
Boca Raton, Florida, CRC Press.

130
APPENDICES

131
APPENDIX A
IRB DOCUMENT
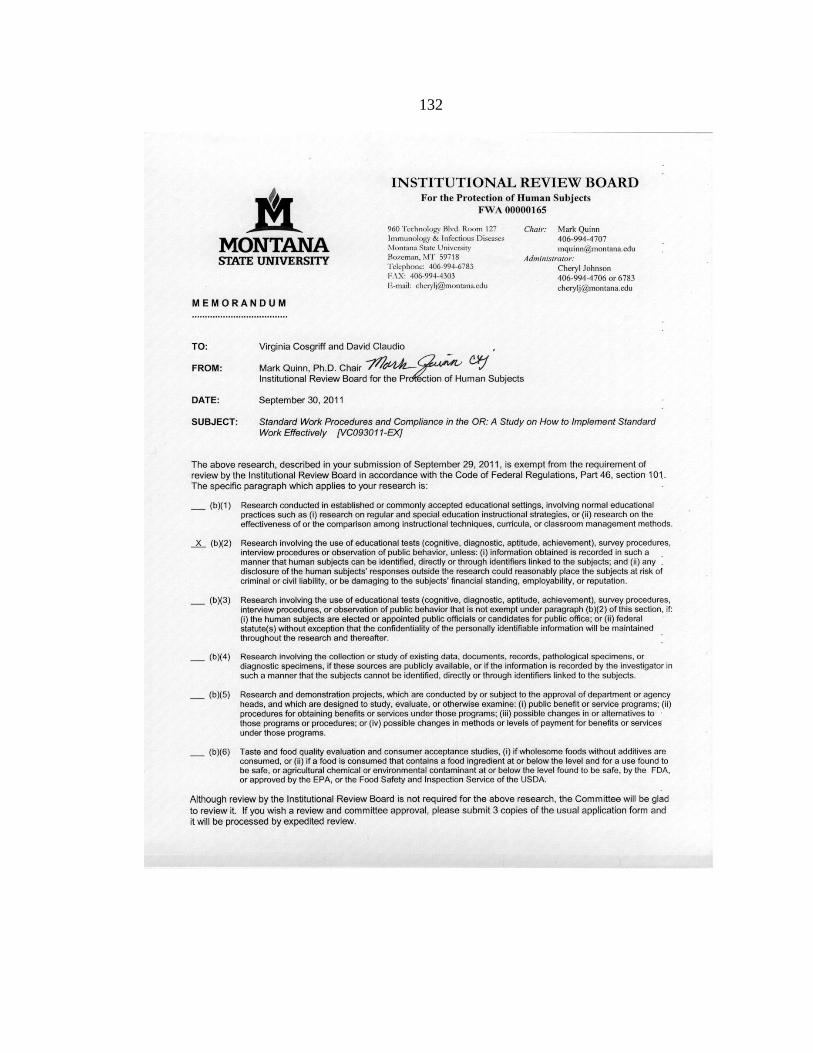
132
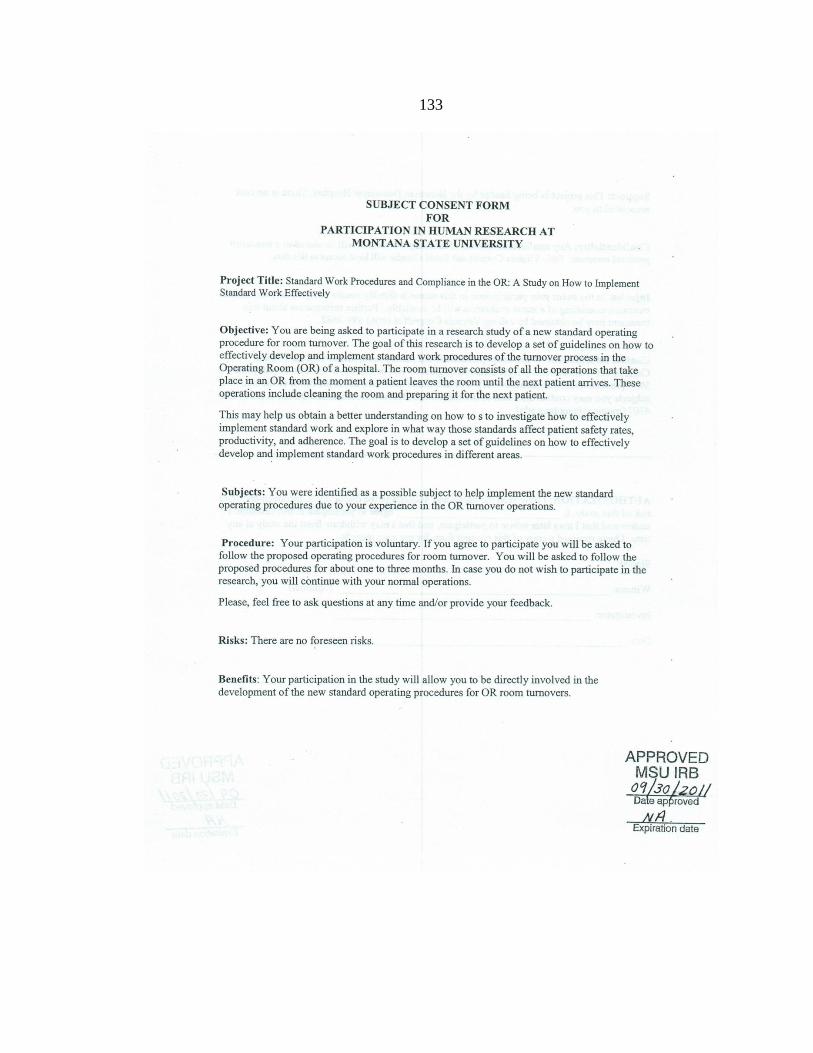
133

134
135
APPENDIX B
CONFIDENTIALITY AGREEMENT

136
CONFIDENTIALITY COMMITMENT
As a Bozeman Deaconess Hospital (BDH) employee, volunteer, committee member, or
visitor, I recognize that assuring confidentiality is an ethical, moral and legal
responsibility. Patients, employees, and business associates of BDH have the right to
expect that confidential information of all kinds—medical, personnel, business and
financial (verbal, written or computerized)—will be safeguarded. Such information may
be accessed, used, and discussed only by those with an authorized need to know, and may
not be released or disclosed, except in accordance with BDH policies and agreements.
I recognize that due to the nature of my involvement with BDH, I agree to be obligated to
follow BDH policies that protect confidentiality. These policies protect the
confidentiality of patient health care information and of strategic business and financial
information. Furthermore, I understand that these policies may be amended and new
policies may be issued that protect the confidentiality of information, and I agree to
follow such new policies as they are issued. Furthermore, I understand that, under special
circumstances, BDH will enter agreements to share confidential business, financial or
patient-related information with outside persons or organizations, with the obligation to
hold such information in confidence. I agree to abide by such agreements.
I understand that failure to protect the confidentiality of information may be grounds for
civil penalties under the Montana Health Information Act or the Health Insurance
Portability and Accountability Act (HIPAA) and violation of BDH policies and
agreements that protect the confidentiality of information will result in disciplinary
action, which may include termination.
If I have a question or concern about BDH policies and expectations regarding
confidentiality, I will ask my supervisor, department manager, a member of senior
leadership, or the Compliance Officer. If I know of a breach or possible breach of
confidentiality, I also recognize that I am obligated to report that breach to my supervisor,
department manager, or the Compliance Officer.
_________________________________ ___________________________ ______
Signature Department/Position Date
_________________________________
Print Name Here

137
APPENDIX C
SPAGHETTI DIAGRAMS

138
Circulating Nurses
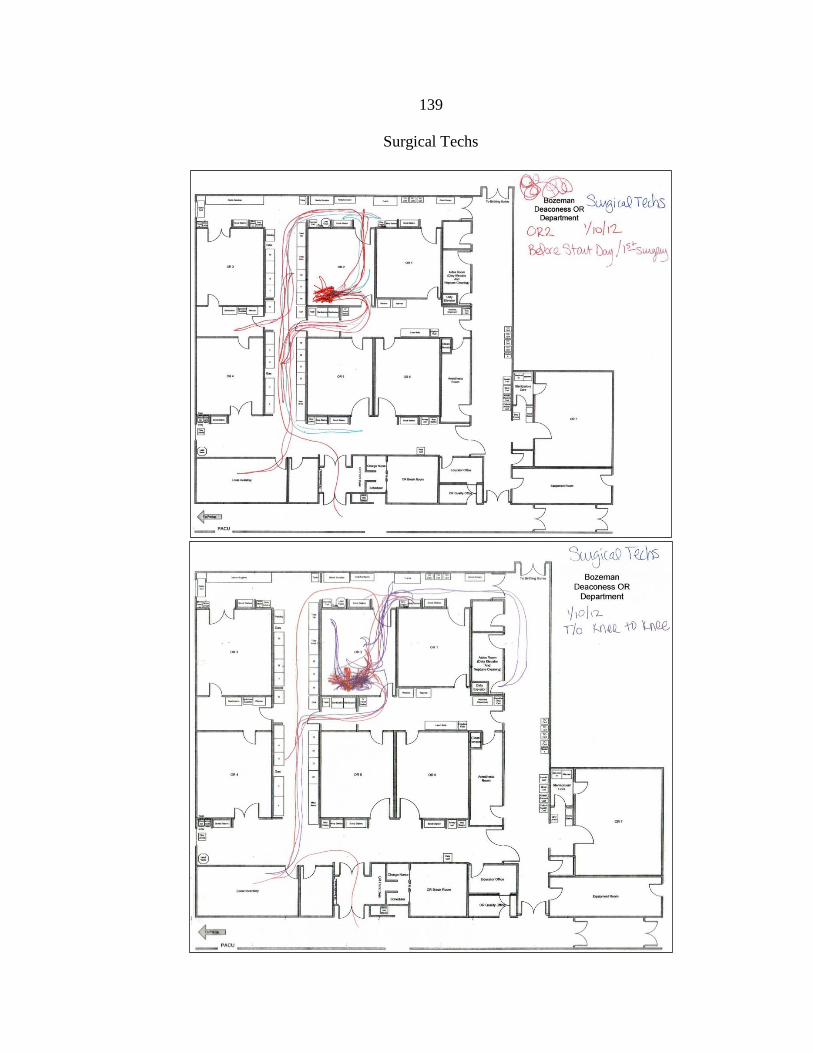
139
Surgical Techs
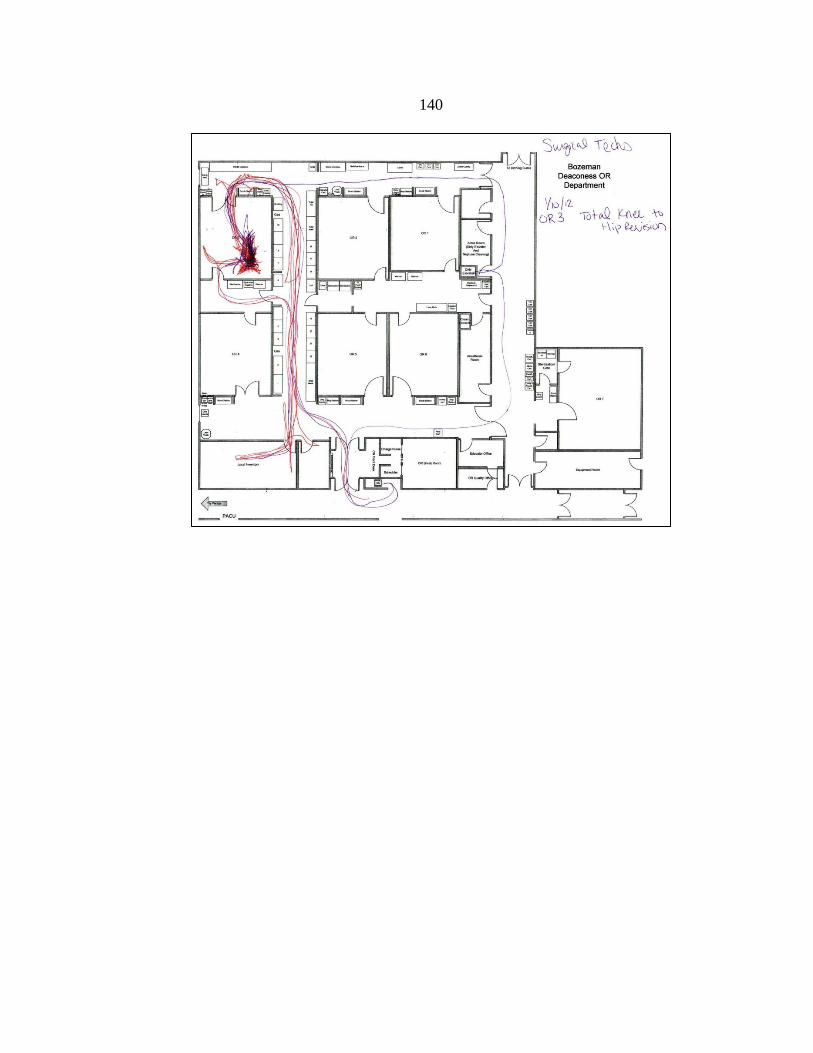
140
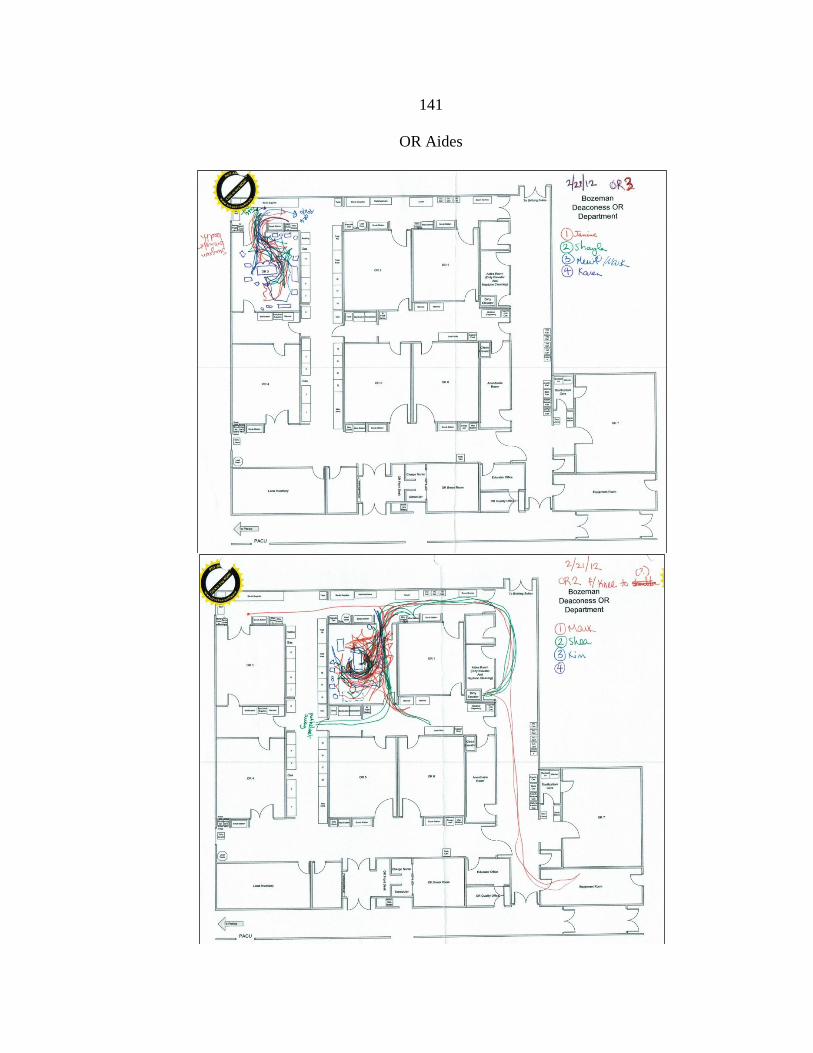
141
OR Aides

142
APPENDIX D
OR AIDE ADHERANCE SHEET

143
Date ________________OR______ Time start_________ End_________
Cleaning the Room with 1-3 People – AdherenceOR Aide 1 ___________________ Gather Linens /Clear Bed
Lights top to bottom
Silver
o Tables
o Ring Stands
o Mayo Stands
o Trash/linen Holders
o Bottom of Surgical Bed
(1st) Preparation
Put new circuit on
Prep wires
Get Bedroll
Check Configuration of bed
Drape Bed and arm-boards
Middle Sheet on bed
Put bags in holders
(2nd) Mop
Get Mop (dipped)
Mop
o Moved surgical bed
Put old mop-head in trash
o Change bag if needed
Replace mop-head
Put mop in its place
(1st) Neptune
Inspect Neptune for contamination (clean if needed)
Check level
Reset/Change
(2nd) Final Check
All things are done
o Circuit
o Suction
o Bed Locked
o Neptune
o Kick Buckets (bags)
o Sharps Container
OR Aide 2 ___________________
Old Circuit off and throw away
Gather Trash/Clear Bed
Wipe Wires
o BP, Pulse Ox, Leads, Oxygen
Wipe Roller
Wipe Bed
o Top of pads
o Bottom of Pads
o Sides
o Clear Wires
o Strap
o Gels/Pads/Sandbags
(1st) Preparation
Put new circuit on
Prep wires
Get Bedroll
Check Configuration of bed
Drape Bed and arm-boards
Middle Sheet on bed
Put bags in holders
(2nd) Mop
Get Mop (dipped)
Mop
o Moved surgical bed
Put old mop-head in trash
o Change bag if needed
Replace mop-head
Put mop in its place
(1st) Neptune
Inspect Neptune for contamination (clean if needed)
Check level
Reset/Change
(2nd) Final Check
All things are done
o Circuit
o Suction
o Bed Locked
o Neptune
o Kick Buckets (bags)
o Sharps Container

144
APPENDIX E
FAILURE MODE AND EFFECTS ANALYSIS (FMEA)
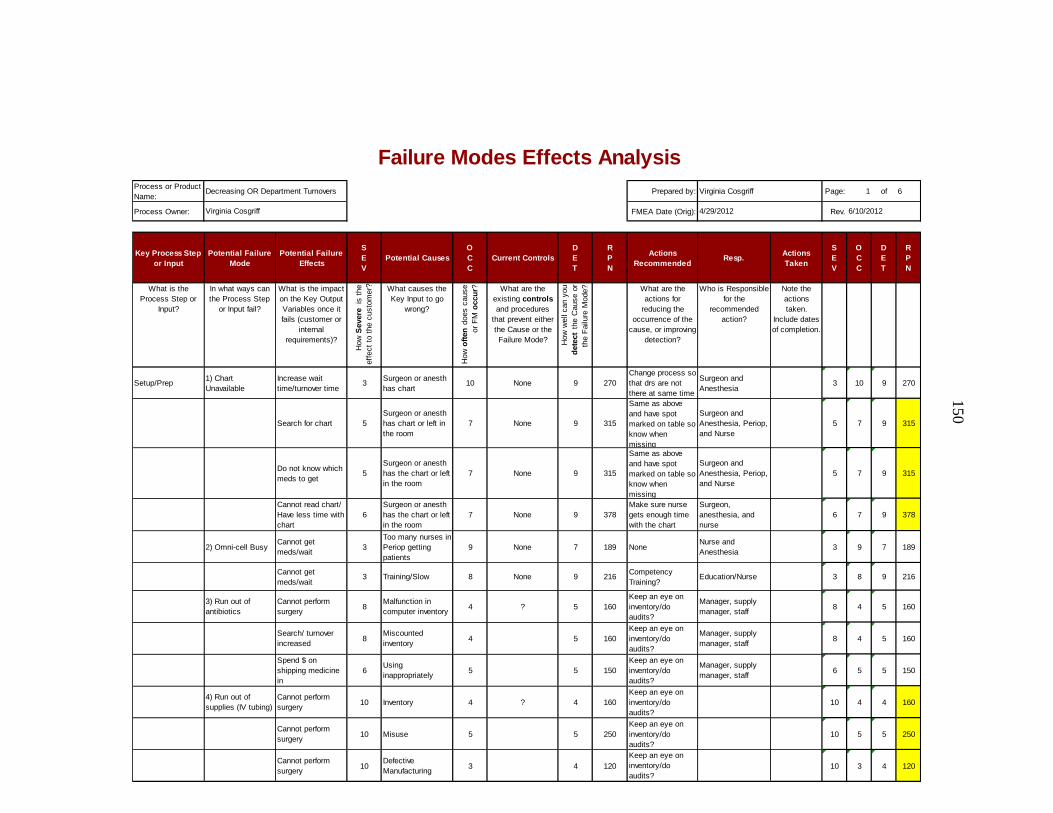
Process or Product
Name:Prepared by: Page: 1 of 6
Process Owner: FMEA Date (Orig): Rev.
Key Process Step
or Input
Potential Failure
Mode
Potential Failure
Effects
S
E
V
Potential Causes
O
C
C
Current Controls
D
E
T
R
P
N
Actions
RecommendedResp.
Actions
Taken
S
E
V
O
C
C
D
E
T
R
P
N
What is the
Process Step or
Input?
In what ways can
the Process Step
or Input fail?
What is the impact
on the Key Output
Variables once it
fails (customer or
internal
requirements)?
How
Severe
is t
he
eff
ect
to t
he c
usto
mer? What causes the
Key Input to go
wrong?
How
oft
en
does c
ause
or
FM
occu
r? What are the
existing controls
and procedures
that prevent either
the Cause or the
Failure Mode? How
well
can y
ou
dete
ct
the C
ause o
r
the F
ailu
re M
ode? What are the
actions for
reducing the
occurrence of the
cause, or improving
detection?
Who is Responsible
for the
recommended
action?
Note the
actions
taken.
Include dates
of completion.
Setup/Prep1) Chart
Unavailable
Increase wait
time/turnover time3
Surgeon or anesth
has chart10 None 9 270
Change process so
that drs are not
there at same time
Surgeon and
Anesthesia3 10 9 270
Search for chart 5
Surgeon or anesth
has chart or left in
the room
7 None 9 315
Same as above
and have spot
marked on table so
know when
missing
Surgeon and
Anesthesia, Periop,
and Nurse
5 7 9 315
Do not know which
meds to get5
Surgeon or anesth
has the chart or left
in the room
7 None 9 315
Same as above
and have spot
marked on table so
know when
missing
Surgeon and
Anesthesia, Periop,
and Nurse
5 7 9 315
Cannot read chart/
Have less time with
chart
6
Surgeon or anesth
has the chart or left
in the room
7 None 9 378
Make sure nurse
gets enough time
with the chart
Surgeon,
anesthesia, and
nurse
6 7 9 378
2) Omni-cell BusyCannot get
meds/wait3
Too many nurses in
Periop getting
patients
9 None 7 189 NoneNurse and
Anesthesia3 9 7 189
Cannot get
meds/wait3 Training/Slow 8 None 9 216
Competency
Training?Education/Nurse 3 8 9 216
3) Run out of
antibiotics
Cannot perform
surgery8
Malfunction in
computer inventory4 ? 5 160
Keep an eye on
inventory/do
audits?
Manager, supply
manager, staff8 4 5 160
Search/ turnover
increased8
Miscounted
inventory4 5 160
Keep an eye on
inventory/do
audits?
Manager, supply
manager, staff8 4 5 160
Spend $ on
shipping medicine
in
6Using
inappropriately5 5 150
Keep an eye on
inventory/do
audits?
Manager, supply
manager, staff6 5 5 150
4) Run out of
supplies (IV tubing)
Cannot perform
surgery10 Inventory 4 ? 4 160
Keep an eye on
inventory/do
audits?
10 4 4 160
Cannot perform
surgery10 Misuse 5 5 250
Keep an eye on
inventory/do
audits?
10 5 5 250
Cannot perform
surgery10
Defective
Manufacturing3 4 120
Keep an eye on
inventory/do
audits?
10 3 4 120
Failure Modes Effects Analysis
Decreasing OR Department Turnovers Virginia Cosgriff
Virginia Cosgriff 4/29/2012 6/10/2012
150

Process or Product
Name:Prepared by: Page: 2 of 6
Process Owner: FMEA Date (Orig): Rev.
Key Process Step
or Input
Potential Failure
Mode
Potential Failure
Effects
S
E
V
Potential Causes
O
C
C
Current Controls
D
E
T
R
P
N
Actions
RecommendedResp.
Actions
Taken
S
E
V
O
C
C
D
E
T
R
P
N
What is the
Process Step or
Input?
In what ways can
the Process Step
or Input fail?
What is the impact
on the Key Output
Variables once it
fails (customer or
internal
requirements)?
How
Severe
is t
he
eff
ect
to t
he c
usto
mer? What causes the
Key Input to go
wrong?
How
oft
en
does c
ause
or
FM
occu
r? What are the
existing controls
and procedures
that prevent either
the Cause or the
Failure Mode? How
well
can y
ou
dete
ct
the C
ause o
r
the F
ailu
re M
ode? What are the
actions for
reducing the
occurrence of the
cause, or improving
detection?
Who is Responsible
for the
recommended
action?
Note the
actions
taken.
Include dates
of completion.
Setup/Prep 5) Patient is late Increased OR time/
turnover5
Uunknown time to
be at Periop9
None
5 225
Make sure a
system is in place
that patient knows
when to be there
Patient and Periop
5 9 5 225
Staff rushing to get
ready 7Uunknown time to
be at Periop 9None
5 315 7 9 5 315
6) Wait for surgeon
or anesth (patient
busy)
Increased OR time/
turnover and
increased wait time
5
Patient asks too
many questions 9
None
9 405 5 9 9 405
Increased OR time/
turnover and
increased wait time
5
Patient in bathroom
9
None
9 405 5 9 9 405
Increased OR time/
turnover and
increased wait time
5
Doctor is late
9
1st surgery start
schedule 5 225
Have schedule
when doctors see
the patient
Doctors
5 9 5 225
Increased OR time/
turnover and
increased wait time5
Labs are late, in
correct, or need to
be redone8
Check before
surgery8 320
System/trime
frame for checking
so it doesn't hold
up case
Doctors, nurses,
periop5 8 8 320
7) Patient has a lot
of questions
Increased OR time/
turnover 3
Not informed ahead
of time 7 ? 0
Check pre-surgery
infor and see where
holes are
Doctors, periop
3 7 0 0
Increased OR time/
turnover 3
Too many family
members 7
Limit the number of
family members in
periop room
3 63
Enforce the rule of
number of family
members
Periop
3 7 3 63
8) Patient has
unforseen
circumstance
Increased OR time/
turnover 7
Patient issue not
caught early
enough
5
None?
7 245
Make sure to ask
before patient
arrives
Periop/Drs
7 5 7 245
Involves multiple
Staff 6Error causes
situation 5 2 60Error Proofing Everyone
6 5 2 60
Hold up other
cases 7Cancel surgery
7None
6 294 - - 7 7 6 294
Increased OR time/
turnover7
Labs are late, in
correct, or need to
be redone8
Check before
surgery8 448
System/trime
frame for checking
so it doesn't hold
up or bump another
case
Nurse/Doctors
7 8 8 448
Failure Modes Effects Analysis
Decreasing OR Department Turnovers Virginia Cosgriff
Virginia Cosgriff 4/29/2012 6/10/2012
151
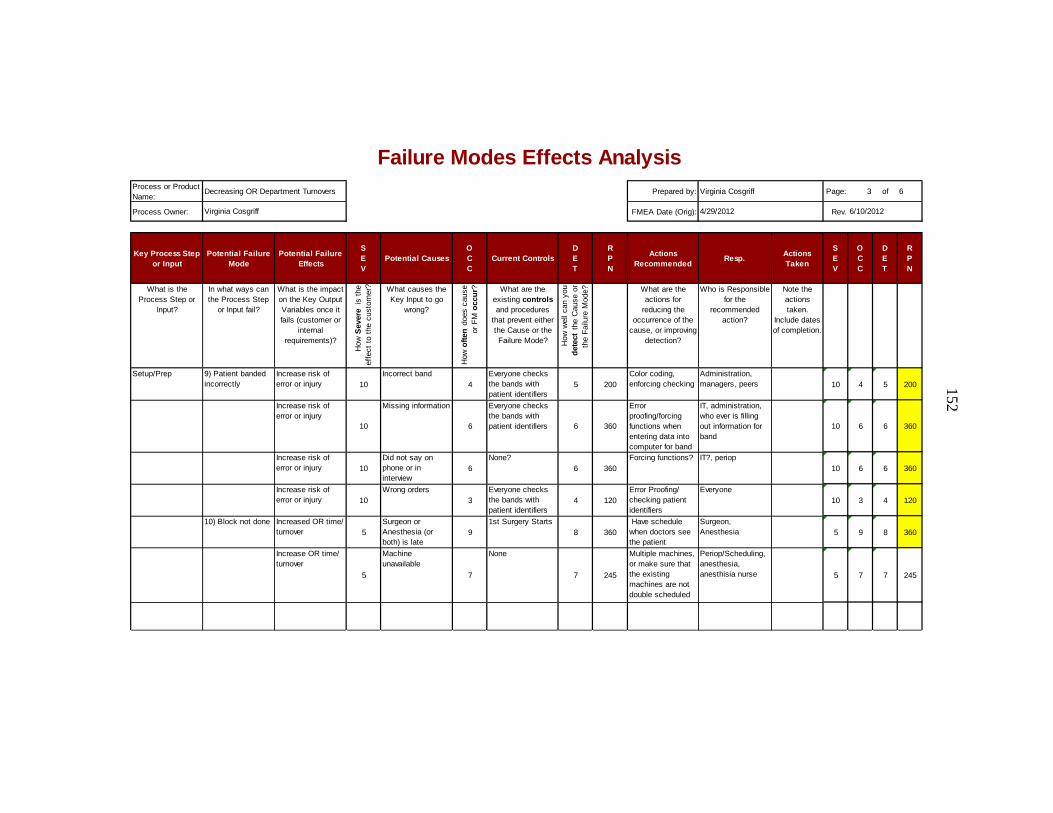
Process or Product
Name:Prepared by: Page: 3 of 6
Process Owner: FMEA Date (Orig): Rev.
Key Process Step
or Input
Potential Failure
Mode
Potential Failure
Effects
S
E
V
Potential Causes
O
C
C
Current Controls
D
E
T
R
P
N
Actions
RecommendedResp.
Actions
Taken
S
E
V
O
C
C
D
E
T
R
P
N
What is the
Process Step or
Input?
In what ways can
the Process Step
or Input fail?
What is the impact
on the Key Output
Variables once it
fails (customer or
internal
requirements)?
How
Severe
is t
he
eff
ect
to t
he c
usto
mer? What causes the
Key Input to go
wrong?
How
oft
en
does c
ause
or
FM
occu
r? What are the
existing controls
and procedures
that prevent either
the Cause or the
Failure Mode? How
well
can y
ou
dete
ct
the C
ause o
r
the F
ailu
re M
ode? What are the
actions for
reducing the
occurrence of the
cause, or improving
detection?
Who is Responsible
for the
recommended
action?
Note the
actions
taken.
Include dates
of completion.
Setup/Prep 9) Patient banded
incorrectly
Increase risk of
error or injury 10
Incorrect band
4
Everyone checks
the bands with
patient identifiers
5 200
Color coding,
enforcing checking
Administration,
managers, peers 10 4 5 200
Increase risk of
error or injury
10
Missing information
6
Everyone checks
the bands with
patient identifiers 6 360
Error
proofing/forcing
functions when
entering data into
computer for band
IT, administration,
who ever is filling
out information for
band
10 6 6 360
Increase risk of
error or injury 10
Did not say on
phone or in
interview
6
None?
6 360
Forcing functions? IT?, periop
10 6 6 360
Increase risk of
error or injury 10
Wrong orders
3
Everyone checks
the bands with
patient identifiers
4 120
Error Proofing/
checking patient
identifiers
Everyone
10 3 4 120
10) Block not done Increased OR time/
turnover 5
Surgeon or
Anesthesia (or
both) is late
9
1st Surgery Starts
8 360
Have schedule
when doctors see
the patient
Surgeon,
Anesthesia 5 9 8 360
Increase OR time/
turnover
5
Machine
unavailable
7
None
7 245
Multiple machines,
or make sure that
the existing
machines are not
double scheduled
Periop/Scheduling,
anesthesia,
anesthisia nurse 5 7 7 245
Failure Modes Effects Analysis
Decreasing OR Department Turnovers Virginia Cosgriff
Virginia Cosgriff 4/29/2012 6/10/2012
152
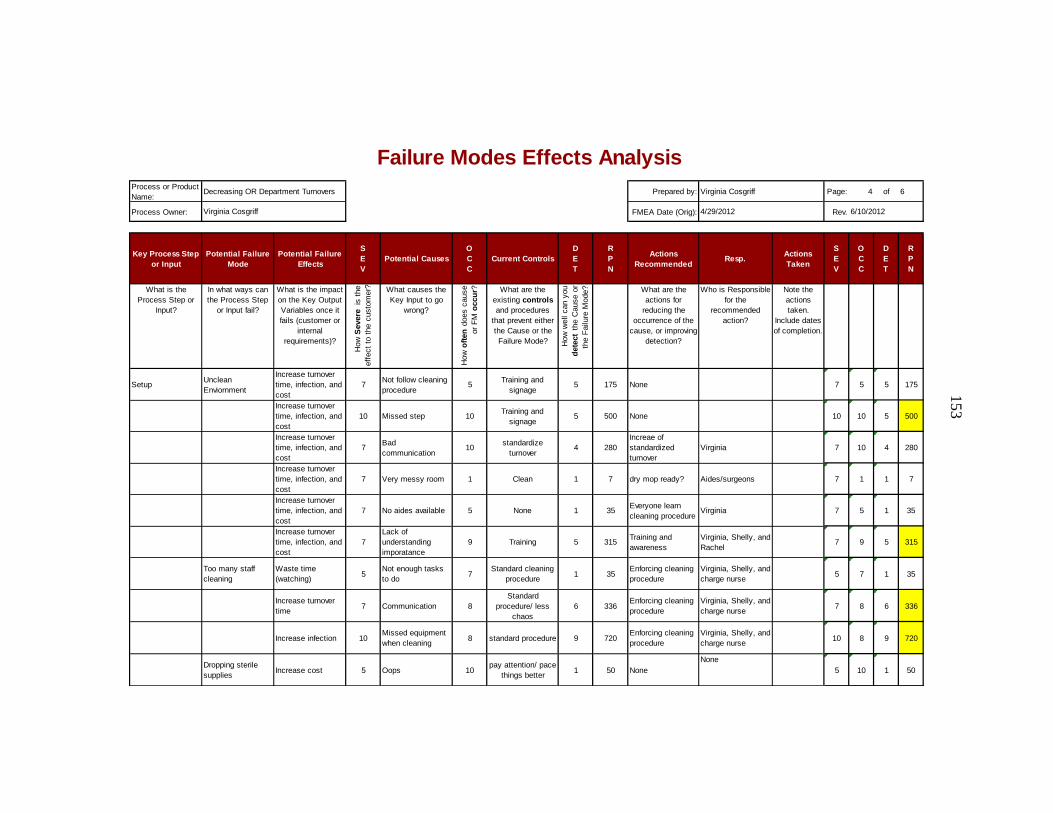
Process or Product
Name:Prepared by: Page: 4 of 6
Process Owner: FMEA Date (Orig): Rev.
Key Process Step
or Input
Potential Failure
Mode
Potential Failure
Effects
S
E
V
Potential Causes
O
C
C
Current Controls
D
E
T
R
P
N
Actions
RecommendedResp.
Actions
Taken
S
E
V
O
C
C
D
E
T
R
P
N
What is the
Process Step or
Input?
In what ways can
the Process Step
or Input fail?
What is the impact
on the Key Output
Variables once it
fails (customer or
internal
requirements)?
How
Severe
is t
he
eff
ect
to t
he c
usto
mer? What causes the
Key Input to go
wrong?
How
oft
en
does c
ause
or
FM
occu
r? What are the
existing controls
and procedures
that prevent either
the Cause or the
Failure Mode? How
well
can y
ou
dete
ct
the C
ause o
r
the F
ailu
re M
ode? What are the
actions for
reducing the
occurrence of the
cause, or improving
detection?
Who is Responsible
for the
recommended
action?
Note the
actions
taken.
Include dates
of completion.
SetupUnclean
Enviornment
Increase turnover
time, infection, and
cost
7Not follow cleaning
procedure5
Training and
signage5 175 None 7 5 5 175
Increase turnover
time, infection, and
cost
10 Missed step 10Training and
signage5 500 None 10 10 5 500
Increase turnover
time, infection, and
cost
7Bad
communication10
standardize
turnover4 280
Increae of
standardized
turnover
Virginia 7 10 4 280
Increase turnover
time, infection, and
cost
7 Very messy room 1 Clean 1 7 dry mop ready? Aides/surgeons 7 1 1 7
Increase turnover
time, infection, and
cost
7 No aides available 5 None 1 35Everyone learn
cleaning procedureVirginia 7 5 1 35
Increase turnover
time, infection, and
cost
7
Lack of
understanding
imporatance
9 Training 5 315Training and
awareness
Virginia, Shelly, and
Rachel7 9 5 315
Too many staff
cleaning
Waste time
(watching)5
Not enough tasks
to do7
Standard cleaning
procedure1 35
Enforcing cleaning
procedure
Virginia, Shelly, and
charge nurse5 7 1 35
Increase turnover
time7 Communication 8
Standard
procedure/ less
chaos
6 336Enforcing cleaning
procedure
Virginia, Shelly, and
charge nurse7 8 6 336
Increase infection 10Missed equipment
when cleaning8 standard procedure 9 720
Enforcing cleaning
procedure
Virginia, Shelly, and
charge nurse10 8 9 720
Dropping sterile
suppliesIncrease cost 5 Oops 10
pay attention/ pace
things better1 50 None
None
5 10 1 50
Failure Modes Effects Analysis
Decreasing OR Department Turnovers Virginia Cosgriff
Virginia Cosgriff 4/29/2012 6/10/2012
153
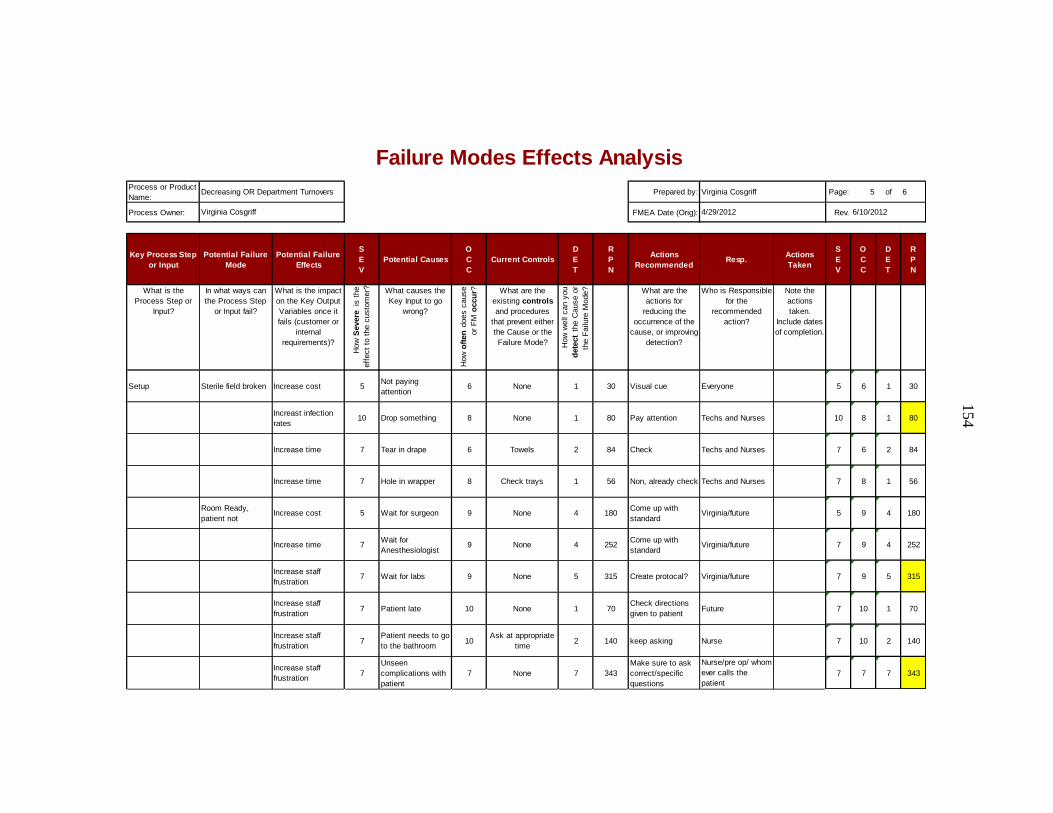
Process or Product
Name:Prepared by: Page: 5 of 6
Process Owner: FMEA Date (Orig): Rev.
Key Process Step
or Input
Potential Failure
Mode
Potential Failure
Effects
S
E
V
Potential Causes
O
C
C
Current Controls
D
E
T
R
P
N
Actions
RecommendedResp.
Actions
Taken
S
E
V
O
C
C
D
E
T
R
P
N
What is the
Process Step or
Input?
In what ways can
the Process Step
or Input fail?
What is the impact
on the Key Output
Variables once it
fails (customer or
internal
requirements)?
How
Severe
is t
he
eff
ect
to t
he c
usto
mer? What causes the
Key Input to go
wrong?
How
oft
en
does c
ause
or
FM
occu
r? What are the
existing controls
and procedures
that prevent either
the Cause or the
Failure Mode? How
well
can y
ou
dete
ct
the C
ause o
r
the F
ailu
re M
ode? What are the
actions for
reducing the
occurrence of the
cause, or improving
detection?
Who is Responsible
for the
recommended
action?
Note the
actions
taken.
Include dates
of completion.
Setup Sterile field broken Increase cost 5Not paying
attention6 None 1 30 Visual cue Everyone 5 6 1 30
Increast infection
rates10 Drop something 8 None 1 80 Pay attention Techs and Nurses 10 8 1 80
Increase time 7 Tear in drape 6 Towels 2 84 Check Techs and Nurses 7 6 2 84
Increase time 7 Hole in wrapper 8 Check trays 1 56 Non, already check Techs and Nurses 7 8 1 56
Room Ready,
patient notIncrease cost 5 Wait for surgeon 9 None 4 180
Come up with
standardVirginia/future 5 9 4 180
Increase time 7Wait for
Anesthesiologist9 None 4 252
Come up with
standardVirginia/future 7 9 4 252
Increase staff
frustration7 Wait for labs 9 None 5 315 Create protocal? Virginia/future 7 9 5 315
Increase staff
frustration7 Patient late 10 None 1 70
Check directions
given to patientFuture 7 10 1 70
Increase staff
frustration7
Patient needs to go
to the bathroom10
Ask at appropriate
time2 140 keep asking Nurse 7 10 2 140
Increase staff
frustration7
Unseen
complications with
patient
7 None 7 343
Make sure to ask
correct/specific
questions
Nurse/pre op/ whom
ever calls the
patient
7 7 7 343
Failure Modes Effects Analysis
Decreasing OR Department Turnovers Virginia Cosgriff
Virginia Cosgriff 4/29/2012 6/10/2012
154
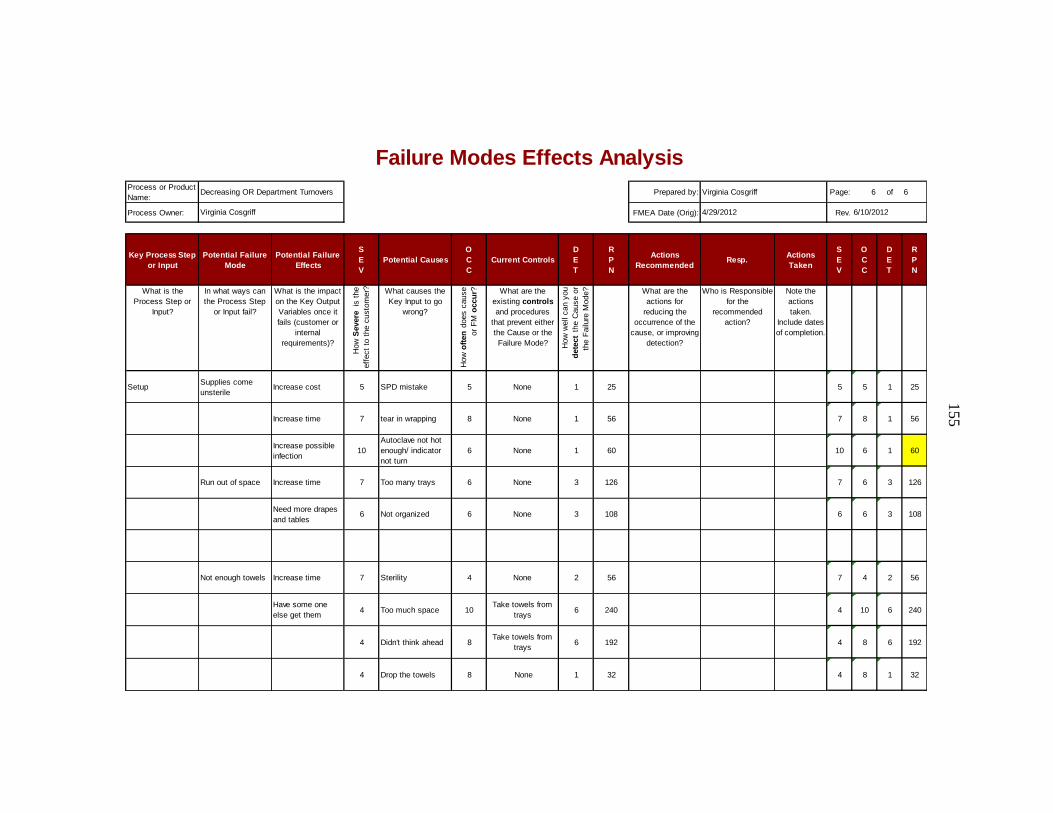
Process or Product
Name:Prepared by: Page: 6 of 6
Process Owner: FMEA Date (Orig): Rev.
Key Process Step
or Input
Potential Failure
Mode
Potential Failure
Effects
S
E
V
Potential Causes
O
C
C
Current Controls
D
E
T
R
P
N
Actions
RecommendedResp.
Actions
Taken
S
E
V
O
C
C
D
E
T
R
P
N
What is the
Process Step or
Input?
In what ways can
the Process Step
or Input fail?
What is the impact
on the Key Output
Variables once it
fails (customer or
internal
requirements)?
How
Severe
is t
he
eff
ect
to t
he c
usto
mer? What causes the
Key Input to go
wrong?
How
oft
en
does c
ause
or
FM
occu
r? What are the
existing controls
and procedures
that prevent either
the Cause or the
Failure Mode? How
well
can y
ou
dete
ct
the C
ause o
r
the F
ailu
re M
ode? What are the
actions for
reducing the
occurrence of the
cause, or improving
detection?
Who is Responsible
for the
recommended
action?
Note the
actions
taken.
Include dates
of completion.
SetupSupplies come
unsterileIncrease cost 5 SPD mistake 5 None 1 25 5 5 1 25
Increase time 7 tear in wrapping 8 None 1 56 7 8 1 56
Increase possible
infection10
Autoclave not hot
enough/ indicator
not turn
6 None 1 60 10 6 1 60
Run out of space Increase time 7 Too many trays 6 None 3 126 7 6 3 126
Need more drapes
and tables6 Not organized 6 None 3 108 6 6 3 108
Not enough towels Increase time 7 Sterility 4 None 2 56 7 4 2 56
Have some one
else get them4 Too much space 10
Take towels from
trays6 240 4 10 6 240
4 Didn't think ahead 8Take towels from
trays6 192 4 8 6 192
4 Drop the towels 8 None 1 32 4 8 1 32
Failure Modes Effects Analysis
Decreasing OR Department Turnovers Virginia Cosgriff
Virginia Cosgriff 4/29/2012 6/10/2012
155

151
APPENDIX F
SURGICAL TECH VALUE STREAM MAP
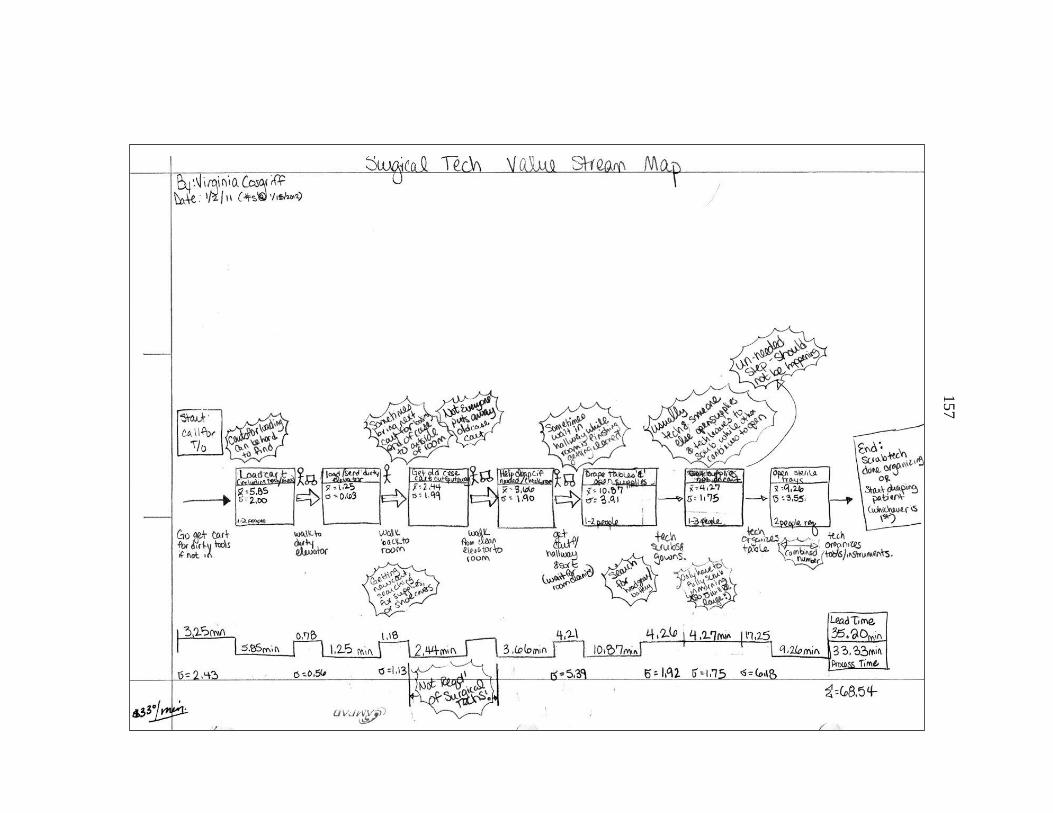
157