Embed Size (px)
Citation preview

Standard Operation Procedures
for Trace Level SO2
In Use By
Polk County Air Quality Ambient Air Monitoring Personnel
For Calendar Year 2016
Revised: February 22, 2016
Section: 24 Revision: 9
PREPARED BY _________________________________________ ______ Polk County Air Quality Air Pollution Monitoring Specialist Date SIGNATURES/APPROVALS _________________________________________ ______ Polk County Air Quality Assurance Officer Date POLK COUNTY AIR QUALITY DIVISION
STANDARD OPERATING PROCEDURE MANUAL FOR THE THERMO SCIENTIFIC 43i TRACE LEVEL SO2

Section 24: Trace Level SO2 Revised: February 22, 2016
Revision Number: 9
1
Table of Contents: Page #: 24.1 Purpose…………………………………………..……………………………………………………………… 3 24.2 Scope ………………………….………………………………………………………………………………… 3 24.3 References……………………………………….……………………………………………………………… 3 24.4 Introduction……………………….…………………………………………………………………………… 3 24.5 Health and Safety Warning/Precautions……………………………………………………………………… 5 24.6 Sampler Setup………………………………………….……………..………………………………………… 5
24.6.1 Site Selection………………………………………………………………………………………….. 5 24.6.1.1 The Monitoring Station…………………………………………………………………... 5 24.6.1.2 Probe Placement………………………………………………………………………….. 6
24.6.2 Inspecting New Equipment…………………………………………………………………………... 6 24.6.3 Equipment Installation……………………………………………………………………………….. 7 24.6.4 Programming Equipment……………………………………………………………………………. 7 24.6.4.1 Range and Units………………………………………………………………………….. 8 24.6.4.2 Averaging Time…………………………………………………………………………… 8 24.6.4.3 Temperature Compensation…………………………………………………………….. 8 24.6.4.4 Pressure Compensation…………………………………………………………………. 8 24.6.4.5 Flash Lamp……………………………………………………………………………….. 9 24.6.4.6 Baud Rate…………………………………………………………………………………. 9 24.6.4.7 Clock Set………………………………………………………………………………….. 9
24.7 Standards……………………………………………………………………………………………………….. 9 24.8 Qualification, Certification and Recertification……………………………………………………………… 10 24.9 Calibration……………………………………………………………………………………………………… 10 24.10 Quality Control………………………………………………………………………………………………… 12 24.10.1 Station Inspection…………………………………………………………………………………….. 12 24.10.2 Station Log Book……………………………………………………………………………………… 12 24.10.3 Bi-Weekly Zero, Precision and Span Checks………………………………………………………. 12
24.10.4 Data Acquisition and Telemetry…………………………………………………………………...... 13 24.11 Equipment, Maintenance and Trouble Isolation…………………………………………………………….. 13 24.11.1 Preventative Maintenance……………………………………………………………………………. 13 24.11.1.1 Analyzer Leak Check…………………………………………………………………… 13 24.11.1.2 Sample Line Leak Check……………………………………………………………....... 14 24.11.1.3 Particulate Filter Changes……………………………………………………………….. 14 24.11.1.4 Cleaning the Fan Filters………………………………………………………………….. 14 24.11.1.5 Replacing the Sample Lines……………………………………………………………… 14 24.11.2 Trouble Isolation……………………………………………………………………………………… 15 24.11.3 Environmental Control for Monitoring Equipment………………………………………………... 15 24.12 Quality Assurance……………………………………………………………………………………………… 15 24.12.1 Direct Comparison Audit…………………………………………………………………………….. 15 24.12.2 Performance Evaluation Audit………………………………………………………………………. 16 24.13 Data Quality Assessment………………………………………………………………………………………. 16 24.13.1 Precision……………………………………………………………………………………………….. 16 24.13.2 Accuracy………………………………………………………………………………………………. 16 24.13.3 Data Completeness……………………………………………………………………………………. 17 24.14 Procedures for Bi-Weekly Checks……………………………………………………………………………. 17 24.14.1 Maintenance Mode for Agilaire Model 8832 Data Loggers……………………………………….. 17 24.14.2 Maintenance and Diagnostics Check………………………………………………………………... 18 24.14.3 Zero, Precision and Span Checks……………………………………………………………………. 18 24.14.3.1 Span Check……………………………………………………………………………….. 19 24.14.3.2 Precision Checks………………………………………………………………………….. 20 24.14.3.3 Zero Air Check…………………………………………………………………………… 20 24.14.3.4 Invalidate Data and Recalibrate………………………………………………………… 20 24.14.4 Standby Mode………………………………………………………………………………………… 21 24.15 Automated Zero and Span Checks……………………………………………………………………………. 21 24.15.1 Calibration Program in the 146i Calibrator……………………………………………………….. 22 24.15.1.1 Program Cycle……………………………………………………………………………. 22 24.15.1.2 Period Hours……………………………………………………………………………….22

Section 24: Trace Level SO2 Revised: February 22, 2016
Revision Number: 9
2
24.15.1.3 Next Cycle…………………………………………………………………………………. 22 24.15.1.4 Events……………………………………………………………………………………… 22 24.15.2 Calibration Program for the 43i Site Analyzer…………………………………………………….. 23 24.15.2.1 Next Time…………………………………………………………………………………. 23 24.15.2.2 Period Hours……………………………………………………………………………… 23 24.15.2.3 Zero Duration……………………………………………………………………………. 24 24.15.2.4 Span Duration…………………………………………………………………………….. 24 24.15.2.5 Averaging Time…………………………………………………………………………… 24 24.15.3 Digital Output Wiring of the 146i Calibrator……………………………………………………… 24 24.15.4 Calibration Program in Agilaire AirVision Software…………………………………………….. 25 24.15.4.1 Configuring Automatic Calibration for Model 8832 Data Loggers…………………… 25 24.15.4.2 Configuring Calibration Phases…………………………………………………………. 27 24.15.4.3 Configuring Expected Values……………………………………………………………. 28 FIGURES Figure 24-1 Model 43i-TLE Flow Diagram…..…………………………………………………………….………. 5 Figure 24-2 Thermo Scientific Model 43i-TLE SO2 Analyzer…………………………………………………….. 7 Figure 24-3 The Agilaire Data Logger (Model 8832). ………………………………..…………….…………….. 17 Figure 24-4 Data Source Details Screen…………………………………………………………………………… 25 Figure 24-5 Selecting the Data Logger…………………………………………………………………………….. 25 Figure 24-6 Adding an Instrument Controlled Calibration………………………………………………………. 26 Figure 24-7 Sequence Editor Screen……………………………………………………………………………….. 26 Figure 24-8 Phase Editor Screen……………………………………………………………………………………. 27 Figure 24-9 Input Control Lines Screen, Programmed for the Zero Phase……………………………………… 28 Figure 24-10 Setting up a Phase Channel…………………………………………………………………………… 29 Figure 24-11 Setting up an Expected Value………………………………………………………………………… 29 TABLES Table 24-1 Preventive Maintenance Schedule for the 43i-TLE………………………………………….……….. 14 Table 24-2 Diagnostic Checks……………………………………………………………………………….……….. 18 Table 24-3 Measurement Quality Objectives ………………………………………………………………………. 31 APPENDIX A-Forms and Field Sheets……………………………………………………………………………… 34

Section 24: Trace Level SO2 Revised: February 22, 2016
Revision Number: 9
3
24.0 STANDARD OPERATING PROCEDURE FOR 2SO MONITORING USING THE THERMO SCIETIFIC 43i TRACE LEVEL MONITOR 24.1 Purpose To establish a standard operating procedure (SOP) manual for the Polk County Air Quality Division personnel concerning the setup, operation, zero/precision/span checks, calibrations, audits and maintenance of trace level sulfur dioxide (TL-SO2) monitors maintained and operated by Polk County staff. This SOP is intended for individuals responsible for collecting ambient air monitoring data supported by the Polk County Air Quality Division.
24.2 Scope These procedures are to be used by Polk County Air Quality Division personnel. The objective of this SOP is to familiarize the station operator with procedures used in the collection of air monitoring data. The accuracy of data obtained from any instrument depends upon the instrument's performance and the operator's skill. It is important that the station operator become familiar with both this SOP as well as the manufacturer's instruction manual in order to achieve a high level of data quality. This SOP is to be used as an outline and is not intended to replace the equipment manufacturer’s manual or procedures. This SOP describes the proper procedures for the setup, operation, zero/precision/span checks, calibrations, audits and maintenance of trace level sulfur dioxide equipment operated by Polk County Air Quality personnel. 24.3 References
24.3.1 40 Code of Federal Regulations (CFR) Part 53.23c. Test Procedures. 24.3.2 40 Code of Federal Regulations (CFR) Part 58, Appendix A. Quality Assurance
Requirements for State and Local Air Monitoring Stations (Slams). 24.3.3 40 Code of Federal Regulations (CFR) Part 58, Appendix D. Network Design for State and
Local Air Monitoring Stations (SLAMS), National Air Monitoring Stations (NAMS), and Photochemical Assessment Monitoring Stations (PAMS).
24.3.4 40 Code of Federal Regulations (CFR) Part 136, Appendix B. 24.3.5 The National Air Monitoring Strategy, Final Draft, 4/29/04.
http://www.epa.gov/ttn/amtic/monstratdoc.html. 24.3.6 Model 43i Trace Level-Enhanced Pulsed Fluoresence SO2 Analyzer Instruction Manual.
Thermo Scientific. Part Number 102780-00. January 14, 2008. 24.3.7 Model 146i Dynamic Gas Calibrator. Thermo Scientific. Part Number 102482-00,
January 30, 2008. 24.3.8 Trace SO2 Monitoring Guidance for the MANE-VU Regional Aerosol Intensive Network
(RAIN) program, Draft (dated March 7, 2005). 24.3.9 EPA-454/R-05-003, Technical Assistance Document (TAD) For Precursor Gas
Measurements in the NCore Multi-Pollutant Monitoring Network, September, 2015. 24.3.10EPA-454/B-13-003, Quality Assurance Handbook for Air Pollution Measurement Systems,
Volume II, May, 2013. 24.3.11EPA-454/B-13-003, Quality Assurance Handbook for Air Pollution Measurement Systems,
Volume II, Appendix D, July, 2014. 24.4 Introduction Sulfur dioxide (SO2) has been identified as a key precursor of fine particulate matter (PM2.5) and, thus, plays an important role in PM-related health effects. Sulfur Dioxide (SO2) is a colorless, nonflammable gas that has a strong suffocating odor. SO2 originates from fuel containing sulfur (mainly coal and oil) burned at power plants

Section 24: Trace Level SO2 Revised: February 22, 2016
Revision Number: 9
4
and during metal smelting and other industrial processes. High levels of SO2 can result in temporary breathing impairment for asthmatic children and adults who are active outdoors. Long-term exposure to high levels of SO2, in the presence of high levels of particulate matter, may aggravate existing cardiovascular disease and respiratory illness. Polk County Air Quality Division uses the Thermo Scientific Model 43i-TLE pulsed fluorescence SO2 analyzer to measure Trace Level SO2. The 43i-TLE is based on the principle that SO2 molecules absorb ultraviolet (UV) light and become excited at one wavelength, then decay to a lower energy state emitting UV light at a different wavelength. Specifically, SO2 + hν1 → SO2* → SO2 + hν2
where: hν1 = incidence light, hν2 = fluoresced light, and
SO2* = SO2 in its excited state In sample mode, the sample is drawn into the analyzer through the SAMPLE bulkhead, as shown in Figure 24-1. The sample flows through a hydrocarbon “kicker,” which operates on a selective permeation principle, allowing only hydrocarbon molecules to pass through the tube wall. The driving force for the hydrocarbon removal is the differential partial pressure across the wall. This differential pressure is produced within the instrument by passing the sample gas through a capillary tube to reduce its pressure and feeding it into the shell side of the hydrocarbon kicker. The SO2 molecules pass through the hydrocarbon “kicker” unaffected. The sample flows into the fluorescence chamber, where pulsating UV light excites the SO2 molecules. The condensing lens focuses the pulsating UV light into the mirror assembly. The mirror assembly contains eight selective mirrors that reflect only the wavelengths, which excite SO2 molecules. As the excited SO2 molecules decay to lower energy states they emit UV light that is proportional to the SO2 concentration. The band pass filter allows only the wavelengths emitted by the excited SO2 molecules to reach the photomultiplier tube (PMT). The PMT detects the UV light emission from the decaying SO2 molecules. The photo detector, located at the back of the fluorescence chamber, continuously monitors the pulsating UV light source and is connected to a circuit that compensates for fluctuations in the UV light.
The sample then flows through a flow sensor, a capillary, and the shell side of the hydrocarbon “kicker.” The Model 43i-TLE trace level outputs the SO2 concentration to the front panel display and the analog or digital outputs
The Detection Limit (DL) for a non-trace level SO2 analyzer is 10 parts per billion (ppb) (40 CFR 53.23c). However, the 43i-TLE has an estimated DL of 100 parts per trillion (ppt), which is accomplished by an increased detector sensitivity, as well as increasing the length of the standard instrument’s optics bench. This document will discuss the Trace Level (TL) operating procedures in detail. The goal of this method is a “true” 1-hour average limit of detection (LOD) of less than 0.3 ppb, for determining ambient air concentrations of SO2.

Section 24: Trace Level SO2 Revised: February 22, 2016
Revision Number: 9
5
Figure 24-1 Model 43i-TLE Flow Diagram
24.5 Health and Safety Warning/Precautions Only properly trained personnel should perform 43i-TLE testing, installation, operation, maintenance and calibration procedures. As with all monitoring equipment, precautions should be taken when working around electricity, power tools and above ground elevations. Cylinder gases are used in tandem with Mass Flow Control (MFC) calibrators for the 43i-TLE. Gas cylinders can sometimes contain pressures as high as 2000 pounds per square inch (psi). Handling of cylinders must be done in a safe manner. If a cylinder is accidentally dropped and valve breaks off, the cylinder can become explosive or a projectile. Transportation of cylinders is regulated by the Department of Transportation (DOT). It is strongly recommended that all agencies contact the DOT or Highway Patrol to learn the most recent regulations concerning transport of cylinders. It is possible to blend other compounds with SO2 cylinder gas. In this case, it is recommended that MSDS for all compounds be made available to all staff that use and handle the cylinders or permeation tubes.
24.6 Sampler Setup
24.6.1 Site Selection For detailed information concerning site selection for trace level SO2 monitoring, refer to Table 24-3 of this SOP or the 40 Code of Federal Regulations (CFR), Part 58, Appendix E, or the Quality Assurance Handbook for Air Pollution Measurement Systems, Volume II, Section 6.2, entitled "Monitoring Site Location."
24.6.1.1 The Monitoring Station The structure housing the monitoring equipment may consist of a trailer, a room in a building, or a shelter designed specifically for air monitoring purposes. A clean, dry, secure and temperature controlled space is required so that the sampling equipment can operate properly.

Section 24: Trace Level SO2 Revised: February 22, 2016
Revision Number: 9
6
Careful thought and planning is required in locating a monitoring station. The individual responsible for the installation must consider:
• Proximity to the nearest power source. A 120 VAC source is required for operation of the SO2 monitoring instruments.
• The space where the equipment is housed must maintain a temperature range of 20-30ºC. This usually requires the need for an air conditioner and a heater controlled by a thermostat.
• The accessibility of the equipment to the operator. The operator must be able to safely access the equipment during regular business hours.
• The security of the equipment. Monitoring instruments are expensive. They must be placed in a location where security can be assured.
• Contracts for rental of space or power. Contracts need to be signed with the owner of the property where the instruments are to be located.
• Local building codes. In most cases, the contractor installing the power, structure, concrete, etc. know the local building codes.
24.6.1.2 Probe Placement Once the location of the station has been identified, the individual responsible for the installation must be familiar with the criteria for locating the probe. The location of the sample probe is critical and individuals performing the installation must follow these specific guidelines:
• The sample inlet should be located between 3-15 meters above ground level • The distance of the probe inlet must be at least 20 meters from nearby
obstructions (buildings and trees) • The vertical and horizontal distance of the probe inlet must be at least one meter
from the ground and support structure • The probe should be positioned with at least 270 degrees of unrestricted airflow
For more detailed information concerning site selection for sulfur dioxide monitoring, refer to Table 24-3 of this SOP or the 40 CFR 58, Appendix E or the Quality Assurance Handbook for Air Pollution Measurement Systems , Volume II, Section 7.2, entitled "Sampling Probes and Manifolds.”
24.6.2 Inspecting New Equipment When shipment of the monitor is received, verify that the package contents are complete as ordered. Inspect the instrument for external physical damage due to shipping, such as scratched or dented panel surfaces and broken knobs or connectors. Remove the instrument cover and all interior foam packing and save (in case future shipments of the instrumentation are needed). Make note of how the foam packing was installed. Inspect the interior of the instrument for damage, such as broken components or loose circuit boards. Make sure that all of the circuit boards are completely secured. Loose boards could short out the motherboard. If no damage is evident, the monitor is ready for calibration, installation and operation. If any damage due to shipping is observed contact Thermo Scientific at 1-866-282-0430 for instructions on how to proceed.

Section 24: Trace Level SO2 Revised: February 22, 2016
Revision Number: 9
7
24.6.3 Equipment Installation Installation of a 43i-TLE (Figure 24-2) monitor consists of connecting the sample tubing to the sample gas inlet fitting and connecting the primary power and the data logger device. The sampler inlet line connection should be made with ¼ -inch outer diameter Teflon tubing. The entrance of the sampling system must ensure that rain cannot enter the system. An inverted funnel and sample line must be placed outside the trailer or enclosure to prevent water from entering the sample line.
Because the analyzer is an optical instrument, it is possible that particulate in the gas sample could interfere with the TL-SO2 readings. Although, the sampling/referencing cyclic operation of the instrument is designed to eliminate such interference. In order to avoid frequent cleaning of the optics and flow handling components, installation of a 0.5-micron Teflon filter between the ambient sample line and the sample port of the analyzer must be done before the operation of the analyzer. A Teflon filter will not degrade the TL-SO2 concentration. However, if particulate matter builds up on the filter, the particulate matter will destroy some of the TL-SO2 in the sample. Since the instrument’s exhaust consists of ambient air with some TL-SO2 removed, ensure that the exhaust cannot re-enter the sample system. Install the monitor’s electrical connections as indicated in the operating manual. The power backup, data acquisition equipment, and any monitoring equipment, calibration equipment, or other ancillary equipment should be installed according to information supplied in the appropriate operating manuals.
Figure 24-2: Thermo Scientific Model 43i-TLE SO2 Analyzer
24.6.4 Programming Equipment When the instrument is first turned on, the exhaust fan will start and the Power-Up and Self-Test screens will be displayed. These screens will be displayed until the instrument has completed its warm up and self-checks. Allow 30 minutes for the instrument to stabilize.

Section 24: Trace Level SO2 Revised: February 22, 2016
Revision Number: 9
8
After the warm-up period the Run Screen, or Normal Operating Screen, is displayed. The Run Screen displays the TL-SO2 concentration. Press the MENU button to access the Main Menu, which contains a list of submenus. Instrument parameters and features are divided into the submenus according to their function. Use the ↑ or ↓ buttons to move the cursor to each submenu.
24.6.4.1 Range and Units The Range Screen defines the concentration range of the analog outputs. Polk County Air Quality will use the “Single Range” option with the selected range of 0 – 200 ppb for the analyzer. To set the range for the instrument, press the MENU button to access the Main Menu. Press the ↓ button until the cursor is on “Range.” Press ENTER to display the SO2 Range Menu, and select RANGE. Use the ↑ or ↓ buttons to scroll through the preset ranges. Select “200.0” and press ENTER. Press MENU to return to the Range Menu. The Gas Units Screen defines how the SO2 concentration reading is expressed. From the Range Menu, select GAS UNITS to display the Gas Units screen. Use the ↑ or ↓ button to select “PPB” and press ENTER. Press RUN to return to the Run Screen. 24.6.4.2 Averaging Time The averaging time defines a time period (1 to 300 seconds) during which SO2 measurements are taken. The average concentration of the readings is calculated for that time period. Polk County Air Quality will use the setting of 60 seconds as the averaging time for the collection of data. An averaging time of 60 seconds will also be used during calibrations, audits, and zero/precision/span checks. From the Main Menu, use the ↓ button to scroll to AVERAGING TIME and press ENTER. From the Averaging Time Screen, use the ↑ or ↓ buttons to scroll through the preset ranges. Press ENTER to select the desired averaging time. Press RUN to return to the Run Screen. 24.6.4.3 Temperature Compensation Temperature Compensation provides compensation for any changes to the instrument’s output signal due to variations in internal instrument temperature. When the temperature correction is off, the first line of the display shows the factory standard temperature of 30ºC. Polk County Air Quality will run the TL-SO2 analyzer with the temperature correction set to ON. From the Main Menu, use the ↓ button to scroll to INSTRUMENT CONTROLS and press ENTER. From the Instrument Controls Screen, use the ↓ button to scroll to TEMPERATURE COMPENSATION, and press ENTER. Press ENTER to toggle the temperature compensation on or off. Press RUN to return to the Run Screen. 24.6.4.4 Pressure Compensation Pressure Compensation provides compensation for any changes to the instrument’s output signal due to variation of fluorescence chamber pressure. When the pressure correction is off, the first line display shows the factory standard pressure of 750 mmHg. Polk County Air Quality will run the TL- SO2 analyzer with the pressure correction set to ON. From the Main Menu, use the ↓ button to scroll to INSTRUMENT CONTROLS and press ENTER. From the Instrument Controls Screen, use the ↓ button to scroll to PRESSURE

Section 24: Trace Level SO2 Revised: February 22, 2016
Revision Number: 9
9
COMPENSATION, and press ENTER. Press ENTER to toggle the pressure compensation on or off. Press RUN to return to the Run Screen. 24.6.4.5 Flash Lamp The Flash Lamp Screen turns the lamp on and off. Polk County Air Quality will run the TL-SO2 analyzer with the flash lamp set to ON. From the Main Menu, use the ↓ button to scroll to INSTRUMENT CONTROLS and press ENTER. From the Instrument Controls Screen, use the ↓ button to scroll to FLASH LAMP, and press ENTER. Press ENTER to toggle the flash lamp on or off. Press RUN to return to the Run Screen. 24.6.4.6 Baud Rate The Baud Rate Screen is used to set the RS-232 interface baud rate. The Polk County Air Quality Department will use a baud rate of 9600. From the Main Menu, use the ↓ button to scroll to INSTRUMENT CONTROLS and press ENTER. From the Instrument Controls Screen, use the ↓ button to scroll to COMMUNICATION SETTINGS and press ENTER. From the Communication Settings Screen, use the ↓ button to scroll to SERIAL SETTINGS and press ENTER. From the Serial Settings Screen, use the ↓ button to scroll to BAUD RATE, and press ENTER. Use the ↑ or ↓ buttons to scroll through the preset rates. Press ENTER to select the desired baud rate. Press RUN to return to the Run Screen. 24.6.4.7 Clock Set To set the correct time and date on the instrument, press MENU to return to the Main Menu. Use the ↓ button to scroll to INSTRUMENT CONTROLS and press ENTER. Use the ↓ buttons to scroll to DATE/TIME and press ENTER. The date and time should be set to the data logger time. To Edit, press ENTER and use the → button to select: year, month, day, hour, minutes, or seconds. Use the ↑ or ↓ buttons to increase/decrease the desired value. Set the appropriate date and time and press ENTER. Press RUN to return to the Run Screen. The instrument is now set with the appropriate time, date, full scale range and units. NOTE: The clock should be checked at each site visit and adjusted if off from the data logger by more than 2 minutes. NOTE: It is recommended that you allow the 43i-TLE 24-hours before you attempt checks or calibration.
24.7 Standards A cylinder containing 9 to 12 ppm SO2 in N2 is used as the concentration standard. The cylinder must be traceable to a National Institute of Standards and Technology (NIST) SO2 in N2 Standard Reference Material. Procedures for certifying the SO2 cylinder (working standard) against a NIST traceable SO2 standard is given in EPA Publication NO. EPA-454/R-05-003, “Technical Assistance Document for High Sensitivity Sulfur Dioxide Measurements.” The cylinder should be recertified on a regular basis as determined by the local quality control program.

Section 24: Trace Level SO2 Revised: February 22, 2016
Revision Number: 9
10
The gas certification process is quite rigorous. However, it is still possible to receive a cylinder gas out of specification. Polk County Air Quality will verify that a new cylinder gas is within specification before it is put into use. Prior to removing an old cylinder, perform a zero/precision/span check, making sure that relevant criteria are met. Change to the new cylinder, and update the Thermo 146i with the new stock gas concentration. Adjust the 146i to produce a target concentration equivalent to the precision level last used with the old cylinder. If the instrument reading is within 4% of the expected value, proceed to calibrate the analyzer with the new stock cylinder. If it is not within 4%, investigate and resolve the disparity prior to using the new cylinder. See Form 1, Appendix A for Gas Comparison Spreadsheet. Operators will be required to replace the SO2 cylinder when the cylinder pressure drops below 200 PSI. This will involve removing the regulator on the depleted cylinder and installing the regulator on a replacement cylinder. Precautions must be taken to remove “dead” pockets of contaminants which are created within the regulator whenever it is removed from the cylinder. This problem can be minimized by carefully evacuating the regulator (also known as purging) after it is connected to the cylinder. Better results will be achieved by alternately pressurizing and depressurizing the regulator once it has been attached to the cylinder.
It is desirable, but not essential, to calibrate the 43i-TLE at low SO2 levels (typically less than 20 ppb). However, fluorescence SO2 analyzers have been shown to be inherently linear over a wide dynamic range. If low concentration SO2 calibration cylinders are used, there is the potential for contamination by back diffusion from a poorly purged regulator. Due to the inherent linearity of the analyzer, the ability to calibrate to very low SO2 levels is not a significant factor in generating “true-trace” level quality SO2 data. Polk County Air Quality will generate a calibration curve utilizing zero and 3 up-scale points. Contamination with even a small amount of moisture from back diffusion can cause the SO2 concentration to become unstable; the lower the cylinder concentration, the more susceptible it is to any contamination from “abuse” in the field. The best way to ensure low concentration cylinders are not contaminated by back diffusion is to make sure whenever the cylinder valve is open, there is gas flow out of the cylinder. Polk County addresses this issue by:
• The cylinder utilized is only used for this site and is not removed until expiration of the certificate.
• The gas dilution system is fixed at this site and is not used at any other site so is not moved unless for maintenance or re-certification.
• The regulator will continuously be kept pressurized with cylinder gas.
24.8 Qualification, Certification and Recertification Gas dilution in the 146i Dynamic Gas Calibrator is achieved by utilizing two or more mass flow controllers. One is a high flow controller (typically 20 slm full scale) to govern the diluting zero air. The other controller is for low flow (typically 100 sccm) and governs the flow of the gas to be diluted. See Polk County Air Quality SOP Section 26 for calibration instructions of the 146i Mass Flow Controllers. 24.9 Calibration The Thermo Scientific 43i-TLE analyzers are calibrated whenever the following occurs: installation of a new monitor, replacement of broken parts, when a zero/precision/span check fails by more than 10%, after 6 months has expired since the last calibration, or yearly if a daily automated zero/precision/span checks are being

Section 24: Trace Level SO2 Revised: February 22, 2016
Revision Number: 9
11
performed, or at the operator’s discretion. The calibration check is a quality control procedure used to verify that the air monitoring system is operating properly. The check involves comparing the response of the station analyzer to SO2 concentrations generated by the station gas calibration system. The calibration levels shall be:
• Zero • Level 1– 160-180 ppb • Level 2 – 80-100 ppb • Level 3 – 40-60 ppb • Level 4- 10-20 ppb
Using linear regression, a calibration relationship is determined using the indicated values of the analyzer and the actual values of the Calibrator. Acceptance criteria can be found in Table 24-3 of this SOP from the Measurement Quality Acceptance Tables from the Quality Assurance Handbook for Air Pollution Measurement Systems, Volume II, Appendix D. EPA-454/B-13-003, July 2014. The calibration data is saved for use as a point of reference for subsequent calibrations.
On the Main Screen (or Standby Screen) of the 146i Calibrator, press the MENU button to access the Main Menu Screen. Scroll to OPERATION and press ENTER. Use the ← and → buttons to select desired GAS and press ENTER. Use the ↓ button to scroll down to SPAN. Use the ← and → buttons to scroll to SPAN 0 and press ENTER to put the 146i Calibrator in zero air mode. With the zero air flowing, verify that the Calibrator and data logger reads 0.000 ppb ± 0.2 ppb. Allow the analyzer to sample zero gas until a stable reading is obtained on the SO2 channel. Press the front panel MENU button on the 43i-TLE site analyzer to display the Main Menu. Use the arrow keys to select CALIBRATION and press ENTER to display the Calibration Menu. Select CAL SO2 BACKGROUND and press ENTER. In the SO2 BACKGROUND screen, press ENTER to set the SO2 reading to zero. Press the MENU button to return to the Calibration Menu. Adjust the flow rate from the SO2 standard to generate and SO2 concentration of approximately 80% the upper range limit (URL) of 200 ppb (i.e. 160 ppb). Allow the Calibrator and data logger to obtain stable readings on the SO2 channel. Press the front panel MENU button on the 43i-TLE site analyzer to display the Main Menu. Use the arrow keys to select CALIBRATION and press ENTER. Scroll to CAL SO2 COEF and press ENTER. Use the ← and → buttons to move the cursor left and right. Use the ↓ or ↑ buttons to increment and decrement the digit to the expected SO2 concentration and press ENTER. After the zero and 80% URL points have been set, determine at least 3 approximately evenly spaced points between zero and the 80% URL without further adjustment to the analyzer. SPAN 1 - 4 have been programmed for calibrations. SPAN 4 is set to 4.500 ppm, SPAN 3 is set to 2.250 ppm, SPAN 2 is set to 1.200 ppm, and SPAN 1 is set to 0.450 ppm. Perform the calibration checks by a direct comparison between the 146i Calibrator and data logger. Allow the Calibrator and data logger to obtain stable readings on the SO2 channel and record readings. Repeat for SPAN 4 - 1, respectively. Record all information on the Calibration Field Sheet, Form 2, Appendix A.

Section 24: Trace Level SO2 Revised: February 22, 2016
Revision Number: 9
12
Generate the regression analysis calculations by least squares the slope, intercept, and correlation coefficient of the site analyzer response versus the calibration standard concentrations, Form 3, Appendix A. 24.10 Quality Control
24.10.1 Station Inspection Before entering the station, the perimeter should be inspected for damage. Extreme weather conditions, neglect of station maintenance, or vandalism may have resulted in damage to the site since the operator's last visit. Check that the sample probe is intact and has not been damaged.
Once the operator enters the monitoring station:
• Check for any obvious analyzer malfunctions. For example, check to see that the equipment is running, the pumps are operating and the instrument is cycling properly.
• Note any unusual odors or noise. An unusual odor may indicate a point source of a pollutant or a strange new noise can indicate a malfunction in the equipment. These observations should be recorded in the station log book and may prove to be invaluable if the data is challenged.
The station operator is responsible for making several observations during the station inspection. Any of the above described observations must be thoroughly detailed in the station log book. Once the initial inspection is made, the operator must proceed with a routine inspection and perform a zero/precision/span check on the TL-SO2 analyzer.
24.10.2 Station Log Book A station log book must be maintained at each monitoring site and should accurately reflect site operations. The log book will be identified with the station name, station number, date, time, operator, instrument identification, parameter, scale and units. All entries shall include the date, time, quality control checks, and maintenance on equipment, audits, equipment changes and missing or invalid data. Additional information should include: maintenance performed on the station, abnormal traffic patterns, nearby construction, or sample line cleaning. Should the data be challenged, the information recorded in the log book is invaluable. A written record of observations concerning abnormal operations or localized occurrences is critical if a violation of ambient air standards were recorded during this period. Completed log books will be maintained by Polk County Air Quality and will be archived for future reference. 24.10.3 Bi-Weekly Zero, Precision and Span Checks The zero/precision/span check is a quality control procedure used to verify that the air monitoring system is operating properly. The check involves comparing the response of the station analyzer to TL-SO2 concentrations generated by the station Calibrator. The deviation between the "indicated" value of the analyzer and the "actual" or "true" value of the Calibrator is then determined. Zero air and SO2 concentrations of 15-30 ppb (precision), 80-90 ppb (mid-point), and 160-180 ppb (span) are generated by the Calibrator. Each concentration is measured by the Calibrator and the station analyzer. Following the precision and span checks, the deviation from the true TL-SO2 value is determined.

Section 24: Trace Level SO2 Revised: February 22, 2016
Revision Number: 9
13
The following critical criteria require recalibration of the field analyzer and invalidation of the data unless there is compelling reason and justification not to do so: if the precision and span check results in a percent difference + 10%, or if the zero drift is + 5.0 ppb. The zero/precision/span check must be performed once every fourteen days and is always performed in the same manner. Failure to perform and document zero/precision/span data within the required frequency and concentration may result in the invalidation of data. The operator is required to submit the completed field sheet form to the Quality Assurance Officer for review. For more detailed procedures on, Zero, Precision and Span Checks refer to Section 24.14.4 Zero, Precision and Span Checks. 24.10.4 Data Acquisition and Telemetry Data acquisition involves retrieval of the ambient air quality data from the data logger. The station operator has the primary responsibility for distinguishing valid measurements from indications caused by malfunctioning instruments or source interferences. The telemetry system can be used by a station operator to scan data transmitted from the monitoring station to a central location. This enables the operator to "call" the monitor site and examine the data recorded at the monitoring station (i.e. TL-SO2 concentrations and station temperature). The station operator should be familiar with daily concentration variations (i.e. the times daily maximum concentrations). By recognizing abnormal data, the operator is alerted that the instruments may not be operating properly and a station visit may be necessary. However, monitoring a station by telemetry is not to be substituted for the site visit. See Polk County Air Quality SOP Section 18 for instructions on data acquisition.
24.11 Equipment, Maintenance and Trouble Isolation
24.11.1 Preventative Maintenance Each instrument must be periodically examined and serviced to anticipate and prevent instrument failure. Scheduled maintenance on the instruments will prevent costly repairs and loss of data. The routine maintenance required on the analyzers by the station operator is minimal and outlined in the manufacturer’s instruction manual. By keeping track of the instrument responses from week to week, the operator can observe trends, which would alert the operator of a potential problem, and to correct the situation before the instrument fails. Table 24-1 displays a preventative maintenance schedule for the operator at the end of these procedures.
24.11.1.1 Analyzer Leak Check A system leak check should be performed on a yearly basis, or as needed for trouble shooting purposes. To perform a system leak check on the analyzer, disconnect the sample line from the SAMPLE INLET on the back panel, and plug the fitting. Press the MENU button to display the Main Menu. Use the ↓ buttons to scroll to DIAGNOSTICS and press ENTER. From the Diagnostic Menu, use the ↓ buttons to scroll to FLOW and press ENTER. The flow reading should slowly drop to zero. Press the MENU button to return to the Diagnostics Menu. Use the ↑ buttons to scroll to PRESSURE and press ENTER. The pressure reading should drop below 180 mmHg. If the flow and pressure do not drop to their desired limits, there is a leak in the system. Check to see that all fittings are tight, and none of the input lines are cracked or broken.

Section 24: Trace Level SO2 Revised: February 22, 2016
Revision Number: 9
14
24.11.1.2 Sample Line Leak Check A comprehensive leak check should be performed on a yearly basis, and anytime new sample line is installed. Unscrew the sample line from the back of the analyzer, and connect to the vacuum pressure gauge. The sample line must be capped off on the top side of the roof before proceeding. Turn vacuum pump on and wait for the pump to remove all air from the sample line. The vacuum gauge will indicate a steady reading of approximately 21 in Hg vacuum when the lines have been evacuated. The vacuum reading must be at least 15 in Hg for the leak check to take place. Close the valve that is located between the vacuum gauge and the pump. Once the valve is closed record the reading from the gauge and start a timer. Shut the pump off and wait 1 minute. Record the reading from the vacuum gauge. The acceptable leak rate for the sample lines is 0.5 in Hg for the 1 minute check. If the leak check fails, make sure all lines are connected securely to the vacuum gauge and the line is capped off the roof, and repeat the check. If a second leak check fails, look for the leak and/or replace sample line if needed.
24.11.1.3 Particulate Filter Changes A 0.5 micron Teflon filter housed in a Teflon filter holder is located on the outside of the analyzer and is connected to the sample line. The filter should be checked every two weeks and changed when noticeably dirty. Slow response of the analyzer during the zero/precision/span check is an indication of a dirty filter or contaminants in the sample line. To replace the used filter, loosen the two halves of the filter holder and replace the dirty filter with a new filter. 24.11.1.4 Cleaning the Fan Filters Under normal use, the fan filters on the rear panel should be cleaned every six months. If the instrument is operated in excessively dirty surroundings, it may be necessary to clean the fan filters more frequently. 24.11.1.5 Replacing the Sample Lines It is the operator’s responsibility to maintain the sample lines. The sample lines must be replaced if the operator suspects a loss in SO2 concentrations due to contamination in the line, or every two years.
Table 24-1: Preventive Maintenance Schedule for the 43i-TLE Item Schedule Visual inspection and cleaning 1/6 months Sample particulate filter inspection 1/2 Weeks Verify Test Function 1/2 Weeks Perform Level I auto check 1/day Capillary inspection and replacement 1/6 months Perform flow check 1/6 months Fan filter inspection and cleaning 1/6 months

Section 24: Trace Level SO2 Revised: February 22, 2016
Revision Number: 9
15
Sample Leak Check 1/year
24.11.2 Trouble Isolation The instruments in Polk County Air Quality’s air monitoring network are very reliable. However, after a period of continuous use problems may occur. Leaks in the system, built up dirt and UV lamp failure are typical. After time, the operator should be able to quickly distinguish the symptoms and causes of equipment failure. It is suggested that each station operator consult the Model 43i Trace Level SO2 Analyzer Instruction Manual, and compile personal notes on troubleshooting as they gain experience with the Thermo Scientific. The operator is encouraged to contact Thermo Scientific technical support at 1-866-282-0430 when attempting any repairs. 24.11.3 Environmental Control for Monitoring Equipment Instrument vibration should be reduced as much as possible. Use shock-absorbing feet for the monitor. Any pumps must be fitted with rubber feet to reduce vibration. All pumps connected to the analyzer should be connected using tubing that will prevent the transfer of vibrations back to the instrument and/or the instrument rack. All instruments should be shielded from natural or artificial light.
Ensure constant voltage to surge protection devices and equipment. Regulate the housing temperature between 20-30°C. The operator’s manual indicates that in non-condensing environments or when a water drop-out is present the instrument may be safely operated over the range of 0-45°C. Hourly enclosure temperature readings are collected by the polling computer during daily polling. Polk County will make every effort to operate the monitor in the 20-30°C range. Data will be investigated to determine the validity of the data for hourly concentrations where the shelter temperatures fall outside the range of (20-30°C).
24.12 Quality Assurance
24.12.1 Direct Comparison Audit Once during each calendar quarter, the designated Quality Assurance Officer utilizing the procedures and calculations specified in 40 CFR 58, Appendix A, "Quality Assurance Requirements for State and Local Air Monitoring Stations (SLAMS)," the TL-SO2 analyzer will be audited using a direct comparison between the analyzer’s current indicated value and the audit standard’s current known concentration. An audit is an independent assessment of the accuracy of data generated by an ambient air analyzer. Independence is achieved by having the audit performed by an operator other then the one conducting the routine field measurements and by using audit standards, reference materials, and equipment different from those routinely used in monitoring. Proper implementation of an auditing program will ensure the integrity of the data and assess the accuracy of the data.

Section 24: Trace Level SO2 Revised: February 22, 2016
Revision Number: 9
16
An audit consists of challenging the 43i-TLE continuous analyzer with known concentrations of SO2 within the measurement range of the analyzer. The 146i Dynamic Gas Calibrators can be programmed to generate the desired TL-SO2 audit concentrations, see Polk County Air Quality SOP Section 26. Generate at least three of the following SLAMS consecutive audit concentrations: 0.410-0.900 ppm, 0.110-0.400 ppm, 0.020-0.100 ppm, 0.006-0.010 ppm, and 0.0003-0.005 ppm. The audit levels selected should represent 80 percent of the ambient concentrations measured by the analyzer. Allow each audit concentration to stabilize for a minimum of 5 minutes. Record a five minute average update of the audit standard for each audit point and calculate and record the means of these five minute averages. Record the site analyzers response from the data logger display. Both the audit standard and site analyzer readings should be taken only after a stable response is exhibited by both instruments. The results are recorded on the Quarterly Audit Sheet, Form 4, Appendix A. If the percent difference is outside ±15% or if the absolute value of the zero reading is outside ±5.0 ppb, and there is reason to believe the results are incorrect or not representative of the analyzers performance, the cause for the error must be investigated and corrected. An investigation initiated by audit results that are outside the above limits may require the invalidation of data. Record all information in the site log. NOTE: For more detailed information concerning audit performances for TL-SO2 monitoring, refer to the “Quality Assurance Handbook for Air Pollution Measurement Systems, Volume II” or 40 CFR 58 or Table 24-3 of this SOP. 24.12.2 Performance Evaluation Audit Agency staff are sent an audit device, such as for the National Performance Audit Program (NPAP). The agency staff does not know the TL-SO2 concentrations produced by the audit equipment. Responses of the on-site analyzer are then compared against those of the generator and a linear regression is calculated. The Polk County Air Quality Department will participate in the USEPA performance audit program for TL-SO2 and in all other EPA audit programs, which may arise in the future. The results of these audits do not have an acceptance criteria however Polk County hopes to have results of +/-15%. A review of the monitoring system shall be conducted if the results are above this. These blind audits will indicate any deficiency in the monitoring system in respect to precision and accuracy, calibrations and maintenance.
24.13 Data Quality Assessment For each calendar quarter and year, Polk County Air Quality will prepare data precision, accuracy and completeness reports for the Iowa Department of Natural Resources (Iowa DNR) and EPA-Region 7 in accordance with the current Letter of Agreement (LOA).
24.13.1 Precision The precision will be evaluated and reported employing the frequencies, procedures and calculations in 40 CFR Part 58, Appendix A, "Quality Assurance Requirements for State and Local Air Monitoring Stations (SLAMS)". 24.13.2 Accuracy The Polk County Air Quality Program participates in the USEPA performance audit program for SO2 and in all other EPA audit programs, which may arise in the future. Using results from the performance

Section 24: Trace Level SO2 Revised: February 22, 2016
Revision Number: 9
17
audits and the calculations specified in 40 CFR 58, Appendix A, "Quality Assurance Requirements for State and Local Air Monitoring Stations". The accuracy will be evaluated and reported. 24.13.3 Data Completeness The completeness of the data will be determined for each monitoring instrument and expressed as a percentage. Percent valid data will be a gauge of the amount of valid data obtained from the monitoring instrument, compared to the amount expected under ideal conditions (24 hours per day, 365 days per year). Exceptions will be made for analyzers with a seasonal sampling period, which were not installed at the beginning, or which were discontinued prior to the end of any reporting period for calculation purposes.
24.14 Procedures for Bi-Weekly Checks New station operators will be provided with on-site training by an experienced operator before they operate a station on their own. The following procedures are intended to assist the operator in performing and documenting monitoring procedures. Monitoring personnel must become familiar with the Instruction Manual for Thermo Scientific Model 43i Trace Level, SO2 Analyzer.
24.14.1 Maintenance Mode for Agilaire Model 8832 Data Loggers During any maintenance, zero/precision/span checks, calibrations, or site visit the data logger must be placed into maintenance mode. This mode flags hourly data with an (M), indicating the analyzer is in the process of being checked by the technician. Scroll down to LOGIN/SET USER LEVEL (or just press L) and press ENTER. Login to the data logger using the appropriate password and press ENTER. Use the arrow keys to scroll to CONFIGURATION MENU (C) and press ENTER. Use the arrow keys to select CONFIGURE (DATA) CHANNEL (D) and press ENTER. Use the arrow keys to select PUT CHANNEL IN MAINTENANCE MODE (I) and press ENTER. Select the correct pollutant channel and press ENTER. Repeat procedures for all appropriate channels. Proceed with maintenance, weekly precision/span check, or calibration of the analyzer. Figure 24-3 displays and data logger Model 8832.
Figure 24-3: The Agilaire Data Logger (Model 8832)

Section 24: Trace Level SO2 Revised: February 22, 2016
Revision Number: 9
18
24.14.2 Maintenance and Diagnostics Check Check and record monitor readings on the data logger. Check and record any alarms on the analyzer. If alarms are present, check field sheet for out-of-control limits and perform any necessary maintenance. Check and record all diagnostics on the Verification Field Sheet, Form 5, Appendix A. Table 24-2 displays a list of diagnostic checks and their explanations.
Check and record the calibration factors on the 43i-TLE. Press MENU and scroll to CALIBRATION FACTORS and press ENTER. Record the SO2 BKG and SO2 COEF coefficients. Write down any maintenance that was performed on the instrument or additional comments that may affect the air monitoring system. Examples include:
● replacement of UV lamps, pumps or tubing ● repairs or maintenance made to or around the shelter ● abnormal localized occurrences nearby ● suggestions for improvements to the system ● supplies that are needed ● checks or audits that were performed
Table 24-2 Diagnostic Checks
Check Explanation
Voltages The current DC power supply and PMT power supply voltages
Temperatures The current internal instrument and chamber temperatures
Pressure The current chamber pressure
Flow The current sample flow rate
Lamp Intensity The current % UV lamp intensity
Optical Span Test A quick way of checking the optics and electronics for span drift
Test Analog Outputs
Enable analog outputs to be set to zero and full scale to adjust analog outputs to agree with the front panel display
24.14.3 Zero, Precision and Span Checks Use the 146i to perform the precision/span checks by diluting the cylinder gas to the desired precision/span levels. The precision/span check must be performed through the sample line filter when used in daily sampling. The ranges are as follows:
• Precision: 5-20 ppb • Mid Point: 80-90 ppb • Span: 160-180 ppb

Section 24: Trace Level SO2 Revised: February 22, 2016
Revision Number: 9
19
The zero air must be free of contaminants that could cause a detectable response on the SO2 analyzer. Polk County Air Quality Division uses the Teledyne 701 air generator with charcoal and Purafil® for the source of zero air. For more information on zero air scrubbers, see Polk County Air Quality SOP Section 25 for instructions for the Zero Air Module Model 701/701H. The external zero air generator is connected to a manifold which is connected to the zero air port on the back of the 146i Calibrator. The 146i Calibrator output port is connected to a “T” that splits between the span and zero ports on the 43i-TLE.
24.14.3.1 Span Check There are two span levels conducted. A span level of 70-90% of the upper range limit of the instrument (or 160-180 ppb). The second level is a mid point level in the range of 80-90 ppb. On the 43i-TLE, press the RUN button to put the site analyzer in SPAN mode. On the Main Screen (or Standby Screen) of the 146i Calibrator, press the MENU button to access the Main Menu Screen. Scroll to OPERATION and press ENTER. Use the ← and → buttons to select desired GAS and press ENTER. Use the ↓ button to scroll down to SPAN. Use the ← and → buttons to scroll to SPAN 3 and press ENTER. SPAN 3 has been programmed to produce the span level of 70-90% the upper range limit of the instrument (or 160-180 ppb). Perform the span check using a cylinder containing 9 to 12 ppm SO2 in N2. The flow can be read on the 146i Calibrator display screen by pressing the Diagnostics Quick button. Scroll to Flow and select Enter. This screen reports the actual gas and zero-air flows and the corresponding target flows. Allow the site analyzer to run for 5 minutes or until stable, then record the SO2 flow, zero actual and gas actual readings from the TL-SO2 channels on the Verification Field Sheet, Form 5, Appendix A. Repeat for other spans. NOTE: Polk County Air Quality uses the Agilaire Model 8832 data loggers for data recording. The values indicated on the data logger are the values that are being transmitted to, and recorded by the central computer. Therefore, it is important that the data logger readings are recorded on the field sheet. Determine the analyzer’s % difference by using the following equation to determine the percent difference between the data logger and the transfer standard:
100%
146
146 ×−
=C
CCDifference M
Where: =MC data logger concentration, ppb
=146C Calibrator concentration, ppb Refer to Section 24.10.3 for acceptable control limits.

Section 24: Trace Level SO2 Revised: February 22, 2016
Revision Number: 9
20
Repeat Section 24.14.4.1 for the mid-point level span check. Use SPAN 2 for the mid point level span check, it has been programmed to produce the mid point level span check in the range of 80-90 ppb. For control limits and recommended corrective actions, refer to Table 24-3 in this SOP or to the Measurement Quality Objective Tables from the Quality Assurance Handbook for Air Pollution Measurement Systems, Volume II, Appendix D. EPA-454/B-13-003, July 2014. If a calibration is necessary, it must be performed after the zero/precision/span checks are finished. 24.14.3.2 Precision Check At this point the span readings have been recorded, perform the precision level check. On the Main Screen (or Standby Screen) of the 146i Calibrator, press the MENU button to access the Main Menu Screen. Scroll to OPERATION and press ENTER. Use the ↓ button to scroll down to SPAN. Use the ← and → buttons on the 146i to scroll to SPAN 1 and press ENTER. SPAN 1 has been programmed to produce the precision level of 5-20 ppb. Allow the site analyzer to stabilize for a minimum of 5 minutes and record all data logger readings from the TL-SO2 channels on the Verification Field Sheet, Form 5, Appendix A. Using the following equation to determine the percent difference between the data logger and the Calibrator: 24.14.3.3 Zero Check At this point the precision reading has been recorded, perform the zero check. On the 43i-TLE, press the RUN button to put the site analyzer in ZERO mode. On the Main Screen (or Standby Screen) of the 146i Calibrator, press the MENU button to access the Main Menu Screen. Scroll to OPERATION and press ENTER. Use the ↓ button to scroll down to SPAN. Use the ← and → buttons on the Calibrator to scroll to ZERO and press ENTER to put the 146i Calibrator in zero air mode. With the zero air flowing, verify that the Calibrator and data logger reads 0.000 ppb ± 5.0 ppb. Allow the site analyzer to stabilize for a minimum of 5 minutes and record all data logger readings from the TL-SO2 channels on the Verification Field Sheet, Form 5, Appendix A. NOTE: If a problem is recognized while performing maintenance, diagnostic, zero air, weekly precision or span checks which has or could affect data, a corrective action form is to be filled out describing the problem identified and the action taken to correct the problem, Form 6, Appendix A. All forms and documentation must be submitted to the Quality Assurance Officer.
24.14.3.4 Invalidate Data and Recalibrate If the precision check results in a percent difference of + 10%, or if the zero drift is + 5.0 ppb, or if the span drift is + 10%, the site analyzer must be recalibrated and the data will be invalidated back to the last valid zero/precision/span check. See Section 24.9 for calibration procedures. NOTE: In order to minimize data loss, Polk County personal will recalibrate the instrument when the results of bi-weekly checks reach recalibration thresholds, unless there is compelling reason and justification not to do so. Recalibration criteria refer to thresholds that typically require recalibrating the analyzer, but do not require the

Section 24: Trace Level SO2 Revised: February 22, 2016
Revision Number: 9
21
invalidation of data. Recalibration criteria should be set to levels that are as tight as practically possible, and based on historical performance data. They may change after reviewing typical differences from control charts.
24.14.4 Standby Mode Once all checks have been completed, put the 146i Calibrator back in Standby Mode. On the 146i press the quick button (OPER) and use the ← → arrows to change the gas to off and press Enter. Then press the quick button (MODE). Scroll to Standby and press enter. Then press the run button to get to the standby screen. On the Data Logger press the escape button (Esc) until the main menu is reached. Take the data logger out of maintenance mode by using the arrow keys to scroll to CONFIGURATION MENU (C) and press ENTER. Use the arrow keys to select CONFIGURE DATA CHANNELS (D) and press ENTER. Use the arrow keys to select TAKE CHANNEL OUT OF MAINTENANCE (O) and press ENTER. Repeat procedures to take all channels out of maintenance mode. Press the (Esc) button until the main menu is reached. Use the arrow keys to select LOG OUT and press ENTER. Record all information on tasks performed in the site log.
24.15 Automated Zero/Precision/ Span Checks The External 24-hour Zero Check is conducted along with the 24-hour precision and span check at a concentration of 20 ppb for precision and between 80-90% of full range scale (160-180 ppb) for span utilizing the auto function of the Thermo Scientific 146i Dynamic Gas Calibrator in conjunction with the 43i-TLE analyzer. The data is flagged for this period with a “C” on the data logger. For the 43i-TLE, the 24-hour Zero Check is plumbed into the zero port in the back of the analyzer. The 24-hour Precision and Span Check is plumbed to the span port on the back of the analyzer. Zero air and Span Gas should be provided to the analyzer at atmospheric pressure. The automated zero/precision/span checks are used to determine if the 43i-TLE is operating properly, and if drift in instrument response has occurred. For these checks, the challenge gas should be sampled through as much of the sampling inlet system as practical to mimic the actual sampling of ambient air. The results of the zero/precision/span checks should be plotted on control charts to graphically illustrate the trends in the response of the analyzer to the challenge gases. Polk County Air Quality Division will analyze “drift” as a direct comparison of the current indicated concentration collected from the site analyzer to the actual concentration collected from the Calibrator. Polk County Air Quality Division will strive to obtain a zero drift < 5.0 ppb, a span drift < 10% of the span level, and a % difference for precision < 10%. If the daily automated precision check results are outside ± 10%, the instrument will be recalibrated and the data will be invalidated to the last acceptable check, unless there is a compelling reason and justification not to do so. There are several components to a successful automated zero and span checks:
• A zero air generator that gives an output of at least 10 psig. The generator is equipped with dual scrubbers of charcoal and “Perma Pure” to remove any water vapor or contaminants which may result in scrubbing. See Polk County Air Quality SOP Section 25 for instructions for the Teledyne 701 Zero Air Generator.
Section 24: Trace Level SO2 Revised: February 22, 2016
Revision Number: 9
22
• A Calibration Program setup in the 146i Calibrator
• A Calibration Program setup in the 43i-TLE Site Analyzer
• A Digital Outputs setup on the 146i Calibrator
• A Calibration Program setup in the AirVision Software for the Agilaire Model 8832 data logger
24.15.1 Calibration Program in the 146i Calibrator A calibration program must be set up in the 146i Calibrator before the calibration will occur. From the Main Menu, use the ↓ button to scroll to PROGRAM MENU and press ENTER. From the Program Menu, use the ↓ button to scroll to PROGRAM CYCLE and press ENTER.
24.15.1.1 Program Cycle The Program Cycle screen is used to turn the program mode on or off. The Program Cycle must be enabled for a programmed event to occur. From the Program Cycle Status Screen, press ENTER enable the program cycle. 24.15.1.2 Period Hours The period Hours screen defined the period or interval between zero and span checks. Periods between 0 and 999 hours are acceptable. To turn the check off, set the period to 0. From the Program Menu, use the ↓ button to scroll to PERIOD HOURS and press ENTER. Use the ← and → buttons to move the cursor left or right, and the ↑ and ↓ buttons to increment or decrement to the desired numeric value. Polk County Air Quality will use a sample period of 24-hours. 24.15.1.3 Next Cycle The Next Cycle screen is used to view and set the next zero and span check date and time. Once the initial check is performed, the date and time of the next check is calculated and displayed. From the Program Menu, use the ↓ button to scroll to NEXT CYCLE and press ENTER. Use the → button to select: year, month, day, hour, minutes, or seconds. Use the ↑ or ↓ buttons to increase/decrease the desired value. Set the appropriate date and time and press ENTER. Polk County Air Quality will run their auto-calibration program daily at 22:00. 24.15.1.4 Events The Events Menu is used to configure events that are part of the program cycle. The number of events and total time of enabled events are displayed. The target values on the right side of the display, is an abbreviated line that describes the settings for that specific event, and should show the desired values based on the displayed operation parameters on the left side. Specific parameters include: • Gas: A-F, Zero
• Span level for the gas: 1-5, Zero
• Ozonator and permeation levels: 1-5, Off
• Photometer mode: I=internal, E=external, C=control
• Event duration time in minutes

Section 24: Trace Level SO2 Revised: February 22, 2016
Revision Number: 9
23
From the Program Menu, use the ↓ button to scroll to EVENTS and press ENTER. Use the ↓ button to scroll to Event 1 and press ENTER. Event 1 will be used for the zero check. To set the zero air duration, use the ↓ button to scroll to ENABLED and press ENTER. Use the ← and → buttons to move the cursor left or right, and the ↑ and ↓ buttons to increment or decrement to the desired numeric value. Polk County Air Quality will sample zero air for 19 minutes. Use the ↓ button to scroll to GAS B and press ENTER. Use the ← and → buttons to move the cursor left or right, and the ↑ and ↓ buttons to increment or decrement to set the cylinder tank concentration. Use the ↓ button to scroll to SPAN 0 and press ENTER. Use the ← and → buttons to move the cursor left or right, and the ↑ and ↓ buttons to increment or decrement to set the value to 0 ppb. From the Events Menu, use the ↓ button to scroll to EVENT 2 and press ENTER. Use the ↓ Event 2 will be used for the precision and span check. To set the span duration, use the ↓ button to scroll to ENABLED and press ENTER. Use the ← and → buttons to move the cursor left or right, and the ↑ and ↓ buttons to increment or decrement to the desired numeric value. Polk County Air Quality will sample span gas for 19 minutes. Use the ↓ button to scroll to GAS B and press ENTER. Use the ← and → buttons to move the cursor left or right, and the ↑ and ↓ buttons to increment or decrement to set the cylinder tank concentration. Use the ↓ button to scroll to SPAN 1 (for precision) and press ENTER. Then repeat for SPAN 3 (for span). Span 1 and 3 have been programmed to sample gas at the precision level of 20 and span level of 170.0 ppb. See Polk County Air Quality SOP Section 26 for instructions on programming the precision and span concentrations in the 146i for the Dynamic Gas Calibrators.
24.15.2 Calibration Program in the 43i-TLE A calibration program must be set up in the 43i-TLE so that the zero port and span port are opened at the appropriate time. This program will occur simultaneously with the calibration program in the 146i Calibrator. From the Main Menu, use the ↓ button to scroll to CALIBRATIONS and press ENTER. From the Calibration Menu, use the ↓ button to scroll to ZERO/SPAN CHECK and press ENTER.
24.15.2.1 Next Time The Next Time screen is used to view and set the next zero/span check date and time. Once the initial check is performed, the date and time of the next check is calculated and displayed. From the Zero/Span Check Menu, use the ↓ button to scroll to NEXT TIME and press ENTER. Use the → button to select: year, month, day, hour, minutes, or seconds. Use the ↑ or ↓ buttons to increase/decrease the desired value. Set the appropriate date and time and press ENTER. Polk County Air Quality will use a sample time of 22:00 hours. NOTE: At each site visit, the internal clock on the site analyzers and Calibrator should be synced to the time on the data logger. 24.15.2.2 Period Hours The period Hours screen defined the period or interval between zero/precision/span checks. Periods between 0 and 999 hours are acceptable. To turn the check off, set the period to 0. From the Zero/Span Check Menu, use the ↓ button to scroll to PERIOD HR and press ENTER. Use the ← and → buttons to move the cursor left or right, and the ↑ and ↓ buttons to increment

Section 24: Trace Level SO2 Revised: February 22, 2016
Revision Number: 9
24
or decrement to the desired numeric value. Polk County Air Quality will use a sample period of 24-hours. 24.15.2.3 Zero Duration The Zero Duration Minutes Screen defines how long the zero level is sampled by the instrument. Durations between 0 and 60 minutes are acceptable. To set the zero duration, use the ← and → buttons to move the cursor left or right, and the ↑ and ↓ buttons to increment or decrement to the desired numeric value. Polk County Air Quality will sample zero air for 19 minutes. 24.15.2.4 Precision and Span Duration The Precision and Span are both ran by through the span option. The Precision and Span Duration Minutes Screen defines how long the span level is sampled by the instrument. Durations between 0 and 60 minutes are acceptable. To set the span duration, use the ← and → buttons to move the cursor left or right, and the ↑ and ↓ buttons to increment or decrement to the desired numeric value. Polk County Air Quality will sample span air for 19 minutes. 24.15.2.5 Averaging Time The Averaging Time screen allows the user to adjust the zero/span averaging time. This averaging time is used by the analyzer only when performing an automatic check. The analyzer’s averaging time is used for all other functions. From the Zero/Span Check Menu, use the ↓ button to scroll to AVERAGE TIME and press ENTER. Use the ↑ and ↓ buttons to scroll to 300 SEC and press ENTER.
24.15.3 Digital Output Wiring of the 146i Calibrator The Model 146i is remotely controllable through the 37-pin female rear panel connector with a 24-green wire placement connector. Refer to Thermo Scientific Model 146i Dynamic Gas Calibrator Instruction manual for correct wiring of the 37-pin digital output. Polk County Air Quality uses Gas B on the 146i to perform the auto zero and precision, span checks on the 43i. The 37-pin digital output is wired to positions 1, 2 and 3 on the Status Input Card of the Agilaire data logger.
Gas Wiring-Gas Bit 2 (Gas B) 37-pin connector: Pins 2 and 21, refer to Page 2-8 of the 146i Instruction Manual 24-green wire placement connector: Pins 3 and 4, refer to Tables 2-2 and 6-6 of the 146i Instruction Manual Precision and Span Wiring-Span Bit 2 (Span 1 & 3) 37-pin connector: Pins 5 and 24, refer to Page 2-9 of the 146i Instruction Manual 24-green wire placement connector: Pins 9 and 10, refer to Tables 2-2 and 6-6 of the 146i Instruction Manual The following conditions need to be met for the zero/precision/span check to occur: Zero: Gas Bit 2 =1(on), Span Bit 1=0(off), Span Bit 2=0(off) Prec: Gas Bit 2=1(on), Span Bit 1=(on), Span Bit 2=0 (off)

Section 24: Trace Level SO2 Revised: February 22, 2016
Revision Number: 9
25
Span: Gas Bit 2 =1(on), Span Bit 1=1(on), Span Bit 2=1(on) 24.15.4 Calibration Program in Agilaire AirVision Software A Calibration Program must be set up in AirVision in order for the software to recognize that the instrument is in calibration mode and flags the data with a “C”. An Instrument-Controlled Calibration program will be used. Three separate phases will be configured: one phase for the zero check, one phase for the precision check and one phase for the precision check.
24.15.4.1 Configuring Automatic Calibration for Model 8832 Data Loggers In the CONFIGURATION EDITOR click on DATA SOURCE DETAILS, see Figure 24-4. Figure 24-4: Data Source Details Screen
Click on the “+” beside the desired site name for which the calibration program is to be configured. Click to highlight the logger at that site, see Figure 24-5. Figure 24-5: Selecting the Data Logger
Now a calibration program can be added to that logger. From the menu bar, click the ADD button. Click ADD CALIBRATION from the drop-down menu. Select INSTRUMENT CONTROLLED from the calibration drop-down menu, see Figure 24-6.

Section 24: Trace Level SO2 Revised: February 22, 2016
Revision Number: 9
26
Figure 24-6: Adding an Instrument Controlled Calibration
An instrument controlled calibration is initiated by the relay output program set up in the Thermo 146i Calibrator, refer to Section 24.15.3. The data logger senses the zero, precision and span phases through its digital input lines, see Figure 24-9. For each phase, a specific pattern of input control line status is defined. The data logger monitors input control line status and when the specified pattern is met, the corresponding calibration phase is initiated. There is no predefined duration for individual phases programmed into the AirVision calibration program; each phase will continue until the input line pattern is no longer met. The duration of each phase is determined by the calibration program in the Thermo 146i Calibrator, refer to Section 24.15.1. Polk County uses a 19 minute duration for each desired phase. At the end of each phase, the concentrations are written into the calibration report. A SEQUENCE EDITOR Screen appears, see Figure 24-7. Figure 24-7: Sequence Editor Screen

Section 24: Trace Level SO2 Revised: February 22, 2016
Revision Number: 9
27
Complete the following fields: • Calibration Type – will already be filled in as Instrument(Controlled)
• Calibration Name – is required to identify the calibration program
• Enabled – check if the calibration is to run
• Number of Calibration Records – determines how many calibrations the data logger will store before overwriting
• Recovery Time – specifies the time required to purge the calibration gases after calibration phases are competed. This function provides a delay before normal sampling and averaging resumes. Polk County Air Quality will use a recovery time of 10 minutes.
• Affected Channels – determines which channels will be taken off-line during the calibration. Select from a list of previously configured parameters.
24.15.4.2 Configuring Calibration Phases At least one phase must be configured for each calibration. Polk County Air Quality uses two phases for the TL-SO2 auto checks: a zero phase, a precision phase and a span phase. Click the ADD PHASE button in the Sequence Editor Screen. The PHASE EDITOR SCREEN will appear, see Figure 24-8. Figure 24-8: Phase Editor Screen
To set up, complete the following fields:
• Name of Phase – Enter a user-defined name that identifies each phase of the calibration sequence. Valid values are A-Z and 0-9.
• Phase Number – Enter to specify the order in which the phase will occur within the calibration. Phase numbers must be in sequence, beginning with 01.
• Response Time – Enter a time to specify how long data will be averaged during a calibration phase. Polk County Air Quality will use a Response Time of one minute.

Section 24: Trace Level SO2 Revised: February 22, 2016
Revision Number: 9
28
Press SELECT LINES under STATUS PATTERN to set up the specific pattern of input control line status. Each phase will have a unique pattern. The zero phase, displayed in Figure 24-9, will have a pattern of 1 = on and 2,3 = off. The precision phase will have a pattern of 1 & 2 on and 3 off. The span phase will have a pattern of 1,2,3 = on. Normal sample mode will have a pattern of 1,2,3, = off. NOTE: When reading the status inputs from the Model 8832 data logger, the following patterns will be observed:
• Zero Phase: 1&2=0&3=0 • Precision Phase: 1&2 & 3=0 • Span Phase: 1&2&3
Figure 24-9: Input Control Lines Screen, Programmed for the Zero Phase
24.15.4.3 Configuring Expected Values Enter an expected value for each phase. The expected value is typically the value of calibration gas. Highlight the desired phase to configure the expected value. Click the ADD button in the Menu bar, and select PHASE CHANNEL from the drop-down menu, see Figure 24-10.

Section 24: Trace Level SO2 Revised: February 22, 2016
Revision Number: 9
29
Figure 24-10: Setting Up a Phase Channel
Select a phase and click OK to continue to the EXPECTED VALUE EDITOR Screen, see Figure 24-11. Figure 24-11: Setting Up an Expected Value

Section 24: Trace Level SO2 Revised: February 22, 2016
Revision Number: 9
30
Complete the following fields:
• Channel – Use the drop-down menu to select the desired parameter for which the auto-calibration is to occur.
• Expected Value - Enter a value in this text box to specify the expected value of the calibration for the phase. Polk County Air Quality uses the expected values: Zero Phase=0, Precision Phase = 20 ppb and Span Phase=170 ppb.
• Store Calibration Records - Click this box to store the value of the data point in the calibration record. Leave this field blank if you are using a parameter for calibration correction only or writing to math pack, so the value will not be included in calibration records (i.e., if the parameter is not required by regulations to be calibrated).
• Error Method – Use the drop-down menu to select the error method to be used in the calibration report from the following choices: % difference, linearity, standard.
Click the SAVE button to save the calibration program.

Table 24-2: Measurement Quality Objectives

Section 24: Trace Level SO2 Revised: February 22, 2016
Revision Number: 9
32

Section 24: Trace Level SO2 Revised: February 22, 2016
Revision Number: 9
33

Section 24: Trace Level SO2 Revised: February 22, 2016
Revision Number: 9
34
APPENDIX A-Critical Forms and Field Sheets
Form 1 …………………………………………………………………… Gas Comparison Spreadsheet Form 2…………………………………………………………………….. Calibration Field Sheet Form 3…………………………………………………………………….. Calibration Linear Regression Form 4……………………………………………………………………. Quarterly Audit Field Sheet Form 5…………………………………………………………………. Verification Field Sheet Form 6……………………………………………………………………. Corrective Action Form

Section 24: Trace Level SO2 Revised: February 22, 2016
Revision Number: 9
35
Form 1 – Gas Comparison Spreadsheet DateTimeSite
Pollutant SO2Operator
Standard Cylinder Conc. PPMSerial Number
Expiration DateCanidate Cylinder Conc. PPM
Serial NumberExpiration Date
Gas Calibrator Thermo 146iLast Verification
Monitor Thermo TL-43iLast Calibrated
AIR GAS Kno wn Va lue Ins trume nt Re sp o nse
Verification Zero Air Actual MFC Gas Pollutant Actual MFC SO2 SO2
SCCM SCCM PPB PPBStandard ZeroCanidate Zero
AIR GAS Kno wn Va lue Ins trume nt Re sp o nse % Diffe re nce Pa ss
Verification Zero Air Actual MFC Gas Pollutant Actual MFC SO2 SO2 SO2 SO2
SCCM SCCM PPB PPB PPB PPBStandard Precision 20Candidate Precision 20
Standard Mid Point 85Candidate Mid Point 85
Standard Span 170CandidateSpan 170
Avg % Diffenece Is Avg % Diffence ±4% ? Is Candidate Gas OK ?
EXTERNAL ZERO TEST
VERIFICATION
Gases
Instruments

Section 24: Trace Level SO2 Revised: February 22, 2016
Revision Number: 9
36
Form 2 – Calibration Field Sheet Trace Level Sulfur Dioxide Calibration Sheet Site:____________________
Date: ____________________________ Time: ____________________________ Tech:_____________________________
Checks Value
Alarm? (Y or N)
If Yes, Suggested Corrective Actions
Analyzer Ser #:____________________ BIAS Voltage: (5 Volts)
Refer to Instruction Manual.
Date of last calibration:______________
Calibrator Ser #:___________________ Date of last calibration:__________ Date of last audit:_______________ Date of last verification:__________
BIAS Voltage: (15 Volts)
Refer to Instruction Manual.
Zero Air Ser #: _____________________ Last annual maintenance:____________ BIAS Voltage:
(-15 Volts)
Refer to Instruction Manual.
Gas cylinder ser #: ________________
Gas expiration date: _______________ Internal Temp: (8-47°C)
Refer to Instruction
Manual. Cylinder >200 psig? (Y or N) Psig reading: ______________________ Cylinder concentration: _____________
Chamber Temp: (43-47°C)
Refer to Instruction
Manual. Zero Coefficient Reading: ___________ Precision Coefficient Reading:________
Pressure: (400-1000 mmHg)
Replace pressure
transducer Station Observations Made: (Y or N)
Data logger recording shelter temp? Flow: (0 - 2.5 LPM)
Replace Pump
(Y or N) Reading:_______________ Changed Filter? (Y or N) Sample Line Checked? (Y or N) Date/Days Elapsed:_________________ Ambient:_____________________
Lamp Intensity: (20-100%)
Check that the lamp and trigger pak are securely fastened
Zero Actual
sccm Gas Actual
sccm ESC Reading
‘Monitor’ 146i Calibrator
‘Assessment’ CALCULATIONS
Reading % Difference % Difference Drift = (Data Logger Reading – Transfer Standard Reading) x 100
Transfer Standard Reading
DRIFT
Zero Drift = Current Data Logger Reading – Calibrator Reading
1) Unadjusted Zero Span 0
Level 4 Span 1 (10-20 ppb) Set Point: 20 ppb
Level 3 Span 1 (40-60 ppb) Set Point: 50 ppb
Level 2 Span 3 (80-100 ppb)
Set Point: 85 ppb
Level 1 Span 4 (160-180 ppb)
Set Point: 170 ppb
Perform a linear regression analysis on calibration concentrations. All points should fall within + 2% of full scale of best fit straight line. Use Form 3, Appendix A from Polk County SOP Section 24-TL-SO2.
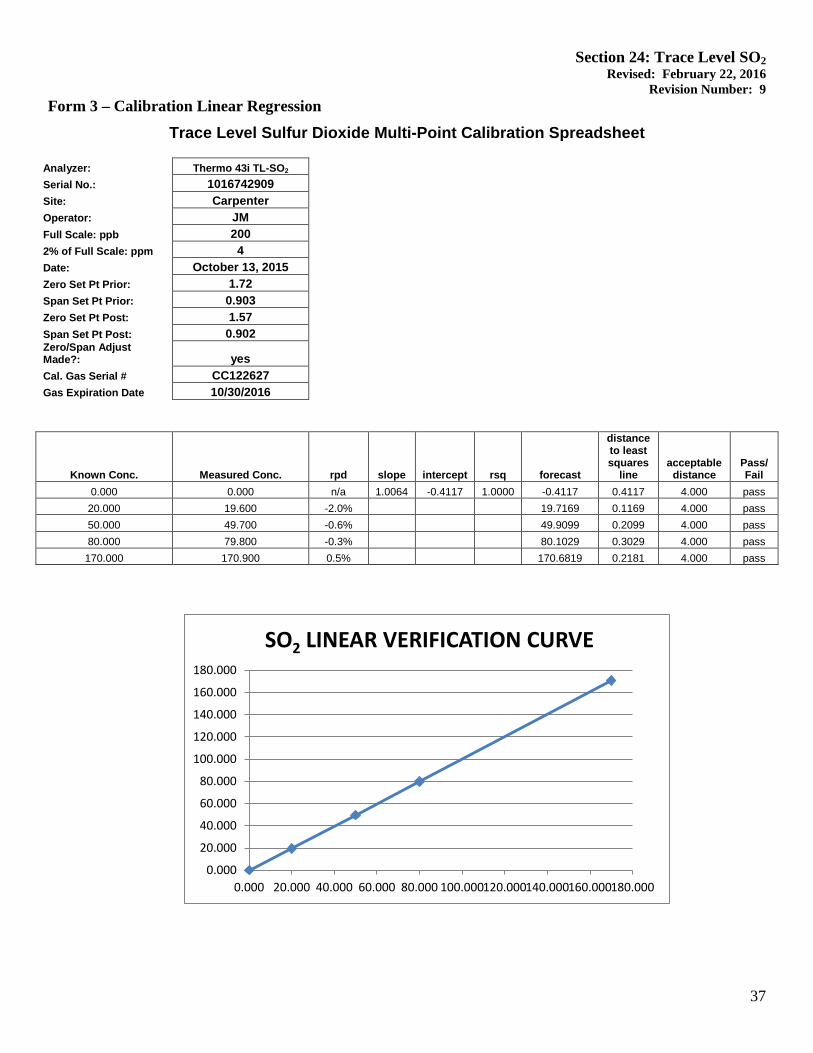
Section 24: Trace Level SO2 Revised: February 22, 2016
Revision Number: 9
37
Form 3 – Calibration Linear Regression
Trace Level Sulfur Dioxide Multi-Point Calibration Spreadsheet
Analyzer: Thermo 43i TL-SO2 Serial No.: 1016742909 Site: Carpenter Operator: JM Full Scale: ppb 200 2% of Full Scale: ppm 4 Date: October 13, 2015 Zero Set Pt Prior: 1.72 Span Set Pt Prior: 0.903 Zero Set Pt Post: 1.57 Span Set Pt Post: 0.902 Zero/Span Adjust
Made?: yes Cal. Gas Serial # CC122627 Gas Expiration Date 10/30/2016
Known Conc. Measured Conc. rpd slope intercept rsq forecast
distance to least squares
line acceptable
distance Pass/Fail
0.000 0.000 n/a 1.0064 -0.4117 1.0000 -0.4117 0.4117 4.000 pass 20.000 19.600 -2.0% 19.7169 0.1169 4.000 pass 50.000 49.700 -0.6% 49.9099 0.2099 4.000 pass 80.000 79.800 -0.3% 80.1029 0.3029 4.000 pass 170.000 170.900 0.5% 170.6819 0.2181 4.000 pass
0.000
20.000
40.000
60.000
80.000
100.000
120.000
140.000
160.000
180.000
0.000 20.000 40.000 60.000 80.000 100.000 120.000 140.000 160.000 180.000
SO2 LINEAR VERIFICATION CURVE

Section 24: Trace Level SO2 Revised: February 22, 2016
Revision Number: 9
38
Form 4 – Trace SO2 Audit Sheet Date: ____________________________ Time: ____________________________ Tech:_____________________________
Checks Value
Alarm? (Y or N) If Yes, Suggested Corrective Actions
Analyzer Ser #:____________________ BIAS Voltage: (5 Volts)
Refer to Instruction Manual. Date of last calibration:______________
Calibrator Ser #:___________________ Date of last calibration:__________ Date of last audit:_______________ Date of last verification:__________
BIAS Voltage: (15 Volts)
Refer to Instruction Manual.
Zero Air Ser #: _____________________ Last annual maintenance:____________ BIAS Voltage:
(-15 Volts)
Refer to Instruction Manual. Gas cylinder ser #: ________________
Gas expiration date: _______________ Internal Temp: (8-47°C)
Refer to Instruction
Manual. Cylinder >200 psig? (Y or N) Psig reading: ______________________ Cylinder concentration: _____________
Chamber Temp: (43-47°C)
Refer to Instruction Manual.
Zero Coefficient Reading: ___________ Precision Coefficient Reading:________
Pressure: (400-1000 mmHg)
Replace pressure
transducer Station Observations Made: (Y or N) Data logger recording shelter temp?
Flow: (0 - 2.5 LPM)
Replace Pump
(Y or N) Reading:_______________ Changed Filter? (Y or N) Sample Line Checked? (Y or N) Date/Days Elapsed:_________________ Ambient:_____________________
Lamp Intensity: (20-100%)
Check that the lamp and trigger pak are securely fastened
Zero Actual
sccm Gas Actual
sccm ESC Reading
‘Monitor’ 146 C Calibrator
‘Assessment’ CALCULATIONS
Reading DRIFT
Zero Drift = Current Data Logger Reading – Calibrator Reading
1) Unadjusted Zero Span 0
% Difference % Difference Drift = (Data Logger Reading – Transfer Standard Reading) x 100
Transfer Standard Reading
2) Level 4 (8-10 ppb)
3) Level 5 (20-49.9 ppb)
4) Level 6 (150-259.9 ppb)
If the percent difference is outside ±15% or if the absolute value of the zero reading is greater than ±5.0 ppb, and there is reason to believe the results are incorrect or not representative of the analyzers performance, the check must be repeated. The cause for the error must be investigated and corrected. An
investigation initiated by audit results outside the above limits may require the invalidation of data.

Section 24: Trace Level SO2 Revised: February 22, 2016
Revision Number: 9
39
Form 5 – Verification Field Sheet Date: ____________________________ Time: ____________________________ Tech:_____________________________
Checks Value
Alarm? (Y or N) If Yes, Suggested Corrective Actions
Analyzer Ser #:____________________ BIAS Voltage: (5 Volts)
Refer to Instruction Manual. Date of last calibration:______________
Calibrator Ser #:___________________ Date of last calibration:__________ Date of last audit:_______________ Date of last verification:__________
BIAS Voltage: (15 Volts)
Refer to Instruction Manual.
Zero Air Ser #: _____________________ Last annual maintenance:____________ BIAS Voltage:
(-15 Volts)
Refer to Instruction Manual. Gas cylinder ser #: ________________
Gas expiration date: _______________ Internal Temp: (8-47°C)
Refer to Instruction
Manual. Cylinder >200 psig? (Y or N) Psig reading: ______________________ Cylinder concentration: _____________
Chamber Temp: (43-47°C)
Refer to Instruction Manual.
Zero Coefficient Reading: ___________ Precision Coefficient Reading:________
Pressure: (400-1000 mmHg)
Replace pressure
transducer Station Observations Made: (Y or N) Data logger recording shelter temp?
Flow: (0 - 2.5 LPM)
Replace Pump
(Y or N) Reading:_______________ Changed Filter? (Y or N) Sample Line Checked? (Y or N) Date/Days Elapsed:_________________ Ambient:_____________________
Lamp Intensity: (20-100%)
Check that the lamp and trigger pak are securely fastened
Zero Actual
sccm Gas Actual
sccm ESC Reading
‘Monitor’ 146 C Calibrator
‘Assessment’ CALCULATIONS
Reading DRIFT
Zero Drift = Current Data Logger Reading – Calibrator Reading
1) Unadjusted Zero Span 0
% Difference % Difference Drift = (Data Logger Reading – Transfer Standard Reading) x 100
Transfer Standard Reading
2) Precision Level Span 1 (15-30 ppb) Set Point: 20 ppb
3) Mid Point Span 3 (80-90 ppb) Set Point: 85 ppb
4) Span Level Span 4 (160-180 ppb)
Set Point: 170 ppb
The following critical criteria require recalibration of the field analyzer and invalidation of the data unless there is compelling reason and justification not to do so: if the precision or span check results in a percent difference + 10% or if the zero drift is + 5.0 ppb. See SOP for calibration procedures.

Section 24: Trace Level SO2 Revised: February 22, 2016
Revision Number: 9
40
Form 6 – Corrective Action Form Polk County Corrective Action Form
To: Polk Co. Air Quality (position) From: Copies of completed form to: AQ Supervisor, File Urgency: Emergency (immediate action needed) Urgent (24 Hr.) Routine (7 days) Next scheduled visit Information only Problem Identification: Site: System: Date: Description of Problem: Recommended Action: Signature of Initiator: Date: Problem Resolution: Date of Corrective Action: Summary of Corrective Action: Result of Corrective Action: Signature of resolver: Date: Signature of QA Officer: ________________________________ Date: _______________________