Embed Size (px)
Citation preview

MODEL 43C Trace Level
PULSED FLUORESCENCE SO2 ANALYZER
INSTRUCTION MANUAL P/N 13399
THERMO ELECTRON CORPORATION ENVIRONMENTAL INSTRUMENTS
27 FORGE PARKWAY FRANKLIN MASSACHUSETTS 02038
(866) 282-0430 Toll Free (508) 520-0430 International
(508) 520-1460 Fax
www.thermo.com/eid
23Aug2004
The 220V option complies with 89/336/EEC directive for electromagnetic compatibility.

© 2003 Thermo Electron Corporation. All rights reserved. Thermo Electron Corporation, question
everything, and Analyze. Detect. Measure. Control are trademarks of Thermo Electron Corporation.
All other product names and logos are the property of their respective owner.
Specifications, terms and pricing are subject to change. Not all products are available in all countries.
Please consult your local sales representative for details.

iii
TABLE OF CONTENTS CHAPTER 1 INTRODUCTION .........................................................................1-1 Principle of Operation...................................................................................................... 1-1 Specifications................................................................................................................... 1-3 CHAPTER 2 INSTALLATION...........................................................................2-1 Lifting............................................................................................................................... 2-1 Unpacking ........................................................................................................................ 2-1 Setup Procedure .............................................................................................................. 2-2 Analog Output Cover Installation .................................................................................... 2-4 Startup .............................................................................................................................. 2-6 CHAPTER 3 OPERATION ...............................................................................3-1 Display ............................................................................................................................. 3-1 Pushbuttons...................................................................................................................... 3-1 Run Pushbutton.................................................................................................... 3-1 Menu Pushbutton ................................................................................................. 3-2 Enter Pushbutton.................................................................................................. 3-2 Help Pushbutton................................................................................................... 3-2 ↑ ↓ ← → Pushbuttons ......................................................................................... 3-2 Software Overview .......................................................................................................... 3-2 Power-Up Screen ................................................................................................. 3-4 Self-Test Screen ................................................................................................... 3-4 Run Screen ........................................................................................................... 3-5 Main Menu........................................................................................................... 3-5 Range Menu ..................................................................................................................... 3-6 Single Range Mode.............................................................................................. 3-7 Dual Range Mode ................................................................................................ 3-7 Autorange Mode .................................................................................................. 3-8 Gas Units............................................................................................................ 3-10 Range ................................................................................................................. 3-11 Custom Ranges Menu ........................................................................................ 3-13 Custom Range Screen ............................................................................ 3-14 Averaging Time ............................................................................................................. 3-15 Calibration Factors Menu .............................................................................................. 3-16 SO2 Background Correction............................................................................... 3-17 Span Gas ............................................................................................................ 3-19 SO2 Span Coefficient ......................................................................................... 3-20

iv
Calibration Menu ........................................................................................................... 3-21 Calibrate Zero .................................................................................................... 3-22 Calibrate SO2 ..................................................................................................... 3-23 Instrument Controls Menu ............................................................................................. 3-24 Temperature Correction ..................................................................................... 3-25 Pressure Correction............................................................................................ 3-26 Flash Lamp......................................................................................................... 3-27 Baud Rate........................................................................................................... 3-28 Instrument ID ..................................................................................................... 3-29 Screen Brightness............................................................................................... 3-30 Service Mode ..................................................................................................... 3-31 Time .................................................................................................................. 3-32 Date .................................................................................................................... 3-33 Diagnostics Menu .......................................................................................................... 3-34 Program Number................................................................................................ 3-35 Voltages ............................................................................................................. 3-36 Temperatures...................................................................................................... 3-37 Pressure .............................................................................................................. 3-38 Flow ................................................................................................................... 3-39 Lamp Intensity ................................................................................................... 3-40 Optical Span Test ............................................................................................... 3-41 Test Analog Outputs .......................................................................................... 3-42 Zero ........................................................................................................ 3-43 Fullscale ................................................................................................. 3-44 Ramp...................................................................................................... 3-45 Option Switches ................................................................................................. 3-46 Alarms............................................................................................................................ 3-47 Internal Temperature.......................................................................................... 3-48 Min and Max Internal Temperature Limits............................................ 3-49 Chamber Temperature........................................................................................ 3-50 Min and Max Chamber Temperature Limits ......................................... 3-51 Pressure .............................................................................................................. 3-52 Min and Max Pressure Limits................................................................ 3-53 Flow ................................................................................................................... 3-54 Min and Max Flow Limits ..................................................................... 3-55 Intensity.............................................................................................................. 3-56 Min and Max Lamp Intensity Limits ..................................................... 3-57 Lamp Voltage..................................................................................................... 3-58 Min and Max lamp Voltage Limits........................................................ 3-59 SO2 Concentration ............................................................................................. 3-60 Min and Max SO2 Concentration Limits ............................................... 3-61 Service Mode Menu....................................................................................................... 3-62 Lamp Supply...................................................................................................... 3-63 PMT Supply....................................................................................................... 3-64 Adjust LED ........................................................................................................ 3-65 Pressure .............................................................................................................. 3-66

v
Flow ................................................................................................................... 3-67 A/D Frequency................................................................................................... 3-68 Set Test Display ................................................................................................. 3-70 Internal Option Switches................................................................................................ 3-71 Remote ............................................................................................................... 3-72 RS-232 ............................................................................................................... 3-72 Zero/Span and Sample Solenoid Valves............................................................ 3-72 Double Range and Autorange ............................................................................ 3-72 Lock ................................................................................................................... 3-73 Permeation Span Source .................................................................................... 3-73 Spare ................................................................................................................ 3-73 CHAPTER 4 CALIBRATION ............................................................................4-1 Zero Gas Generation ........................................................................................................ 4-1 Commercial Heatless Air Dryers ......................................................................... 4-1 Absorbing Column............................................................................................... 4-2 Calibration Gas Generation.............................................................................................. 4-2 Cylinder Gas Dilution System ............................................................................. 4-2 Commercial Precision Dilution Systems ................................................. 4-3 Permeation Tube System ..................................................................................... 4-4 Commercial Permeation Systems ............................................................ 4-5 Multi-Point Calibration.................................................................................................... 4-5 Multi-Point Calibration in Dual/Autorange Mode........................................................... 4-7 Zero/Span Check.............................................................................................................. 4-9 CHAPTER 5 PREVENTIVE MAINTENANCE...................................................5-1 Spare Parts ....................................................................................................................... 5-1 Visual Inspection and Cleaning ....................................................................................... 5-1 Fan Filter Inspection and Cleaning .................................................................................. 5-2 Capillary Inspection and Replacement............................................................................. 5-2 Sample Particulate Filter Inspection ................................................................................ 5-2 Flow Check ...................................................................................................................... 5-3 Lamp Voltage Check ....................................................................................................... 5-3 CHAPTER 6 TROUBLESHOOTING ................................................................6-1 Troubleshooting Guide .................................................................................................... 6-1

vi
CHAPTER 7 SERVICING.................................................................................7-1 Safety Precautions............................................................................................................ 7-1 Replacement Parts List..................................................................................................... 7-2 Pump Rebuilding ............................................................................................................ 7-4 Pump Replacement .......................................................................................................... 7-4 PMT Replacement ........................................................................................................... 7-5 Flash Lamp Replacement................................................................................................. 7-6 Lamp Voltage Adjustment ............................................................................................... 7-7 Flash Intensity Board Replacement.................................................................................. 7-7 Temperature Control Board Replacement ....................................................................... 7-9 DC Power Supply Board Replacement ............................................................................ 7-9 Flasher Supply Board Replacement ............................................................................... 7-10 PMT High Voltage Power Supply Replacement ........................................................... 7-10 Input Board Replacement............................................................................................... 7-10 Analog Output Adjustment ............................................................................................ 7-11 Pressure Transducer Adjustment ................................................................................... 7-12 Temperature Sensor Adjustment.................................................................................... 7-13 Fuse Replacement .......................................................................................................... 7-14 Service Locations........................................................................................................... 7-15 CHAPTER 8 THEORY OF OPERATION..........................................................8-1 Electronics........................................................................................................................ 8-1 DC Power Supply................................................................................................. 8-1 Flasher Supply Board........................................................................................... 8-1 Flash Intensity Board ........................................................................................... 8-2 Input Board .......................................................................................................... 8-2 Temperature Control Board ................................................................................. 8-2 The Microprocessor System................................................................................. 8-3 Display Module........................................................................................ 8-3 Processor Board. ...................................................................................... 8-3 Digital/Analog Board............................................................................... 8-3 Analog to Digital Board. .......................................................................... 8-4 C-Link Board ........................................................................................... 8-4 Subassemblies .................................................................................................................. 8-4 Hydrocarbon Kicker............................................................................................. 8-4 Optics ................................................................................................................... 8-4 Flow Components ................................................................................................ 8-5 CHAPTER 9 OPTIONAL EQUIPMENT............................................................9-1 Rack Mounts with Slides ................................................................................................. 9-1 Internal Zero/Span and Sample Valves............................................................................ 9-3

vii
Zero/Span Check.................................................................................................. 9-3 Remote Activation of Zero/Span and Sample Valves ..................................................... 9-6 Input Pins ............................................................................................................. 9-7 Instrument Status Outputs.................................................................................... 9-7 4-20 mA Isolated Current Output .................................................................................... 9-9 Internal Permeation Span Source..................................................................................... 9-9 Teflon Particulate Filter ................................................................................................... 9-9 Instrument Handle.......................................................................................................... 9-10 APPENDIX A WARRANTY.............................................................................. A-1 APPENDIX B RS-232/485 COMMANDS......................................................... B-1 APPENDIX C INTERNAL PERMEATION SPAN SOURCE ............................ C-1 Specifications...................................................................................................................C-2 Permeation Tube Installation ...........................................................................................C-3 Computation of Concentrations .......................................................................................C-3 Oven Temperature Correction Calibration (D/A 4) .........................................................C-4 Permeation Tube Oven Calibration .................................................................................C-4 Setting Measure Temperature with Water Bath...................................................C-5 Setting Measure Temperature with an Accurately Known Oven ........................C-6 Determination Of Permeation Rate By Weight Loss .......................................................C-8 Determination of Release Rate by Use of Transfer Standard ..........................................C-8 APPENDIX D STANDARDS FOR TRACE LEVEL ANALYZERS.................. D-1 APPENDIX E SCHEMATICS........................................................................... E-1 Motherboard.....................................................................................................................E-2 Pushbutton Board 1..........................................................................................................E-3 Pushbutton Board 2..........................................................................................................E-3 Processor Board ...............................................................................................................E-4 Analog/Digital Board.......................................................................................................E-5 Digital/Analog Board.......................................................................................................E-6 Power Supply Board ........................................................................................................E-7 Trigger Pak.......................................................................................................................E-8 Flash Intensity ..................................................................................................................E-9 Flasher Supply Board.....................................................................................................E-10 Input Board ....................................................................................................................E-11 Temperature Control Board ...........................................................................................E-12

viii
C-Link Board (optional).................................................................................................E-13 4-20 mA Outputs (optional)...........................................................................................E-14 Input/Output Board (optional) .......................................................................................E-15 Permeation Oven Controller Board (optional)...............................................................E-16 Rear Connector Interface Board.....................................................................................E-17 APPENDIX F PUMP MAINTENANCE..............................................................F-1

ix
LIST OF ILLUSTRATIONS FIGURE PAGE 1-1 Model 43C Trace Level Flow Schematic............................................................. 1-2 2-1 Model 43C Trace Level Rear Panel ..................................................................... 2-3 2-2 Atmospheric Dump Bypass Plumbing................................................................. 2-3 2-3 Shielded Cable with Shielding Pulled Back ........................................................ 2-4 2-4 Exploded View of Analog Output Cover Installation.......................................... 2-5 2-5 Properly Installed Shield Cable............................................................................ 2-6 3-1 Model 43C Trace Level Front Panel.................................................................... 3-1 3-2 Flowchart of Menu-Driven Software................................................................... 3-3 3-3 Pin-Out of Rear Panel Terminal Strip in Single Range Mode............................. 3-7 3-4 Pin-Out of Rear Panel Terminal Strip in Dual Range Mode ............................... 3-7 3-5 Pin-Out of Rear Panel Terminal Strip in Autorange Mode ................................. 3-8 3-6 Analog Output in Autorange Mode ..................................................................... 3-9 3-7 Location of Internal Option Switches ................................................................ 3-71 4-1 Cylinder Gas Dilution System ............................................................................. 4-3 4-2 Permeation Tube System ..................................................................................... 4-4 7-1 Properly Grounded Antistatic Wrist Strap ........................................................... 7-1 7-2 Model 43C Trace Level Component Layout........................................................ 7-3 7-3 Pump Assembly ................................................................................................... 7-5 7-4 Optical Bench Assembly...................................................................................... 7-8 9-1 Rack Mount Option Assembly............................................................................. 9-1 9-2 Model 43C Trace Level Dimensional Outline..................................................... 9-2 9-3 Rear Panel I/O Connector .................................................................................... 9-6 9-4 Remote I/O Zero Gas Mode Activation ............................................................... 9-7 9-5 Remote I/O Span Gas Mode Activation .............................................................. 9-7 9-6 Instrument Status Output Relays.......................................................................... 9-8 9-7 Pin-Out of Rear Panel Terminal Strip with Optional Current Output ................. 9-9 9-8 Instrument Handle Assembly............................................................................. 9-10 C-1 Internal Permeation Span Source Flow Schematic ..............................................C-1


xi
LIST OF TABLES TABLE PAGE 3-1 Standard Ranges................................................................................................. 3-12 3-2 A/D Converters .................................................................................................. 3-68 3-3 Option Switch Functions.................................................................................... 3-72 3-4 Operating Mode Truth Table ............................................................................. 3-73 5-1 Recommended Spare Parts .................................................................................. 5-1 7-1 Replacement Parts................................................................................................ 7-2 9-1 Instrument Status Output Truth Table ................................................................. 9-8


1-1
CHAPTER 1 INTRODUCTION
The Model 43C Trace Level pulsed fluorescence SO2 analyzer combines proven detection technology, easy to use menu-driven software, and advanced diagnostics to offer unsurpassed flexibility and reliability. The Model 43C Trace Level has the following features: ! Multi-line alphanumeric display ! Menu-driven software ! Field programmable ranges ! Dual range mode ! Autorange mode ! Multiple analog outputs ! High sensitivity ! Fast response time ! Linearity through all ranges ! Internal sample pump ! Totally self contained ! Insensitive to change in flow and temperature
Thermo Environmental Instruments is pleased to supply this pulsed fluorescence analyzer. We are committed to the manufacture of instruments exhibiting high standards of performance and workmanship. Service personnel are available for assistance with any questions or problems that may arise in the use of this analyzer.
PRINCIPLE OF OPERATION The Model 43C Trace Level is based on the principle that SO2 molecules absorb ultraviolet (UV) light and become excited at one wavelength, then decay to a lower energy state emitting UV light at a different wavelength. Specifically,
22*212 h + SO SO h + SO νν →→

Chapter 1 Introduction
1-2
The sample is drawn into the Model 43C Trace Level through the SAMPLE bulkhead, as shown in Figure 1-1. The sample flows through a hydrocarbon kicker, which removes hydrocarbons from the sample by forcing the hydrocarbon molecules to permeate through the tube wall. The SO2 molecules pass through the hydrocarbon kicker unaffected. The sample flows into the fluorescence chamber, where pulsating UV light excites the SO2 molecules. The condensing lens focuses the pulsating UV light into the mirror assembly. The mirror assembly contains eight selective mirrors that reflect only the wavelengths which excite SO2 molecules. As the excited SO2 molecules decay to lower energy states they emit UV light that is proportional to the SO2 concentration. The bandpass filter allows only the wavelengths emitted by the excited SO2 molecules to reach the photomultiplier tube (PMT). The PMT detects the UV light emission from the decaying SO2 molecules. The photodetector, located at the back of the fluorescence chamber, continuously monitors the pulsating UV light source and is connected to a circuit that compensates for fluctuations in the UV light. The sample then flows through a flow sensor, a capillary, and the shell side of the hydrocarbon kicker. The Model 43C Trace Level outputs the SO2 concentration to the front panel display and the analog outputs.
57P807
Figure 1-1. Model 43C Trace Level Flow Schematic

Chapter 1 Introduction
1-3
SPECIFICATIONS Preset ranges 0-10, 20, 50, 100, 200, 500, and 1000 ppb 0-20, 50, 100, 200, 500, 1000, and 2000 µg/m3 Custom ranges 0-10 to 1000 ppb 0-20 to 2000 µg/m3 Zero noise 0.1 ppb RMS (10 sec avg. time) 0.05 ppb RMS (60 sec avg. time) 0.03 ppb RMS (300 sec avg. time) Lower detectable limit 0.2 ppb (10 sec avg. time) 0.10 ppb (60 sec avg. time) 0.06 ppb (300 sec avg. time) Zero drift less than 0.2 ppb per day Span drift ± 1% per week Response time 80 sec (10 sec avg. time) 110 sec (60 sec avg. time) 320 sec (300 sec avg. time) Linearity ± 1% of fullscale Sample flow rate 0.5 liters/min. (standard) 1 liter/min. (optional) Interferences (EPA levels) less than lower detectable limit except for the following NO < 1 ppb, M-Xylene < 1 ppb, H2O < 3% of reading Operating temperature 20 - 30°C (may be safely operated over the range of 0 - 45°C)* Power requirements 90-110 VAC @ 50/60 Hz 105-125 VAC @ 50/60 Hz 210-250 VAC @ 50/60 Hz 100 Watts Physical dimensions 16.75" (W) X 8.62" (H) X 23" (D) Weight 44 lbs. Outputs selectable voltage 4-20 mA isolated, 4-20 mA non-isolated RS-232/485 Interface * In non-condensing environments Any alteration, modification, or republication of this instruction manual or any alteration or modification to the Thermo Environmental Instrument product without the express written consent of Thermo Environmental Instruments Inc. is expressly prohibited, nullifies our warranty obligations, and bars our liability for any damages deriving therefrom.


2-1
CHAPTER 2 INSTALLATION
The installation of the Model 43C Trace Level includes lifting the instrument, unpacking the instrument, connecting sample, zero, span, and exhaust lines to the instrument, and attaching the analog outputs to a recording device. The installation should always be followed by calibration of the analyzer as described in Chapter 4, Calibration.
LIFTING A procedure appropriate to lifting a heavy object should be used when lifting the analyzer. This procedure consists of bending at the knees while keeping your back straight and upright. The analyzer should be grasped at the bottom, in the front and at the rear of the unit. Do not attempt to lift the analyzer by the cover or other external fittings. While one person may lift the unit, it is desirable to have two persons lifting, one by grasping the bottom in the front and the other by grasping the bottom in the rear.
UNPACKING The Model 43C Trace Level is shipped complete in one container. If, upon receipt of the analyzer, there is obvious damage to the shipping container, notify the carrier immediately and hold for inspection. The carrier, and not Thermo Environmental Instruments Inc., is responsible for any damage incurred during shipment. Follow the procedure below to unpack and inspect the instrument. 1. Remove the instrument from the shipping container and set on a table or bench that
allows easy access to both the front and rear of the instrument. 2. Remove the instrument cover to expose the internal components. 3. Remove any packing material. 4. Check for possible damage during shipment. 5. Check that all connectors and printed circuit boards are firmly attached. 6. Re-install the instrument cover.

Chapter 2 Installation
2-2
SETUP PROCEDURE 1. Connect the sample line to the SAMPLE bulkhead on the rear panel of the instrument.
Ensure that the sample is not contaminated by dirty, wet, or incompatible materials in the sample line. Use FEP Teflon , 316 stainless steel, borosilicate glass, or similar tubing with an OD of 1/4" and a minimum ID of 1/8" for all sample lines and components. The length of the tubing should be less than 10 feet.
If the sample contains particulates larger that 5 microns, it should be filtered before introduction into the instrument. A filter (part no. 6655) which does not interact with SO2 in the sample should be used. If a sample filter is used, all calibrations and span checks must be performed through the filter. The filter element should be replaced regularly to prevent the absorption of SO2 by trapped material on the filter.
2. Connect the EXHAUST bulkhead to a suitable vent. The exhaust line should be 1/4" OD with a minimum ID of 1/8". The length of the exhaust line should be less than 10 feet. Verify that there is no restriction in this line.
3. Connect a suitable recording device to the rear panel terminals. Two 0-10 volt recorder outputs are supplied in the standard instrument. Terminals 1 and 2 are the ground and signal terminals for data output one. Terminals 3 and 4 are the ground and signal terminals for data output two.
4. Plug the instrument into an outlet of the appropriate voltage and frequency.
To install optional equipment see Chapter 9, Optional Equipment.
NOTE: Gas must be delivered to the instrument at atmospheric pressure. It may be necessary to employ an atmospheric bypass plumbing arrangement, as shown in Figure 2-2.
CAUTION: The Model 43C Trace Level is supplied with a three-wire grounding cord. Under no circumstances should this grounding system be defeated.

Chapter 2 Installation
2-3
Figure 2-1. Model 43C Trace Level Rear Panel 57P7122R
Figure 2-2. Atmospheric Dump Bypass Plumbing 57P7100

Chapter 2 Installation
2-4
Analog Output Cover Installation The analog output cover must be mounted over the analog outputs to comply with 89/336/EEC Directive. This procedure describes how to install the user-supplied analog output cable in the instruments analog output cover. The following shielded cables or their equivalent are recommended: Cable Gauge No. of Conductors Alpha #1741C 20 2
Alpha #1746C 18 2
Alpha #5320/2C* 20 2
Alpha #51 52C* 20 2
Alpha #5162C* 18 2
Alpha #1743C 20 4
Alpha 1747/4C 18 4
Alpha #5320/4C 20 4
Alpha #5154C 20 4
Alpha #5164C 18 4
Belden #8208 18 2
* Maximum shielding. Under harsh environments, maximum shielding may be required. The following tools are required:
Small screwdriver Wire stripper Electrical tape or heat shrink tubing
The user-supplied shielded analog output cable must be properly grounded by coming into full contact with the cable clamp (mounted to the analog output cover). To ensure full contact, the shielding must be exposed and folded back over the cable as shown in Figure 2-3.
Figure 2-3. Shielded Cable with Shielding Pulled Back

Chapter 2 Installation
2-5
Follow the procedure below to prepare the shielded cable: 1. Remove about 1.8 cm of insulation from the cable. 2. Fold back the shielding. 3. Use electrical tape or shrink tubing to hold the shielding in place. Be sure at least 1.5
cm of shielding is exposed. 4. Strip each signal wire. Follow the procedure below to connect the shielded cable to the 8-position header: 1. Pass the shielded cable through the cable clamp on the analog output cover, as shown
in Figure 2-4.
Figure 2-4. Exploded View of Analog Output Cover Installation
2. Insert the bare signal wire into the slot of the header. 3. Tighten down the corresponding set screw. 4. Repeat steps 2 and 3 for each signal wire. 5. Plug the header(s) into the analog output connectors. 6. Install the analog output cover using the four #6 screws with star lockwashers. 7. Position the cable shielding so that it. comes in contact with the cable clamp. 8. Tighten down the cable clamp onto the shielding, as shown in Figure 2-5.

Chapter 2 Installation
2-6
Figure 2-5. Properly Installed Shield Cable
1. Install cable clamp into shield cover and secure. Be sure there is good electrical
conductivity between clamp and shield cover. The following is a parts list of components in the analog output cover assembly:
Part No. Description Qty.
7592 Analog output cover 1
11519 8-Position header 2
5889 #6 Star lock washers 4
5820 6-32X3/8 screw 4
14549 Cable clamp 1
STARTUP 1. Turn the power on. 2. Allow 30 minutes for the instrument to stabilize. 3. Set the instrument parameters such as operating ranges and averaging times to the
appropriate settings. For more information about instrument parameters, see Chapter 3, Operation.
4. Before beginning actual monitoring, perform a multipoint calibration as described in Chapter 4, Calibration.

3-1
CHAPTER 3 OPERATION
This chapter describes the front panel display, front panel pushbuttons, and menu-driven software.
DISPLAY The 4 line by 20 character alphanumeric display shows the sample concentrations, instrument parameters, instrument controls, and help messages. Some menus contain more items than can be displayed at one time. For these menus, use the ↑ and ↓ pushbuttons to move the cursor up and down to each choice.
PUSHBUTTONS Run Pushbutton The RUN pushbutton, shown below, is used to display the Run screen. The Run screen normally displays the SO2 concentration. In addition, the RUN pushbutton is used to switch the optional zero/span and sample solenoid valves. For more information about the optional solenoid valves, see Chapter 9, Optional Equipment.
57P7122F Figure 3-1. Model 43C Trace Level Front Panel

Chapter 3 Operation
3-2
Menu Pushbutton The MENU pushbutton is used to display the Main Menu and to display submenus. When in the Run screen, this pushbutton displays the Main Menu. When in any other screen, a submenu is displayed. For more information about the Main Menu, see Main Menu later in this chapter. Enter Pushbutton The ENTER pushbutton is used to choose a menu item, complete an entry, and toggle on/off functions. Help Pushbutton The HELP pushbutton is context-sensitive, that is, it provides additional information about the screen that is being displayed. Press the HELP pushbutton for a concise explanation about the current screen or menu. Help messages are displayed using lower case letters to easily distinguish them from the operating screens. To exit a help screen, press MENU to return to the previous screen or RUN to return to the Run screen. ↑ ↓ ← → Pushbuttons The four arrow pushbuttons (↑ , ↓ , ←, and →) move the cursor up, down, right, and left.
SOFTWARE OVERVIEW The Model 43C Trace Level is based on menu-driven software as illustrated by the flowchart in Figure 3-2. The Power-Up and Self-Test screens, shown at the top of the flowchart, are displayed each time the instrument is turned on. These screens are displayed while the instrument is warming up and performing self-checks. After the warm-up period, the Run screen is automatically displayed. The Run screen is the normal operating screen. It is where the SO2 concentration is displayed. From the Run screen, the Main Menu can be displayed by pressing the MENU pushbutton. The Main Menu contains a list of submenus. Each submenu contains related instrument parameters and/or functions. This chapter describes each submenu and screen in detail. Refer to the appropriate sections for more information.

Chapter 3 O
peration
3-3
Figure 3-2. Flowchart of Menu-Driven Software

Chapter 3 Operation
3-4
Power-Up Screen The Power-Up screen, as shown below, is displayed on power up of the Model 43C Trace Level. Power-Up Screen Self-Test Screen The Self-Test Screen, as shown below, is displayed while the internal components are warming up and a diagnostic check is performed. Self Test Screen

Chapter 3 Operation
3-5
Run Screen The Run screen, shown below, normally displays the SO2 concentration and the time. It also displays the status of the remote interface and zero/span and sample solenoid valves. For more information about optional equipment, see Chapter 9, Optional Equipment. Run Screen Main Menu The Main Menu contains several submenus as shown below. Instrument parameters and features are divided into these submenus according to their function. Use the ↑ and ↓ pushbuttons to move the cursor to each submenu. When the Main Menu is entered directly from the Run screen, the ←←←← pushbutton may be used to jump to the most recently displayed submenu screen. Use the ENTER pushbutton to select a submenu. Main Menu

Chapter 3 Operation
3-6
RANGE MENU The Range menu appears as shown below. In the upper right corner of the display, the word single, dual, or auto is displayed to indicate the active mode. The Range menu in the dual and autorange modes appear the same except for the word dual or auto, displayed in the upper right corner. For more information about the single, dual, or autorange modes, see Single Range Mode, Dual Range Mode, and Autorange Mode below. To display the Range Menu: From the Main Menu choose Range
To use the Range Menu: Press the ↑ and ↓ pushbuttons to move the cursor to each choice Press ENTER to select a choice Press MENU to return to the Main Menu Press RUN to return to the Run screen
Range Menu in Single and Dual/Autorange Mode

Chapter 3 Operation
3-7
Single Range Mode In the single range mode, there is one range, one averaging time, and one span coefficient. The two SO2 analog outputs are arranged on the rear panel terminal strip as shown in Figure 3-3. To use the single range mode, set option switches 4 and 5 off. For more information about setting the internal option switches, see Internal Option Switches, later in this chapter. Figure 3-3. Pin-Out of Rear Panel Terminal Strip in Single Range Mode 57P965-2 Dual Range Mode In the dual range mode, there are two independent SO2 analog outputs as shown below. Figure 3-4. Pin-Out of Rear Panel Terminal Strip in Dual Range Mode 57P965-3

Chapter 3 Operation
3-8
There are two ranges, high SO2 range and low SO2 range, that correspond to the high SO2 and low SO2 analog outputs, respectively. This enables the sample concentration reading to be sent to the analog outputs at two different ranges. For example, the low SO2 analog output can be set to output concentrations from 0 to 50 ppb and the high SO2 analog output set to output concentrations from 0 to 100 ppb. The low SO2 and high SO2 range can be set to the same range in order to provide two identical outputs. In addition, each SO2 analog output has a span coefficient. There are two span coefficients so that each range can be calibrated separately. This is necessary if the two ranges are not close to one another. For example, the low SO2 range is set to 0-10 ppb and the high SO2 range is set to 0-1000 ppb. To use the dual range mode, set option switch 4 on and option switch 5 off. For more information about setting the internal option switches, see Internal Option Switches, later in this chapter. Autorange Mode The autorange mode switches the SO2 analog output between a high SO2 range and a low SO2 range, depending on the concentration level. The high SO2 range and the low SO2 range are defined in the Range menu. When concentrations are below the low SO2 range, the SO2 analog output uses the low SO2 range. When concentrations are above the low SO2 range, the SO2 analog output uses the high SO2 range. Figure 3-5. Pin-Out of Rear Panel Terminal Strip in Autorange Mode 57P965-1 For example, suppose the low SO2 range is set to 50 ppb and the high SO2 range is set to 100 ppb. Sample concentrations below 50 ppb are presented to the SO2 analog output using the low SO2 range, as shown below. Sample concentrations above 50 ppb are presented to the SO2 analog output using the high SO2 range. The SO2 status output indicates which range the SO2 analog output is using. When the low SO2 range is active, the SO2 status output is at 0 volts. When the high SO2 range is active, the SO2 status output is at 50% of fullscale.

Chapter 3 Operation
3-9
When the high SO2 range is active, the concentration must drop to 85% of the low SO2 range for the low SO2 range to become active. In addition, there are two span coefficients so that each range can be calibrated separately. This is necessary if the two ranges are not close to each other another. For example, the low SO2 range is set to 0-10 ppb and the high SO2 range is set to 0-1000 ppb. To use the autorange mode, set option switch 4 and 5 on. For more information about setting the internal option switches, see Internal Option Switches, later in this chapter.
Figure 3-6. Analog Output in Autorange Mode

Chapter 3 Operation
3-10
Gas Units The Gas Units screen, shown below, defines how the SO2 concentration reading is expressed. Gas Units of parts per billion (ppb) or micrograms per cubic meter (µg/m3) are available. The µg/m3 gas concentration modes are calculated using a factory standard pressure of 760 mm Hg and a factory standard temperature of 20°C. When switching from ppb to µg/m3 or vice versa, the SO2 range and custom ranges are set to default to the highest range in that mode. For example, when switching from µg/m3 to ppb, all ranges will be set to 1000 ppb. The current gas units are shown on the first line of the display. The gas units are selected on the second line of the display. To display the Gas Units screen: From the Main Menu choose Range From the Range Menu choose Gas Units
To use the Gas Units screen: Use the ↑ and ↓ pushbuttons to select the gas units Press ENTER to accept the choice Press MENU to return to the Range menu Press RUN to return to the Run screen
Gas Units Screen

Chapter 3 Operation
3-11
Range The Range screen defines the concentration range of the analog outputs. For example, a SO2 range of 0-50 ppb restricts the analog output to concentrations between 0 and 50 ppb. The second line of the display shows the current SO2 range. The third line of the display is used to change the range. The range screen is similar for the single, dual, and autorange modes as shown below. For more information about the single, dual, or autorange modes, see Single Range Mode, Dual Range Mode, and Autorange Mode earlier in this chapter. Table 3-1 lists the available preset ranges. To display the Range screen: From the Main Menu choose Range From the Range menu choose Range
To use the Range screen: Use the ↑ and ↓ pushbuttons to scroll through the preset ranges Press ENTER to accept a range Press MENU to return to the Range menu Press RUN to return to the Run screen
Range Screens in Single and Dual/Autorange Modes

Chapter 3 Operation
3-12
ppb µµµµg/m3
10 20
20 50
50 100
100 200
200 500
500 1,000
1,000 2,000
C1 C1
C2 C2
C3 C3 Table 3-1. Standard Ranges C1, C2, and C3 are custom ranges. For more information about custom ranges, see Custom Ranges Menu below.

Chapter 3 Operation
3-13
Custom Ranges Menu The Custom Ranges Menu, shown below, lists three custom ranges: C1, C2, and C3. Custom ranges are user-defined ranges. In the standard range mode, any value between 10 ppb (20 µg/m3) and 1000 ppb (2000 µg/m3) can be specified as a range. See Custom Range Screen below for more information about defining the custom ranges. To display the Set Custom Ranges menu: From the Main Menu choose Range From the Range menu choose Set Custom Ranges
To use the Set Custom Ranges menu: Use the ↑ and ↓ pushbutton to move the cursor between each custom range Press ENTER to select the custom range to define Press MENU to return to the Range menu Press RUN to return to the Run screen
Set Custom Ranges Menu

Chapter 3 Operation
3-14
Custom Range Screen. The Custom Range screen, shown below, is used to define the custom range. The first line of the display shows the current custom range. The second line of the display is used to set the range. To use the custom fullscale range be sure to select either C1, C2, or C3 in the Range screen. See Range above for more information. To display the Custom Range screen: From the Main Menu choose Range From the Range menu choose Set Custom Ranges From the Set Custom Range menu choose C1, C2, or C3
To use the Custom Range screen: Use the ↑ and ↓ pushbutton to increment and decrement each digit Use the ← and → pushbutton to move the cursor left and right Press ENTER to accept the custom range Press MENU to return to the Set Custom Ranges menu Press RUN to return to the Run screen
Set Custom Range 1 Screen

Chapter 3 Operation
3-15
AVERAGING TIME The averaging time defines a time period (1 to 300 seconds) during which SO2 measurements are taken. The average concentration of the readings are calculated for that time period. The front panel display and analog outputs are updated every 10 seconds for averaging times between 10 and 300 seconds. For averaging times of 1, 2, and 5 seconds, the front panel display and analog outputs are updated every one second. An averaging time of 10 seconds, for example, means that the average concentration of the last 10 seconds will be output at each update. An averaging time of 300 seconds means that the moving average concentration of the last 300 seconds will be output at each update. Therefore, the lower the averaging time the faster the front panel display and analog outputs respond to concentration changes. Longer averaging times are typically used to smooth output data. The Averaging Time screen for the single range and autorange mode is shown below. In the dual range mode, an Averaging Time menu is displayed before the averaging time screen. This menu is needed because the dual range mode has two Averaging Times (high and low). The Averaging Time screens function the same way in the single, dual and autorange modes. The following averaging times are available: 1, 2, 5, 10, 20, 30, 60, 90, 120, 180, 240, and 300 seconds. To display the Averaging Time menu/screen:
From the Main Menu choose Averaging Time
To use the Averaging Time screen:
Use the ↑ and ↓ pushbuttons to select the averaging time Press ENTER to accept the averaging time Press MENU to return to the Main Menu Press RUN to return to the Run screen
Averaging Time Screen

Chapter 3 Operation
3-16
CALIBRATION FACTORS MENU
Calibration factors are determined during automatic and manual calibration and are used to correct the SO2 concentration readings. The Calibration Factors menu displays the calibration factors as shown below. Normally the instrument is calibrated automatically, that is, using the Calibration menu. However, the instrument can be calibrated manually using this menu. To manually calibrate the instrument, see SO2 Background Correction and SO2 Span Coefficient below for more information. To display the Calibration Factors menu: From the Main Menu choose Calibration Factors:
To use the Calibration Factors menu: Use the ↑ and ↓ pushbuttons to move the cursor up and down Press ENTER to go to the Calibration Factor screen Press MENU to return to the Main Menu Press RUN to return to the Run screen
Calibration Factors Menu in Single and Dual/Autorange Modes

Chapter 3 Operation
3-17
SO2 Background Correction The SO2 background correction is determined during zero calibration. The SO2 background is the amount of signal read by the analyzer while sampling zero air. The background signal is a combination of electrical noise and scattered light. Before the analyzer sets the SO2 reading to zero, it stores the value as the SO2 background correction. The SO2 Background screen is used to perform a manual zero calibration of the instrument. As such, the instrument should sample zero air until stable readings are obtained. The first line of the display shows the current SO2 reading. This reading is the SO2 background signal. The second line of the display shows the SO2 background correction that is stored in memory and is being used to correct the SO2 reading. That is, the SO2 background correction is subtracted from the SO2 reading. In the example below, the analyzer is reading 2.7 ppb of SO2 while sampling zero air. The SO2 background correction is 0.0 ppb. That is, the analyzer is not applying a zero background correction. The question mark is used as a prompt to change the background correction. In this case the background correction must be increased to 2.7 ppb in order for the SO2 reading to be at 0 ppb. To set the SO2 reading in the example below to zero, use the ↑ pushbutton to increment the SO2 background correction to 2.7 ppb. As the SO2 background correction reading is increased, the SO2 reading is decreased. At this point however, no real changes have been made. To escape without making any changes, press the MENU pushbutton to return to the Calibration Factors menu or the RUN pushbutton to return to the Run screen. Press the ENTER pushbutton to set the SO2 reading to 0.0 ppb and store the background correction of 2.7 ppb.

Chapter 3 Operation
3-18
To display the SO2 Background screen: From the Main Menu choose Calibration Factors From the Calibration Factors menu choose SO2 Background
To use the SO2 Background screen: Use the ↑ and ↓ pushbuttons to increment/decrement the SO2 background Press ENTER to accept a change in the background Press MENU to return to the Calibration Factors menu Press RUN to return to the Run screen
SO2 Background Screen

Chapter 3 Operation
3-19
Span Gas The Span Gas screen represents the last stored span setting. To display the Span Gas screen: From the Main Menu choose Calibration Factors From the Calibration Factors menu choose Span Gas
To use the Span Gas screen: Use the ↑ and ↓ pushbuttons to increment/decrement the Span Gas Press ENTER to accept a change in the Span Gas Press MENU to return to the Calibration Factors menu Press RUN to return to the Run screen
Span Gas Screen

Chapter 3 Operation
3-20
SO2 Span Coefficient The SO2 span coefficient is calculated during calibration. The span coefficient is used to correct the SO2 readings and normally has a value near 1.000. The SO2 Span Coefficient screen enables the SO2 span coefficient to be manually changed while sampling span gas of known concentration. The first line of the display shows the current SO2 concentration reading. The second line of the display shows the SO2 span coefficient that is stored in memory and is being used to correct the SO2 concentration. Notice that as the span coefficient value is changed using the ↑ and ↓ pushbuttons, that the current SO2 concentration reading on the first line also changes. To display the SO2 Span Coefficient screen: From the Main Menu choose Calibration Factors From the Calibration Factors menu choose SO2 Coef
To use the SO2 Span Coefficient screen: Use the ↑ and ↓ pushbuttons to increment/decrement the span coefficient Press ENTER to accept a change Press MENU to return to the Calibration Factors menu Press RUN to return to the Run screen
SO2 Span Coefficient Screen

Chapter 3 Operation
3-21
CALIBRATION MENU
The Calibration menu is used to calibrate zero and span. The calibration menu is similar for the single, dual, and autorange mode as shown below. The dual and autorange modes have two SO2 span factors ("Hi" and "Lo"). This allows each range to be calibrated separately. This is necessary if the two ranges used are not close to one another. For example a low SO2 range of 10 ppb and a high SO2 range of 1000 ppb. For more information about calibration, see Chapter 4, Calibration. To display the Calibration menu: From the Main Menu choose Calibration
To use the Calibration menu: Use the ↑ and ↓ pushbuttons to move the cursor up and down Press ENTER to accept the choice Press MENU to return to the Main Menu Press the RUN to return to the Run screen
Calibration Menu in Single and Dual/Autorange Modes
Chapter 3 Operation
3-22
Calibrate Zero The Calibrate Zero screen, shown below, is used to perform a zero calibration. The second line of the display shows the current SO2 reading. Before performing a zero calibration, ensure that the analyzer samples zero air for at least 5 minutes. For more information about the SO2 background, see SO2 Background Correction, earlier in this chapter. To display the Calibrate Zero screen: From the Main Menu choose Calibration From the Calibration menu choose Calibrate Zero
To use the Calibrate Zero screen: Press ENTER to set the SO2 reading to zero Press MENU to return to the Calibration menu Press RUN to return to the Run screen
Zero Calibration Screen

Chapter 3 Operation
3-23
Calibrate SO2 The Calibrate Span screen is used to adjust the SO2 span concentration while sampling span gas of known concentration. The first line of the display shows the current SO2 concentration reading. The second line of the display shows the current SO2 range. The third line of the display is where the SO2 calibration gas concentration is entered. The SO2 span coefficient is calculated, stored, and used to correct the current SO2 reading. For more information about calibration, see Chapter 4, Calibration. To display the Calibrate SO2 screen: From the Main Menu choose Calibration From the Calibration menu choose Calibrate SO2
To use the Calibrate SO2 screen: Use the ↑ and ↓ pushbuttons to increment/decrement each digit Use the ← and → pushbuttons to move the cursor left and right Press ENTER to calibrate the SO2 reading to the SO2 calibration gas Press MENU to return to the Calibration menu Press RUN to return to the Run screen
SO2 Calibration Screen

Chapter 3 Operation
3-24
INSTRUMENT CONTROLS MENU
The Instrument Controls menu is shown below. The software controls in this menu control instrument functions. To display the Instrument Controls Menu:
From the Main Menu choose Instrument Controls To use the Instrument Controls Menu:
Use the ↑ and ↓ pushbuttons to scroll through the choices Press ENTER to select a choice
Instrument Controls Menu

Chapter 3 Operation
3-25
Temperature Correction Temperature correction provides compensation for any changes to the instrument's output signal due to variations in internal instrument temperature. The effects of internal instrument temperature changes on the analyzer's subsystems and output have been empirically determined. This empirical data is used to compensate for any changes in temperature. The temperature correction screen is shown below. When temperature correction is on, the first line of the display shows the current internal instrument temperature (measured by a thermistor on the Motherboard). When temperature correction is off, the first line of the display shows the factory standard temperature of 30oC. To display the Temperature Correction screen: From the Main Menu choose Instrument Controls From the Instrument Controls menu choose Temperature Correction
To use the Temperature Correction screen: Press ENTER to toggle temperature correction on and off Press MENU to return to the Instrument Controls menu Press RUN to return to the Run screen
Temperature Correction Screen
Chapter 3 Operation
3-26
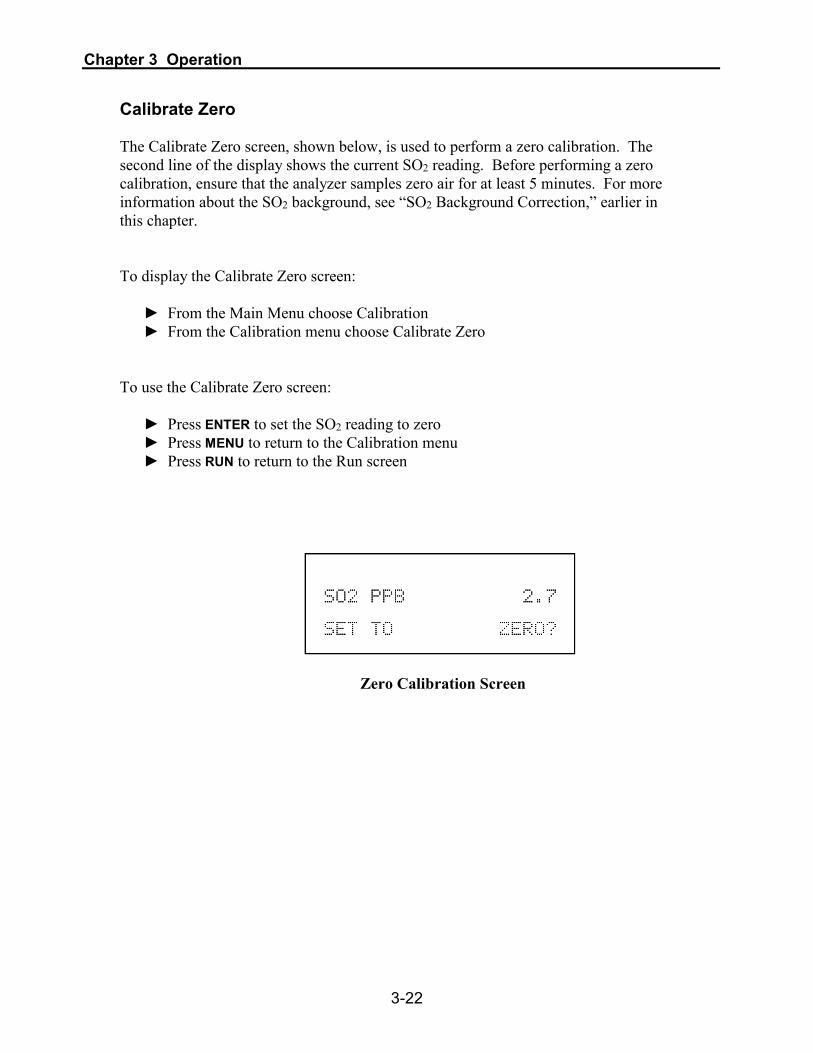
Pressure Correction Pressure correction provides compensation for any changes to the instrument's output signal due to variations of fluorescence chamber pressure. The effects of fluorescence chamber pressure changes on the analyzer's subsystems and output have been empirically determined. This empirical data is used to compensate for any change in fluorescence chamber pressure. The pressure correction screen is shown below. When pressure correction is on, the first line of the display represents the current pressure in the fluorescence chamber. When pressure correction is off, the first line of the display shows the factory standard pressure of 760 mm Hg. To display the Pressure Correction screen: From the Main Menu choose Instrument Controls From the Instrument Controls menu choose Pressure Correction
To use the Pressure Correction screen: Press ENTER to toggle pressure correction on and off Press MENU to return to the Instrument Controls menu Press RUN to return to the Run screen
Pressure Correction Screen

Chapter 3 Operation
3-27
Flash Lamp The Flash Lamp screen, shown below, turns the flash lamp on and off. The flash lamp must be off when using the optical test LED. For more information about the optical test LED, see Optical Test LED, later in this chapter. To display the Flash Lamp screen: From the Main Menu choose Instrument Controls From the Instrument Controls menu choose Flash Lamp
To use the Flash Lamp screen: Use the ENTER pushbutton to toggle the flash lamp on and off Press MENU to return to the Instrument Controls menu Press RUN to return to the Run screen
Flash Lamp Screen

Chapter 3 Operation
3-28
Baud Rate The Baud Rate screen, shown below, is used to set the RS-232 interface baud rate. Baud rates of 1200, 2400, 4800, and 9600 are available. To display the Baud Rate screen: From the Main Menu choose Instrument Controls From the Instrument Controls menu choose Baud Rate
To use the Baud Rate screen: Use the ↑ and ↓ pushbuttons to increment/decrement the baud rate Press ENTER to accept a change Press MENU to return to the Instrument Controls menu Press RUN to return to the Run screen
Baud Rate Screen

Chapter 3 Operation
3-29
Instrument ID The Instrument ID screen, shown below, enables the Instrument ID to be user-defined. This is useful if two or more of the same instrument are connected to one computer. Valid Instrument ID numbers are from 0 to 99. The Model 43C Trace Level has a default Instrument ID of 33. For more information about the Instrument ID, see Appendix B, RS-232/485 Commands. To display the Instrument ID screen: From the Main Menu choose Instrument Controls From the Instrument Controls menu choose Instrument ID
To use the Instrument ID screen: Use the ↑ and ↓ pushbuttons to increment/decrement the ID number Press ENTER to accept a change Press MENU to return to the Instrument Controls menu Press RUN to return to the Run screen
Instrument ID Screen

Chapter 3 Operation
3-30
Screen Brightness The Screen Brightness screen, shown below, is used to change the screen brightness. Intensities of 25%, 50%, 75%, and 100% are available. Changing the screen brightness to a lower intensity will extend the life of the display. To display the Screen Brightness screen: From the Main Menu choose Instrument Controls From the Instrument Controls menu choose Screen Brightness
To use the Screen Brightness screen: Use the ↑ and ↓ pushbuttons to increment/decrement the screen brightness Press ENTER to accept a change Press MENU to return to the Instrument Controls menu Press RUN to return to the Run screen
Screen Brightness Screen

Chapter 3 Operation
3-31
Service Mode The Service Mode screen, shown below, is used to turn the service mode on and off. The service mode includes parameters and functions that are useful when making adjustments or diagnosing the Model 43C Trace Level. Meaningful data should not be collected when the instrument is in the service mode. For more information about the service mode, see Service Mode Menu, later in this chapter. To display the Service Mode screen: From the Main Menu choose Instrument Controls From the Instrument Controls menu choose Service Mode
To use the Service Mode screen: Press ENTER to toggle service mode on and off Press MENU to return to the Instrument Controls menu Press RUN to return to the Run screen
Service Mode Screen

Chapter 3 Operation
3-32
Time The internal clock is set by the Time screen as shown below. The first line of the display shows the current time (military). The second line of the display is used to change the time. The internal clock is powered by its own battery when instrument power is off. To display the Time screen: From the Main Menu choose Instrument Controls From the Instrument Controls menu choose Time
To use the Time screen: Use the ↑ and ↓ pushbuttons to increment/decrement the hours and minutes Use the ← and → pushbuttons to move the cursor left and right Press ENTER to accept a change Press MENU to return to the Instrument Controls menu Press RUN to return to the Run screen
Time Screen
Chapter 3 Operation
3-33
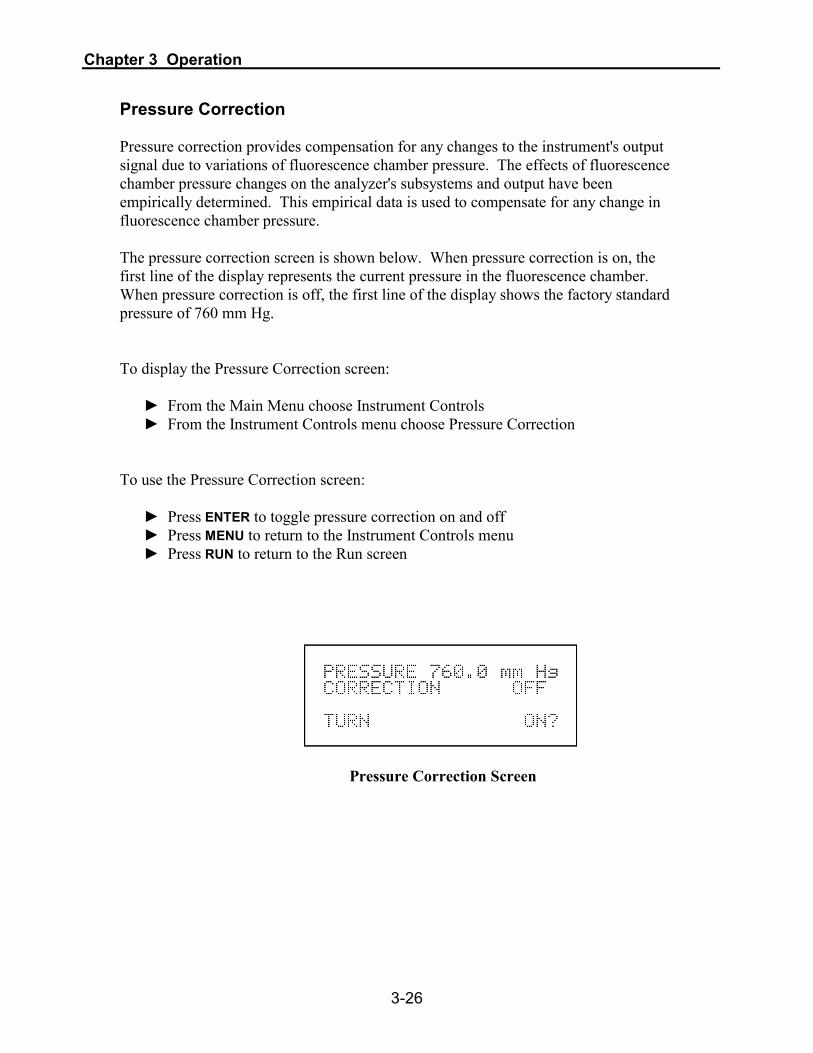
Date The date is set by the Date screen as shown below. The first line of the display shows the current date. The second line of the display is used to change the date. The date is updated by the internal clock. To display the Date screen: From the Main Menu choose Instrument Controls From the Instrument Controls menu choose Date
To use the Date screen:
Use the ↑ and ↓ pushbuttons to increment/decrement the month, day, and year Use the ← and → pushbutton to move the cursor left and right Press ENTER to accept a change Press MENU to return to the Instrument Controls menu Press RUN to return to the Run screen
Date Screen

Chapter 3 Operation
3-34
DIAGNOSTICS MENU The Diagnostics menu, shown below, provides access to diagnostic information and functions. This menu is useful when troubleshooting the instrument. To display the Diagnostics menu:
From the Main Menu choose Diagnostics To use the Diagnostics menu: Use the ↑ and ↓ pushbuttons to move the cursor up and down Press MENU to return to the Main Menu Press RUN to return to the Run screen
Diagnostics Menu

Chapter 3 Operation
3-35
Program Number The Program Number screen, shown below, shows the version numbers of the programs installed. Prior to contacting the factory with any questions regarding the instrument, please note the program numbers. To display the Program Number screen: From the Main Menu choose Diagnostics From the Diagnostics menu choose Program Number
To use the Program Number screen: This is a view only screen Press MENU to return to the Diagnostics menu Press RUN to return to the Run screen
Program Number Screen
Chapter 3 Operation
3-36
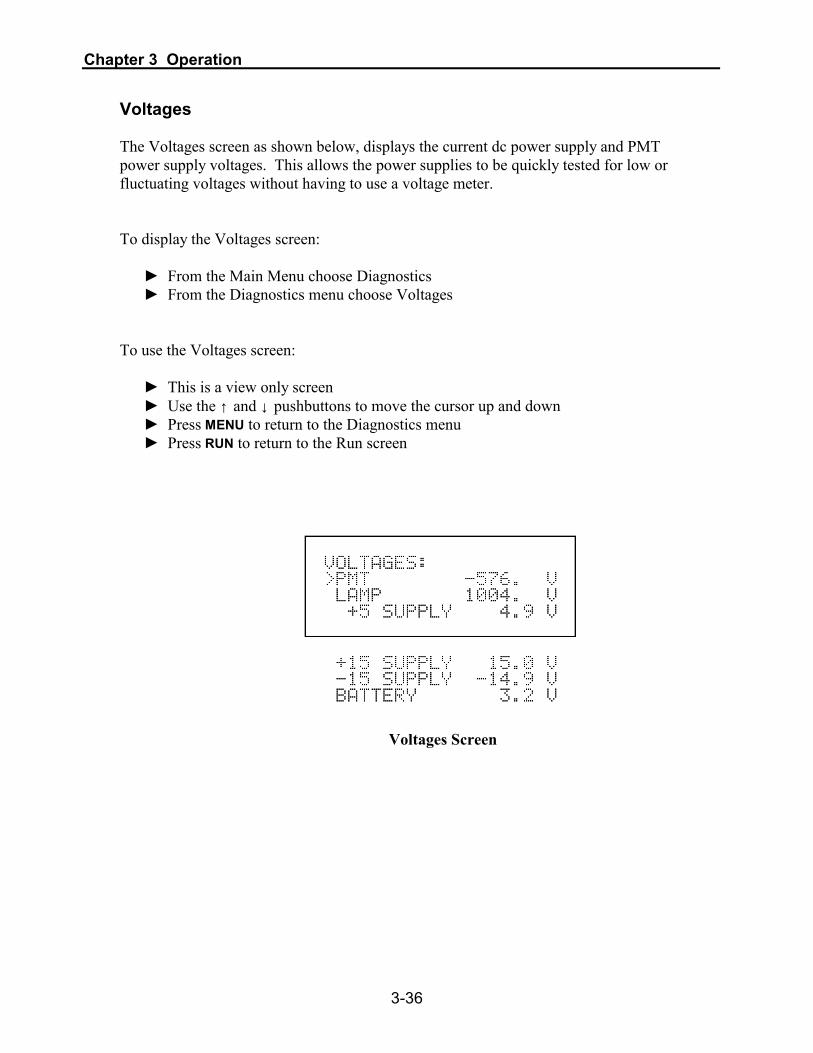
Voltages The Voltages screen as shown below, displays the current dc power supply and PMT power supply voltages. This allows the power supplies to be quickly tested for low or fluctuating voltages without having to use a voltage meter. To display the Voltages screen: From the Main Menu choose Diagnostics From the Diagnostics menu choose Voltages
To use the Voltages screen: This is a view only screen Use the ↑ and ↓ pushbuttons to move the cursor up and down Press MENU to return to the Diagnostics menu Press RUN to return to the Run screen
Voltages Screen

Chapter 3 Operation
3-37
Temperatures The Temperatures screen, as shown below, displays the current internal instrument temperature and chamber temperature. To display the Temperatures screen: From the Main Menu choose Diagnostics From the Diagnostics menu choose Temperatures
To use the Temperatures screen: This is a view only screen Press MENU to return to the Diagnostics menu Press RUN to return to the Run screen
Temperatures Screen

Chapter 3 Operation
3-38
Pressure The Pressure screen, shown below, displays the current chamber pressure. The pressure is measured by a pressure transducer in-line with the fluorescence chamber (see Figure 1-1). To display the Pressure screen: From the Main Menu choose Diagnostics From the Diagnostics menu choose Pressure
To use the Pressure screen: This is a view only screen Press MENU to return to the Diagnostics menu Press RUN to return to the Run screen
Pressure Screen

Chapter 3 Operation
3-39
Flow The Flow screen, shown below, displays the current sample flow rate. The flow is measured by an internal flow sensor (see Figure 1-1). To display the Flow screen: From the Main Menu choose Diagnostics From the Diagnostics menu choose Flow
To use the Flow screen: This is a view only screen Press MENU to return to the Diagnostics menu Press RUN to return to the Run screen
Flow Screen

Chapter 3 Operation
3-40
Lamp Intensity The Lamp Intensity screen, shown below, displays the current lamp intensity in Hertz. To display the Lamp Intensity screen: From the Main Menu choose Diagnostics From the Diagnostics menu Lamp Intensity
To use the Lamp Intensity screen: This is a view only screen Press MENU to return to the Diagnostics menu Press RUN to return to the Run screen
Lamp Intensity Screen

Chapter 3 Operation
3-41
Optical Span Test The Optical Span Test screen, shown below, turns the optical test LED on and off. Within the fluorescence chamber is a light emitting diode (LED) which may be used to simulate a particular concentration of SO2. It is designed to provide a quick and easy way of checking the optics and electronics for span drift or other problems. Potentiometer R7 (LED ADJ) on the Motherboard, adjusts the intensity of the LED. The flash lamp should be turned off when using this feature. See Flash Lamp earlier in this chapter for more information. To display the Optical Span Test screen: From the Main Menu choose Diagnostics From the Diagnostics menu choose Optical Span Test
To use the Optical Span Test screen: Press ENTER to toggle the test on and off Press MENU to return to the Diagnostics menu Press RUN to return to the Run screen
Optical Test LED Screen

Chapter 3 Operation
3-42
Test Analog Outputs The Test Analog Outputs menu contains three choices as shown below. These functions enable the analog outputs to be set to zero and fullscale in order to adjust the analog outputs to agree with the front panel display. In addition, a digital to analog (DAC) ramp can be generated to fully test the analog outputs. To display the Test Analog Outputs menu: From the Main Menu choose Diagnostics From the Diagnostics menu choose Test Analog Outputs
To use the Test Analog Outputs menu: Use the ↑ and ↓ pushbuttons to move the cursor up and down Press ENTER to select a choice Press MENU to return to the Instrument Controls menu Press RUN to return to the Run screen
Test Analog Outputs Menu

Chapter 3 Operation
3-43
Zero. The Zero screen, as shown below, sets the analog outputs to zero volts. Use the ↑ and ↓ pushbuttons to increment/decrement the output level. For example, to set the analog outputs to 5% of fullscale, use the ↑ pushbutton to increment the 0.0 to 5.0%. To display the Zero screen: From the Main Menu choose Diagnostics From the Diagnostics menu choose Test Analog Outputs From the Test Analog Outputs menu choose Zero
To use the Zero screen: Use the ↑ and ↓ pushbuttons to increment/decrement the output level Press MENU to return to the Diagnostics menu and cancel the zero output Press RUN to return to the Run screen and cancel the zero output
Zero Analog Outputs Screen

Chapter 3 Operation
3-44
Fullscale. The Fullscale screen, as shown below, sets the analog outputs to fullscale. Use the ↑ and ↓ pushbuttons to increment/decrement the output level. For example, to set the analog outputs to 95% of fullscale, use the ↓ pushbutton to decrement the 100.0 to 95.0%. To display the Fullscale screen: From the Main Menu choose Diagnostics From the Diagnostics menu choose Test Analog Outputs From the Test Analog Outputs menu choose Fullscale To use the Fullscale screen: Use the ↑ and ↓ pushbuttons to increment/decrement the output level Press MENU to return to the Diagnostics menu and cancel the fullscale output Press RUN to return to the Run screen and cancel the fullscale output
Fullscale Analog Outputs Screen

Chapter 3 Operation
3-45
Ramp. The digital to analog (DAC) ramp is used to fully test the analog outputs. The analog outputs start at -2.3% and then increments by 0.1% every second until it reaches 100.0% (1000). A linear output indicates a that the analog outputs are operating correctly. To display the Ramp screen: From the Main Menu choose Diagnostics From the Diagnostics menu choose Test Analog Outputs From the Test Analog Outputs menu choose Ramp
To use the Ramp screen: This is a view only screen Press MENU to return to the Diagnostics menu and cancel the ramp output Press RUN to return to the Run screen and cancel the ramp output
Ramp Analog Outputs Screen

Chapter 3 Operation
3-46
Option Switches The Option Switches screen, shown below, enables the settings of the internal option switches to be viewed. Option switch settings cannot be changed through the software. For more information about the internal option switches, see Internal Option Switches later in this chapter. To display the Option Switches screen: From the Main Menu choose Diagnostics From the Diagnostics menu choose Option Switches
To use the Option Switches screen: This is a view only screen Use the ↑ and ↓ pushbuttons to move up and down Press MENU to return to the Diagnostics menu Press RUN to return to the Run screen
Option Switch Status Screen

Chapter 3 Operation
3-47
ALARMS The Alarms menu, shown below, displays a list of items that are monitored by the analyzer. If the item being monitored goes outside the lower or upper limit, the status of that item will go from OK to either LOW or HIGH, respectively. The number in the upper right corner of the display indicates how many alarms have occurred. If no alarms are detected, the number zero is displayed. To see the actual reading of an item and its minimum and maximum limits, move the cursor to the item and press ENTER. To display the Alarms menu: From the Main Menu choose Alarm
To use the Alarms menu: Use the ↑ and ↓ pushbuttons to move up and down Press ENTER to see the actual reading and the min and max limits Press MENU to return to the Main Menu Press RUN to return to the Run screen
Alarm Menu

Chapter 3 Operation
3-48
Internal Temperature The Internal Temperature screen, shown below, displays the current internal temperature and the factory-set min and max alarm limits. The min and max alarm limits can be changed when the instrument is in the service mode. Acceptable alarm limits range from 8 to 47oC. If the internal temperature reading goes beyond either the min or max alarm limit, an alarm is activated. The word Alarm appears in the Run screen and in the Main Menu. To display the Internal Temperature screen: From the Main Menu choose Alarm From the Alarm menu choose Internal Temperature
To use the Internal Temperature screen: Use the ↑ and ↓ pushbuttons to move up and down (service mode on) Press ENTER to select a choice (service mode on) Press MENU to return to the Alarm menu Press RUN to return to the Run screen
Internal Temperature Screen

Chapter 3 Operation
3-49
Min and Max Internal Temperature Limits. The Min Internal Temperature alarm limit screen, shown below, is accessible only when the instrument is in the service mode. It is used to change the min internal temperature alarm limit. The Min and Max Internal Temperature screens function the same way. To display the Min or Max Internal Temperature limit screens (service mode on): From the Main Menu choose Alarm From the Alarm menu choose Internal Temperature From the Internal Temperature menu choose Min or Max
To use the Min or Max Internal Temperature limit screens (service mode on): Use the ↑ and ↓ pushbuttons to increment/decrement the value Press ENTER to accept the change Press MENU to return to the Internal Temperature menu Press RUN to return to the Run screen
Set Min Internal Temperature Screen

Chapter 3 Operation
3-50
Chamber Temperature The Chamber Temperature screen, shown below, displays the current chamber temperature and the factory-set min and max alarm limits. The min and max alarm limits can be changed when the instrument is in the service mode. Acceptable alarm limits range from 43 to 47oC. If the chamber reading goes beyond either the min or max limit, an alarm is activated. The word Alarm appears in the Run screen and in the Main Menu. To display the Chamber Temperature screen: From the Main Menu choose Alarm From the Alarm menu choose Chamber Temperature
To use the Chamber Temperature screen: Use the ↑ and ↓ pushbuttons to move up and down (service mode on) Press ENTER to select a choice (service mode on) Press MENU to return to the Alarm menu Press RUN to return to the Run screen
Chamber Temperature Screen

Chapter 3 Operation
3-51
Min and Max Chamber Temperature Limits. The Min Chamber Temperature alarm limit screen, shown below, is accessible only when the instrument is in the service mode. It is used to change the min chamber temperature alarm limit. The Min and Max Chamber Temperature screens function the same way. To display the Min or Max Chamber Temperature limit screens (service mode on): From the Main Menu choose Alarm From the Alarm menu choose Chamber Temperature From the Chamber Temperature menu choose Min or Max
To use the Min or Max Chamber Temperature limit screens (service mode on): Use the ↑ and ↓ pushbuttons to increment/decrement the value Press ENTER to accept the change Press MENU to return to the Chamber Temperature menu Press RUN to return to the Run screen
Set Min Chamber Temperature Screen

Chapter 3 Operation
3-52
Pressure The Pressure screen, shown below, displays the current fluorescence chamber pressure reading and the factory-set min max alarm limits. The min and max alarm limits can be changed when the instrument is in the service mode. Acceptable alarm limits range from 400 to 1000 mm Hg. If the pressure reading goes beyond either the min or max alarm limit, an alarm is activated. The word Alarm appears in the Run screen and in the Main Menu. To display the Pressure screen: From the Main Menu choose Alarm From the Alarm menu choose Pressure
To use the Pressure screen: Use the ↑ and ↓ pushbuttons to move up and down (service mode on) Press ENTER to select a choice (service mode on) Press MENU to return to the Alarm menu Press RUN to return to the Run screen
Pressure Screen

Chapter 3 Operation
3-53
Min and Max Pressure Limits. The Min Pressure limit screen, shown below, is accessible only when the instrument is in the service mode. It is used to change the min pressure alarm limit. The Min and Max Pressure screens function the same way. To display the Min or Max Pressure limit screens (service mode on): From the Main Menu choose Alarm From the Alarm menu choose Pressure From the Pressure menu choose Min or Max
To use the Min or Max Pressure limit screens (service mode on): Use the ↑ and ↓ pushbuttons to increment/decrement the value Press ENTER to accept the change Press MENU to return to the Pressure menu Press RUN to return to the Run screen
Set Min Pressure Screen

Chapter 3 Operation
3-54
Flow The Flow screen, shown below, displays the current sample flow reading and the factory-set min and max alarm limits. The min and max alarm limits can be changed when the instrument is in the service mode. Acceptable alarm limits range from 0 to 1.5 LPM. If the sample flow reading goes beyond either the min or max alarm limit, an alarm is activated. The word Alarm appears in the Run screen and in the Main Menu. To display the Sample Flow screen: From the Main Menu choose Alarm From the Alarm menu choose Sample Flow
To use the Sample Flow screen: Use the ↑ and ↓ pushbuttons to move the cursor up and down (service mode) Press ENTER to select a choice (service mode) Press MENU to return to the Alarm menu Press RUN to return to the Run screen
Sample Flow Screen
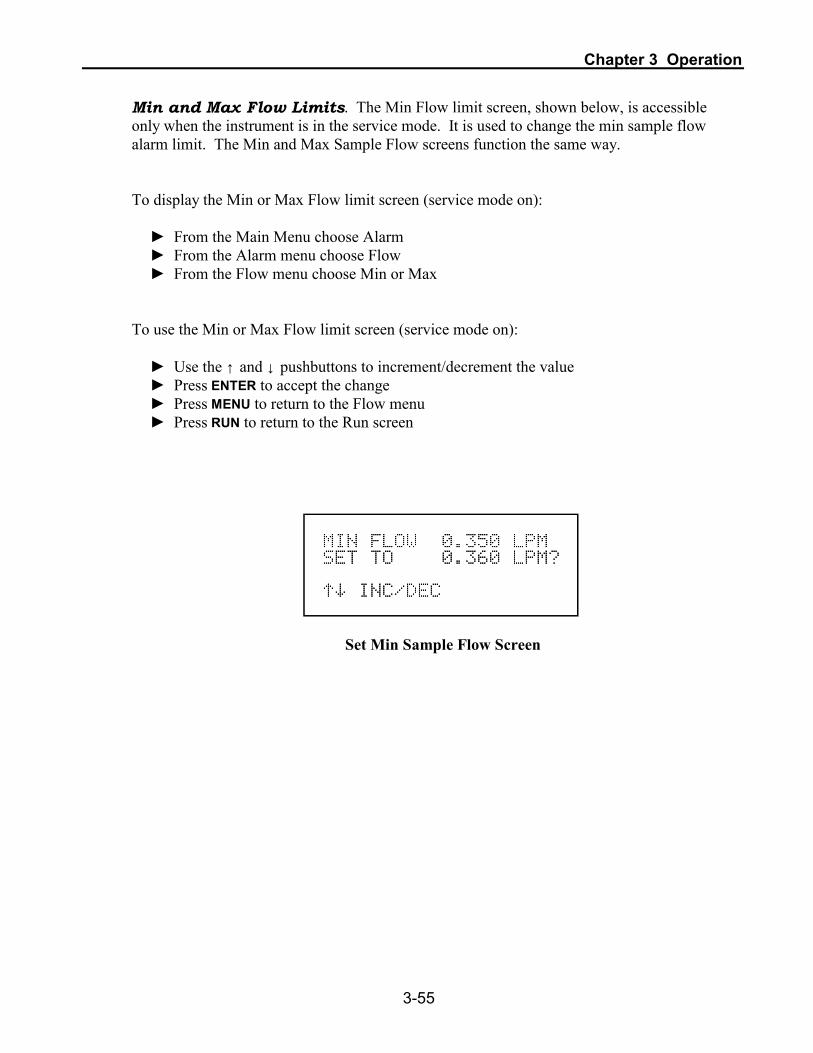
Chapter 3 Operation
3-55
Min and Max Flow Limits. The Min Flow limit screen, shown below, is accessible only when the instrument is in the service mode. It is used to change the min sample flow alarm limit. The Min and Max Sample Flow screens function the same way. To display the Min or Max Flow limit screen (service mode on): From the Main Menu choose Alarm From the Alarm menu choose Flow From the Flow menu choose Min or Max
To use the Min or Max Flow limit screen (service mode on): Use the ↑ and ↓ pushbuttons to increment/decrement the value Press ENTER to accept the change Press MENU to return to the Flow menu Press RUN to return to the Run screen
Set Min Sample Flow Screen

Chapter 3 Operation
3-56
Intensity The Intensity screen, shown below, displays the current lamp intensity reading and the factory-set min and max alarm limits. The min and max alarm limits can be changed when the instrument is in the service mode. Acceptable alarm limits range from 10,000 to 50,000 Hz. If the lamp intensity reading goes beyond either the min or max alarm limit, an alarm is activated. The word Alarm appears in the Run screen and in the Main Menu. To display the Intensity screen: From the Main Menu choose Alarm From the Alarm menu choose Intensity
To use the Intensity screen: Use the ↑ and ↓ pushbuttons to move up and down (service mode on) Press the ENTER pushbutton to select a choice (service mode on) Press MENU to return to the Alarm menu Press RUN to return to the Run screen
Lamp Intensity Screen

Chapter 3 Operation
3-57
Min and Max Lamp Intensity Limits. The Min Intensity limit screen, shown below, is accessible only when the instrument is in the service mode. It is used to change the min intensity alarm limit. The Min and Max Intensity screens function the same way. To display the Min or Max Lamp Intensity limit screens (service mode on): From the Main Menu choose Alarm From the Alarm menu choose Intensity From the Intensity menu choose Min or Max
To use the Min or Max Lamp Intensity limit screens (service mode on): Use the ↑ and ↓ pushbuttons to increment/decrement the value Press ENTER to accept the change Press MENU to return to the Lamp Intensity menu Press RUN to return to the Run screen
Set Min Lamp Intensity Screen

Chapter 3 Operation
3-58
Lamp Voltage The Lamp Voltage screen, shown below, displays the current lamp voltage and the factory-set min and max alarm limits. The min and max alarm limits can be changed when the instrument is in the service mode. Acceptable alarm limits range from 500 to 1200 volts. If the lamp voltage goes beyond either the min or max alarm limit, an alarm is activated. The word Alarm appears in the Run screen and in the Main Menu. To display the Lamp Voltage screen: From the Main Menu choose Alarm From the Alarm menu choose Lamp Voltage
To use the Lamp Voltage screen: Use the ↑ and ↓ pushbuttons to move up and down (service mode on) Press the ENTER pushbutton to select a choice (service mode on) Press MENU to return to the Alarm menu Press RUN to return to the Run screen
Lamp Voltage Screen

Chapter 3 Operation
3-59
Min and Max lamp Voltage Limits. The Min Lamp Voltage limit screen, shown below, is accessible only when the instrument is in the service mode. It is used to change the min lamp voltage alarm limit. The Min and Max Lamp Voltage screens function the same way. To display the Min or Max Voltage limit screens (service mode on): From the Main Menu choose Alarm From the Alarm menu choose Lamp Voltage From the Lamp Voltage menu choose Min or Max
To use the Min or Max Lamp Voltage screens (service mode on): Use the ↑ and ↓ pushbuttons to increment/decrement the value Press ENTER to accept the change Press MENU to return to the Lamp Voltage menu Press RUN to return to the Run screen
Set Min Lamp Voltage Screen

Chapter 3 Operation
3-60
SO2 Concentration The SO2 Concentration screen, shown below, displays the current SO2 concentration and the factory-set min and max alarm limits. The min and max alarm limits can be changed when the instrument is in the service mode. When using standard ranges, the acceptable alarm limits range from 0 to 1000 ppb. If the SO2 concentration reading goes beyond either the min or max alarm limit, an alarm is activated. The word Alarm appears in the Run screen and in the Main Menu. To display the SO2 Concentration screen: From the Main Menu choose Alarm From the Alarm menu choose SO2 Concentration
To use the SO2 Concentration screen: Use the ↑ and ↓ pushbuttons to move up and down (service mode on) Press the ENTER pushbutton to select a choice (service mode on) Press MENU to return to the Alarm menu Press RUN to return to the Run screen
SO2 Concentration Screen

Chapter 3 Operation
3-61
Min and Max SO2 Concentration Limits. The SO2 min and max concentration limit screens are accessible only when the instrument is in the service mode. They are used to change the min and max concentration alarm limits. The Min SO2 concentration screen is shown below. To display the Min or Max SO2 Concentration limit screens (service mode on): From the Main Menu choose Alarm From the Alarm menu choose SO2 Concentration From the SO2 Concentration menu choose Min or Max
To use the Min or Max SO2 Concentration limit screens (service mode on): Use the ↑ and ↓ pushbuttons to increment/decrement the value Press ENTER to accept the change Press MENU to return to the SO2 Concentration menu Press RUN to return to the Run screen
Set Min SO2 Concentration Screen

Chapter 3 Operation
3-62
SERVICE MODE MENU The Service Mode menu, shown below, appears only when the instrument is in the service mode. To put the instrument into the service mode, select Instrument Controls from the Main Menu, then from the Instrument Controls menu select Service Mode. When the instrument is in the service mode, the Main Menu extends to include the Service Mode menu. The service mode includes some of the same information found in the Diagnostic menu. However, items such as PMT supply, optical test LED adjust, pressure, and flow readings are updated every 10 seconds in the Diagnostic menu, where in the service mode these readings are updated every second. The rapid update time enables the readings on the display to respond faster to adjustment. In addition, advanced diagnostic functions are included in the service mode. Meaningful data should not be collected when the instrument is in the service mode. To display the Service Mode menu: From the Main Menu choose Service Mode
To use the Service Mode menu: Use the ↑ and ↓ pushbuttons to move the cursor up and down Press ENTER to select a choice Press MENU to return to the Main Menu Press RUN to return to the Run screen
Service Mode Menu

Chapter 3 Operation
3-63
Lamp Supply The Lamp Supply screen, shown below, shows the lamp intensity and voltage. Both readings are updated every second. To display the Lamp Supply screen: From the Main Menu choose Service Mode From the Service Mode menu choose Lamp Supply
To use the Lamp Supply screen: This is a view only screen Press MENU to return to the Service Mode menu Press RUN to return to the Run screen
Lamp Supply Screen

Chapter 3 Operation
3-64
PMT Supply The PMT Supply screen, shown below, shows the PMT supply voltage. The PMT supply voltage reading is updated every second. This screen is used while adjusting the PMT voltage.
CAUTION: Some internal components can be damaged by small amounts of static electricity. A properly grounded antistatic wrist strap must be worn while handling any internal component. For more information about appropriate safety precautions, see Chapter 7, Servicing.
To display the PMT Supply screen: From the Main Menu choose Service Mode From the Service Mode menu choose PMT Supply
To use the PMT Supply screen: This is a view only screen Press MENU to return to the Service Mode menu Press RUN to return to the Run screen
PMT Supply Screen
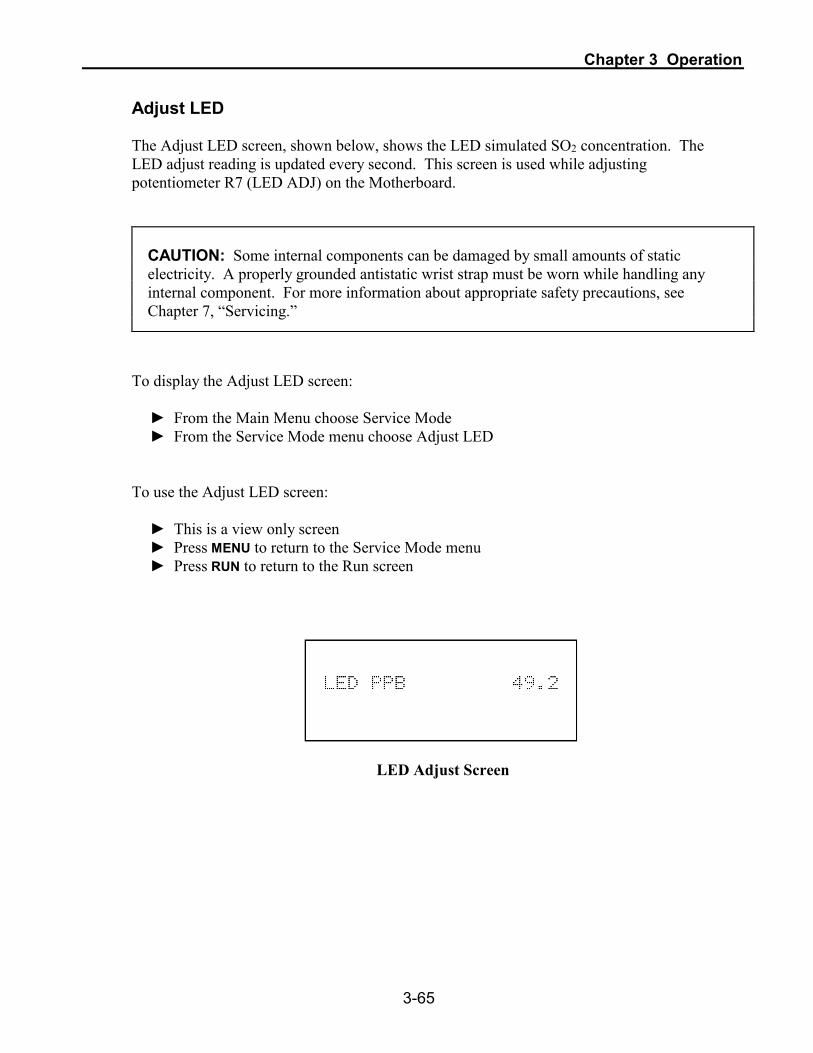
Chapter 3 Operation
3-65
Adjust LED The Adjust LED screen, shown below, shows the LED simulated SO2 concentration. The LED adjust reading is updated every second. This screen is used while adjusting potentiometer R7 (LED ADJ) on the Motherboard.
To display the Adjust LED screen: From the Main Menu choose Service Mode From the Service Mode menu choose Adjust LED
To use the Adjust LED screen: This is a view only screen Press MENU to return to the Service Mode menu Press RUN to return to the Run screen
LED Adjust Screen
CAUTION: Some internal components can be damaged by small amounts of static electricity. A properly grounded antistatic wrist strap must be worn while handling any internal component. For more information about appropriate safety precautions, see Chapter 7, Servicing.

Chapter 3 Operation
3-66
Pressure The Pressure screen, shown below, shows the fluorescence chamber pressure. The fluorescence chamber pressure is updated every second. This screen is used while adjusting the pressure transducer potentiometers.
CAUTION: Some internal components can be damaged by small amounts of static electricity. A properly grounded antistatic wrist strap must be worn while handling any internal component. For more information about appropriate safety precautions, see Chapter 7, Servicing.
To display the Pressure screen: From the Main Menu choose Service Mode From the Service Mode menu choose Pressure
To use the Pressure screen: This is a view only screen Press MENU to return to the Service Mode menu Press RUN to return to the Run screen
Pressure Screen

Chapter 3 Operation
3-67
Flow The Flow screen, shown below, shows the sample flow. The sample flow reading is updated every second. This screen is used while the sample flow sensor potentiometers are adjusted. The potentiometer closest to the divider panel is the zero adjust potentiometer and the potentiometer farthest from the divider panel is the span potentiometer.
To display the Sample Flow screen: From the Main Menu choose Service Mode From the Service Mode menu choose Sample Flow
To use the Sample Flow screen: This is a view only screen Press MENU to return to the Service Mode menu Press RUN to return to the Run screen
Sample Flow Screen
CAUTION: Some internal components can be damaged by small amounts of static electricity. A properly grounded antistatic wrist strap must be worn while handling any internal component. For more information about appropriate safety precautions, see Chapter 7, Servicing.
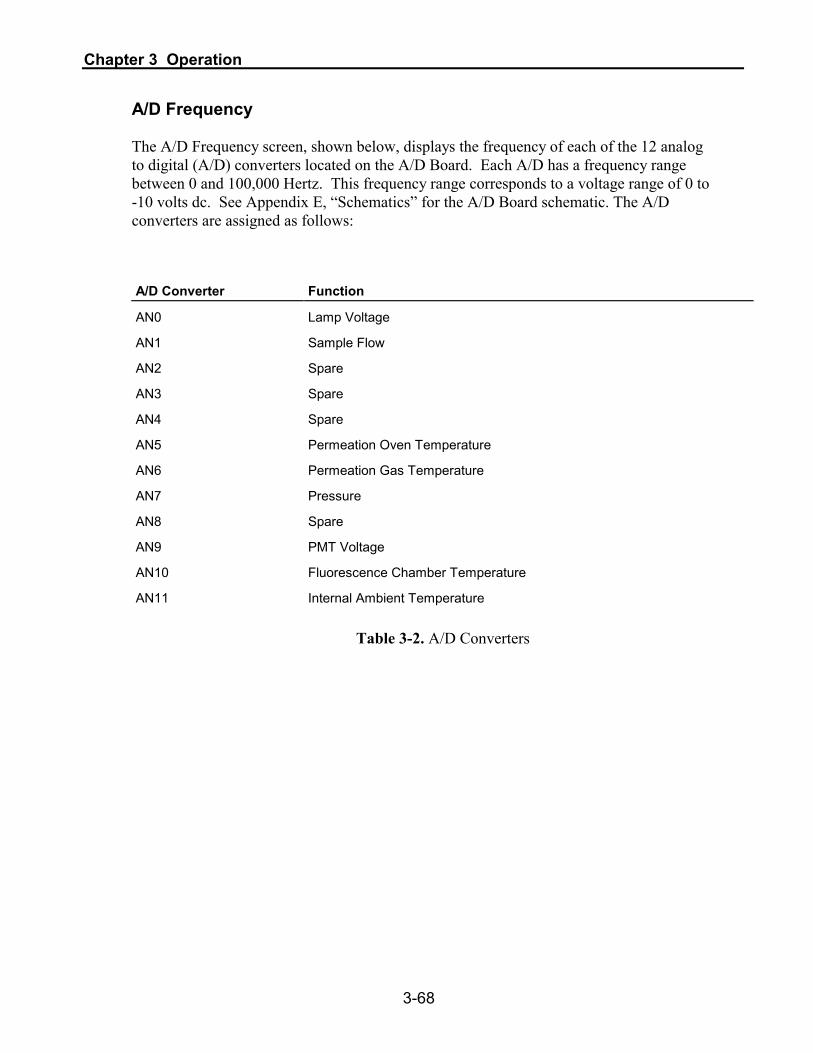
Chapter 3 Operation
3-68
A/D Frequency The A/D Frequency screen, shown below, displays the frequency of each of the 12 analog to digital (A/D) converters located on the A/D Board. Each A/D has a frequency range between 0 and 100,000 Hertz. This frequency range corresponds to a voltage range of 0 to -10 volts dc. See Appendix E, Schematics for the A/D Board schematic. The A/D converters are assigned as follows: A/D Converter Function
AN0 Lamp Voltage
AN1 Sample Flow
AN2 Spare
AN3 Spare
AN4 Spare
AN5 Permeation Oven Temperature
AN6 Permeation Gas Temperature
AN7 Pressure
AN8 Spare
AN9 PMT Voltage
AN10 Fluorescence Chamber Temperature
AN11 Internal Ambient Temperature Table 3-2. A/D Converters

Chapter 3 Operation
3-69
To display the A/D Frequency screen: From the Main Menu choose Service Mode From the Service Mode menu choose A/D Frequency
To use the A/D Frequency screen: Use the ↑ and ↓ pushbuttons to increment/decrement the A to D number Press MENU to return to the Service Mode menu Press RUN to return to the Run screen
A/D Frequency Screen

Chapter 3 Operation
3-70
Set Test Display The Set Test Display screen, shown below, displays the contents of a given memory location. This screen is only useful to TEI service personnel. To display the Set Test Display screen: From the Main Menu choose Service Mode From the Service Mode menu choose Set Test Display
To use the Set Test Display screen: Use the ↑ and ↓ pushbuttons to change the display mode Press MENU to return to the Service Mode menu Press RUN to return to the Run screen
Set Test Display Screen

Chapter 3 Operation
3-71
INTERNAL OPTION SWITCHES The internal option switches are located on the Motherboard (near front panel), as shown in Figure 3-7 below. The function of each option switch is given in Table 3-4. These switches are used to activate hardware and software options.
CAUTION: Some internal components can be damaged by small amounts of static electricity. A properly grounded antistatic wrist strap must be worn while handling any internal component. For more information about appropriate safety precautions, see Chapter 7, Servicing.
Figure 3-7. Location of Internal Option Switches 64P7192

Chapter 3 Operation
3-72
Option Switch Function
1 Remote
2 RS-232
3 Zero/Span and Sample Solenoid Valves
4 Double Range
5 Autorange
6 Lock
7 Permeation Span Source
8 Spare Table 3-3. Option Switch Functions Remote Option switch 1 is on when a remote interface is installed, such as RS-232 or I/O activation. RS-232 Option switch 2 is used to select between RS-232 and I/O activation. When option switch 2 is on, RS-232 is selected. When it is off, I/O activation is selected. Zero/Span and Sample Solenoid Valves Option switch 3 is on when the optional zero/span and sample solenoid valves are installed. For more information about the zero/span solenoid valves, see Chapter 9, Optional Equipment. Double Range and Autorange The double range (option switch 4) and autorange (option switch 5) switches are used to activate the single, dual, and autorange modes. The following table shows how each mode is activated. For more information about the single, dual, and autorange modes, see Operating Modes, earlier in this chapter.

Chapter 3 Operation
3-73
Operating Mode Option Switch 4 Option Switch 5
Single Range Mode Off On or Off
Dual Range Mode On Off
Autorange Mode On On Table 3-4. Operating Mode Truth Table Lock When option switch 6 is on, instrument parameters are locked and can not be changed. This prevents any erroneous entry of instrument parameters. When option switch 6 is off, instrument parameters can be changed. Permeation Span Source Option switch 7 is on only when the optional permeation span source is installed. Spare This option switch is currently not used.


4-1
CHAPTER 4
CALIBRATION
The Model 43C Trace Level requires initial and periodic calibration according to the procedures described in this chapter. A quality control plan that allows the frequency and number of calibration points to be modified depending on calibration and zero/span check data should be implemented. Such a quality control program is essential to ascertain the accuracy and reliability of the air quality data collected. The data compiled for such a program might include items such as dates of calibration, atmospheric conditions, control settings and other pertinent data. For more detailed quality assurance guidelines, see the Quality Assurance Handbook for Air Pollution Measurement Systems, published by the U.S. EPA, Research Triangle Park, NC, 27711. There are a number of conditions which should be met prior to a calibration or a zero/span check. First, the instrument should have at least 30 minutes to warm up and stabilize. Second, the range used during the calibration or zero/span check should be the same as that used during normal monitoring. Third, all operational adjustments to the instrument should be completed prior to calibration. Fourth, all parts of the gas flow system, such as sample lines, particulate filters, etc., which are used in normal monitoring should also be used during calibration. Finally, it is recommended that the recording devices and outputs used during normal monitoring be calibrated prior to the instrument calibration and that they be used during the calibration or the zero/span check.
ZERO GAS GENERATION An SO2-free air supply is required for the proper calibration and checkout of the analyzer. There are several methods that are acceptable to generate this zero gas. For more information about generating zero air, see Appendix D, Standards for Trace Level Analyzers. Commercial Heatless Air Dryers Commercial heatless air dryers filled with a mixed bed of activated charcoal and a 13X molecular sieve have been found effective in removing SO2 from compressed air. The use of this type of zero gas system is recommended when minimum maintenance is of prime importance. This system requires a source of compressed air. Refer to the manufacturer's recommendations for installation of such a system.

Chapter 4 Calibration
4-2
Absorbing Column An absorbing column packed with activated charcoal (Part No. 4157) is acceptable for scrubbing SO2 from ambient air. Ambient air is forced through a laboratory gas absorption column packed with the charcoal and the SO2 is removed to acceptable levels. The charcoal should be changed at a minimum of every 6 months. It may be necessary to change the charcoal more frequently depending on local conditions.
CALIBRATION GAS GENERATION A calibration gas system capable of providing accurate levels of SO2 calibration gas between zero and 80% of the fullscale range is required. The calibration system must provide a flow rate of at least 0.8 LPM for an instrument with the standard flow (instruments with higher flow rates will require a higher minimum calibration system flow rate). All calibration gas should be derived from local or working standards (e.g., cylinders of compressed gas or permeation devices) that are certified as traceable to an NIST primary standard. Cylinder Gas Dilution System A cylinder gas dilution system, shown in Figure 4-1, can be constructed. All connections between components in the system should be made with glass, Teflon, or other non-reactive material. The air flow controller should be capable of maintaining a constant air flow within ± 2% of the required flow rate. The SO2 flow controller should be capable of maintaining constant SO2 flows within ± 2% of the required flow rate. Ensure both flow controllers are properly calibrated. The pressure regulator for the standard SO2 cylinder must have a non-reactive diaphragm and internal parts and a suitable delivery pressure.
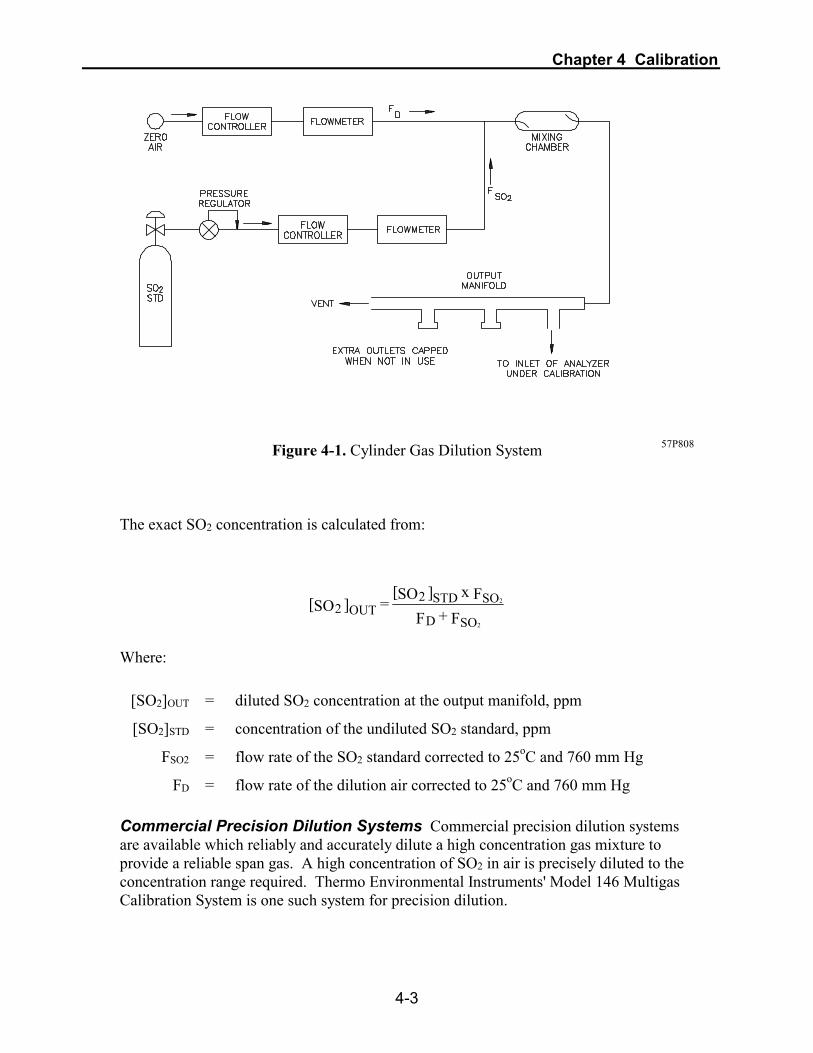
Chapter 4 Calibration
4-3
Figure 4-1. Cylinder Gas Dilution System 57P808 The exact SO2 concentration is calculated from:
Where:
[SO2]OUT = diluted SO2 concentration at the output manifold, ppm
[SO2]STD = concentration of the undiluted SO2 standard, ppm
FSO2 = flow rate of the SO2 standard corrected to 25oC and 760 mm Hg
FD = flow rate of the dilution air corrected to 25oC and 760 mm Hg Commercial Precision Dilution Systems Commercial precision dilution systems are available which reliably and accurately dilute a high concentration gas mixture to provide a reliable span gas. A high concentration of SO2 in air is precisely diluted to the concentration range required. Thermo Environmental Instruments' Model 146 Multigas Calibration System is one such system for precision dilution.
F + F
Fx ]SO[ = ]SO[
SOD
SOSTD2OUT2
2
2
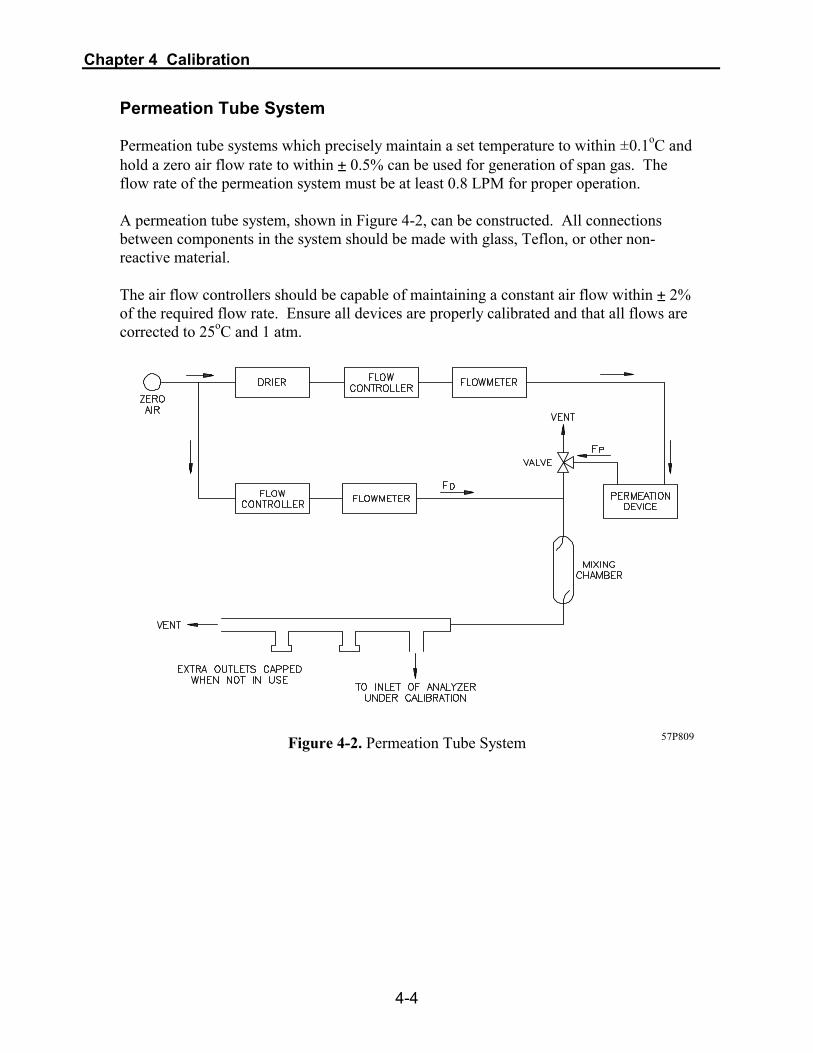
Chapter 4 Calibration
4-4
Permeation Tube System Permeation tube systems which precisely maintain a set temperature to within ±0.1oC and hold a zero air flow rate to within ± 0.5% can be used for generation of span gas. The flow rate of the permeation system must be at least 0.8 LPM for proper operation. A permeation tube system, shown in Figure 4-2, can be constructed. All connections between components in the system should be made with glass, Teflon, or other non-reactive material. The air flow controllers should be capable of maintaining a constant air flow within ± 2% of the required flow rate. Ensure all devices are properly calibrated and that all flows are corrected to 25oC and 1 atm.
Figure 4-2. Permeation Tube System 57P809

Chapter 4 Calibration
4-5
The SO2 output level is calculated from:
Where:
[SO2]OUT = SO2 output concentration in ppm
P = permeation rate in ng/min
FT = total flow rate of gas after mixing chamber (FP + FD), ml/min
K (SO2) = constant for specific permeant, 0.382 Commercial Permeation Systems. Commercial permeation systems, such as Thermo Environmental Instruments' Model 146 Multigas Calibration System, are available for this requirement. Refer to the instrument instruction manual for more information.
MULTI-POINT CALIBRATION Regulations require calibration when the instrument is newly installed, moved, repaired, interrupted for more than a few days, or when span or zero shift by more than 15%. If the instrument is equipped with the optional zero/span and sample valves, connect zero and span gas to the rear panel bulkheads labeled ZERO and SPAN. The RUN pushbutton is used to activate the zero and span valves. The lower left corner of the Run screen indicates which mode is active: zero, span, or sample.
Fx K P= ]SO[T
OUT2
NOTE: All gas must be supplied to the instrument at atmospheric pressure, it may be necessary to employ an atmospheric bypass plumbing arrangement to accomplish this (see Figure 2-2). If a filter is used, all gas must enter the analyzer through the filter.

Chapter 4 Calibration
4-6
1. Connect a source of zero air to the SAMPLE bulkhead. 2. To ensure that the zero air is being measured at atmospheric pressure, check that the
flow is about 0.5 LPM. From the Run screen, press the MENU pushbutton to display the Main Menu. Use the ↓ pushbutton to move the cursor to Diagnostics and press ENTER to display the Diagnostics menu. Use the ↓ pushbutton to move the cursor to Flow and press ENTER to display the flow screen.
3. Press the RUN pushbutton to monitor the zero air reading and wait for the reading to
stabilize. 4. Press the MENU pushbutton to display the Main Menu. Use ↓ pushbutton to move
the cursor to Calibration and press ENTER to display the Calibration menu. 5. Press ENTER to select Calibrate Zero. The Calibrate Zero screen appears. The first
line of the display shows the current SO2 reading. Press ENTER to set the SO2 reading to zero. The lower left corner of the display flashes the message SAVING PARAMETER(S) and the SO2 reading is added to the background correction. Press the MENU pushbutton to return to the Calibration menu. Record the stable zero air reading as ZSO2.
6. Connect a source of calibration gas to the SAMPLE bulkhead. The calibration gas
should be about 80% of the fullscale range. 7. To ensure that the calibration gas is being measured at atmospheric pressure, check
that the flow is about 0.5 LPM. 8. Sample the calibration gas and wait for the instrument reading to stabilize. 9. Use the ↓ pushbutton to move the cursor to Calibrate Span and press ENTER to
display the Calibrate span screen. The first line of the display shows the current SO2 reading. The second line of the display shows the current range. The third line of the display is where the calibration gas concentration is entered. To enter the calibration gas concentration, use the ← and → pushbuttons to move the cursor left and right. Use the ↑ and ↓ pushbuttons to increment and decrement the digit. Press the ENTER pushbutton to calibrate the analyzer to the SO2 calibration gas. The lower left corner of the display flashes the message SAVING PARAMETER(S) and the corrected SO2 reading is displayed. Press the RUN pushbutton to return to the Run screen. The SO2 recorder response will equal:

Chapter 4 Calibration
4-7
Where:
URL = upper range limit of the analyzer's operating range
ZSO2 = analyzer response to zero air, % fullscale 10. Generate five SO2 concentrations equally spaced between zero and the concentration
above. Record instrument reading for each concentration after allowing time for both gas generation system and instrument to stabilize. Plot a graph of instrument readings against the SO2 concentrations generated. This is the instrument calibration curve. All future measurements should be interpreted using this curve.
MULTI-POINT CALIBRATION IN DUAL/AUTORANGE MODE Regulations require calibration when the instrument is newly installed, moved, repaired, interrupted for more than a few days, or when span or zero shift by more than 15%. If the instrument is equipped with the optional zero/span and sample valves, connect zero and span gas to the rear panel bulkheads labeled ZERO and SPAN. The RUN pushbutton is used to activate the zero and span valves. The lower left corner of the Run screen indicates which mode is active: zero, span, or sample.
NOTE: All gas must be supplied to the instrument at atmospheric pressure, it may be necessary to employ an atmospheric bypass plumbing arrangement to accomplish this (see Figure 2-2). If a filter is used, all gas must enter the analyzer through the filter.
1. Connect a source of zero air to the SAMPLE bulkhead. 2. To ensure that the zero air is being measured at atmospheric pressure, check that the
flow is about 0.5 LPM. From the Run screen, press the MENU pushbutton to display the Main Menu. Use the ↓ pushbutton to move the cursor to Diagnostics and press ENTER to display the Diagnostics menu. Use the ↓ pushbutton to move the cursor to Flow and press ENTER to display the flow screen.
Z = 100x URL
]SO[SO
OUT22

Chapter 4 Calibration
4-8
3. Press the RUN pushbutton to monitor the zero air reading and wait for the reading to
stabilize. 4. Press the MENU pushbutton to display the Main Menu. Use ↓ pushbutton to move
the cursor to Calibration and press ENTER to display the Calibration menu. 5. Press ENTER to select Calibrate Zero. The Calibrate Zero screen appears. The first
line of the display shows the current SO2 reading. Press ENTER to set the SO2 reading to zero. The lower left corner of the display flashes the message SAVING PARAMETER(S) and the SO2 reading is added to the background correction. Press the MENU pushbutton to return to the Calibration menu. Record the stable zero air reading as ZSO2.
6. Connect a source of calibration gas to the SAMPLE bulkhead. The calibration gas
should be about 80% of the high fullscale range. 7. To ensure that the calibration gas is being measured at atmospheric pressure, check
that the flow is about 0.5 LPM. 8. Sample the calibration gas and wait for the instrument reading to stabilize. 9. Use the ↓ pushbutton to move the cursor to Calibrate HI Span and press ENTER to
display the Calibrate HI Span screen. The first line of the display shows the current SO2 reading. The second line of the display shows the current high range. The third line of the display is where the high calibration gas concentration is entered. To enter the high calibration gas concentration, use the ← and → pushbuttons to move the cursor left and right. Use the ↑ and ↓ pushbuttons to increment and decrement the digit. Press the ENTER pushbutton to calibrate the analyzer to the high SO2 calibration gas. The lower left corner of the display flashes the message SAVING PARAMETER(S) and the corrected SO2 reading is displayed. Press the MENU pushbutton to return to the Calibration menu. The SO2 recorder response will equal:
Where:
URL = upper range limit of the analyzer's operating range
ZSO2 = analyzer response to zero air, % fullscale
Z = 100x URL
]SO[SO
OUT22

Chapter 4 Calibration
4-9
10. Generate five SO2 concentrations equally spaced between zero and the concentration above. Record instrument reading for each concentration after allowing time for both gas generation system and instrument to stabilize. Plot a graph of instrument readings against the SO2 concentrations generated. This is the instrument calibration curve. All future measurements should be interpreted using this curve.
11. Connect a source of calibration gas to the SAMPLE bulkhead. The calibration gas
should be about 80% of the low fullscale range. 12. Use the ↓ pushbutton to move the cursor to Calibrate LO Span and press ENTER to
display the Calibrate LO Span screen. The first line of the display shows the current SO2 reading. The second line of the display shows the current low range. The third line of the display is where the low calibration gas concentration is entered. To enter the low calibration gas concentration, use the ← and → pushbuttons to move the cursor left and right. Use the ↑ and ↓ pushbuttons to increment and decrement the digit. Press the ENTER pushbutton to calibrate the analyzer to the low SO2 calibration gas. The lower left corner of the display flashes the message SAVING PARAMETER(S) and the corrected SO2 reading is displayed. Press the MENU pushbutton to return to the Calibration menu.
13. Generate five SO2 concentrations equally spaced between zero and the concentration
above. Record instrument reading for each concentration after allowing time for both gas generation system and instrument to stabilize. Plot a graph of instrument readings against the SO2 concentrations generated. This is the instrument calibration curve. All future measurements should be interpreted using this curve.
ZERO/SPAN CHECK/SPAN CHECK The zero/span check procedure is normally performed before and after a sampling period and any time a quick check of the accuracy of the instrument is required. Normally, zero and span are checked daily. As experience is gained with the analyzer, the frequency of these checks can be adjusted accordingly. The span gas concentration used in the span check should be between 70% and 90% of the fullscale range. The zero and span drift should be measured and recorded prior to making any adjustments. If the instrument is equipped with the optional zero/span and sample valves, connect zero and span gas to the rear panel bulkheads labeled ZERO and SPAN. The RUN pushbutton is used to activate the zero and span valves. The lower left corner of the Run screen indicates which mode is active: zero, span, or sample.

Chapter 4 Calibration
4-10
NOTE: All gas must be supplied to the instrument at atmospheric pressure, it may be necessary to employ an atmospheric bypass plumbing arrangement to accomplish this (see Figure 2-2). If a filter is used, all gas must enter the analyzer through the filter.
1. Connect a source of zero air to the SAMPLE bulkhead. 2. To ensure that the zero air is being measured at atmospheric pressure check that the
flow is about 0.5 LPM. From the Run screen, press the MENU pushbutton to display the Main Menu. Use the ↓ pushbutton to move the cursor to Diagnostics and press ENTER to display the Diagnostics menu. Use the ↓ pushbutton to move the cursor to Sample Flow and press ENTER to display the flow screen.
3. Press the RUN pushbutton to monitor the zero air reading and wait for the reading to
stabilize. 4. Record the measured SO2 value as the zero drift since the last adjustment. If the zero
has changed by more than ± 1.5 ppb, it is recommended that a new calibration be performed.
5. Connect span gas to the SAMPLE bulkhead. The span gas should be about 80% of
the fullscale range. 6. To ensure that the span gas is being measured at atmospheric pressure check that the
flow is about 0.5 LPM. 7. Press the RUN pushbutton to monitor the span gas reading and wait for the reading to
stabilize. 8. Record the difference between the measured SO2 value and the actual SO2 span
concentration used. This is the span drift since the last adjustment. If the calibration has changed by more than ± 10%, a new calibration should be performed.

5-1
CHAPTER 5 PREVENTIVE MAINTENANCE
To ensure proper operation of the Model 43C Trace Level, the maintenance procedures described in this chapter should be performed every six months.
SPARE PARTS Table 5-1 lists recommended spare parts. Part Number Description
8919 Capillary - 13 mil long (~.5 L/min flow rate) standard
4125 Capillary - 20 mil long (~1 L/min flow rate)
4800 Capillary O-Ring
8550 Pump - 110 volts
8551 Pump - 220 volts
8709 Pump - specify voltage and frequency
8606 Pump repair kit
13399 Model 43C Trace Level Instruction Manual
4158 Charcoal (pound)
8666 Flash lamp
60100 Particulate filter assembly
4509 Fuse (115V) T, 2A, 250V
14008 Fuse (220V) T, 0.8A, 250 V Table 5-1. Recommended Spare Parts
VISUAL INSPECTION AND CLEANING The Model 43C Trace Level should be inspected occasionally for obvious visible defects, such as loose connectors, loose fittings, cracked or clogged Teflon lines, and excessive dust or dirt accumulation. Dust and dirt can accumulate in the instrument and can cause overheating or component failure. Dirt on the components prevent efficient heat dissipation and may provide conducting paths for electricity. The best way to clean the inside of the instrument is to first carefully vacuum all accessible areas and then blow away the remaining dust with low-pressure compressed air. Use a soft paint brush or cloth to remove stubborn dirt.

Chapter 5 Preventive Maintenance
5-2
FAN FILTER INSPECTION AND CLEANING Under normal use, the filter over the instrument fan located on the rear panel of the instrument should be cleaned and reconditioned at six-month intervals. If the instrument is operated in excessively dirty surroundings, this procedure should be instituted on a more frequent schedule. 1. Remove the filter cover by gently pulling it off the fan guard. 2. Flush the filter with warm water and let dry (a clean, oil-free air purge will help with
the drying process). 3. Re-install filter and filter cover.
CAPILLARY INSPECTION AND REPLACEMENT To ensure that the pressure reducing capillary does not plug or impair the flow of sample gas through the instrument, it should be inspected approximately every six months. To remove the capillary, follow the procedure below: 1. Wear an antistatic wrist strap that is properly connected to earth ground. See “Safety
Precautions,” earlier in this chapter for more information. 2. Turn the instrument off, unplug the power cord, and remove the instrument cover. 3. Locate the capillary holder and remove the cap nut. 4. Remove the glass capillary (long - 13 mil) and O-Ring. 5. Check the capillary for particulate deposits within the bore. Clean or replace the
capillary (Part No. 8919) if particulate deposits are present. 6. Check the O-Ring (Part No. 4800) for cuts or abrasions and replace it if either are
present. 7. Replace the capillary in the holder, making sure the O-Ring is around the capillary
before inserting it into the holder. 8. Finger-tighten the holder cap nut over the capillary enough to ensure a tight seal. 9. Re-install the instrument cover.
SAMPLE PARTICULATE FILTER INSPECTION If a sample pre-filter is used, it should be inspected regularly for excessive dust and particulates, which restrict flow. If necessary, replace the sample filter.
Chapter 5 Preventive Maintenance
5-3
FLOW CHECK A flow rate of about 0.5 LPM should be observed for a standard instrument, if a flow rate of less than 0.35 LPM is observed, the following leak test procedure below should be performed: 1. Block the bulkhead labeled SAMPLE on the rear panel with a leak-tight cap. 2. Wait two minutes. 3. From the Run screen, press the MENU pushbutton to display the Main Menu. Use the
↓ pushbutton to move the cursor to Diagnostics, and press ENTER to display the Diagnostics menu. Use the ↓ pushbutton to move the cursor to Sample Flow and press ENTER to display the flow screen. The flow reading should now read zero flow and the pressure reading should be less than 180 mm Hg. If not, check to see that all fittings are tight, and that none of the input lines are cracked or broken.
LAMP VOLTAGE CHECK The Model 43C Trace Level is equipped with a lamp voltage control circuit, which automatically corrects for the degradation of the flash lamp with age. However, after several years of use, the lamp may have degraded to the point that it is being driven with the maximum voltage (1200 V) that the power supply can deliver. To display the lamp voltage, press the MENU pushbutton from the Run screen to display the Main Menu. Use the ↓ pushbutton to move the cursor to Diagnostics, and press ENTER to display the Diagnostics menu. Use the ↓ pushbutton to move the cursor to Lamp Intensity, and press ENTER to display the lamp intensity screen. If this voltage is at 1200 V, it is necessary to either replace the lamp or adjust the lamp voltage control circuit. For more information about replacing the lamp or adjusting the lamp voltage control circuit, see Chapter 7, “Servicing.”


6-1
CHAPTER 6 TROUBLESHOOTING
The Model 43C Trace Level has been designed to achieve a high level of reliability. Only premium components are used, thus complete failure is rare. In the event of problems or failure, the troubleshooting guidelines presented in this chapter should be helpful in isolating the fault(s). The Service Department at Thermo Environmental can also be consulted in the event of problems at (508) 520-0430. In any correspondence with the factory, please note both the serial number and program number of the instrument.
CAUTION: Some internal components can be damaged by small amounts of static electricity. A properly grounded antistatic wrist strap must be worn while handling any internal component. For more information about appropriate safety precautions, see Chapter 7, Servicing.
TROUBLESHOOTING GUIDE
MALFUNCTION POSSIBLE CAUSE ACTION
Does not start up No power Check that the instrument is
plugged into the proper source (110 or 220 volts)
Check instrument fuse
Power supply Check voltages from power supply
Digital electronics Check that all boards are seated properly
Replace boards one at a time with spare boards to isolate the faulty board.
No response to gas Bad calibration Ensure proper calibration

Chapter 6 Troubleshooting
6-2
No response to gas (cont.)
Bad span gas
Verify quality of span gas
Flasher power supply
Check all voltages and test points
Lamp trigger pak Replace with known good trigger pak to isolate bad part
Lamp Remove lamp and socket from flash holder by loosening the single set screw. The lamp flash should be clearly visible at 20 yards distance in a well-lit room.
PMT high voltage power supply
Check voltage on high voltage power supply connector, this voltage should be about -400 and -1200 volts (violet is positive)
PMT Replace with known good PMT to see if the PMT is the problem
Input board Check voltages and test point
Digital electronics Replace board one at a time with spare boards to isolate the faulty board
Bad pump Check pump vacuum
Capillary blocked Clean or replace

Chapter 6 Troubleshooting
6-3
Excessive response time
Partially blocked capillary
Clean or replace
Calibration drift
Non-consistent SO2 calibration source
Verify SO2 generation system or source
Faulty zero air used in calibration system
Check zero air generation system )
Temperature control board or thermistor
For proper operation the temperature control board LED should be blinking
Zero drift
Zero air
Check zero air generation system
Excessive noise
Noisy recorder
Check recorder for electrical noise pickup
Input board Replace with known good input board to see if it is the problem
Defective or low sensitivity PMT
Install known good PMT and check performance
Spikes in recorder output
Improper grounding of instrument or recorder
Ensure instrument and recorder are properly grounded through line cord
No output voltage
Jumper missing
Replace jumper on D/A Board

Chapter 6 Troubleshooting
6-4
No output voltage (cont.)
D/A board
Replace with a known good D/A board to see if the board is the problem
Inaccurate output voltage
Analog output needs adjustment
Perform analog output adjustment as described in Chapter 4, "Calibration"
D/A board Run DAC ramp as described in Chapter 3, "Operation"
Low flow
Capillary blocked
Clean or replace
Internal instrument leak Perform leak test
Unstable span
Internal instrument leak
Perform leak test
PMT high voltage power supply
Check voltage on high voltage power supply connector, this voltage should be about -400 and -1200 volts (violet is positive)
Flasher lamp Replace with known good lamp to see if the lamp is the problem
High scattered light
Zero air supply
Check zero air generation system
Low pump vacuum
Perform leak test. If leak test fails to discover leak, rebuild or replace pump

Chapter 6 Troubleshooting
6-5
Low lamp intensity
Flasher lamp
Check that the lamp and trigger pak are securely fastened
Flow meter fluctuations
Dirty pump diaphragm
Clean or replace
Capillary blocked Clean or replace
Clogged Teflon line Inspect all lines
Span factor outside acceptable limits of 0.5 - 2.0
Bad span gas
Verify quality of span gas
System leak
Perform leak test
Insufficient calibrator flow Verify calibrator is providing a flow of at least 0.8 LPM (for standard instrument)


7-1
CHAPTER 7 SERVICING
This chapter explains how to replace the Model 43C Trace Level subassemblies. Fault location is accomplished in the preceding chapters of “Preventive Maintenance” and “Troubleshooting.” This chapter assumes that a subassembly has been identified as defective and needs to be replaced. For additional service assistance, see “Servicing Locations” later in this chapter.
SAFETY PRECAUTIONS Some internal components can be damaged by the discharge of static electricity. To avoid damaging internal components, follow these precautions when performing any service procedure: Wear an antistatic wrist strap that is properly connected to earth ground (note that
when the analyzer is unplugged, the chassis is not at earth ground) If an antistatic wrist strap is not available, be sure to touch a grounded metal object
before touching any internal components Handle all printed circuit boards by the edges Carefully observe the instructions in each procedure
Figure 7-1. Properly Grounded Antistatic Wrist Strap 64P263/57P7127

Chapter 7 Servicing
7-2
REPLACEMENT PARTS LISTS Table 7-1 lists the part numbers of the major subassemblies in the Model 43C Trace Level. Refer to Figure 7-2 to identify their location. Part Number Description
9829 Motherboard
9837 Processor Board
8943 Analog/Digital Board
9839 Digital/Analog Board
8949 Power Supply Board
8774 Trigger Pak
8884 Flash Intensity Board
10996 Flasher Supply Board
8951 Input Board
8765 Temperature Control Board
9843 C-Link Board
8919 Capillary - 13 mil
4800 Capillary O-ring
8666 Flash Lamp
8606 Pump Rebuild Kit
8550 Pump 110V
8551 Pump 220V Table 7-1. Replacement Parts

Chapter 7 Servicing
7-3
Figu
re 7
-2.
Mod
el 4
3C T
race
Lev
el C
ompo
nent
Lay
out

Chapter 7 Servicing
7-4
NOTE: Power should be removed from the instrument before any servicing is performed.
PUMP REBUILDING
Equipment Required: Pump Repair Kit Screwdriver 1. Wear an antistatic wrist strap, see “Safety Precautions,” earlier in this chapter for
more information. 2. Turn the instrument off, unplug the power cord, and remove the instrument cover. 3. Release four latch fasteners and remove instrument cover. 4. Loosen fittings and remove both lines going to the pump. 5. Remove four screws from the top plate, remove the top plate, flapper valve, and the
bottom plate (see Figure 7-3). 6. Remove clamping disk holding diaphragm and Teflon protection wafer onto
clamping rod, remove both diaphragm and Teflon wafer. 7. Assemble pump by following above procedure in reverse, making sure not to over-
tighten clamping disk, and to have Teflon side of diaphragm facing up and that the flapper valves cover the holes of the top and bottom plate.
8. Re-install the instrument cover. 9. Check that the flow reads about 0.5 LPM when power is turned on.
PUMP REPLACEMENT Equipment Required: 110 volt Pump 220 volt Pump Nutdriver Screwdriver 1. Wear an antistatic wrist strap, see “Safety Precautions,” earlier in this chapter for
more information. 2. Turn the instrument off, unplug the power cord, and remove the instrument cover. 3. Release four latch fasteners and remove instrument cover. 4. Disconnect power line of pump from power supply. 5. Loosen fittings and remove both lines going to the pump. 6. Remove four screws holding pump mounting plate to floor plate. 7. Remove two screws holding pump to mounting plate. 8. Install new pump by following above procedure in reverse. 9. Re-install the instrument cover.

Chapter 7 Servicing
7-5
Figure 7-3. Pump Assembly 93P737
PMT REPLACEMENT Equipment Required: PMT Allen Wrench - 5/32" Nutdriver - 1/4" Screwdriver 1. Wear an antistatic wrist strap, see “Safety Precautions,” earlier in this chapter for
more information. 2. Turn the instrument off, unplug the power cord, and remove the instrument cover. 3. Release four latch fasteners and remove instrument cover. 4. Locate PMT housing. Disconnect the two-pin connector from the PMT to the PMT
high voltage supply.

Chapter 7 Servicing
7-6
5. Disconnect the signal cable from the Input Board. 6. Use 5/32" Allen wrench to remove the two screws securing PMT housing. 7. Use screwdriver and remove the three screws from the PMT cover. 8. With care slide the cover out. 9. Use 1/4" nutdriver and remove the two screws from at top and bottom of PMT base. 10. Pull the socket and tube out, and replace tube with new one. 11. Follow the above procedure in reverse, make sure all connectors and screws are
tight. 12. Re-install the instrument cover.
FLASH LAMP REPLACEMENT Equipment Required: Flash Lamp Screwdriver 1. Wear an antistatic wrist strap, see “Safety Precautions,” earlier in this chapter for
more information. 2. Turn the instrument off, unplug the power cord, and remove the instrument cover. 3. Release four latch fasteners and remove instrument cover. 4. Locate the lamp housing and trigger pak (see Figure 7-3). 5. Disconnect the three-pin connector from the flasher supply board. 6. Loosen the single screw on the lamp housing. 7. Pull out trigger pak and lamp from lamp housing.
8. Insert new lamp in socket. 9. Follow the above procedure in reverse, make sure all connectors and screws are
tight. 10. Follow “Lamp Voltage Adjustment” procedure below. 11. Re-install the instrument cover.
CAUTION: Do not touch lamp front window with hands, if this happens wash lamp with laboratory cleaning solution and dry before replacement.

Chapter 7 Servicing
7-7
LAMP VOLTAGE ADJUSTMENT Equipment Required: Screwdriver 1. Wear an antistatic wrist strap, see “Safety Precautions,” earlier in this chapter for
more information. 2. Turn the instrument off, unplug the power cord, and remove the instrument cover. 3. Locate the lamp voltage adjustment potentiometer (R28) on the lamp power supply
board. 4. Access the Diagnostic menu to display the current lamp voltage. 5. Using a small screwdriver, turn the lamp voltage adjustment potentiometer until the
lamp voltage is back to 800 volts. 6. Since the light intensity will now be less than it had been before the adjustment, the
photomultiplier gain will now have to be adjusted proportionately. A calibration should therefore be performed at this time.
7. Re-install the instrument cover.
FLASH INTENSITY BOARD REPLACEMENT Equipment Required: Flash Intensity Board Allen Wrench - 5/32" Screwdriver 1. Wear an antistatic wrist strap, see “Safety Precautions,” earlier in this chapter for
more information. 2. Turn the instrument off, unplug the power cord, and remove the instrument cover. 3. Release four latch fasteners and remove instrument cover. 4. Remove the four screws securing the optical bench to the floor plate with 5/32"
Allen wrench. 5. Lift the optical bench from the floor plate to gain access to the Flash Intensity Board
(see Figure 7-4). 6. Remove the three screws holding the flash intensity assembly to the reaction
chamber. 7. Install new Flash Intensity Board by following the above procedure in reverse. 8. Re-install the instrument cover.

Chapter 7 Servicing
7-8
Figu
re 7
-4.
Opt
ical
Ben
ch A
ssem
bly
57
P712
5

Chapter 7 Servicing
7-9
TEMPERATURE CONTROL BOARD REPLACEMENT Equipment Required: Temperature Control Board Nutdriver - 1/4" 1. Wear an antistatic wrist strap, see “Safety Precautions,” earlier in this chapter for
more information. 2. Turn the instrument off, unplug the power cord, and remove the instrument cover. 3. Release four latch fasteners and remove instrument cover. 4. Unplug J61 on the temperature control board (see Figure 7-4). 5. Unplug J4 on the dc power supply board. 6. Remove three screws with a 1/4" nutdriver. 7. Cut the tie-wrap holding thermistor leads to standoff. 8. Install new temperature control board by following the above procedure in reverse. 9. Re-install the instrument cover.
DC POWER SUPPLY BOARD REPLACEMENT Equipment Required: DC Power Supply Screwdriver 1. Wear an antistatic wrist strap, see “Safety Precautions,” earlier in this chapter for
more information. 2. Turn the instrument off, unplug the power cord, and remove the instrument cover. 3. Release four latch fasteners and remove instrument cover. 4. Disconnect all plug-in connections from both the dc power supply and flasher supply
boards. 5. Remove the power supply board base, which holds the power supply and the flasher
supply boards, by removing the four screws securing it to the instrument floor plate. 6. Remove the two remaining corner screws from the dc power supply board. 7. Remove the two screws holding down the transformer on the dc power supply. 8. Remove one nut located near U1 on the dc power supply board. 9. Carefully lift the power supply board from the power supply board base. 10. Replace power supply board. Be sure the leads of U1 are fully inserted into the
proper sockets on the bottom side of the power supply board. 11. Follow the above procedure in reverse, making sure all screws are tight and all
connectors are properly plugged in. 12. Re-install the instrument cover.

Chapter 7 Servicing
7-10
FLASHER SUPPLY BOARD REPLACEMENT
Equipment Required: Flasher Supply Board Screwdriver 1. Wear an antistatic wrist strap, see “Safety Precautions,” earlier in this chapter for
more information. 2. Turn the instrument off, unplug the power cord, and remove the instrument cover. 3. Release four latch fasteners and remove instrument cover. 4. Unplug the three connectors. 5. Remove five screws, one in each corner and one in the center. 6. Install new flasher supply board by following the above procedure in reverse. 7. Re-install the instrument cover.
PMT HIGH VOLTAGE POWER SUPPLY REPLACEMENT Equipment Required: PMT High Voltage Power Supply Screwdriver 1. Wear an antistatic wrist strap, see “Safety Precautions,” earlier in this chapter for
more information. 2. Turn the instrument off, unplug the power cord, and remove the instrument cover. 3. Release four latch fasteners and remove instrument cover. 4. Remove the four screws that hold the PMT high voltage power supply to the divider
panel. 5. Disconnect both PMT high voltage power supply connectors. 6. Install new PMT high voltage power supply by following the above procedure in
reverse. 7. The PMT gain will now have to be adjusted.
INPUT BOARD REPLACEMENT Equipment Required: Input Board Screwdriver 1. Wear an antistatic wrist strap, see “Safety Precautions,” earlier in this chapter for
more information. 2. Turn the instrument off, unplug the power cord, and remove the instrument cover. 3. Release four latch fasteners and remove instrument cover.

Chapter 7 Servicing
7-11
4. Disconnect the signal cable from the Input Board. 5. Remove three screws from the Input Board cover. 6. Remove four screws securing Input Board to divider panel. 7. Install new Input Board by following the above procedure in reverse. 8. Re-install the instrument cover.
ANALOG OUTPUT ADJUSTMENT The analog outputs need only be adjusted if the concentration value on the front panel display disagrees with the analog outputs. To see if the analog outputs need to be adjusted, compare the front panel display to the analog output voltage. If they differ by more than 1%, then the analog outputs should be adjusted. This procedure should only be performed by an instrument service technician. 1. Wear an antistatic wrist strap that is properly connected to earth ground, see “Safety
Precautions,” earlier in this chapter for more information. 2. Remove the instrument cover. 3. From the Run screen, press the MENU pushbutton to display the Main Menu. Use the
pushbutton to move the cursor to Diagnostics, and press ENTER to display the Diagnostics menu. Use the ↓ pushbutton to move the cursor to Test Analog Outputs, and press ENTER. The Test Analog Output screen appears as shown below.
Test Analog Outputs Menu 4. Press ENTER to select Zero. The zero screen appears as shown below. Using a small
screwdriver, adjust potentiometer R1 and R3 on the D/A Board until the analog outputs read 0 volts. Press the MENU pushbutton to return to the Test Analog Outputs menu.

Chapter 7 Servicing
7-12
Zero Analog Outputs Screen 5. Press the ↓ pushbutton to move the cursor to Fullscale and press ENTER. The
fullscale screen appears as shown below. Using a small screwdriver, adjust potentiometer R2 and R4 on the D/A Board until the analog outputs read 10 volts (standard instrument). Press the MENU pushbutton to return to the Test Analog Outputs menu.
Fullscale Analog Outputs Screen 6. Repeat the above steps to ensure the adjustments are accurate. 7. Re-install the instrument cover.
PRESSURE TRANSDUCER ADJUSTMENT Equipment Required: Vacuum Pump Screwdriver
CAUTION: Some internal components can be damaged by small amounts of static electricity. A properly grounded antistatic wrist strap must be worn while handling any internal component.
1. Wear an antistatic wrist strap, see “Safety Precautions,” earlier in this chapter for
more information.

Chapter 7 Servicing
7-13
2. Turn the instrument off, unplug the power cord, and remove the instrument cover. 3. Disconnect the tubing from the pressure transducer and connect a vacuum pump
known to produce a vacuum less than 1 mm Hg. 4. From the Run screen, press MENU to display the Main Menu. Use the ↓ pushbutton
to move the cursor to Service menu. Press ENTER to display the Service menu. Use the pushbutton to move the cursor to Pressure. Press ENTER to display the pressure reading.
5. Adjust the zero potentiometer on the pressure transducer for a reading of zero mm Hg.
6. Disconnect the vacuum pump. The display should read the current local barometric pressure. If this value does not agree with a known accurate barometer, adjust the span potentiometer.
7. Reconnect the tubing to the pressure transducer. 8. Re-install the instrument cover. Note that if the expected pressure changes are small (i.e., the only changes expected are barometric weather changes and not altitude changes) an error in the zero setting will not introduce a measurable error if the span is adjusted correctly. Thus if only a barometer is available, and not a vacuum pump, only adjust the span. If a barometer is not available, a rough check could be made as follows. Obtain the current barometric pressure from the local weather station or airport. Since these pressures are usually reported corrected to sea level, it might be necessary to correct to local pressure by subtracting 0.027 mm Hg per foot of altitude. Do not try to calibrate the pressure transducer unless the pressure is known accurately. It is possible for the atmospheric barometric pressure from room to room or in a building to be different from the outside atmospheric pressure as a result of the positive pressure developed by the air-conditioning and/or heating systems.
TEMPERATURE SENSOR ADJUSTMENT Equipment Required: Calibrated Thermometer or 10KΩ ± 1% Resistor Screwdriver In order to calibrate the temperature sensor, tape the thermistor plugged into the Motherboard to a calibrated thermometer. Adjust the GAIN potentiometer on the Analog to Digital Board until the internal temperature reading agrees with the value on the calibrated thermometer. Since the thermistors used in the Model 43C Trace Level are interchangeable to an accuracy of ± 0.2°C, and have a value of 10K ohms at 25°C, an alternate procedure is to connect an accurately known 10K resistor to the thermistor input on the Motherboard, and adjust the GAIN potentiometer for an internal temperature reading of 25°C. Note that a 1°C change corresponds to a ± 5% change in resistance, thus this alternative procedure can be quite accurate as a check; however, it clearly is not NIST traceable.
Chapter 7 Servicing
7-14
FUSE REPLACEMENT Equipment Required: 115V T, 2A, 250V 220V T, 0.8A, 250V 1.Disconnect power to instrument. 2.Remove fuse drawer, located on the AC power connector. 3.Replace both fuses, if either is blown. 4.Insert fuse drawer and reconnect power cord.

Chapter 7 Servicing
7-15
SERVICE LOCATIONS For additional assistance, Environmental Instruments Division has service available from exclusive distributors worldwide. Contact one of the phone numbers below for product support and technical information.
866-282-0430 Toll Free 508-520-0430 International


8-1
CHAPTER 8 THEORY OF OPERATION
In order to better understand the operation of the Model 43C Trace Level, a general knowledge of the electronics, software, and subassemblies is necessary.
ELECTRONICS The electronics can be broken down into the following subassemblies: ! DC Power Supply ! Flasher Supply Board ! Flash Intensity Board ! Input Board ! Temperature control Board ! Trigger Pak ! Microprocessor System A brief description of each follows. Note that all the electrical schematics are given in Appendix E, Schematics. DC Power Supply The DC Power Supply outputs the regulated and unregulated dc voltages necessary to operate the digital electronics, the Flasher Supply Board, Flash Intensity Board, Input Board, Trigger Pak, and Temperature Control Board. It outputs +24 volts unregulated and ±15 volts and +5 volts regulated. The main transformer can be configured for use with either 110 or 220 volts ac. The power supply board also contains the circuitry for driving the optional zero/span and sample solenoid valves. Flasher Supply Board The Flasher Supply Board provides the necessary high voltage for the flash lamp and also contains the lamp voltage control circuit. As the light output from the lamp falls, the lamp voltage circuit drives the lamp with a higher voltage, thereby keeping the light intensity constant. The lamp voltage is factory set at 800 volts, but after several years of use, the lamp may have degraded to the point that is being driven with the maximum voltage (1200 volts) that the power supply can deliver.

Chapter 8 Theory of Operation
8-2
The lamp intensity signal, coming from the Flash Intensity Board, is fed to a precision sample and hold amplifier. The output of the sample and hold amplifier is fed to both a comparator (U6) and to a voltage to frequency converter (U7). The comparator compares the actual lamp intensity to a reference signal defined by R28 (INT ADJ). The difference between the actual and reference intensity signals is used to control the lamp voltage. The output of the voltage to frequency converter is sent to the microprocessor board. A timer (U5) generates a square wave, which drives Q5 and then the step-up transformer to produce the flash lamp high voltage. Flash Intensity Board The Flash Intensity Board amplifies the lamp intensity signal detected by the photodetector. The output of the photodetector (R1228) is integrated by C1 and R3 and the fed to an op-amp (IC1). The output of the op-amp is sent to the Flasher Supply Board to be used to control the lamp voltage. Input Board A photomultiplier tube (PMT) transforms the light intensity into a current. The Input Board contains a preamplifier circuit, consisting of C1, R2, R1, C2, and U1, which converts the current into a voltage. This voltage is amplified by an op-amp (U3) according to the range setting selected by the digital gain set IC (U2). From here, the signal is switched synchronously with the flash lamp pulses. Finally, the voltage is converted to a frequency by U4 and sent to the microprocessor board. Temperature Control Board The Temperature Control Board sets and regulates the temperature of the fluorescence chamber. The fluorescence chamber temperature is measured by a thermistor mounted on a standoff of the Temperature Control Board. A comparator (IC1) turns Q1 on and off, which in turn drives the relay (K1). The relay switches ac line voltage on and off to the heaters mounted on the optical bench.

Chapter 8 Theory of Operation
8-3
The Microprocessor System The microprocessor system consists of printed circuit boards which plug into a motherboard, connecting them to each other and to the rest of the instrument. These boards are as follows: ! Display Module ! Processor Board ! Analog to Digital Board ! Digital to Analog Board ! C-Link Board Display Module. The vacuum fluorescent display module shows SO2 concentrations, instrument parameters, and help messages. The single board display module consists of 80 characters (4 line by 20 column), refresh memory, character generator, dc/dc converter and all necessary control logic. The display module is powered by +5 volts dc. Processor Board. The Processor Board contains a Motorola M68HC11F1 microprocessor (U14), RAM (U5), and EEPROM (U2). In addition, this high-performance, nonmultiplexed 68-pin microprocessor, contains 512 bytes of EEPROM and 1K of RAM. It is operated at a frequency of 1 MHz, which is generated by crystal X1. During each instruction cycle, the processor fetches an instruction from memory and executes it, reading or writing data to or from the data bus, or performing a calculation on some internal register or registers. The reset signal is generated by U7. This signal resets the M68HC11F1 every tenth of a second, and is used by the microprocessor to keep track of time. Each time the microprocessor is reset, it reads the counters, increments the clock, checks the status of the pushbuttons, and updates the D/A converters and display. The MC6840 counter chip (U1) acts as the interface between the Input Board and the microprocessor. A pulse train from the Input Board is directly fed into one of three counters on the MC6840 counter chip. Digital/Analog Board. The Digital to Analog Board contains four 10 bit D/A converters, one for each analog output. Each is addressed by the processor via signals from PA0-PA7 and PG0 and PG1. The D/A converters are zeroed using potentiometers R2 and R4 and span is set using potentiometers R1 and R3. The fullscale output of the two D/A converters is set by jumpers on switches SW1 and SW2 on the D/A Board. Fullscale voltages of 10, 5, 1, and 0.1 volts are available.

Chapter 8 Theory of Operation
8-4
Analog to Digital Board. The Analog to Digital Board acts as an interface between all the signals monitored by the processor system and the microprocessor itself. The internal ambient temperature, internal ambient pressure, and power supply voltages are converted to digital signals used by the microprocessor. C-Link Board. The C-Link Board contains the RS-232 circuitry, clock, and memory for the datalogger. Incoming RS-232 signals are converted to TTL levels by U3, an RS-232 driver/receiver. The TTL signals are then interpreted by U5, a 68HC11 microprocessor, which is dedicated to remote communications. Data records from the internal datalogger are stored in U2, a 128K RAM, and the link program is stored in U6, a 64K EPROM. U10 is the internal clock. A battery supplies +5 volts to the clock and the data logger memory when instrument power off.
SUBASSEMBLIES Hydrocarbon Kicker The Hydrocarbon Kicker removes hydrocarbons from the gas stream while leaving the SO2 concentration unaffected. It operates on a selective permeation principle, allowing only hydrocarbon molecules to pass through the tube wall. The driving force for the hydrocarbon removal is the differential partial pressure across the wall. This differential pressure is produced within the instrument by passing the sample gas through a capillary tube to reduce its pressure and feeding it into the shell side of the Hydrocarbon Kicker. Optics The optics section begins with a hermetically sealed lamp which is pulsed at a rate of 10 times per second. The lamp is operated in the pulsed mode for six major reasons. ! Long life ! High optical intensity - improved signal to noise ratio ! Small size ! Low power requirements - less than 1 watt ! Long term stability ! Chopped signal processing - no dark current drift The light from this lamp is focused with a condensing lens into the mirror assembly. A set of eight mirrors selectively reflects only those wavelengths which are of use in exciting SO2 molecules. This reflective filtering allows the radiation reaching the detection chamber to be both more intense and more stable throughout the lifetime of the instrument. After this reflective filtering, the light passes through a relay lens and into the fluorescence chamber. A circular baffle helps keep stray light from entering the actual detection volume.

Chapter 8 Theory of Operation
8-5
The main detector assembly is located at a right angle to the incoming light. A condenser lens collects and focuses light from fluorescing SO2 molecules. The light then passes through a bandpass filter which restricts the light reaching the photomultiplier tube to the SO2 fluorescence wavelengths only. Facing the light source, at the opposite side of the fluorescence chamber, is a light trap, which prevents light from reflecting back into the detection volume. At the center of this trap, a hole allows light to reach the photodetector located at the back of the fluorescence chamber. This photodetector continuously monitors the incident light. It is connected to a circuit which automatically compensates for fluctuations in the flash lamp output. Flow Components The sample is drawn into the Model 43C Trace Level through the SAMPLE bulkhead (see Figure 1-1). The sample flows through a hydrocarbon kicker, which removes hydrocarbons from the sample by forcing the hydrocarbon molecules to permeate through the tube wall. The SO2 molecules pass through the hydrocarbon kicker unaffected. The sample then flows into the fluorescence chamber, where pulsating UV light excites the SO2 molecules. The condensing lens focuses the pulsating UV light into the mirror assembly. The mirror assembly contains eight selective mirrors that only reflect the wavelengths which excite SO2 molecules. As the excited SO2 molecules decay to lower energy states they emit UV light that is proportional to the SO2 concentration. The bandpass filter allows only the wavelengths emitted by the excited SO2 molecules to reach the photomultiplier (PMT). The PMT detects the UV light emission from the decaying SO2 molecules. The photodetector, located at the back of the fluorescence chamber, continuously monitors the pulsating UV light source and is connected to a circuit that compensates for fluctuations in the UV light. The sample then flows through a flow sensor, a capillary, and the shell side of the hydrocarbon kicker. The Model 43C Trace Level outputs the SO2 concentration to the front panel display and the analog outputs.


9-1
CHAPTER 9 OPTIONAL EQUIPMENT
This chapter describes optional equipment available for the Model 43C Trace Level.
RACK MOUNTS WITH SLIDES Rack mounts with slides for standard 19-inch relay racks are available. Figures 9-1 and 9-2 illustrate the installation of the rack mount option. Also available, as Option 209, are the handle mounting brackets and handles without the rack mounts.
Figure 9-1. Rack Mount Option Assembly 93P726

Chapter 9 O
ptional Equipment
9-2
Figure 9-2. Model 43C Trace Level Dimensional Outline

Chapter 9 Optional Equipment
9-3
INTERNAL ZERO/SPAN AND SAMPLE VALVES With the zero/span and sample valve option, a source of span gas is connected to the SPAN port and a source of zero air is connected to the ZERO port (see Figure 2-1). Zero and span gas should be supplied at atmospheric pressure. It may be necessary to use an atmospheric dump bypass plumbing arrangement to accomplish this (see Figure 2-2). If this option is installed, option switch 3 must be on (see Figure 3-7). Use the RUN pushbutton while in the Run screen to manually switch the valves between sample, zero, and span. The active mode is shown in the lower left corner of the display as shown below. Run Screen in Sample Mode Zero/Span Check Automatic zero/span checking is available in the local mode (option switch 1 off) with the zero/span valve option. Zero/Span Check appears in the Calibration screen as shown below. Use the 9 pushbutton to move the cursor to Zero/Span Check and press ENTER. Calibration Screen with Zero/Span Check

Chapter 9 Optional Equipment
9-4
The Zero/Span Check menu appears as shown below. Zero/Span Check Menu To set zero/span check, follow the procedure below: 1. Set the date of the first zero/span check. The Next Date screen, shown below, is used to
set the initial or start date of the zero/span check. Once the initial zero/span check is performed, the date of the next zero/span check is calculated and displayed.
Next Date Screen 2. Set the time of the first zero/span check. The Next Time screen, shown below, is used to
set the initial time of the zero/span check. Once the initial zero/span check is performed, the time of the next zero/span check is calculated and displayed.

Chapter 9 Optional Equipment
9-5
Next Time Screen 3. Set the period between zero/span checks. The Period screen, shown below, defines the
period or interval between zero/span checks. Periods between 2 and 1,000 hours are acceptable. To turn the zero/span check off, set the period to 0.
Period Screen 4. Set the zero check and the span check duration. The Z (zero) Duration screen, shown
below, defines how long zero air is sampled by the instrument. The S (span) Duration screen looks and functions the same way as the Z Duration screen, and is used to set how long the span gas is sampled by the instrument. Durations between 1 and 60 minutes are acceptable. Each time a zero/span check occurs, the zero check is done first, followed by the span check. To perform just a zero check, set the S Duration screen to 0. To perform just a span check, set the Z duration screen to 0.

Chapter 9 Optional Equipment
9-6
Z Duration Screen
REMOTE ACTIVATION OF ZERO/SPAN AND SAMPLE VALVES The rear panel I/O (DB25) connector, shown in Figure 9-3, enables the zero/span and sample valves to be remotely controlled via contact closure. In addition, the connector has several instrument status outputs. Option switch 1 must be on and option switch 2 off in order to enable the remote I/O connector.
Pin Out (1) Ground (13) NC (2) NC (14) Ground (3) NC (15) NC (4) NC (16) NC (5) INPUT - Zero Gas (17) NC (6) Ground (18) INPUT - Span Gas (7) Relay Common (19) Ground (8) STATUS - Concentration Alarm (20) Relay Common (9) STATUS - Local or Remote Mode (21) STATUS - Zero Gas Mode (10) STATUS - ppm or mg/m3 mode (22) STATUS - Span Gas Mode (11) STATUS - General Alarm (23) NC (12) Relay Common (24) STATUS - Sample Gas Mode (25) Relay Common Figure 9-3. Rear Panel I/O Connector 64P947-5

Chapter 9 Optional Equipment
9-7
Input Pins To activate the zero gas mode, connect pin 1, 6, 14, or 19 (ground) to pin 5 (zero gas mode), as shown in Figure 9-4. To deactivate the zero gas mode, disconnect ground from the zero gas mode input.
Figure 9-4. Remote I/O Zero Gas Mode Activation 64P947-6 To activate the span gas mode, connect pin 1, 6, 14, or 19 (ground) to pin 18 (span gas mode), as shown in Figure 9-5. To deactivate the span gas mode, disconnect ground from the span gas mode input.
Figure 9-5. Remote I/O Span Gas Mode Activation 64P947-7 Instrument Status Outputs Several instrument status outputs are available on the rear panel I/O connector via reed relays on the I/O Board. The reed relays are arranged as shown in Figure 9-6. In the instrument status output truth table, each pin is referred to as open or closed (based on the physical position of the corresponding relay). The Relay Common line is common to each of the relays.

Chapter 9 Optional Equipment
9-8
Figure 9-6. Instrument Status Output Relays
Status Pin Relay Closed Relay Open
Concentration Alarm 8 Alarm No Alarm
Local or Remote Mode 9 Local or Service Mode Remote Mode
mg/m3 or ppb Mode 10 mg/m3 mode ppb mode
General Alarm 11 Alarm No Alarm
Status Pin 21 Pin 22 Pin 24
Sample Gas Mode Active Relay Open Relay Open Relay Closed
Zero Gas Mode Active Relay closed Relay Open Relay Open
Span Gas Mode Active Relay closed Relay Closed Relay Open
Table 9-1. Instrument Status Output Truth Table

Chapter 9 Optional Equipment
9-9
4-20 mA ISOLATED CURRENT OUTPUT A 4-20 mA Isolated Current Output enables the SO2 concentration to be output at 4-20 mA as shown in Figure 9-7.
57P765-4 Figure 9-7. Pin-Out of Rear Panel Terminal Strip with Optional Current Output
INTERNAL PERMEATION SPAN SOURCE The internal permeation span source is designed to provide a simple zero and span check. For more information about this option see Appendix C Internal Permeation Span Source.
TEFLON PARTICULATE FILTER A 5-10 micron pore size, 2 inch diameter Teflon element is available for the Model 43C Trace Level. This filter should be installed just prior to the SAMPLE bulkhead. When using a filter, all calibrations and span checks must be performed through the filter.

Chapter 9 Optional Equipment
9-10
INSTRUMENT HANDLE An instrument handle is available to aid in carrying the instrument. It also enables the instrument to be slightly elevated, while resting on a table or bench, to increase visibility of the display. Figure 9-8 shows the installation of the instrument handle.
Figure 9-8. Instrument Handle Assembly 93P727

A-1
APPENDIX A WARRANTY
Seller warrants that the Products will operate substantially in conformance with Seller's published specifications, when subjected to normal, proper and intended usage by properly trained personnel, for 13 months from date of shipment or 12 months from date of installation, whichever is less (the "Warranty Period"). Seller agrees during the Warranty Period, provided it is promptly notified in writing upon the discovery of any defect and further provided that all costs of returning the defective Products to Seller are pre-paid by Buyer, to repair or replace, at Seller's option, defective Products so as to cause the same to operate in substantial conformance with said specifications. Replacement parts may be new or refurbished, at the election of Seller. All replaced parts shall become the property of Seller. Shipment to Buyer of repaired or replacement Products shall be made in accordance with the provisions of Section 5 above. Lamps, fuses, bulbs and other expendable items are expressly excluded from the warranty under this Section 8. Seller's sole liability with respect to equipment, materials, parts or software furnished to Seller by third party suppliers shall be limited to the assignment by Seller to Buyer of any such third party supplier's warranty, to the extent the same is assignable. In no event shall Seller have any obligation to make repairs, replacements or corrections required, in whole or in part, as the result of (i) normal wear and tear, (ii) accident, disaster or event of force majeure, (iii) misuse, fault or negligence of or by Buyer, (iv) use of the Products in a manner for which they were not designed, (v) causes external to the Products such as, but not limited to, power failure or electrical power surges, (vi) improper storage of the Products or (vii) use of the Products in combination with equipment or software not supplied by Seller. If Seller determines that Products for which Buyer has requested warranty services are not covered by the warranty hereunder, Buyer shall pay or reimburse Seller for all costs of investigating and responding to such request at Seller's then prevailing time and materials rates. If Seller provides repair services or replacement parts that are not covered by the warranty provided in this Section 8, Buyer shall pay Seller therefore at Seller's then prevailing time and materials rates. ANY INSTALLATION, MAINTENANCE, REPAIR, SERVICE, RELOCATION OR ALTERATION TO OR OF, OR OTHER TAMPERING WITH, THE PRODUCTS PERFORMED BY ANY PERSON OR ENTITY OTHER THAN SELLER WITHOUT SELLER'S PRIOR WRITTEN APPROVAL, OR ANY USE OF REPLACEMENT PARTS NOT SUPPLIED BY SELLER, SHALL IMMEDIATELY VOID AND CANCEL ALL WARRANTIES WITH RESPECT TO THE AFFECTED PRODUCTS. THE OBLIGATIONS CREATED BY THIS SECTION TO REPAIR OR REPLACE A DEFECTIVE PRODUCT SHALL BE THE SOLE REMEDY OF BUYER IN THE EVENT OF A DEFECTIVE PRODUCT. EXCEPT AS EXPRESSLY PROVIDED IN THIS SECTION 8, SELLER DISCLAIMS ALL WARRANTIES, WHETHER EXPRESS OR IMPLIED, ORAL OR WRITTEN, WITH RESPECT TO THE PRODUCTS, INCLUDING WITHOUT LIMITATION ALL IMPLIED WARRANTIES OF MERCHANTABILITY OR FITNESS FOR ANY PARTICULAR PURPOSE. SELLER DOES NOT WARRANT THAT THE PRODUCTS ARE ERROR-FREE OR WILL ACCOMPLISH ANY PARTICULAR RESULT.


B-1
APPENDIX B RS-232/485 COMMANDS
The RS-232/485 interface enables the analyzer to be remotely controlled by a host remote device such as, a PC, PLC, datalogger, etc.
CONNECTIONS On the rear panel of the analyzer there are two male DB9 connectors. Both connectors are identical, so either can be connected to the remote device. The remaining connector can be used to connect a second analyzer. Using a daisy-chain configuration, several analyzers can be connected to one remote device. A null modem (crossed) cable is required when connecting the analyzer to an IBM Compatible PC. However, a straight cable (one to one) may be required when connecting the analyzer to other remote devices. As a general rule, when the connector of the remote device is female, a straight cable is required and when the connector is male, a null modem cable is required.
DATA FORMAT 1200, 2400, 4800, or 9600 baud 8 data bits 1 stop bit no parity All responses are terminated with a carriage return (hex 0D)
INSTRUMENT IDENTIFICATION NUMBER Each command sent to the analyzer must begin with the instrument's identification number plus 128. For example, if the instrument ID is set to 25, then decimal 153 precedes each command. The analyzer ignores any command that does not begin with its instrument identification number.
COMMANDS The analyzer must be in the remote mode in order to change instrument parameters via remote. However, the command "set mode remote" can be sent to the analyzer to put it in the remote mode. Report commands can be issued either in the remote or local mode.

Appendix B RS-232/485 Commands
B-2
The commands can be sent in either uppercase or lowercase characters. In the examples below, only the characters between the quotation marks ("") are sent and received. If an incorrect command is sent, a "bad cmd" message will be received. The example below sends the incorrect command "set time avg" instead of the correct command "set avg time". Send: "set time avg" Receive: "set time avg bad cmd" so2 This command reports the current SO2 concentration reading. The example below reports that the current SO2 reading is 40 ppb. Send: "so2" Receive: "so2 0040E+0 ppb" gas mode This reports the current mode of sample, zero, or span. The example below reports that the gas mode is sample. Send: "gas mode" Receive: "gas mode sample" set sample gas This command sets the optional valves to the sample mode. The example below sets the instrument to sample mode, that is, the instrument is reading the sample gas. Send: "set sample gas" Receive: "set sample gas ok"

Appendix B RS-232/485 Commands
B-3
set zero gas This command sets the optional valves to the zero mode. The example sets the instrument in the zero mode, that is, the instrument is sampling zero air. Send: "set zero" Receive: "set zero ok" set span gas This command sets the optional valves to the span mode. The example below sets the instrument to the span mode, that is, the instrument is sampling span gas. Send: "set span" Receive: "set span ok" mode This reports what operating mode the instrument is in: local or remote. The example below shows that the instrument is in the remote mode. Send: "mode" Receive: "mode remote" set mode local set mode remote These commands set the instrument to local or remote mode. The example below sets the instrument to the local mode. Send: "set mode local" Receive: "set mode local ok"

Appendix B RS-232/485 Commands
B-4
gas unit This reports the current gas units (ppb or µg/m3). The example reports that the gas unit is set to ppb. Send: "gas unit" Receive: "gas unit ppb" set gas unit unit unit = | ppb | ug/m3 | This command sets the gas units to ppb or µg/m3. The example below sets the gas units µg/m3. Send: "set gas unit ug/m3" Receive: "set gas unit ug/m3 ok" range so2 This command reports the current SO2 range. The example below reports that the SO2 range is set to 50 ppb. Send: "range so2" Receive: "range so2 2: 5000E-2 ppb" set range d d = Code in table below This command selects the SO2 fullscale range according to the tables below. The example below sets the SO2 fullscale range to 50 ppb. Send: "set range 7" Receive: "set range 7 ok"

Appendix B RS-232/485 Commands
B-5
Standard Ranges: Code ppb µg/m3
0 10 20
1 20 50
2 50 100
3 100 200
4 200 500
5 500 1000
6 1,000 2000
8 C1 C1
9 C2 C2
10 C3 C3 custom d d = | 1 | 2 | 3 | This reports the user-defined value of custom range 1, 2, or 3. The example below reports that custom range 1 is defined to 55.0 ppb. Send: "custom 1" Receive: "custom 1 5500E-2 ppb" set custom 1 range ddddd.d set custom 2 range ddddd.d set custom 3 range ddddd.d These commands are used to define the custom ranges. To use the custom range select it using the set range command. The example below defines custom range 1 to 55.5 ppb. Send: "set custom 1 range 55.5" Receive: "set custom 1 range 55.5 ok"

Appendix B RS-232/485 Commands
B-6
avg time This reports the averaging time setting. The example below reports that the averaging time is set to 60 seconds. Send: "avg time" Receive: "avg time 060 sec" set avg time d d = Code in table below Sets the averaging time according to the Table below. The example below sets the averaging time to 60 seconds. Send: "set avg time 3" Receive: "set avg time 3 ok" Code Averaging time (seconds)
0 1
1 2
2 5
3 10
4 20
5 30
6 60
7 90
8 120
9 180
10 240
11 300

Appendix B RS-232/485 Commands
B-7
so2 bkg This command reports the current SO2 background. The example below reports that the SO2 background is 2.7 ppb. Send: "so2 bkg" Receive: "so2 bkg 002.7 ppb" set so2 bkg dd.d This command is used to set the SO2 background to a user-defined value. The example below sets the SO2 background to 2.7 ppb. Send: "set so2 bkg 2 2.7" Receive: "set so2 bkg 02.7 ok" coef so2 This command reports the current SO2 coefficient. The example below reports that the SO2 coefficient is 1.005. Send: "so2 coef" Receive: "so2 coef 1.005" set coef so2 d.ddd This command sets the SO2 coefficient to a user-defined value. The example below sets the SO2 coefficient to 1.005. Send: "set so2 coef 1.005" Receive: "set so2 coef 1.005 ok"

Appendix B RS-232/485 Commands
B-8
lamp status This reports the status of the flash lamp: on or off. The example below reports that the flash lamp is on. Send: "lamp status" Receive: "lamp status on" set lamp on set lamp off These commands turn the flash lamp on and off. The example below turns the flash lamp on. Send: "set lamp on" Receive: "set lamp on ok" temp comp This reports whether temperature compensation is on or off. The example below shows a typical response to this command. Send: "temp comp" Receive: "temp comp off" set temp comp on set temp comp off This command turns the temperature compensation on and off. The example below turns temperature compensation off. Send: "set temp comp off" Receive: "set temp comp off ok"

Appendix B RS-232/485 Commands
B-9
pres comp This reports whether pressure compensation is on or off. The example below shows that pressure compensation is on. Send: "pres comp" Receive: "pres comp on" set pres comp on set pres comp off These commands turn the pressure compensation on and off. The example below turns pressure compensation off. Send: "set pres comp off" Receive: "set pres comp off ok" time This reports the current time (military time). The example below reports that the internal time is 2:15:30 pm. Send: "time" Receive: "time 14:15:30" set time hh:mm:ss hh = hours mm = minutes ss = seconds Sets the internal clock (military time). The example below sets the internal time to 2:15 pm. Note that if seconds are omitted, the seconds default to 00. Send: "set time 14:15" Receive: "set time 14:15 ok"

Appendix B RS-232/485 Commands
B-10
date This reports the current date. The example below reports the date as December 1, 1996. Send: "date" Receive: "date 12-01-96" set date mm-dd-yy mm = month dd = day yy = year Sets the internal date. The example below sets the internal date to December 1, 1996. Send: "set date 12-01-96" Receive: "set date 12-01-96 ok" pmt voltage This reports the current PMT voltage. The example below reports that the current PMT voltage is -510 volts. Send: "pmt voltage" Receive: "pmt voltage -0510 volts" internal temp This reports the current internal instrument temperature. The first temperature reading is the temperature being used in instrument calculations. The second temperature is the actual temperature being measured. If temperature compensation is on, then both temperature readings are the same. If temperature compensation is off, a temperature of 30°C is used as the default temperature even though the actual internal temperature is 27.2°C. The example below shows that temperature compensation is on and that the internal temperature is 27.2°C. Send: "internal temp" Receive: "internal temp 027.2 deg C, actual 027.2"

Appendix B RS-232/485 Commands
B-11
react temp This reports the current reaction chamber temperature. The example below reports that the current reaction chamber temperature is 45.2°C. Send: "react temp" Receive: "react temp 045.2 deg C" lamp int This reports the current flash lamp intensity. The example reports that the current flash lamp intensity is 35,867 Hz. Send: "lamp int" Receive: "lamp int 35867 Hz" lamp voltage This command reports the current flash lamp voltage. The example below reports that the flash lamp voltage is 810 volts. Send: "lamp voltage" Receive: "lamp voltage 810 V" led status This command reports the status of the optical test LED (on or off). The example below reports that the optical test LED is off. Send: "test led status" Receive: "test led status off"

Appendix B RS-232/485 Commands
B-12
set led on set led off These commands turn the optical span test led on and off. The example below turns the optical test led off. Send: "set test led off" Receive: "set test led off ok" pres This reports the current reaction chamber pressure. The first pressure reading is the pressure reading being used in instrument calculations. The second pressure is the actual pressure reading being measured. If pressure compensation is on, then both pressure readings are the same. If pressure compensation is off, a pressure of 760 mm Hg is used as the default pressure even though the actual pressure is 753.4 mm Hg. The example below shows that actual reaction chamber pressure is 753.4 mm Hg. Send: "pres" Receive: "pres 760.0 mm Hg, actual 753.4" flow This reports the current sample flow. The example below reports that the current sample flow is 0.503 liters/minute. Send: "flow" Receive: "flow 0.503 l/m" dtoa d d = DTOA in table below This reports the outputs of the 7 Digital to Analog converters (0000 = 0.0% FS, 1000 = 100.0% fullscale). The example below shows that the D/A for the SO2 voltage Out is 97.7% fullscale. Send: "dtoa 1" Receive: "dtoa 1 0977"

Appendix B RS-232/485 Commands
B-13
DTOA Function
1 SO2 Voltage Output
2 SO2 Voltage Output
3 Not Used
4 Not Used
5 SO2 Current Output
6 SO2 Current Output
7 Not Used perm gas temp This reports the current permeation gas temperature. The example below reports that the permeation gas temperature is 45.0°C. Send: "perm gas temp" Receive: "perm gas temp 045.0 deg C" option switches This reports the status (on/off) of the 8 option switches. For example, a return of 11100000, means that option switches 1, 2, and 3 are on and the others are off (see Internal Option Switches in Chapter 3 Operation, for more information about option switches). The example below shows that option switches 1, 2, and 3 are on. Send: "option switches" Receive: "option switches 11100000" program no This reports the analyzer's program number and the Link (communications) program number. The example below shows that the installed processor program is 43TR0001 00 and the installed communication program (link) is 43LTR000100. Send: "program no" Receive: "program no processor 43TR0001 00 link 43LTR0001 00"

Appendix B RS-232/485 Commands
B-14
set save params This command stores parameters in the EEPROM. It is important that each time instrument parameters are changed, that this command be sent. If changes are not saved, they will be lost in the event of a power failure. The example below saves the parameters to EEPROM. Send: "set save params" Receive: "set save params ok" screen This reports the information currently being displayed on the instrument's front panel display. The example below shows a typical response to this command. Send: "screen" Receive: " " "SO2 PPB 29.5" " " "SAMPLE 14:25 REMOTE" push button button = | run | menu | enter | help | up | down | left | right | This command is used to simulate pressing the Model 43C Trace Level front panel pushbuttons. In the example below, the push command is used in conjunction with the screen command to view the Main Menu. Note that the instrument is in the Run screen initially. Send: "push menu" Receive: "push menu ok" Send: "screen" Receive: "MAIN MENU: 10:25" ">RANGE " " AVERAGING TIME " " CALIBRATION FACTORS "

Appendix B RS-232/485 Commands
B-15
format This command reports the current reply termination format as shown below: Send: "format" Receive: "format 00" Code Reply Termination
00 <CR>
01 0x80 xxxx <CR> where xxxx = the sum of all characters in the message set format dd dd = | 00 | 01 | This command sets the reply termination format. The example below sets the reply termination format to checksum. Send: "format 01" Receive: "format 01 ok" "sum 0570" Code Reply Termination
00 <CR>
01 <nl>sum xxxx<CR> where xxxx = 4 hexadecimal digits that represent the sum of all the characters in the message

Appendix B RS-232/485 Commands
B-16
set lrec format tt ff set srec format tt xx tt = | 00 | 01 | 02 | 03 | 04 | ff = | 00 | 01 | 02 | 03 | xx = | 00 | 01| There are two types of records that the internal data logger stores: long records and short records. Both records contain the time, date, SO2 average, and the instrument status flags. The SO2 average is taken over the logging interval. For example, if the long record (or lrec) logging time is set to 30 minutes, then the SO2 reading is the average SO2 reading during the last 30 minutes. In addition, the long record contains the following data: PMT voltage, lamp voltage, lamp intensity, internal instrument temperature, reaction chamber temperature, pressure, and sample flow readings. These readings are instantaneous measurements. The data logger can store 1,792 long records and 4,096 short records. The logging time for each record is defined as follows: Time Logging Time
(minutes)
00 1
01 5
02 15
03 30
04 60 The records may be output several ways: Reply Output Format
00 Short reply (no temps, flows, etc.) with no text
01 Short reply (no temps, flows, etc.) with text
02 Long reply (temps, flows, etc.) with no text
03 Long reply (temps, flows, etc.) with text

Appendix B RS-232/485 Commands
B-17
The example below sets the lrec logging time to 5 minutes and the output format to long reply with text. Send: "set lrec format 01 03" Receive: "set lrec format 01 03 ok" lrec xxxx yy srec xxxx yy xxxx = number of records back yy = the number of records to return (0 to 10) These commands output the contents of the data logger's records. The output format and logging time are determined by the set lrec format and set srec format commands as described above. In the example below, the instrument reports the contents of 5 long records, starting with the 100th previous record. The logging time is set to 5 minutes and the text is being displayed. Send: "lrec 100 5" Receive: "10:15 12-28 so2 2560E+0 ppb flags 40000000 pmtv -0510 lmpv 0810 lmpi 35867 intt 30.1 rctt 45.2 pgst 0.00 flow 0.503 pres 753.4 10:20 12-28 so2 2580E+0 ppb flags 40000000 pmtv -0510 lmpv 0810 lmpi 35870 intt 30.1 rctt 45.2 pgst 0.00 flow 0.503 pres 753.4 10:25 12-28 so2 2570E+0 ppb flags 40000000 pmtv -0510 lmpv 0810 lmpi 35868 intt 30.1 rctt 45.2 pgst 0.00 flow 0.503 pres 753.4 10:30 12-28 so2 2560E+0 ppb flags 40000000 pmtv -0510 lmpv 0810 lmpi 35867 intt 30.1 rctt 45.2 pgst 0.00 flow 0.503 pres 753.4 10:35 12-28 so2 2570E+0 ppb flags 40000000 pmtv -0510 lmpv 0810 lmpi 35866 intt 30.1 rctt 45.2 pgst 0.00 flow 0.503 pres 753.4" where: pmtv = PMT Voltage lmpv = Lamp Voltage lmpi = Lamp Intensity intt = Internal Temperature rctt = Reaction Chamber Temperature pgst = Permeation Gas Temp (0.00 is shown when permeation oven is not installed) flow = Sample Flow pres = Pressure

Appendix B RS-232/485 Commands
B-18
flags This reports 8 hexadecimal digits (or flags) that represent the status of the ozonator, PMT, gas mode, and alarms. To decode the flags, each hexadecimal digit is converted to binary as shown in the figure below. It is the binary digits that define the status of each parameter. In the example below, the instrument is reporting that the flash lamp is on, that the instrument is in the span gas mode, and that the SO2 high concentration alarm is activated. Send: "flags" Receive: "flags 40028000"

Appendix B RS-232/485 Commands
B-19


C-1
APPENDIX C INTERNAL PERMEATION SPAN SOURCE
The Internal Permeation Span Source option is designed to provide a simple zero and span check. Because this option does not precisely control dilution gas flow, this option should not be used as a basis for analyzer zero and span adjustments, calibration updates or adjustment of ambient data. This option is intended as a quick, convenient check to be used between zero and span calibrations for determining analyzer malfunction or drift. Whenever there is an indication of possible analyzer drift or malfunction, a full zero and multipoint calibration (Level 1) should be performed prior to corrective action. For further information on zero, span and calibration of air pollution monitors, refer to Section 2.0.9 of the US EPA's Quality Assurance Handbook for Air Pollution Measurement Systems (Volume II).
Figure C-1. Internal Permeation Span Source Flow Schematic 57P904 The method of operation of the Model 43C Trace Level with this option can be seen by referring to Figure C-1. Energizing the valve labeled V1 shuts off the sample flow and permits the flow of zero air for analysis. When valves V1 and V2 are energized, the flow of zero air is blended with air containing SO2 from the permeation oven. This mode of operation provides the single span check feature of this option.

Appendix C Internal Permeation Span Source
C-2
SPECIFICATIONS
Temperature control Single Point 45°C Temperature stability ±0.1°C Warm-up time 1 hour (permeation device can take 24 to 48 hours to
stabilize) Carrier gas flow 70 scc/min Chamber size Accepts permeation tubes up to 9 cm in total length;
1 cm in diameter. Temperature range 10 to 30°C Physical dimensions Contained inside the Model 43C Trace Level (except
the charcoal scrubber). Power requirements 50 watts, 50/60 Hz, 120/220 VAC (in addition to the
standard Model 43C Trace Level). Weight Approximately 5 lbs. (in addition to the standard Model
43C Trace Level). Remote operation RS-232 Interface or Contact Closure

Appendix C Internal Permeation Span Source
C-3
PERMEATION TUBE INSTALLATION 1. Remove the oven cover. 2. Remove the glass chamber assembly by loosening (not removing) the knurled screw
and gently pulling the assembly upward. Completely remove from the oven. 3. Separate the glass chamber from the top assembly by twisting and gently pulling the
glass away from the top. 4. Keep the glass clean when handling the glass. 5. Place permeation tube(s) in chamber. 6. Attach the glass chamber to the top assembly by gently pushing the two together
with a slight twisting motion. 7. Replace the glass chamber assembly into the oven until top of the assembly is flush
or slightly below the top of the oven. 8. Tighten the knurled screw finger-tight. 9. Do not use tools to tighten. 10. Replace the oven cover, be sure to place the tubing and wire into the slot of cover.
COMPUTATION OF CONCENTRATIONS The computation of SO2 output level is shown below. Note that it is assumed that all devices are properly calibrated and that all flows are corrected to 25oC and 1 atm. Permeation Tube:
Where: R = permeation rate in ng/min K = constant for the specific permeant, 0.382 Qo = flow rate of gas (ml/min) into the charcoal scrubber during span mode.
Q
) K ( ) R ( = ) ppm (Output o

Appendix C Internal Permeation Span Source
C-4
OVEN TEMPERATURE CORRECTION CALIBRATION (D/A 4
The Model 43C Trace Level uses the oven temperature correction signal (D/A 4) to maintain a constant temperature in the permeation oven. Follow the procedure below to calibrate D/A 4: 1. From the Service Mode menu select Permeation Oven. 2. From the Permeation Oven menu select Cal DTOA #4. Press ENTER to set D/A 4 to
0 volts. The screen below appears. Cal DTOA #4 Screen 3. Adjust Z4 on the Digital/Analog Board until 0.000 volts is measured across pins 7
and 8 on the rear panel analog output connector. 4. Press ENTER to set D/A 4 to 10 volts. Adjust SP4 on the Digital/Analog Board until
10.000 volts is measured across pins 7 and 8. 5. Press MENU to return to the Permeation Oven menu.
PERMEATION TUBE OVEN CALIBRATION There are two general approaches that can be used to calibrate the permeation tube oven. The first is to calibrate the temperature indicator very accurately (to better than 0.02°C), and to use a permeation tube whose weight loss has been previously determined at that temperature (note, an error of about 0.1°C corresponds to an error of 1% in release rate). The second approach is to note that the thermistors used to measure temperature are interchangeable to better than ± 0.2°C. Thus a 1% resistor of the proper value (4.369 K ohm for 45°C) can be used to set the span on the Oven Controller Board. The release rate for the permeation tube is then determined by weight loss in the actual oven being used.

Appendix C Internal Permeation Span Source
C-5
Setting Measure Temperature with Water Bath 1. Unplug J3 from the Oven Controller Board. Place a 4.369 KΩ resistor across pins 3
and 4 of J3 on the Oven Controller Board. 2. From the Permeation Oven menu, select Cal Oven Thermistor. Adjust R2 on the
Oven Controller Board until the oven drive voltage is 5.000 volts. Press MENU to return to the Permeation Oven menu.
Cal Oven Thermistor Screen 3. Remove the thermistor from the permeation tube oven. Leave the thermistor
connected to the Oven Controller Board. Insert the thermistor into the water bath next to a NIST traceable thermometer. (If necessary, use an extension cable to reach).
4. Turn on the power to the water bath. Using an NIST traceable thermometer with a resolution of ± 0.01°C, adjust water bath to 45°C.
5. From the Permeation Oven menu, select Cal Gas Thermistor. Adjust R4 on the Oven Controller Board until the permeation gas temperature reading is 45°C.
Cal Gas Thermistor Screen 6. Remove thermistor from the water bath, dry, and replace into the permeation tube
oven. 7. Make sure the charcoal scrubber is connected to the ZERO bulkhead on the rear
panel. 8. Wait for the permeation gas temperature reading to stabilize.

Appendix C Internal Permeation Span Source
C-6
9. From the Permeation Oven menu, select Set Gas Temperature. Adjust R2 until the
Perm Gas reading displayed on the first line is 45.00°C. Since it takes several minutes for the permeation oven temperature to stabilize, it is best to wait 10 minutes between adjustments.
Set Gas Temperature Screen Setting Measure Temperature with an Accurately Known Oven Temperature 1. Unplug J3 from the Oven Controller Board. Place a 4.369 KΩ resistor across pins 3
and 4 of J3 on the Oven Controller Board. 2. From the Permeation Oven menu, select Cal Oven Thermistor. Adjust R2 on the
Oven Controller Board until the oven drive voltage is 5.000 volts. Press MENU to return to the Permeation Oven menu.
Cal Oven Thermistor Screen 1. Remove thermistor from J1 on the Oven Controller Board. 2. Connect a resistance of 4.369 KΩ across pins 1 and 2 of J1 (use a resistance
substitution box and an accurate meter if necessary).

Appendix C Internal Permeation Span Source
C-7
3. From the Permeation Oven menu, select Cal Gas Thermistor. Adjust R4 on the
Oven Controller Board until the permeation gas temperature reading is 45°C. Cal Gas Thermistor Screen 4. Reconnect measure thermistor. 5. Make sure the charcoal scrubber is connected to the ZERO bulkhead on the rear
panel. 6. Wait for the permeation gas temperature reading to stabilize. 7. From the Permeation Oven menu, select Set Gas Temperature. Adjust R2 until the
Perm Gas reading displayed on the first line is 45.00°C. Since it takes several minutes for the permeation oven temperature to stabilize, it is best to wait 10 minutes between adjustments.
Set Gas Temperature Screen

Appendix C Internal Permeation Span Source
C-8
DETERMINATION OF PERMEATION RATE BY WEIGHT LOSS 1. Make sure the oven has been calibrated as described above. 2. Insert the permeation tube carefully. Do not touch with fingers. 3. Turn on the Model 43C Trace Level. 4. Wait 48 to 72 hours for the permeation tube to stabilize. 5. Carefully remove the permeation tube from the oven and weigh to an accuracy of 0.1
mg. Perform this measurement as quickly as possible. 6. Replace permeation tube into the oven of the Model 43C Trace Level. 7. Repeat steps 5 and 6 after two weeks. 8. Compute the weight loss of the permeation tube from the values determined in steps
5, 6, and 7 above. 9. Repeat steps 5 to 8 until the weight loss has been determined to a precision of 1 to
2%. 10. For most accurate work, use the permeation tube in the same oven that was used to
determine the permeation tube's weight loss.
DETERMINATION OF RELEASE RATE BY USE OF TRANSFER STANDARD
1. Make sure the permeation oven temperature in the Model 43C Trace Level has been
calibrated. Also make sure that the Transfer Standard has been properly calibrated. 2. Determine the permeation rate for the permeation tube in the transfer standard, or
install a certified permeation tube. 3. Allow the permeation tubes in both instruments, Model 43C Trace Level and
Transfer Standard, to stabilize at least 48 hours. 4. Carefully calibrate the Model 43C Trace Level using the Transfer Standard. The
output of the transfer standard should be connected to the sample bulkhead on the rear panel of the Model 43C Trace Level.
5. Switch the calibrated Model 43C Trace Level into the span mode. Measure the flow rate into the ZERO bulkhead on the rear panel of the Model 43C Trace Level. Be sure that the charcoal scrubber is connected. Note the flow and the measured SO2 concentration.
6. From the flow and measured concentration, compute the permeation tube release rate.

D-1
APPENDIX D STANDARDS FOR TRACE LEVEL ANALYZERS
The development of ultra-sensitive analytical analyzers for the measurement of trace quantities of pollutants such as NO, NO2, or SO2, has raised a number of questions concerning proper calibration procedures and equipment. Analyzers that in theory have detection limits below 1 ppb, may not in practice be useful due to inadequate and/or inaccurate calibration practices. Thermo Environmental Instruments Inc. (TEI) has in its development of Trace Level instrumentation used the same basic principles for calibration as for standard analyzers. However, enhanced emphasis on the zero air supply used for dilution of standard gases and for establishing a zero background signal is made. Chemiluminescence NO/NOx and fluorescence SO2 analyzers (when properly designed) have been shown in numerous research studies and compliance monitoring situations to be inherently linear over a wide dynamic range. Calibration is normally done using first a zero gas then a span gas generated by dilution of a calibration gas cylinder. Dilution is done by dynamic mixing of accurately known flows of span gas and zero gas. For Trace level analyzers, mass flow controllers that are NIST traceable are required. Nitric oxide and sulfur dioxide calibration standards between 1 and 10 ppm are readily available in specially treated cylinders, and have been shown to have excellent stability and accuracy. NIST traceable mass flow controllers with full scale ranges from 20 sccm to 20,000 sccm are also readily available. It is therefore relatively straight forward to generate span gas concentrations from below 1 ppb to 10 ppb assuming a suitable zero gas source is used. For example:
FlowTotal FlowNOx ][NO = ][NO SPAN GENERATED
Assuming a calibration cylinder of 1 ppm, NO flow of 10 sccm, and a total flow of 10,000 sccm, allows generation of a span concentration of 1 ppb. Using the specifications of the mass flow controllers and calibration cylinder, this concentration should be accurate to within 5%. Multi-point concentrations from 0.5 ppb to 10 ppb may be similarly generated, establishing the linearity of the particular analyzer being calibrated. TEI believes it is not necessary to generate concentrations below these levels since the fundamental linearity of the instrumentation has been demonstrated. If however, the zero air used for dilution and for establishing baseline conditions has impurity levels greater than several tenths of a ppb, the accuracy of the analyzer being calibrated may be severely jeopardized. A 0.5 ppb impurity level is equivalent to a 10% relative error for a 5 ppb concentration.

Appendix D Standards for Trace Level Analyzers
D-2
Ultra-zero ambient monitoring gases are available from gas suppliers, however, the typical analyses for NOx and SO2 impurities only guarantee levels below 5 ppb. In practice, TEI personnel as well as other users of Trace Level equipment have found these gases to be at least an order of magnitude better than what is guaranteed, and therefore are adequate for most purposes. Non-reactive and diffusion resistant regulators are required, and as the cylinder pressure falls below 500 psig, the integrity of the zero gas becomes more in question. Rather than relying on cylinder sources for zero air, TEI routinely uses zero air generated by brute force, that is, by compression, chemical scrubbing and reaction. Ambient air that has been compressed and pressurized to give an output of about 25 psig is dried by passing the air through a heatless air dryer (for example) and then sent through a series of chemical reactors and/or scrubbers. Normally these include indicating silica gel, Purafil, activated charcoal, and a fine (5 micron) particulate filter. When first used, this brute force approach actually can generate enhanced impurity levels for NOx and SO2, as these gases desorb from the chemical reactors. However after 24 to 48 hours of continuous operation, impurity levels will generally fall and stabilize below detection limits for the Trace Level analyzers. It is critical when using this type of zero air source to always maintain flow through the system. If flow is interrupted, even for a short period, a reconditioning time of up to 24 hours may be required. In conclusion, tests by the United States Environmental Protection Agency, Tennessee Valley Authority, Battelle National Labs, and TEI's Engineering Department have demonstrated that Trace Level analyzers are readily calibrated at the low concentration levels required for sub-ambient monitoring. Although extra care is required, primarily in zero air generation, users familiar with normal compliance requirements should be able with minimal additional effort to obtain valid concentration data.

E-1
APPENDIX E SCHEMATICS
This appendix contains the schematics for the standard and optional printed circuit boards contained in the Model 43C Trace Level. Always turn off the instrument and unplug the power cord before removing any printed circuit board. For more information about appropriate safety precautions, see Chapter 7, “Servicing.” A description of each board can be found in Chapter 8, “Theory of Operation.”
PC Board Schematic No. Part No. Page
Motherboard 57P958 9829 E-2
Pushbutton Board 1 93P906 9950 E-3
Pushbutton Board 2 93P906 9952 E-3
Processor Board 93P907 9837 E-4
Analog/Digital Board 57P963 8943 E-5
Digital/Analog Board 93P908 9839 E-6
Power Supply Board 57P959 8949 E-7
Trigger Pak 57P908 8392 E-8
Flash Intensity Board 57P905 8755 E-9
Flasher Supply Board 57P967 10996 E-10
Input Board 57P962 8951 E-11
Temperature Control Board 57P903 8765 E-12
C-Link Board 93P914 9843 E-13
4-20 mA Outputs (optional) 93P912 9954 E-14
Input/Output Board (optional) 93P913 9956 E-15
Perm Oven Controller (optional) 57P960 8953 E-16
Rear Connector Interface Board 93P915 9903 E-17
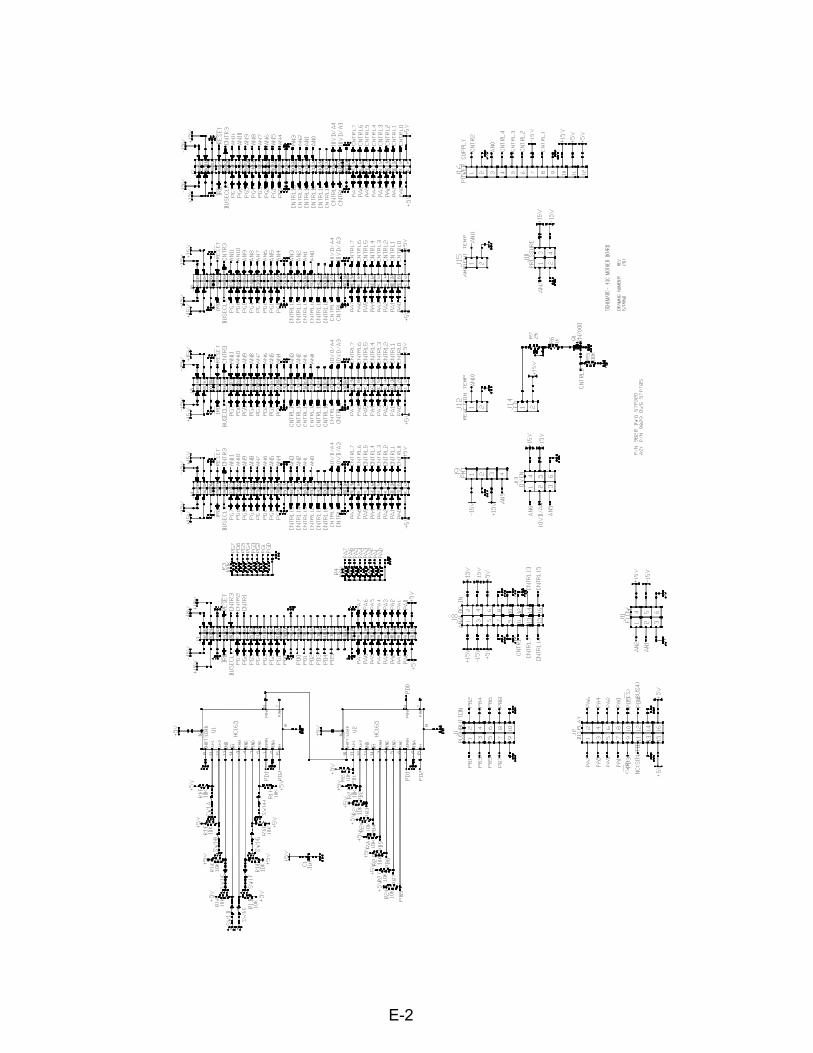
E-2

E-3

E-4

E-5

E-6

E-7

E-8
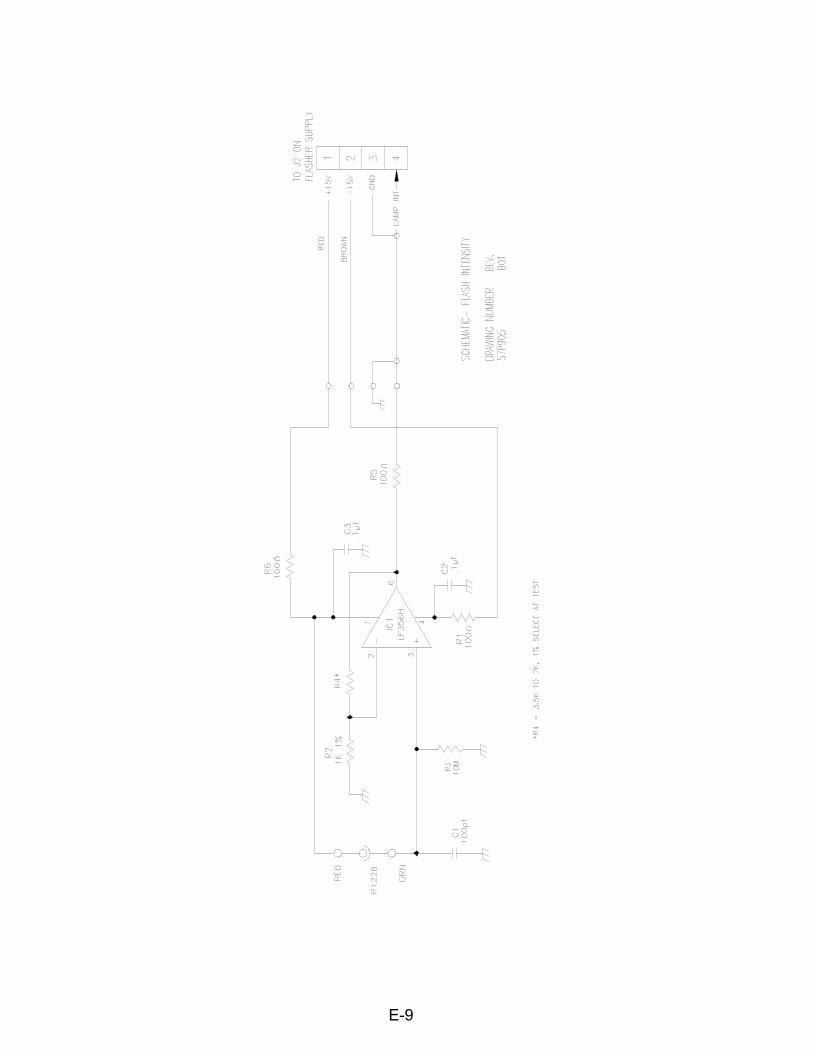
E-9

E-10

E-11

E-12

E-13

E-14

E-15

E-16

E-17


APPENDIX F
PUMP MAINTENANCE