Embed Size (px)
Citation preview
Stand Development
Monitoring
Stefan Zeglen
Coast Forest Region
Ministry of Forests and Range

Background
Under FRPA, forest health is part of the Timber
Value.
As part of the Forest and Range Evaluation
Program (FREP), forest health was asked to
come up with questions regarding monitoring.
Our question focussed on the free-growing (FG)
assessment.
Is the FG assessment an accurate predictor of
future stand productivity and are assumptions
about stand performance valid?
Are free-growing stands meeting expectations?

Why free growing?
Free-growing milestone is the most fundamental
result that licensees are held accountable to.
Since inception in 1987, over 2.5 million ha* of
Crown forest land have been declared.
After declaration, stands may not be assessed
again until age 60 when they are eligible for VRI
sampling.
No MFR-led post-FG stand monitoring.
* 850,000 ha of licensee obligation ground
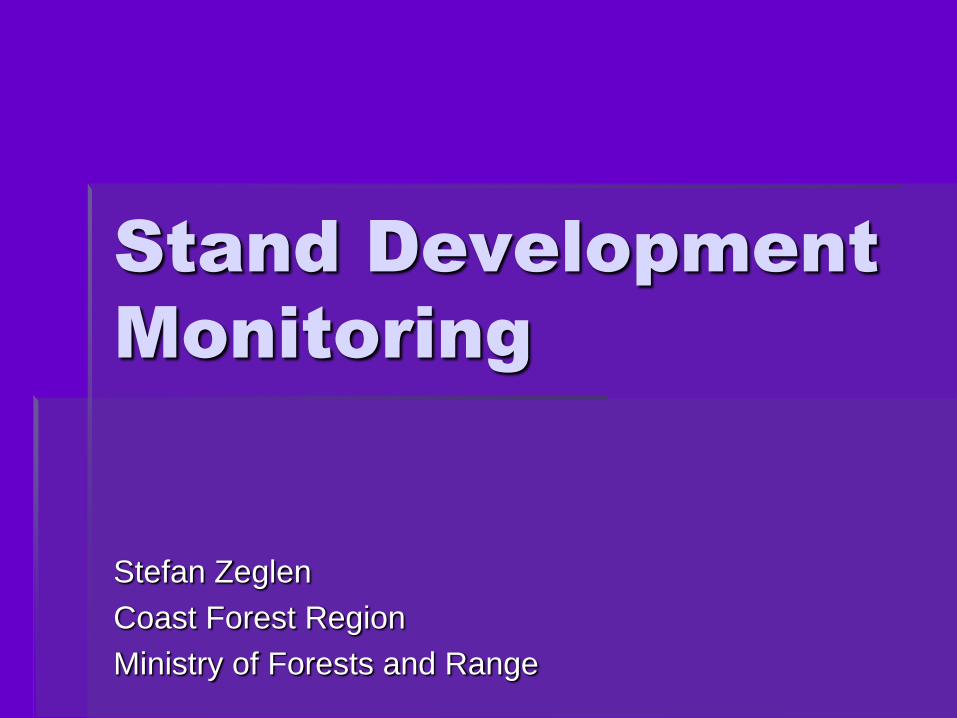
Questions
1. Have losses from pests increased since FG?
2. Do TIPSY projections using FG attributes differ
from those using current attributes?
3. Do TIPSY volume projections to age 80 differ
when using FG versus current attributes?
4. Has the leading species changed since
declaration (inventory label)?
5. Does site index differ between the FG estimate
and the growth intercept or SIBEC estimate?
6. Have stocking levels changed significantly
since declaration?
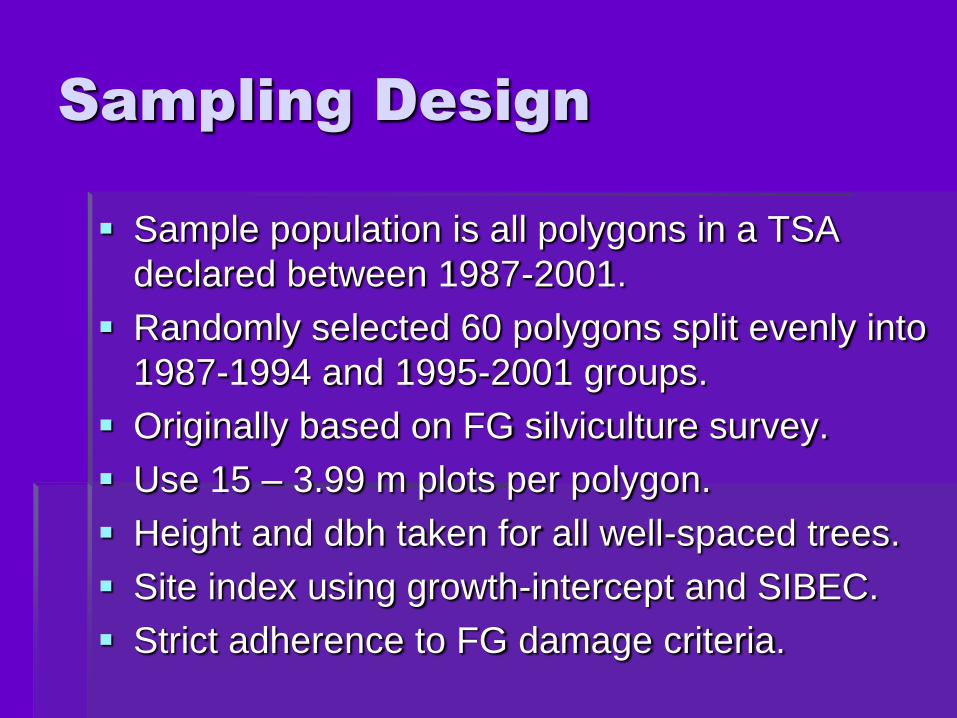
Sampling Design
Sample population is all polygons in a TSA
declared between 1987-2001.
Randomly selected 60 polygons split evenly into
1987-1994 and 1995-2001 groups.
Originally based on FG silviculture survey.
Use 15 – 3.99 m plots per polygon.
Height and dbh taken for all well-spaced trees.
Site index using growth-intercept and SIBEC.
Strict adherence to FG damage criteria.
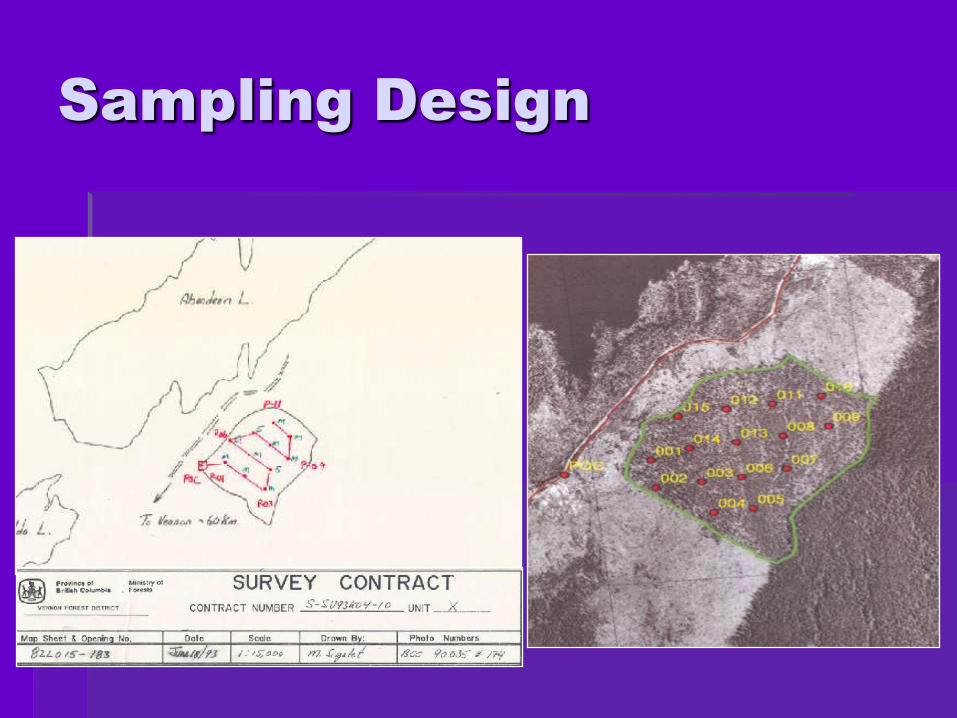
Sampling Design

Turn this...

...into this82M033-8231 SILVICULTURE INFORMATION
Plot# Total
Trees
Total
Conifers
WS/FG
Pw
WS/FG
FD
WS/FG
PL
WS/FG
CW
WS/FG
SX
WS/FG
HW
WS/FG
BL
Total
WS
Total
WS(M)
Total FG Total
FG(M)
Silv. Ht.
(cm)
Silv. Age Ldr. Ht.
(cm)
Plant
Spots
Prep
Spots
SI Height
(m)
SI Age SI
Value
SI
SIBEC
SI SP
1 38 29 2 5 5 2 2 790 18 14.2 31 21 21 Fdi
2 12 4 3 3 0 0 220 24 12.5 22 26.0 21 Pli
3 0 0 0 0 0 0 8.5 19 19.5 21 Pli HISTORY
4 14 6 0 0 0 0 10.3 20 20 21 Pli B80
5 18 16 2 2 2 2 2 1250 24 14.5 23 26.5 21 Fdi
6 30 30 5 1 6 6 6 6 1000 24 11.2 21 21 21 Pli L77
7 2 1 0 0 0 0 9.8 19 21.5 21 Fdi
8 20 11 1 4 4 1 1 700 21 10.3 22 20 21 Fdi P84
9 5 5 0 0 0 0 8.1 18 19 21 Fdi
10 12 9 2 1 4 4 3 3 880 21 8.8 18 19 21 Fdi
TOTAL 151 111 0 3 10 1 0 0 0 24 24 14 14 4840 132 0 0 0 108.2 213 213.5
SPH 3020 2220 0 60 200 20 0 0 0 480 480 280 280 807 22 0 0 0 11 21 21
Year 2008 2008 (m) 1993 PEST INFO SUMMARY
Total Trees/ha 3020
Pest
Code
Total
trees
Total
conifers
Live
affected
Dead
affected
Host spp
comp
% Total
trees
affected
%
Conifers
affected
% Host trees
affected
%
Affecte
d at
DeclaraTotal Conifers/ha 2220 VP 151 111 3 1 1.0 2.6% 3.6% 2.6% 1.0%
Countable Conifers/ha 0 DRA 151 111 2 13 1.0 9.1% 12.1% 9.1% -
Total Well Spaced/ha 480 480 VT 151 111 4 1.0 2.6% 3.5% 2.6% -
Total FG/ha 280 280 AB 151 111 1 1.0 0.7% 0.9% 0.7% -
Plantable Spots/ha 0 DSA 151 111 1 0.4 0.7% 0.9% 1.7% -
Preparable Spots 0 IWW 151 111 1 0.4 0.7% 0.9% 1.6% -
SI (m) 21.4 PDT 151 111 1 0.1 0.7% 0.9% 6.6%
IBM 151 111 2 2 0.4 2.6% 3.5% 6.4%
SILVICULTURE LABEL 151 111 0.0% 0.0% #DIV/0!
Sp. % of Sil. L 10 21
Pli 71 Age Ht (cm) SI (m) WS FG
Fdi 21 22 807 21.4 480 280
Sx 0
Cw 7
Bl 0
Hw 0
Pw 0
INVENTORY INFORMATION
Plot
1
2
3
4
5
6
7
8
9
10
Pli30 Fdi20 Ac20 Ep20 Cw10 - 24/21 - 10/7.5 - 21/I - 80 - 3020(08)
Ep70 Ac10 Cw10 Fdi10 - 25/25 - 12/12 - na - 60 - 3020(08)
Pli50 At20 Fdi10 Cw10 Ep10 - 24/25 - 8.5/15 - 19.5/I - 30 - 3020(08)
Pli60 At30 Fdi10 - 24/18 - 10/8 - 20/I - 70 - 3020(08)
Pli40 Fdi20 At10 Cw10 Ep10 Ac10 - 24/23 - 10.1/9.8 - 21.5/I - 70 - 3020(08)
Fdi40 At30 Pli20 Cw10 - 24/20 - 8/11 - 19/I - 45 - 3020(08)
Fdi40 Pli30 At30 - 22/24 - 7/9 - 18/I - 50 - 3020(08)
Pli40 Fdi30 Cw20 At10 - 24/24 - 12/12 - 27.5/I - 70 - 3020(08)
Cw40 Pli30 Fdi30 - 15/24 - 5/11 - 21/I - 75 - 3020(08)
Pli40 At20 Cw20 Fdi20 - 24/25 - 11/15 - 22.5/I - 55 - 3020(08)
Ep20 Ac20 At20 Pli20 Cw10 Fdi10 - 10/25 - 7/15 - na - 70 - 3020(08)
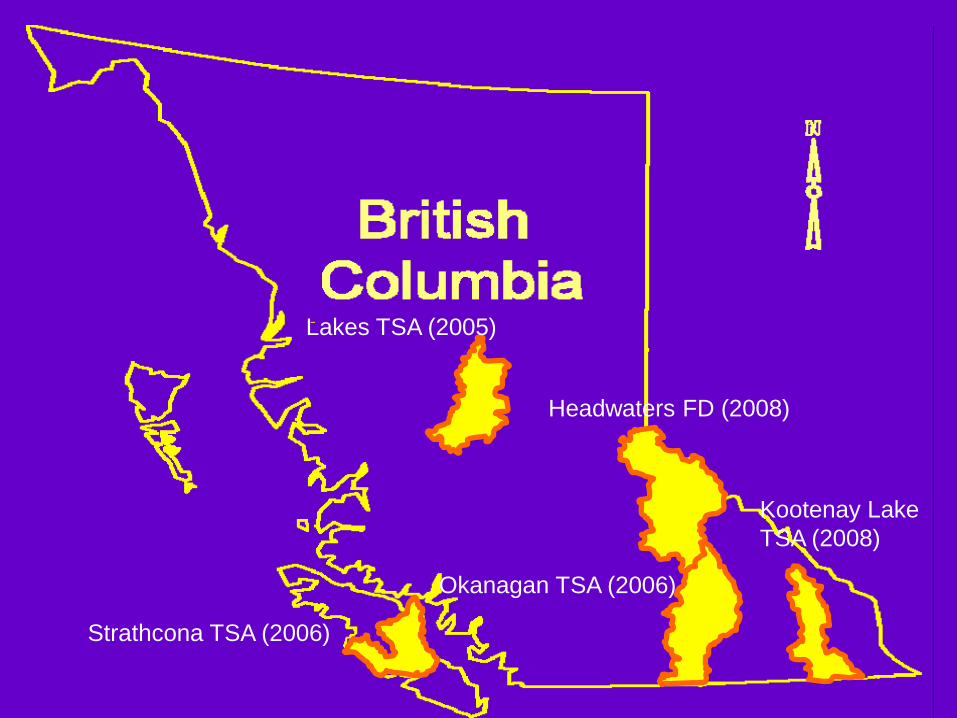
Headwaters FD (2008)
Kootenay Lake
TSA (2008)
Lakes TSA (2005)
Strathcona TSA (2006)
Okanagan TSA (2006)

Results from the Lakes
Report released and
available at
http://www.for.gov.bc.ca/hf
p/frep/site_files/reports/FR
EP_Report_13.pdf.
Lists seven
recommendations.

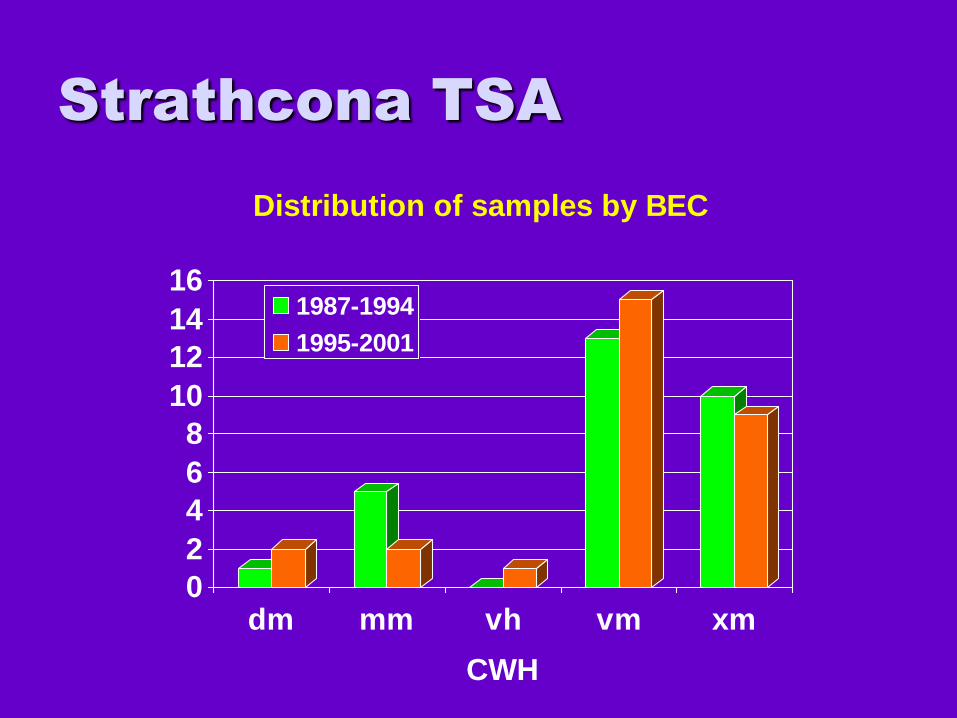
Strathcona TSA
0
2
4
6
8
10
12
14
16
dm mm vh vm xm
CWH
Distribution of samples by BEC
1987-1994
1995-2001
Strathcona TSA
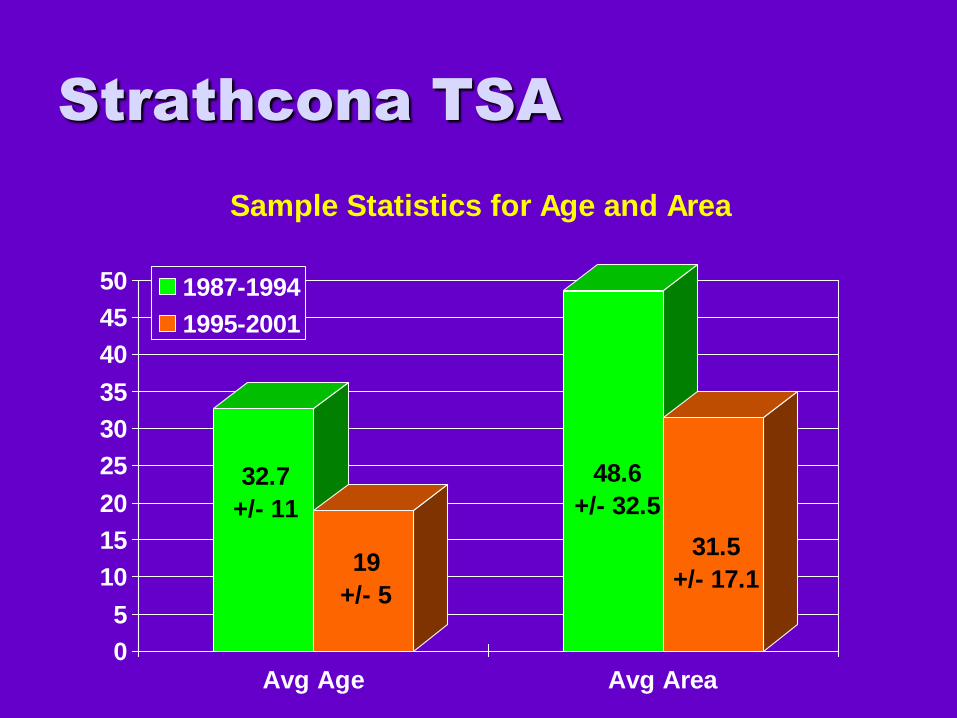
32.7
+/- 11
19
+/- 5
48.6
+/- 32.5
31.5
+/- 17.1
0
5
10
15
20
25
30
35
40
45
50
Avg Age Avg Area
Sample Statistics for Age and Area
1987-1994
1995-2001

Strathcona TSA
0
5
10
15
20
25
Treated Not treated
Distribution of Samples by Treatment History
1987-1994
1995-2001
Strathcona TSA
0%
10%
20%
30%
40%
50%
60%
70%
80%
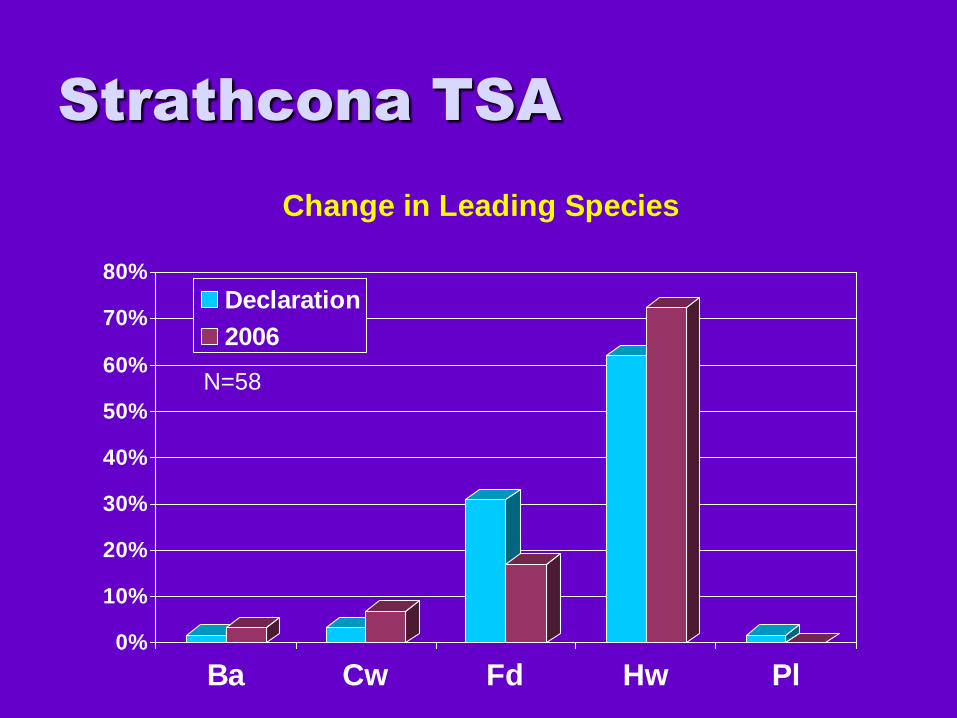
Ba Cw Fd Hw Pl
Change in Leading Species
Declaration
2006
N=58

Strathcona TSA
0%
5%
10%
15%
20%
25%
30%
35%
40%
45%
Ba Cw Fd Hw P Ss Dec
Change in Secondary Species
Declaration
2006
N=58

Strathcona TSA
0
100
200
300
400
500
600
700
800
900
Avg WS density
(FG)
Avg WS density
(2006)
Avg FG density
(FG)
Avg FG density
(2006)
Comparison of WS and FG Densities
1987-1994
1995-2001
Strathcona TSA
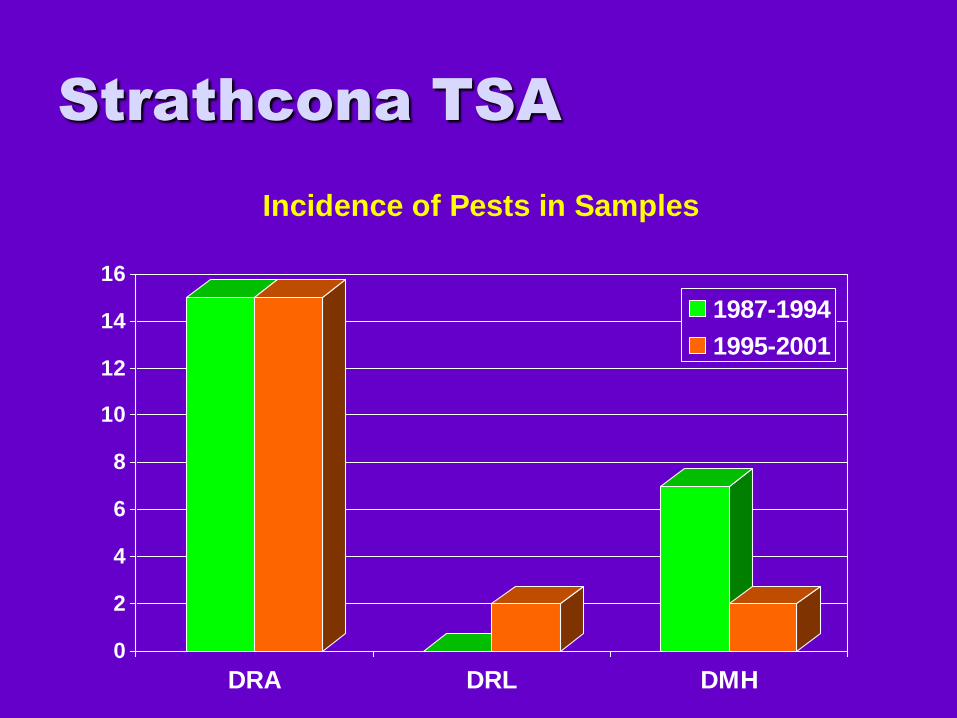
0
2
4
6
8
10
12
14
16
DRA DRL DMH
Incidence of Pests in Samples
1987-1994
1995-2001

Strathcona TSA
2.8% 1.8% 1.0% 1.6%
0%
10%
20%
30%
40%
50%
60%
70%
80%
% Inf Stands Avg Inf (87-94) Avg Inf (95-01)
Incidence of Armillaria in Samples
Hw-leading
Fd-leading
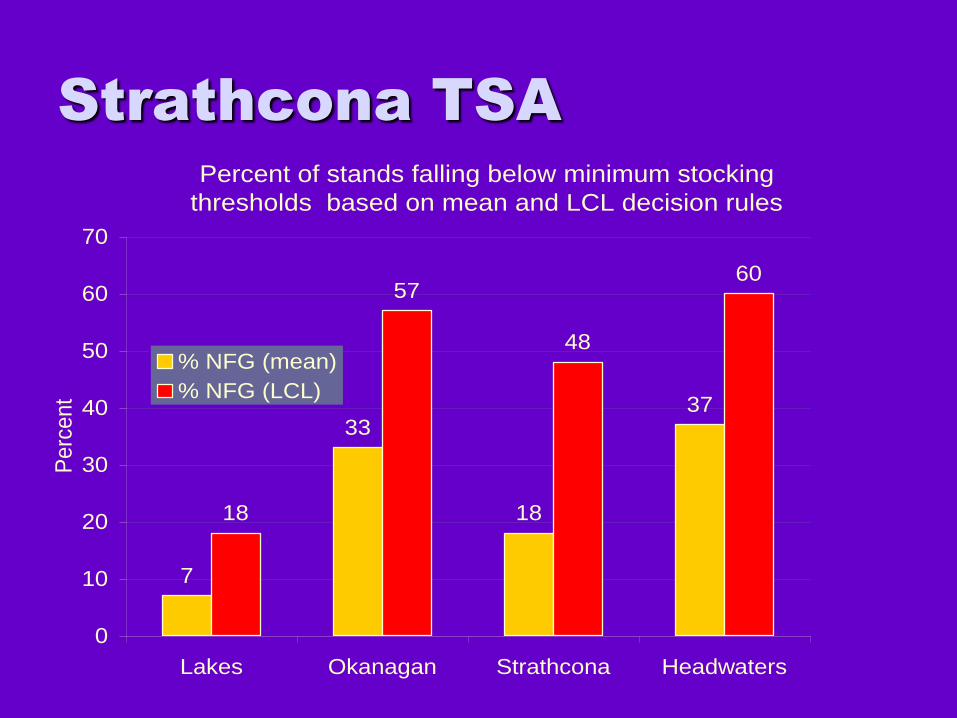
Strathcona TSA
Percent of stands falling below minimum stocking
thresholds based on mean and LCL decision rules
7
33
18
37
18
57
48
60
0
10
20
30
40
50
60
70
Lakes Okanagan Strathcona Headwaters
Pe
rcen
t
% NFG (mean)
% NFG (LCL)
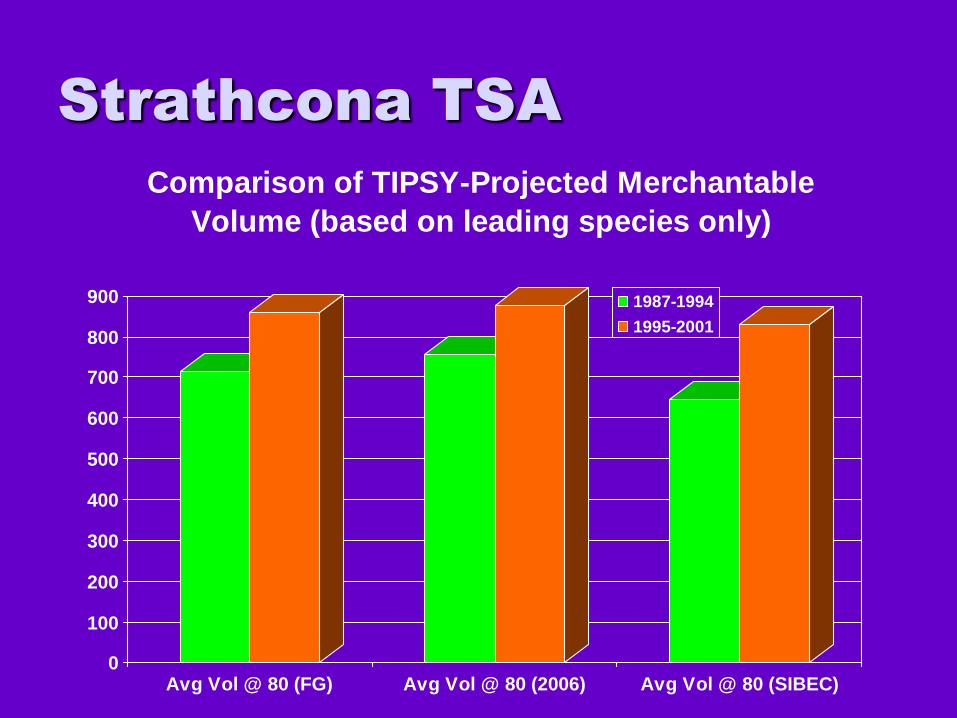
Strathcona TSA
0
100
200
300
400
500
600
700
800
900
Avg Vol @ 80 (FG) Avg Vol @ 80 (2006) Avg Vol @ 80 (SIBEC)
Comparison of TIPSY-Projected Merchantable
Volume (based on leading species only)
1987-1994
1995-2001

Reality Check
Salmon Arm Workshop – October 2008
This is not a
free-growing
survey
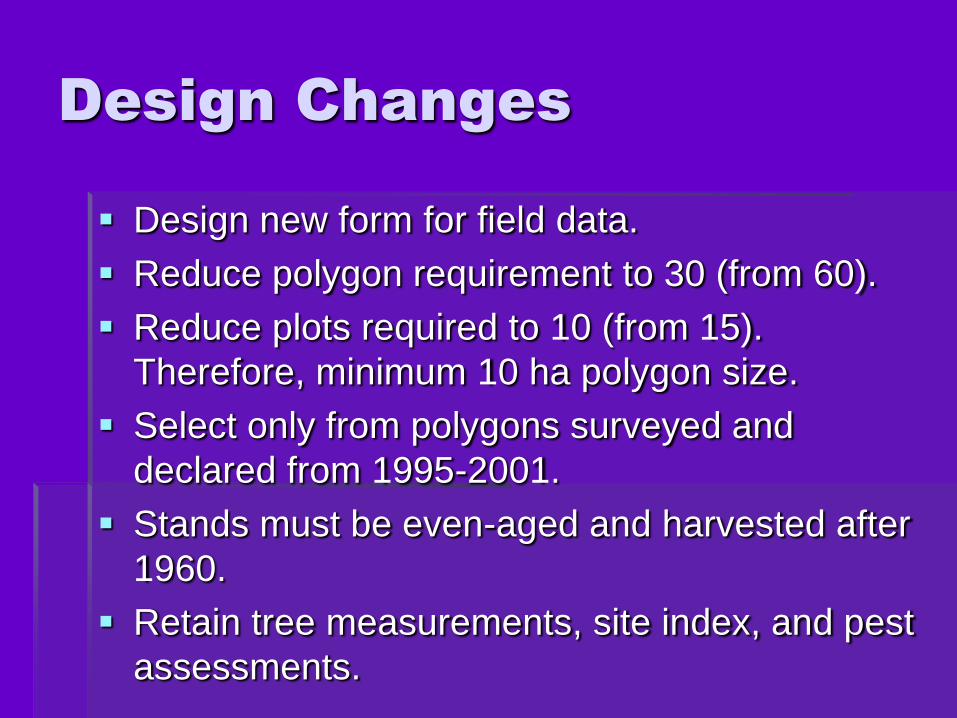
Design Changes
Design new form for field data.
Reduce polygon requirement to 30 (from 60).
Reduce plots required to 10 (from 15).
Therefore, minimum 10 ha polygon size.
Select only from polygons surveyed and
declared from 1995-2001.
Stands must be even-aged and harvested after
1960.
Retain tree measurements, site index, and pest
assessments.

Design Changes

Next Steps
Redraft protocol document to reflect procedures.
Field test protocol in six districts in 2009.
Design “seamless” data handling from field to
IMS and RESULTS.
Development of electronic field data capture.
Ability to input into FREP IMS and update
RESULTS (new mid-rotation milestone?)
Ensure access to FAIB for inventory updates and
TSR modelling and for districts to answer specific
inquiries.
Acknowledgements
Alex Woods and Erin Havard (NIFR)
David Rusch (Rot Rooters)
Nigel Ross (Westfor)
Campbell River Forest District
Peter Bradford and Frank Barber (FREP)
Dave Weaver, Heather MacLennan, Harry
Kope, Kristine Sacenieks, Steve Baumber
Happy Birthday, Chuck.