Embed Size (px)
Citation preview
American Economic Review 101 (December 2011): 3427–3439http://www.aeaweb.org/articles.php?doi=10.1257/aer.101.7.3427
3427
The canonical bargaining game in economics is the ultimatum game, played by tens of thousands of students around the world over the past three decades. In the ultimatum game, first studied by Werner Güth, Rolf Schmittberger, and Bernd Schwarze (1982), the “proposer” proposes how to split a pie between herself and a “responder.” Then the responder decides whether to accept or reject this proposal. If the responder accepts, then the proposal is implemented; otherwise, both players receive nothing. For players motivated purely by monetary considerations, the stan-dard subgame-perfect equilibrium solution implies that the proposer receives almost all of the money. In this manner, the ultimatum game represents a stylized glimpse into the underpinnings of decision making at the heart of economics. For instance, a monopolist setting a price, a monopsonist setting a wage, or, more generally, any bargaining situation that has a take it or leave it element.
The ultimatum game is frequently presented as the quintessential game that dis-plays the importance of nonmonetary components of utility in driving behavior away from predictions of standard economic theory. The usual findings are that proposers often make offers that are close to an equal split of the pie, and that low offers are frequently rejected by responders. The behavior of the responders in par-ticular has been puzzling to economists, and different models of social preferences have been put forward to explain such actions. Clearly, rejecting a positive offer in the ultimatum game involves a monetary cost, and whether behavior changes when this cost increases is an immediate question. Many people’s intuition is that, while responders will be willing to reject unequal offers when their cost is low, a large enough offer should make it too costly to reject. Many of us might be willing to reject an offer of 1 percent of ten dollars; yet how many of us would reject 1 percent of ten million dollars?
Notwithstanding this intuition, one reliable result in the literature is that respon-dents do not markedly change their behavior as the stakes increase (Robert Slonim and Alvin E. Roth 1998; Lisa A. Cameron 1999; Bertrand Munier and Costin Zaharia 2002). Cameron (1999) reports, for example, that “the persistence of rejections at high stakes does however raise the question of how high the stakes need to be to
Stakes Matter in Ultimatum Games†
By Steffen Andersen, Seda Ertaç, Uri Gneezy, Moshe Hoffman, and John A. List*
* Andersen: Department of Economics, Copenhagen Business School, Porcelænshaven 16A, 1, DK-2000 Frederiksberg, Denmark (e-mail: [email protected]); Ertaç: Koc University, Rumeli Feneri Yolu, Sariyer, Istanbul 34450 Turkey (e-mail: [email protected]); Gneezy: Rady School of Management, University of California, San Diego, 9500 Gilman Drive, La Jolla, CA 92093 (e-mail: [email protected]); Hoffman: Rady School of Management, University of California, San Diego, CA 92093 (e-mail: [email protected]); List: Department of Economics, University of Chicago, 1126 E. 59th St., Chicago, IL 60637, and NBER (e-mail: [email protected]). Thanks to Daron Acemoglu, Alvin Roth, and Robert Slonim for comments on a previous version of this study.
† To view additional materials, visit the article page at http://www.aeaweb.org/articles.php?doi=10.1257/aer.101.7.3427.
3428 THE AMERICAN ECONOMIC REVIEW DECEMBER 2011
complete the reversion to Nash equilibrium.” Indeed, it is an open empirical ques-tion whether people respond at all to liberal stakes changes in bargaining, trust, or gift-exchange games conducted in the laboratory—that is, whether liberal changes in stakes have any bearing on actions over any stakes range in this class of games (see, e.g., Steven D. Levitt and List 2007). This is an important debate because where economics provides its most basic predictions revolves around how people should respond to changes in incentives—pecuniary or nonpecuniary (Gneezy and Aldo Rustichini 2000)—not whether subjects have fairness, spite, or altruistic proclivities.
In terms of the ultimatum game, one challenging issue for the literature is the lack of information on how responders react to low proportional offers in high stakes games. This is because proposers stubbornly insist on offering nontrivial fractions of the pie when playing the game, presenting difficulties in testing the response to unfair offers in high stakes games. For example, only four of 250 offers were less than 20 percent of the pie in the high stakes treatment in Slonim and Roth (1998). Likewise, in Cameron (1999) only two of 29 offers were less than 20 per-cent of the pie. This also causes difficulty in measuring stake effects with great precision. Consider Slonim and Roth (1998), which to date represents the premier study exploring ultimatum games over considerable stakes ranges. If one considers data across all stakes levels, Slonim and Roth observe only ten offers out of 820 offers that are less than 10 percent of the pie, with none of these offers in the high stakes treatment, making it impossible to measure stake effects for such low offers. In Cameron’s data, only five out of 178 offers are below 10 percent of the pie, and only one of these is in the high stakes condition.
In this paper, we overcome these challenges by designing an experiment that admits sufficient information on low offers and simultaneously provides large varia-tion in stakes. The setting we use is poor villages in Northeast India. Within these villages, we execute an experiment that is unique in two ways. First, we increase the stakes by a factor of 1,000, which is considerably higher than those used in earlier experiments—permitting us to explore bargains from 20 rupees to 20,000 rupees (1.6 hours of work to 1,600 hours of work). Second, by use of specific language in the experimental instructions, our design successfully elicits low offers from pro-posers over all stakes levels, making it possible to measure stake effects precisely over large stakes changes.
We report several results. First, our design worked across all stakes levels: the median offer was 20 percent of the pie, and the 95 percent confidence interval was 2.5 percent–50 percent of the pie. Interestingly, while the offer proportions are signifi-cantly lower in the higher stakes treatments compared to the lowest stakes treatment, the actual amount offered increases as stakes increase. Second, among responders we find a considerable effect of stakes: while at low stakes we observe rejections in the range of the extant literature, in the highest stakes condition we observe only a single rejection out of 24 responders. Third, we also explore how changes in wealth (earned during the experiment) affect behavior. The potential importance of wealth effects is frequently mentioned in multiround laboratory experiments; however, it is difficult to disentangle the effect of wealth from learning in such settings. We assign subjects randomly into one of two conditions: those who start with zero wealth, and those who have nonzero wealth at the time of participation in the ultimatum game.
3429ANDERsEN ET AL.: sTAkEs MATTER IN ULTIMATUM GAMEsVOL. 101 NO. 7
We do not find a significant wealth effect for proposers or responders, although we do find that rejection rates are lower among subjects with no initial wealth, conso-nant with a small wealth effect in the intuitive direction.
The remainder of our study proceeds as follows. The next section describes our design. Section II contains a discussion of the experimental results. Section III concludes.
I. Experimental Design and Procedures
The study was conducted in eight villages at different locations in the state of Meghalaya in Northeast India. A total of 458 responders and an equal number of proposers participated in the experiment. Each participant played the game only once—either as a proposer or as a responder. Proposers and responders were ran-domized into one of eight treatment cells, displayed in Table 1. Table 1 shows our 2 × 4 factorial design: two wealth conditions by four stakes levels. A total of 136 subjects were assigned to the no-wealth condition, whereas 322 subjects had posi-tive wealth when they played the ultimatum game. Our “No-wealth” subjects par-ticipated only in the ultimatum game, and had earnings from only this game. Our “Wealth” subjects had earnings from unrelated prior tasks.1
We varied stakes from 20 to 20,000 Indian rupees, in four cells: 20, 200, 2,000, and 20,000 Indian rupees. At the time of the experiment, these amounts roughly corresponded to $0.41, $4.1, $41, and $410.2 In the villages where the experiments were conducted, 100 rupees represented roughly a day’s wage for the average vil-lager. This choice of stakes permits us to bracket the literature and go beyond the stakes level used to explore our major hypotheses of interest. For example, Slonim and Roth’s (1998) highest stakes level is 62.5 hours of wages, with the lower stakes levels being 12.5 and 2.5 hours of work. If we take a day’s work to be eight hours, our middling stakes conditions of 200 rupees would be 16 hours of work, and 2,000 rupees is 160 hours of work, which effectively brackets Slonim and Roth’s (1998) stakes conditions. We should also note that this is a conservative estimate, since
1 These earnings ranged from 37 to 1,280 rupees, with a mean of 493 rupees. Using actual wealth rather than a wealth dummy does not change the conclusions of our analysis.
2 The total amount paid to participants was approximately $16,000; the cost of the high stakes treatment was $12,000, which played a role in limiting our sample size in this treatment cell.
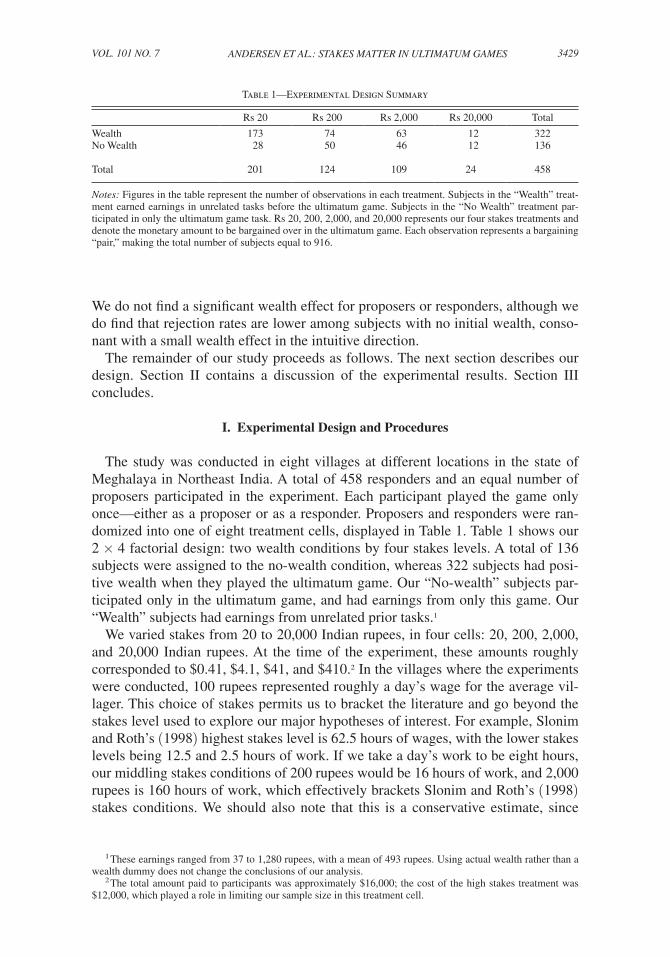
Table 1—Experimental Design Summary
Rs 20 Rs 200 Rs 2,000 Rs 20,000 Total
Wealth 173 74 63 12 322No Wealth 28 50 46 12 136
Total 201 124 109 24 458
Notes: Figures in the table represent the number of observations in each treatment. Subjects in the “Wealth” treat-ment earned earnings in unrelated tasks before the ultimatum game. Subjects in the “No Wealth” treatment par-ticipated in only the ultimatum game task. Rs 20, 200, 2,000, and 20,000 represents our four stakes treatments and denote the monetary amount to be bargained over in the ultimatum game. Each observation represents a bargaining “pair,” making the total number of subjects equal to 916.
3430 THE AMERICAN ECONOMIC REVIEW DECEMBER 2011
most villages have some level of underemployment. In a related survey we con-ducted in these villages, the average reported yearly income was Rs 17,000, so our large stakes treatment is a little over a year’s income, and Rs 2,000 make nearly one and a half month’s income. Similarly, Cameron’s (1999) highest stakes treat-ment corresponds to three months of expenditures. If we assume expenditures equal income, this level of stakes computes to roughly 600 hours of work, which is effec-tively bracketed by our stakes.
Table 1 contains the sample sizes in each of the eight treatments. Although work-ing within a poor community permits our experimental budget to cover many more high stakes observations, this alone might not tremendously help the power of test-ing the null hypothesis of interest if little information is obtained over small rela-tive offers. Of course, this is exactly what is necessary to test how stakes affect the response to unfair offers and explore whether individuals are stake sensitive over the entire offer domain.
To elicit a significant number of low offers, we used standard ultimatum game instructions with one twist. We added a specific message in the experimental instruc-tions for proposers.3
Notice that if the responder’s goal is to earn as much money as possible from the experiment, he/she should accept any offer that gives him/her positive earnings, no matter how low. This is because the alternative is to reject, in which case he/she will not receive any earnings. If the responder is expected to behave in this way and accept any positive offer, a proposer should offer the minimum possible amount to the responder in order to leave the experiment with as much money as possible. That is, if the responder that you are matched with aims to earn as much money as possible, he/she should accept any offer that is greater than zero. Given this, making the offer that gives the lowest possible earnings to the responder will allow you to leave the experi-ment with as much money possible.
This frame informs proposers that the rational decision, if both parties aim to maximize earnings, is to offer the lowest possible amount (see the Appendix for the verbatim instructions4). In light of the experimental results on the power of mes-sages, cues, and framing, we expected this addition to shift the offer distribution downwards for every stakes conditions. This would effectively permit us exogenous variation that includes considerable mass at low offers. The instructions used for responders were standard, and taken directly from the experimental literature.
Before moving to a discussion of the experimental results, we should briefly men-tion a few other experimental particulars. First, each subject played the game only once—either making an offer or responding to an offer. Second, subjects responded to offers that were made by proposers from the same village, except for 45 respond-ers in the 20-rupee condition, who were presented with offers that were made by proposers from another village, to which we returned to make proper payment to avoid deception. The response to these offers was not different from the offers made by proposers from the same village, which makes sense since none of the responders
3 An alternative approach could have been to use the strategy method in which responders are asked to state their choices for every possible proposal. We chose not to use the strategy method because we believe such an approach potentially places subjects on an artificial margin. It remains an open empirical question as to whether the strategy method induces behavioral differences in the ultimatum game (see Jordi Brandts and Gary Charness 2009).
4 The actual instructions were given in the local language, Khasi.
3431ANDERsEN ET AL.: sTAkEs MATTER IN ULTIMATUM GAMEsVOL. 101 NO. 7
were told of the geographic location of their partner proposer. We therefore pool the data in our analysis below.
II. Results
A. Proposer Behavior
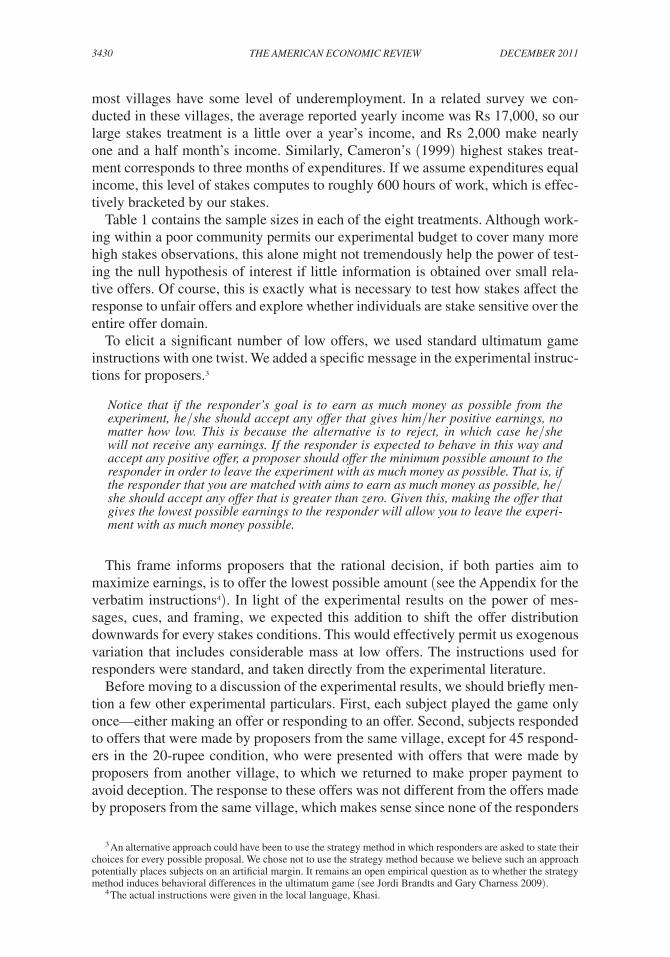
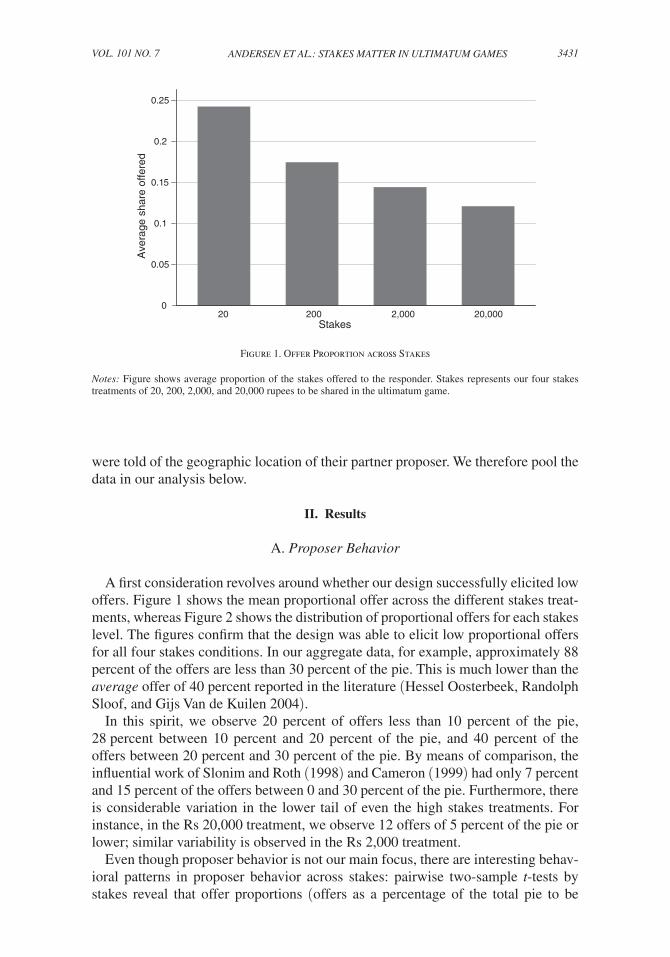
A first consideration revolves around whether our design successfully elicited low offers. Figure 1 shows the mean proportional offer across the different stakes treat-ments, whereas Figure 2 shows the distribution of proportional offers for each stakes level. The figures confirm that the design was able to elicit low proportional offers for all four stakes conditions. In our aggregate data, for example, approximately 88 percent of the offers are less than 30 percent of the pie. This is much lower than the average offer of 40 percent reported in the literature (Hessel Oosterbeek, Randolph Sloof, and Gijs Van de Kuilen 2004).
In this spirit, we observe 20 percent of offers less than 10 percent of the pie, 28 percent between 10 percent and 20 percent of the pie, and 40 percent of the offers between 20 percent and 30 percent of the pie. By means of comparison, the influential work of Slonim and Roth (1998) and Cameron (1999) had only 7 percent and 15 percent of the offers between 0 and 30 percent of the pie. Furthermore, there is considerable variation in the lower tail of even the high stakes treatments. For instance, in the Rs 20,000 treatment, we observe 12 offers of 5 percent of the pie or lower; similar variability is observed in the Rs 2,000 treatment.
Even though proposer behavior is not our main focus, there are interesting behav-ioral patterns in proposer behavior across stakes: pairwise two-sample t-tests by stakes reveal that offer proportions (offers as a percentage of the total pie to be
Figure 1. Offer Proportion across Stakes
Notes: Figure shows average proportion of the stakes offered to the responder. Stakes represents our four stakes treatments of 20, 200, 2,000, and 20,000 rupees to be shared in the ultimatum game.
0
0.05
0.1
0.15
0.2
0.25
20 200 2,000 20,000
Ave
rage
sha
re o
ffere
d
Stakes
3432 THE AMERICAN ECONOMIC REVIEW DECEMBER 2011
divided) are significantly lower in the higher stakes treatments compared to the 20-rupee case ( p = 0.000 for Rs 20 versus Rs 200, p = 0.000 for Rs 200 versus Rs 2,000, and p = 0.0002 for Rs 20 versus Rs 20,000). This finding is consistent with the literature, although the negative marginal effect that we obtain is larger than what was found in previous work (see Oosterbeek, Sloof, and Van de Kuilen 2004 for a review). Our results reveal that offer proportions are declining significantly with the first and second tenfold increase in stakes. The third tenfold increase only marginally, and insignificantly, lowers the mean offer proportion. Our results also show that the actual amount offered increases as stakes increase, from a median of Rs 5 in the 20 rupee case, to 30, 200, and Rs 1,500 in the 200, 2,000, and 20,000 cases, respectively. Proposer wealth has an insignificant effect on the proportion offered, at all stakes levels.
B. Responder Behavior
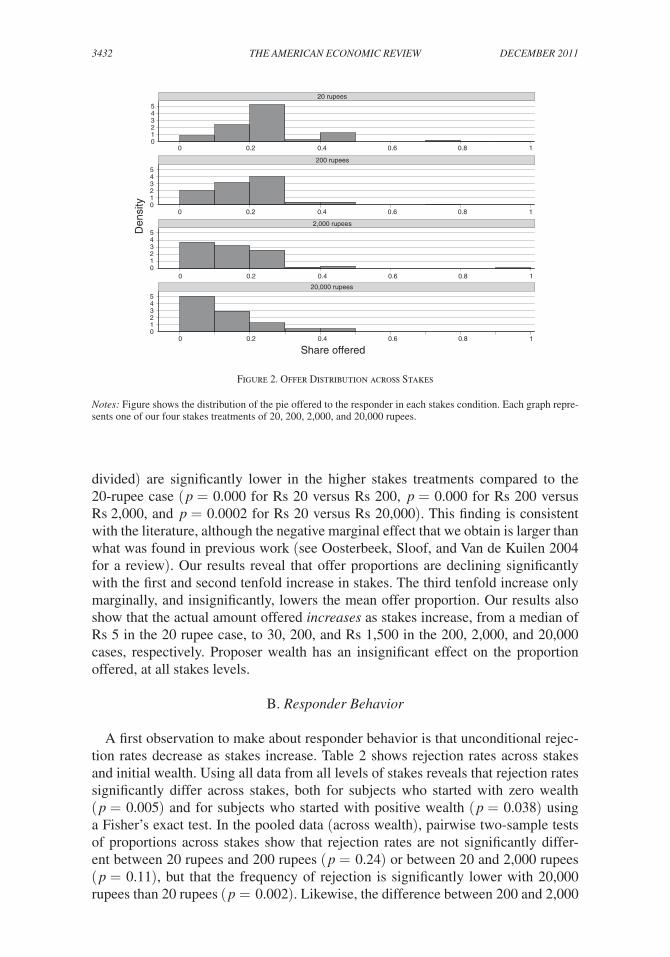
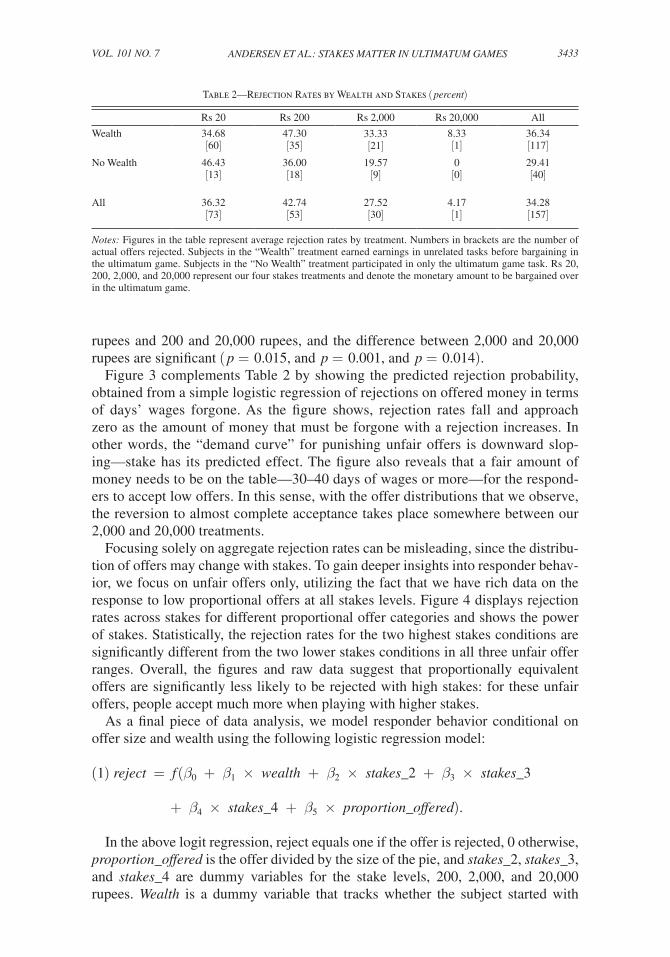
A first observation to make about responder behavior is that unconditional rejec-tion rates decrease as stakes increase. Table 2 shows rejection rates across stakes and initial wealth. Using all data from all levels of stakes reveals that rejection rates significantly differ across stakes, both for subjects who started with zero wealth ( p = 0.005) and for subjects who started with positive wealth ( p = 0.038) using a Fisher’s exact test. In the pooled data (across wealth), pairwise two-sample tests of proportions across stakes show that rejection rates are not significantly differ-ent between 20 rupees and 200 rupees ( p = 0.24) or between 20 and 2,000 rupees ( p = 0.11), but that the frequency of rejection is significantly lower with 20,000 rupees than 20 rupees ( p = 0.002). Likewise, the difference between 200 and 2,000
Figure 2. Offer Distribution across Stakes
Notes: Figure shows the distribution of the pie offered to the responder in each stakes condition. Each graph repre-sents one of our four stakes treatments of 20, 200, 2,000, and 20,000 rupees.
0 0.2 0.4 0.6 0.8 1
20 rupees
200 rupees
2,000 rupees
20,000 rupees
Den
sity
Share offered
543210
543210
543210
543210
0 0.2 0.4 0.6 0.8 1
0 0.2 0.4 0.6 0.8 1
0 0.2 0.4 0.6 0.8 1
3433ANDERsEN ET AL.: sTAkEs MATTER IN ULTIMATUM GAMEsVOL. 101 NO. 7
rupees and 200 and 20,000 rupees, and the difference between 2,000 and 20,000 rupees are significant ( p = 0.015, and p = 0.001, and p = 0.014).
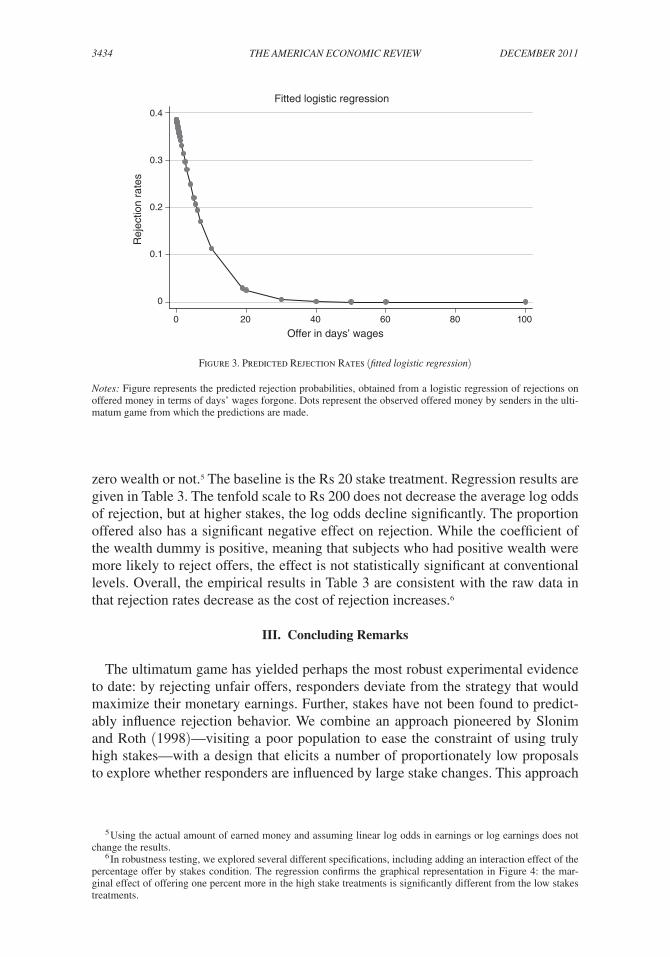
Figure 3 complements Table 2 by showing the predicted rejection probability, obtained from a simple logistic regression of rejections on offered money in terms of days’ wages forgone. As the figure shows, rejection rates fall and approach zero as the amount of money that must be forgone with a rejection increases. In other words, the “demand curve” for punishing unfair offers is downward slop-ing—stake has its predicted effect. The figure also reveals that a fair amount of money needs to be on the table—30–40 days of wages or more—for the respond-ers to accept low offers. In this sense, with the offer distributions that we observe, the reversion to almost complete acceptance takes place somewhere between our 2,000 and 20,000 treatments.
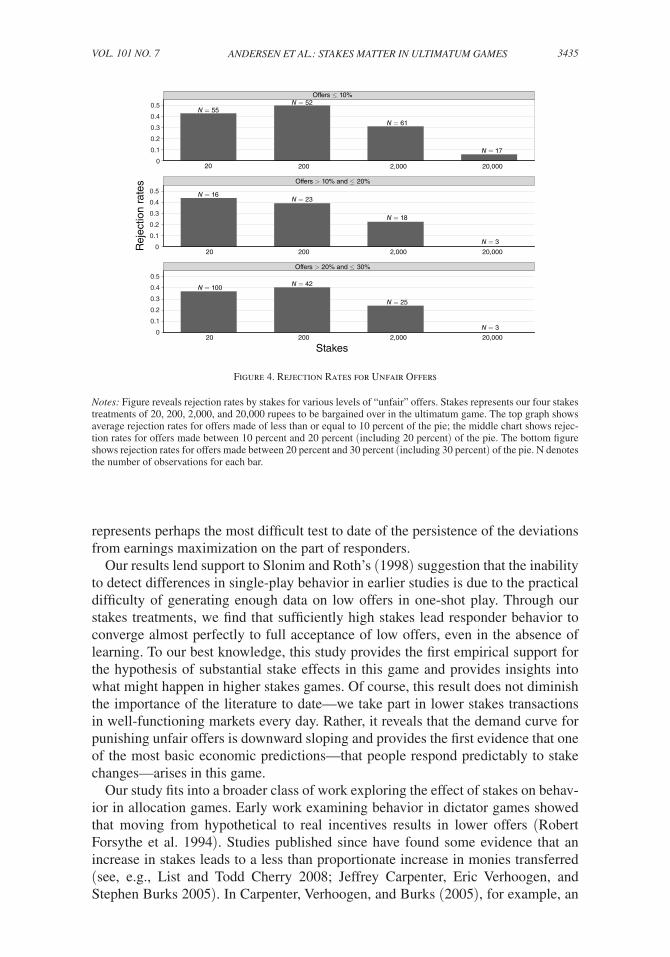
Focusing solely on aggregate rejection rates can be misleading, since the distribu-tion of offers may change with stakes. To gain deeper insights into responder behav-ior, we focus on unfair offers only, utilizing the fact that we have rich data on the response to low proportional offers at all stakes levels. Figure 4 displays rejection rates across stakes for different proportional offer categories and shows the power of stakes. Statistically, the rejection rates for the two highest stakes conditions are significantly different from the two lower stakes conditions in all three unfair offer ranges. Overall, the figures and raw data suggest that proportionally equivalent offers are significantly less likely to be rejected with high stakes: for these unfair offers, people accept much more when playing with higher stakes.
As a final piece of data analysis, we model responder behavior conditional on offer size and wealth using the following logistic regression model:
(1) reject = f (β0 + β1 × wealth + β2 × stakes_2 + β3 × stakes_3
+ β4 × stakes_4 + β5 × proportion_offered).
In the above logit regression, reject equals one if the offer is rejected, 0 otherwise, proportion_offered is the offer divided by the size of the pie, and stakes_2, stakes_3, and stakes_4 are dummy variables for the stake levels, 200, 2,000, and 20,000 rupees. Wealth is a dummy variable that tracks whether the subject started with
Table 2—Rejection Rates by Wealth and Stakes ( percent)
Rs 20 Rs 200 Rs 2,000 Rs 20,000 All
Wealth 34.68 [60]
47.30[35]
33.33[21]
8.33[1]
36.34 [117]
No Wealth 46.43 [13]
36.00[18]
19.57[9]
0[0]
29.41 [40]
All 36.32 [73]
42.74[53]
27.52[30]
4.17 [1]
34.28 [157]
Notes: Figures in the table represent average rejection rates by treatment. Numbers in brackets are the number of actual offers rejected. Subjects in the “Wealth” treatment earned earnings in unrelated tasks before bargaining in the ultimatum game. Subjects in the “No Wealth” treatment participated in only the ultimatum game task. Rs 20, 200, 2,000, and 20,000 represent our four stakes treatments and denote the monetary amount to be bargained over in the ultimatum game.
3434 THE AMERICAN ECONOMIC REVIEW DECEMBER 2011
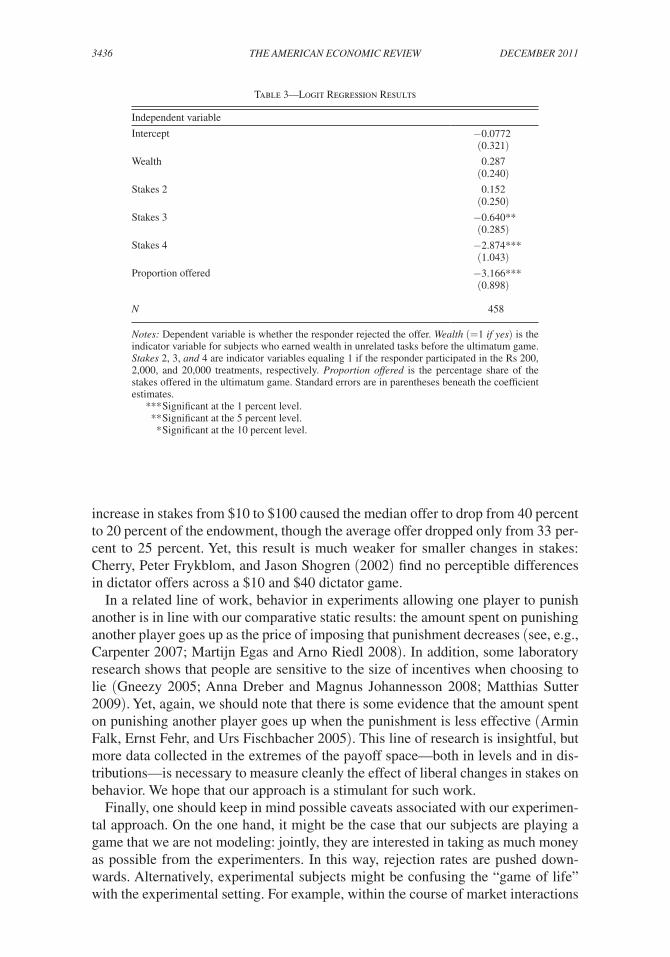
zero wealth or not.5 The baseline is the Rs 20 stake treatment. Regression results are given in Table 3. The tenfold scale to Rs 200 does not decrease the average log odds of rejection, but at higher stakes, the log odds decline significantly. The proportion offered also has a significant negative effect on rejection. While the coefficient of the wealth dummy is positive, meaning that subjects who had positive wealth were more likely to reject offers, the effect is not statistically significant at conventional levels. Overall, the empirical results in Table 3 are consistent with the raw data in that rejection rates decrease as the cost of rejection increases.6
III. Concluding Remarks
The ultimatum game has yielded perhaps the most robust experimental evidence to date: by rejecting unfair offers, responders deviate from the strategy that would maximize their monetary earnings. Further, stakes have not been found to predict-ably influence rejection behavior. We combine an approach pioneered by Slonim and Roth (1998)—visiting a poor population to ease the constraint of using truly high stakes—with a design that elicits a number of proportionately low proposals to explore whether responders are influenced by large stake changes. This approach
5 Using the actual amount of earned money and assuming linear log odds in earnings or log earnings does not change the results.
6 In robustness testing, we explored several different specifications, including adding an interaction effect of the percentage offer by stakes condition. The regression confirms the graphical representation in Figure 4: the mar-ginal effect of offering one percent more in the high stake treatments is significantly different from the low stakes treatments.
Figure 3. Predicted Rejection Rates (fitted logistic regression)
Notes: Figure represents the predicted rejection probabilities, obtained from a logistic regression of rejections on offered money in terms of days’ wages forgone. Dots represent the observed offered money by senders in the ulti-matum game from which the predictions are made.
Rej
ectio
n ra
tes
0 20 40 60 80 100
Offer in days’ wages
Fitted logistic regression0.4
0.3
0.2
0.1
0
3435ANDERsEN ET AL.: sTAkEs MATTER IN ULTIMATUM GAMEsVOL. 101 NO. 7
represents perhaps the most difficult test to date of the persistence of the deviations from earnings maximization on the part of responders.
Our results lend support to Slonim and Roth’s (1998) suggestion that the inability to detect differences in single-play behavior in earlier studies is due to the practical difficulty of generating enough data on low offers in one-shot play. Through our stakes treatments, we find that sufficiently high stakes lead responder behavior to converge almost perfectly to full acceptance of low offers, even in the absence of learning. To our best knowledge, this study provides the first empirical support for the hypothesis of substantial stake effects in this game and provides insights into what might happen in higher stakes games. Of course, this result does not diminish the importance of the literature to date—we take part in lower stakes transactions in well-functioning markets every day. Rather, it reveals that the demand curve for punishing unfair offers is downward sloping and provides the first evidence that one of the most basic economic predictions—that people respond predictably to stake changes—arises in this game.
Our study fits into a broader class of work exploring the effect of stakes on behav-ior in allocation games. Early work examining behavior in dictator games showed that moving from hypothetical to real incentives results in lower offers (Robert Forsythe et al. 1994). Studies published since have found some evidence that an increase in stakes leads to a less than proportionate increase in monies transferred (see, e.g., List and Todd Cherry 2008; Jeffrey Carpenter, Eric Verhoogen, and Stephen Burks 2005). In Carpenter, Verhoogen, and Burks (2005), for example, an
Figure 4. Rejection Rates for Unfair Offers
Notes: Figure reveals rejection rates by stakes for various levels of “unfair” offers. Stakes represents our four stakes treatments of 20, 200, 2,000, and 20,000 rupees to be bargained over in the ultimatum game. The top graph shows average rejection rates for offers made of less than or equal to 10 percent of the pie; the middle chart shows rejec-tion rates for offers made between 10 percent and 20 percent (including 20 percent) of the pie. The bottom figure shows rejection rates for offers made between 20 percent and 30 percent (including 30 percent) of the pie. N denotes the number of observations for each bar.
0.5
0.4
0.3
0.2
0.1
0
20
N = 55N = 52
N = 61
N = 17
200 2,000 20,000
Offers ≤ 10%
20 200 2,000 20,000
Offers > 10% and ≤ 20%
20 200 2,000 20,000
Rej
ectio
n ra
tes
Stakes
0.5
0.4
0.3
0.2
0.1
0
0.5
0.4
0.3
0.2
0.1
0
Offers > 20% and ≤ 30%
N = 16N = 23
N = 18
N = 3
N = 100N = 42
N = 25
N = 3
3436 THE AMERICAN ECONOMIC REVIEW DECEMBER 2011
increase in stakes from $10 to $100 caused the median offer to drop from 40 percent to 20 percent of the endowment, though the average offer dropped only from 33 per-cent to 25 percent. Yet, this result is much weaker for smaller changes in stakes: Cherry, Peter Frykblom, and Jason Shogren (2002) find no perceptible differences in dictator offers across a $10 and $40 dictator game.
In a related line of work, behavior in experiments allowing one player to punish another is in line with our comparative static results: the amount spent on punishing another player goes up as the price of imposing that punishment decreases (see, e.g., Carpenter 2007; Martijn Egas and Arno Riedl 2008). In addition, some laboratory research shows that people are sensitive to the size of incentives when choosing to lie (Gneezy 2005; Anna Dreber and Magnus Johannesson 2008; Matthias Sutter 2009). Yet, again, we should note that there is some evidence that the amount spent on punishing another player goes up when the punishment is less effective (Armin Falk, Ernst Fehr, and Urs Fischbacher 2005). This line of research is insightful, but more data collected in the extremes of the payoff space—both in levels and in dis-tributions—is necessary to measure cleanly the effect of liberal changes in stakes on behavior. We hope that our approach is a stimulant for such work.
Finally, one should keep in mind possible caveats associated with our experimen-tal approach. On the one hand, it might be the case that our subjects are playing a game that we are not modeling: jointly, they are interested in taking as much money as possible from the experimenters. In this way, rejection rates are pushed down-wards. Alternatively, experimental subjects might be confusing the “game of life” with the experimental setting. For example, within the course of market interactions
Table 3—Logit Regression Results
Independent variable
Intercept −0.0772(0.321)
Wealth 0.287(0.240)
Stakes 2 0.152(0.250)
Stakes 3 −0.640**(0.285)
Stakes 4 −2.874***(1.043)
Proportion offered −3.166***(0.898)
N 458
Notes: Dependent variable is whether the responder rejected the offer. Wealth (=1 if yes) is the indicator variable for subjects who earned wealth in unrelated tasks before the ultimatum game. stakes 2, 3, and 4 are indicator variables equaling 1 if the responder participated in the Rs 200, 2,000, and 20,000 treatments, respectively. Proportion offered is the percentage share of the stakes offered in the ultimatum game. Standard errors are in parentheses beneath the coefficient estimates.
*** Significant at the 1 percent level. ** Significant at the 5 percent level. * Significant at the 10 percent level.
3437ANDERsEN ET AL.: sTAkEs MATTER IN ULTIMATUM GAMEsVOL. 101 NO. 7
in the “extralab” world, there is almost always a future or a reputation at stake, in particular in small villages. In the case of the ultimatum game, such confusion may push participants toward rejecting low offers, because such offers are rejected auto-matically in the field, and this behavior spills over into the lab.
While we believe that such insights hold merit when measuring levels of outcome variables, our experimental approach is designed to mitigate such factors. First, our design revolves around measuring comparative static effects over liberal changes in stakes. That is, we are less concerned about the levels of outcome measures; rather we focus our attention on the treatment effects of stakes and wealth. Second, we used eight distinct villages in our data gathering to avoid explicitly the chance of having the village effects interact with the treatment effects. Since data across vil-lages reveal similar behavioral patterns, we believe that our treatment effects apply more broadly. Yet, of course, future replication studies should explore whether and to what extent our design choices influenced our empirical results.
Appendix A
INSTRUCTIONS FOR PROPOSERS:Welcome to this study of decision-making. The experiment will take about
15 minutes. The instructions are simple, and if you follow them carefully, you can earn a considerable amount of money. All the money you earn is yours to keep, and will be paid to you, in cash, in private, after the experiment ends. Your confidential-ity is assured.
In this experiment, you have been assigned the role of “proposer.” You have been randomly matched with another participant who will be in the role of “responder.” Your earnings will depend on your decisions, as well as on the decisions of the responder.
You will be asked to propose a split of a total of ____ Rupees between yourself and the responder. That is, you will make an offer to the responder that specifies how much of the ____ Rupees you will receive and how much of the _____ Rupees he/she will receive.
The amount that your offer specifies for yourself can be anything from 0 to ____Rupees. Your earnings in the experiment will depend on whether or not the responder accepts your offer. If he/she accepts your offer, both you and the responder receive the amounts specified in your (accepted) offer. If he/she rejects your offer, both you and the responder will receive zero earnings for this experiment.
Notice that if the responder’s goal is to earn as much money as possible from the experiment, he/she should accept any offer that gives him/her positive earnings, no matter how low. This is because the alternative is to reject, in which case he/she will not receive any earnings. If the responder is expected to behave in this way and accept any positive offer, a proposer should offer the minimum possible amount to the responder in order to leave the experiment with as much money as possible. That is, if the responder that you are matched with aims to earn as much money as pos-sible, he/she should accept any offer that is greater than zero. Given this, making the offer that gives the lowest possible earnings to the responder will allow you to leave the experiment with as much money possible.
3438 THE AMERICAN ECONOMIC REVIEW DECEMBER 2011
Now, please tell us your proposed split of the ___ Rupees between yourself and the responder.
INSTRUCTIONS FOR RESPONDERS:Welcome to this study of decision-making. The experiment will take about
15 minutes. The instructions are simple, and if you follow them carefully, you can earn a considerable amount of money. All the money you earn is yours to keep, and will be paid to you, in cash, in private, after the experiment ends. Your confidential-ity is assured. In this experiment, you have been assigned the role of “responder.” You have been randomly matched with another participant who is in the role of the “proposer.” Your earnings will depend on your decisions, as well as on the decision of the proposer.
The proposer has been asked to propose a split of ____ Rupees between him/her and you. That is, the proposer has made an offer that specifies how much of the total ____ Rupees you will receive and how much of the _____ Rupees he/she will receive.
You can choose either to accept or to reject this offer. If you accept the offer, both you and the proposer receive the amounts specified in the offer. If you reject the offer, both you and the proposer will receive zero earnings for this experiment.
The proposer has offered that out of the total amount of ____ Rupees, you receive ____ Rupees and he/she receives ____ Rupees.
Now, please tell us if you accept or decline this offer by the proposer.
REFERENCES
Andersen, Steffen, Seda Ertac, Uri Gneezy, Moshe Hoffman, and John A. List. 2011. “Stakes Mat-ter in Ultimatum Games: Dataset.” American Economic Review. http://www.aeaweb.org/articles.php?doi=10.1257/aer.101.7.3427.
Brandts, Jordi, and Gary Charness. 2009. “The Strategy Method: A Survey of Experimental Evi-dence.” http://www.asr.uab.cat/asr/docs/brandts/strategy_101509.pdf.
Cameron, Lisa A. 1999. “Raising the Stakes in the Ultimatum Game: Experimental Evidence from Indonesia.” Economic Inquiry, 37(1): 47–59.
Carpenter, Jeffrey P. 2007. “The Demand for Punishment.” Journal of Economic Behavior and Orga-nization, 62(4): 522–42.
Carpenter, Jeffrey P., Eric Verhoogen, and Stephen Burks. 2005. “The Effect of Stakes in Distribution Experiments.” Economics Letters, 86(3): 393–98.
Cherry, Todd L., Peter Frykblom, and Jason F. Shogren. 2002. “Hardnose the Dictator.” American Economic Review, 92(4): 1218-21.
Dreber, Anna, and Magnus Johannesson. 2008. “Gender Differences in Deception.” Economics Let-ters, 99(1): 197–99.
Egas, Martijn, and Arno Riedl. 2008. “The Economics of Altruistic Punishment and the Maintenance of Cooperation,” Proceedings of the Royal society London B Biological sciences 275, 871–78.
Falk, Armin, Ernst Fehr, and Urs Fischbacher. 2005. “Driving Forces Behind Informal Sanctions.” Econometrica, 73(6): 2017–30.
Forsythe, Robert, Joel L. Horowitz, N. E. Savin, and Martin Sefton. 1994. “Fairness in Simple Bar-gaining Experiments.” Games and Economic Behavior, 6(3): 347–69.
Gneezy, Uri. 2005. “Deception: The Role of Consequences.” American Economic Review, 95(1): 384–94.
Gneezy, Uri, and Aldo Rustichini. 2000. “Pay Enough or Don’t Pay at All.” Quarterly Journal of Eco-nomics, 115(3): 791–810.
Güth, Werner, Rolf Schmittberger, and Bernd Schwarze. 1982. “An Experimental Analysis of Ultima-tum Bargaining.” Journal of Economic Behavior and Organization, 3(4): 367–88.

3439ANDERsEN ET AL.: sTAkEs MATTER IN ULTIMATUM GAMEsVOL. 101 NO. 7
Levitt, Steven D., and John A. List. 2007. “What Do Laboratory Experiments Measuring Social Prefer-ences Reveal About the Real World?” Journal of Economic Perspectives, 21(2): 153–74.
List, John A., and Todd L. Cherry. 2008. “Examining the Role of Fairness in High Stakes Allocation Decisions.” Journal of Economic Behavior and Organization, 65(1): 1–8.
Munier, Bertrand, and Costin Zaharia. 2002. “High Stakes and Acceptance Behavior in Ultimatum Bargaining: A Contribution from an International Experiment.” Theory and Decision, 53(3): 187–207.
Oosterbeek, Hessel, Randolph Sloof, and Gijs van de Kuilen. 2004. “Cultural Differences in Ultima-tum Game Experiments: Evidence from a Meta–Analysis.” Experimental Economics, 7(2): 171–88.
Slonim, Robert, and Alvin E. Roth. 1998. “Learning in High Stakes Ultimatum Games: An Experiment in the Slovak Republic.” Econometrica, 66(3): 569–96.
Sutter, Matthias. 2009. “Deception through Telling the Truth?! Experimental Evidence from Individu-als and Teams.” Economic Journal, 119(534): 47–60.