Embed Size (px)
Citation preview

Stage 3 CKD Co‐morbidities: How to Evaluate & Treat Secondary Hyperparathyroidism &
Anemia
Andrea Easom MA, MNSc, APN, FNP‐BC, CNN‐NP
Instructor, COM, Nephrology Division
University of Arkansas for Medical Sciences
Objectives
• Discuss the relationship between CKD, CV disease and vitamin D deficiency and treatment options to manage Vitamin D deficiency and secondary hyperparathyroidism
• Discuss diagnosis and treatment of CKD related anemia.
• Evaluate treatment goals for CKD anemia in light of black box warnings

CVD Mortality Markedly Increased in ESRD
Foley RN et al. Am J Kidney Dis. 1998;32(suppl 3):S112–S119.
• CVD mortality 10–20 times higher in ESRD than the general population• 120 times higher for ESRD patients aged 25 to 34
Dialysis maleDialysis femaleDialysis blackDialysis white
GP maleGP femaleGP blackGP white
Ann
ual M
orta
lity,
%
Age, years25–34 35–44 45–54 55–64 65–74 75–84 >85
100
10
1
0.1
0.01
GP = General population.
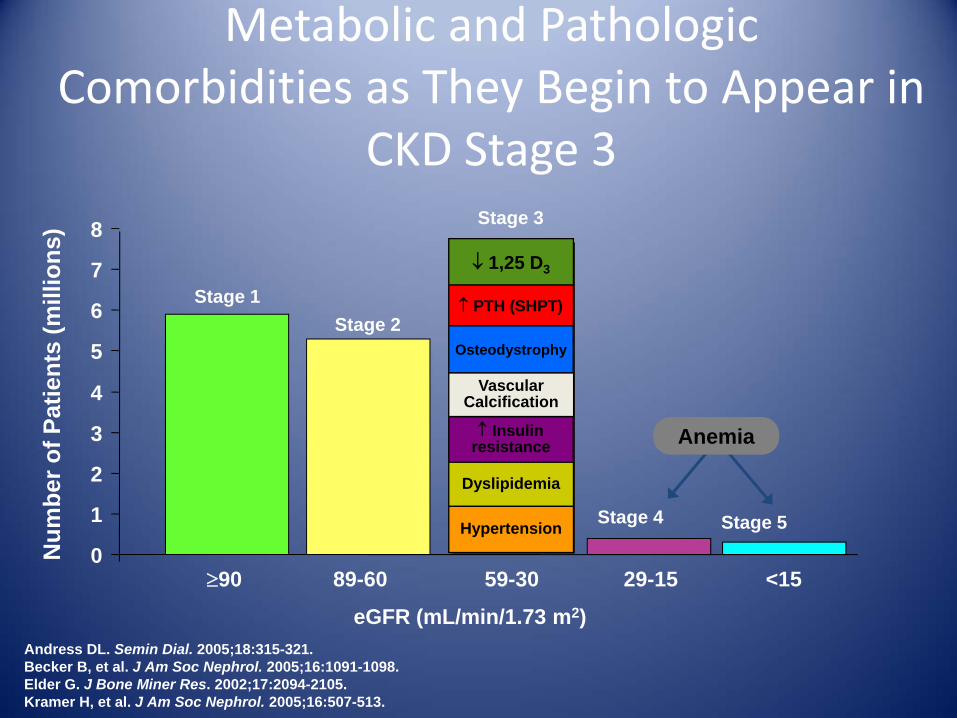
Metabolic and PathologicComorbidities as They Begin to Appear in
CKD Stage 3
Andress DL. Semin Dial. 2005;18:315-321.Becker B, et al. J Am Soc Nephrol. 2005;16:1091-1098.Elder G. J Bone Miner Res. 2002;17:2094-2105.Kramer H, et al. J Am Soc Nephrol. 2005;16:507-513.
Num
ber o
f Pat
ient
s (m
illio
ns)
≥90 89-60 59-30 29-15 <15
eGFR (mL/min/1.73 m2)
Stage 3
Stage 1Stage 2
Stage 4 Stage 5
0
1
2
3
4
5
6
7
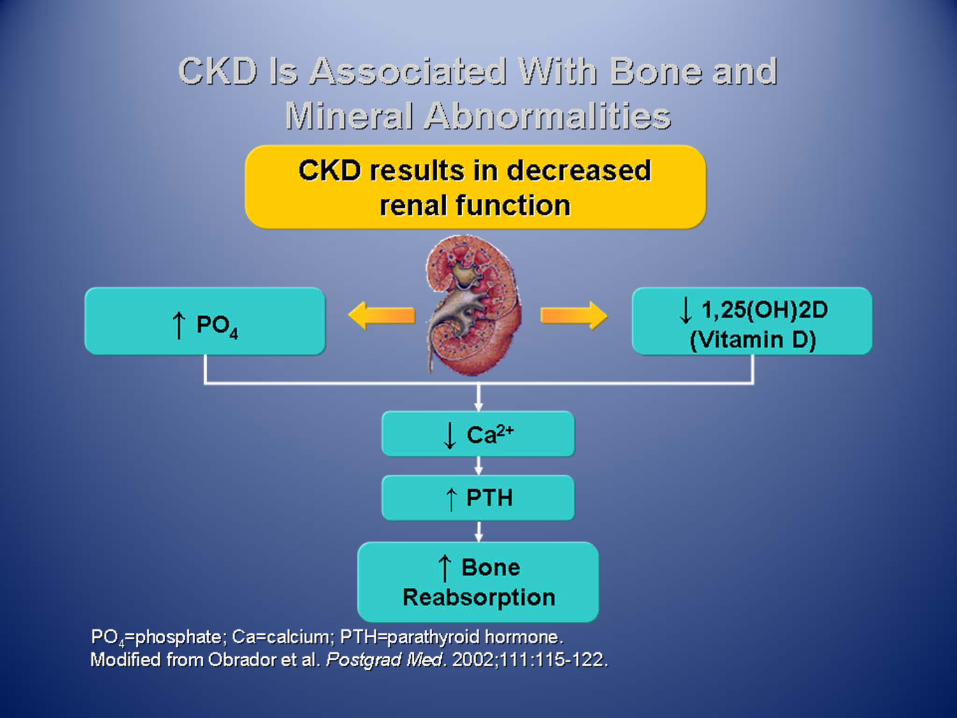
8↓ 1,25 D3
↑ PTH (SHPT)
↑ Insulin resistance
Dyslipidemia
Hypertension
Vascular Calcification
Osteodystrophy
Anemia


CKD &Secondary Hyperprathyroidism
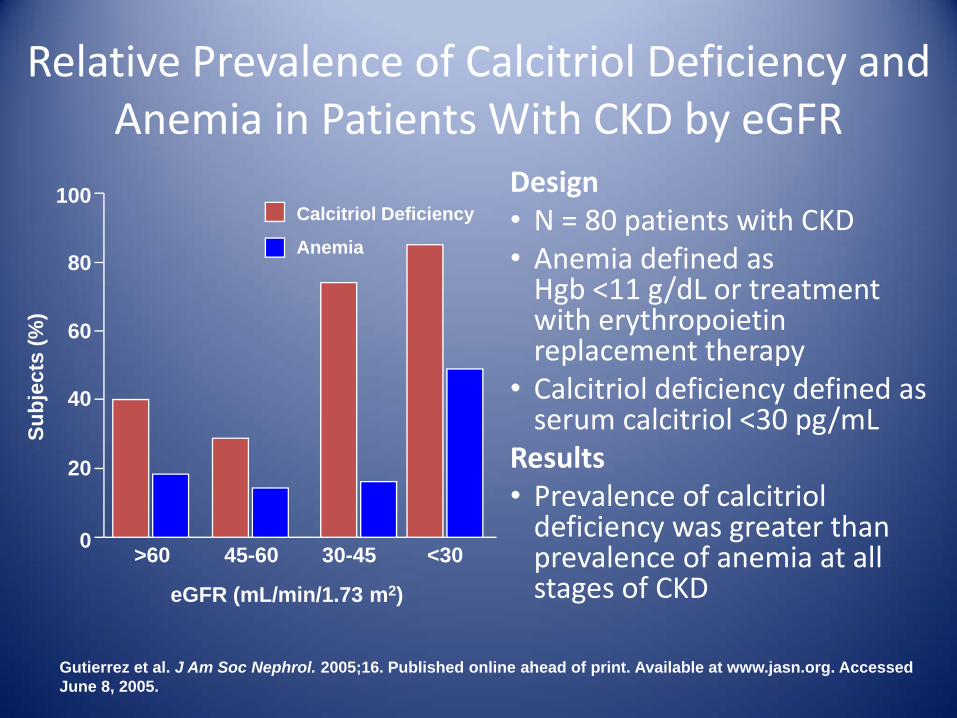
Relative Prevalence of Calcitriol Deficiency and Anemia in Patients With CKD by eGFR
Design• N = 80 patients with CKD• Anemia defined as Hgb <11 g/dL or treatment with erythropoietin replacement therapy
• Calcitriol deficiency defined as serum calcitriol <30 pg/mL
Results• Prevalence of calcitriol deficiency was greater than prevalence of anemia at all stages of CKD
Gutierrez et al. J Am Soc Nephrol. 2005;16. Published online ahead of print. Available at www.jasn.org. Accessed June 8, 2005.
>60 45-60 30-45 <30
eGFR (mL/min/1.73 m2)
100
80
60
40
20
0
Calcitriol Deficiency
Anemia
Subj
ects
(%)

Vitamin D Receptor Is Ubiquitous
System Tissue and CellGastrointestinal Esophagus, stomach, small intestine, large intestine, colon
Arterial vessels Vascular smooth muscle cellsHepatic Liver parenchymal cellsRenal Proximal and distal tubules, collecting duct Endocrine Parathyroid, pancreatic β-cells, thyroid C cellsExocrine Parotid gland, sebaceous glandReproductive Testis, ovary, placenta, uterus, endometrium, yolk sac Immune Thymus, bone marrow, B cells, T cellsCardiovascular Cardiac myocytesRespiratory Lung alveolar cellsMusculoskeletal Osteoblasts, osteocytes, chondrocytes, striated
muscleEpidermis/appendage Skin, breast, hair folliclesCentral nervous Brain neuronsConnective tissue Fibroblasts, stroma


Intimal and Medial Calcification in Patients With CKD
Patient in the general population
Medial CalcificationIntimal Calcification
Patient with CKD
0
50
100
150
200
250
300
>80 79-70 69-60 59-50 49-40 39-30 29-20 <20
eGFR Interval (mL/min/1.73 m2)
iPTH
Lev
el (p
g/m
L)
05101520253035404550
iPTH 1,25 Vitamin D 25(OH) Vitamin D
1,25
Vita
min
D (p
g/m
L)25
(OH
) Vita
min
D (n
g/m
L)
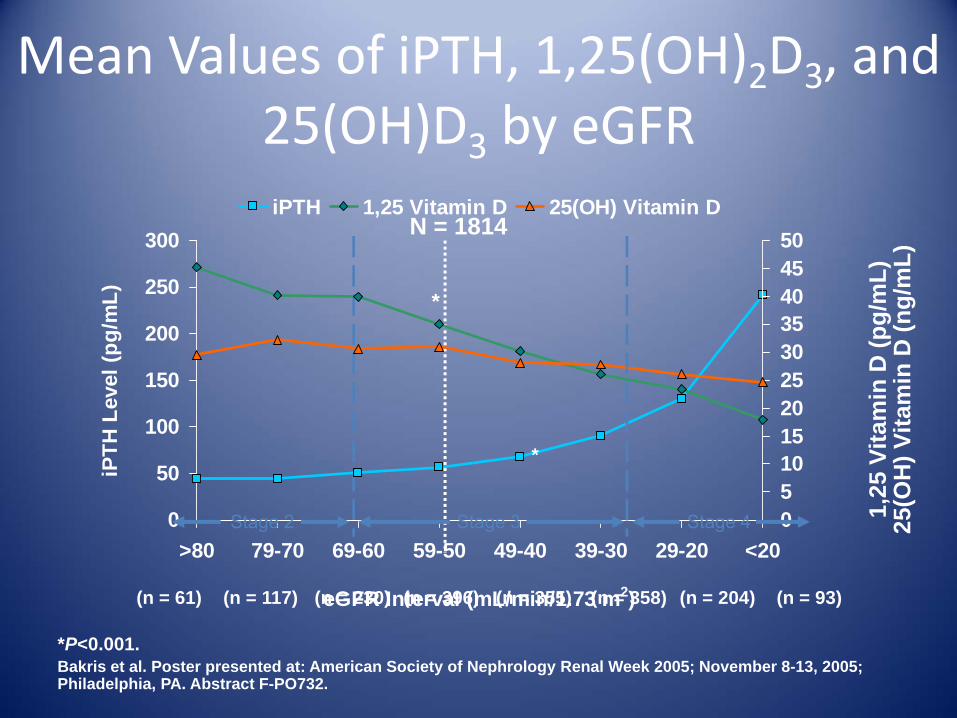
Mean Values of iPTH, 1,25(OH)2D3, and 25(OH)D3 by eGFR
N = 1814
*P<0.001.Bakris et al. Poster presented at: American Society of Nephrology Renal Week 2005; November 8-13, 2005; Philadelphia, PA. Abstract F-PO732.
(n = 61) (n = 117) (n = 230) (n = 396) (n = 355) (n = 358) (n = 204) (n = 93)
*
*
Stage 2 Stage 4Stage 3

Prevalence of Elevated iPTH by eGFR Intervals
0102030405060708090
100
>80 79-70 69-60 59-50 49-40 39-30 29-20 <20(n = 61)
Patie
nts
With
iPTH
>65
pg/
mL
(%)
iPTH = intact parathyroid hormone.Bakris et al. Poster presented at: American Society of Nephrology Renal Week 2005; November 8-13, 2005; Philadelphia, PA. Abstract F-PO732.
(n = 117) (n = 396)(n = 230) (n = 355) (n = 93)(n = 358) (n = 204)
N = 1814
eGFR Interval (mL/min/1.73 m2)

Evidence of Renal Osteodystrophy: Bone Loss in CKD Stages 2‐4
-2.25
-2.00
-1.75
-1.50
-1.25
-1.00
-0.75
-0.50
-0.25
0.00Spine Hip Arm
Bon
e M
iner
al D
ensi
ty (Z
-Sco
re)
PTH <60 pg/mL PTH 60-120 pg/mL PTH >120 pg/mL
*P<0.05 compared with patients with PTH in the normal range.Rix et al. Kidney Int. 1999;56:1084-1093.
*
**
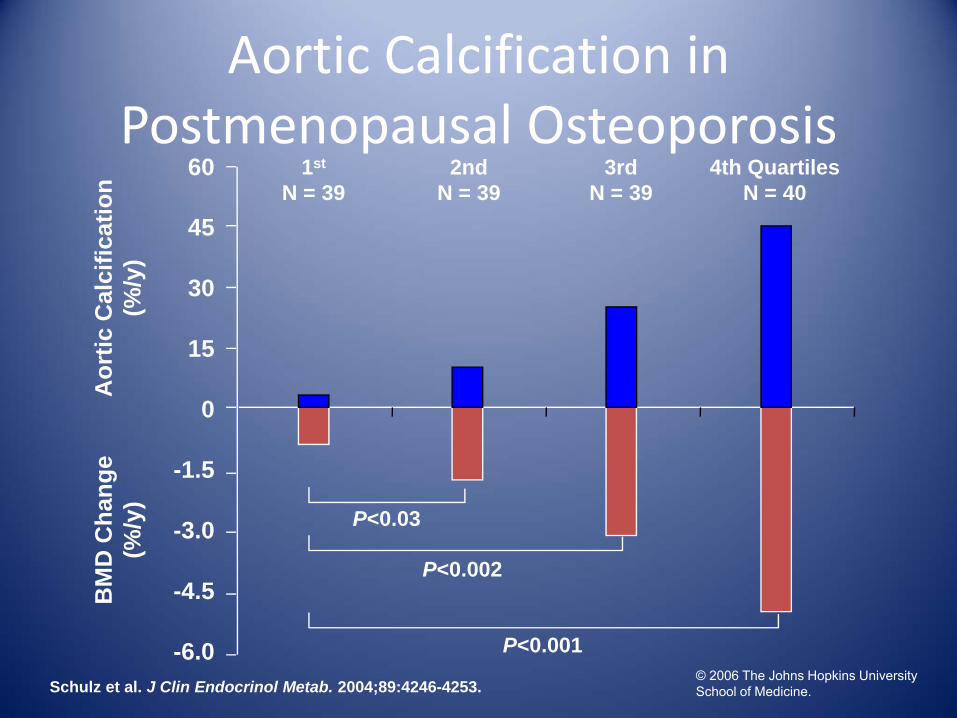
Schulz et al. J Clin Endocrinol Metab. 2004;89:4246-4253.
Aortic Calcification in Postmenopausal Osteoporosis
1st
N = 392nd
N = 394th Quartiles
N = 403rd
N = 39
Aor
tic C
alci
ficat
ion
(%/y
)B
MD
Cha
nge
(%/y
)
P<0.03
-6.0
-4.5
-3.0
-1.5
0
15
30
45
60
P<0.002
P<0.001© 2006 The Johns Hopkins University School of Medicine.
.
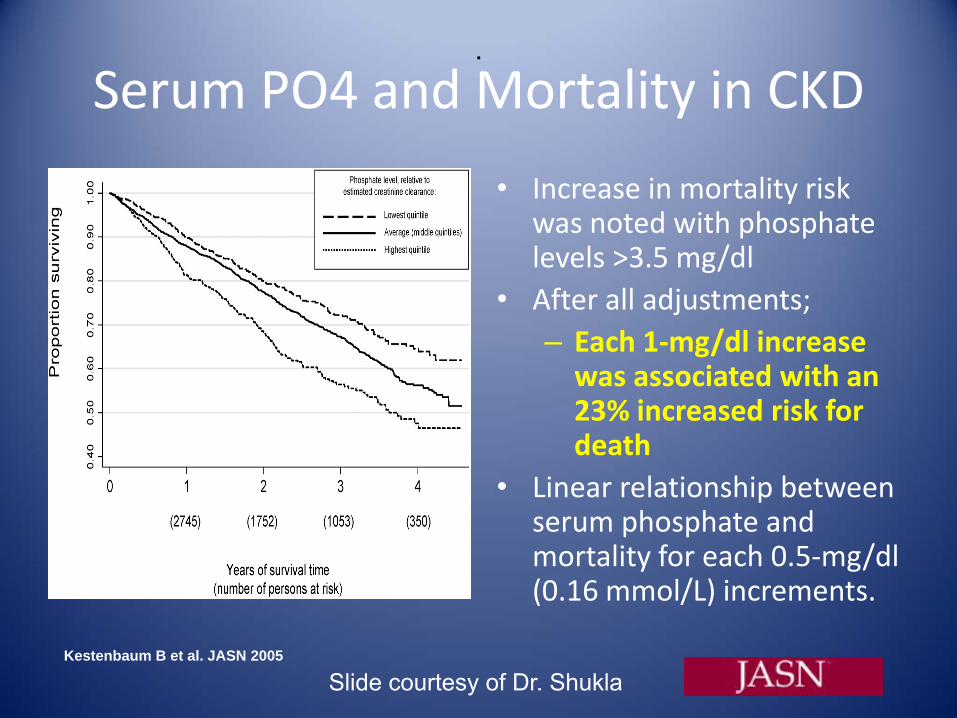
Kestenbaum B et al. JASN 2005
Serum PO4 and Mortality in CKD
• Increase in mortality risk was noted with phosphate levels >3.5 mg/dl
• After all adjustments; – Each 1‐mg/dl increase was associated with an 23% increased risk for death
• Linear relationship between serum phosphate and mortality for each 0.5‐mg/dl (0.16 mmol/L) increments.
Slide courtesy of Dr. Shukla
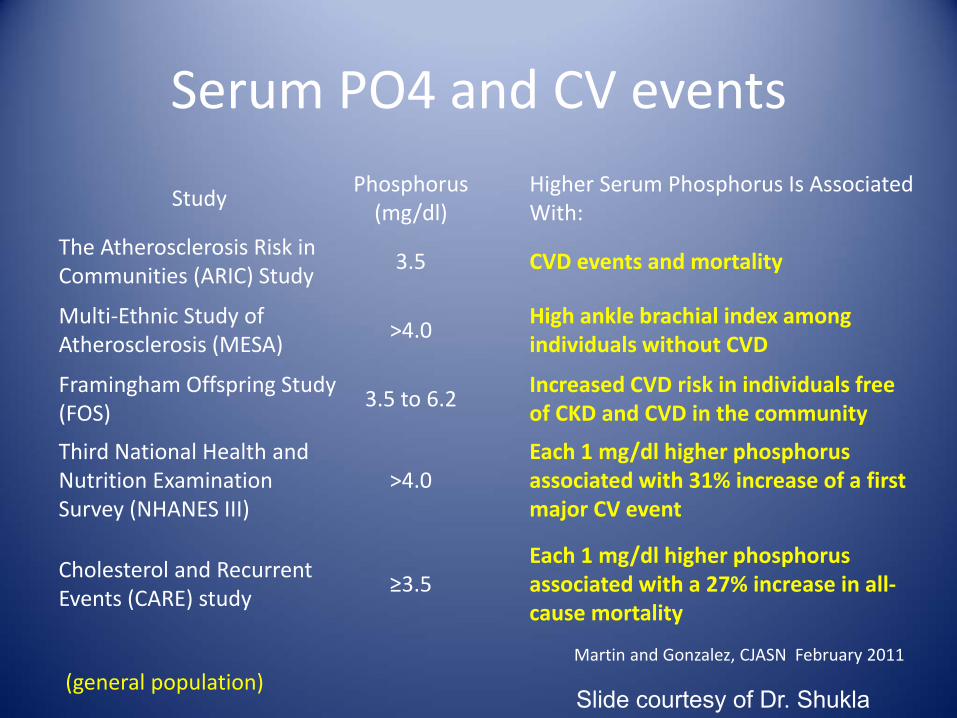
Serum PO4 and CV events
StudyPhosphorus (mg/dl)
Higher Serum Phosphorus Is Associated With:
The Atherosclerosis Risk in Communities (ARIC) Study
3.5 CVD events and mortality
Multi‐Ethnic Study of Atherosclerosis (MESA)
>4.0High ankle brachial index among individuals without CVD
Framingham Offspring Study(FOS)
3.5 to 6.2
Increased CVD risk in individuals free of CKD and CVD in the community
Third National Health and Nutrition Examination Survey (NHANES III)
>4.0Each 1 mg/dl higher phosphorus associated with 31% increase of a first major CV event
Cholesterol and Recurrent Events (CARE) study
≥3.5Each 1 mg/dl higher phosphorus associated with a 27% increase in all‐cause mortality
(general population)Martin and Gonzalez, CJASN February 2011
Slide courtesy of Dr. Shukla
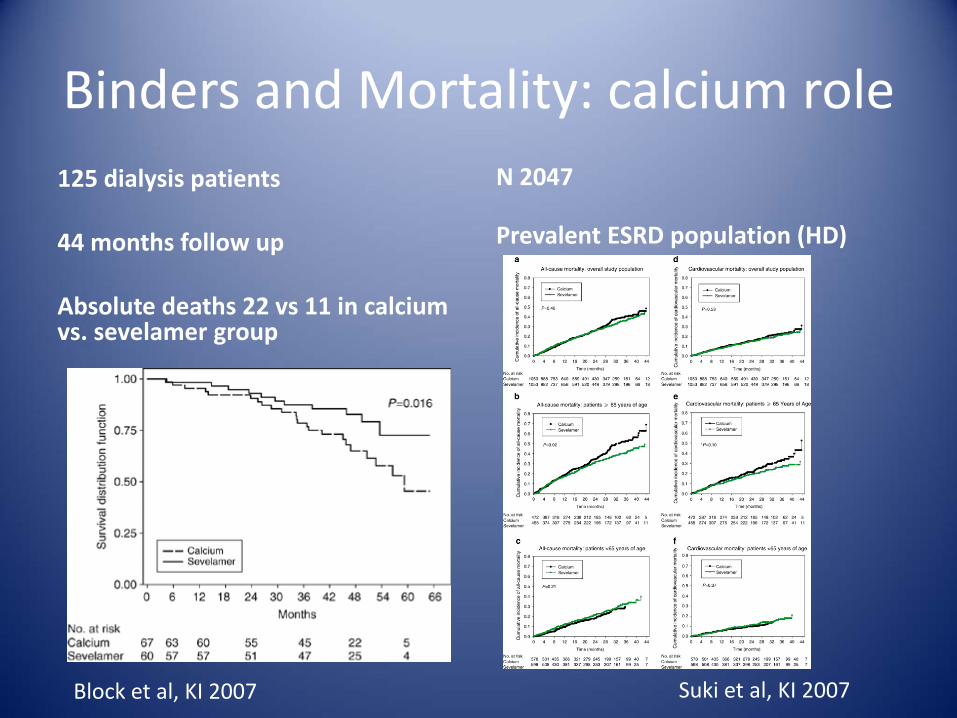
Binders and Mortality: calcium role125 dialysis patients
44 months follow up
Absolute deaths 22 vs 11 in calcium vs. sevelamer group
N 2047
Prevalent ESRD population (HD)
Block et al, KI 2007 Suki et al, KI 2007
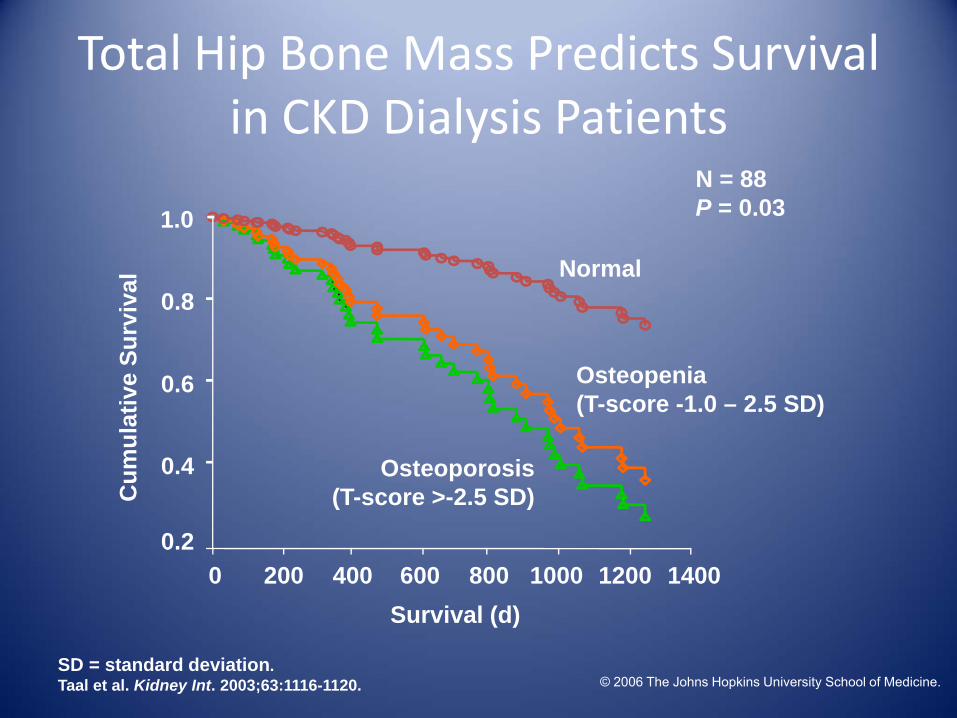
Total Hip Bone Mass Predicts Survival in CKD Dialysis Patients
Survival (d)1400120010008006004002000
Cum
ulat
ive
Surv
ival
1.0
0.8
0.6
0.4
0.2
Normal
Osteopenia (T-score -1.0 – 2.5 SD)
Osteoporosis(T-score >-2.5 SD)
N = 88P = 0.03
SD = standard deviation.Taal et al. Kidney Int. 2003;63:1116-1120. © 2006 The Johns Hopkins University School of Medicine.
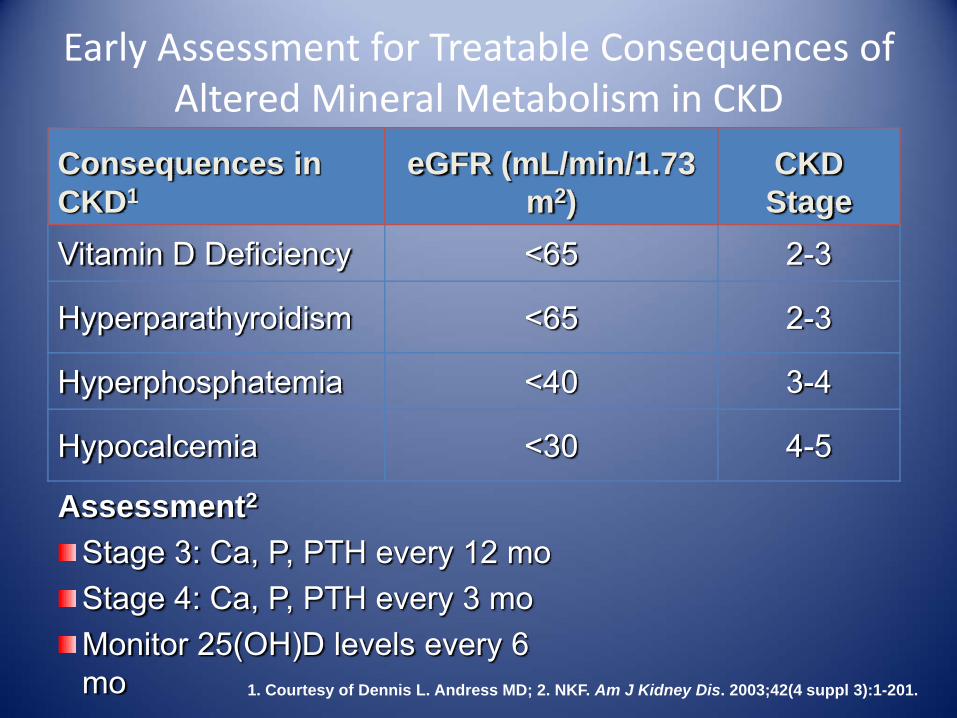
Early Assessment for Treatable Consequences of Altered Mineral Metabolism in CKD
Assessment2
Stage 3: Ca, P, PTH every 12 moStage 4: Ca, P, PTH every 3 moMonitor 25(OH)D levels every 6 mo
Consequences in CKD1
eGFR (mL/min/1.73 m2)
CKD Stage
Vitamin D Deficiency <65 2-3
Hyperparathyroidism <65 2-3
Hyperphosphatemia <40 3-4
Hypocalcemia <30 4-5
1. Courtesy of Dennis L. Andress MD; 2. NKF. Am J Kidney Dis. 2003;42(4 suppl 3):1-201.

Recommended Goals for Hormone and Mineral Metabolism in CKD Stages 3 and 4
Parameter RecommendationiPTH (pg/mL) Stage 3: 35-70; stage 4: 70-110
Serum 25(OH) vitamin D (ng/mL) >30
P (mg/dL) 2.7-4.6
Ca (mg/dL) 8.5-10.2
Ca × P product (mg2/dL2) <55
Ca intake (mg/d)<1500 elemental from Ca-based P-binders<2000 from diet and P-binders
iPTH = intact PTH.NKF. Am J Kidney Dis. 2003;42(4 suppl 3):1-201.

Martin K J , González E A CJASN 2011
Pathways involved in evolution of disordered mineral metabolism in an early course of CKD (dashed lines
indicate counter-regulatory pathways).

Nutritional vitamin D: therapy?Author/Year Subjects efficacy Change in Other Relevant Biomarkers
Shah et al., 2005 29 PD <7 to 30 No change in PTH or 1,25(OH)2D.
DeVille et al., 2006 85 CKD 3 to 5 17.4 to 42.1 PTH decreased by 2.8 pmol/L
Al‐Aly et al., 2007 66 CKD 3 and 4 17 to 27 PTH levels decreased from 231 to 192pg/ml.
Zisman et al., 2007 52 CKD 20 to 31 in CKD 3 18
to 35 in CKD 4 PTH decrease by 13% in CKD 3, 2% in CKD 4.
Saab et al., 2007 119 HD 17 to 53 No change in PTH
Jean et al., 2008 149 HD 30 to 126 nmol/ L Lowered PTH and AP only in responders
Jean et al., 2008 43 HD 28 to 118 nmol/l1,25(OH)2 D increased from 7 to 30 pmol/l. PTH decreased ,144 to 108, AP unchanged.
Chandra et al 2008 20 CKD 3 and 4 17 to 49 ng/ml No change in PTH or 1,25(OH)2D
Blair et al., 2008 344 HD 18 to 42 HbA1c levels fell 6.9 to 6.4 no change in PTH.
Kalantar‐Zadeh et al, CJASN 2009Slide courtesy of Dr. Shukla

Active vitamin D and outcomes?Author/Year No Examined Therapy Main Results
Shoji et al., 04 242 alfacalcidol / placebo Lower CV mortality
Teng et al., 03 67,399 Paricalcitol/ calcitriol 16% lower ACM
Teng et al., 05 51,037 Any VDRA/ placebo 20% lower ACM
Melamed etal. 06 1007 IV calcitriol / placebo Lower ACM
Tentori et al.06 7731Any VDRA / placebo & calcitriol / paricalcitol / doxercalciferol
Lower mortality with any VDRA. No difference between the types of
VDRA
KZadeh et al.06 Lee et al., 07
58,058 Paricalcitol / placebo Lower ACM
Kovesdy et al 08 520 Calcitriol / placebo Lower ACM
Shoben et al.08 1418 Calcitriol / placeboLower ACM and combined
mortality or ESRD
N‐Diaz et al.08 16,004 Calcitriol / placebo Lower mortality
Wolf et al.08 9303 VDRA / placebo Lower Mortality
Tentori et al.09 38,066 Inactive / active vitamin D 7% to 22% lower mortality
Kalantar‐Zadeh et al, CJASN 2009Slide courtesy of Dr. Shukla

Evaluations of Oral Vitamin D Compounds in CKD Stages 3 and 4
Patients (%)
Vitamin D Compound N
Ca >10.5 mg/dL
P >5.5 mg/dL
Ca × P >55
mg2/dL2
Urinary Ca
% change
Calcitriol 511 64 56 33 100
Alfacalcidol* 1762 11 56 NA 58
Doxercalciferol 553 4 (NS) 9 (NS) NS 42
Paricalcitol 2204 2† (NS) 10† (NS) NS 6 (NS)NA = not assessed.*Alfacalcidol is not available in the US; †Percent of patients with elevation for 2 consecutive lab evaluations.1. Calcitriol NDA, 18-044, 1977. FDA publication; 2. Hamdy et al. BMJ. 1995;310:358-363; 3. Coburn et al. Am J Kidney Dis. 2004;43:877-890; 4. Coyne et al. Am J Kidney Dis. 2006;47:263-276.
© 2006 The Johns Hopkins University School of Medicine.

Develop A Clinical Action Plan
• Check 25(0H) Vitamin D and iPTH levels when eGFR falls below 60
• Start treatment when indicated by labs• Restrict phosphorus intake when eGFR <40• Start PO4 binders when eGFR is low and PO4 is trending up, even w/n normal range
• Monitor labs, as indicated by therapy
CKD & Anemia
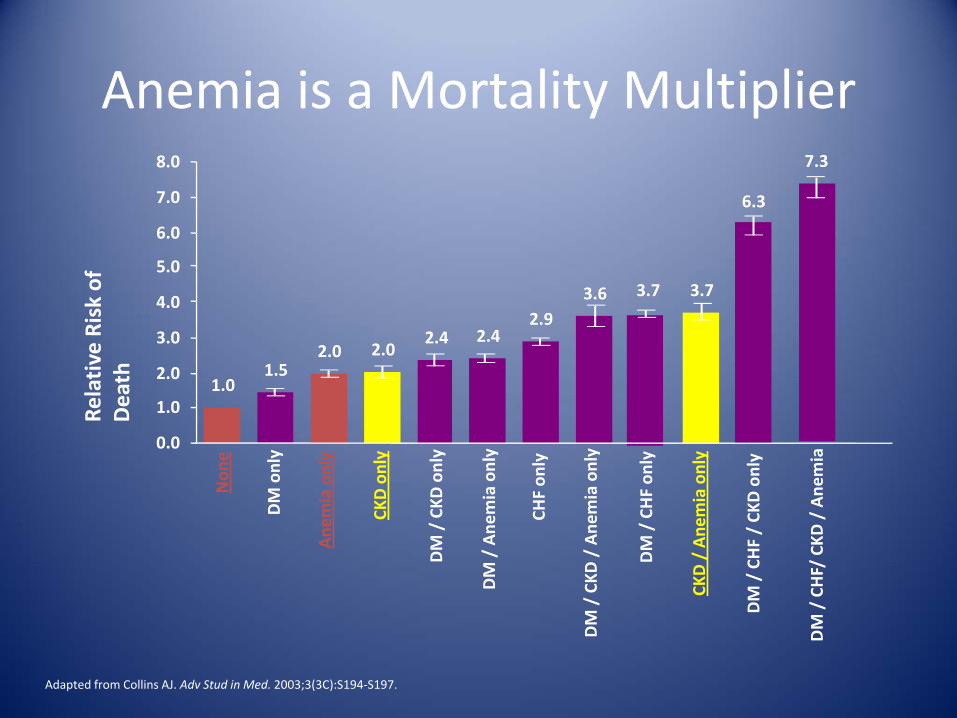
Anemia is a Mortality Multiplier
DM / CHF/ CKD
/ Ane
mia
DM / CKD
/ Ane
mia only
DM / CHF / CK
D only
CKD / Ane
mia only
DM / CHF on
ly
CHF on
ly
DM / Ane
mia only
DM / CKD
only
CKD only
Ane
mia only
DM only
Non
e
3.6 3.7 3.7
7.3
1.52.0 2.0
2.4 2.42.9
1.0
0.0
1.0
2.0
3.0
4.0
5.0
6.0
7.0
8.0
6.3
Adapted from Collins AJ. Adv Stud in Med. 2003;3(3C):S194‐S197.


A reduction in kidney mass and decreased production of erythropoietin, results in decreased RBC mass and anemia
More reticulocytes enter circulating blood
Proerythroblasts in bone marrow mature into reticulocytes
Low delivery of oxygen in the blood stimulates erythropoietin secretion
Larger number of RBCs in circulation
The Role of the Erythropoietinin RBC Production
RBCs = red blood cells; EPO = erythropoietinModified from: Hillman. In: Harrison’s Principles of Internal Medicine. 14th ed. 1998:334‐339.

CHOIR study
• 1432 patients with CKD• 222 primary composite
end points– 125 in high Hb group
• The use of a target hemoglobin level of 13.5 g as compared with 11.3 g was associated with increased risk and no improvement in the quality of life.
Singh et al, NEJM 2006Slide courtesy of Dr. Shukla

The TREAT study• 4038 diabetic CKD patients• 13 vs 9 Hb• 1234 end points• 632 vs 602 in high vs rescue control
group• The use of darbepoetin alfa in
patients with Diabetes, CKD and moderate anemia did not reduce the risk of either of the two primary composite outcomes (either death or a cardiovascular event or death or a renal event) and was associated with an increased risk of stroke.
• For many persons involved in clinical decision making, this risk will outweigh the potential benefits
Pfeffer et al, NEJM 2009Courtesy of Dr. Shukla

Please see Important Safety Information including Boxed
WARNINGS WARNINGS: INCREASED MORTALITY, SERIOUS CARDIOVASCULAR and THROMBOEMBOLICEVENTS, and TUMOR PROGRESSIONRenal failure: Patients experienced greater risks for death and serious cardiovascular events when administered erythropoiesis-stimulating agents (ESAs) to target higher versus lower hemoglobin levels (13.5 vs. 11.3 g/dL; 14 vs. 10 g/dL) in two clinical studies. Individualize dosing to achieve and maintain hemoglobin levels within the range of 10 to 12 g/dL.Cancer:
ESAs shortened overall survival and/or time-to-tumor progression in clinical studies in patients with advanced breast, head and neck, lymphoid, and non-small cell lung malignancies when dosed to target a hemoglobin of ≥ 12 g/dL.
The risks of shortened survival and tumor progression have not been excluded when ESAs are dosed to target a hemoglobin of < 12 g/dL.
To minimize these risks, as well as the risk of serious cardio- and thrombovascular events, use the lowest dose needed to avoid red blood cell transfusions.Use only for treatment of anemia due to concomitant myelosuppressive chemotherapy.Discontinue following the completion of a chemotherapy course.
Perisurgery: EPOGEN® increased the rate of deep venous thromboses in patients not receiving prophylactic anticoagulation. Consider antithrombotic prophylaxis.

CKD Warning• In controlled trials, patients experienced greater risks of death, serious adverse CV reactions and stroke when administered ESAs to target hemoglobin level greater than 11 g/dL.
• No trial has identified a hemoglobin target level, ESA dose or dosing strategy that does not increase these risks.
• Use the lowest ESA dose sufficient to reduce the need for RBC transfusions.
Amgen Highlights of Prescribing Information 6/2011
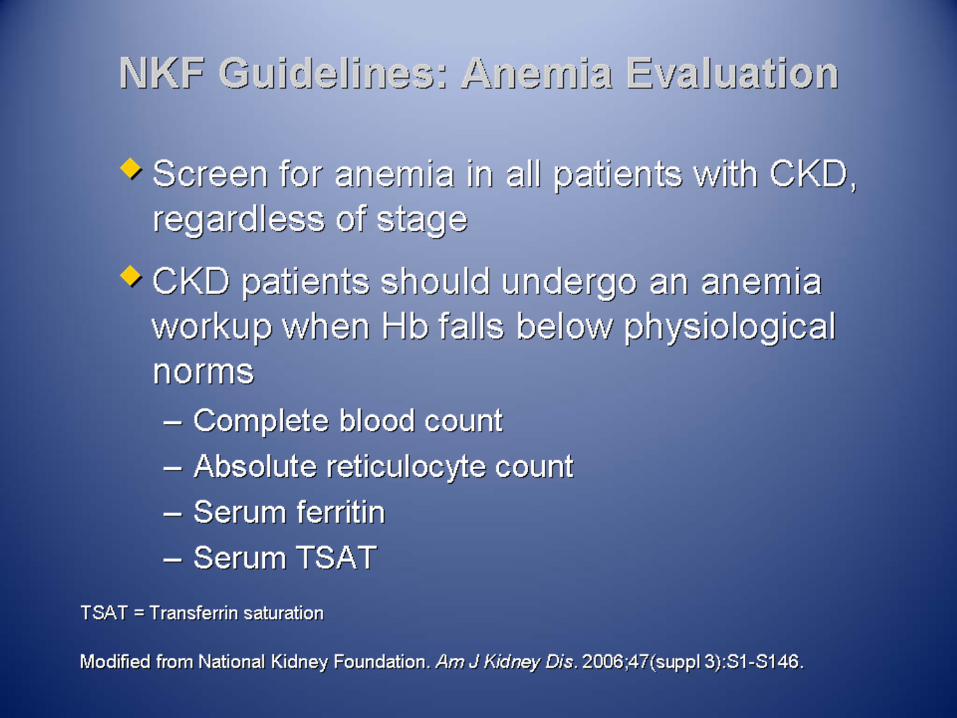

Initial Work Up and Treatment of Anemia Associated With CRF
Treat with ESAif indicated?
No
Further workup and other necessary labs required
Yes
Treat with irona
CRF patients identifiedwith anemiaWorkup: CBC, indices, retics; iron studies1
Iron deficiency?
CRF Anemia?
aEven with iron therapy, ESAs may still be required.CBC = complete blood count. 1. Modified from: National Kidney Foundation. Am J Kidney Dis. 2006;47(suppl 3):S1‐S146.2. Aranesp® (darbepoetin alfa) prescribing information, Amgen.
Target hemoglobin : classically recommended 10‐12gm/dl but now ? 9 the lower limit or even lower?

Patients With CHF and Anemia (n = 126, 91% CKD)
NYHA class = New York Heart Association classification; SOB = shortness of breath.Silverberg et al. Perit Dial Int. 2001;21(suppl 3):S236‐S240.
Clinical Benefit of Anemia Correction: CHF and CKD
Parameter Before AfterHgb (g/dL) 10.3 13.1Serum creatinine (g/dL) 2.4 2.3∆GFR (mL/min/mo) -0.95 0.27NYHA class (0-4) 3.8 2.7Fatigue/SOB index (0-10) 8.9 2.7Hospitalizations 3.7 0.2Systolic BP (mm Hg) 132 131Diastolic BP (mm Hg) 75 76

Anemia Treatment Eligibility
• Serum Creatinine (2.0 mg/dl or above) or
• Creatinine Clearance (45 ml/min or below) and
• Hemoglobin (10g/dl or below) or
• Hematocrit (30 % or below) or
and
• Symptoms of anemia

CKD Anemia: A Funded Modifiable Risk Factor
Anemia Management Targets
• Hemoglobin : None• If Hg approaches or exceeds 11g/dL, Reduce or stop dose
• Transferrin Saturation: 20‐50 %*
• Ferritin: >100 ng/mL*– Use clinical judgementto continue when ferrtinis >500 ng/ml
Treatment options
• ESAs– Epoetin alpha
– Darbepoetin alpha
• Iron Therapies– Oral irons
– Injectables• Iron dextran
• Iron sucrose
• Sodium ferric gluconate
• Ferumoxytol injection

CKD Anemia Treatment Plan• Successful treatment of anemia involves
– Analyzing current patient data trends
– Evaluating the whole patient to make ESA and IV iron treatment decisions
• Assess inflammation and malnutrition
• Do not rely solely on the serum ferritin marker
– Protocol that balances ESA and IV iron therapy
– System to monitor response to therapy
• Trending laboratory results
• Adjusting medication doses

Summary
• There are multiple benefits to correcting anemia in CKD patients
• Treatment of anemia is principally aimed at correcting the morbidity and not mortality and the goal is to prevent complications.
• Use the lowest ESA dose to reduce the need for RBC transfusion
• Monthly labs and titration of doses are needed• Weigh the risk benefit ratio before starting