Embed Size (px)
Citation preview

PRELIMINARY DRAFT. DO NOT CITE WITHOUT PERMISSION.
STAFFING CLASSROOMS: HOW DO NEW YORK SCHOOL
DISTRICTS FIND THEIR TEACHERS?
Dana Balter and William Duncombe Education Finance and Accountability Program Center for Policy Research, Syracuse University
426 Eggers Hall Syracuse, NY 13244-1020 [email protected]
[email protected]://www-cpr.maxwell.syr.edu/faculty/duncombe/
American Education Finance Association 2005 Annual Conference Louisville Kentucky March 17-19, 2005
Acknowledgements: This project would not have been possible without significant help from a number of individuals. Jim Wyckoff and EFRC generously agreed to fund the project. Tom Rogers at NYSCOSS graciously sponsored the survey. We want to especially thank Briggs McAndrews at NYSCOSS, who provided significant help with all aspects of the survey. Several superintendents and district administrators provided valuable advice on survey design including Marilyn Dominick, Superintendent at Jordan Elbridge School District; Martin Swenson, Superintendent at Fabius-Pompey School District; Yvonne Young, Associate Superintendent for Support Services at Syracuse City School District; Rudy Rubeis, Superintendent at West Genesee School District; Joe Proscia. Assistant Superintendent for Curriculum and Instruction at West Genesee School District; and Sally Romano, Director of Personnel at West Genesee School District. Deborah Cunningham, Charles Szuberla, Johanna Duncan-Poitier, Nancy Willie-Schiff, and Joe Porter of the New York State Education Department reviewed the survey and provided helpful comments. Dan Goldhaber and Michael DeArmond of the University of Washington had a number of valuable suggestions on both the content and design of the survey. Willow Jacobson at the University of North Carolina, Pat Ingraham at Syracuse University, and Mark Robbins and Bill Simonsen, at the University of Connecticut, critiqued the survey instrument, and proposed a number of revisions to reduce length and improve clarity. We also want to thank Jeff McLellan, Kim Kirsch, and Bob Bifulco for their comments on preliminary draft of the report. We appreciate the willingness of Robert Strauss of Carnegie Mellon University to allow us to borrow from his survey on teacher hiring practices in Pennsylvania. Errors and omissions are, of course, solely the responsibility of the authors.
Note: The full project report is available from the Education Finance Research Consortium on their website: http://www.albany.edu/edfin.
STAFFING CLASSROOMS:
HOW DO NEW YORK SCHOOL DISTRICTS FIND THEIR TEACHERS?
Abstract
Decades of research on the determinants of student achievement make it clear that high quality
teachers matter for student success. Despite the recent focus on teacher quality, relatively little research
exists on district practices to recruit, screen and select teachers. This paper takes a first step in filling this
gap by documenting the findings of a survey on teacher hiring practices in New York State school
districts. We received a response rate of over 70%. In this paper will focus on the teacher recruitment
part of the survey.
Most districts continue to use fairly traditional methods to recruit teachers by advertising in local
newpapers, working with local colleges, recruiting student teachers and substitute teachers, and offering
compensation for extracurricular activities and credit for teaching outside the district. A much smaller
share of districts advertise outside the local area, work with colleges in other regions of the state or other
states, or use non-traditional recruiting incentives, such as signing bonuses, subsidized tuition at local
colleges, or assistance purchasing a home. Most districts use the internet to post job notices on the school
district websites, but most districts do not post job notices on other job websites, or use the internet to
actively search for teachers. Districts with more difficulty recruiting teachers are more apt to use all of
the strategies to increase the local supply of teachers and to use several recruiting incentives.
We examined more formally the factors associated with district use of particular recruiting
practices using a model of adoption of innovations. Estimation of this model shows that enrollment,
difficulty recruiting, institutionalization of practices, and management capacity are significantly
associated with adoption for many of the practices examined.

STAFFING CLASSROOMS:
HOW DO NEW YORK SCHOOL DISTRICTS FIND THEIR TEACHERS?
Decades of research on the determinants of student achievement make it clear that high quality
teachers matter to student success (Ferguson, 1998; Goldhaber, 2002; Goldhaber et al., 1999; Hanushek et
al., 2002). With states under pressure to raise teacher quality to comply with NCLB and with a significant
increase in demand for teachers projected for the next decade (Hussar, 1999), school districts face
significant teacher recruitment challenges. Moreover, evidence suggests that high quality teachers are
unequally distributed across districts and that disadvantaged students are much more likely to be served
by less qualified teachers (Lankford et al., 2002; Oakes et al., 1992; Loeb 2000). The success of high need
districts in meeting NCLB standards will depend in large part on their success in recruiting and retaining
high quality teachers.
Despite the suggestion that differences in hiring processes may contribute to the teacher quality
problem (Loeb, 2000), most policy proposals are aimed at the state level and focus on how to increase the
supply of teachers and improve teacher retention. Research documenting the effectiveness of particular
district hiring practices for teachers is very limited. This paper starts to fill this research gap by
documenting the practices used in New York school districts for teacher recruitment based on a survey of
school districts administered during the summer of 2004.
The paper is organized into five sections. In the first section of the paper we review briefly the
literature on teacher labor markets, and empirical research on recruitment and selection policies in
education. The second section describes survey design and implementation and analyzes our sample’s
representativeness of all districts in New York. In the third section, we present the descriptive results of
the recruitment section of the survey. We then present a model of policy adoption, and test this model
using some of the key recruitment practices identified in the survey. Finally, we summarize the results
and discuss future research plans.
Research on Teacher Recruitment and Labor Supply
Recent concerns about teacher shortages first emerged in the 1990s as a result of demographic
changes (a baby “boomlet”) and class size reduction programs in many states increased the demand for
teachers after several decades of stagnant or declining demand. From the standpoint of state policy to
improve teacher quality, it is important to identify how teacher choices affect the overall quality and
distribution of the teaching workforce. Are teacher shortages caused by a lack of strong candidates

entering teaching; significant attrition of individuals entering teaching early in their careers; teachers’
choices to change school districts; or market imperfections that create localized teacher shortages?
According to Strauss, et al. (2000) teacher quality problems are not caused by a lack of teacher
supply. In Pennsylvania, he estimates that 20,000 teaching certificates are issued per year, and only one-
tenth this number of new teachers is hired on an annual basis. Instead, states should be more worried
about improving the quality of students entering the teaching profession (Strauss et al., 2000; Murnane,
1996) and increasing the retention of high quality teachers.1
A large body of empirical research on teacher mobility confirms that compensation can
significantly affect teacher decisions about leaving and moving (Baugh and Stone, 1982; Murnane and
Olsen, 1990; Stinebrickner, 1998; Imazeki, 1999; Dolton et al., 1999). If compensation is a key factor
affecting mobility, then in theory districts serving disadvantaged populations can attract and retain
qualified teachers by raising salaries sufficiently. However, several factors suggest that solving the
teacher shortage will be more difficult. Recent research indicates that teacher mobility across schools and
districts may be driven in large part by the characteristics of the students that they are teaching and less by
salary differences (Loeb, 2000; Hanushek, et al., 2001). Of equal concern, are the findings of Boyd,
Lankford, Loeb, and Wyckoff (2004) that the teacher labor market is very localized. “Most public school
teachers take their first public school teaching job very close to their hometowns or where they attended
college” (p. 117) or in districts that share similar characteristics to their hometowns.2 Strong preferences
for a familiar teaching environment, implies that large central cities will have difficulty attracting and
retaining teachers who grew up in non-city areas, even with significantly higher salaries.
Strauss et al. (2000) finds a similar result in Pennsylvania, but attributes it not to teacher
preferences, but to the search process of the school district. Specifically, districts focus their hiring
process on substitute or part-time teachers and graduates of local colleges, and do not “actively seek new
teacher applications through vigorous advertising and recruiting.” (p. 405) Concerns over the quality of
the public teacher hiring process have been raised in several comparisons of teacher recruitment policies
in public and private schools (Ballou, 1996; Ballou and Podgursky, 1998). Ballou (1996) argues that
1Nationally, 11% of teachers leave the profession after the first year, and 39% leave after five years (Ingersol, 2002). Recent estimates from the NCES (2004) indicate that 13 percent of teachers with 1 to 3 years of experience moved to another district, and 8.5 percent left teaching as an occupation from 1999-2000 to 2000-2001. Movers cited most frequently improvements in the assignments, working conditions, and salaries as very important to their decision to move. Leavers cited salary, working conditions, and interest in pursuing a family or another career. 2 In fact, they found that 82 percent of New York teachers were employed in jobs teaching at schools that were within 40 miles of their hometowns.
2
“public school officials undervalue cognitive skills and subject matter knowledge when screening new
applicants” (p. 130). 3
Unfortunately, it is difficult to separate the effect of teacher preferences for the local area from
district hiring decisions; districts may recruit locally because of the ineffectiveness of broader regional or
national searches. Understanding this process is also hindered by a lack of information on teacher hiring
processes. “We know little about how effective districts are in their hiring decisions” (Loeb, 2001, p.
109).
Recruitment, like all aspects of human resource management, requires careful planning to be
successful (Pynes 1997). Ideally, a strategic human resource planning process would be used to determine
the district’s personnel needs. Based on the plan, the school district should develop a recruitment plan that
delineates: 1) when will the district recruit (i.e. timing with respect to the school year); 2) how will the
district recruit (e.g. newspaper ads, on-line job banks, etc.); and 3) where will the district recruit (e.g.
locally, colleges and universities, nationally)?
Most of the literature on recruitment in education focuses on state policies and is case study
based. These studies examine teacher recruitment, training, and compensation policies in particular
states, and use these case studies to make broad recommendations (The Southeast Center for Teaching
Quality, 2002; Pathways to Teaching Careers, 1997; Hirsch, 2001; Fox and Certo, 1999; Education
Research Service, 2001; Clewell, et al., 2000). The focus of most of this research is on potential changes
in state certification and compensation policy that can increase the supply of teachers.
The little evidence that does exist on actual recruitment practices in education suggests that
districts engage in a fairly limited search for candidates. Using a detailed survey of superintendents,
school board presidents, and teacher union presidents in Pennsylvania, Strauss et al (1998, 2000) find, for
example, that 75% of districts only advertise in Pennsylvania and 17% only advertise locally. The media
outlets used most frequently in order of importance include education trade publications (e.g.,
Pennsylvania School Board Association bulletin), education school placement offices, word of mouth,
and newspapers. The internet was used at least sometimes by 29% of respondents. Only 30% of districts
had partnerships with colleges for teacher training and placement, although 50% were contacted by
colleges marketing their graduates.
While the Strauss study is valuable, it is for only one state and is seven years old. As might be
expected for a 1997 survey, Strauss had only one question about the use of the internet. In addition, the
survey didn’t ask about district programs to expand the supply of teachers or the use of monetary
recruitment incentives. These are topics included in our survey of New York districts.
3 Ballou’s (1996) analysis of data from the Surveys of Recent College Graduates (1976-1991) suggests that a stronger academic background does little for a candidate’s job prospects in public schools.
3

Survey Design and Implementation
The literature on hiring practices in school districts has been primarily prescriptive and anecdotal
in nature. The major objective of this survey is to document important teacher hiring practices used by
school districts in New York State. The list of topics that could be included in a survey of teacher hiring
practices is extensive and would require at least several surveys. To keep the survey to manageable
length, choices had to be made about the focus of the survey; we wanted to limit the survey to important
practices and to emerging practices as identified in the literature. The survey was organized into three
broad topics: 1) teacher recruitment, 2) teacher screening, and selection, and 3) interest in training and
support. (The full survey instrument is available in on the website: http://www-
cpr.maxwell.syr.edu/faculty/duncombe/teaching-survey/teacher-hiring.htm
In constructing the survey, we borrowed extensively from the detailed survey developed by
Strauss (1998), particularly in the section on screening and selection. The research of Liu (2002) indicated
the importance of examining whether the hiring process was centralized, decentralized, or shared;
therefore, we asked several questions about staff involvement in the recruitment, screening, interview,
and selection processes. In addition, several studies of state recruiting programs were used to identify a
range of recruiting incentives and strategies for increasing teacher supply (Clewell et al., 2000; Hirsch,
2001; The Southeast Center for Teacher Quality, 2002).
In implementing the survey, we followed closely the recommendations of Dillman (2000). A
number of steps were taken to maximize the response rate to the survey. The director of the New York
State Council of School Superintendents (NYSCOSS), Tom Rogers, graciously agreed to endorse the
survey, put the NYSCOSS logo on the survey instrument, and send a joint cover letter with the survey.
NYSCOSS also allowed us to put a link to the online survey on their website. To provide the greatest
flexibility possible, the survey was available in both hardcopy and online.4 We sent four waves of
mailings to superintendents over a two month period, and included a copy of the survey, a sheet of
instructions on how to use the online survey, a postage paid return envelope, and a cover letter explaining
the objectives and importance of the survey in three of these mailings. The resulting response rate was
excellent, 71.3%.
To examine how representative the sample is of all school districts in New York, we compared
average characteristics for districts completing the survey with those of districts not completing it (Table
1). Included in our comparison are enrollment, fiscal, teacher, and region variables. Districts completing
the survey have similar enrollment size and student socio-economic composition as non-respondents. The
one exception is the share of limited English proficient (LEP) students, which was higher in districts not 4 The online survey package, Survey Monkey, was used to design the online survey, and store survey results.
4

in the survey. Regarding district finances, districts in the survey have 6% lower spending overall and 3%
lower operating spending. None of the other differences in fiscal variables are statistically significant
from zero. The teacher work force in responding districts is very similar to non-respondents, except that
non-respondents have slightly less experienced teachers and a slightly lower share of tenured and
permanently certified teachers. Respondents and non-respondents tend to be distributed evenly between
urban, suburban, and rural districts. Respondents are less likely to be located in downstate districts than
non-respondents. A slightly higher share of districts completing the survey are average need districts and
a lower share are low need districts.
<Table 1 about here>
Descriptive Survey Results on Teacher Recruitment
The high response rate and representative nature of the sample provides us the opportunity to
examine the teacher recruitment practices of New York school districts. In this section we will present
some descriptive analysis of the survey results. Specifically, we examine differences in results based on
enrollment size, the difficulty of recruiting teachers, 5 and the resource capacity, and student needs of the
district as classified by the New York State Education Department (SED).6 Basic results for each survey
questions as well as descriptive tables by income and poverty categories are presented on the website:
http://www-cpr.maxwell.syr.edu/faculty/duncombe/teaching-survey/teacher-hiring.htm.
Traditional Recruiting Methods The goal of teacher recruitment is to increase the number of high quality applicants to the district.
Traditional methods of recruiting have focused on increasing the number of applicants from the local pool
of teachers using fairly passive methods. Strategies would include advertising locally, attending local job
fairs, and partnering with local colleges. In periods of teacher surplus, districts may be able to produce
sufficient numbers of high quality applicants by only tapping the local pool. When there are teacher
shortages, districts may have to consider more aggressive (and expensive) strategies. One possibility is to
expand traditional approaches such as advertising, job fairs, and college partnerships to other areas of the
state or outside the state. Another alternative is to search for “innovative” approaches to both expand the
5 To calculate the difficulty of recruitment, we took the average share of teacher categories (subject areas, types of schools, and demographics of teachers) where districts had recruited in the last 3 years, which they identified as very difficult to recruit for. If a district had less than 8% of these categories identified as very difficult, they were categorized as low difficulty, 8% to 31% as medium difficulty, and above 31% as high difficulty. 6 The SED classification uses the share of free lunch students in K-6 as the measure of needs, and CWR as the measure of fiscal capacity. We have combined the categories for the Big 4 cities and “other high need urban” districts to preserve confidentiality of the survey responses.
5

number of applicants from outside the local area and to try to expand the local supply of teachers
available to a district. The term “innovative” is put in quotation marks because innovative does not
necessarily imply effective; the research on the effectiveness of these strategies is anecdotal at best. We
will focus initially on the more traditional approaches and then turn, in the next section, to “innovative”
approaches. This is one of the few surveys that we are aware of that systematically documents the use of
these strategies by school districts.
Advertising
A simple and fairly passive strategy for recruitment is to put an advertisement in a newspaper,
trade publication, or on radio or television. The least expensive option would probably be local
newspapers and possibly local radio stations. We asked districts to identify the media outlets they use and
whether the newspapers are local (within 50 miles), in other areas of the state, or based out of state.7 The
typical district begins advertising in March or April and makes an offer in June (Table 2); an early
advertising date is associated with making earlier offers to prospective teachers.8 Large districts start
advertising a month earlier than small districts and make their offers a half a month earlier. High need
urban districts begin advertising around the same time as average need and low need districts, but make
their offers one-half to one month later (even controlling for enrollment).9
Table 2 suggests that most advertising is in local papers, with a smaller subset of advertising in
other New York newspapers. A third of districts indicated that some of their advertising was in education
trade publications and almost no districts report using radio or TV advertisements. Small districts are
more apt to use local newspapers and less apt to use other New York newspapers than districts with high
enrollment. High need urban districts and average need districts are less apt to use newspaper advertising
in general than high need rural districts but are not more likely to use other media (even controlling for
enrollment). Unexpectedly, high need rural districts are more apt to use radio and TV advertising than
other districts (use is still very limited).
<Table 2 about here>
7 We did not clarify in this question whether a New York newspaper with national circulation, such as the New York Times, is considered an out-of-state paper. The distinctions across the three categories could be handled differently by districts if they advertise in the New York Times. Given the expense of such an advertisement, we are assuming that relatively few districts outside of the New York City area advertise in this paper. 8 The correlation between the date of advertising (in months) and offering date is 0.44. For districts that gave us a range of months for advertising date and offer date, we used the middle date in the calculations (using fractions of months). 9 To identify emergency hires, we asked superintendents to indicate the number of hires after the first day of school. Unfortunately, the results from this question suggest that superintendents interpreted the question differently, so the results are not reported.
6

Recruiting from Colleges
While advertising may be a successful strategy for experienced teachers, for new teachers a more
effective approach may be to work with the colleges producing them. The contact can be fairly passive,
such as asking colleges to post job notices on bulletin boards or in placement newsletters, or can involve a
more direct contact by visiting the campus or talking to faculty about job candidates. School districts and
colleges can establish even stronger partnerships through student teaching arrangements and the
interaction of college faculty and district personnel on curricular and pedagogical issues.
The most common college recruitment strategies used by districts are supervision of student
teachers, posting of job notices at the colleges, and contacting college faculty in local colleges (Table 3).
The majority of districts post job notices in non-local New York colleges but otherwise have little direct
contact with these colleges. With regard to non-New York colleges, the share of districts working with
these colleges on recruitment drops to 10% for most strategies. Larger districts are more apt to use
recruitment strategies in both local colleges and non-local colleges than smaller districts. High need urban
districts are more likely to visit local colleges and supervise student teachers from non-local colleges but
otherwise are not any more active in working with colleges than other types of districts.
Job Fairs
Another common approach to teacher recruitment is for a district to be present at education job
fairs. The typical district in New York attends one job fair and 37% of districts attend no job fairs. Over
90% of districts attend three or fewer job fairs, but attendance at job fairs goes up significantly with
district enrollment. Large districts, for example, attend between two and three job fairs and 20% attend
four or more. High need districts or those with difficulty recruiting teachers are not more likely to attend
job fairs once enrollment is controlled for.
Emerging Approaches for Teacher Recruitment Districts continue to focus their recruitment efforts primarily on traditional methods, particularly
in the local area. Relatively few districts advertise outside the local area or work with non-local colleges.
The fact that the use of traditional methods, especially outside the local area, goes up with enrollment
suggests that the costs of teacher recruitment are perceived to be relatively fixed, in the sense that costs
per position recruited go down with the number of positions recruited.10 The first emerging approach we
examine may provide the opportunity to reduce some of the fixed costs of recruiting.
10 Ideally, we would like to test this assumption, but we do not have recruitment costs disaggregated from other central office expenditures.
7

Use of the Internet
The internet should be the ideal medium for teacher recruitment. For the cost of posting job
notices on a website, a district can potentially have access to a national market of teachers. Districts can
post job notices on their own websites and can provide recruiting brochures online for candidates to
download. Prospective teachers can communicate with the districts by email and can even submit their
applications online. Districts can use the internet to do a national search for the right teachers as
inexpensively as if they were doing a local search.
Approximately three-quarters of districts use the internet, primarily to post job notices on the
school district website and other recruitment websites (Table 4). A much smaller share use the internet to
search for job candidates. Large districts are more likely to use the internet, particularly to post jobs on
district websites, allow candidates to submit online applications, and search for job candidates. High need
urban districts use the internet in similar rates as average and low need districts. Districts with medium to
high recruitment difficulties are more apt to use a range of internet services than districts with little
difficulty recruiting teachers. These findings suggest that most districts are reaping only a portion of the
potential benefits of the internet.
<Table 4 about here>
Small districts are less likely to use the internet, even though it may have greater benefits for
small districts by potentially broadening their searches. Using the internet for recruitment requires staff
time and some technical competence in the use of the internet. In addition, some small districts may not
have a district website on which they can post job notices and accept applications. Regional education
organizations, such as New York’s Board of Cooperative Educational Services (BOCES), can help to
bridge this technical divide by providing recruiting services to school districts. We asked about a range of
BOCES services including assistance with online application systems, online placement of vacancy
notices, advertising, and recruitment fairs.
Approximately half the districts responding to the survey use hiring services provided by
BOCES, particularly for online applications, online vacancy notices, advertising and recruitment fairs.
The BOCES providing the broadest range of services and serving the most districts (Putnam-Westchester
BOCES) also operates an online application system (OLAS) used by 150 school districts. Small districts
are not more apt to use BOCES services than large districts, especially for online application systems.
However, small districts using BOCES recruitment services are much more likely to use the internet for
recruitment than those that do not. Districts with medium to high difficulty recruiting teachers are more
likely to use BOCES online recruitment services and assistance with recruitment fairs. These findings
suggest that BOCES can help reduce the potential fixed costs and staffing challenges of using the internet
for recruiting, and that BOCES recruitment services should be made more readily available to districts.
8

Teacher Recruitment Incentives
Complementing the use of the internet to broaden the search beyond the local area are monetary
incentives to increase the attractiveness of working in the district. Given the potential costs to teachers for
taking a job in a new area, both monetary and non-monetary, districts may be able to attract new teachers
by providing them a higher salary or some other form of compensation. For example, the district could
offer prospective teachers a signing bonus or could credit teachers for experience in other districts or even
for work experience in non-teaching occupations. Opportunities to supervise extra-curricular activities for
compensation could be made available for teaching candidates. Other incentives used in some states
include compensation for National Board Certification, subsidized tuition at local colleges, additional
compensation for teaching in hard to staff schools or fields, and assistance with the purchase of a home.
In a heavily unionized state such as New York, it is likely that most of these incentives would need to be
negotiated with the union as part of the collective bargaining process.
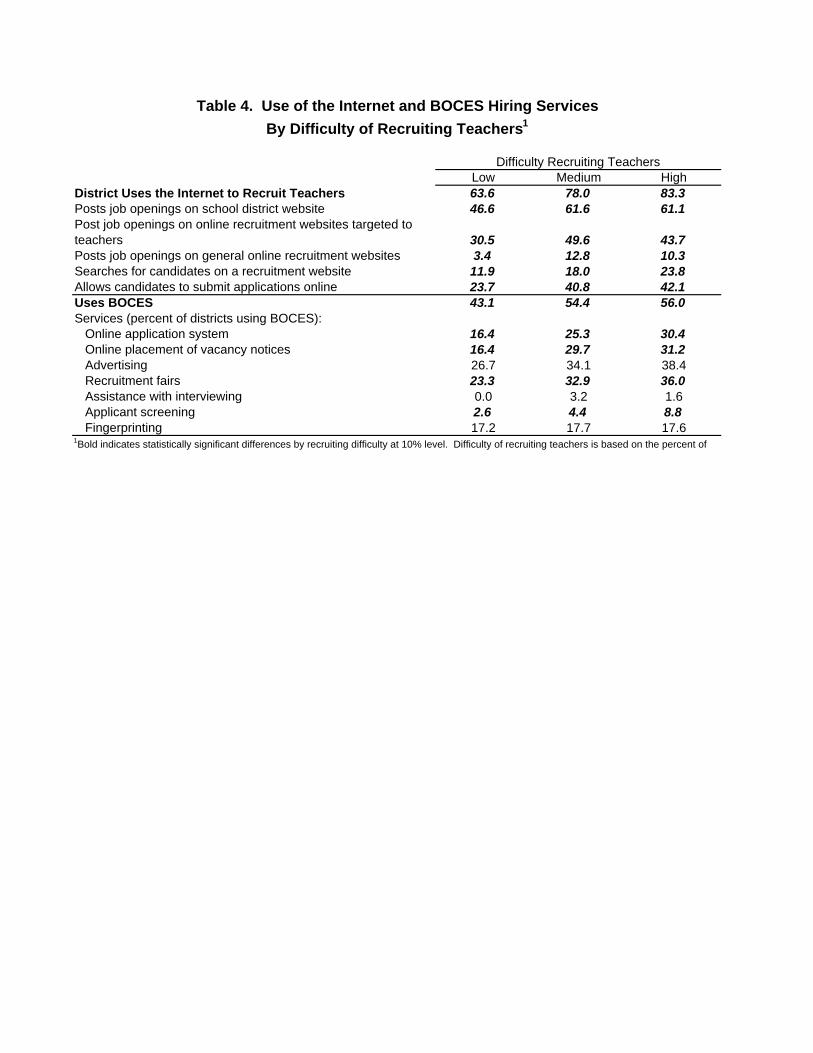
Almost three-quarters of superintendents responding to the survey said they used some type of
recruitment incentive (Table 5). However, only two of the incentives—compensation for extracurricular
activities and crediting teachers for experience outside the district—are used by almost half the districts.
The fact that these are the most common incentives is not surprising given that they are not likely to be
controversial provisions of teacher contracts. Approximately 16% of districts provide subsidized tuition at
local colleges, offer additional compensation for National Board Certification, and give credit for work
experience in non-teaching occupations. The only other incentive used by at least 25 school districts is
additional compensation in hard-to-staff fields. The use of incentives tends to go up with district size,
particularly additional compensation for National Board Certification.11 High need urban districts are
more likely to use incentives than other types of districts, particularly signing bonuses, additional
compensation for National Board Certification, subsidized college tuition, additional compensation for
hard-to-staff fields, and for extra-curricular or administrative functions. Use of recruiting incentives also
goes up with recruiting difficulty, particularly additional compensation for extra-curricular activities and
flexibility in crediting previous experience. However, districts with high recruiting difficulty are not more
likely to use nontraditional incentives such as signing bonuses or help with the purchase of a home.
<Table 5 about here>
Strategies to Increase Supply
Besides broadening the search outside the local area and using incentives to increase applications,
districts can try to expand the pool of potential teachers in the local area. Strategies to increase supply 11 Controlling for need/resource capacity, district size is positively related (and statistically significant) to use of all incentives except extra compensation for extracurricular activity and hard to staff fields and schools.
9

could include recruiting substitute teachers, retired teachers, former teachers, and alternatively certified
teachers, or providing incentives for paraprofessionals to become certified teachers. The first three
strategies can be implemented relatively easily (assuming these teachers are certified). Recruitment of
alternatively certified teachers could be a matter of dispute with the teachers’ union and assisting
paraprofessionals to become teachers is a longer term strategy.
Almost 90% of districts use some strategy to increase supply with recruiting of substitutes being
the most commonly used strategy (Table 6). Over 40% of districts recruit teachers certified through
alternative routes and 28% recruit retired teachers or provide assistance to paraprofessionals to become
teachers. Only 7% recruit former teachers. Use of supply strategies is not strongly related to district size
but larger districts are more likely to recruit substitutes and to assist paraprofessionals. High need districts
are not more apt to use these strategies than average need districts. The results in Table 6 suggest that
districts with high recruiting difficulties are more apt to use all of the strategies to increase supply except
recruiting former teachers.
<Table 6 about here>
Analysis of Factors Affecting Adoption of Recruitment Practices
So far, we have focused on frequencies and bivariate relationships among recruitment
practices and district characteristics. In this section of the paper, we examine multivariate
relationships using an exploratory model of adoption as a framework. We first use district size
as a single explanatory variable to confirm the importance of that characteristic suggested by the
previous analysis. Next, we add the exogenous variables, district stress and institutionalism of
practices, to the model. Finally, we use the complete model which includes the likely
endogenous variables, difficulty recruiting and management capacity.
Adoption Model
To model the adoption of teacher recruitment practices we draw from research in
economics and organization theory. We hypothesize that adoption of recruiting practices are
affected by district size, district fiscal and political stress, institutionalization of the practice
within the district’s peer group, and management capacity of the district (Figure 1). We will
briefly discuss each of these factors, before turning to measurement and model results.
10

Figure 1. Adoption Model
District Size
District Stress
Institutionalization
Management Capacity
Adoption of Practice
Adoption of practices could be affected by the size of the organization if there are
economies of scale in their implementation (Duncombe and Yinger, 2001). Typically,
economies of scale would arise in the short-run from significant fixed costs. In the case of
teacher recruiting, recruitment costs associated with organizing the process, developing
advertising material, organizing contacts with local colleges, and implementing a recruitment
website could be relatively fixed, and thus we might expect a positive relationship between their
adoption and district size. However, it is possible that these relationships are nonlinear, so we
examine different forms for enrollment.
The other factors in the model are drawn primarily from the organizational theory
literature. The institutionalization of a practice is the degree to which it has been accepted as a
standard in a given field (Rainey, 1997). Clearly, this should affect an organization’s decision of
whether or not to use the practice. Researchers have found that organizations adopt practices
because other similar organizations use them rather than on the basis of efficiency or
effectiveness considerations (e.g. Meyer and Rowan, 1983; DiMaggio and Powell, 1983; Pfeffer,
1982). In this case, we care not just about what is standard practice in human resources as a
whole, but specifically in what is considered standard practice in school districts. We expect that
the more standardized a given recruitment practice is in a school district’s peer group, the more
likely the district is to adopt it.
We are particularly interested in looking at the adoption of “innovative” practices.
Innovation is different from change that might be driven by institutionalization because it is, by
11

definition, a practice that is not the standard or state-of-the-art (Kimberly, 1981). This departure
from the norm does not necessarily have to be drastic, however, and thus the adoption of
individual practices within the larger process of recruitment may qualify as “innovative.”
Innovations are related to the organization’s conditions and can be influenced by both internal
and external or environmental factors (Hall, 2002). Organizational characteristics that may
influence the adoption of innovation include professionalization of organization members,
decentralization of power, and a low emphasis on efficiency and volume as opposed to quality
(Hage and Aiken, 1970). In the context of our study, we consider the management capacity of
the district. Many of the recruitment practices require devoting time to implement properly and
at least some of them require specialized knowledge or skill. We assume that the greater the
district’s capacity to manage the recruitment process, the more likely the district is to adopt more
and “innovative” practices.
With regard to environmental factors, district stress, both fiscal and political, is also
expected to affect the adoption of recruitment practices, though the direction of that effect is
unclear. It has been found that when facing adversity, less successful organizations are forced to
innovate, whereas more successful organizations are shielded from the adversity (Manns and
March, 1978). Thus, we might expect that school districts experiencing high levels of district
stress would be more likely to adopt “innovative” practices as a district must find new ways to
accomplish its goals in challenging circumstances. At the same time, however, it is possible that
greater stress limits the capacity for innovation. If certain innovative practices carry with them
high costs, for example, those districts facing fiscal stress may be unable to implement them.
Measurement
We have both discrete and continuous dependent variables. Most of our dependent
variables are dummies coded “1” if the district uses the practice and “0” if it doesn’t. We wanted
to look at practices that have some variation in reported use and so chose practices which more
than 20% and fewer than 80% of districts use. We did make a couple of exceptions to this
decision rule for practices that are of great interest despite being limited in use. Both in an effort
to increase variation and in the interest of focusing on innovation, we also collapsed some of the
individual practices within a given category into broader variables. For example, in the category
of advertising in various media outlets, we collapsed the more unusual advertising practices
12

(advertising in newspapers outside of the local area but within the state, in newspapers in other
states, and on the radio or television) into a variable called innovative advertising. The models
using these dependent variables were estimated using logistic regression. We include several
quasi-continuous variables as well; most are counts of the number of a certain type of practice
used and one is the month during which job offers are made. The models using these dependent
variables were estimated using ordered logistic regression.
The independent variables also include both discrete and continuous variables. In the
first stage of the model, we use three different measures of enrollment: enrollment; enrollment
and enrollment squared; and enrollment categories ranging from small to very large. In the
second and third stages of the model, we use enrollment and enrollment squared. District stress
is measured with four variables. The first, a standard measure of poverty, is the percentage of
students eligible for free or reduced price lunch. The second is the combined wealth ratio
(CWR) of the district, which is a measure of fiscal capacity developed by the New York State
Education Department that averages a property value index and income index. The third is the
number of budget defeats the district has faced in the last five years. The fourth and final stress
variable is the percentage of positions recruited that the district indicated were “very difficult” to
recruit.
Institutionalization is measured as the percentage of districts who share the same BOCES
that have adopted the practice. We hypothesize that districts view other districts as peers, and
are more likely to adopt a practice if a sizeable share of their peers adopt. Management capacity
is measured in three ways. The first variable is the presence of a human resource director on
district staff. The presence of a human resource director may indicate the level of
professionalization of human resource management in the district. The second is whether the
recruitment process is decentralized, defined as being managed at the school level or shared
between the district and school levels. Decentralization may not only affect the selection process
but may have an influence on what decisions are made about media outlets, college contacts, and
other strategies to expand supply. The third management variable is the number of positions
involved in the recruitment process. A broader set of actors involved in the recruiting process
could influence district choices; however, it is difficult to predict the direction of these effects.
13
Results
The bivariate analysis suggested that district size is related to the use of various
recruitment practices. We therefore estimated the effects of enrollment on the use of those
practices, using enrollment as the only explanatory variable. In order to observe some of the
nuance of the relationship, we used three different specifications of enrollment: enrollment;
enrollment and enrollment squared; and dummy variables for size categories. While each of
these specifications yields significant results for a portion of the practices, none yields significant
results for all of the practices (Table 7). For example, district size is very significant, under all
three specifications in predicting attendance at job fairs while it is unrelated, for the most part, to
the use of BOCES services. Enrollment is also important in the use of the internet, college
recruitment strategies, and of certain recruitment incentives, particularly additional compensation
for National Board Certification. These positive relationships are consistent with the existence
of economies of scale in spending on these practices. It is interesting to note that for a subset of
practices, the second specification shows a non-linear relationship between enrollment and
adoption. This subset includes use of the internet, college recruitment, attendance at job fairs,
and use of certain recruitment incentives.
<Table 7 about here>
Our next step is to look at a more complete adoption model by adding those variables
affecting adoption that are clearly outside district control. The first category is district stress, and
includes measures of fiscal capacity (CWR), the percent of students eligible for free or reduced
price lunch, and the number of budget defeats in the last five years. The second type is
institutionalization, measured as the percentage of districts in the district’s BOCES that use the
practice.
The first panel of Table 8 shows the results of this model for advertising, college
recruitment, and job fair attendance. Enrollment is negatively related to advertising in local
newspapers but that is the only form of advertising it is associated with in this model.
Interestingly, districts that have high poverty rates are more likely to advertise on radio and
television, a result echoed in the bivariate analysis. This, however, is the only significant
coefficient among district stress variables. The degree of institutionalization seems to have the
most effect on advertising practices, with a highly significant impact on “innovative” advertising,
14
which includes advertising in non-local and out-of-state newspapers as well as on the radio and
television.
<Table 8 about here>
With the exception of posting job notices on campus, all college recruitment practices are
positively related to enrollment size. Visiting campuses, advertising in newsletters, and the use
of “active” strategies (visiting campuses, contacting faculty, supervising student teachers) have
non-linear relationships with enrollment, while the other practices have positive linear
relationships. Here we see slightly more effect of district stress; fiscal capacity (CWR)
negatively affects posting job notices and advertising in news letters. We might assume this is
because districts with stronger tax bases are inherently more attractive to teachers and thus face
less need to recruit. The only practice affected by institutionalization is the use of any of these
strategies outside the state of New York. This is particularly interesting as recruiting outside the
state would be considered more “innovative,” suggesting that institutionalizing innovative
practices would encourage more districts to use them. With job fair attendance we see a similar
pattern. Enrollment is positively related to attendance at job fairs and non-linearly related to the
number of job fairs attended. Institutionalization increases attendance and districts with higher
fiscal capacity are less likely to attend job fairs.
Turning to the use of BOCES recruitment services, we see that only the degree of
institutionalization is significant for adoption (Table 9). It is possible that this result merely
reflects the fact that the availability of services differs from BOCES to BOCES. It is entirely
logical that those districts that share a BOCES are apt to take advantage of what is available and
thus use the same set of BOCES services. In the future we will examine other ways of measure
institutionalization that avoid this potential endogeneity. Institutionalization remains highly
significant for internet use, including “non-district” applications—posting job openings on
general recruitment websites, posting job openings on recruitment websites targeted to teachers,
and searching for candidates on recruitment websites. Enrollment is also significantly related to
the use of the internet and is non-linear.
<Table 9 about here>
The pattern of the importance of enrollment and institutionalization holds up fairly well
for the use of supply increasing practices and recruiting incentives (Table 10). Interestingly, we
see that institutionalization again supports the use of “innovative” strategies when it comes to
15
increasing teacher supply (recruiting teachers certified through alternative routes, recruiting
former teachers, and recruiting retired teachers) but not when it comes to the use of “innovative”
recruiting incentives (signing bonuses, crediting job experience in non-teaching occupations,
compensation for hard-to-staff-schools and –fields, and help with the purchase of a home). It is
likely that the use of innovative incentives is significantly hindered by the strength of the unions
in New York State school districts and that those effects swamp any others.
< Table 10 about here >
In the third and final stage of our analysis, we use the complete adoption model and add
potentially endogenous variables. These include a measure of teacher recruiting difficulty in the
district (put in the district stress category) and three management capacity variables--the
presence of an HR director, decentralization of the recruiting process, and the number of
positions involved in recruitment. Ideally, we would find appropriate instruments and estimate
these models using an IV method.12 Time limits have prevented us from taking this step for this
paper. Accordingly, the results should be viewed as exploratory only given the potential
simultaneity bias.
The results of this model are displayed in the second panels of Tables 8, 9 and 10. In
general, enrollment continues to be significantly related to adoption of these practices. While
other district stress variables are still limited in their importance, the measure of teacher
recruitment difficulty is quite significant for several groups of practices. Management capacity
variables are also important for several sets of practices.
Those districts that report difficulty in recruiting teachers and have higher rates of
poverty are more likely to advertise on the radio and television (Table 8). This follows from the
result of the bivariate analysis that showed that high need rural districts are more likely than any
other type to use these media outlets. The presence of an HR director is negatively related to
advertising in local newspapers, suggesting that HR directors are more likely to use “innovative”
practices and focus efforts outside of the local area. The number of positions involved in
recruitment is positively related with local and non-local newspaper advertising but negatively
related with radio/TV advertising. This negative relationship may again be picking up the high
need rural districts that cannot devote much in the way of staff resources to recruiting.
12 Whether the recruitment difficulty is endogenous depends on whether district response to this question was influenced by the types of hiring practices used by the district. We will test its endogeneity in future rounds of this research.
16

Adoption of college recruitment practices does not appear strongly related to most of the
management variables. Difficulty recruiting does have significant positive effects on advertising
in newsletters, contacting faculty, and the use of college recruiting outside of New York. This
last relationship suggests that, as the innovation literature indicates, “innovative” strategies may
be a response to adversity. Both difficulty recruiting and management capacity affect job fair
attendance. Districts that face more difficulty in recruiting are more likely to attend job fairs and
as their difficulty increases so does the number of job fairs they attend. It is logical that the
number of positions involved in recruiting increases job fair attendance as there are more staff
people to attend. At the same time, it makes sense that a district that employs a more
decentralized process would be less likely to attend job fairs as that may be a practice best
promoted and organized by central administration.
The use of BOCES recruitment services is affected by management capacity (Table 9).
Districts that have HR directors are more likely to use a greater number of BOCES services than
those that don’t and districts with a decentralized recruiting process are less likely to use any
BOCES services, particularly the “active” services. This finding might be due to the fact that an
HR director (or a “point person” in centralized processes) would have an easier time functioning
as a liaison with the BOCES, building a relationship, keeping apprised of available services, and
coordinating the acquisition of those services. The only management capacity variable related to
internet use is the number of number of positions involved in recruiting. Internet use, including
use of “non-district” internet applications, is very significantly affected by the difficulty the
district has in recruiting teachers. This result suggests again that districts are innovating in
response to adversity.
Not surprisingly, difficulty recruiting has a highly significant and positive effect on the
use of strategies to increase the supply of teachers (Table 10). The greater difficulty a district
faces, the greater the number of these strategies it uses, particularly “innovative” strategies. The
most significant result is for recruiting retired teachers, a practice that only 28% of districts
report using. Management capacity also has an effect here. Those districts with HR directors are
less likely to provide assistance to paraprofessionals to become certified teachers, perhaps
because HR directors—professionalized specialists—are more likely to want to recruit
professionals. The more decentralized the process, the less likely districts are to recruit teachers
certified through alternative routes, perhaps because that effort requires specialized knowledge of
17

alternative programs which may be more likely to reside with a central administrator. The
number of positions involved in recruitment increases the number of strategies a district uses and
its likelihood of using innovative strategies. This, too, seems logical as the more people are
involved, the more ground they can cover.
Management capacity does not have much effect on the use of recruiting incentives,
however. The one exception is that the more positions involved, the more likely the district to
credit experience in non-teaching occupations. The explanation for this relationship is not
readily apparent but, perhaps, involving more people increases the likelihood that the recruitment
team will include people who recognize the potential value in such experience. As expected,
difficulty in recruiting does have a positive effect on the use and number of recruiting incentives.
Of particular note is the increase in the use of “innovative” incentives as recruiting difficulties
increase.
Conclusions
The survey results have provided a rich picture of the hiring process in New York school districts.
We have documented the use of a wide range of practices and how they vary with school district
characteristics. We have also developed a model to explain the adoption of district recruitment practices.
While some factors, such as enrollment, appear to be consistently related to hiring practices, hiring
practices are complex and not easily explained by socio-economic variables. In this section, we will pull
together some of the conclusions that we have drawn from reviewing the results. These should be viewed
as preliminary conclusions, which will undoubtedly be modified as we analyze the data further.
Local newspapers remain the major form of advertising, especially in small districts. The degree
of institutionalization of advertising practices has a significant impact on their use, especially when it
comes to advertising beyond local newspapers.
The most common college recruitment strategies used by districts are supervision of student
teachers, posting of job notices at the colleges, and contacting college faculty in local colleges. The
employment of these strategies increases with district enrollment and, unlike most practices we examined,
is influenced by some district stress effects.
The typical district attends one job fair, and 37% of districts attend no job fairs. Attendance at job
fairs goes up significantly with enrollment, institutionalization, difficulty recruiting, and the number of
positions involved in recruitment.
18
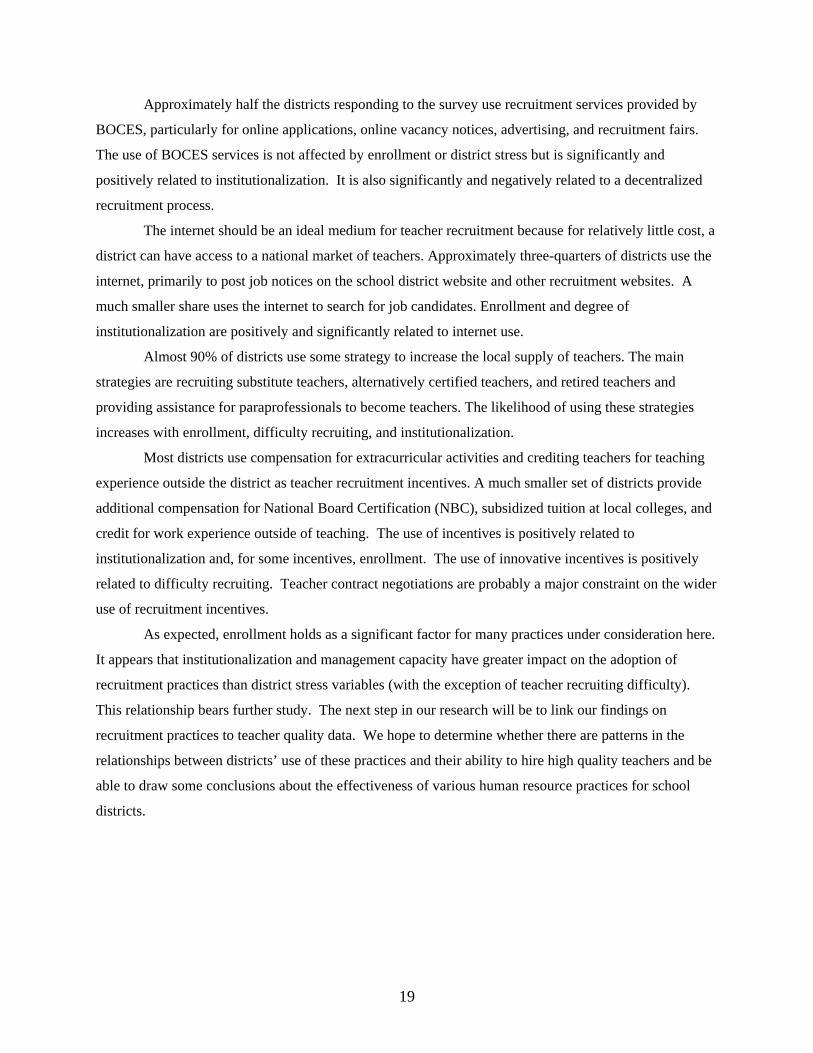
Approximately half the districts responding to the survey use recruitment services provided by
BOCES, particularly for online applications, online vacancy notices, advertising, and recruitment fairs.
The use of BOCES services is not affected by enrollment or district stress but is significantly and
positively related to institutionalization. It is also significantly and negatively related to a decentralized
recruitment process.
The internet should be an ideal medium for teacher recruitment because for relatively little cost, a
district can have access to a national market of teachers. Approximately three-quarters of districts use the
internet, primarily to post job notices on the school district website and other recruitment websites. A
much smaller share uses the internet to search for job candidates. Enrollment and degree of
institutionalization are positively and significantly related to internet use.
Almost 90% of districts use some strategy to increase the local supply of teachers. The main
strategies are recruiting substitute teachers, alternatively certified teachers, and retired teachers and
providing assistance for paraprofessionals to become teachers. The likelihood of using these strategies
increases with enrollment, difficulty recruiting, and institutionalization.
Most districts use compensation for extracurricular activities and crediting teachers for teaching
experience outside the district as teacher recruitment incentives. A much smaller set of districts provide
additional compensation for National Board Certification (NBC), subsidized tuition at local colleges, and
credit for work experience outside of teaching. The use of incentives is positively related to
institutionalization and, for some incentives, enrollment. The use of innovative incentives is positively
related to difficulty recruiting. Teacher contract negotiations are probably a major constraint on the wider
use of recruitment incentives.
As expected, enrollment holds as a significant factor for many practices under consideration here.
It appears that institutionalization and management capacity have greater impact on the adoption of
recruitment practices than district stress variables (with the exception of teacher recruiting difficulty).
This relationship bears further study. The next step in our research will be to link our findings on
recruitment practices to teacher quality data. We hope to determine whether there are patterns in the
relationships between districts’ use of these practices and their ability to hire high quality teachers and be
able to draw some conclusions about the effectiveness of various human resource practices for school
districts.
19

References
Ballou, D. (1996). Do public schools hire the best applicants? Quarterly Journal of Economics, 111(1), 97-133.
Ballou, D., & Podgursky, M. (1998). Teacher recruitment and retention in public and private schools.
Journal of Policy Analysis and Management, 17(3), 393-417. Baugh, W. & Stone, J. (1982). Mobility and wage equilibrium in the educator labor market. Economics of
Education Review, 2(3), 253-274. Boyd, D., Lankford, H., Loeb, S., & Wyckoff, J. (2004). The draw of home: How teachers’ preferences
for proximity disadvantage urban schools. Journal of Policy Analysis and Management 24(1): 113-132.
Clewell, B., Darke, K., Davis-Googe, T., Forcier, L. & Manes, S. (2000). Literature Review on Teacher
Recruitment Programs. Washington D.C.: The Urban Institute. Dillman, D. (2000) Mail and internet surveys, The tailored design method. New York, NY: John Wiley
and Sons, Inc. DiMaggio, P. J. and Pwell, W. R. (1983). The Iron Cage Revisited: Institutional Isomorphism and
Collective Rationality in Organizational Fields. American Sociological Review. 48: 147-160. Dolton, P., Makepeace, G., & Van Der Klaauw, W. (1999). The turnover of teachers: A competing risks
explanation. Review of Economics and Statistics, 81(3): 543-552. Duncombe, William and John Yinger. (2001). Does school district consolidation cut costs?” Center for
Policy Research Working Paper No. 33, The Maxwell School. Syracuse, NY: Syracuse University, January.
Education Research Service. (2001) Finding and keeping high-quality teachers. The Informed Educator
Series. pp. 1-12. Ferguson, R. F. (1998). Can schools narrow the black-white test score gap. In C. Jencks & M. Phillips
(Eds.), The Black-White Test Score Gap (pp. 318 - 374). Washington, DC: The Brookings Institution. Fox, J. & Certo, J. (1999). Recruiting and Retaining Teachers: A Review of the Literature. Richmond,
VA: Metropolitan Educational Research Consortium. Goldhaber, D. D. (2002). The mystery of good teaching. Education Next, 2(1), 50-55. Goldhaber, D. D., Brewer, D. J., & Anderson, D. J. (1999). A three-way error components analysis of
educational productivity. Education Economics, 7(3), 199-208. Hage, J. & Aiken, M. (1970). Social Change in Complex Organizations. New York: Random House. Hall, R. H. (2002). Organizations: Structures, Processes, and Outcomes, 8th edition. Saddle River, NJ:
Prentice Hall.
20

Hanushek, E. A., Kain, J.F., & Rivkin, S. G. (2001). Why public schools lose teachers. Working Paper No. 8599. Cambridge: National Bureau of Economic Research.
Hanushek, E. A., Kain, J. F., & Rivkin, S. G. (2002). Teachers, schools, and academic achievement.
Working Paper No. 6691 (No. Working Paper No. 6691). Cambridge: National Bureau of Economic Research.
Hirsch, R. (2001). Teacher Recruitment: Staffing Classrooms with Quality Teachers. Denver, CO:
National Conference of State Legislatures. Hussar, W. J. Predicting the need for newly hired teachers in the United States to 2008- 09. Washington, DC: National Center for Education Statistics. Imazeki, J. (1999). Moving on or moving out? Determinants of job and career changes for teachers.
Unpublished paper prepared for University of Wisconsin. Ingersol, R. (2002) “The Teacher Shortage: A Case of Wrong Diagnosis and Wrong Prescription.”
National Association of Secondary School Principals Bulletin 86(June): 16-31. Kimberly, J. R. (1981). Managerial Innovation. In Handbook of Organizational Design, Vol. 1. P. C.
Nystrom and W. H. Starbuck (Eds.). New York: Oxford University Press. Lankford, H., Loeb, S., & Wyckoff, J. (2002). Teacher sorting and the plight of urban schools: A
descriptive analysis. Educational Evaluation and Policy Analysis, 24(1), 37 - 62. Liu, E. (2002). New teachers' experiences of hiring: New Jersey. Unpublished paper prepared for
Harvard Graduate School of Education, Project on the Next Generation of Teachers. Loeb, S. (2000). How Teachers’ Choices Affect What a Dollar Can Buy: Wages and Quality in K-12
Schooling. Proceedings from the Symposium on the Teaching Workforce. Albany, New York, Education Finance Research Consortium, November 8.
Loeb, S. (2001). Teacher quality: Its enhancement and potential for improving student achievement. In P.
Monk, H. Walberg, and M. Wang (Eds.), Improving Educational Productivity (pp. 99-114). Greenwich, CT: Information Age Publishing.
Manns, C. L. & March, J. G. (1978). Financial Adversity, Internal Competition, and Curricular Change
in a University. Administrative Science Quarterly, 23, 541-52. Meyer, J. W. & Rowan, B. (1983). Institutionalized Organizations: Formal structure as Myth and
Ceremony.” In J. W. Meyer and W. R. Scott (Eds.), Organizational Environments: Ritual and Rationality. Thousand Oaks, CA: Sage Publishing.
Murnane, R. & Olsen, R. (1990). The effects of salaries and opportunity costs on length of stay in
teaching: Evidence from North Carolina. Journal of Human Resources, 25(1): 106-124. National Center for Education Statistics (2004). Teacher Attrition and Mobility: Results From the
Teacher Follow-up Survey, 2000-2001. Washington, DC.: U.S. Department of Education.
21

Oakes, J., Gamoran, A., & Page, R.N. (1992). Curriculum differentiation: Opportunities, Outcomes and Meaning. In P.W. Jackson (Ed.), Handbook of Research on Curriculum (pp. 570-608). Washington, DC: American Educational Research Association.
Pathways to Teaching Careers. (1997). Recruiting, Preparing and Retaining Teachers for America’s
Schools. Pleasantville, NY: DeWitt Wallace/Reader’s Digest Fund. Pfeffer, J. (1982). Organizations and Organization Theory. Boston, MA: Pitman. Pynes, J. E. (1997). Human Resources Management for Public and Nonprofit Organizations. San
Francisco: Jossey-Bass Publishers. Rainey, H. G. (1997). Understanding and Managing Public Organizations. San Francisco: Jossey-Bass
Publishers. Southwest Center for Teacher Quality. (2002). Recruiting Teachers for Hard-to-Staff Schools. Chapel
Hill, NC: The University of North Carolina. Stinebrickner, T. R. (1998). An empirical investigation of teacher attrition. Economics of Education
Review, 17 (2), 127-136. Strauss, R. P., Bowes, L. R., Marks, M. S., & Plesko, M. R. (1998). Teacher Performance and Selection
in Pennsylvania. Report prepared for the Pennsylvania State Board of Education. Strauss, R. P., Bowes, L. R., Marks, M. S., & Plesko, M. R. (2000). Improving teacher preparation and
selection: lessons from the Pennsylvania experience. Economics of Education Review, 19(4), 387-415.
Webb, L. D., & Norton, M. S. (1999). Human Resources Administration: Personnel Issues and Needs in
Education (Third ed.). Upper Saddle River, NJ: Prentice-Hall, Inc.
22

Districts DistrictsAll Districts In Survey Not in Survey
Enrollment Variables: Enrollment (dcaadm) 2,676 2,681 2,545 Percent nonwhite enrollment 11.5 10.9 13.0 Percent Hispanic enrollment 4.5 4.1 5.3 Percent LEP students 1.4 1.2 1.8 Percent of free lunch students 29.4 29.0 30.3 Child poverty rate (2000) 11.6 11.5 12.1 Percent single mother families 6.3 6.2 6.5
Financial Variables: Per pupil total spending $16,565 $16,284 $17,269 Per pupil operating spending $14,389 $14,256 $14,725 Per pupil spending on teaching $8,539 $8,420 $8,839 Per pupil state aid $5,680 $5,694 $5,645 Per pupil local taxes $7,940 $7,871 $8,115 Local property tax rate (per $1000 of MV) 17.1 15.8 20.3 Combined wealth ratio (CWR) 1.20 1.20 1.17 Per pupil income (AGI) $142,584 $137,845 $154,467 Per pupil market property values $657,545 $688,163 $580,604
Teacher Variables (all teachers): Salary $46,465 $46,694 $45,890 Adjusted salary index2 1.00 1.00 1.00 Total experience 16.5 16.6 16.2 Percent with graduate degree 73.6 73.2 74.5 Percent probationary 25.4 25.0 26.2 Percent tenured 71.5 71.8 70.5 Percent female 73.6 73.5 73.8District Classifications (percent of all districts): SED regions Large and small city districts 8.8 8.8 8.8 Upstate and downstate suburban districts 60.5 60.0 61.7 Upstate rural districts 30.2 30.5 29.5 Downstate districts 26.0 23.8 31.6 Upstate districts 74.0 76.2 68.4 Need/resource capacity categories High need urban districts3 6.0 5.5 7.3 High need rural districts 23.5 21.7 28.0 Average need districts 50.2 54.9 38.3 Low need districts 19.7 17.2 25.9
2Teacher salaries adjusted for years of experience and education level.3Includes the categories for large cities and other high need urban districts.
Table 1. Evaluation of Whether Sample Responding to Teacher Hiring Survey Is Representative of All Districts In New York1
p , p , ,2000 Census of Population .1Bold and italics indicates a statistically signficant difference between districts completing the survey and those not completing

Enrollment2 Low Medium High All DistrictsDate of first advertisements (months) 4.1 3.7 3.0 3.6Date of typical offer (months) 6.1 5.8 5.7 5.9
Local newspapers/periodicals (within 50 miles) 86.6 81.0 71.1 79.7Other newspapers/periodicals in New York 24.5 19.0 31.8 24.8Newspapers/periodicals in other states 1.4 1.8 0.7 1.3Education trade publications/periodicals 2.1 3.0 5.5 3.5Radio/television 2.2 0.6 0.7 1.1
SED Need/Resource Capacity CategoriesHigh Need
UrbanHigh Need
Rural Average Need Low NeedDate of first advertisements (months) 3.5 4.1 3.6 3.1Date of typical offer (months) 6.4 6.1 5.9 5.4
Local newspapers/periodicals (within 50 miles) 70.4 86.8 81.7 66.3Other newspapers/periodicals in New York 19.2 26.7 19.2 42.0Newspapers/periodicals in other states 0.0 3.2 1.1 0.0Education trade publications/periodicals 7.7 6.1 1.5 5.0Radio/television 0.0 3.1 0.8 0.0
2"Low" is below 30th percentile, "medium" is 30th to 70th percentile, and "high" is above the 70th percentile.
Table 2. Advertising for Teachers in Media Outlets by District Characteristics(percent of responses with "most" or "all" advertisements)1
1Bold and italics indicates that there is a statistically significant difference between the categories (10% level).

Enrollment2 Low Medium High All Districts Low Medium High All DistrictsPost job notices at the college 77.7 83.6 86.8 82.7 54.5 50.7 54.4 53.0Visit campus to actively recruit job candidates 42.6 63.0 82.5 67.8 23.4 17.8 42.7 30.0Advertise in placement newsletter distributed by college 54.7 59.7 69.4 61.7 42.2 36.1 47.2 41.6Contact specific college faculty to identify potential job candidates 76.3 80.7 84.5 80.5 31.2 26.9 37.3 31.3Supervise student teachers from the college 84.4 86.1 90.0 86.8 18.0 21.2 37.1 25.3
SED Need/Resource Capacity Categories
High Need Urban
High Need Rural
Average Need Low Need
High Need Urban
High Need Rural
Average Need Low Need
Post job notices at the college 73.9 76.7 86.6 79.2 34.8 59.3 54.0 45.8Visit campus to actively recruit job candidates 92.3 46.7 71.9 70.5 30.8 26.7 32.8 25.0Advertise in placement newsletter distributed by college 58.3 57.1 66.9 48.3 33.3 46.9 43.5 27.6Contact specific college faculty to identify potential job candidates 78.9 81.7 79.9 82.0 31.6 31.0 32.3 28.0Supervise student teachers from the college 80.0 86.2 86.5 91.2 44.0 21.3 25.4 23.5
1Bold and italics indicates that there is a statistically significant difference between the categories (10% level). 2"Low" is below 30th percentile, "medium" is 30th to 70th percentile, and "high" is above the 70th percentile. 3Local colleges are those within 50 miles of the district.
Table 3. Location of Colleges Where Districts Using Recruitment StrategiesBy District Characteristics
(percent of responses using recruitment strategy)1
Local Colleges3 Non-Local Colleges
Low Medium HighDistrict Uses the Internet to Recruit Teachers 63.6 78.0 83.3Posts job openings on school district website 46.6 61.6 61.1Post job openings on online recruitment websites targeted to teachers 30.5 49.6 43.7Posts job openings on general online recruitment websites 3.4 12.8 10.3Searches for candidates on a recruitment website 11.9 18.0 23.8Allows candidates to submit applications online 23.7 40.8 42.1Uses BOCES 43.1 54.4 56.0Services (percent of districts using BOCES):
Online application system 16.4 25.3 30.4Online placement of vacancy notices 16.4 29.7 31.2Advertising 26.7 34.1 38.4Recruitment fairs 23.3 32.9 36.0Assistance with interviewing 0.0 3.2 1.6Applicant screening 2.6 4.4 8.8Fingerprinting 17.2 17.7 17.6
Table 4. Use of the Internet and BOCES Hiring ServicesBy Difficulty of Recruiting Teachers1
Difficulty Recruiting Teachers
1Bold indicates statistically significant differences by recruiting difficulty at 10% level. Difficulty of recruiting teachers is based on the percent of

Enrollment2 Low Medium High All DistrictsDistrict offers recruiting incentives 66.0 75.6 76.3 72.8
One-time compensation for new teachers (signing bonus) 1.3 2.8 2.6 2.3Additional compensation for extra-curricular or administrative functions 45.1 48.9 55.9 49.9Flexibility in crediting teaching experience in other districts or states 41.8 49.4 50.7 47.4Flexibility in crediting job experience in non-teaching occupations 19.0 15.0 18.4 17.3Additional compensation for National Board Certification 8.5 13.3 25.7 15.7Subsidized tuition in local college 15.7 16.1 17.8 16.5Additional compensation for teaching in hard-to-staff fields 9.2 6.1 7.2 7.4Additional compensation for teaching in hard-to-staff schools 0.7 0.6 0.0 0.4Help with purchase of a home 0.7 1.1 0.7 0.8
SED Need/Resource Capacity Categories High Need High Need Average Low NeedDistrict offers recruiting incentives 89.3 75.7 71.3 67.9
One-time compensation for new teachers (signing bonus) 10.7 4.7 1.5 0.0Additional compensation for extra-curricular or administrative functions 64.3 52.3 49.1 41.7Flexibility in crediting teaching experience in other districts or states 39.3 45.8 48.0 47.6Flexibility in crediting job experience in non-teaching occupations 10.7 15.0 17.8 19.0Additional compensation for National Board Certification 28.6 9.3 16.4 16.7Subsidized tuition in local college 21.4 14.0 19.3 8.3Additional compensation for teaching in hard-to-staff fields 17.9 11.2 5.1 6.0Additional compensation for teaching in hard-to-staff schools 0.0 0.0 0.7 0.0Help with purchase of a home 3.6 1.9 0.4 0.0
Difficulty Recruiting Teachers Low Medium HighDistrict offers recruiting incentives 63.8 75.7 75.4
One-time compensation for new teachers (signing bonus) 1.7 2.5 2.4Additional compensation for extra-curricular or administrative functions 41.4 50.6 56.3Flexibility in crediting teaching experience in other districts or states 35.3 52.3 49.2Flexibility in crediting job experience in non-teaching occupations 7.8 19.8 21.4Additional compensation for National Board Certification 10.3 18.1 15.9Subsidized tuition in local college 11.2 17.3 19.8Additional compensation for teaching in hard-to-staff fields 6.0 7.4 8.7Additional compensation for teaching in hard-to-staff schools 0.0 0.4 0.8Help with purchase of a home 0.9 0.8 0.8
2"Low" is below 30th percentile, "medium" is 30th to 70th percentile, and "high" is above the 70th percentile.
Table 5. Use of Teacher Recruitment Incentives by District Characteristics(percent of responses)1
1Bold and italics indicates that there is a statistically significant difference between the categories (10% level).

Enrollment2 Low Medium High All DistrictsUse Strategy to Increase Supply 83.0 87.8 89.5 86.8
Recruit teachers certified through alternative routes 40.5 40.0 50.0 43.3Recruit substitute teachers 73.2 81.1 83.6 79.4Recruit retired teachers 27.5 27.2 30.3 28.2Recruit former teachers who have left teaching 9.2 5.0 8.6 7.4Provide assistance to paraprofessionals to become certified teachers 24.2 24.4 35.5 27.8
SED Need/Resource Capacity CategoriesHigh Need
UrbanHigh Need
RuralAverage
Need Low NeedUse Strategy to Increase Supply 85.7 86.0 89.5 79.8
Recruit teachers certified through alternative routes 46.4 41.1 46.5 36.9Recruit substitute teachers 82.1 71.0 83.6 73.8Recruit retired teachers 28.6 27.1 28.7 26.2Recruit former teachers who have left teaching 7.1 8.4 7.6 6.0Provide assistance to paraprofessionals to become certified teachers 39.3 26.2 25.8 28.6
Difficulty Recruiting Teachers Low Medium HighUse Strategy to Increase Supply 77.6 88.5 92.1
Recruit teachers certified through alternative routes 23.3 51.4 46.0Recruit substitute teachers 71.6 81.5 82.5Recruit retired teachers 19.0 26.7 39.7Recruit former teachers who have left teaching 7.8 7.0 7.9Provide assistance to paraprofessionals to become certified teachers 20.7 28.4 33.3
Table 6. Use of Strategies to Increase Supply of Teachers by District Characteristics(percent of responses)1
1Bold and italics indicates that there is a statistically significant difference between the categories (10% level). 2"Low" is below 30th percentile, "medium" is 30th to 70th percentile, and "high" is above the 70th percentile.

Practice Enrollment Enrollment Enrollment2 Small Medium Large Very Large
Advertising Local newspapers -0.0001119 *** -0.0001435 ** 1.73E-09 0.2529965 -0.2543749 -0.7101255 -0.9826134 ** Other NY newspapers 0.0000294 0.0001512 * -7.75E-09 0.0870114 -0.2666287 0.3527145 0.5531011 Radio/TV -0.0000919 -0.0001613 3.94E-09 -1.419817 -2.032922 * -0.71562 "Innovative" advertising1 0.0000312 0.0001521 * -7.77E-09 0.0921153 -0.2174129 0.3566749 0.567984
Use of Internet Any use 0.0001692 *** 0.0002429 **** -5.48E-09 ** 0.9093703 *** 1.220902 **** 1.585627 **** 2.24071 **** Accepting online applications 0.0000383 0.0004461 **** -3.60E-08 *** 0.6546052 1.064984 *** 1.764646 **** 1.011907 ** "Non-district" internet applications2 0.000041 0.000058 -8.63E-10 0.6161861 * 0.4801184 0.9178399 *** 0.9461437 **
Use of BOCES Any services -0.0000206 0.0001203 -1.13E-08 0.194156 0.2666287 0.5596158 -0.0425596 Number of services -0.0000158 0.0001286 -1.20E-08 0.2274969 0.3259859 0.6725436 ** -0.0424303 "Passive" services3 -0.0000196 0.0000704 -7.12E-09 0.1304402 0.2995165 0.4756461 -0.086146 "Active" services4 -7.48E-06 0.000113 -9.32E-09 0.3413622 0.4764621 0.8021774 ** 0.086146
Use of College RecruitmentPost job notices at the college 0.0000296 0.0000406 -5.89E-10 0.6481 * 0.8486259 *** 0.4899644 1.005522 **Visit campus to actively recruit job candidates 0.000286 **** 0.0006029 **** -2.38E-08 **** 0.2424678 0.7492366 * 1.94591 **** 2.908721 ****Advertise in placement newsletter distributed by college 0.000031 0.0002738 *** -1.94E-08 ** 0.2841043 0.1152353 0.4353181 0.8668107 **Contact specific college faculty to identify potential job candidates 0.0000978 ** 0.0001223 ** -1.81E-09 -0.0153142 0.2282187 0.3780661 0.8443782 **"Active" strategies5 0.0002012 ** 0.0002953 *** -6.92E-09 ** 0.2583075 1.193922 *** 1.382717 *** 1.589235 **Any strategies at colleges outside NY 0.0001721 **** 0.0002091 **** -2.55E-09 0.9663572 0.9214058 1.798585 *** 2.157219 ****"Active" strategies at colleges outside NY 0.0001983 **** 0.0002434 **** -3.97E-09 0.3302417 0.3803592 1.098612 *** 1.734601 ****
Job FairsAttend any job fairs 0.0004477 **** 0.0005194 **** -1.03E-08 *** 0.5718712 1.027492 *** 1.876994 *** 3.036975 ****Number of job fairs attended 0.0003166 **** 0.0005004 **** -1.08E-08 **** 0.4853903 1.075634 **** 2.188225 **** 3.247251 ****
Use of Strategies to Increase Supply
Recruit teachers certified through alternative routes 0.0000696 ** 0.0000631 4.44E-10 0.5034455 0.3166696 0.6821294 * 0.7990958 **Recruit substitute teachers 0.0001289 ** 0.0001268 2.27E-10 0.1565239 0.5543784 0.4834266 1.337842 **Recruit retired teachers 0.0000308 5.28E-06 1.17E-09 0.189242 0.1152353 0.2513144 0.2876821Provide assistance to paraprofessionals to become certified teachers 0.0001271 **** 8.50E-06 1.11E-08 -0.3755377 -0.2255975 0.0074837 0.8259067 **Any strategy to increase supply 0.0001473 ** 0.000063 1.08E-08 -0.1762792 0.2668045 0.1105419 1.514128 *Number of strategies used to increase supply 0.0001054 **** 0.00008 * 1.36E-09 0.0821014 0.1414534 0.3844467 0.8823666 **"Innovative" strategies to increase supply 6 0.0000447 0.0000453 -3.77E-11 0.2186892 0.2231436 0.4895482 0.3894648
Recruiting IncentivesAdditional compensation for extra-curricular or administrative functions 0.0000308 0.0000217 4.91E-10 0.4105802 0.4255519 0.7111657 ** 0.7018052 *Flexibility in crediting teaching experience in other districts or states 0.0000719 ** 0.0000592 9.63E-10 -0.0297129 0.2879318 0.2301122 0.5419565Flexibility in crediting job experience in non-teaching occupations 0.0000504 -0.0000732 7.56E-09 0.3672439 -0.029853 0.04652 0.5007753
Enrollment Categories
Table 7. Impact of Enrollment on Recruitment Practices
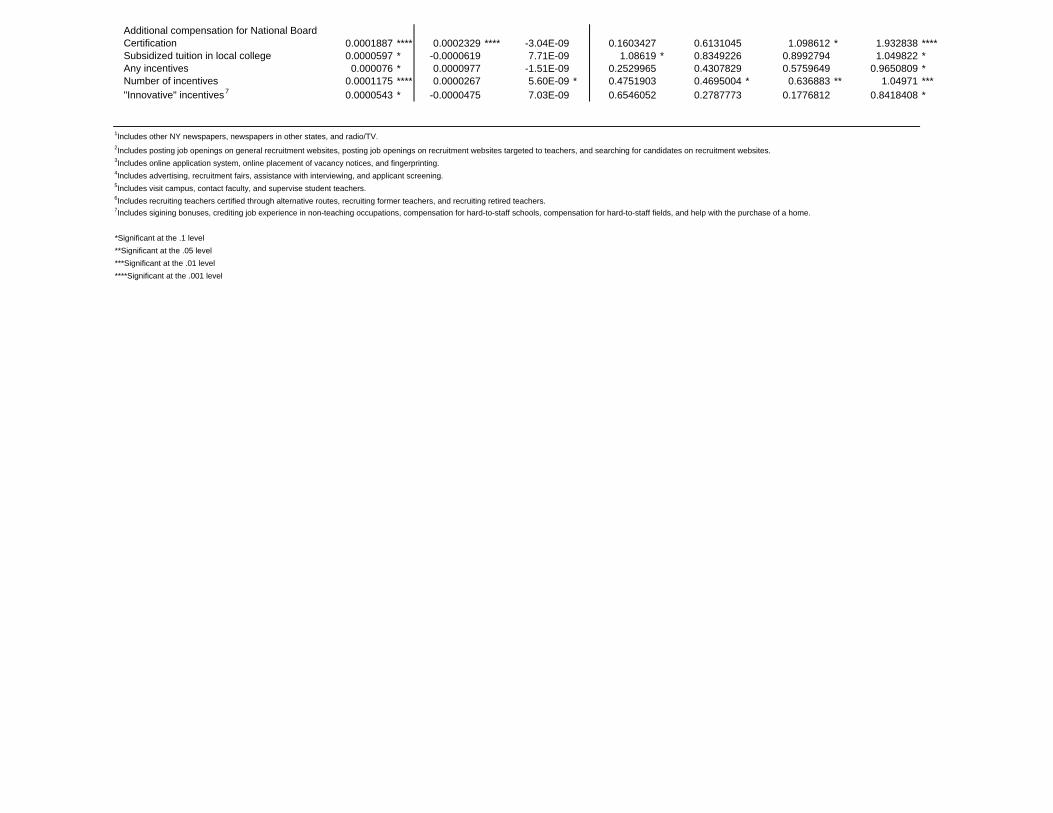
Additional compensation for National Board Certification 0.0001887 **** 0.0002329 **** -3.04E-09 0.1603427 0.6131045 1.098612 * 1.932838 ****Subsidized tuition in local college 0.0000597 * -0.0000619 7.71E-09 1.08619 * 0.8349226 0.8992794 1.049822 *Any incentives 0.000076 * 0.0000977 -1.51E-09 0.2529965 0.4307829 0.5759649 0.9650809 *Number of incentives 0.0001175 **** 0.0000267 5.60E-09 * 0.4751903 0.4695004 * 0.636883 ** 1.04971 ***"Innovative" incentives7 0.0000543 * -0.0000475 7.03E-09 0.6546052 0.2787773 0.1776812 0.8418408 *
*Significant at the .1 level**Significant at the .05 level***Significant at the .01 level****Significant at the .001 level
7Includes sigining bonuses, crediting job experience in non-teaching occupations, compensation for hard-to-staff schools, compensation for hard-to-staff fields, and help with the purchase of a home.
3Includes online application system, online placement of vacancy notices, and fingerprinting.4Includes advertising, recruitment fairs, assistance with interviewing, and applicant screening.5Includes visit campus, contact faculty, and supervise student teachers.6Includes recruiting teachers certified through alternative routes, recruiting former teachers, and recruiting retired teachers.
1Includes other NY newspapers, newspapers in other states, and radio/TV.2Includes posting job openings on general recruitment websites, posting job openings on recruitment websites targeted to teachers, and searching for candidates on recruitment websites.
(1st panel: exogenous variables; 2nd panel: exogenous and endogenous variables)
Table 8. Results of Modeling Adoption of Advertising and Use of College Recruitment Strategies
Advertising Use of College Recruitment Job Fairs
Loc
al
new
spap
ers
Oth
er N
Y ne
wsp
aper
s
Rad
io/T
V
"In
nova
tive"
ad
verti
sing
1
Post
job
notic
es
Visi
t cam
pus
Adve
rtise
in
new
slet
ter
Con
tact
col
lege
fa
culty
"Act
ive"
st
rate
gies
2
Any
stra
tegi
es
outs
ide
NY
"Act
ive"
st
rate
gies
ou
tsid
e N
Y
Atte
nd a
ny jo
b fa
irs
Num
ber o
f job
fa
irs a
ttend
ed
District Size Enrollment -0.0001 *** 3.46E-05 -2.33E-05 3.54E-05 2.14E-05 0.000563 **** 0.000295 *** 0.000101 *** 0.000276 *** 0.000161 **** 0.000199 **** 0.000385 **** 0.000452 **** Enrollment squared -2.18E-08 **** -1.97E-08 ** -6.50E-09 ** -9.91E-09 ****
District Stress Combined wealth ratio -0.0766 0.060755 -1.03444 0.04708 -0.26112 *** -0.14748 -0.37131 ** -0.02392 -0.0777 -0.04087 -0.09555 -0.15733 * -0.14754 * Reduced price lunch 0.510717 -0.94138 0.976336 * -0.16564 0.032898 -0.01702 -1.54624 -1.01695 0.209524 0.208374 -0.82733 0.43507 0.191003 Budget defeats 0.064614 0.039607 -0.26376 0.068984 0.315232 ** -0.05063 -0.0653 0.024231 0.018259 0.168486 0.087741 -0.06287 -0.06216
Institutionalization Proportion of BOCES districts using the practice 1.864572 * 3.190791 **** 8.950478 3.104046 **** 0.83371 0.986229 0.363439 -0.85561 0.833333 2.710596 *** 1.025566 2.887706 **** 0.820397 ****
District Size Enrollment -8.6E-05 ** -1.5E-05 8.62E-05 -1.5E-05 4.19E-05 0.000451 **** 0.000344 ** 0.000143 *** 0.000318 ** 0.000162 *** 0.000195 **** 0.000256 *** 0.000351 **** Enrollment squared -1.70E-08 ** -2.26E-08 ** -7.35E-09 ** -7.56E-09 ****
District Stress Combined wealth ratio -0.05555 0.088736 -1.16961 0.063057 -0.25635 *** -0.16635 -0.32835 ** -0.01821 -0.08732 -0.03983 -0.11419 -0.17006 * -0.15744 * Reduced price lunch 0.384759 -0.84112 1.665324 ** -0.07327 0.032816 -0.01582 -1.59039 -1.08491 0.225188 0.246631 -0.82021 0.563284 0.277539 Budget defeats 0.11394 -0.03455 0.182574 0.008086 0.313863 ** -0.04907 -0.05063 0.072325 0.155331 0.187364 0.116666 -0.04893 -0.05557 Difficulty recruiting -0.79955 0.559681 7.839454 ** 0.626157 0.196742 0.467101 1.491346 ** 1.076432 * 1.420597 1.386412 * 0.97993 1.127622 * 1.205106 **
Institutionalization Proportion of BOCES districts using the practice 2.093531 ** 3.047386 **** 6.642695 2.943929 **** 0.788651 0.774746 0.373512 -0.97062 1.043731 2.604275 *** 0.998221 2.633917 **** 0.63112 ***
Management Capacity HR director -0.65428 ** 0.096437 0.642041 0.277246 -0.1188 0.3285 -0.20452 -0.31094 -0.09217 -0.03861 0.272095 0.25238 0.385217 Decentralized process -0.35757 -0.46832 * 0.279198 -0.39634 -0.00579 -0.25151 -0.02735 0.259537 0.270231 -0.00292 0.093767 -0.50811 ** -0.42799 ** Number of positions involved in recruiting 0.150285 * 0.195697 ** -0.74758 ** 0.125987 -0.03105 0.060207 0.014725 0.018572 -0.04111 0.004057 -0.09843 0.163778 ** 0.111649 *
*Significant at the .1 level**Significant at the .05 level***Significant at the .01 level****Significant at the .001 level
1Includes other NY newspapers, newspapers in other states, and radio/TV.2Includes visit campus, contact faculty, and supervise student teachers.
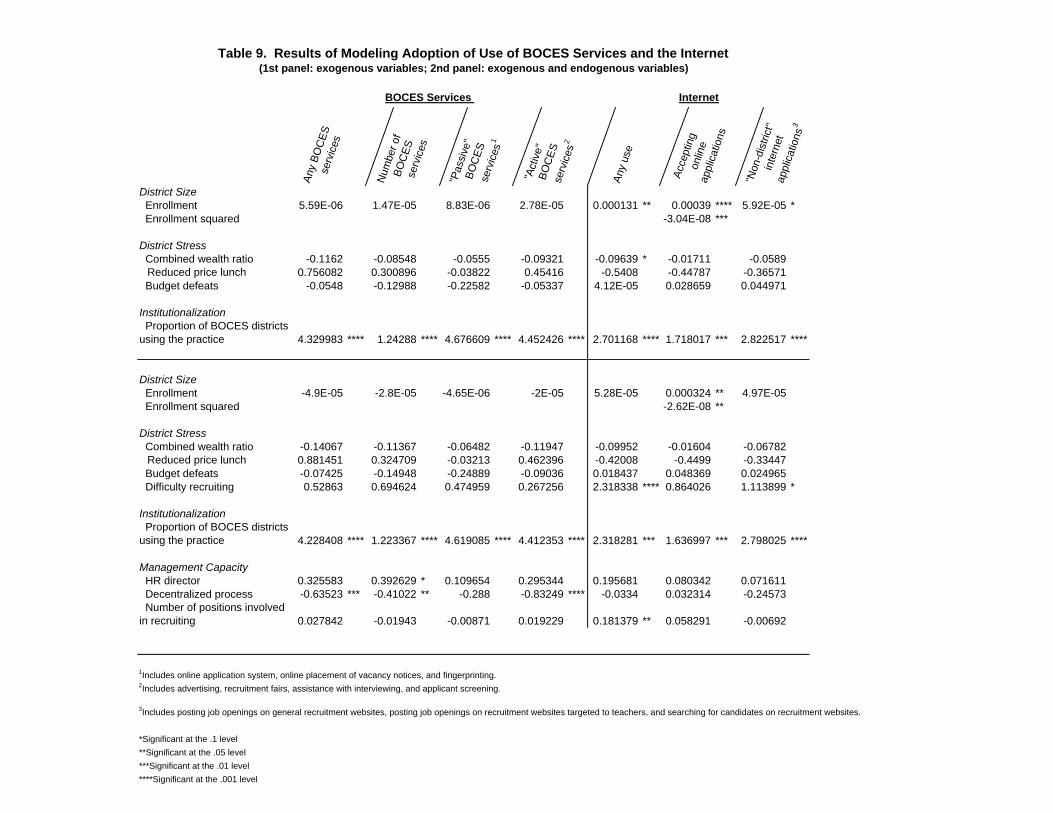
Table 9. Results of Modeling Adoption of Use of BOCES Services and the Internet (1st panel: exogenous variables; 2nd panel: exogenous and endogenous variables)
BOCES Services Internet
Any
BOC
ES
serv
ices
Num
ber o
f BO
CES
se
rvic
es
"Pas
sive
" BO
CES
se
rvic
es1
"Act
ive"
BO
CES
se
rvic
es2
Any
use
Acce
ptin
g on
line
appl
icat
ions
"Non
-dis
trict
" in
tern
et
appl
icat
ions
3
District Size Enrollment 5.59E-06 1.47E-05 8.83E-06 2.78E-05 0.000131 ** 0.00039 **** 5.92E-05 * Enrollment squared -3.04E-08 ***
District Stress Combined wealth ratio -0.1162 -0.08548 -0.0555 -0.09321 -0.09639 * -0.01711 -0.0589 Reduced price lunch 0.756082 0.300896 -0.03822 0.45416 -0.5408 -0.44787 -0.36571 Budget defeats -0.0548 -0.12988 -0.22582 -0.05337 4.12E-05 0.028659 0.044971
Institutionalization Proportion of BOCES districts using the practice 4.329983 **** 1.24288 **** 4.676609 **** 4.452426 **** 2.701168 **** 1.718017 *** 2.822517 ****
District Size Enrollment -4.9E-05 -2.8E-05 -4.65E-06 -2E-05 5.28E-05 0.000324 ** 4.97E-05 Enrollment squared -2.62E-08 **
District Stress Combined wealth ratio -0.14067 -0.11367 -0.06482 -0.11947 -0.09952 -0.01604 -0.06782 Reduced price lunch 0.881451 0.324709 -0.03213 0.462396 -0.42008 -0.4499 -0.33447 Budget defeats -0.07425 -0.14948 -0.24889 -0.09036 0.018437 0.048369 0.024965 Difficulty recruiting 0.52863 0.694624 0.474959 0.267256 2.318338 **** 0.864026 1.113899 *
Institutionalization Proportion of BOCES districts using the practice 4.228408 **** 1.223367 **** 4.619085 **** 4.412353 **** 2.318281 *** 1.636997 *** 2.798025 ****
Management Capacity HR director 0.325583 0.392629 * 0.109654 0.295344 0.195681 0.080342 0.071611 Decentralized process -0.63523 *** -0.41022 ** -0.288 -0.83249 **** -0.0334 0.032314 -0.24573 Number of positions involved in recruiting 0.027842 -0.01943 -0.00871 0.019229 0.181379 ** 0.058291 -0.00692
*Significant at the .1 level**Significant at the .05 level***Significant at the .01 level****Significant at the .001 level
2Includes advertising, recruitment fairs, assistance with interviewing, and applicant screening.
3Includes posting job openings on general recruitment websites, posting job openings on recruitment websites targeted to teachers, and searching for candidates on recruitment websites.
1Includes online application system, online placement of vacancy notices, and fingerprinting.

Table 10. Results of Modeling Adoption of Strategies to Increase Supply of Teachers and Use of Recruitment Incentives (1st panel: exogenous variables; 2nd panel: exogenous and endogenous variables)
Increasing Supply Recruitment Incentives
Rec
ruit
alte
rnat
ive
rout
es
Rec
ruit
subs
titut
es
Rec
ruit
retir
ed
teac
hers
Hel
p pa
ras
beco
me
certi
fied
Any
stra
tegy
Num
ber o
f st
rate
gies
"Inno
vativ
e"
stra
tegi
es1
Extra
-cur
ricul
ar,
adm
inis
trativ
e fu
nctio
ns
Cre
ditin
g
expe
rienc
e in
ot
her d
istri
cts
Cre
ditin
g no
n-te
achi
ng
expe
rienc
e
Nat
iona
l Boa
rd
Cer
tific
atio
n
Subs
idiz
ed
tuiti
on
Any
ince
ntiv
es
Num
ber o
f in
cent
ives
"Inno
vativ
e"
ince
ntiv
es2
District Size Enrollment 8.03E-05 ** 0.000142 ** 2.83E-05 0.000129 **** 0.000149 ** 0.000105 **** 0.000049 3.52E-05 5.88E-05 * 4.91E-05 0.000167 **** 6.05E-05 * 6.95E-05 * 9.94E-05 **** 5.18E-05 Enrollment squared
District Stress Combined wealth ratio -0.13512 0.014692 -0.04371 0.098246 * 0.000404 0.013053 -0.01794 -0.05146 -0.00709 0.067554 -0.01828 -0.25444 -0.08576 -0.050449 0.357731 Reduced price lunch -0.21596 1.657243 -0.18042 0.354233 3.582045 0.161016 -0.30073 -1.43975 0.941755 -0.69401 -0.1688 -0.76077 0.180075 -0.170014 0.072888 Budget defeats -0.02985 0.0068 -0.01685 -0.11043 -0.10444 -0.01122 0.071172 0.165825 0.310641 ** 0.13476 0.095398 -0.1824 0.310023 ** 0.162057 0.154624
Institutionalization Proportion of BOCES districts using the practice 2.814665 **** -2.04745 * -1.58823 * 0.952293 -1.8497 0.119028 1.578185 ** 1.18915 ** 1.311586 ** 1.06004 3.650802 **** 3.589334 **** 1.067555 0.580697 **** 0.357731
District Size Enrollment 3.09E-05 0.000159 ** 2.38E-05 0.000172 **** 0.000163 * 0.000103 **** 6.41E-06 2.62E-05 6.69E-05 6.32E-05 0.00011 ** 7.42E-05 * 4.75E-05 0.000104 *** 5.71E-05 Enrollment squared
District Stress Combined wealth ratio -0.14798 0.027067 -0.0492 0.121994 ** 0.027454 0.03453 -0.01808 -0.05719 0.002511 0.087996 * -0.02342 -0.21897 -0.0818 -0.047197 0.04813 Reduced price lunch -0.14197 1.792155 -0.09977 0.385207 3.880814 0.29489 -0.16376 -1.42021 0.946248 -0.679 -0.06975 -0.75582 0.229679 -0.084462 0.154471 Budget defeats -0.06457 -0.00077 0.019808 -0.08783 -0.09526 -0.01036 0.091504 0.156373 0.300471 0.170733 0.096168 -0.17218 0.311411 ** 0.161791 0.189789 Difficulty recruiting 1.382721 ** 1.384629 * 2.538125 **** 1.281841 ** 2.987026 *** 2.400059 **** 2.929215 **** 1.163983 ** 0.628322 1.361204 * 0.492164 0.969368 0.910357 1.235079 ** 1.308084 **
Institutionalization Proportion of BOCES districts using the practice 2.670701 **** -2.16884 * -1.81727 * 1.064487 -2.73013 -0.06041 1.201372 * 1.156241 * 1.165306 * 0.565503 3.501464 **** 3.702899 **** 0.955263 0.511466 *** -0.032555
Management Capacity HR director 0.158224 -0.30634 -0.02288 -0.69149 ** -0.45635 -0.24544 0.161086 0.044737 -0.20963 -0.49707 0.34384 -0.09184 0.048623 -0.142592 -0.176647 Decentralized process -0.42635 ** -0.19203 0.098033 -0.0862 -0.44317 -0.24211 -0.2246 -0.17537 0.089613 0.248695 0.073954 0.059984 0.152494 0.078859 0.240607 Number of positions involved in recruiting 0.125588 * 0.081761 0.048116 0.141836 * 0.136047 0.119928 ** 0.118938 * 0.0076 0.074162 0.177755 ** 0.123761 -0.05367 0.068075 0.049251 0.081617
*Significant at the .1 level**Significant at the .05 level***Significant at the .01 level****Significant at the .001 level
2Includes sigining bonuses, crediting job experience in non-teaching occupations, compensation for hard-to-staff schools, compensation for hard-to-staff fields, and help with the purchase of a home.
1Includes recruiting teachers certified through alternative routes, recruiting former teachers, and recruiting retired teachers.