Embed Size (px)
DESCRIPTION
Stacking-Based Visualization of Trajectory Attribute Data. Authors: Christian Tominski Heidrun Schumann Gennady Andrienko Natalia Andrienko. IEEE TRANSACTIONS ON VISUALIZATION AND COMPUTER GRAPHICS, DECEMBER 2012. BY: Farah Kamw. Introduction. - PowerPoint PPT Presentation
Citation preview

STACKING-BASED VISUALIZATION OF
TRAJECTORY ATTRIBUTE DATA
IEEE TRANSACTIONS ON VISUALIZATION AND COMPUTER GRAPHICS, DECEMBER 2012
Authors: 1. Christian Tominski2. Heidrun Schumann3. Gennady Andrienko4. Natalia Andrienko
BY:Farah Kamw
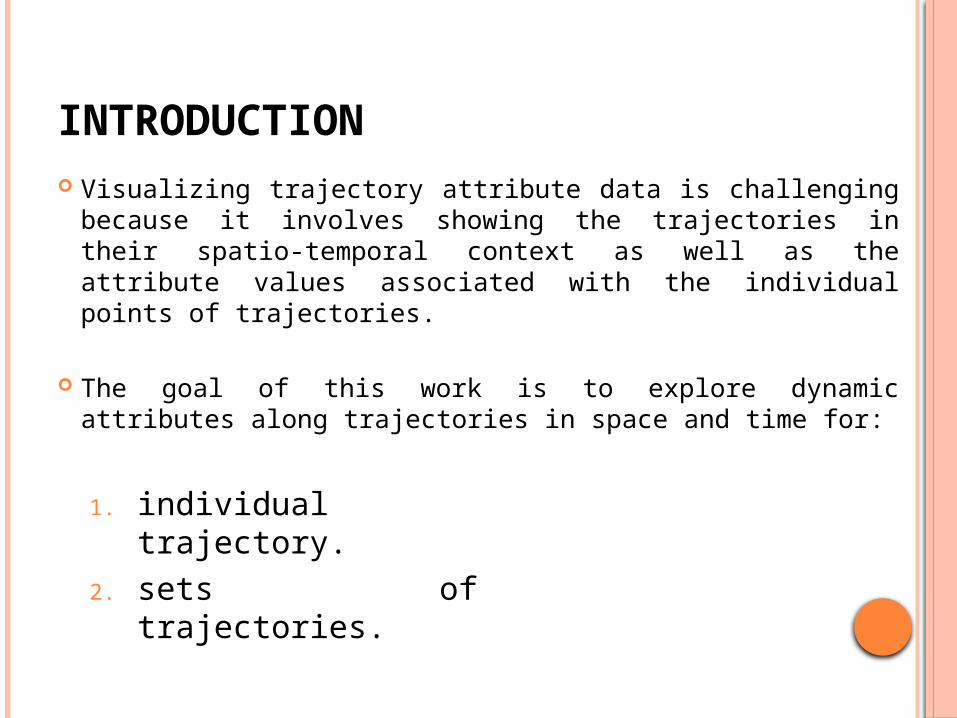
INTRODUCTION Visualizing trajectory attribute data is challenging
because it involves showing the trajectories in their spatio-temporal context as well as the attribute values associated with the individual points of trajectories.
The goal of this work is to explore dynamic attributes along trajectories in space and time for:
1. individual trajectory.2. sets of trajectories.
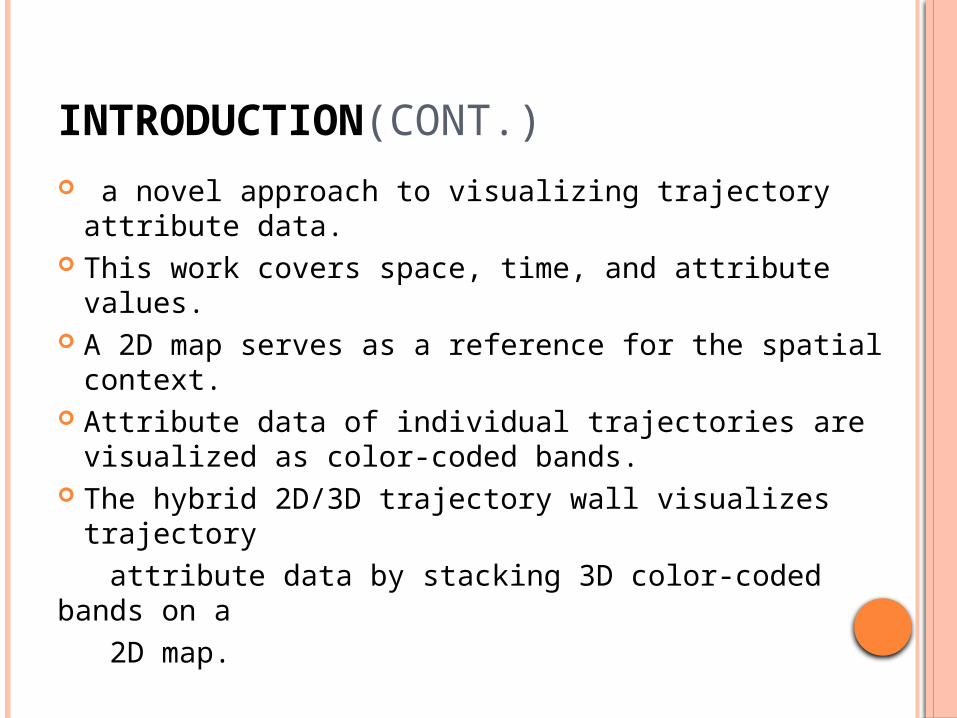
INTRODUCTION(CONT.) a novel approach to visualizing trajectory
attribute data. This work covers space, time, and attribute values. A 2D map serves as a reference for the spatial
context. Attribute data of individual trajectories are
visualized as color-coded bands. The hybrid 2D/3D trajectory wall visualizes
trajectory attribute data by stacking 3D color-coded bands on a 2D map.
INTRODUCTION (CONT.)
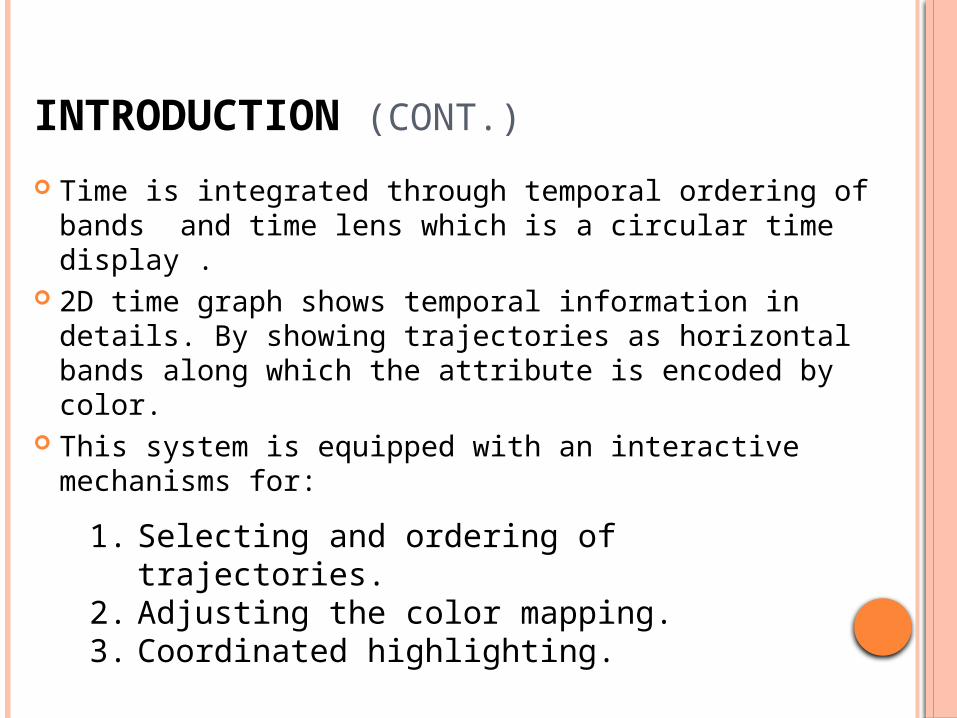
Time is integrated through temporal ordering of bands and time lens which is a circular time display .
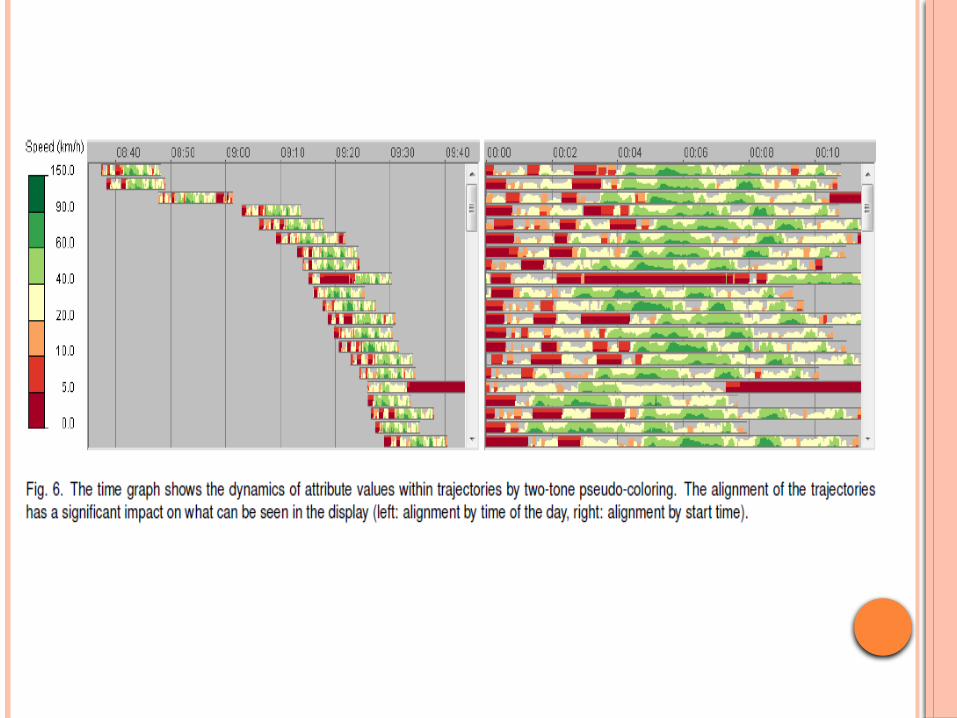
2D time graph shows temporal information in details. By showing trajectories as horizontal bands along which the attribute is encoded by color.
This system is equipped with an interactive mechanisms for:
1. Selecting and ordering of trajectories.2. Adjusting the color mapping.3. Coordinated highlighting.
CONTRIBUTION
A novel system that: 1. Integrates space, time, and attributes2. Combines visual, analytical, and interactive
components to facilitate trajectory attribute exploration.
DATA
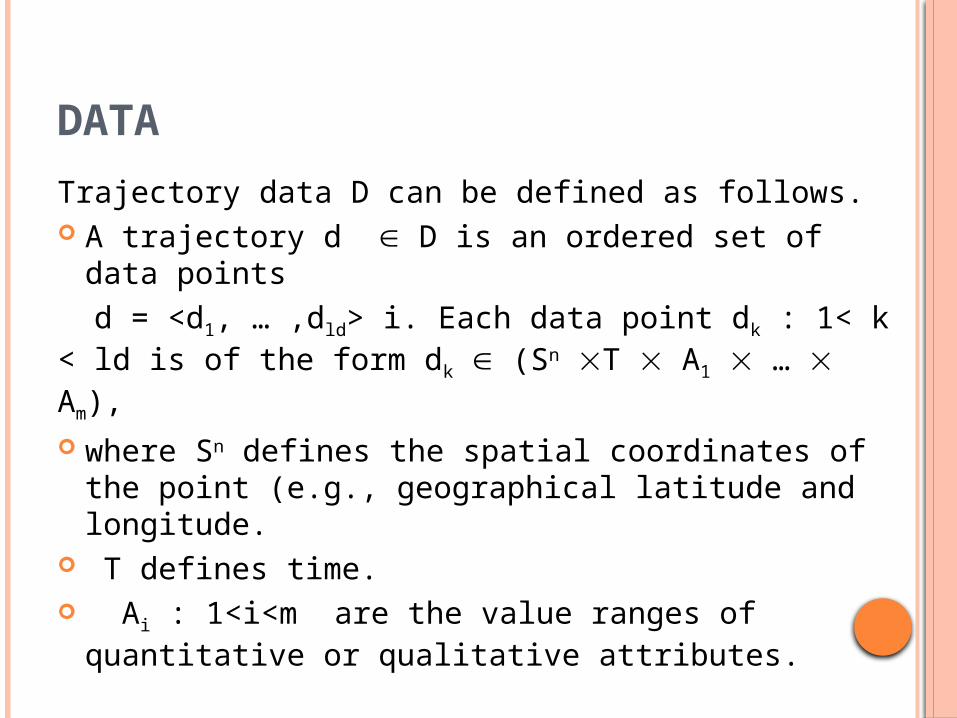
Trajectory data D can be defined as follows. A trajectory d D is an ordered set of data points d = <d1, … ,dld> i. Each data point dk : 1< k < ld is of the form dk (Sn T A1 … Am), where Sn defines the spatial coordinates of the
point (e.g., geographical latitude and longitude. T defines time. Ai : 1<i<m are the value ranges of quantitative
or qualitative attributes.
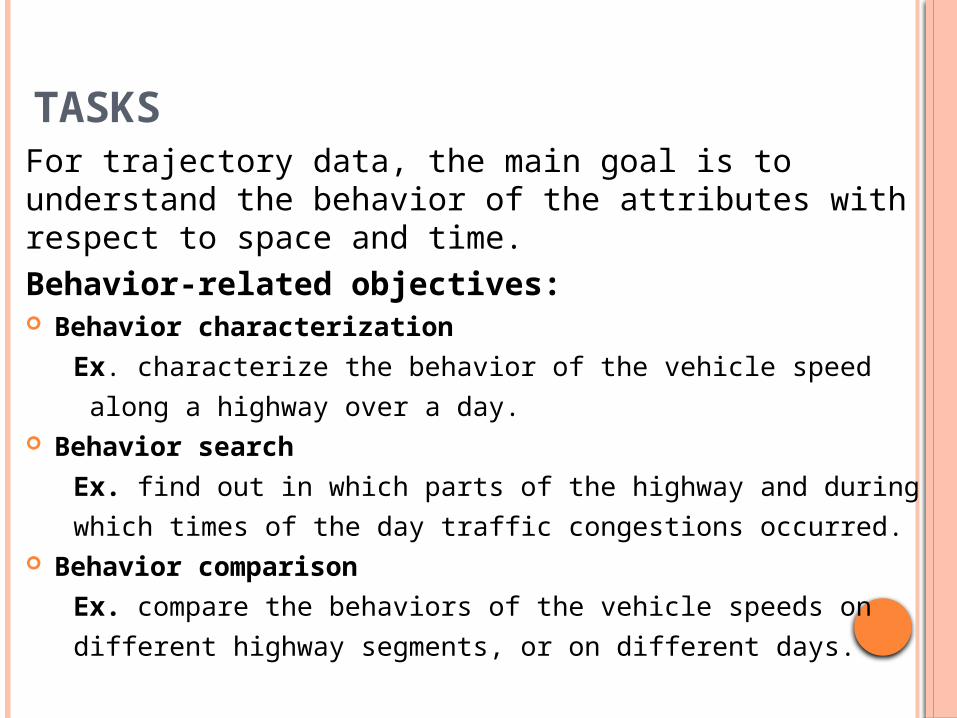
TASKSFor trajectory data, the main goal is to understand the behavior of the attributes with respect to space and time.Behavior-related objectives: Behavior characterization
Ex. characterize the behavior of the vehicle speed
along a highway over a day. Behavior search
Ex. find out in which parts of the highway and during
which times of the day traffic congestions occurred. Behavior comparison
Ex. compare the behaviors of the vehicle speeds on
different highway segments, or on different days.
TASKS (CONT.)
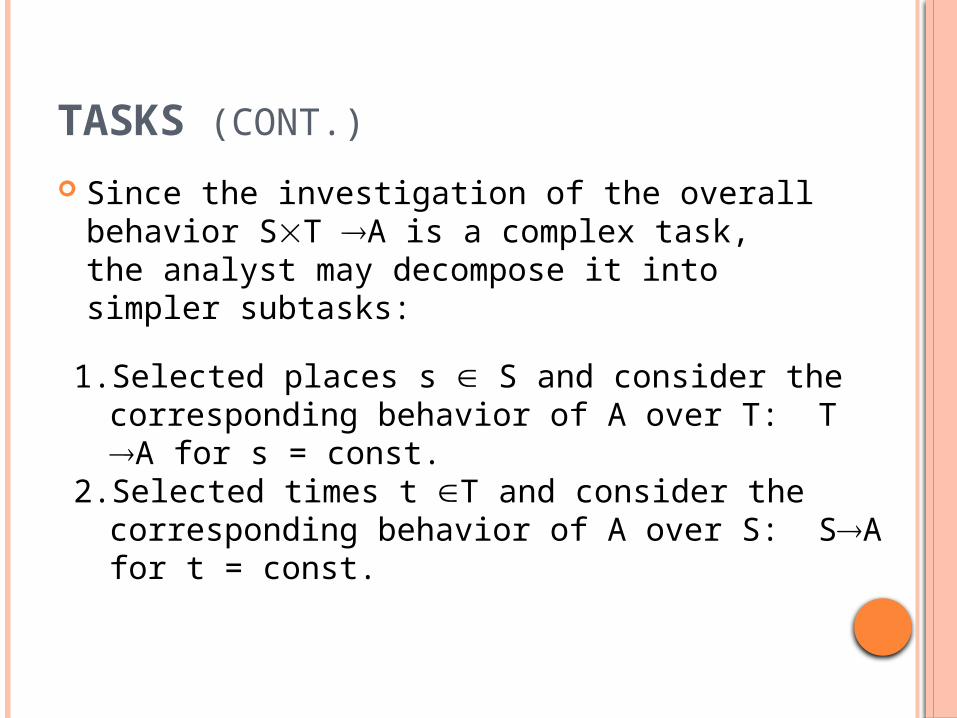
Since the investigation of the overall behavior ST A is a complex task, the analyst may decompose it into simpler subtasks:
1. Selected places s S and consider the corresponding behavior of A over T: T A for s = const.
2. Selected times t T and consider the corresponding behavior of A over S: SA for t = const.
GENERAL VISUALIZATION ISSUES
This system requires : Color-coding of attribute values. Grouping and selecting trajectories Stacking trajectories
COLOR-CODING OF ATTRIBUTE VALUES
To make the behavior of attribute values easily detectable an appropriate mapping of the values to colors is required.
Isomorphic vs. segmented color scales. According to cartographers, the segmented color scales can represent behavior better. However, this requires not only an appropriate color scale,
but also an appropriate definition of class intervals. The cartographic literature recommends choosing class
breaks according to the statistical distribution of the values.In this system They used two ways:
1. The division can be done automatically . 2. The user can interactively set class breaks point
by using a slider.
GROUPING AND SELECTING TRAJECTORIES
Grouping is useful for dividing a large set of trajectories into manageable portions, which can be analyzed one by one.
For analyzing trajectory attributes in respect to space. They start with identifying groups of trajectories that have similar geometries , e.g., clustering trajectories by similar origins.
When analyzing the temporal behavior, they create groups based on temporal queries, e.g., selecting evening or weekend trajectories.
STACKING TRAJECTORIES
chronological ordering of the trajectory bands brings a part of temporal information into the trajectory wall display.
The ordering can be done according to the absolute times of the starts or ends of the trajectories.
Gradual changes of the color along the horizontal dimension signify a spatial trend,
Gradual changes along the vertical dimension signify a temporal trend,
Changes in a diagonal direction correspond to a spatio-temporal trend
DESIGN OF THE VISUALIZATION COMPONENTS
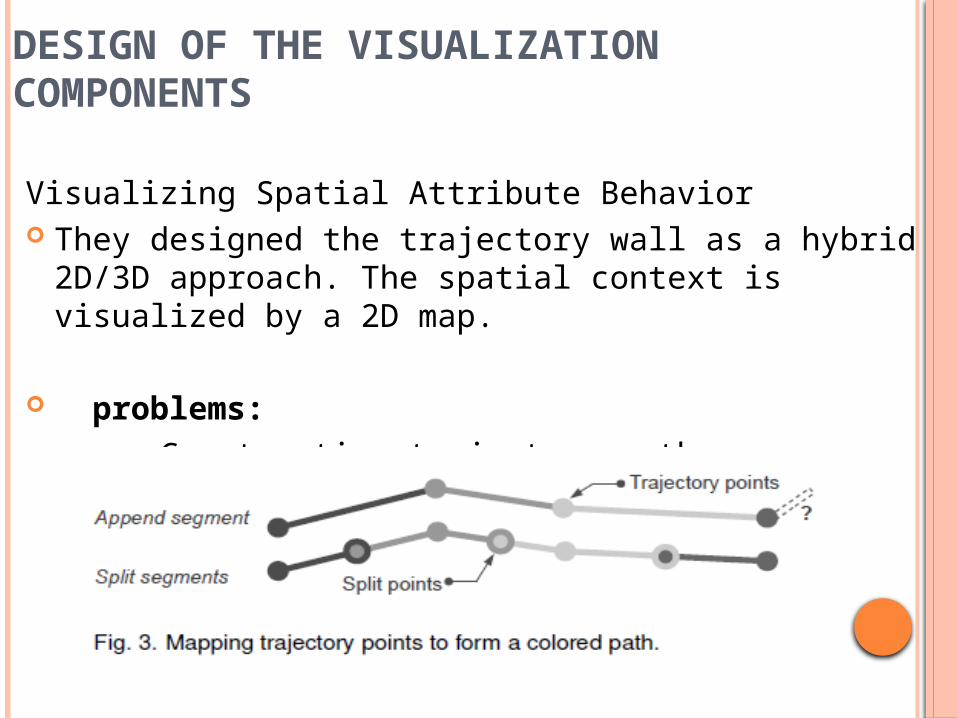
Visualizing Spatial Attribute Behavior They designed the trajectory wall as a hybrid 2D/3D
approach. The spatial context is visualized by a 2D map.
problems: Constructing trajectory paths
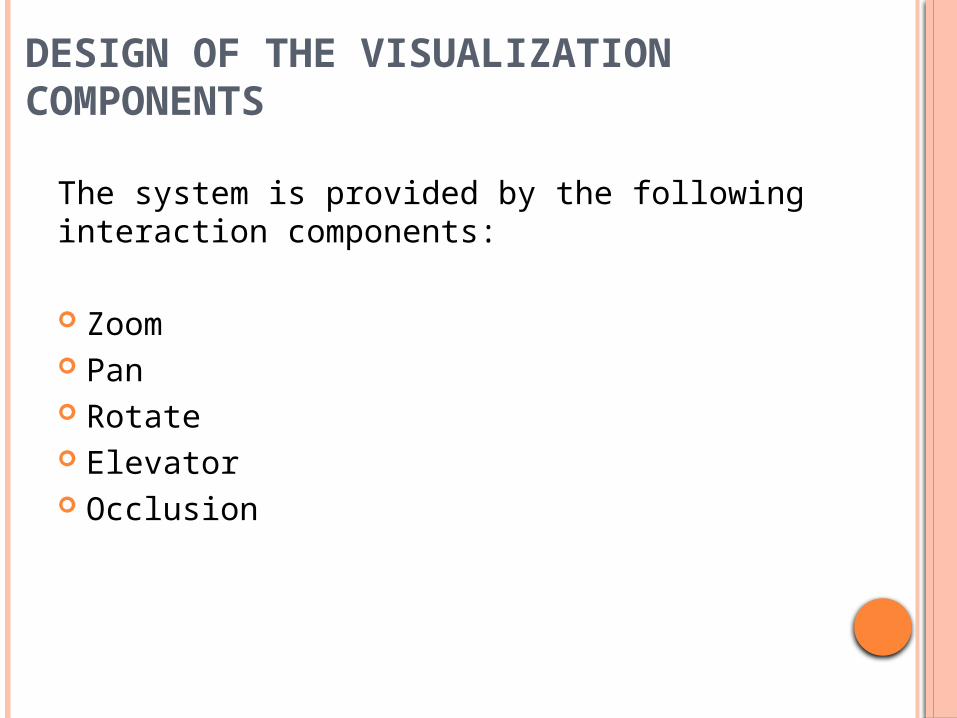
The system is provided by the following interaction components:
Zoom Pan Rotate Elevator Occlusion
DESIGN OF THE VISUALIZATION COMPONENTS
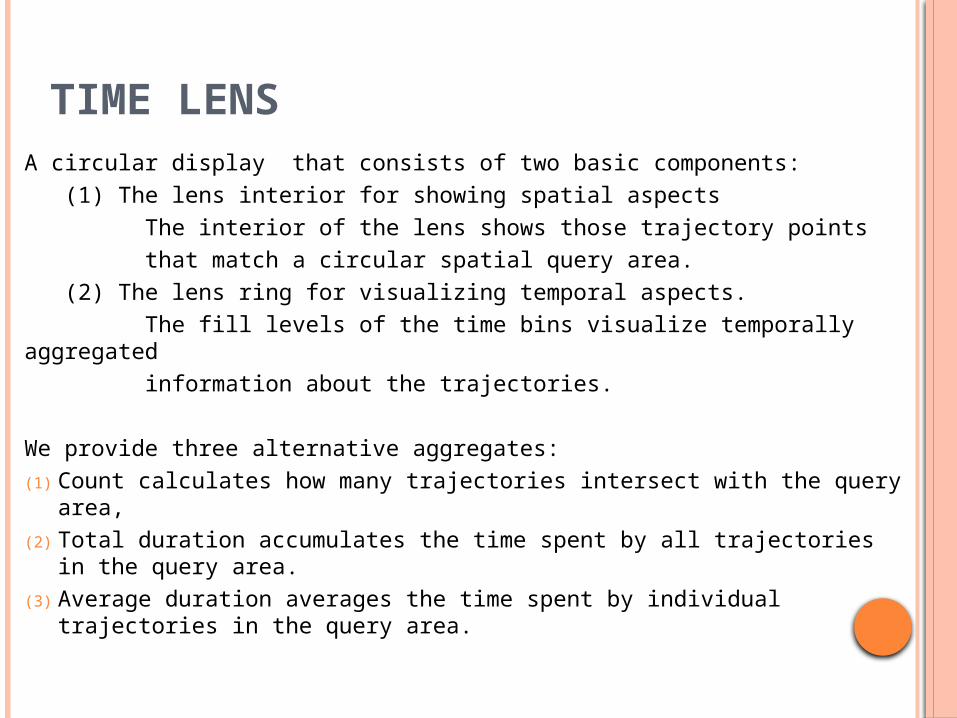
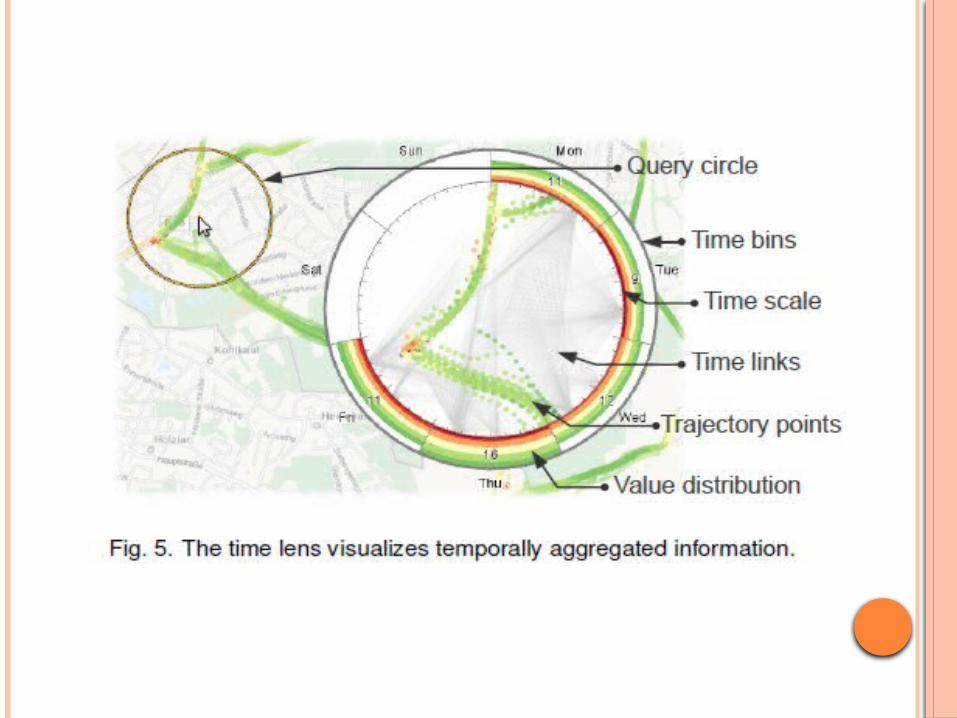
A circular display that consists of two basic components: (1) The lens interior for showing spatial aspects The interior of the lens shows those trajectory points that match a circular spatial query area. (2) The lens ring for visualizing temporal aspects. The fill levels of the time bins visualize temporally aggregated information about the trajectories.
We provide three alternative aggregates: (1) Count calculates how many trajectories intersect with the query
area, (2) Total duration accumulates the time spent by all trajectories in the
query area. (3) Average duration averages the time spent by individual trajectories
in the query area.
TIME LENS
TIME GRAPH DISPLAY 2D time graph shows temporal information in
details. This display shows individual trajectories as
stacked horizontal bands along which the attribute is encoded by color.
The time graph is limited by the available screen height.
Larger sets of trajectories can be explored by means of scrolling
EXAMPLES DATA SET 1: RADIATION MEASUREMENTS IN JAPAN
1,014 trajectories. The goal is to characterize of the radiation behavior along the
major highway connecting Tokyo and Fukushima. (SA): The values increasing as the distance to the station
decreases. (T A): The values in different places at medium distances
from the station (from 25 to 75km) tend to decrease over time. (ST A):The radiation increases with approaching the station
and decreases over time at medium distances from the station while being constantly low at farther distances and constantly high closely to the station.
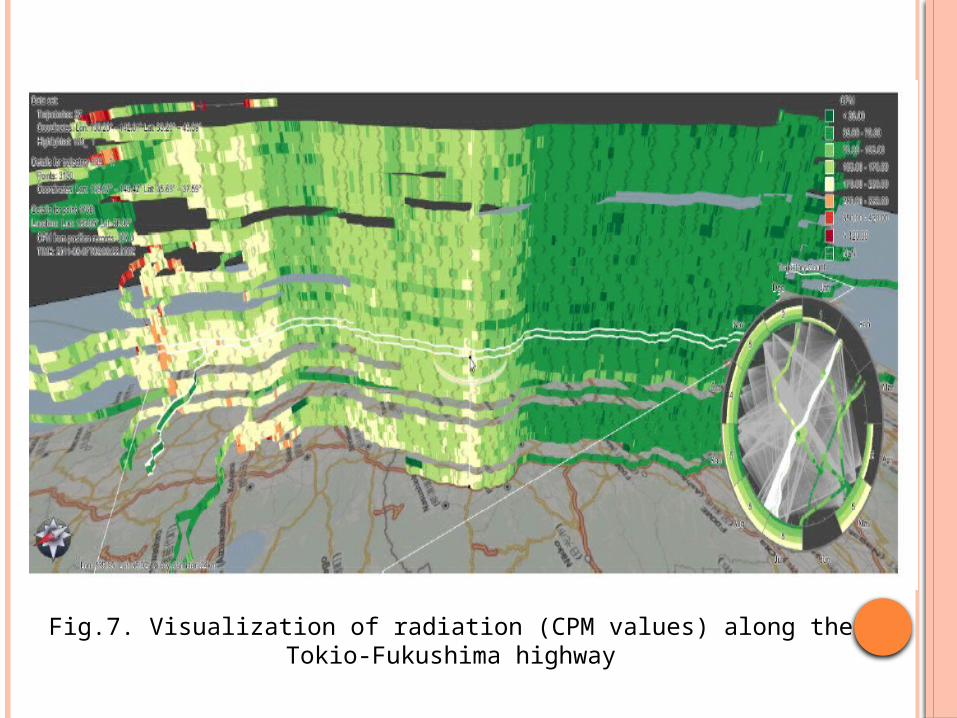
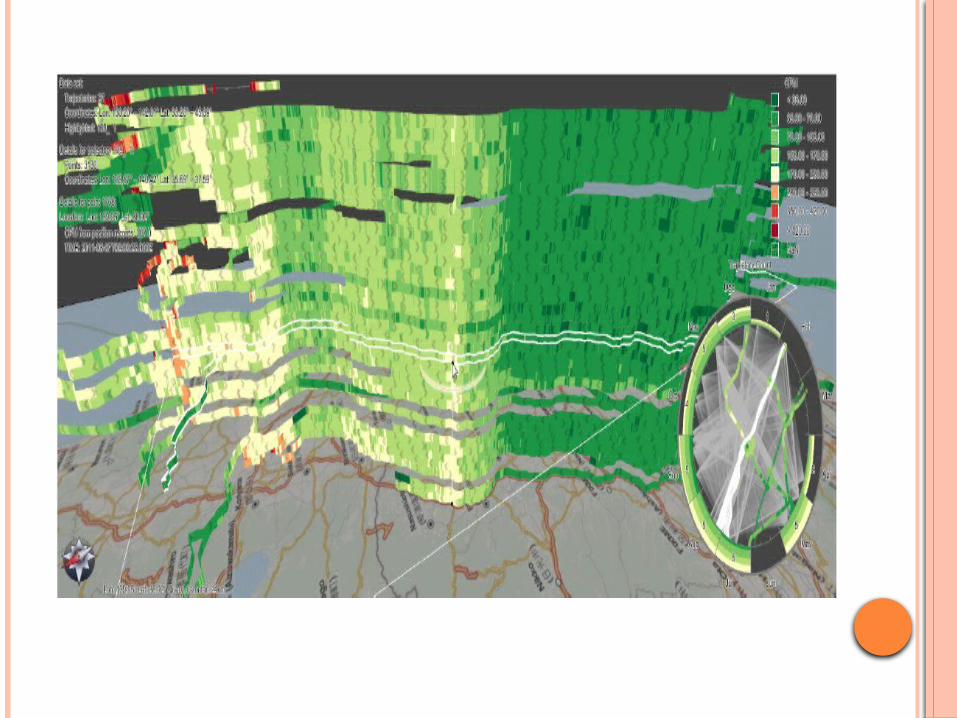
Fig.7. Visualization of radiation (CPM values) along the Tokio-Fukushima highway
EXAMPLES
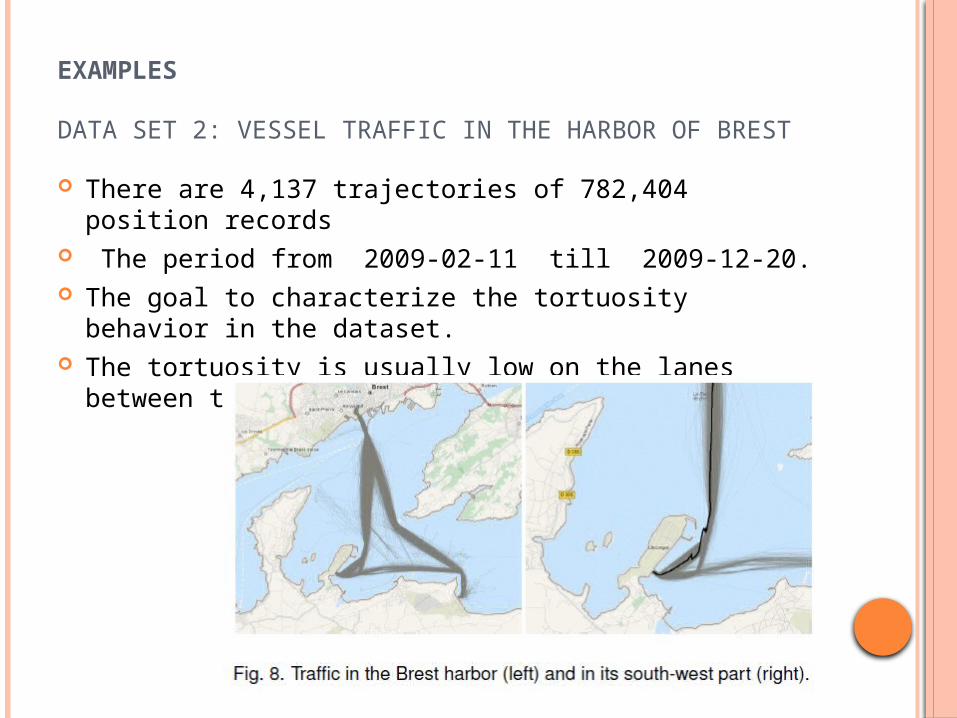
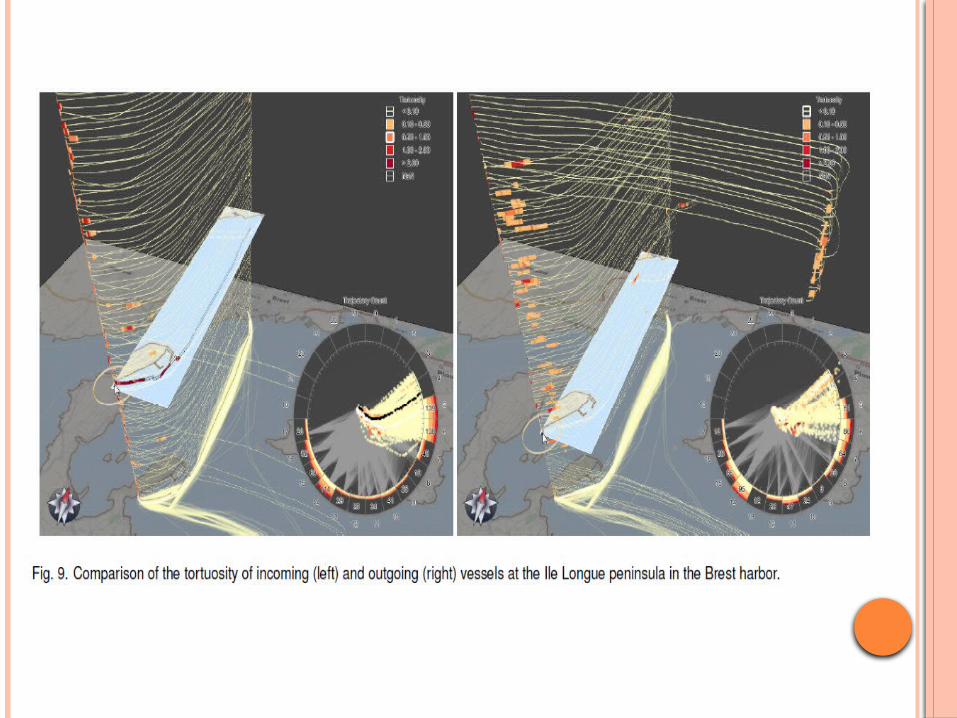
DATA SET 2: VESSEL TRAFFIC IN THE HARBOR OF BREST
There are 4,137 trajectories of 782,404 position records
The period from 2009-02-11 till 2009-12-20. The goal to characterize the tortuosity behavior in the
dataset. The tortuosity is usually low on the lanes between the
ports.
CONCLUSION
They presented a novel visualization approach that facilitates gaining insight into trajectory attribute data. By integrating spatial and temporal displays.
This design is based on color-coded trajectory bands, and on stacking the bands.
http://www.youtube.com/watch?v=JKVAaxuj8hQ

Thanks For Your Listening