Embed Size (px)
Citation preview

GOVERNMENT OF THE REPUBLIC OF SLOVENIA
STABILITY PROGRAMME
AMENDMENTS 2016
Ljubljana, April 2016

Page 2 of 31
Table of contents
1. ECONOMIC REVIEW..................................................................................................... 4
1.1. Public finance situation ............................................................................................ 4
1.2. Assumptions for the international environment ........................................................ 4
1.3. Macroeconomic developments and short-term prospects ........................................ 5
1.4. Medium-term scenario ............................................................................................. 7
2. FRAMEWORK AND ECONOMIC POLICY OBJECTIVES .............................................. 7
2.1. Medium-term balance of general government ......................................................... 7
2.2. Policy of general government revenue ...................................................................10
2.3. Policy of general government expenditure ..............................................................12
2.4. Migration costs and enforcement of the exceptional derogation clause ..................13
2.5. General government debt .......................................................................................14
3. SENSITIVITY ANALYSIS ..............................................................................................16
3.1. Sensitivity analysis of general government balance to movements of GDP ............16
3.2. Debt sensitivity analysis .........................................................................................17
3.3. Comparison of GDP forecast with the preliminary programme ...............................18
3.4. Quality of forecasts.................................................................................................18
4. LONG-TERM SUSTAINABILITY OF PUBLIC FINANCES .............................................20
4.1. Expenditure relating to population ageing ...............................................................20
4.2. Guarantees ............................................................................................................22
5. QUALITY OF PUBLIC FINANCES ................................................................................23
5.1. General government expenditure ...........................................................................23
5.2. General government revenue .................................................................................25
6. INSTITUTIONAL ENVIRONMENT ................................................................................26
6.1. Coordination of structural reforms ..........................................................................26
6.2. Review of expenditure in health care, education and social protection ...................27
6.3. Public Finance Act..................................................................................................27
ANNEX: Additional tables compliant with the rules of the Stability and Growth Pact
Page 3 of 31
Preface
Status of the Stability Programme (SP) The Stability Programme for 2016 was first drafted together with the Decree on general government framework 2017–2019 which was discussed and passed by the National Assembly at its session on 19 April 2016 in accordance with the Fiscal Rule Act (hereinafter: FRA). As per the Act, the framework determines the target balance and the largest possible scope of general government expenditure for an individual fiscal year and target balances and the largest possible scope of expenditure from individual public finance budgets for the next three years, i.e. 2017, 2018 and 2019. Connection with the Stability and Growth Pact (SGP) The Stability Programme has so far also served as the Slovenian medium-term fiscal framework; however, starting from this year, it also presents the amendment to the budgeting framework as per Article 6 of the FRA, where a target general government balance and the largest scope of general government expenditure are determined in accordance with Article 3 of the FRA. We thus comply with the requirements of Council Directive 2011/85/EU on requirements for budgetary frameworks of the Member States. On the basis of April EDP reporting1 on the main aggregates of general government for 2015, Slovenia will be able to exit the excessive deficit procedure and the corrective arm of the Stability and Growth Pact (SGP). Following the first review, the general government deficit for 2015 was estimated at 2.9% of GDP, whereas it amounted to 5.0% of GDP in 2014 after the revision. For the first time after 2008, a slight primary surplus in the amount of 0.04% of GDP was generated in 2015; in 2014, the primary surplus amounted to 1.8% of GDP. The total general government revenue increased nominally by 3.7% in 2015 and the total expenditure reduced nominally by 0.6%. The entry data published also on the website of the Statistical Office of the Republic of Slovenia for the entry in the preventive arm of the SGP for 2016 include: general government deficit for 2016 estimated at 2.2% of GDP and consolidated general government gross debt estimated at 80.2% of GDP. The Government of the Republic of Slovenia insists on the projected path that the structural fiscal balance will be offset in 2020 according to assessments when Slovenia’s medium-term fiscal objective (MTO) will have been met. Since Slovenia has not yet achieved its MTO, the transitional period and the rule of Article 15 of the FRA apply that the structural deficit must be gradually reduced towards the MTO in a manner which will be compliant with the SGP. During the convergence period, the FRA does not provide for the speed of adjusting nor the formula for the calculation of the upper threshold of expenditure. According to the Government’s estimate, the cyclical position of the Slovenian economy is not as favourable as assessed in the EC’s calculations. Deflation is present in Slovenia; there is surplus in the current account on the balance of payments and unemployment is above the long-term average. Investment rates, industrial production and finally also the GDP growth rates are not at the levels from before the crisis, and it is thus impossible to claim that Slovenian economy is overheating merely on the basis of the EU common methodology, as is claimed by the EC, particularly since the calculations of other international institutions (IMF and OECD) do not confirm this. Connection with the National Reform Programme (NRP) The contents of the SP and the NRP complement and overlap each other. The SP focuses on the macroeconomic development, fiscal policy and public finance, and the NRP describes measures, projected structural reforms within the European Semester and the attainment of the objectives of the Europe 2020 Strategy.
1 First data of 30 March 2016: http://www.stat.si/StatWeb/prikazi-novico?id=5861&idp=1&headerbar=0; review of 20 April 2016.
Page 4 of 31
Spring forecast of the Institute of Macroeconomic Analysis and Development (IMAD) On 16 March 2016, the Government of the Republic of Slovenia was informed of the Spring forecast in which this year’s economic growth is marked by further export growth, enhancement of private consumption and a decline in state investments. The Government of the Republic of Slovenia is obliged to observe IMAD’s forecasts in the SP.
1. ECONOMIC OUTLOOK According to the first assessment of the Statistical Office of the Republic of Slovenia (SORS), Slovenia achieved an economic growth of 2.9% in 2015 by which it confirmed the continuation of the favourable trend from 2014 when the growth amounted to 3%. For Slovenia, 2015 thus denotes an important confirmation of the projected path and the progress in improving the economic and social areas. With measures and policies in the previous years, Slovenia has tackled key macroeconomic imbalances and has also successfully reduced them. According to a preliminary assessment, Slovenia will exit the excessive deficit procedure in 2015 since the headline general government deficit will remain below 3% of GDP also in the forthcoming years according to the estimates.
1.1. Public finance situation According to the first revised statistical assessment, the general government deficit fell to 2.9% of GDP in 2015 as per 5.0% of GDP in 2014. Slovenia thus successfully addressed fiscal risks in 2015; conservative fiscal planning and more beneficial cyclical movements than projected also made an important contribution to the improvement. The total general government revenue increased by 3.7%; the expenditure reduced by 0.6% and thus achieved 48% of GDP. An overview according to general government units reveals that the central government units outside the state budget had a significant impact on the 2015 results. Surplus was noted in the budgets of municipalities, public institutions, agencies and public funds, including the Pension Fund Management (KAD) and the Slovenian Sovereign Holding (SSH). Deficit in the amount of 1.2% of GDP was recorded by the Bank Assets Management Company (BAMC) due to the effect of transactions.
Nominal reduction of general government deficit is to a lesser extent reflected in the improved structural fiscal balance in which the impact of the economic cycle and one-off measures are excluded. The aforementioned denotes that permanent structural measures and reforms which would improve the structure of public finance and enhance potential growth are of key importance for Slovenia in the medium-term period. Between 2016 and 2019, Slovenia will therefore continue its gradual consolidation of public finance by reducing the nominal general government balance by 0.6 percentage point annually. This will mark the path towards medium-term sustainability of public finance in 2020.
1.2. Assumptions for the international environment
The macro-economic projections in the Stability Programme are taken from the Spring Forecast of Economic Trends 2016 (IMAD, March 2016). The forecasts of international institutions published by the end of February 2016 were observed as assumptions with regard to the international environment. The GDP growth in some of Slovenia’s leading trade partners in the euro area will be lower this year than in 2015; also somewhat lower than last year is the expected decline in GDP in Russia.
Page 5 of 31
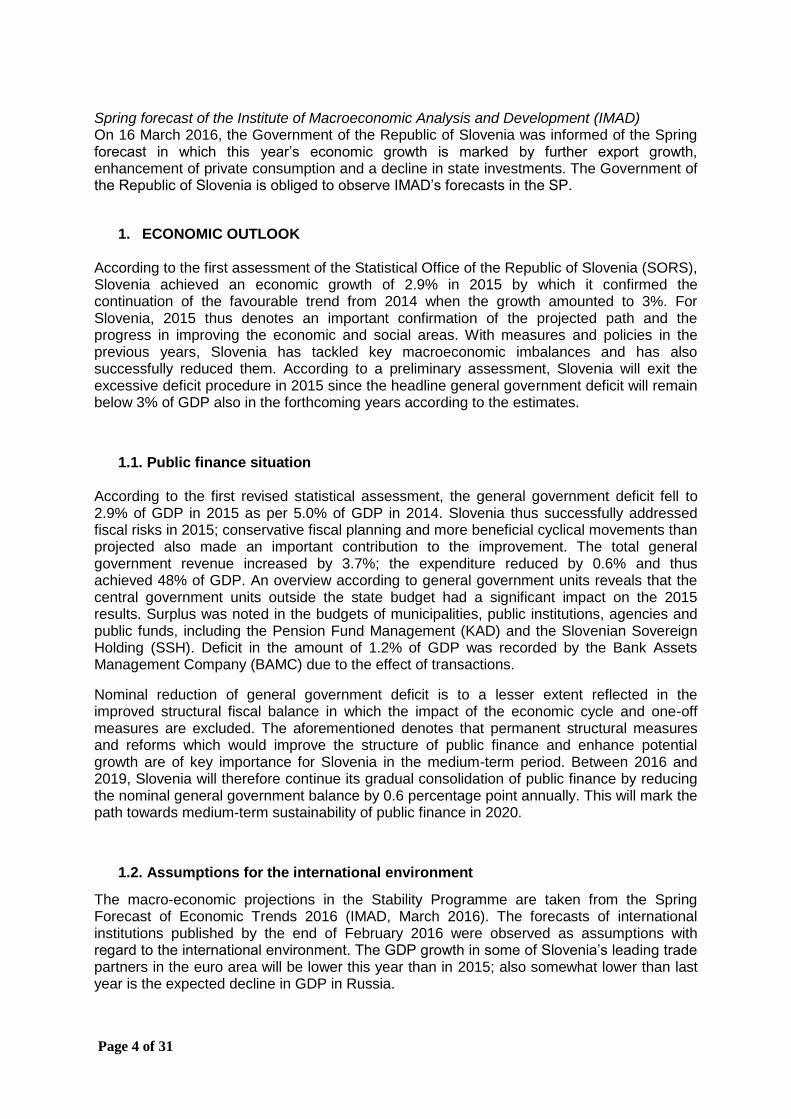
Table 1.1: Assumptions for the international environment
2014 2015 2016 2017 2018
USD/EUR ratio (annual average)
(euro area and ERM II members)1
1.329 1.110 1.111 1.114 1.114
Nominal effective rate 0.3 -2.8 1.1 0.0 0.0
GDP growth in EU 1.4 1.9 1.8 1.9 1.8
Growth of export markets2 3.2 3.7 3.7 4.8 5.0
Oil price (Brent, USD/barrel) 98.9 52.4 35.0 41.5 45.1 Source: IMAD, Spring Forecast 2016. Notes:
1 For the period 2016–2018: technical assumption on the basis of an average rate
in February 2016; 2 Real import of goods and services from trade partners weighted by means of Slovenian export rates to these
countries.
The technical assumption for the average price of Brent oil is 35 USD/barrel in 2016. According to available data from futures contracts, the price of oil is set to increase gradually over the next two years. The assumption on price trends of non-energy raw materials also anticipates further decline in 2016 after the last year’s drop. The technical assumption for the average value of the euro against the US dollar is 1.111 USD/EUR for 2016.
1.3. Macroeconomic developments and short-term prospects
In 2016, the economic growth will reach 1.7%2, which is less than in the last two years when it was about 3%. The economic slowdown is linked particularly to the significantly lower contribution of government investment after the use of EU funds from the previous financial framework. Furthermore, economic developments in 2016 will be denoted by a steady growth of foreign demand and further enhancement of private consumption. Following a halt in the last quarter of 2015, the export growth will be lower than in 2015. Nevertheless, a preservation of a competitive position of export companies is expected, which has improved notably in the last three years. The utilisation of production capacities has grown significantly together with production growth, which will increase the growth of investing in equipment and machinery that has been enhancing since the beginning of 2015. Since credit activity is still weak, the financing of investments will be enabled by improved business results and reduced indebtedness of the corporate sector. Improved terms of trade will have a positive impact on operations of companies. Due to a significant reduction in planned government investment, fixed capital formation in 2016 will be lower than in 2015. The enhancement of private consumption contribution will continue in 2016, which will be stimulated by further positive movements in the labour market.
Government spending will also somewhat increase due to the anticipated increase in the number of employees, and the increase of funds earmarked for social transfers, goods and services. In the case of stable conditions in the international environment, the real growth of GDP will be higher again by more than 2% from 2017 onwards. In addition to export and further growth of private consumption, investment consumption will contribute to the growth where state investments will increase gradually on the basis of the anticipated growth of private investments. The contribution of domestic consumption to the growth will be significantly higher and thus related higher import will impact the relatively lower contribution of the foreign exchange to the economic growth.
2 Spring Forecast 2016. IMAD: the so-called realistic or the most likely scenario.
Page 6 of 31
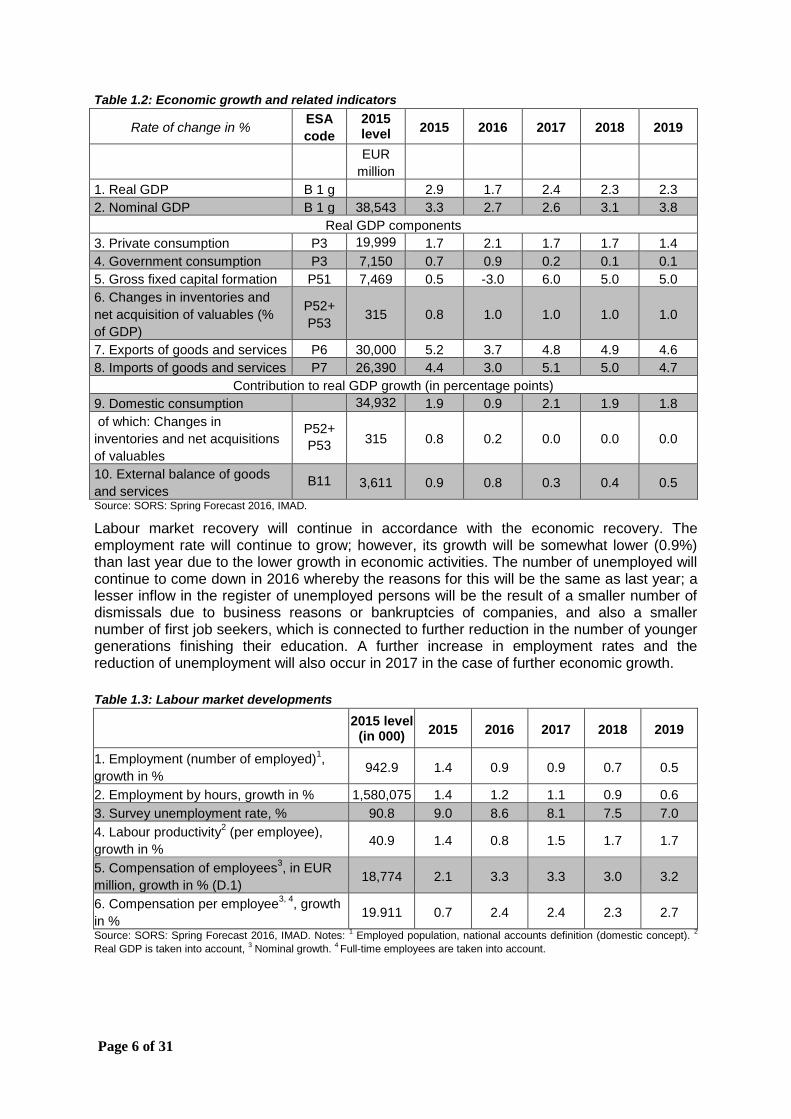
Table 1.2: Economic growth and related indicators
Rate of change in % ESA
code
2015 level
2015 2016 2017 2018 2019
EUR
million
1. Real GDP B 1 g 2.9 1.7 2.4 2.3 2.3
2. Nominal GDP B 1 g 38,543 3.3 2.7 2.6 3.1 3.8
Real GDP components
3. Private consumption P3 19,999 1.7 2.1 1.7 1.7 1.4
4. Government consumption P3 7,150 0.7 0.9 0.2 0.1 0.1
5. Gross fixed capital formation P51 7,469 0.5 -3.0 6.0 5.0 5.0
6. Changes in inventories and
net acquisition of valuables (%
of GDP)
P52+
P53 315 0.8 1.0 1.0 1.0 1.0
7. Exports of goods and services P6 30,000 5.2 3.7 4.8 4.9 4.6
8. Imports of goods and services P7 26,390 4.4 3.0 5.1 5.0 4.7
Contribution to real GDP growth (in percentage points)
9. Domestic consumption 34,932 1.9 0.9 2.1 1.9 1.8
of which: Changes in
inventories and net acquisitions
of valuables
P52+
P53 315 0.8 0.2 0.0 0.0 0.0
10. External balance of goods
and services B11 3,611 0.9 0.8 0.3 0.4 0.5
Source: SORS: Spring Forecast 2016, IMAD.
Labour market recovery will continue in accordance with the economic recovery. The employment rate will continue to grow; however, its growth will be somewhat lower (0.9%) than last year due to the lower growth in economic activities. The number of unemployed will continue to come down in 2016 whereby the reasons for this will be the same as last year; a lesser inflow in the register of unemployed persons will be the result of a smaller number of dismissals due to business reasons or bankruptcies of companies, and also a smaller number of first job seekers, which is connected to further reduction in the number of younger generations finishing their education. A further increase in employment rates and the reduction of unemployment will also occur in 2017 in the case of further economic growth.
Table 1.3: Labour market developments
2015 level (in 000)
2015 2016 2017 2018 2019
1. Employment (number of employed)1,
growth in % 942.9 1.4 0.9 0.9 0.7 0.5
2. Employment by hours, growth in % 1,580,075 1.4 1.2 1.1 0.9 0.6
3. Survey unemployment rate, % 90.8 9.0 8.6 8.1 7.5 7.0
4. Labour productivity2 (per employee),
growth in % 40.9 1.4 0.8 1.5 1.7 1.7
5. Compensation of employees3, in EUR
million, growth in % (D.1) 18,774 2.1 3.3 3.3 3.0 3.2
6. Compensation per employee3, 4
, growth
in % 19.911 0.7 2.4 2.4 2.3 2.7
Source: SORS: Spring Forecast 2016, IMAD. Notes: 1 Employed population, national accounts definition (domestic concept).
2
Real GDP is taken into account, 3 Nominal growth.
4 Full-time employees are taken into account.

Page 7 of 31
1.4. Medium-term scenario
The medium-term scenario of economic trends from the Spring forecast of economic developments is based on the assumed stable trends in the international environment and further gradual consolidation of public finance in the general framework of programme guidelines. The key economic activity factor will be exports on the basis of the anticipated gradual acceleration of economic recovery in the main trade partners. The growth of private consumption will be about 1.5%. The scenario foresees that, given the successful and sustainable lowering of the public deficit and the stabilisation of the banking system, the conditions for financing the government and, indirectly, the private sector, will be relatively stable. In the medium term, this will have a positive impact on investment and overall economic activity, which is expected to grow by an average of 2.3% a year towards the end of this decade. In accordance with the projected growth of the economic activity, the conditions on the labour market will also be improving gradually. Unemployment will decline, but, at the end of the programming period, it will remain higher than before the onset of the economic crisis. Demographic movements will have a growing impact on labour market trends due to the reduction of the number of working-age population (20 to 64 years).
2. FRAMEWORK AND ECONOMIC POLICY OBJECTIVES
2.1. Medium-term balance of general government The Government of the Republic of Slovenia insists on the projected path that the structural fiscal balance will be offset in 2020 according to assessments of the Ministry of Finance when Slovenia’s medium-term fiscal objective (MTO) will have been met. Since Slovenia has not yet achieved its MTO, the transitional period and the rule that the structural deficit must be gradually reduced towards the MTO in a manner which will be compliant with the SGP apply. The speed of convergence is not governed by the FRA, which does also not provide the formula for the calculation of the upper threshold of expenditure during the convergence. Deflation is present in Slovenia; there is surplus in the current account on the balance of payments and unemployment is above the long-term average. Investment rates, industrial production and finally also the GDP growth rates are not at the levels from before the crisis, and it is thus impossible to claim that Slovenian economy is overheating merely on the basis of the EU common methodology, as is claimed by the Commission, particularly since the calculations of other international institutions (IMF and OECD) do not confirm this. Upon the reviion of general government deficit for 2015 by SORS (or EUROSTAT) on 20 April 2016, the deficit increased by 0.7 percentage point of GDP to 2.9% of GDP relating to the first publication on 31 March 2016. The change was primarily the result of differences in observing transactions of one of the general government units, i.e. the Bank Assets Management Company (BAMC). The changes are the result of subsequent observance of impairments and write-offs of bad debts by the BAMC. In order to ensure suitable level of general government expenditure and the observance of the fiscal rule and the Stability and Growth Pact, the Government of the Republic of Slovenia will apply the advantage of one-tier management system in the BAMC if necessary and thus ensure the compliance with the medium-term objective of the general government sector. For this reason, the possibility of excluding the BAMC from the general government sector is also being examined.
Page 8 of 31
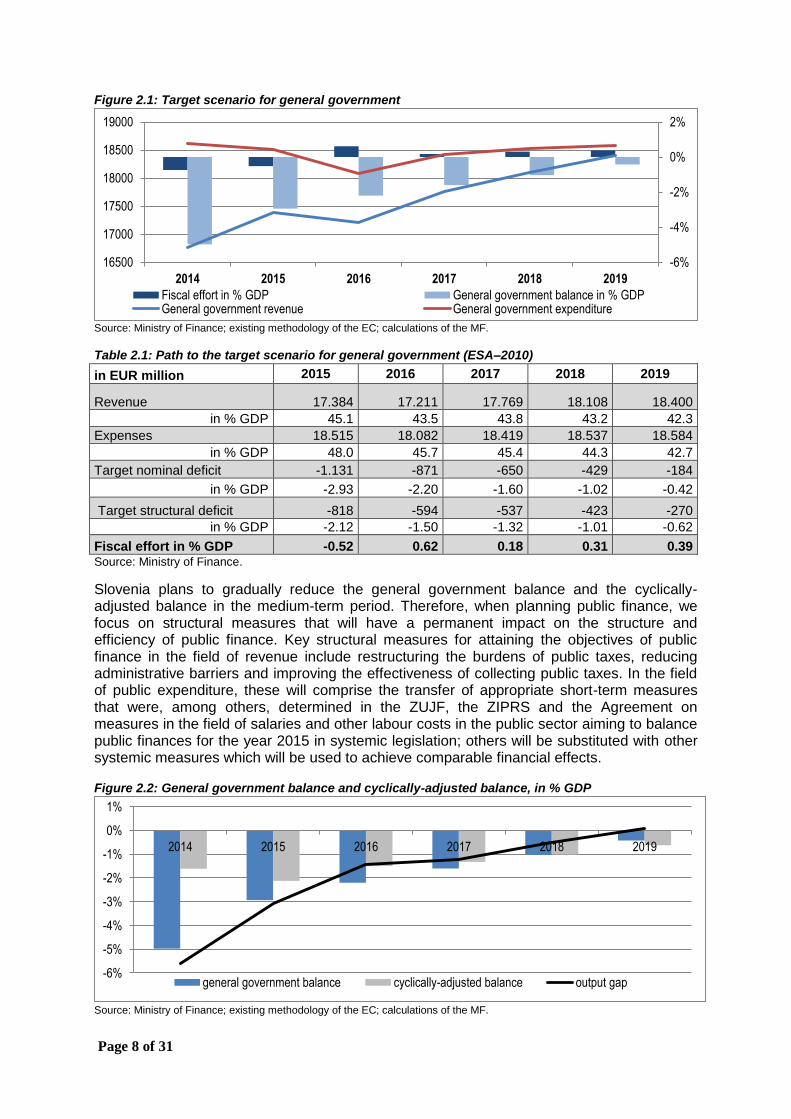
Figure 2.1: Target scenario for general government
Source: Ministry of Finance; existing methodology of the EC; calculations of the MF.
Table 2.1: Path to the target scenario for general government (ESA–2010)
in EUR million 2015 2016 2017 2018 2019
Revenue 17.384 17.211 17.769 18.108 18.400
in % GDP 45.1 43.5 43.8 43.2 42.3
Expenses 18.515 18.082 18.419 18.537 18.584
in % GDP 48.0 45.7 45.4 44.3 42.7
Target nominal deficit -1.131 -871 -650 -429 -184
in % GDP -2.93 -2.20 -1.60 -1.02 -0.42
Target structural deficit -818 -594 -537 -423 -270
in % GDP -2.12 -1.50 -1.32 -1.01 -0.62
Fiscal effort in % GDP -0.52 0.62 0.18 0.31 0.39 Source: Ministry of Finance.
Slovenia plans to gradually reduce the general government balance and the cyclically-adjusted balance in the medium-term period. Therefore, when planning public finance, we focus on structural measures that will have a permanent impact on the structure and efficiency of public finance. Key structural measures for attaining the objectives of public finance in the field of revenue include restructuring the burdens of public taxes, reducing administrative barriers and improving the effectiveness of collecting public taxes. In the field of public expenditure, these will comprise the transfer of appropriate short-term measures that were, among others, determined in the ZUJF, the ZIPRS and the Agreement on measures in the field of salaries and other labour costs in the public sector aiming to balance public finances for the year 2015 in systemic legislation; others will be substituted with other systemic measures which will be used to achieve comparable financial effects.
Figure 2.2: General government balance and cyclically-adjusted balance, in % GDP
Source: Ministry of Finance; existing methodology of the EC; calculations of the MF.
-6%
-4%
-2%
0%
2%
16500
17000
17500
18000
18500
19000
2014 2015 2016 2017 2018 2019
Fiscal effort in % GDP General government balance in % GDPGeneral government revenue General government expenditure
-6%
-5%
-4%
-3%
-2%
-1%
0%
1%
2014 2015 2016 2017 2018 2019
general government balance cyclically-adjusted balance output gap

Page 9 of 31
Table 2.2: Cyclical developments
in % GDP ESA code
2015 2016 2017 2018 2019
1. Real GDP growth (%) 2.9 1.7 2.4 2.3 2.3
2. Net lending/borrowing of general government B.9 -2.9 -2.2 -1.6 -1.0 -0.4
3. Interest expenditure D.41 3.0 2.9 2.6 2.5 2.4
4. One-off and other temporary measures 0.11 0.12 0.05 0.05 0.00
5. Potential GDP growth (%) 1.14 1.52 1.61 1.76 1.88
Contributions:
- labour 0.85 0.83 0.74 0.61 0.49
- capital 0.29 0.18 0.33 0.45 0.57
- total factor productivity 0.01 0.50 0.54 0.70 0.82
6. Output gap -1.43 -1.23 -0.49 0.08 0.45
7. Cyclical budgetary component -0.70 -0.58 -0.23 0.04 0.20
8. Cyclically adjusted balance (2–7) -2.2 -1.6 -1.4 -1.0 -0.2
9. Changes in cyclically-adjusted general government balance
0.6 0.2 0.4 0.8
10. Structural deficit (8–4) -2.1 -1.5 -1.3 -1.0 -0.6
11. Changes in structural deficit (fiscal effort) -0.5 0.6 0.2 0.3 0.4
Source: Ministry of Finance.
When meeting the commitments of the Stability and Growth Pact and the Fiscal Rule Act during the transitional period when the medium-term objective has not been met yet, we comply with the requirements. As displayed in figure below, we thus observe that the growth of general government expenditure lags behind the growth of general government revenue and potential product so that a share is always ‘saved’ or earmarked for approximation to the medium-term objective. The target scenario also notes the assumption that the potential GDP growth is lower than the real GDP growth or the negative output gap until 2019, which points to an additional discrepancy of the calculations made according to the applicable methodology of the European Commission.
Figure 2.3: Growth of general government revenue, expenditure, real and potential GDP growth, in %
Source: Ministry of Finance; existing methodology of the EC; calculations of the MF.
-2%
-1%
-1%
0%
1%
1%
2%
2%
3%
3%
4%
2016 2017 2018 2019 2020
growth of GG revenue growth of GG expenditures
potential GDP growth real GDP groeth

Page 10 of 31
Figure below displays changes necessary in general government expenditure for the attainment of objectives of public finance in order to be compliant with the fiscal rule.
Figure 2.4: General government revenue and expenditure, and necessary changes in general government expenditure in EUR million
Source: Ministry of Finance. Source: Ministry of Finance; existing methodology of the EC; calculations of the MF.
2.2. General government revenue policy The total general government revenue increased by 3.7% in 2015 of which tax revenues increased by 3.4%. The growth is attributed to a more favourable business cycle and more efficient tax collection. Tax revenues connected to labour, employment (personal income tax and contributions) and corporate income tax increased the most.
In 2015, important steps were taken by means of which we pursue the objectives of simplifying procedures for collecting taxes by reducing administrative barriers (amendments to the Tax Procedure Act, the latest amendments to the Value Added Tax Act, the latest amendments to the Act Implementing the Customs Regulations of the European Community), increasing effectiveness and improving voluntary tax compliance (Fiscal Verification of Invoices Act).
In this programming period, the objective of the tax policy is gradual consolidation of public finance and transition to healthy public finance, which means that the preparation of measures which would have a beneficial effect on the acceleration of economic activity is important in the field of tax policy. These measures would enhance competitiveness of the business environment with minimum distortion effects and also lead to stable and predictable public finance conditions. A measure denotes certain unburdening of the productive section of employees and denotes further path towards restructuring tax burdens. The measures leading towards these objectives point in three directions: restructuring the burdens of public taxes, reducing administrative barriers and improving the effectiveness of collecting public taxes.
- Restructuring the burdens of taxes, including the modernisation of real property taxation
Measures aimed at tax burden distribution among consumption, work and property (capital) are envisaged for 2016, so that the new distribution ensures a more competitive business environment. While observing the aforementioned, the measures set for reducing labour taxation have a negative impact on competitiveness, and they at the same time represent quite a significant limitation for economic growth. Solutions will be prepared by restructuring
-106
-434
337
118
47
-500
-400
-300
-200
-100
0
100
200
300
400
16500
17000
17500
18000
18500
19000
2015 2016 2017 2018 2019Nominal changes in expenditure General government revenue
General government expenditure
Page 11 of 31
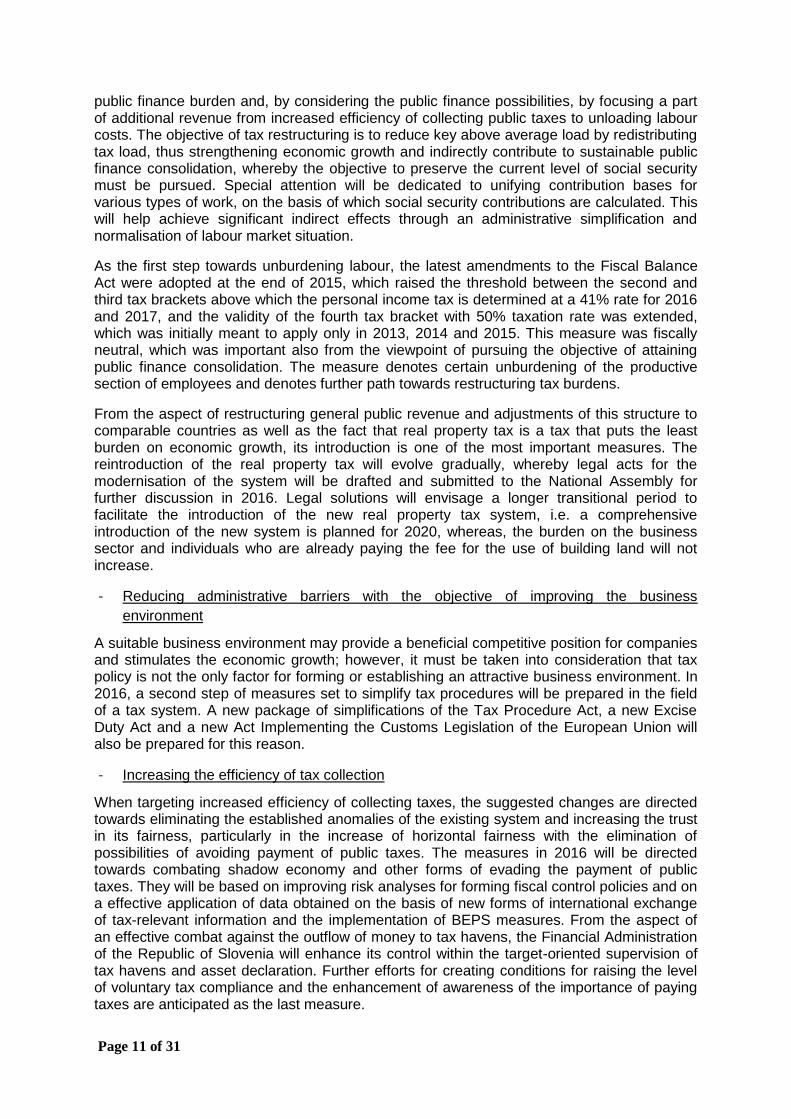
public finance burden and, by considering the public finance possibilities, by focusing a part of additional revenue from increased efficiency of collecting public taxes to unloading labour costs. The objective of tax restructuring is to reduce key above average load by redistributing tax load, thus strengthening economic growth and indirectly contribute to sustainable public finance consolidation, whereby the objective to preserve the current level of social security must be pursued. Special attention will be dedicated to unifying contribution bases for various types of work, on the basis of which social security contributions are calculated. This will help achieve significant indirect effects through an administrative simplification and normalisation of labour market situation.
As the first step towards unburdening labour, the latest amendments to the Fiscal Balance Act were adopted at the end of 2015, which raised the threshold between the second and third tax brackets above which the personal income tax is determined at a 41% rate for 2016 and 2017, and the validity of the fourth tax bracket with 50% taxation rate was extended, which was initially meant to apply only in 2013, 2014 and 2015. This measure was fiscally neutral, which was important also from the viewpoint of pursuing the objective of attaining public finance consolidation. The measure denotes certain unburdening of the productive section of employees and denotes further path towards restructuring tax burdens.
From the aspect of restructuring general public revenue and adjustments of this structure to comparable countries as well as the fact that real property tax is a tax that puts the least burden on economic growth, its introduction is one of the most important measures. The reintroduction of the real property tax will evolve gradually, whereby legal acts for the modernisation of the system will be drafted and submitted to the National Assembly for further discussion in 2016. Legal solutions will envisage a longer transitional period to facilitate the introduction of the new real property tax system, i.e. a comprehensive introduction of the new system is planned for 2020, whereas, the burden on the business sector and individuals who are already paying the fee for the use of building land will not increase.
- Reducing administrative barriers with the objective of improving the business
environment
A suitable business environment may provide a beneficial competitive position for companies and stimulates the economic growth; however, it must be taken into consideration that tax policy is not the only factor for forming or establishing an attractive business environment. In 2016, a second step of measures set to simplify tax procedures will be prepared in the field of a tax system. A new package of simplifications of the Tax Procedure Act, a new Excise Duty Act and a new Act Implementing the Customs Legislation of the European Union will also be prepared for this reason.
- Increasing the efficiency of tax collection
When targeting increased efficiency of collecting taxes, the suggested changes are directed towards eliminating the established anomalies of the existing system and increasing the trust in its fairness, particularly in the increase of horizontal fairness with the elimination of possibilities of avoiding payment of public taxes. The measures in 2016 will be directed towards combating shadow economy and other forms of evading the payment of public taxes. They will be based on improving risk analyses for forming fiscal control policies and on a effective application of data obtained on the basis of new forms of international exchange of tax-relevant information and the implementation of BEPS measures. From the aspect of an effective combat against the outflow of money to tax havens, the Financial Administration of the Republic of Slovenia will enhance its control within the target-oriented supervision of tax havens and asset declaration. Further efforts for creating conditions for raising the level of voluntary tax compliance and the enhancement of awareness of the importance of paying taxes are anticipated as the last measure.
Page 12 of 31
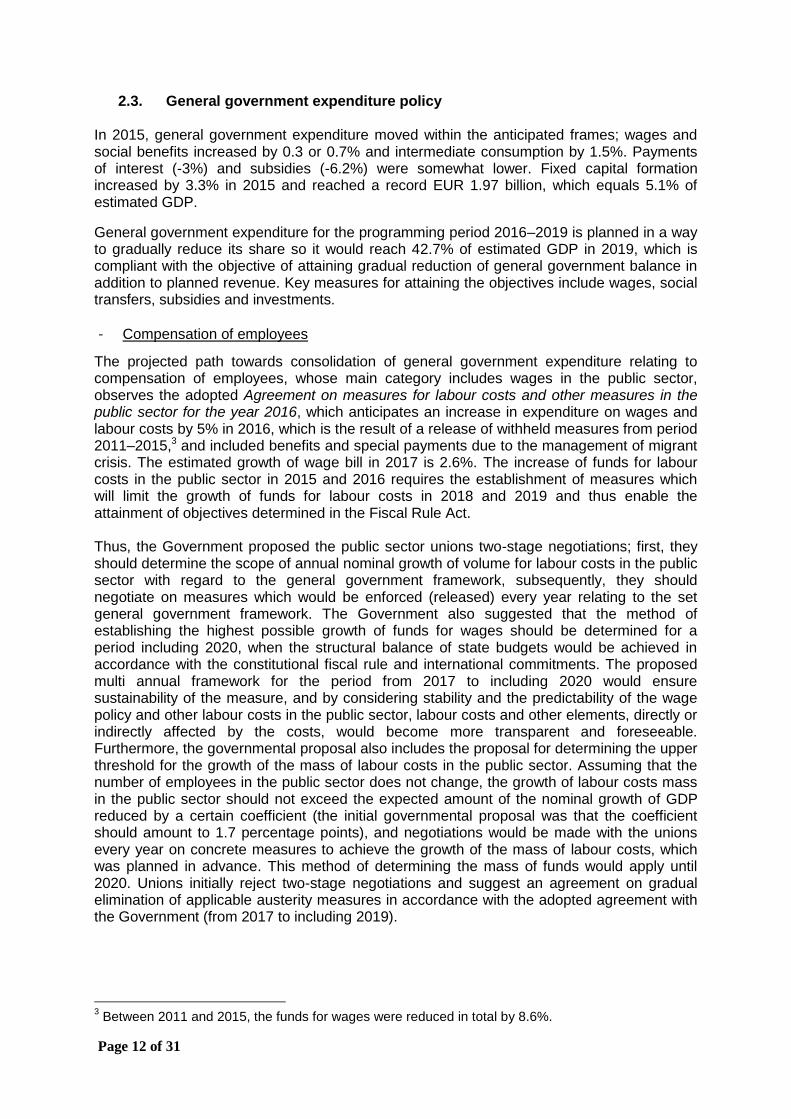
2.3. General government expenditure policy In 2015, general government expenditure moved within the anticipated frames; wages and social benefits increased by 0.3 or 0.7% and intermediate consumption by 1.5%. Payments of interest (-3%) and subsidies (-6.2%) were somewhat lower. Fixed capital formation increased by 3.3% in 2015 and reached a record EUR 1.97 billion, which equals 5.1% of estimated GDP.
General government expenditure for the programming period 2016–2019 is planned in a way to gradually reduce its share so it would reach 42.7% of estimated GDP in 2019, which is compliant with the objective of attaining gradual reduction of general government balance in addition to planned revenue. Key measures for attaining the objectives include wages, social transfers, subsidies and investments.
- Compensation of employees
The projected path towards consolidation of general government expenditure relating to compensation of employees, whose main category includes wages in the public sector, observes the adopted Agreement on measures for labour costs and other measures in the public sector for the year 2016, which anticipates an increase in expenditure on wages and labour costs by 5% in 2016, which is the result of a release of withheld measures from period 2011–2015,3 and included benefits and special payments due to the management of migrant crisis. The estimated growth of wage bill in 2017 is 2.6%. The increase of funds for labour costs in the public sector in 2015 and 2016 requires the establishment of measures which will limit the growth of funds for labour costs in 2018 and 2019 and thus enable the attainment of objectives determined in the Fiscal Rule Act. Thus, the Government proposed the public sector unions two-stage negotiations; first, they should determine the scope of annual nominal growth of volume for labour costs in the public sector with regard to the general government framework, subsequently, they should negotiate on measures which would be enforced (released) every year relating to the set general government framework. The Government also suggested that the method of establishing the highest possible growth of funds for wages should be determined for a period including 2020, when the structural balance of state budgets would be achieved in accordance with the constitutional fiscal rule and international commitments. The proposed multi annual framework for the period from 2017 to including 2020 would ensure sustainability of the measure, and by considering stability and the predictability of the wage policy and other labour costs in the public sector, labour costs and other elements, directly or indirectly affected by the costs, would become more transparent and foreseeable. Furthermore, the governmental proposal also includes the proposal for determining the upper threshold for the growth of the mass of labour costs in the public sector. Assuming that the number of employees in the public sector does not change, the growth of labour costs mass in the public sector should not exceed the expected amount of the nominal growth of GDP reduced by a certain coefficient (the initial governmental proposal was that the coefficient should amount to 1.7 percentage points), and negotiations would be made with the unions every year on concrete measures to achieve the growth of the mass of labour costs, which was planned in advance. This method of determining the mass of funds would apply until 2020. Unions initially reject two-stage negotiations and suggest an agreement on gradual elimination of applicable austerity measures in accordance with the adopted agreement with the Government (from 2017 to including 2019).
3 Between 2011 and 2015, the funds for wages were reduced in total by 8.6%.
Page 13 of 31
- Social transfers
In the field of expenditure for social transfers, the Government will pursue the objective of preventing the increase of the total volume of expenditure in 2018 and 2019 while observing the applicable measures, whereby deviations within individual categories of social transfers are possible relating to the conditions in the business sector (e.g. less unemployment benefits).
- Subsidies
Restrictive policy of granting subsidies is also anticipated. Additional measures will be adopted by means of which the funds for subsidies will be transformed into refundable funds to the greatest extent possible.
- Investments
In 2016, gross fixed capital formation financed from public funds will be reduced by 35% to 3.3% of GDP in comparison to 2015, which is the result of a transition into a new programming period of financing from European funds and lower common funds to which Slovenia is entitled in the period 2014–2020. A revival of government investing is planned for 2017 and 2018, when investment level will have again achieved 3.5% of GDP. A redirection of drawing EU funds supporting ‘classic’ investments into supporting ‘soft content’, i.e. investing in people, knowledge and development is also anticipated. Despite the fact that budgets for 2016 and 2017 have already been adopted, additional minimum financial funds, i.e. EUR 10 million in 2016, and EUR 20 to 40 million in 2017, are or will be ensured for implementing the investments and investment maintenance on the main road and regional road network in 2016 and 2017 in addition to the funds already provided in the budgets for 2016 and 2017. Additional funds in the amount of EUR 45 million will be ensured in 2018 relating to the thus raised and adopted budget for 2017.
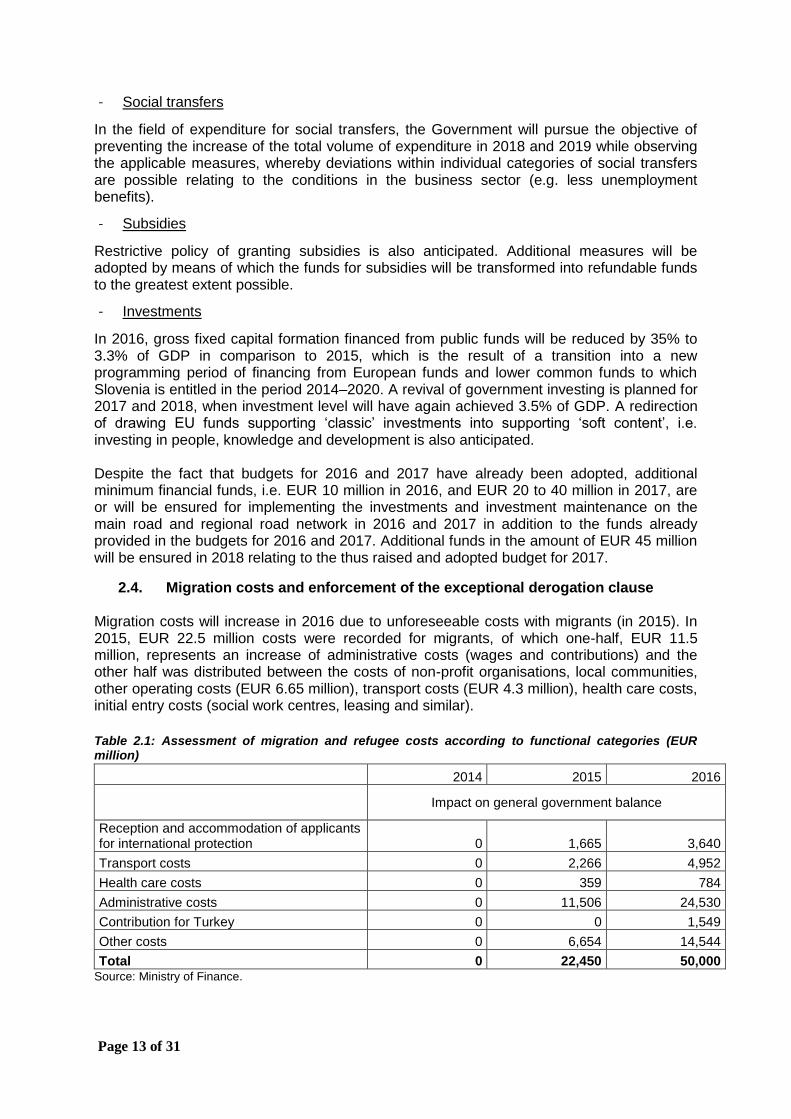
2.4. Migration costs and enforcement of the exceptional derogation clause Migration costs will increase in 2016 due to unforeseeable costs with migrants (in 2015). In 2015, EUR 22.5 million costs were recorded for migrants, of which one-half, EUR 11.5 million, represents an increase of administrative costs (wages and contributions) and the other half was distributed between the costs of non-profit organisations, local communities, other operating costs (EUR 6.65 million), transport costs (EUR 4.3 million), health care costs, initial entry costs (social work centres, leasing and similar).
Table 2.1: Assessment of migration and refugee costs according to functional categories (EUR million)
2014 2015 2016
Impact on general government balance
Reception and accommodation of applicants for international protection 0 1,665 3,640
Transport costs 0 2,266 4,952
Health care costs 0 359 784
Administrative costs 0 11,506 24,530
Contribution for Turkey 0 0 1,549
Other costs 0 6,654 14,544
Total 0 22,450 50,000 Source: Ministry of Finance.
Page 14 of 31
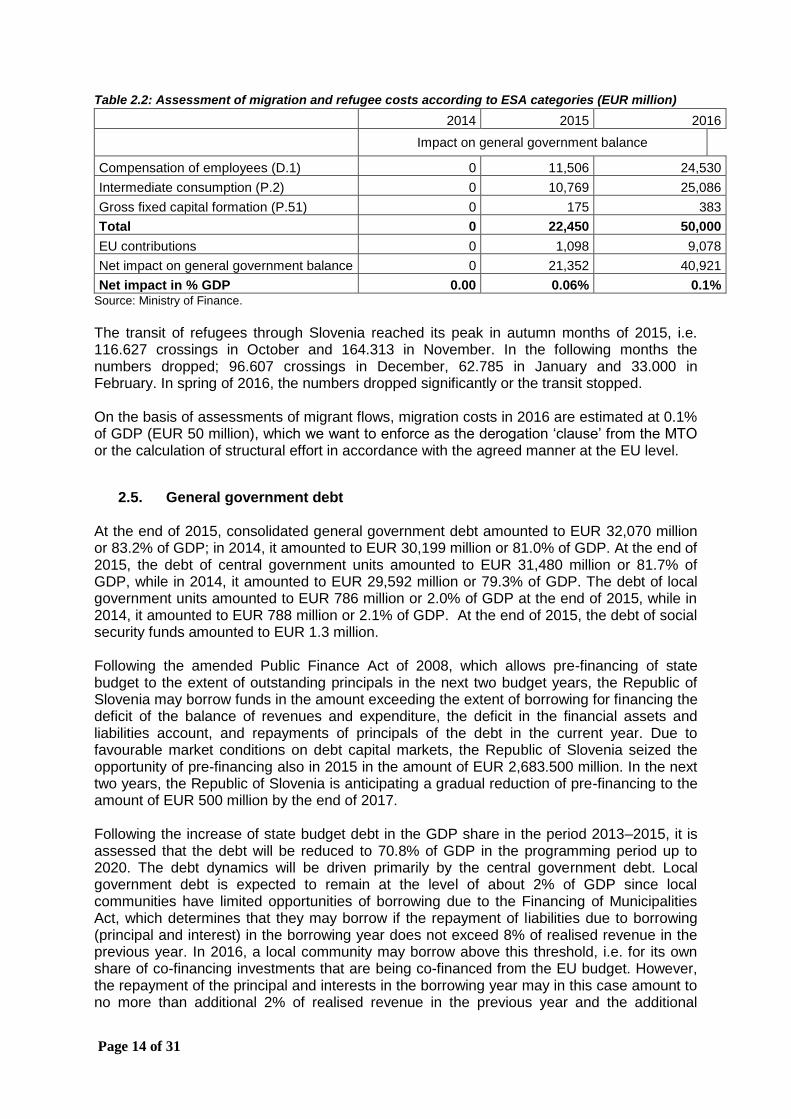
Table 2.2: Assessment of migration and refugee costs according to ESA categories (EUR million)
2014 2015 2016
Impact on general government balance
Compensation of employees (D.1) 0 11,506 24,530
Intermediate consumption (P.2) 0 10,769 25,086
Gross fixed capital formation (P.51) 0 175 383
Total 0 22,450 50,000
EU contributions 0 1,098 9,078
Net impact on general government balance 0 21,352 40,921
Net impact in % GDP 0.00 0.06% 0.1% Source: Ministry of Finance.
The transit of refugees through Slovenia reached its peak in autumn months of 2015, i.e. 116.627 crossings in October and 164.313 in November. In the following months the numbers dropped; 96.607 crossings in December, 62.785 in January and 33.000 in February. In spring of 2016, the numbers dropped significantly or the transit stopped. On the basis of assessments of migrant flows, migration costs in 2016 are estimated at 0.1% of GDP (EUR 50 million), which we want to enforce as the derogation ‘clause’ from the MTO or the calculation of structural effort in accordance with the agreed manner at the EU level.
2.5. General government debt At the end of 2015, consolidated general government debt amounted to EUR 32,070 million or 83.2% of GDP; in 2014, it amounted to EUR 30,199 million or 81.0% of GDP. At the end of 2015, the debt of central government units amounted to EUR 31,480 million or 81.7% of GDP, while in 2014, it amounted to EUR 29,592 million or 79.3% of GDP. The debt of local government units amounted to EUR 786 million or 2.0% of GDP at the end of 2015, while in 2014, it amounted to EUR 788 million or 2.1% of GDP. At the end of 2015, the debt of social security funds amounted to EUR 1.3 million. Following the amended Public Finance Act of 2008, which allows pre-financing of state budget to the extent of outstanding principals in the next two budget years, the Republic of Slovenia may borrow funds in the amount exceeding the extent of borrowing for financing the deficit of the balance of revenues and expenditure, the deficit in the financial assets and liabilities account, and repayments of principals of the debt in the current year. Due to favourable market conditions on debt capital markets, the Republic of Slovenia seized the opportunity of pre-financing also in 2015 in the amount of EUR 2,683.500 million. In the next two years, the Republic of Slovenia is anticipating a gradual reduction of pre-financing to the amount of EUR 500 million by the end of 2017. Following the increase of state budget debt in the GDP share in the period 2013–2015, it is assessed that the debt will be reduced to 70.8% of GDP in the programming period up to 2020. The debt dynamics will be driven primarily by the central government debt. Local government debt is expected to remain at the level of about 2% of GDP since local communities have limited opportunities of borrowing due to the Financing of Municipalities Act, which determines that they may borrow if the repayment of liabilities due to borrowing (principal and interest) in the borrowing year does not exceed 8% of realised revenue in the previous year. In 2016, a local community may borrow above this threshold, i.e. for its own share of co-financing investments that are being co-financed from the EU budget. However, the repayment of the principal and interests in the borrowing year may in this case amount to no more than additional 2% of realised revenue in the previous year and the additional
Page 15 of 31
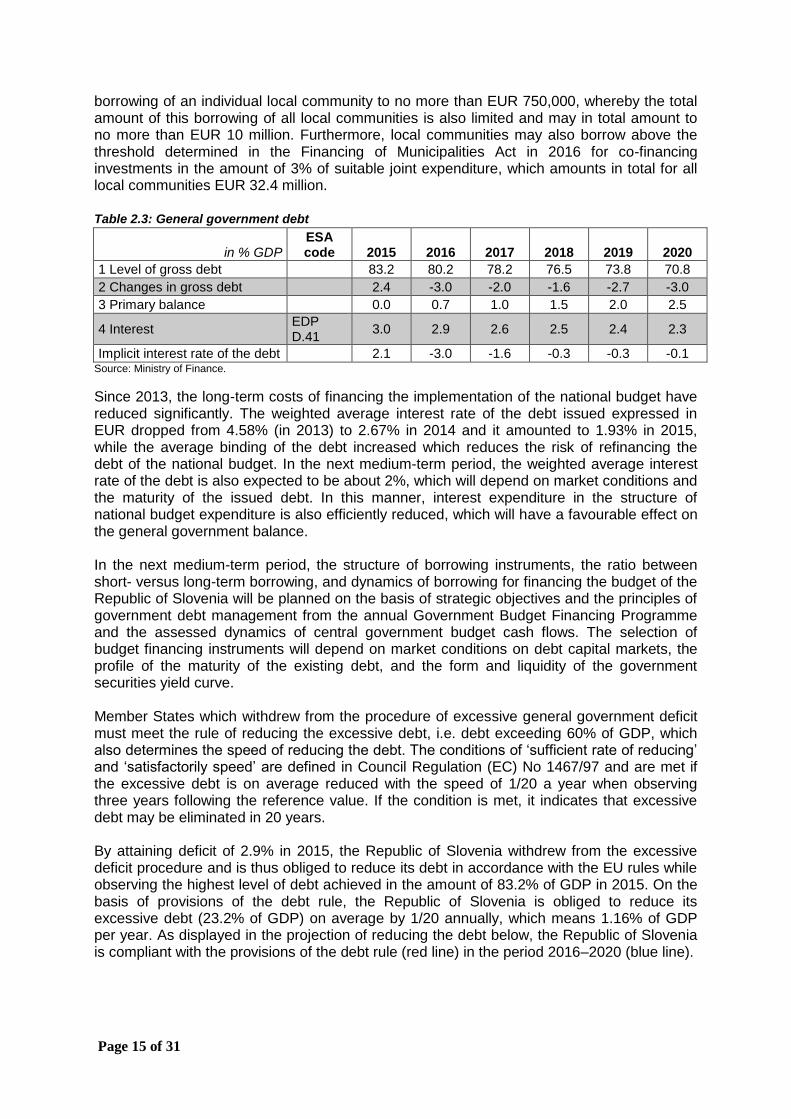
borrowing of an individual local community to no more than EUR 750,000, whereby the total amount of this borrowing of all local communities is also limited and may in total amount to no more than EUR 10 million. Furthermore, local communities may also borrow above the threshold determined in the Financing of Municipalities Act in 2016 for co-financing investments in the amount of 3% of suitable joint expenditure, which amounts in total for all local communities EUR 32.4 million. Table 2.3: General government debt
in % GDP ESA code 2015 2016 2017 2018 2019 2020
1 Level of gross debt 83.2 80.2 78.2 76.5 73.8 70.8
2 Changes in gross debt 2.4 -3.0 -2.0 -1.6 -2.7 -3.0
3 Primary balance 0.0 0.7 1.0 1.5 2.0 2.5
4 Interest EDP D.41
3.0 2.9 2.6 2.5 2.4 2.3
Implicit interest rate of the debt 2.1 -3.0 -1.6 -0.3 -0.3 -0.1 Source: Ministry of Finance.
Since 2013, the long-term costs of financing the implementation of the national budget have reduced significantly. The weighted average interest rate of the debt issued expressed in EUR dropped from 4.58% (in 2013) to 2.67% in 2014 and it amounted to 1.93% in 2015, while the average binding of the debt increased which reduces the risk of refinancing the debt of the national budget. In the next medium-term period, the weighted average interest rate of the debt is also expected to be about 2%, which will depend on market conditions and the maturity of the issued debt. In this manner, interest expenditure in the structure of national budget expenditure is also efficiently reduced, which will have a favourable effect on the general government balance. In the next medium-term period, the structure of borrowing instruments, the ratio between short- versus long-term borrowing, and dynamics of borrowing for financing the budget of the Republic of Slovenia will be planned on the basis of strategic objectives and the principles of government debt management from the annual Government Budget Financing Programme and the assessed dynamics of central government budget cash flows. The selection of budget financing instruments will depend on market conditions on debt capital markets, the profile of the maturity of the existing debt, and the form and liquidity of the government securities yield curve. Member States which withdrew from the procedure of excessive general government deficit must meet the rule of reducing the excessive debt, i.e. debt exceeding 60% of GDP, which also determines the speed of reducing the debt. The conditions of ‘sufficient rate of reducing’ and ‘satisfactorily speed’ are defined in Council Regulation (EC) No 1467/97 and are met if the excessive debt is on average reduced with the speed of 1/20 a year when observing three years following the reference value. If the condition is met, it indicates that excessive debt may be eliminated in 20 years. By attaining deficit of 2.9% in 2015, the Republic of Slovenia withdrew from the excessive deficit procedure and is thus obliged to reduce its debt in accordance with the EU rules while observing the highest level of debt achieved in the amount of 83.2% of GDP in 2015. On the basis of provisions of the debt rule, the Republic of Slovenia is obliged to reduce its excessive debt (23.2% of GDP) on average by 1/20 annually, which means 1.16% of GDP per year. As displayed in the projection of reducing the debt below, the Republic of Slovenia is compliant with the provisions of the debt rule (red line) in the period 2016–2020 (blue line).
Page 16 of 31
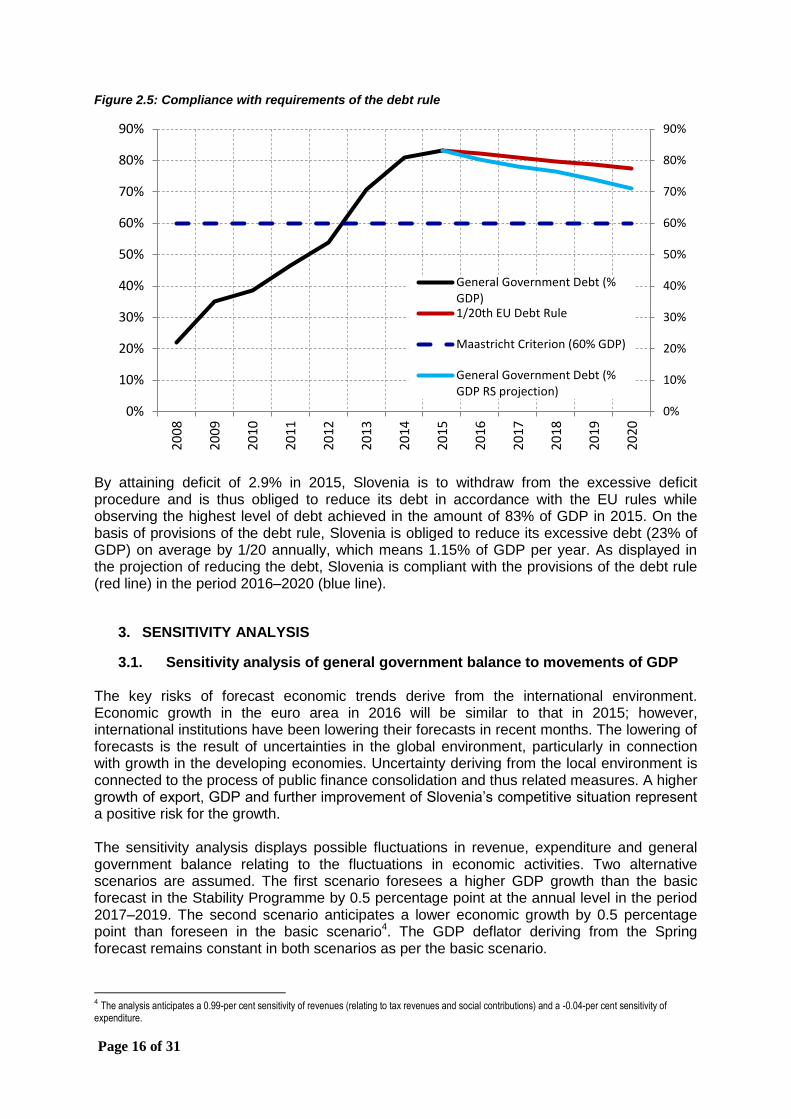
Figure 2.5: Compliance with requirements of the debt rule
By attaining deficit of 2.9% in 2015, Slovenia is to withdraw from the excessive deficit procedure and is thus obliged to reduce its debt in accordance with the EU rules while observing the highest level of debt achieved in the amount of 83% of GDP in 2015. On the basis of provisions of the debt rule, Slovenia is obliged to reduce its excessive debt (23% of GDP) on average by 1/20 annually, which means 1.15% of GDP per year. As displayed in the projection of reducing the debt, Slovenia is compliant with the provisions of the debt rule (red line) in the period 2016–2020 (blue line).
3. SENSITIVITY ANALYSIS
3.1. Sensitivity analysis of general government balance to movements of GDP The key risks of forecast economic trends derive from the international environment. Economic growth in the euro area in 2016 will be similar to that in 2015; however, international institutions have been lowering their forecasts in recent months. The lowering of forecasts is the result of uncertainties in the global environment, particularly in connection with growth in the developing economies. Uncertainty deriving from the local environment is connected to the process of public finance consolidation and thus related measures. A higher growth of export, GDP and further improvement of Slovenia’s competitive situation represent a positive risk for the growth. The sensitivity analysis displays possible fluctuations in revenue, expenditure and general government balance relating to the fluctuations in economic activities. Two alternative scenarios are assumed. The first scenario foresees a higher GDP growth than the basic forecast in the Stability Programme by 0.5 percentage point at the annual level in the period 2017–2019. The second scenario anticipates a lower economic growth by 0.5 percentage point than foreseen in the basic scenario4. The GDP deflator deriving from the Spring forecast remains constant in both scenarios as per the basic scenario.
4 The analysis anticipates a 0.99-per cent sensitivity of revenues (relating to tax revenues and social contributions) and a -0.04-per cent sensitivity of
expenditure.
0%
10%
20%
30%
40%
50%
60%
70%
80%
90%
0%
10%
20%
30%
40%
50%
60%
70%
80%
90%
20
08
20
09
20
10
20
11
20
12
20
13
20
14
20
15
20
16
20
17
20
18
20
19
20
20
General Government Debt (%GDP)1/20th EU Debt Rule
Maastricht Criterion (60% GDP)
General Government Debt (%GDP RS projection)
Page 17 of 31
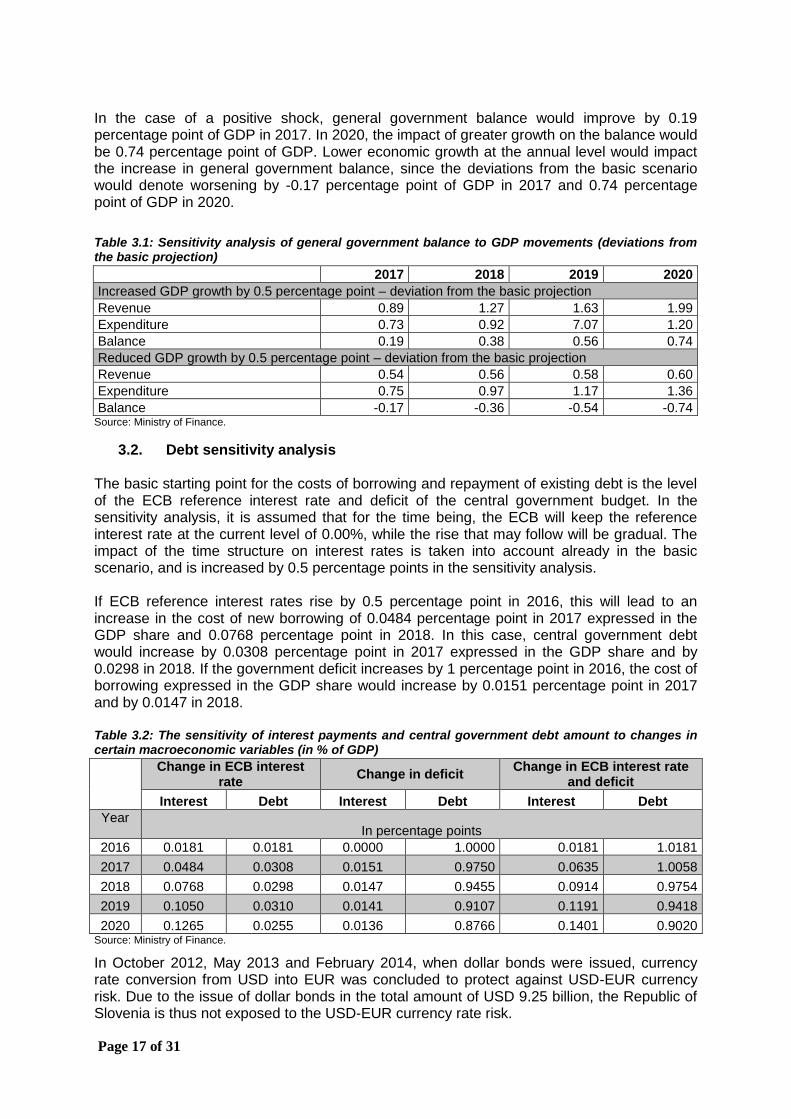
In the case of a positive shock, general government balance would improve by 0.19 percentage point of GDP in 2017. In 2020, the impact of greater growth on the balance would be 0.74 percentage point of GDP. Lower economic growth at the annual level would impact the increase in general government balance, since the deviations from the basic scenario would denote worsening by -0.17 percentage point of GDP in 2017 and 0.74 percentage point of GDP in 2020.
Table 3.1: Sensitivity analysis of general government balance to GDP movements (deviations from the basic projection)
2017 2018 2019 2020
Increased GDP growth by 0.5 percentage point – deviation from the basic projection
Revenue 0.89 1.27 1.63 1.99
Expenditure 0.73 0.92 7.07 1.20
Balance 0.19 0.38 0.56 0.74
Reduced GDP growth by 0.5 percentage point – deviation from the basic projection
Revenue 0.54 0.56 0.58 0.60
Expenditure 0.75 0.97 1.17 1.36
Balance -0.17 -0.36 -0.54 -0.74 Source: Ministry of Finance.
3.2. Debt sensitivity analysis The basic starting point for the costs of borrowing and repayment of existing debt is the level of the ECB reference interest rate and deficit of the central government budget. In the sensitivity analysis, it is assumed that for the time being, the ECB will keep the reference interest rate at the current level of 0.00%, while the rise that may follow will be gradual. The impact of the time structure on interest rates is taken into account already in the basic scenario, and is increased by 0.5 percentage points in the sensitivity analysis. If ECB reference interest rates rise by 0.5 percentage point in 2016, this will lead to an increase in the cost of new borrowing of 0.0484 percentage point in 2017 expressed in the GDP share and 0.0768 percentage point in 2018. In this case, central government debt would increase by 0.0308 percentage point in 2017 expressed in the GDP share and by 0.0298 in 2018. If the government deficit increases by 1 percentage point in 2016, the cost of borrowing expressed in the GDP share would increase by 0.0151 percentage point in 2017 and by 0.0147 in 2018.
Table 3.2: The sensitivity of interest payments and central government debt amount to changes in certain macroeconomic variables (in % of GDP)
Change in ECB interest rate
Change in deficit Change in ECB interest rate
and deficit
Interest Debt Interest Debt Interest Debt
Year In percentage points
2016 0.0181 0.0181 0.0000 1.0000 0.0181 1.0181
2017 0.0484 0.0308 0.0151 0.9750 0.0635 1.0058
2018 0.0768 0.0298 0.0147 0.9455 0.0914 0.9754
2019 0.1050 0.0310 0.0141 0.9107 0.1191 0.9418
2020 0.1265 0.0255 0.0136 0.8766 0.1401 0.9020 Source: Ministry of Finance.
In October 2012, May 2013 and February 2014, when dollar bonds were issued, currency rate conversion from USD into EUR was concluded to protect against USD-EUR currency risk. Due to the issue of dollar bonds in the total amount of USD 9.25 billion, the Republic of Slovenia is thus not exposed to the USD-EUR currency rate risk.

Page 18 of 31
The impact of changes in interest rates on existing central government debt expressed in the GDP share is relatively limited, as the central government debt is comprised mainly of fixed interest instruments. Thus the change in interest rate affects merely the cost of new borrowing. In the 2016 programming year, the share of debt with a fixed interest rate is estimated at 98.7%.
3.3. Comparison of GDP forecast with the preliminary programme The forecast for GDP growth compared with the previous Stability Programme is somewhat lower for 2016 and somewhat higher for the remaining years in the programming period. However, there are no significant changes in the expected structure of economic growth, which will be marked significantly by the dynamics of government investments financed from EU funds upon the transition to the new financial perspective. The economic growth in 2015 exceeded expectations of domestic and foreign institutions and was higher by 0.5 percentage point in comparison to the projection in the last year's Stability Programme, which was the result of higher growth of export and particularly faster recovery of private consumption. Contrary to expectations, government spending also somewhat increased. The growth of gross investments was lower, and the scope of government investments was particularly smaller. A higher positive effect of lower import prices also affected the business activity, including a weaker euro from the viewpoint of price competitiveness. A somewhat lower forecast of economic growth in 2016 relating to the previous Stability Programme is particularly the result of lower assumptions of foreign demand and lower growth of export. The anticipated decline in investments will also be somewhat greater. In the forthcoming years, the dynamics of investment growth differs from last year's projections mainly because of somewhat different assumptions of dynamics of drawing EU funds. The forecasts of government spending are also slightly higher than in last year's projections, where stagnation is anticipated instead of a decline. Following faster last and this years' recovery, the growth of private consumption will be somewhat lower in the next years. Table 3.3: Comparison of GDP growth with forecasts in the Stability Programme from March 2015
% GDP 2014 2015 2016 2017 2018 2019 2020
2015 Stability Programme 2.6 2.4 2.0 2.1 2.2 2.2
2016 Stability Programme 2.9 1.7 2.4 2.3 2.3 2.3
Difference 0.5 -0.3 0.3 0.1 0.1 Source: IMAD, SORS and the Ministry of Finance of the Republic of Slovenia.
The key risks for realisation of the basic scenario of economic growth forecast derive from the international environment. In recent months, international institutions have lowered their economic growth forecasts which are associated with uncertainties in the global environment, particularly relating to the growth of developing economies. Increased uncertainty on foreign currency markets, which could further enhance this trend by means of greater changes to exchange rates, is also connected to this. Uncertainty deriving from the local environment is further connected to the process of public finance consolidation and particularly thus related measures. The assessment of drawing EU funds is also uncertain. On the other hand, there is a risk that competitive situation would continue to improve in 2016, which could result in higher growth of export and GDP.
3.4. Quality of forecasts
The table below displays the differences in the forecasts of the IMF, the European Commission, the OECD, the Bank of Slovenia and the IMAD, because the change in forecast significantly changes the BDP and the calculations of potential growth, and consequently also the general government balance as well as the production gap.
Page 19 of 31
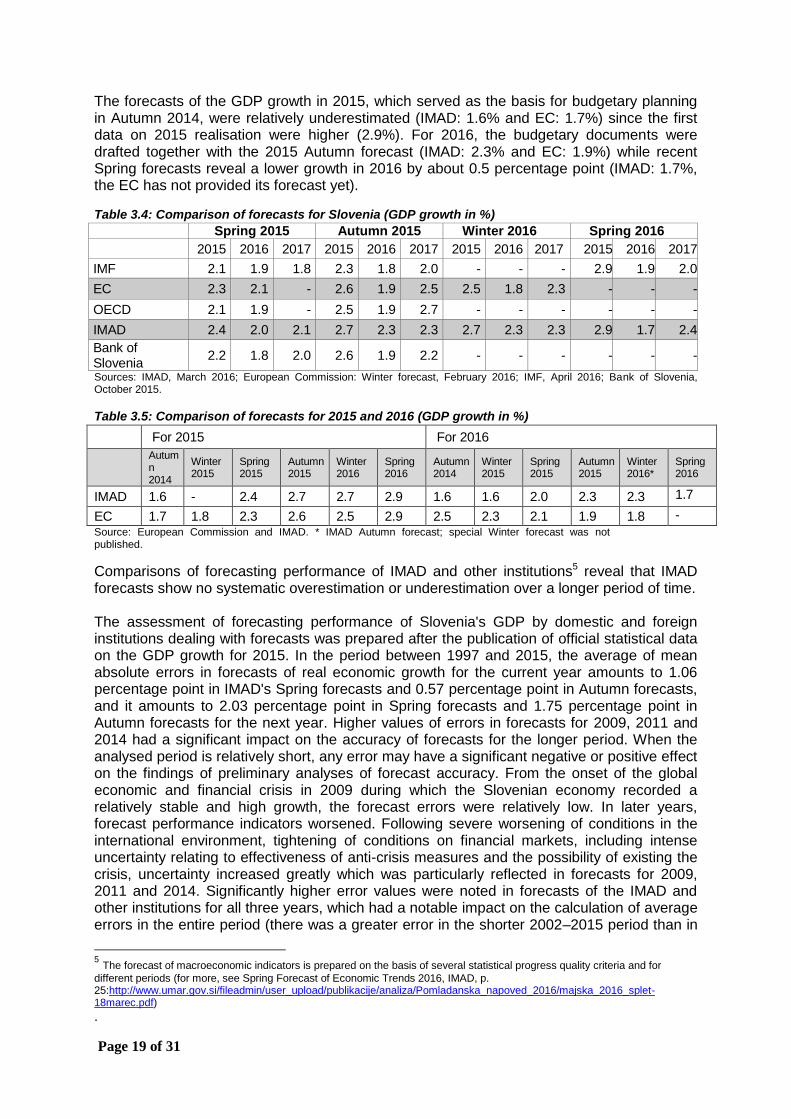
The forecasts of the GDP growth in 2015, which served as the basis for budgetary planning in Autumn 2014, were relatively underestimated (IMAD: 1.6% and EC: 1.7%) since the first data on 2015 realisation were higher (2.9%). For 2016, the budgetary documents were drafted together with the 2015 Autumn forecast (IMAD: 2.3% and EC: 1.9%) while recent Spring forecasts reveal a lower growth in 2016 by about 0.5 percentage point (IMAD: 1.7%, the EC has not provided its forecast yet).
Table 3.4: Comparison of forecasts for Slovenia (GDP growth in %)
Spring 2015 Autumn 2015 Winter 2016 Spring 2016
2015 2016 2017 2015 2016 2017 2015 2016 2017 2015 2016 2017
IMF 2.1 1.9 1.8 2.3 1.8 2.0 - - - 2.9 1.9 2.0
EC 2.3 2.1 - 2.6 1.9 2.5 2.5 1.8 2.3 - - -
OECD 2.1 1.9 - 2.5 1.9 2.7 - - - - - -
IMAD 2.4 2.0 2.1 2.7 2.3 2.3 2.7 2.3 2.3 2.9 1.7 2.4
Bank of Slovenia
2.2 1.8 2.0 2.6 1.9 2.2 - - - - - -
Sources: IMAD, March 2016; European Commission: Winter forecast, February 2016; IMF, April 2016; Bank of Slovenia, October 2015.
Table 3.5: Comparison of forecasts for 2015 and 2016 (GDP growth in %)
For 2015 For 2016
Autumn 2014
Winter 2015
Spring 2015
Autumn 2015
Winter 2016
Spring 2016
Autumn 2014
Winter 2015
Spring 2015
Autumn 2015
Winter 2016*
Spring 2016
IMAD 1.6 - 2.4 2.7 2.7 2.9 1.6 1.6 2.0 2.3 2.3 1.7
EC 1.7 1.8 2.3 2.6 2.5 2.9 2.5 2.3 2.1 1.9 1.8 -
Source: European Commission and IMAD. * IMAD Autumn forecast; special Winter forecast was not published.
Comparisons of forecasting performance of IMAD and other institutions5 reveal that IMAD forecasts show no systematic overestimation or underestimation over a longer period of time. The assessment of forecasting performance of Slovenia's GDP by domestic and foreign institutions dealing with forecasts was prepared after the publication of official statistical data on the GDP growth for 2015. In the period between 1997 and 2015, the average of mean absolute errors in forecasts of real economic growth for the current year amounts to 1.06 percentage point in IMAD's Spring forecasts and 0.57 percentage point in Autumn forecasts, and it amounts to 2.03 percentage point in Spring forecasts and 1.75 percentage point in Autumn forecasts for the next year. Higher values of errors in forecasts for 2009, 2011 and 2014 had a significant impact on the accuracy of forecasts for the longer period. When the analysed period is relatively short, any error may have a significant negative or positive effect on the findings of preliminary analyses of forecast accuracy. From the onset of the global economic and financial crisis in 2009 during which the Slovenian economy recorded a relatively stable and high growth, the forecast errors were relatively low. In later years, forecast performance indicators worsened. Following severe worsening of conditions in the international environment, tightening of conditions on financial markets, including intense uncertainty relating to effectiveness of anti-crisis measures and the possibility of existing the crisis, uncertainty increased greatly which was particularly reflected in forecasts for 2009, 2011 and 2014. Significantly higher error values were noted in forecasts of the IMAD and other institutions for all three years, which had a notable impact on the calculation of average errors in the entire period (there was a greater error in the shorter 2002–2015 period than in
5 The forecast of macroeconomic indicators is prepared on the basis of several statistical progress quality criteria and for
different periods (for more, see Spring Forecast of Economic Trends 2016, IMAD, p. 25:http://www.umar.gov.si/fileadmin/user_upload/publikacije/analiza/Pomladanska_napoved_2016/majska_2016_splet-18marec.pdf)
.
Page 20 of 31
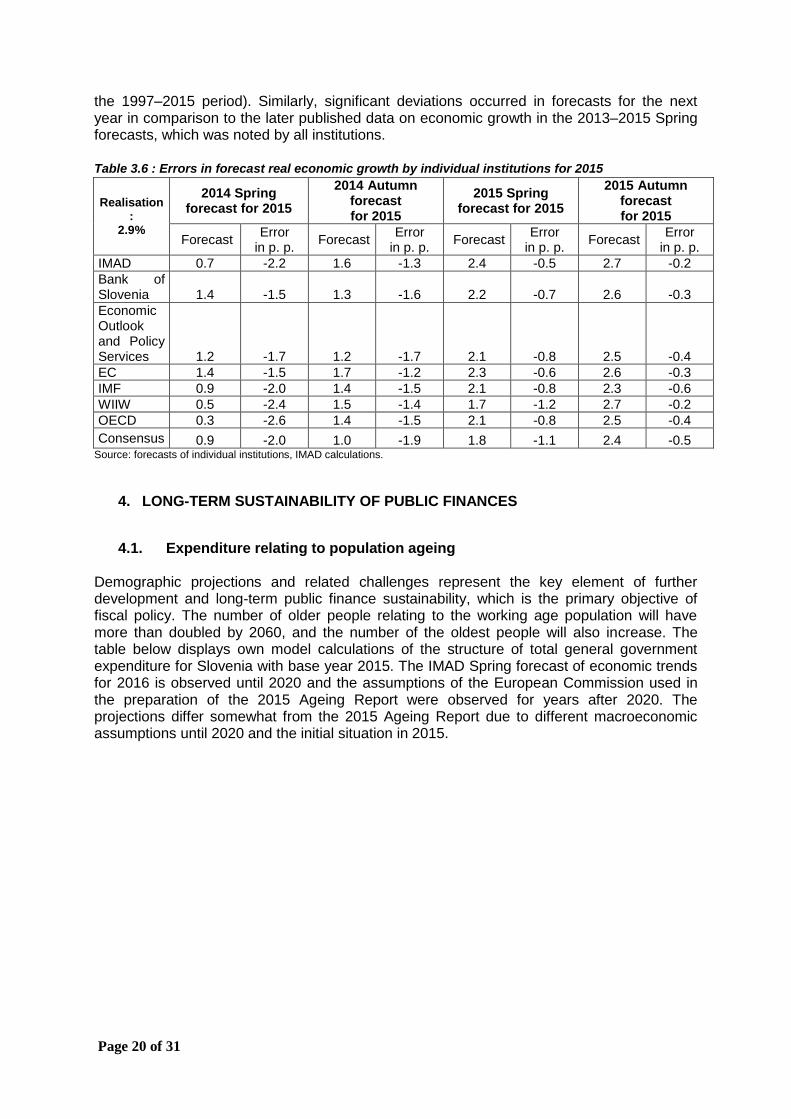
the 1997–2015 period). Similarly, significant deviations occurred in forecasts for the next year in comparison to the later published data on economic growth in the 2013–2015 Spring forecasts, which was noted by all institutions. Table 3.6 : Errors in forecast real economic growth by individual institutions for 2015
Realisation:
2.9%
2014 Spring forecast for 2015
2014 Autumn forecast for 2015
2015 Spring forecast for 2015
2015 Autumn forecast for 2015
Forecast Error
in p. p. Forecast
Error in p. p.
Forecast Error
in p. p. Forecast
Error in p. p.
IMAD 0.7 -2.2 1.6 -1.3 2.4 -0.5 2.7 -0.2
Bank of Slovenia 1.4 -1.5 1.3 -1.6 2.2 -0.7 2.6 -0.3
Economic Outlook and Policy Services 1.2 -1.7 1.2 -1.7 2.1 -0.8 2.5 -0.4
EC 1.4 -1.5 1.7 -1.2 2.3 -0.6 2.6 -0.3
IMF 0.9 -2.0 1.4 -1.5 2.1 -0.8 2.3 -0.6
WIIW 0.5 -2.4 1.5 -1.4 1.7 -1.2 2.7 -0.2
OECD 0.3 -2.6 1.4 -1.5 2.1 -0.8 2.5 -0.4
Consensus 0.9 -2.0 1.0 -1.9 1.8 -1.1 2.4 -0.5 Source: forecasts of individual institutions, IMAD calculations.
4. LONG-TERM SUSTAINABILITY OF PUBLIC FINANCES
4.1. Expenditure relating to population ageing Demographic projections and related challenges represent the key element of further development and long-term public finance sustainability, which is the primary objective of fiscal policy. The number of older people relating to the working age population will have more than doubled by 2060, and the number of the oldest people will also increase. The table below displays own model calculations of the structure of total general government expenditure for Slovenia with base year 2015. The IMAD Spring forecast of economic trends for 2016 is observed until 2020 and the assumptions of the European Commission used in the preparation of the 2015 Ageing Report were observed for years after 2020. The projections differ somewhat from the 2015 Ageing Report due to different macroeconomic assumptions until 2020 and the initial situation in 2015.

Page 21 of 31
Table 4.1: Long-term sustainability of public finances (base year 2015)
in % GDP 2015 2020 2030 2040 2050 2060 Difference
2060–2010
Total general government expenditure
44.0 44.4 47.7 52.9 59.4 65.0 21.0
1. Total age-related expenditure:
24.5 25.3 27.0 29.4 31.4 31.4 6.9
1.1. Pensions 11.2 11.4 12.4 14.3 15.6 15.2 4.0
Age and early pensions 7.6 8.7 9.9 11.7 12.8 12.4 4.9
Disability pensions 1.2 1.3 1.0 1.0 1.0 0.9 -0.3
Other pensions 2.4 1.5 1.5 1.7 1.8 1.9 -0.5
1.2. Health care 5.7 5.9 6.4 6.7 6.8 6.8 1.1
1.3. Long-term care 1.0 1.1 1.3 1.5 1.8 1.9 0.9
1.4. Education 5.3 5.4 5.6 5.5 5.8 6.1 0.9
1.5. Other age-related expenditure
1.4 1.5 1.3 1.3 1.4 1.4 0.0
2.Expenditure on goods and services, other transfers:
2.1. Wage compensations 0.4 0.4 0.3 0.3 0.3 0.3 -0.1
2.2. Subsidies 1.0 1.0 1.0 1.0 1.0 1.0 0.0
2.3. State investments 4.7 4.7 4.7 4.7 4.7 4.7 0.0
Total primary expenditure 41.3 42.0 43.4 45.7 47.6 47.4 6.1
3. Interest expenditure 2.7 2.4 4.3 7.2 11.8 17.6 14.9
Total general government revenues
40.8 41.2 41.0 40.4 40.1 40.1 -0.6
Assumptions
Labour productivity growth 1.4 1.9 1.8 1.8 1.7 1.5 0.1
Real GDP growth 2.1 2.5 1.4 1.2 1.3 1.6 -0.5
Real GDP growth per
inhabitant 2.1 2.5 1.4 1.2 1.3 1.6 -0.5
Male activity rate
(20–64 years) 79.6 82.7 81.9 81.0 82.1 82.5 2.9
Female activity rate
(20–64 years) 72.1 75.5 77.7 76.7 77.6 78.1 6.0
Total activity rate
(20–64 years) 76.0 79.2 79.8 78.9 79.9 80.4 4.4
Unemployment rate 9.0 9.0 6.7 6.3 6.3 6.3 -2.7
Share of population aged
65 years and more 18.1 20.6 25.0 27.9 29.9 29.4 11.3
Source: Ministry of Finance, Institute for Economic Research.
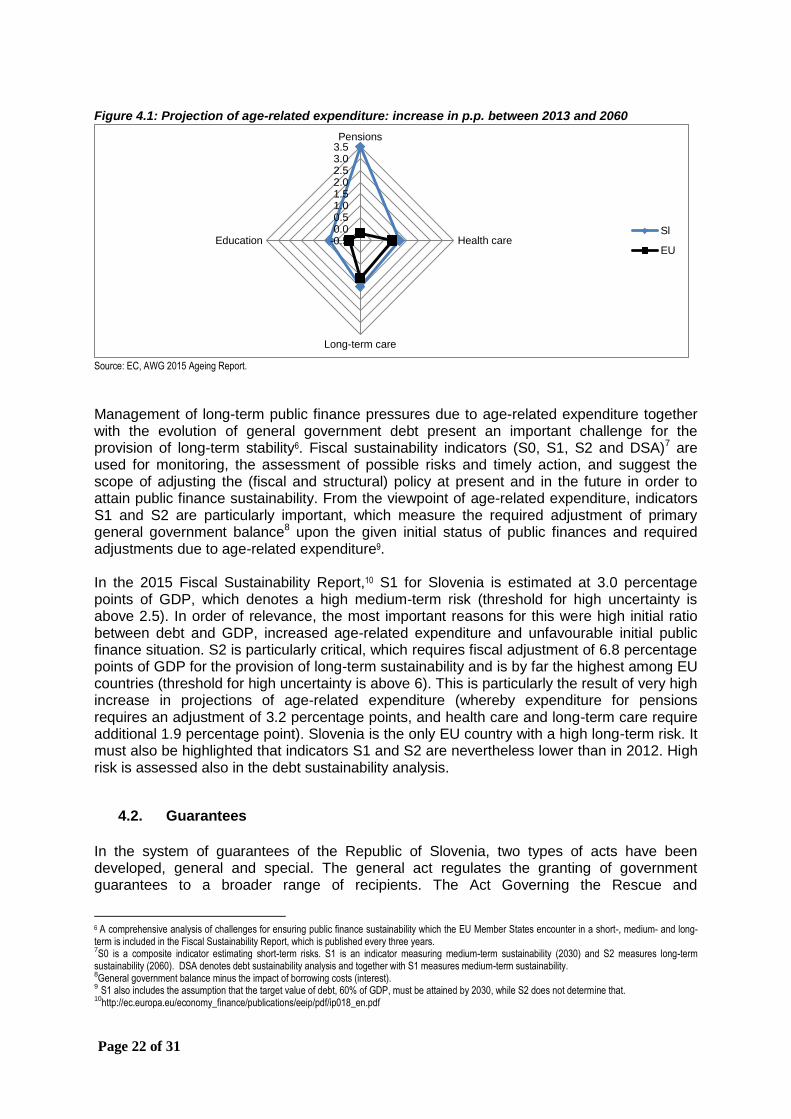
The figure below displays the change (in percentage points) in the rate of basic projection of individual expenditure related to ageing expressed in % of GDP between 2013 and 2060 deriving from the 2015 Ageing Report. Projections of expenditure have been increasing more on all displayed fields in Slovenia if compared to the EU average. According to these projections, Slovenia would be at the very top of the EU also by the rate of expenditure related to ageing expressed in the GDP share in 2060.
Page 22 of 31
Figure 4.1: Projection of age-related expenditure: increase in p.p. between 2013 and 2060
Source: EC, AWG 2015 Ageing Report.
Management of long-term public finance pressures due to age-related expenditure together with the evolution of general government debt present an important challenge for the provision of long-term stability6. Fiscal sustainability indicators (S0, S1, S2 and DSA)7 are used for monitoring, the assessment of possible risks and timely action, and suggest the scope of adjusting the (fiscal and structural) policy at present and in the future in order to attain public finance sustainability. From the viewpoint of age-related expenditure, indicators S1 and S2 are particularly important, which measure the required adjustment of primary general government balance8 upon the given initial status of public finances and required adjustments due to age-related expenditure9. In the 2015 Fiscal Sustainability Report,10 S1 for Slovenia is estimated at 3.0 percentage points of GDP, which denotes a high medium-term risk (threshold for high uncertainty is above 2.5). In order of relevance, the most important reasons for this were high initial ratio between debt and GDP, increased age-related expenditure and unfavourable initial public finance situation. S2 is particularly critical, which requires fiscal adjustment of 6.8 percentage points of GDP for the provision of long-term sustainability and is by far the highest among EU countries (threshold for high uncertainty is above 6). This is particularly the result of very high increase in projections of age-related expenditure (whereby expenditure for pensions requires an adjustment of 3.2 percentage points, and health care and long-term care require additional 1.9 percentage point). Slovenia is the only EU country with a high long-term risk. It must also be highlighted that indicators S1 and S2 are nevertheless lower than in 2012. High risk is assessed also in the debt sustainability analysis.
4.2. Guarantees
In the system of guarantees of the Republic of Slovenia, two types of acts have been developed, general and special. The general act regulates the granting of government guarantees to a broader range of recipients. The Act Governing the Rescue and
6
A comprehensive analysis of challenges for ensuring public finance sustainability which the EU Member States encounter in a short-, medium- and long-term is included in the Fiscal Sustainability Report, which is published every three years. 7S0 is a composite indicator estimating short-term risks. S1 is an indicator measuring medium-term sustainability (2030) and S2 measures long-term
sustainability (2060). DSA denotes debt sustainability analysis and together with S1 measures medium-term sustainability. 8General government balance minus the impact of borrowing costs (interest).
9 S1 also includes the assumption that the target value of debt, 60% of GDP, must be attained by 2030, while S2 does not determine that.
10http://ec.europa.eu/economy_finance/publications/eeip/pdf/ip018_en.pdf
-0.50.00.51.01.52.02.53.03.5Pensions
Health care
Long-term care
EducationSl
EU

Page 23 of 31
Restructuring Aid for Companies in Difficulty is an example of a general act. Special acts are intended for specific recipients, e.g. the acts on guarantees to Družba za avtoceste v Republiki Sloveniji, d.d. (Motorway Company of the Republic of Slovenia), Slovenski državni holding, d.d. (Slovenian Sovereign Holding), etc. The Republic of Slovenia may issue government guarantees to public or private sector entities. Most of the guarantees in the private sector were granted to companies in difficulties. Relatively high levels of this type of guarantee are being called on while a relatively low number of guarantees for the public sector is being called on. The issuing of government guarantees of the Republic of Slovenia is regulated by the provisions of the systemic act. The annual quota is set by the act governing the execution of the state budget, while the state may issue guarantees also outside the quota if this is permitted by an individual act. The data below display the assessment of balance of guarantees of the Republic of Slovenia at the end of the year, which was prepared on the basis of certain assumptions relating to the repayment of existing guarantees. As per the Implementation of the Republic of Slovenia’s Budget for 2016 and 2017 Act, the planned quota for new guarantees for 2016 is EUR 1 billion and separately EUR 350 million for guarantees of SID banka d.d. The experience from the previous years shows that the actual use of the quota is low: only 0.38% in 2014 and 5.7% in 2015, while it was not used at all for SID banka d.d. Table 4.2: Balance of guarantees of the Republic of Slovenia
Balance as of 31
Dec 2016 Balance as of 31
Dec 2017 Balance as of 31
Dec 2018 Balance as of 31
Dec 2019
in EUR million
in % GDP
in EUR million
in % GDP
in EUR million
in % GDP in EUR million
in % GDP
Guarantees of the Republic of Slovenia
6,166.56 15.6 5,037.79 12.4 4,265.48 10.2 3,555.58 8.2
within: financial sector**
1,378.19 3.5 1,168.33 2.9 973.57 2.3 805.18 1.9
Source: Ministry of Finance of the Republic of Slovenia. Notes: *Projections of the Ministry of Finance. ** In accordance with classification, legal entities with SKIS mark S12 (SID banka d.d.) are included.
In 2015, EUR 7.1 million was used for the realisation of government guarantees of the Republic of Slovenia according to the Republic of Slovenia Guarantee Scheme Act, the Act on the Natural Persons Guarantee Scheme of the Republic of Slovenia and the Act Governing the Rescue and Restructuring Aid for Companies in Difficulty. In 2016, the use of funds in the amount of EUR 13 million is anticipated and EUR 3.5 million in 2017.
5. QUALITY OF PUBLIC FINANCES
5.1. General government expenditure
Budgetary classification On the basis of EDP notification published by the Statistical Office, the deficit at the central government level amounted to EUR 1.131 million or 2.9% of GDP in 2015. Social security funds recorded a surplus of EUR 45 million or 0.1% of GDP in 2015. Surplus was also estimated at local level amounting to EUR 97 million or 0.3% of GDP. Public funds (EUR 52 million) and budgetary funds (EUR 31 million) improved general government balance by 0.21% of GDP relating to the budgetary plan for 2016 from October 2015. In 2016, we proceed with economic policies as they were planned: estimates of future trends in social transfers and funds for employees allow the mobilisation of certain restrictions to a
Page 24 of 31
certain extent, which must be replaced with other, long-term measures with comparable financial effects. Simultaneously, a stable investment level is being enabled throughout the entire period until the balance offset. Until the attainment of the medium-term objective (2020), we intend to limit the growth of funds for employees, social benefits and pensions so that they enable the achievement of objectives determined in the Fiscal Rule Act. Similarly, the plan for gross investments (co-financing from EU funds remains at the average level of EUR 500 million per year) is to reach the level before the crisis, where the use of refundable funds is planned for increasing investments in the private sector.
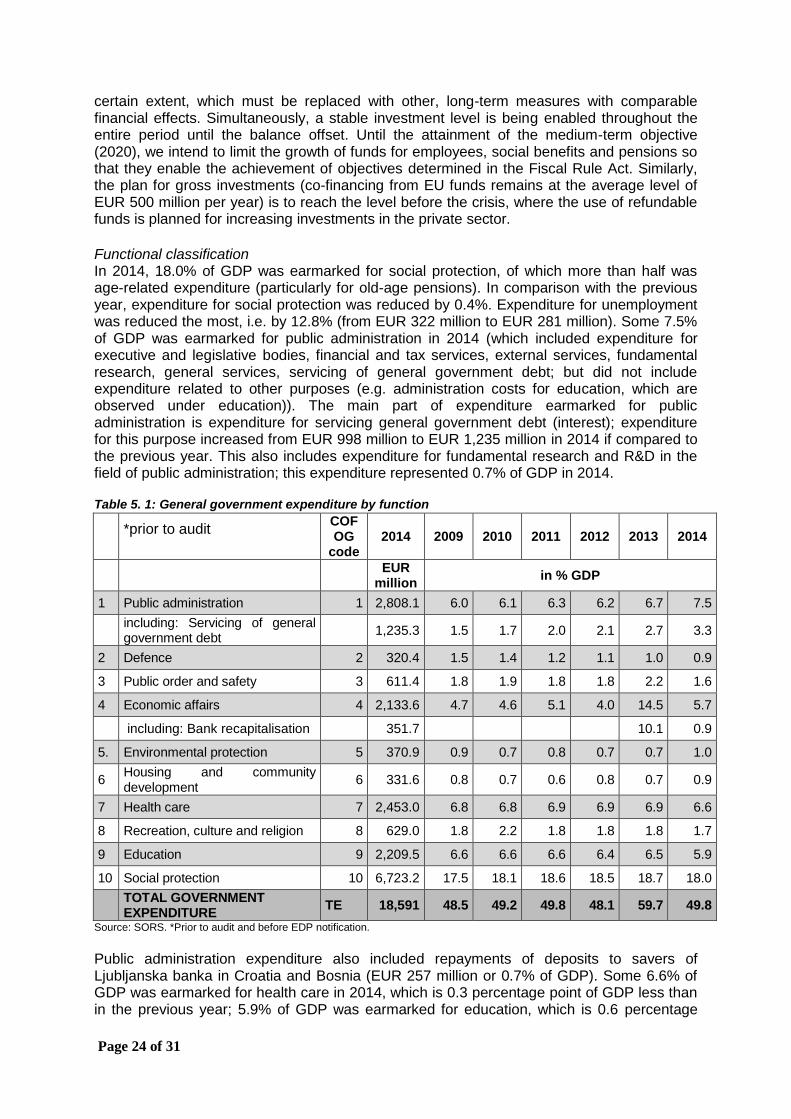
Functional classification In 2014, 18.0% of GDP was earmarked for social protection, of which more than half was age-related expenditure (particularly for old-age pensions). In comparison with the previous year, expenditure for social protection was reduced by 0.4%. Expenditure for unemployment was reduced the most, i.e. by 12.8% (from EUR 322 million to EUR 281 million). Some 7.5% of GDP was earmarked for public administration in 2014 (which included expenditure for executive and legislative bodies, financial and tax services, external services, fundamental research, general services, servicing of general government debt; but did not include expenditure related to other purposes (e.g. administration costs for education, which are observed under education)). The main part of expenditure earmarked for public administration is expenditure for servicing general government debt (interest); expenditure for this purpose increased from EUR 998 million to EUR 1,235 million in 2014 if compared to the previous year. This also includes expenditure for fundamental research and R&D in the field of public administration; this expenditure represented 0.7% of GDP in 2014. Table 5. 1: General government expenditure by function
*prior to audit
COFOG
code 2014 2009 2010 2011 2012 2013 2014
EUR
million in % GDP
1 Public administration 1 2,808.1 6.0 6.1 6.3 6.2 6.7 7.5
including: Servicing of general government debt
1,235.3 1.5 1.7 2.0 2.1 2.7 3.3
2 Defence 2 320.4 1.5 1.4 1.2 1.1 1.0 0.9
3 Public order and safety 3 611.4 1.8 1.9 1.8 1.8 2.2 1.6
4 Economic affairs 4 2,133.6 4.7 4.6 5.1 4.0 14.5 5.7
including: Bank recapitalisation 351.7 10.1 0.9
5. Environmental protection 5 370.9 0.9 0.7 0.8 0.7 0.7 1.0
6 Housing and community development
6 331.6 0.8 0.7 0.6 0.8 0.7 0.9
7 Health care 7 2,453.0 6.8 6.8 6.9 6.9 6.9 6.6
8 Recreation, culture and religion 8 629.0 1.8 2.2 1.8 1.8 1.8 1.7
9 Education 9 2,209.5 6.6 6.6 6.6 6.4 6.5 5.9
10 Social protection 10 6,723.2 17.5 18.1 18.6 18.5 18.7 18.0
TOTAL GOVERNMENT EXPENDITURE
TE 18,591 48.5 49.2 49.8 48.1 59.7 49.8
Source: SORS. *Prior to audit and before EDP notification.
Public administration expenditure also included repayments of deposits to savers of Ljubljanska banka in Croatia and Bosnia (EUR 257 million or 0.7% of GDP). Some 6.6% of GDP was earmarked for health care in 2014, which is 0.3 percentage point of GDP less than in the previous year; 5.9% of GDP was earmarked for education, which is 0.6 percentage

Page 25 of 31
point of GDP less than in 2013. This includes a section of expenditure for preschool education, expenditure for formal and informal education, supplementary services in education and other activities related to education. If compared to the previous year, expenditure for education was reduced nominally by 6.0% from EUR 2,351 million to EUR 2,209 million. Economic activities include general economic affairs, services related to employment, agriculture, production and distribution of fuels and energy, transport and other economic activities. Some 5.7% of GDP or EUR 2,134 million was intended for economic activities in 2014, of which EUR 352 million was earmarked for recapitalisation of banks (0.9% of GDP). 1.6% of GDP was intended for public order and safety (police, fire-fighters, courts, prisons); if compared to the previous year, expenditure for this field was reduced by 0.2 percentage point of GDP. 1.7% of GDP was earmarked for recreation, culture and religion; 1.0% of GDP for environmental protection; 0.9% of GDP for housing and community development and 0.9% of GDP for defence (military defence, civil protection). In comparison with the previous publication of COFOG statistics, expenditure for compensations for the erased (EUR 129 million) for 2013 is displayed under public administration and no longer under public order and safety.
5.2. General government revenue
In 2014 and 2015, total general government revenue increased nominally and significantly more than total general government expenditure, which is even more obvious if expenditure for financial crisis and other important one-off expenses in an individual year are not included. Thus the total general government deficit in which one-off expenses were not included reduced significantly in the last two years, i.e. from EUR 1,763 million or 4.9% of GDP in 2013 to EUR 1,504 million or 4.0% of GDP in 2014 and EUR 1,131 million or 2.9% of GDP in 2015. Total revenue from taxes and social contributions amounted to EUR 14,240 million or 37.0% of GDP in 2015, which is nominally by 3.6% more than in 2014 (EUR 13,750 million or 36.9% of GDP) according to the ESA methodology. Total revenue from taxes increased in 2015 if compared to 2014 according to the ESA methodology, of which revenue from taxes on income and property increased by 4.3% and revenue from taxes on production and imports by 2.5%. Revenue from social contributions increased nominally by 4.4% in the same comparison. The structure of general government revenue reveals that tax revenue represent about 85% of all general government revenue, of which social security contributions and domestic taxes on goods and services represent more than two-thirds of all tax revenue. The structure of tax revenue by cash flow in 2015 does not differ significantly from previous years and thus amounts to:
– social security contributions: EUR 5.47 billion;
– domestic taxes on goods and services: EUR 5.35 billion;
– taxes on income and profits: EUR 2.58 billion;
– total tax revenue: EUR 13.75 billion, and
– total revenue of consolidated global balance of public funding: EUR 15.71 billion. In addition to the already established measures for reducing the scope of shadow economy in the past years, the reason for higher revenue due to domestic taxes lies also in higher revenue due to tax on financial services and tax on insurance contracts, which is the result of higher tax rates of both taxes adopted in the past year. A high share of indirect taxes in the entire structure of tax revenue is the result of changes to the tax system in the past, when a positive impact on the labour supply, capital accumulation and economic growth was to be attained by rising the relative share of indirect taxes. The planned measures in the
Page 26 of 31
programming period aim at restructuring public taxes with the objective of reducing tax burden on labour. The measures are directed particularly at the segment of the most productive labour, which could result in substantial savings in the business sector and also stimulate higher employment rate. A change in the structure of public taxes towards less distortion taxation could thus contribute to better macroeconomic conditions. With the adopted and planned measures in the programming period, a somewhat higher economic growth may be expected, which could enhance potential growth and closing of the output gap. Additional general government revenue could also be expected. A predictable, efficient and as neutral as possible tax system is the basis for a stable business environment on one hand and for healthy public finances on the other hand. Finally, improved transparency, simplicity and understandability result in savings of monetary and non-monetary costs of taxable persons and tax authorities. The policy of general government revenue also pursues increase in the efficiency of recovery of outstanding liabilities by all public purses, whereby it is necessary that further operating of business entities is not endangered. This objective will also be attained through enhanced transparency and effectiveness of inspection supervision.
6. INSTITUTIONAL ENVIRONMENT
6.1. Coordination of structural reforms In Slovenia, the Ministry of Finance is authorised for conducting the tasks of a coordinator of the European Semester and the cooperation between the Republic of Slovenia and the newly established European Commission’s Structural Reform Support Service. The Ministry also coordinates the tasks related to the implementation of the programme of the European Commission’s Structural Reform Support Programme for the period 2017–2020. Substantive fields of the programme encompass a broad selection of contents and fields enabling countries to apply for technical assistance, whereby broader measures for enhancing productivity are of key importance, which stimulate potential long-term growth. On the basis of proposals provided by ministries and governmental services, the Government selected eight projects, which were assessed as suitable from the viewpoint of providing harmonisation with national priorities (the National Reform Programme, the Stability Programme, the strategies important from the aspect of development and thematic or general ex-ante conditionalities and priority government projects on the basis of the Government’s decision) and submitted them to the EC for further consideration.
– Conceptual design of the project for establishing an investment unit in Slovenia; holder: Government Office for Development and European Cohesion Policy; possible commencement: first half of 2016.
– Salary system in public administration based on results; holder: Ministry of Public Administration; possible commencement: first half of 2016.
– Implementation of a health reform; holder: Ministry of Health; possible commencement of the activity: May 2016.
– Optimisation of the network of courts; holder: Ministry of Justice; possible commencement: second half of 2016.
– Reports on the efficiency of the use of public expenditure on selected fields; holder: Ministry of Finance; possible commencement: second half of 2016.
– Long-term care and substantive and technical support during the establishment of a systematic monitoring of home care; holder: Ministry of Labour, Family and Social Affairs; possible commencement: November 2016.

Page 27 of 31
– Shift towards a low-carbon society; holder: Ministry of Infrastructure; possible commencement: 2016.
6.2. Review of expenditure in health care, education and social protection
In 2015, Slovenia reviewed expenditure in three key fields of public expenditure: health care, social care and education. Concrete effects of selected identified measures are expected in 2017 and later in compliance with social partners.
- A comprehensive review of the health system, which included the review of expenditure,
sources of finance, calculation models in the health system and optimisation of health care, was prepared and presented in January 2016.
- The review of expenditure including a selection of possible solutions with financial results in the period 2017–2020 in the field of social protection and pension protection was adopted in April 2016 with proposals of possible measures on the basis of which measures that are to be actually implemented will be selected.
- The review of general government expenditure in the field of education was undergoing final drafting and harmonisation of proposed measures at the level of the working group in April 2016.
6.3. Public Finance Act
The following new or amended contents are harmonised in the proposed act:
– medium-term planning of fiscal policy;
– public finance budgets (budgets of the state, municipalities, the Disability Insurance Institute of the Republic of Slovenia and the Health Insurance Institute of Slovenia), which will be entered in the register of public finance budgets and budget users;
– municipalities no longer have direct budget users (municipal administration, mayor and joint municipal administration are the holders of tasks of municipalities presented as cost centres);
– emphasis is on the programme preparation of the budget;
– elimination of managed assets and a new method of financing indirect budget users;
– auditor’s correction;
– new method of organising the internal audit, and
– transitional periods for the enforcement or application will be proposed for certain proposals.
The chapter on the medium-term planning of fiscal policy determines the preparation of a medium-term fiscal framework in a way which observes:
– the national development policy programme adopted by the Government on 30 November of the current year for the next four years and which is based on the Slovenia's Development Strategy;
– institutional units of the general government sector, which submit to the ministry responsible for finance forecasts of basic economic categories of revenue and expenditure according to the programme classification at the level of a sub-programme for the next four years no later than by 15 February of the current year, and
– proposal of the framework for preparation of budgets for at least the next three years, which the Government submits to the National Assembly for adoption by 30 March of the current year.
On the basis of the medium-term fiscal framework, the state budget will also be prepared.

Page 28 of 31
If corrective measures must be implemented as per the ZFisP, the ZJF enables the minister responsible for finance to temporary withhold the implementation of the state budget on the first day of the next month by no more than 45 days in a way to
permit the assumption of liabilities only on the basis of a prior consent of the minister responsible for finance, and
stop the rearrangement of rights to use. If the observance of the principle of medium-term balance is not ensured in due time with the set measures, the Government prolongs the measures on the basis of the ZJF and submits to the National Assembly the proposal of amendment to the framework and proposal of the programme of measures, which will re-ensure the observance of the medium-term balance. The implementation of measures continues until the adoption of the amendment to the framework and measures, which will re-ensure the observance of the medium-term balance.
The budget memorandum is important in the proposal, which the Government is to adopt at the proposal of the minister responsible for finance by 15 May of the current year and which includes the proposal of general government expenditure according to the economic and programme classifications of policy levels with explanations for at least the next two years, whereby the scope of all non-refundable funds, with the exception of labour costs, current transfers to individuals, and costs of interests and principals of repaid loans in the current year, must not exceed the scope of refundable funds.
The proposed act also determines a mandatory preparation of biennial budgets and financial plans by direct and indirect budget users. The provisions on amendments and the revised budget are also defined in more detail than in the current act. If the budget or a financial plan is not adopted before the implementation year, the rule of temporary implementation is preserved according to which the funds are limited to 90% of the previous year’s expenditure (it must be taken into consideration that some projects were completed while the execution of new ones cannot commence due to temporary implementation).

Page 29 of 31
ANNEX: Additional tables compliant with the rules of the Stability and Growth Pact
Table 1P: Price developments
Rate of change in % 2014 2015 2016 2017 2018 2019
1 GDP deflator 0.8 0.4 1.0 0.2 0.8 1.5
2 Private consumption deflator 0.0 -1.1 -0.6 1.0 1.0 1.4
3 Consumer price index (annual
average) 0.2 -0.5 -0.3 1.3 1.3 1.7
4 Government consumption deflator 0.1 -0.3 3.1 1.9 1.4 1.6
5. Gross fixed capital formation deflator 0.4 1.4 1.4 2.0 2.0 2.0
6 Export price deflator (goods and
services) -0.1 -0.1 -0.7 0.3 0.5 1.5
7 Import price deflator (goods and
services) -1.1 -1.3 -1.5 1.9 1.2 1.5
Source: SORS, Spring Forecast 2016, IMAD.
Table 2P: Sectoral balances
in % GDP ESA
code 2015 2016 2017 2018 2019
Net lending/borrowing B.9 2.9 2.2 1.6 1.0 0.4
of which:
Import and export balance of goods and services 9.4 10.4 9.3 9.0 9.2
Balance of primary incomes and current transfers N/A N/A N/A N/A N/A
Capital account N/A N/A N/A N/A N/A
Net lending/borrowing of the private sector B.9/EDP
B.9 N/A N/A N/A N/A N/A
Net lending/borrowing of the general government B.9 2.9 2.2 1.6 1.0 0.4
Statistical discrepancy N/A N/A N/A N/A N/A Source: SORS, Ministry of Finance, Spring Forecast 2016, IMAD.
Table 3P: Key macroeconomic indicators for the period until 2021
Spring forecast
2015–2018 2019-2021
Gross domestic product, real growth in % 2.1 2.3
Exports of goods and services 4.4 4.6
Imports of goods and services 4.4 4.7
Private consumption 1.9 1.4
Government consumption 0.4 0.1
Gross fixed capital formation 2.7 5.0
Employment (SNA), growth in % 0.8 0.4
Registered unemployment rate (in %) 11.0 9.0
Survey-based unemployment rate (in %) 8.1 6.5
Average number of registered unemployed in thousands 101.0 82.9
Inflation, annual average 0.8 1.8
Source: Projections of Spring Forecast 2016, IMAD, March 2016.

Page 30 of 31
Table 4P: Consolidated general government balance
ESA
CODE Level 2015
2015 2016 2017 2018 2019
million EUR
% GDP % GDP % GDP % GDP % GDP
GENERAL GOVERNMENT SURPLUS (+)/DEFICIT (-) BY SUBSECTORS (B.9)
1 General government units S.13 -1,131.2 -2.9 -2.2 -1.6 -1.0 -0.4
2 Central government units S.1311 -1,273.1 -3.3 -2.2 -1.6 -1.1 -0.5
3 Regional government units S.1312 … … … … … …
4 Local government units S.1313 96.6 0.3 0.0 0.0 0.0 0.0
5. Social security funds S.1314 45.3 0.1 -0.1 0.0 0.0 0.0
TOTAL GENERAL GOVERNMENT SECTOR (S.13)
6 Total general government revenue
TR 17,384.3 45.1 43.5 43.8 43.2 42.3
7 Total general government expenditure
TE 18,515.5 48.0 45.7 45.4 44.3 42.7
8 Net lending/borrowing EDP B.9 -1,131.2 -2.9 -2.2 -1.6 -1.0 -0.4
9 Interest expenditure EDP D.41
1,145.1 3.0 2.9 2.6 2.5 2.4
10 Primary balance 13.9 0.0 0.7 1.0 1.5 2.0
SELECTED COMPONENTS OF REVENUE
12 Total taxes (12a + 12b + 12c) 8,538.6 22.2 22.2 22.1 21.9 21.8
12a Taxes on production and imports
D.2 5,721.2 14.8 14.9 14.8 14.6 14.6
12b Current taxes on income and wealth
D.5 2,807.9 7.3 7.3 7.3 7.3 7.2
12c Capital taxes D.91 9.6 0.0 0.0 0.0 0.0 0.0
13 Social security contributions D.61 5,701.5 14.8 14.9 15.0 14.9 14.7
14 Property income D.4 432.8 1.1 0.7 0.8 0.7 0.6
15 Other revenue 2,711.4 7.0 5.6 5.9 5.8 5.2
16.=6. Total revenue TR 17,384.3 45.1 43.5 43.8 43.2 42.3
Tax burden (D.2+D.5+D.61+D.91–D.995)
14,240.1 36.9 37.2 37.1 36.8 36.5
SELECTED COMPONENTS OF EXPENDITURE
17 Compensation of employees and intermediate consumption
D.1+P.2 6,792.9 17.6 17.9 17.8 17.4 16.8
17a Compensation of employees D.1 4,268.8 11.1 11.3 11.3 11.0 10.6
17b Intermediate consumption P.2 2,524.1 6.5 6.6 6.5 6.4 6.3
18 Social payments 6,940.8 18.0 17.7 17.5 17.3 16.8
18a Social transfers in kind
D.6311, D.63121
, D.63131
747.8 1.9 1.9 1.9 1.9 1.9
18b Social benefits and cash aid D.62 6,193.0 16.1 15.8 15.6 15.3 14.9
19.=9. Interest expenditure D.41 1,145.1 3.0 2.9 2.6 2.5 2.4
20 Subsidies D.3 308.6 0.8 1.1 1.2 1.0 1.0
21 Gross fixed capital formation P.51 1,972.3 5.1 3.3 3.4 3.4 3.2
22 Other expenditure 1,355.9 3.5 2.8 2.8 2.7 2.5
23.=7. TOTAL EXPENDITURE TE 18,515.5 48.0 45.7 45.4 44.3 42.7
Source: Ministry of Finance.

Page 31 of 31
Table 5P: No policy change projections
ESA
code 2015 2016 2017 2018 2019
in % GDP
1 Total revenue at unchanged policies TR 45.1 43.5 43.8 43.2 42.0
a Taxes on production and imports D.2 14.8 14.9 14.8 14.6 14.3
2 Total expenditure at unchanged policies TE 48.0 45.8 45.7 45.0 43.9
a Compensation of employees and intermediate consumption D.1+P.2 17.6 17.9 17.8 17.5 17.2
b Social benefits D.62+D.6
31 18.0 17.7 17.7 17.7 17.5
3 Net lending/borrowing B.9 -2.9 -2.4 -1.9 -1.7 -1.9
Source: Ministry of Finance. Table 6P: Expenditure benchmark
2015 2016 2017 2018 2019
million
EUR % GDP
1 Expenditure fully related to EU budget revenue* 1,087 1.92 2.08 2.27 2.72
a of which: investments fully related to EU budget revenue 738 0.46 0.56 0.58 0.41
2 Cyclical unemployment benefit expenditure 25 0.01 0.01 0.00 0.00
3 Effect of discretionary revenue measures 123 0.19 0.0 0.0 0.0
4 Revenue increases mandated by law N/A N/A N/A N/A N/A
Source: Ministry of Finance.