Embed Size (px)
Citation preview
1
EUROPEAN COMMISSION DIRECTORATE GENERAL
ECONOMIC AND FINANCIAL AFFAIRS
Brussels, 23 May 2018
Assessment of the 2018 Stability Programme for
Cyprus
(Note prepared by DG ECFIN staff)
2
CONTENTS
1. INTRODUCTION ....................................................................................................... 3
2. MACROECONOMIC DEVELOPMENTS ................................................................ 3
3. RECENT AND PLANNED BUDGETARY DEVELOPMENTS.............................. 5
3.1. DEFICIT DEVELOPMENTS IN 2017 AND 2018 .................................................... 5
3.2. MEDIUM-TERM STRATEGY AND TARGETS ..................................................... 7
3.3. MEASURES UNDERPINNING THE PROGRAMME ............................................. 9
3.4. DEBT DEVELOPMENTS ........................................................................................ 10
3.5. RISK ASSESSMENT ............................................................................................... 12
4. COMPLIANCE WITH THE PROVISIONS OF THE STABILITY AND
GROWTH PACT ...................................................................................................... 13
4.1. Compliance with the debt criterion ................................................................. 13
4.2. Compliance with the MTO .............................................................................. 14
5. FISCAL SUSTAINABILITY ................................................................................... 17
6. FISCAL FRAMEWORK .......................................................................................... 19
7. SUMMARY .............................................................................................................. 19
8. ANNEX ..................................................................................................................... 21
3
1. INTRODUCTION
On 30 April 2018, Cyprus submitted its 2018 Stability Programme (hereafter called Stability
Programme), covering the period 2018-2021. The Council of Ministers approved the Stability
Programme on 24 April 2017.
Cyprus is currently subject to the preventive arm of the the Stability and Growth Pact (SGP)
and should preserve a sound fiscal position which ensures compliance with the Medium-Term
Budgetary Objective (MTO). As the debt ratio was 107.5% of GDP in 2015 (the year in
which Cyprus corrected its excessive deficit), exceeding the 60% of GDP reference value,
Cyprus is also subject to the transitional arrangements as regards compliance with the debt
reduction benchmark during the three years following the correction of the excessive deficit
(transitional debt rule). In this period it should ensure sufficient progress towards compliance
with the debt reduction benchmark. After the transition period, as of 2019, Cyprus is expected
to comply with the debt reduction benchmark.
This document complements the Country Report published on 7 March 2018 and updates it
with the information included in the Stability Programme. Section 2 presents the
macroeconomic outlook underlying the Stability Programme and provides an assessment
based on the Commission 2018 spring forecast. The following section presents the recent and
planned budgetary developments, according to the Stability Programme. In particular, it
includes an overview on the medium term budgetary plans, an assessment of the measures
underpinning the Stability Programme and a risk analysis of the budgetary plans based on the
Commission forecast. Section 4 assesses compliance with the rules of the SGP, including on
the basis of the Commission 2018 spring forecast. Section 5 provides an overview on long-
term sustainability risks and Section 6 on recent developments and plans regarding the fiscal
framework. Section 7 provides a summary.
2. MACROECONOMIC DEVELOPMENTS
The economy of Cyprus expanded markedly by 3.9% in real terms in 2017. The
macroeconomic scenario underlying the Stability Programme projects a nearly equally strong
growth in 2018, at 3.8%, before easing somewhat in 2019, to 3.6%. In 2020-2021, growth is
expected to continue gradually slowing down, but still to record a very solid 3.2% and 3.0%,
respectively. Domestic demand is expected to be the main driver for growth, with gross fixed
capital formation playing a key role and expanding between 7 and 16% per year during the
programme horizon, while private consumption is expected to be strong but grow at a slower
pace than the real GDP. Net exports are expected to continue having a negative impact on
growth, albeit this impact is set to diminish rapidly despite domestic-demand driven growth,
from -4.5% in 2017 to -0.3% in 2021.
Compared to the 2018 Draft Budgetary Plan, real GDP growth for 2017 in the stability
programme is revised by 0.3 percentage point upwards. There is an even larger revision for
2018, which is currently forecast at 3.8% compared to the 3.0% projected in the Draft
Budgetary Plan. This is particularly driven by large revisions in gross fixed capital formation,
private consumption and imports.
The 2018 and 2019 projections underlying the Stability Programme are slightly more
optimistic (by 0.2 and 0.3 percentage points, respectively) than the Commission 2018 spring
forecast. The composition of growth in 2018 has a broadly similar pattern, with somewhat
weaker growth of domestic demand components and less negative contribution of net exports
in the Commission forecast. For 2019, the Commission 2018 spring forecast and the Stability
4
Programme projections identify the same main drivers of growth. However, the Commission
projects lower GDP growth due to a slightly weaker domestic demand and a somewhat more
negative contribution of net exports than in the Stability Programme. The unemployment rate
in the Stability Programme is projected to fall at a slower pace than in the Commission 2018
spring forecast. The unemployment outlook for 2018 in the Stability Programme, at 9.5%, can
be considered conservative, given that the unemployment rate in February 2018 has already
fallen to 9.6%.
Inflation in Cyprus has been very subdued and is expected to remain so. In 2017, HICP
recorded 0.7% inflation, after several years of deflation. The Stability Programme projects
even lower inflation in 2018, at 0.5% and a gradual increase to 2% at the end of the
programme horizon. This is somewhat lower (by 0.2 percentage point for both 2018 and
2019) than the Commission 2018 spring forecast.
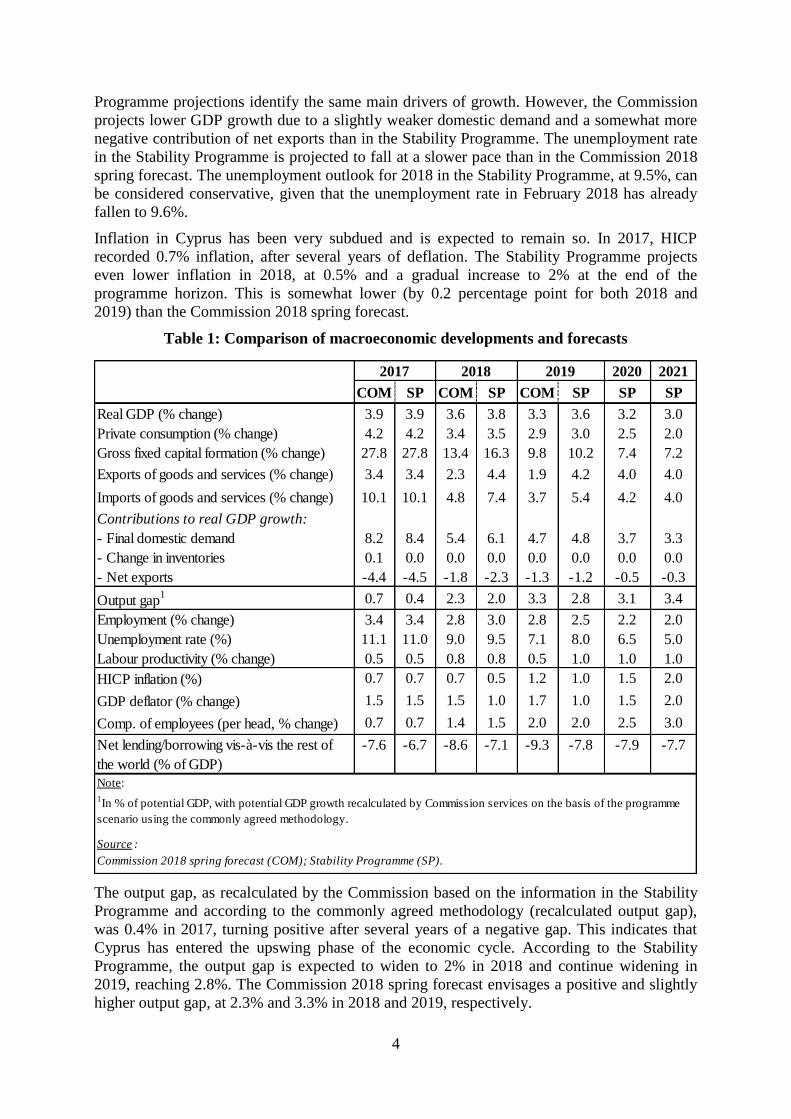
Table 1: Comparison of macroeconomic developments and forecasts
The output gap, as recalculated by the Commission based on the information in the Stability
Programme and according to the commonly agreed methodology (recalculated output gap),
was 0.4% in 2017, turning positive after several years of a negative gap. This indicates that
Cyprus has entered the upswing phase of the economic cycle. According to the Stability
Programme, the output gap is expected to widen to 2% in 2018 and continue widening in
2019, reaching 2.8%. The Commission 2018 spring forecast envisages a positive and slightly
higher output gap, at 2.3% and 3.3% in 2018 and 2019, respectively.
2020 2021
COM SP COM SP COM SP SP SP
Real GDP (% change) 3.9 3.9 3.6 3.8 3.3 3.6 3.2 3.0
Private consumption (% change) 4.2 4.2 3.4 3.5 2.9 3.0 2.5 2.0
Gross fixed capital formation (% change) 27.8 27.8 13.4 16.3 9.8 10.2 7.4 7.2
Exports of goods and services (% change) 3.4 3.4 2.3 4.4 1.9 4.2 4.0 4.0
Imports of goods and services (% change) 10.1 10.1 4.8 7.4 3.7 5.4 4.2 4.0
Contributions to real GDP growth:
- Final domestic demand 8.2 8.4 5.4 6.1 4.7 4.8 3.7 3.3
- Change in inventories 0.1 0.0 0.0 0.0 0.0 0.0 0.0 0.0
- Net exports -4.4 -4.5 -1.8 -2.3 -1.3 -1.2 -0.5 -0.3
Output gap1 0.7 0.4 2.3 2.0 3.3 2.8 3.1 3.4
Employment (% change) 3.4 3.4 2.8 3.0 2.8 2.5 2.2 2.0
Unemployment rate (%) 11.1 11.0 9.0 9.5 7.1 8.0 6.5 5.0
Labour productivity (% change) 0.5 0.5 0.8 0.8 0.5 1.0 1.0 1.0
HICP inflation (%) 0.7 0.7 0.7 0.5 1.2 1.0 1.5 2.0
GDP deflator (% change) 1.5 1.5 1.5 1.0 1.7 1.0 1.5 2.0
Comp. of employees (per head, % change) 0.7 0.7 1.4 1.5 2.0 2.0 2.5 3.0
Net lending/borrowing vis-à-vis the rest of
the world (% of GDP)
-7.6 -6.7 -8.6 -7.1 -9.3 -7.8 -7.9 -7.7
1In % of potential GDP, with potential GDP growth recalculated by Commission services on the basis of the programme
scenario using the commonly agreed methodology.
Source :
Commission 2018 spring forecast (COM); Stability Programme (SP).
Note:
2017 2018 2019
5
Overall, the Stability Programme presents plausible macroeconomic assumptions until 2019,
with a somewhat more favourable macroeconomic outlook than the Commission 2018 spring
forecast for both 2018 and 2019. The risks associated with the macroeconomic assumptions
presented in the Stability Programme are tilted to the downside. The main downside risks to
the projections are linked to the developments in the banking sector, namely the still very high
share of non-performing loans. On the external side, risks remain contained and relate to the
economic outlook of the UK, one of the key trading partners of Cyprus; and a potential
deterioration in the external environment, including uncertainties on the policy stance of the
US and the relationship between the EU and Russia.
3. RECENT AND PLANNED BUDGETARY DEVELOPMENTS
3.1. DEFICIT DEVELOPMENTS IN 2017 AND 2018
In 2017, based on notified data1, the general government headline balance reached a surplus
of 1.8% of GDP (up from 0.3% in 2016), one of the highest in the EU and well above the
estimates of the 2018 Draft Budgetary Plan, which projected a surplus of 1.0% of GDP. The
2017 outperformance is explained by a better-than-expected economic growth in 2017,
including the buoyant tax intake, and favourable labour market developments. Compared to
2016, total revenue soared by 8.2% in 2017, amounting to 39.9% of GDP and pointing at
significant revenue windfalls. Tax revenue turned out stronger than expected in 2017, surging
by 8.5% compared to the year before. This was mainly the result of the sizable increase in tax
revenue on production and imports (by 11.0%), due to the surge in VAT receipts (by 15.9%).
In addition, tax revenue on income and wealth rose markedly (by 4.6%), mainly due to the
strong performance of corporate tax receipts (by 10.3%) and despite the negative impact of
the abolition of the immovable property tax and the termination of the temporary tax on
private sector emoluments in 2017. Furthermore, revenue from social security contributions
increased strongly (by 10.5%), as well as other non-tax revenue (by 3.8%). Total expenditure
increased by 4.3% compared to 2016, but declined as a percentage of GDP to 38.1%. The rise
in expenditure is mainly attributed to increases in compensation of employees (by 4.0%),
including the hiring of additional personnel for security forces and the abolition of the
temporary contribution on emoluments of public sector employees; intermediate consumption
(by 11.9%), partly due to higher energy-related spending and expenditures for
pharmaceuticals and desalinated water; social payments (by 2.1%), namely due to increased
payments for old age pensions; interest expenditure (by 1.2%); gross fixed capital formation
(by 12.3%), and other expenditure (by 13.6%). According to the Stability Programme,
Cyprus' (recalculated) structural balance2 is estimated to have improved (by 0.3 percentage
point of GDP) in 2017, due to the improvement in the headline balance as well as the
improving cyclical condition. The output gap is estimated to increase to 0.4% of GDP in
2017, up from -1.1% of GDP in 2016.
1 Based on data reported to Eurostat in spring 2018, see April 2018 EDP notification. Discussions between
Eurostat and the Statistical Service of Cyprus (Cystat) are ongoing regarding the recording of interest
expenditure and intermediate consumption. Possible future changes to the recording of those expenditure items
would not have an impact on the general government balance, but they would affect the primary balance and
interest expenditure. 2 Cyclically-adjusted balance net of one-off and temporary measures, recalculated by the Commission on the
basis of the information provided in the Stability Programme according to the commonly agreed methodology.
6
For 2018, the Stability Programme presents a general government headline surplus target of
1.7% of GDP, above the target in the 2018 Draft Budgetary Plan (by 0.7 percentage point of
GDP). The revised target mostly results from the carry-over from 2017, the upward revision
of the macroeconomic outlook and a further improvement in the labour market. The revenue-
to-GDP ratio presented in the Stability Programme appears conservative and is projected to
decrease to 39.1% in 2018, a decrease by 0.8 percentage point compared to the previous year.
This is notably due to the projected significant decrease in the non-tax revenue item (by 0.6
percentage point of GDP for other revenue) and, to a lesser extent, the projected drop in
current taxes on income and wealth (by 0.2 percentage point of GDP) and taxes on production
and imports (by 0.1 percentage point of GDP). Total tax revenue is expected to increase by
3.7% compared to 2017, somewhat below nominal GDP (of 4.8%). In turn, the expenditure-
to-GDP ratio is projected to decline by some 0.7 percentage point to 37.4%, although it is
projected to increase in nominal terms by 3.3% in 2018, compared to a rise of 4.3% in 2017.
The decrease of expenditure as a proportion of GDP mostly results from projected
expenditure declines in compensation of employees (by 0.2 percentage point of GDP), social
payments (by 0.3 percentage point of GDP), gross fixed capital formation (by 0.2 percentage
point of GDP) and other expenditure (by 0.3 percentage point of GDP). The changes
projected on intermediate consumption and interest expenditure are partly explained by the
fact that the authorities' projections in the Stability Programme are not based on 2017 notified
data3. According to the Stability Programme, the (recalculated) structural balance is estimated
at around 0.6% of GDP in 2018, partly explained by the increase of the positive output gap.
The Commission 2018 spring forecast projects the general government headline balance for
2018 at 2.0% of GDP, compared to a projection of 1.7% of GDP in the Stability Programme.
The difference vis-à-vis the programme's target stems from the macroeconomic assumptions
based on a higher nominal GDP projection, more dynamic revenue based on track-record
(4.3% y-o-y as against 3.0% in the Stability Programme, and compared to 8.2% in 2017) and
more conservative assumptions on expenditure. More specifically, the Stability Programme
presents, on the revenue side, a lower forecast for non-tax revenue item (i.e. other revenue, by
0.4 percentage point of GDP) and, to a lesser extent, for taxes on production an imports and
current taxes on income and wealth (by 0.1 percentage point of GDP, respectively). On the
expenditure side, the differences mainly concern a lower forecast for gross fixed capital
formation (by 0.3 percentage point of GDP), other expenditure (by 0.3 percentage point of
GDP) and compensation of employees (by 0.1 percentage point of GDP). As mentioned
above, the differences on intermediate consumption and interest expenditure are partly due to
the use of non-notified data for 2017 in the Stability Programme. Finally, according to the
Commission 2018 spring forecast, the structural surplus is expected to narrow by 0.6
percentage point of GDP in 2018 compared to the year before, although remaining well above
the MTO.
3 Expenditure on intermediate consumption is projected to increase (by 0.5 percentage point of GDP), while
interest expenditure is set to decrease (by 0.4 percentage point of GDP) in 2018. For further information on the
2017 notified data, see footnote 1.
7
3.2. MEDIUM-TERM STRATEGY AND TARGETS
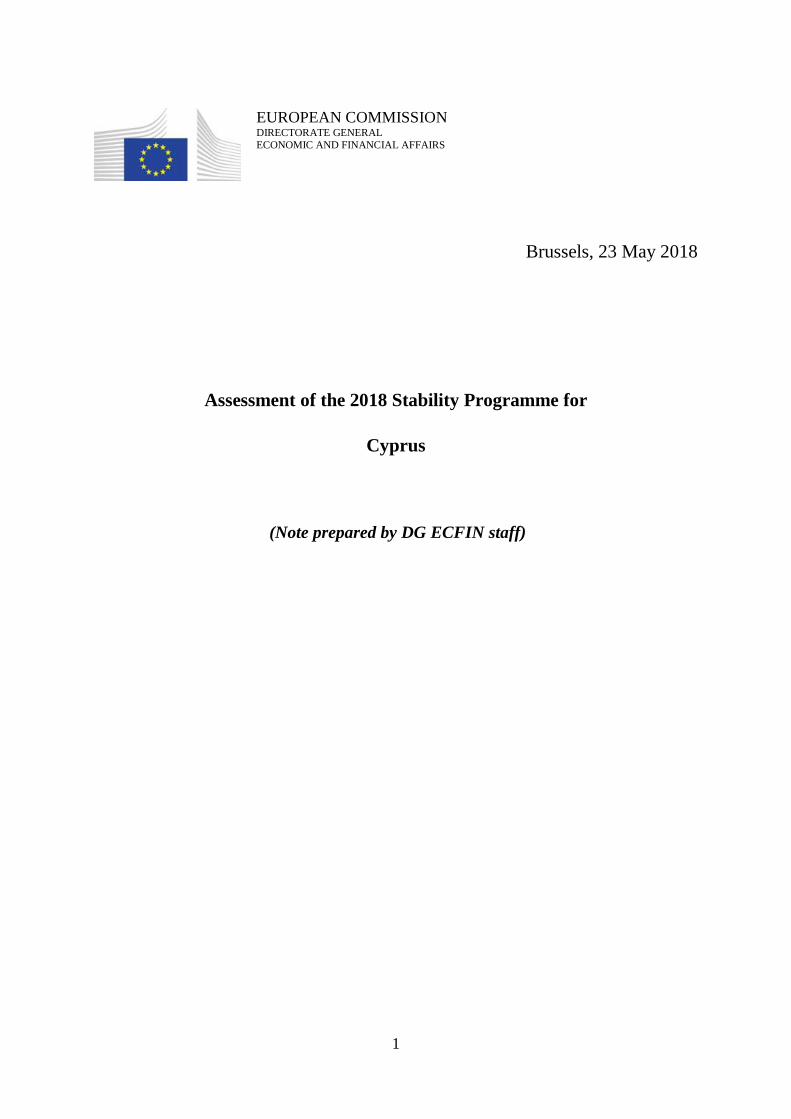
In the 2018 Stability Programme the general government balance is projected to remain in
surplus and broadly constant at 1.7% of GDP in 2018 and to steadily increase over the
programme period, reaching a surplus of 1.9% of GDP in 2021. The structural balance is
estimated to reach 0.4% of GDP in 2018 and to remain above Cyprus' MTO of 0% of GDP
over the programme horizon. The Stability Programme states that the MTO remains
unchanged and targets a balanced structural position, more stringent4 than required by the
Pact.
On the basis of the information in the Stability Programme, the recalculated structural balance
is estimated at 0.6% of GDP in 2018, after 1.4% of GDP in 2017, and set to narrow further
over the programme horizon, but to remain above the MTO throughout.
Compared to the 2018 Draft Budgetary Plan, the headline surplus for 2018 reported in the
Stability Programme is higher by 0.4 percentage point of GDP, reflecting the higher-than-
expected fiscal outturn for 2017 and a better economic environment. However, as a
percentage of GDP, the Stability Programme points to a decline of the headline balance in
2018 (by 0.1 percentage point of GDP) compared to the previous year, unlike the 2018 Draft
Budgetary Plan that projected an increase (by 0.3 percentage point of GDP).
The Stability Programme targets the general government surplus to remain constant in 2019
and to slightly increase to below 2% of GDP over the programme period. The revenue-to-
GDP ratio is set to decline to 38.9% of GDP in 2019, averaging at 38.3% of GDP over the
2019-2021 period, and where the Stability Programme estimates appear conservative. Tax
revenue is projected to increase annually by 3.9% on average over the same period. As
reported in the Stability Programme, corporate tax receipts are planned to continue to account
on average for about 17.9% of total tax revenue. More specifically for 2019, the projected
decrease in revenue as a proportion of GDP is mainly due to a significant drop in the non-tax
revenue item (by 0.5 percentage point of GDP for other revenue), for which no detailed
explanations are provided in the Stability Programme, that offsets the marked increase in
social contributions (by 0.5 percentage point of GDP). The expenditure-to-GDP ratio is
projected to decrease to 37.2% of GDP in 2019 and gradually to 35.7% of GDP by 2021.
Total expenditure is set to grow below nominal GDP growth. For 2019, the projected decline
in expenditure as a proportion of GDP mainly stems from a drop in compensation of
employees (by 0.2 percentage point of GDP), assuming that the increase in nominal terms
remains stable over the programme horizon at about 2.8% per year and below the nominal
GDP growth, and social payments (by 0.2 percentage point of GDP), which offset the increase
in other expenditure (by 0.3 percentage point of GDP).
The Commission 2018 spring forecast, under the usual no-policy-change assumption, projects
a headline surplus of 2.2% of GDP in 2019, 0.5 percentage point above the authorities'
projections. Compared with the Stability Programme, the Commission projections reflect a
somewhat different macroeconomic outlook in terms of a higher nominal GDP projection,
more dynamic revenue given the track-record (by 0.7 percentage point of GDP against the
Stability Programme) and more conservative assumptions on expenditure by extrapolating
trends with past policy orientations (by 0.1 percentage point of GDP compared to the Stability
Programme). In particular, the Stability Programme presents, on the revenue side, a
4 The MTO selected by the Member State is more ambitious than the minimum MTO by more than ½ percentage
point. The minimum MTOs are country-specific and calculated based on an agreed methodology.
8
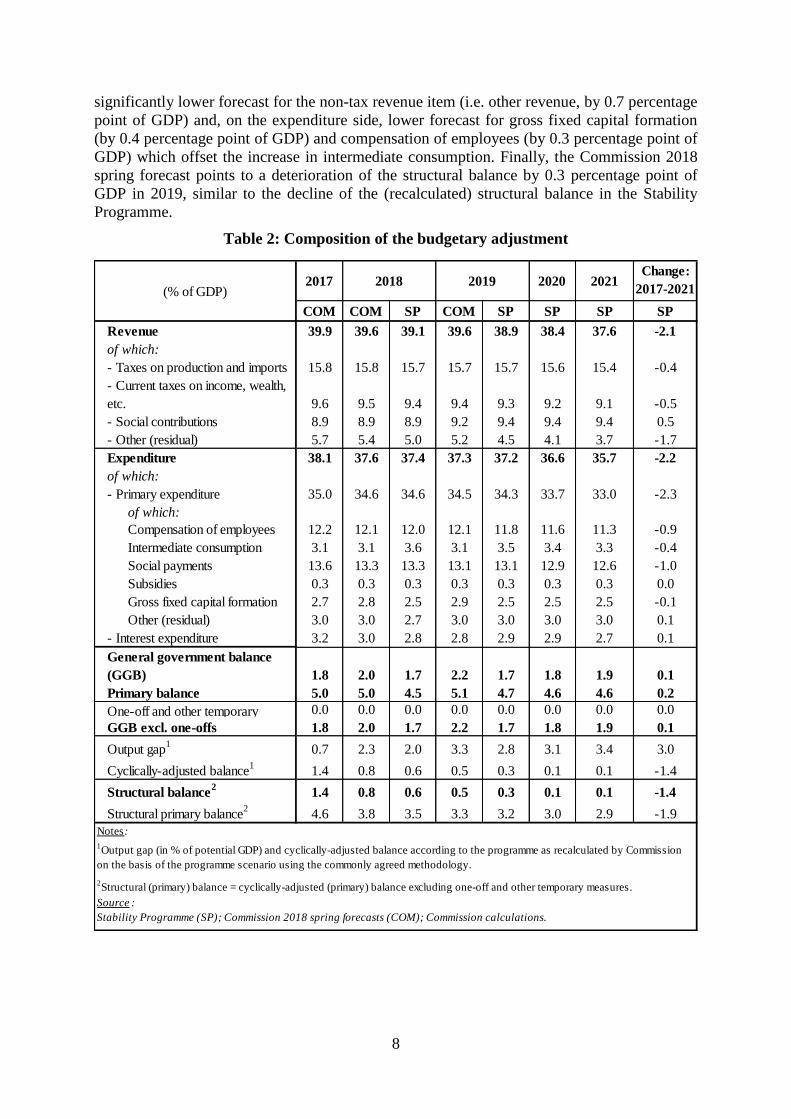
significantly lower forecast for the non-tax revenue item (i.e. other revenue, by 0.7 percentage
point of GDP) and, on the expenditure side, lower forecast for gross fixed capital formation
(by 0.4 percentage point of GDP) and compensation of employees (by 0.3 percentage point of
GDP) which offset the increase in intermediate consumption. Finally, the Commission 2018
spring forecast points to a deterioration of the structural balance by 0.3 percentage point of
GDP in 2019, similar to the decline of the (recalculated) structural balance in the Stability
Programme.
Table 2: Composition of the budgetary adjustment
2017 2020 2021Change:
2017-2021
COM COM SP COM SP SP SP SP
Revenue 39.9 39.6 39.1 39.6 38.9 38.4 37.6 -2.1
of which:
- Taxes on production and imports 15.8 15.8 15.7 15.7 15.7 15.6 15.4 -0.4
- Current taxes on income, wealth,
etc. 9.6 9.5 9.4 9.4 9.3 9.2 9.1 -0.5
- Social contributions 8.9 8.9 8.9 9.2 9.4 9.4 9.4 0.5
- Other (residual) 5.7 5.4 5.0 5.2 4.5 4.1 3.7 -1.7
Expenditure 38.1 37.6 37.4 37.3 37.2 36.6 35.7 -2.2
of which:
- Primary expenditure 35.0 34.6 34.6 34.5 34.3 33.7 33.0 -2.3
of which:
Compensation of employees 12.2 12.1 12.0 12.1 11.8 11.6 11.3 -0.9
Intermediate consumption 3.1 3.1 3.6 3.1 3.5 3.4 3.3 -0.4
Social payments 13.6 13.3 13.3 13.1 13.1 12.9 12.6 -1.0
Subsidies 0.3 0.3 0.3 0.3 0.3 0.3 0.3 0.0
Gross fixed capital formation 2.7 2.8 2.5 2.9 2.5 2.5 2.5 -0.1
Other (residual) 3.0 3.0 2.7 3.0 3.0 3.0 3.0 0.1
- Interest expenditure 3.2 3.0 2.8 2.8 2.9 2.9 2.7 0.1
General government balance
(GGB) 1.8 2.0 1.7 2.2 1.7 1.8 1.9 0.1
Primary balance 5.0 5.0 4.5 5.1 4.7 4.6 4.6 0.2
One-off and other temporary 0.0 0.0 0.0 0.0 0.0 0.0 0.0 0.0
GGB excl. one-offs 1.8 2.0 1.7 2.2 1.7 1.8 1.9 0.1
Output gap1
0.7 2.3 2.0 3.3 2.8 3.1 3.4 3.0
Cyclically-adjusted balance1
1.4 0.8 0.6 0.5 0.3 0.1 0.1 -1.4
Structural balance2
1.4 0.8 0.6 0.5 0.3 0.1 0.1 -1.4
Structural primary balance2
4.6 3.8 3.5 3.3 3.2 3.0 2.9 -1.9
Notes:
(% of GDP)2018 2019
Stability Programme (SP); Commission 2018 spring forecasts (COM); Commission calculations.
Source :
2Structural (primary) balance = cyclically-adjusted (primary) balance excluding one-off and other temporary measures.
1Output gap (in % of potential GDP) and cyclically-adjusted balance according to the programme as recalculated by Commission
on the basis of the programme scenario using the commonly agreed methodology.
9
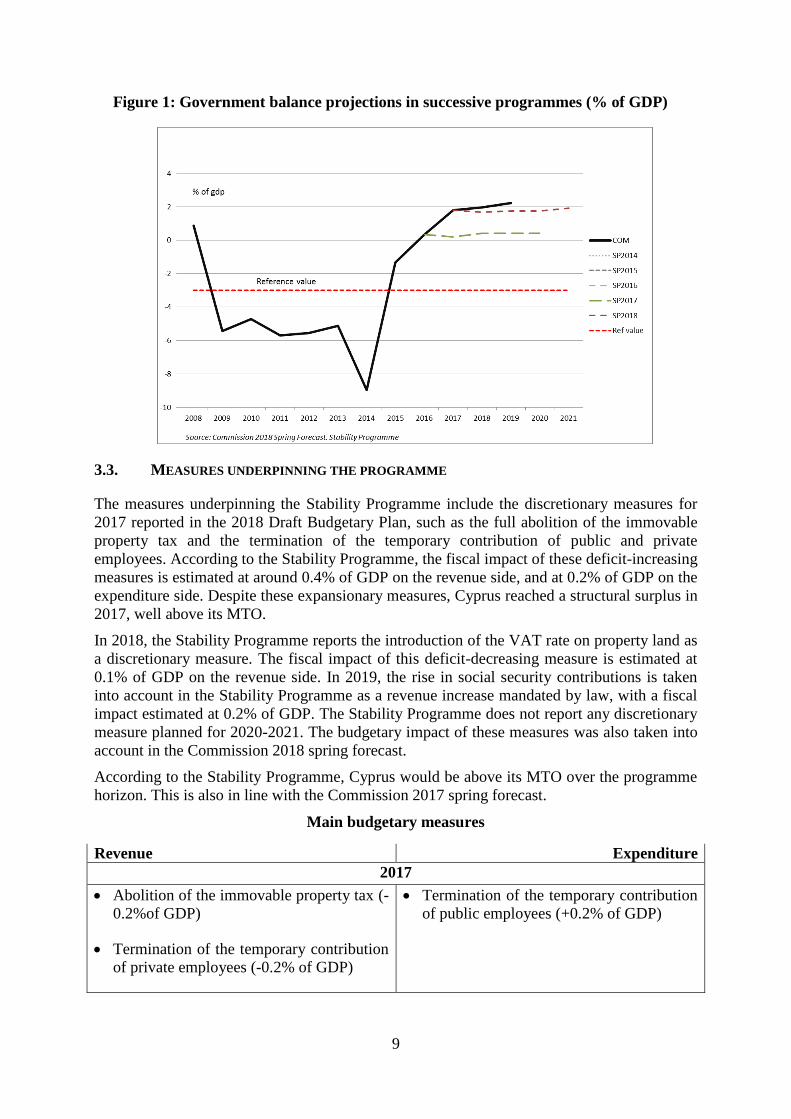
Figure 1: Government balance projections in successive programmes (% of GDP)
3.3. MEASURES UNDERPINNING THE PROGRAMME
The measures underpinning the Stability Programme include the discretionary measures for
2017 reported in the 2018 Draft Budgetary Plan, such as the full abolition of the immovable
property tax and the termination of the temporary contribution of public and private
employees. According to the Stability Programme, the fiscal impact of these deficit-increasing
measures is estimated at around 0.4% of GDP on the revenue side, and at 0.2% of GDP on the
expenditure side. Despite these expansionary measures, Cyprus reached a structural surplus in
2017, well above its MTO.
In 2018, the Stability Programme reports the introduction of the VAT rate on property land as
a discretionary measure. The fiscal impact of this deficit-decreasing measure is estimated at
0.1% of GDP on the revenue side. In 2019, the rise in social security contributions is taken
into account in the Stability Programme as a revenue increase mandated by law, with a fiscal
impact estimated at 0.2% of GDP. The Stability Programme does not report any discretionary
measure planned for 2020-2021. The budgetary impact of these measures was also taken into
account in the Commission 2018 spring forecast.
According to the Stability Programme, Cyprus would be above its MTO over the programme
horizon. This is also in line with the Commission 2017 spring forecast.
Main budgetary measures
Revenue Expenditure
2017
Abolition of the immovable property tax (-
0.2%of GDP)
Termination of the temporary contribution
of private employees (-0.2% of GDP)
Termination of the temporary contribution
of public employees (+0.2% of GDP)
10
2018
Introduction of the VAT rate on property
land (+0.1% of GDP)
2019
Increase in social security contributions
(+0.2% of GDP)
Note: The budgetary impact in the table is the impact reported in the programme, i.e. by the national authorities.
A positive sign implies that revenue / expenditure increases as a consequence of this measure.
3.4. DEBT DEVELOPMENTS
Public debt fell significantly in 2017, dropping below 100 % for the first time since 2013, to
97.5 % of GDP. Cyprus has significantly accelerated its public debt reduction, owing to a
high nominal GDP growth, a sizeable general government primary surplus and active debt
management operations. The latter entailed repaying part of the debt from the accumulated
cash balances (reflected in a negative stock-flow adjustment). In particular, the government
repaid part of the debt owed to the CBC (amounting to EUR 615 m, 3.2 % of GDP) in
November 2017.
Based on the Stability Programme, public debt is projected to sharply increase in 2018 to
105.6 % of GDP. The increase in 2018 is mainly due to an issuance of a series of government
bonds on 3 April 2018 (of EUR 2.35 billions), the proceeds of which were deposited with the
Cyprus Cooperative Bank (CCB). The accumulation of liquid assets in the form of deposits at
the CCB is expected to be maintained over the forecast horizon, as reflected in a positive
stock flow adjustment in 2018 and no corresponding negative adjustment in following years.
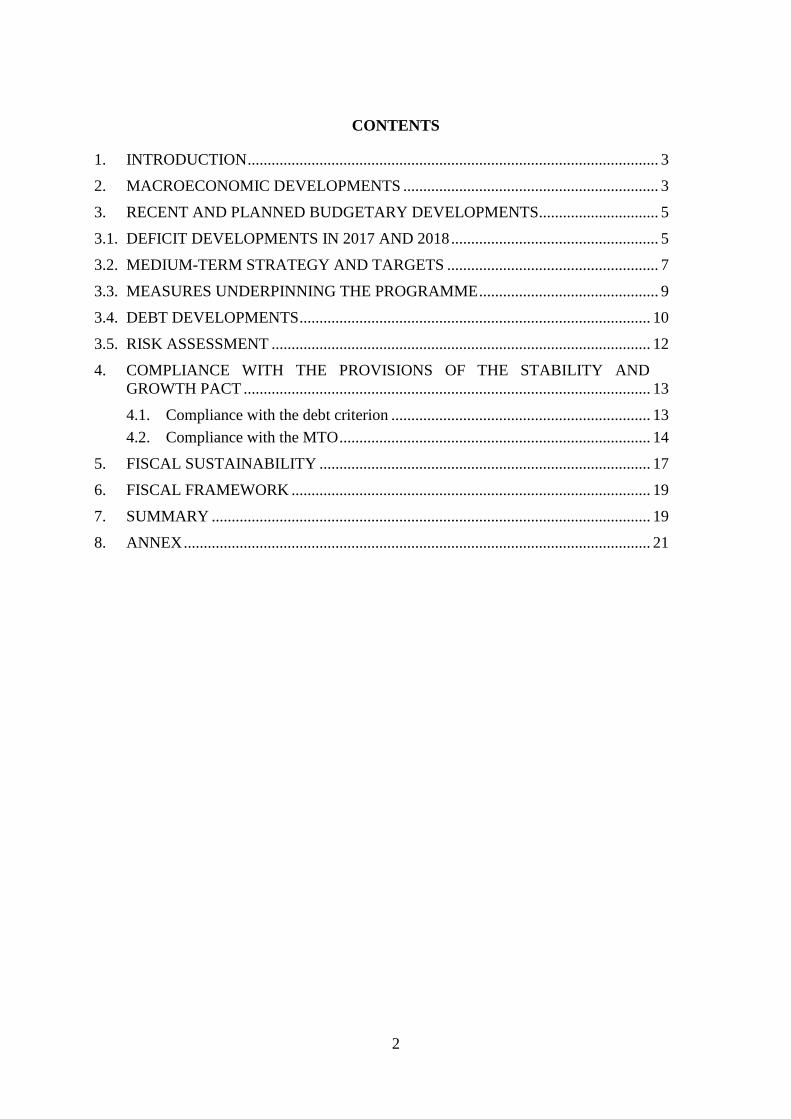
Under the Stability Programme, public debt-to-GDP ratio is projected to exhibit a sharp
downward trend over 2019-2021, mainly due to projected high primary surpluses (above
4.5% of GDP) and relatively high real GDP growth.
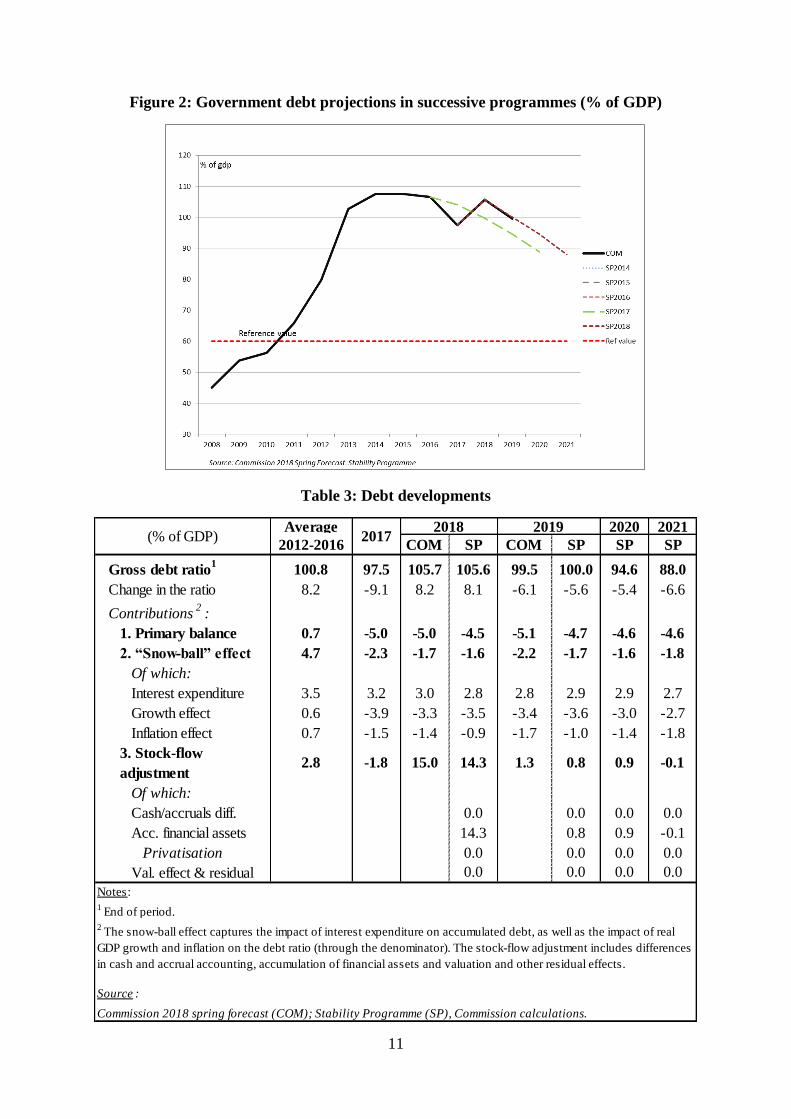
Due to the transaction with the CCB, representing a level shift upwards for the public debt
trajectory, public debt is projected to be above that expected in the 2017 Stability Programme
(Figure 2). Based on the Commission 2018 spring forecast, government debt is expected to
follow similar dynamics. The decline in 2019 is projected by the Commission to be somewhat
larger compared to the Stability Programme projections, due to more optimistic projections of
the inflation and primary balance, partly offset by more pessimistic projection of a higher
stock-flow adjustment (in the form of accumulation of financial assets).
11
Figure 2: Government debt projections in successive programmes (% of GDP)
Table 3: Debt developments
Average 2020 2021
2012-2016 COM SP COM SP SP SP
Gross debt ratio1
100.8 97.5 105.7 105.6 99.5 100.0 94.6 88.0
Change in the ratio 8.2 -9.1 8.2 8.1 -6.1 -5.6 -5.4 -6.6
Contributions2
:
1. Primary balance 0.7 -5.0 -5.0 -4.5 -5.1 -4.7 -4.6 -4.6
2. “Snow-ball” effect 4.7 -2.3 -1.7 -1.6 -2.2 -1.7 -1.6 -1.8
Of which:
Interest expenditure 3.5 3.2 3.0 2.8 2.8 2.9 2.9 2.7
Growth effect 0.6 -3.9 -3.3 -3.5 -3.4 -3.6 -3.0 -2.7
Inflation effect 0.7 -1.5 -1.4 -0.9 -1.7 -1.0 -1.4 -1.8
3. Stock-flow
adjustment2.8 -1.8 15.0 14.3 1.3 0.8 0.9 -0.1
Of which:
Cash/accruals diff. 0.0 0.0 0.0 0.0
Acc. financial assets 14.3 0.8 0.9 -0.1
Privatisation 0.0 0.0 0.0 0.0
Val. effect & residual 0.0 0.0 0.0 0.0
Notes:
Source :
(% of GDP) 20172018 2019
1 End of period.
2 The snow-ball effect captures the impact of interest expenditure on accumulated debt, as well as the impact of real
GDP growth and inflation on the debt ratio (through the denominator). The stock-flow adjustment includes differences
in cash and accrual accounting, accumulation of financial assets and valuation and other residual effects.
Commission 2018 spring forecast (COM); Stability Programme (SP), Commission calculations.
12
3.5. RISK ASSESSMENT
As analysed in Section 2, the real GDP growth projections put forward in the Stability
Programme for 2018 and 2019 are higher than the Commission 2018 spring forecast. Despite
the recent strong performance of the Cypriot economy, risks to the macroeconomic outlook
appear to be tilted to the downside in both years, mainly due to domestic factors, in particular
the high levels of non-performing loans in the banking sector and the low profitability of
banks. There are also external risks, such as those related to the economic outlook of the UK,
as one of the Cyprus’ most significant trading partners, and the potential deterioration of the
policy stance of the US and the relationship between the EU and Russia. In addition, the
concentration of investment in construction and transport equipment (ship registration in
particular) casts doubts on the extent of its positive impact on potential growth in the medium
to long term.
As analysed in Section 3, the fiscal projections in the 2018 Stability Programme for 2018 and
2019 are more conservative than the Commission 2018 spring forecast. Despite the generally
more optimistic macroeconomic assumptions in the Stability Programme, the budgetary
projections appear to be markedly conservative, in particular on revenue. According to the
Stability Programme, the effect to the fiscal outlook from risks related to macroeconomic
outcomes, interest rates developments and contingent liabilities are somewhat mitigated by
upside risks , namely on the prospects in tax revenue.
However, risks to the baseline fiscal projections remain and are mostly on the downside,
mainly regarding the potential impact of possible support measures to the banking system,
possible spending pressures on public wages, uncertainties about the outcome of court cases
and concerns about the durability of the recent over-performance in revenue. The
materialisation of contingent liabilities in relation to the banking sector may create downward
risks to the fiscal outlook over the programme horizon, in particular to the expenditure
projections.5 Additionally, it is difficult to predict the impact of the ongoing sale of the
Cyprus Cooperative Bank on the national accounts due to uncertainties on the sale and the
complexity linked to its statistical treatment. Concerning expenditure on compensation of
employees, it could prove difficult to maintain the moderate salary increases projected in the
Stability Programme, below the nominal GDP growth, given the unfreezing of promotions,
the provision of Cost of Living Allowance (COLA), the annual increments and the extension
of employment of seasonal personnel from 8 months to 11 months per year.6 Furthermore,
there are uncertainties about the outcome of court cases concerning the constitutionality of the
public sector wage and benefit cuts during the crisis, as rulings in favour of claimants could
significantly impact public finances. On the revenue side, the important share of corporate tax
revenue in Cyprus as a percentage of GDP (compared to the EU average)7 poses a potential
risk to public finances, as the respective tax base is influenced by relocation decision of
enterprises. The Stability Programme states that corporate taxes continue to account on
average for about 17.9% of total tax revenue over the programme period, in line with previous
years. Nonetheless, it is important to note that the forecasts in previous Stability Programmes
5 Such risks could derive from, for example, the ongoing sale process of the Cyprus Cooperative Bank and the
setting up of the “ESTIA” project, as mentioned in the Stability Programme. 6 The overall wage bill developments in the public and broader public sector are governed by collective
agreements with the Unions, whereby a wage setting mechanism monitors and regulates wage bill growth below
nominal GDP growth for 2017-2018. According to the Stability Programme, in the absence of any amendments
to the current agreements, the mechanism will continue to be in effect. 7 For further information, see the 2018 Country Report for Cyprus, section 4.1.3.
13
have proven to be more conservative than the actual fiscal outturns, mainly due to higher-
than-expected economic growth. Finally, it is worth noting that Eurostat is currently
discussing with the Statistical Service of Cyprus the recording of interest expenditure and
intermediate consumption and, therefore, the potential impact of the revision to the envisaged
budgetary plans remains unclear.8
Regarding risks related to debt developments, Cyprus’ still high level of public debt makes
government debt projections sensitive to variations in economic growth and to the expected
size of budget surpluses. In addition, there are downside risks linked to potential future
changes to market conditions, such as higher interest expenditure due to unanticipated
increases in the borrowing costs. This is mitigated by relatively low annual debt principal
repayment needs until 2021 (below 7 % of GDP) and the high level of government cash
buffers. The sizeable contingent liabilities also pose an additional risk.
4. COMPLIANCE WITH THE PROVISIONS OF THE STABILITY AND GROWTH PACT
Box 1. Council Recommendations addressed to Cyprus
On 11 July 2017, the Council addressed recommendations to Cyprus in the context of the
European Semester.9 In particular, in the area of public finances the Council
recommended Cyprus to remain at its medium-term budgetary objective in 2018 and to
use windfall gains to accelerate the reduction of the general government debt ratio.
4.1. Compliance with the debt criterion
After it corrected its excessive deficit in 2015, Cyprus is in the transition period for the
following three years (until 2018) and should ensure sufficient progress towards compliance
with the debt reduction benchmark. This implies that, during this period, it is required to make
sufficient progress as defined by the minimum linear structural adjustment (MLSA) towards
compliance with the debt reduction benchmark at the end of the transition period. As from
2019, as its public debt exceeds the 60% of GDP reference of the Treaty, Cyprus has to
comply with the debt reduction benchmark.
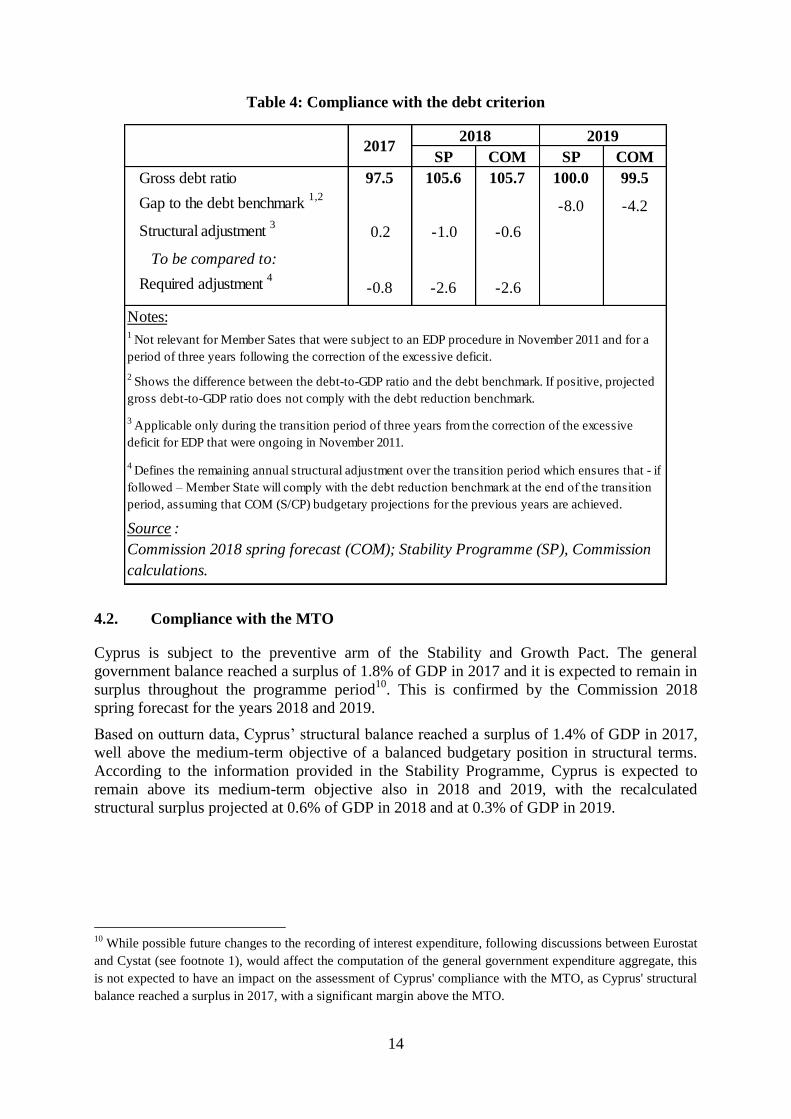
Until end 2018, Cyprus is in a transition period and, based on the Stability Programme,
Cyprus is making sufficient progress towards compliance with the debt reduction benchmark
in 2017 and 2018. In particular, the estimated change in the structural balance in 2017 was
higher than the MLSA by 1 % of GDP. For 2018, the Stability Programme’s projections point
to a similar result, by a margin of 1.6 % of GDP above the required adjustment. This is
broadly in line with the Commission 2018 spring forecast, according to which the change in
the structural balance is also expected to exceed the required MLSA in 2018 by 2 % of GDP.
Based on the Stability Programme, in 2019, Cyprus is expected to meet the debt reduction
benchmark, as its debt-to-GDP ratio is expected to be below the debt benchmark, with a gap
to the debt benchmark of -8% of GDP. Based on the Commission 2018 spring forecast,
Cyprus is also expected to respect the benchmark in 2019 (with a gap to the debt benchmark
of -4.2 % of GDP).
8 For further information, see footnote 1.
9 Council Recommendation of 11 July 2017 on the 2017 National Reform Programme of Cyprus and delivering a
Council opinion on the 2017 Stability Programme of Cyprus, OJ C 261, 9.8.2017.
14
Table 4: Compliance with the debt criterion
4.2. Compliance with the MTO
Cyprus is subject to the preventive arm of the Stability and Growth Pact. The general
government balance reached a surplus of 1.8% of GDP in 2017 and it is expected to remain in
surplus throughout the programme period10
. This is confirmed by the Commission 2018
spring forecast for the years 2018 and 2019.
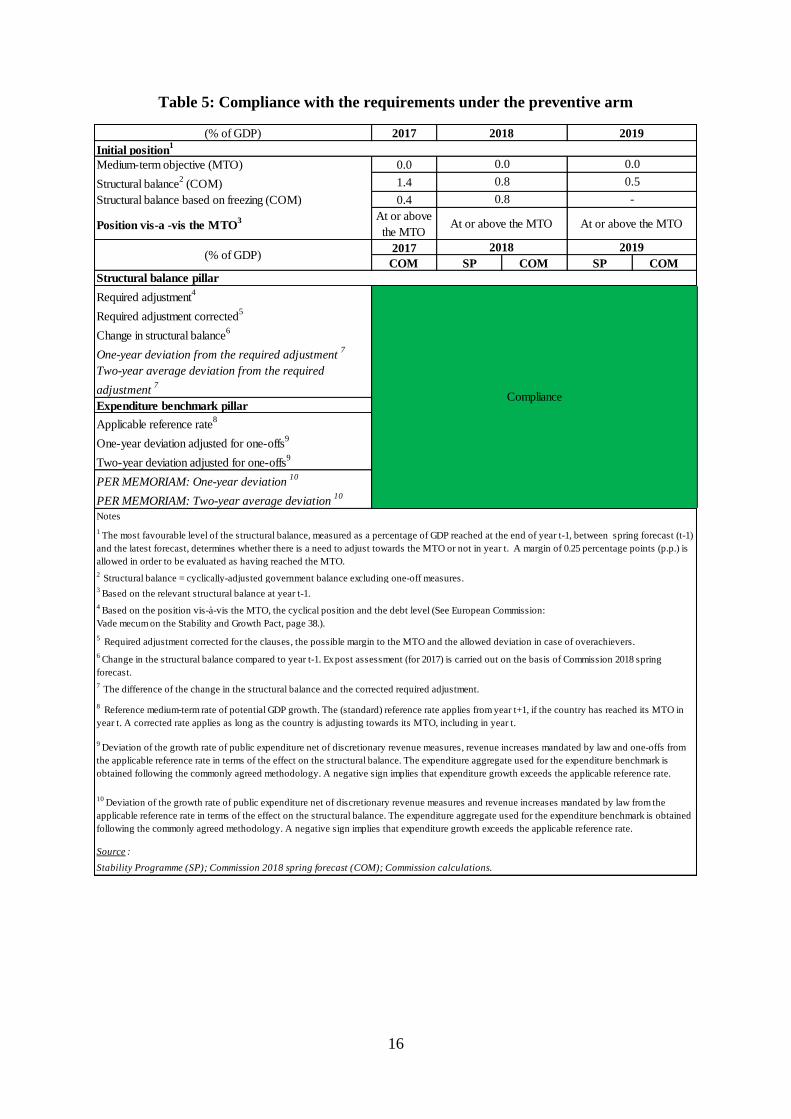
Based on outturn data, Cyprus’ structural balance reached a surplus of 1.4% of GDP in 2017,
well above the medium-term objective of a balanced budgetary position in structural terms.
According to the information provided in the Stability Programme, Cyprus is expected to
remain above its medium-term objective also in 2018 and 2019, with the recalculated
structural surplus projected at 0.6% of GDP in 2018 and at 0.3% of GDP in 2019.
10
While possible future changes to the recording of interest expenditure, following discussions between Eurostat
and Cystat (see footnote 1), would affect the computation of the general government expenditure aggregate, this
is not expected to have an impact on the assessment of Cyprus' compliance with the MTO, as Cyprus' structural
balance reached a surplus in 2017, with a significant margin above the MTO.
SP COM SP COM
97.5 105.6 105.7 100.0 99.5
-8.0 -4.2
0.2 -1.0 -0.6
-0.8 -2.6 -2.6
Notes:
20172018 2019
Gap to the debt benchmark 1,2
Gross debt ratio
4 Defines the remaining annual structural adjustment over the transition period which ensures that - if
followed – Member State will comply with the debt reduction benchmark at the end of the transition
period, assuming that COM (S/CP) budgetary projections for the previous years are achieved.
Source :
Commission 2018 spring forecast (COM); Stability Programme (SP), Commission
calculations.
Structural adjustment 3
To be compared to:
Required adjustment 4
1 Not relevant for Member Sates that were subject to an EDP procedure in November 2011 and for a
period of three years following the correction of the excessive deficit.
2 Shows the difference between the debt-to-GDP ratio and the debt benchmark. If positive, projected
gross debt-to-GDP ratio does not comply with the debt reduction benchmark.
3 Applicable only during the transition period of three years from the correction of the excessive
deficit for EDP that were ongoing in November 2011.
15
This is confirmed based on the Commission 2018 spring forecast, which projects higher
structural surpluses of 0.8% of GDP in 2018 and 0.5% of GDP in 2019 under a no-policy-
change assumption.11
Cyprus is therefore projected to be compliant with the requirements of the preventive arm of
the Pact in both 2018 and 2019. Beyond 2019, the Stability Programme indicates that the
structural balance is set to remain above the MTO over the programme period.
11
For an explanation of the differences between the Stability Programme and the Commission 2017 spring
forecast projections, see section 3.1 and 3.2.
16
Table 5: Compliance with the requirements under the preventive arm
(% of GDP) 2017
Medium-term objective (MTO) 0.0
Structural balance2
(COM) 1.4
Structural balance based on freezing (COM) 0.4
Position vis-a -vis the MTO3 At or above
the MTO
2017
COM SP COM SP COM
Required adjustment4
Required adjustment corrected5
Change in structural balance6
One-year deviation from the required adjustment7
Two-year average deviation from the required
adjustment7
Expenditure benchmark pillar
Applicable reference rate8
One-year deviation adjusted for one-offs9
Two-year deviation adjusted for one-offs9
PER MEMORIAM: One-year deviation10
PER MEMORIAM: Two-year average deviation10
Source :
Notes
1 The most favourable level of the structural balance, measured as a percentage of GDP reached at the end of year t-1, between spring forecast (t-1)
and the latest forecast, determines whether there is a need to adjust towards the MTO or not in year t. A margin of 0.25 percentage points (p.p.) is
allowed in order to be evaluated as having reached the MTO.
10 Deviation of the growth rate of public expenditure net of discretionary revenue measures and revenue increases mandated by law from the
applicable reference rate in terms of the effect on the structural balance. The expenditure aggregate used for the expenditure benchmark is obtained
following the commonly agreed methodology. A negative sign implies that expenditure growth exceeds the applicable reference rate.
2 Structural balance = cyclically-adjusted government balance excluding one-off measures.
3 Based on the relevant structural balance at year t-1.
4 Based on the position vis-à-vis the MTO, the cyclical position and the debt level (See European Commission:
Vade mecum on the Stability and Growth Pact, page 38.).
6 Change in the structural balance compared to year t-1. Ex post assessment (for 2017) is carried out on the basis of Commission 2018 spring
forecast.
7 The difference of the change in the structural balance and the corrected required adjustment.
8 Reference medium-term rate of potential GDP growth. The (standard) reference rate applies from year t+1, if the country has reached its MTO in
year t. A corrected rate applies as long as the country is adjusting towards its MTO, including in year t.
5 Required adjustment corrected for the clauses, the possible margin to the MTO and the allowed deviation in case of overachievers.
Stability Programme (SP); Commission 2018 spring forecast (COM); Commission calculations.
2018 2019
Initial position1
0.8 0.5
0.8 -
9 Deviation of the growth rate of public expenditure net of discretionary revenue measures, revenue increases mandated by law and one-offs from
the applicable reference rate in terms of the effect on the structural balance. The expenditure aggregate used for the expenditure benchmark is
obtained following the commonly agreed methodology. A negative sign implies that expenditure growth exceeds the applicable reference rate.
At or above the MTO At or above the MTO
0.0 0.0
(% of GDP)2018 2019
Structural balance pillar
Compliance
17
5. FISCAL SUSTAINABILITY
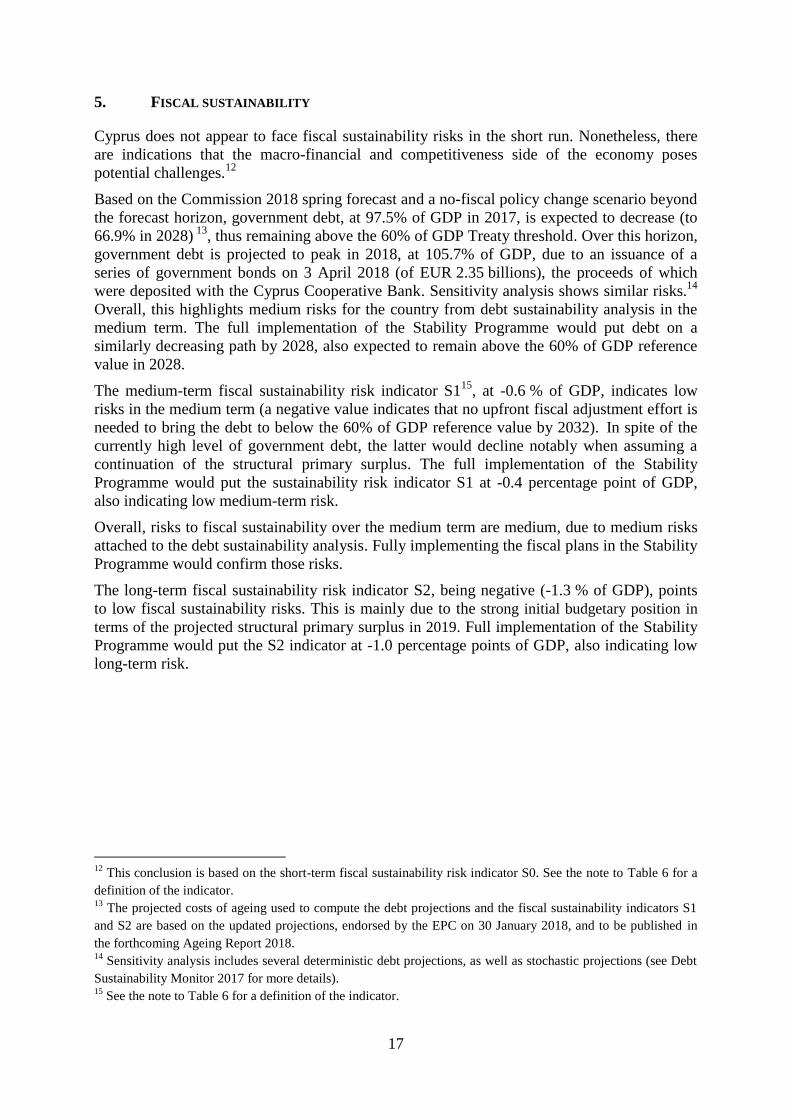
Cyprus does not appear to face fiscal sustainability risks in the short run. Nonetheless, there
are indications that the macro-financial and competitiveness side of the economy poses
potential challenges.12
Based on the Commission 2018 spring forecast and a no-fiscal policy change scenario beyond
the forecast horizon, government debt, at 97.5% of GDP in 2017, is expected to decrease (to
66.9% in 2028) 13
, thus remaining above the 60% of GDP Treaty threshold. Over this horizon,
government debt is projected to peak in 2018, at 105.7% of GDP, due to an issuance of a
series of government bonds on 3 April 2018 (of EUR 2.35 billions), the proceeds of which
were deposited with the Cyprus Cooperative Bank. Sensitivity analysis shows similar risks.14
Overall, this highlights medium risks for the country from debt sustainability analysis in the
medium term. The full implementation of the Stability Programme would put debt on a
similarly decreasing path by 2028, also expected to remain above the 60% of GDP reference
value in 2028.
The medium-term fiscal sustainability risk indicator S115
, at -0.6 % of GDP, indicates low
risks in the medium term (a negative value indicates that no upfront fiscal adjustment effort is
needed to bring the debt to below the 60% of GDP reference value by 2032). In spite of the
currently high level of government debt, the latter would decline notably when assuming a
continuation of the structural primary surplus. The full implementation of the Stability
Programme would put the sustainability risk indicator S1 at -0.4 percentage point of GDP,
also indicating low medium-term risk.
Overall, risks to fiscal sustainability over the medium term are medium, due to medium risks
attached to the debt sustainability analysis. Fully implementing the fiscal plans in the Stability
Programme would confirm those risks.
The long-term fiscal sustainability risk indicator S2, being negative (-1.3 % of GDP), points
to low fiscal sustainability risks. This is mainly due to the strong initial budgetary position in
terms of the projected structural primary surplus in 2019. Full implementation of the Stability
Programme would put the S2 indicator at -1.0 percentage points of GDP, also indicating low
long-term risk.
12
This conclusion is based on the short-term fiscal sustainability risk indicator S0. See the note to Table 6 for a
definition of the indicator. 13
The projected costs of ageing used to compute the debt projections and the fiscal sustainability indicators S1
and S2 are based on the updated projections, endorsed by the EPC on 30 January 2018, and to be published in
the forthcoming Ageing Report 2018. 14
Sensitivity analysis includes several deterministic debt projections, as well as stochastic projections (see Debt
Sustainability Monitor 2017 for more details). 15
See the note to Table 6 for a definition of the indicator.
18
Table 6: Sustainability indicators
Time horizon
Short Term
0.19 LOW risk
0.57 HIGH risk
Medium Term
DSA [2]
S1 indicator [3] -0.6 LOW risk -0.4 LOW risk
Initial Budgetary Position
Debt Requirement
Cost of Ageing
of which
Pensions
Health-care
Long-term care
Other
Long Term
S2 indicator [4]
Initial Budgetary Position
Cost of Ageing
of which
Pensions
Health-care
Long-term care
Other
[1] The S0 indicator of short term fiscal challenges informs the early detection of fiscal stress associated to fiscal risks within a one-year
horizon. To estimate these risks S0 uses a set of fiscal, financial and competitiveness indicators selected and weighted according to
their signalling power. S0 is therefore a composite indicator whose methodology is fundamentally different from the S1 and S2
indicators, which quantify fiscal adjustment efforts. The critical threshold for the overall S0 indicator is 0.46. For the fiscal and the
financial-competitiveness sub-indexes, thresholds are respectively at 0.36 and 0.49*.
[2] Debt Sustainability Analysis (DSA) is performed around the no fiscal policy change scenario in a manner that tests the response of
this scenario to different shocks presented as sensitivity tests and stochastic projections*.
[3] The S1 indicator is a medium-term sustainability gap; it measures the upfront fiscal adjustment effort required to bring the debt-to-
GDP ratio to 60 % by 2032. This adjustment effort corresponds to a cumulated improvement in the structural primary balance over the 5
years following the forecast horizon (i.e. from 2020 for Commission scenario and from last available year for the SCP scenario); it must
be then sustained, including financing for any additional expenditure until the target date, arising from an ageing population. The critical
thresholds for S1 are 0 and 2.5, between which S1 indicates medium risk. If S1 is below 0 or above 2.5, it indicates low or high risk,
respectively*.
[4] The S2 indicator is a long-term sustainability gap; it shows the upfront and permanent fiscal adjustment required to stabilise the debt-
to-GDP ratio over the infinite horizon, including the costs of ageing. The critical thresholds for S2 are 2 and 6, between which S2
indicates medium risk. If S2 is below 2 or above 6, it indicates low or high risk, respectively*.
* For more information see Fiscal Sustainability Report 2015 and Debt Sustainability Monitor 2017.
Note: the 'Commission' scenario depicts the sustainability gap under the assumption that the structural primary balance position
evolves according to the Commissions' spring 2018 forecast covering until 2019 included. The 'stability/convergence programme'
scenario depicts the sustainability gap under the assumption that the budgetary plans in the programme are fully implemented over the
period covered by the programme. Age-related expenditure as given in the 2018 Ageing Report.
0.9 0.9
1.9 1.7
0.3 0.3
0.2 0.2
-1.4 -1.2
Source: Commission services; 2018 stability/convergence programme.
-1.3 -1.0
of which
-2.2 -1.8
0.0 0.0
-0.7 -0.7
LOW risk LOW risk
0.1 0.1
of which
-3.5 -2.7
3.0 2.5
-0.1 -0.2
0.6 0.4
Commission ScenarioStability / Convergence
Programme Scenario
LOW risk
S0 indicator [1] 0.44
Fiscal subindex
Financial & competitiveness subindex
MEDIUM risk
MEDIUM risk
19
6. FISCAL FRAMEWORK
The national fiscal rules are laid down in the Fiscal Responsibility and Budgetary Framework
Law, containing in particular a structural budget balance rule with a corrective adjustment
mechanism, and a debt rule. As regards the structural balance rule (prescribing conformity
with the country's MTO for each year), Cyprus recorded a structural surplus of 1.2% of GDP
in 2017 according to the Stability Programme submitted by the authorities, significantly above
its MTO of a balanced structural position. Over the period 2018-2021, based on the Stability
Programme's projections taken at face value, the structural balance is planned to remain in
surplus averaging around 0.3% of GDP, thus overperforming the MTO.
As regards the debt rule (which is line with the Stability and Growth Pact requirement on debt
reduction), Cyprus is currently in the transition period (2016-2018) and achieved the
minimum linear structural adjustment, based on the information provided in the Stability
Programme (see Section 4.1. for details). Following the transition period, the debt reduction
benchmark applies.
As a result, based on the information provided in the Stability Programme, the past, planned
and forecast fiscal performance in Cyprus appears to comply with the requirements of the
applicable national numerical fiscal rules.
The macroeconomic forecasts underlying the Stability Programme had been submitted to the
independent Fiscal Council for endorsement. On 25 April 2018, the Council concluded in a
public letter16
to the Minister of Finance that the macroeconomic forecast underlying the
Stability Programme was deemed to be sufficiently conservative. More specifically, as stated
in the Stability Programme, the Council concluded that the headline GDP and budget balance
figures as forecast by the Ministry of Finance were considered realistic for the programming
period under consideration. In its public letter the Council flagged some risks, mainly linked
to the limited progress in implementing reforms in the public and private sector, the
challenges faced by the banking sector and the potential deterioration of the external
environment. The Council's detailed assessment is expected to appear in its 2018 spring
report.17
The Stability Programme explicitly states that it should be considered as Cyprus national
medium-term fiscal plan (NMTFP). Nevertheless, neither the Stability Programme nor the
National Reform Programme include indications on the expected economic returns on non-
defence public investment projects that have significant budgetary impact.
7. SUMMARY
In 2017, Cyprus recorded headline and structural budget surpluses, overachieving the
provisions of the Stability and Growth Pact. Cyprus also made sufficient progress towards
compliance with the debt criterion as defined by the minimum linear structural adjustment
(MLSA) in 2017.
According to both the information provided in the Stability Programme and the Commission
2018 spring forecast, Cyprus is expected to remain above its medium-term objective in 2018
and 2019. In addition, according to the Stability Programme and the Commission 2018 spring
16
http://www.fiscalcouncil.gov.cy/fiscalcouncil/fiscalcouncil.nsf/All/77D1E2A3EF35323AC22582860027CF80/
$file/%CE%B4%CE%B5%CE%BB%CF%84%CE%AF%CE%BF%20%CF%84%CF%8D%CF%80%CE%BF
%CF%85%20Eng%201.pdf 17
Spring report 2018, Fiscal Council (forthcoming).
20
forecast, Cyprus is also expected to make sufficient progress towards compliance with the
debt reduction benchmark in 2018 and respect the benchmark in 2019. Therefore, Cyprus is
projected to meet the requirements under the preventive arm of the Stability and Growth Pact
in both 2018 and 2019. At the same time, expenditure developments should be monitored
carefully, especially in light of possible future risks to the robustness of revenues, to
safeguard fiscal sustainability in line with the SGP.
21
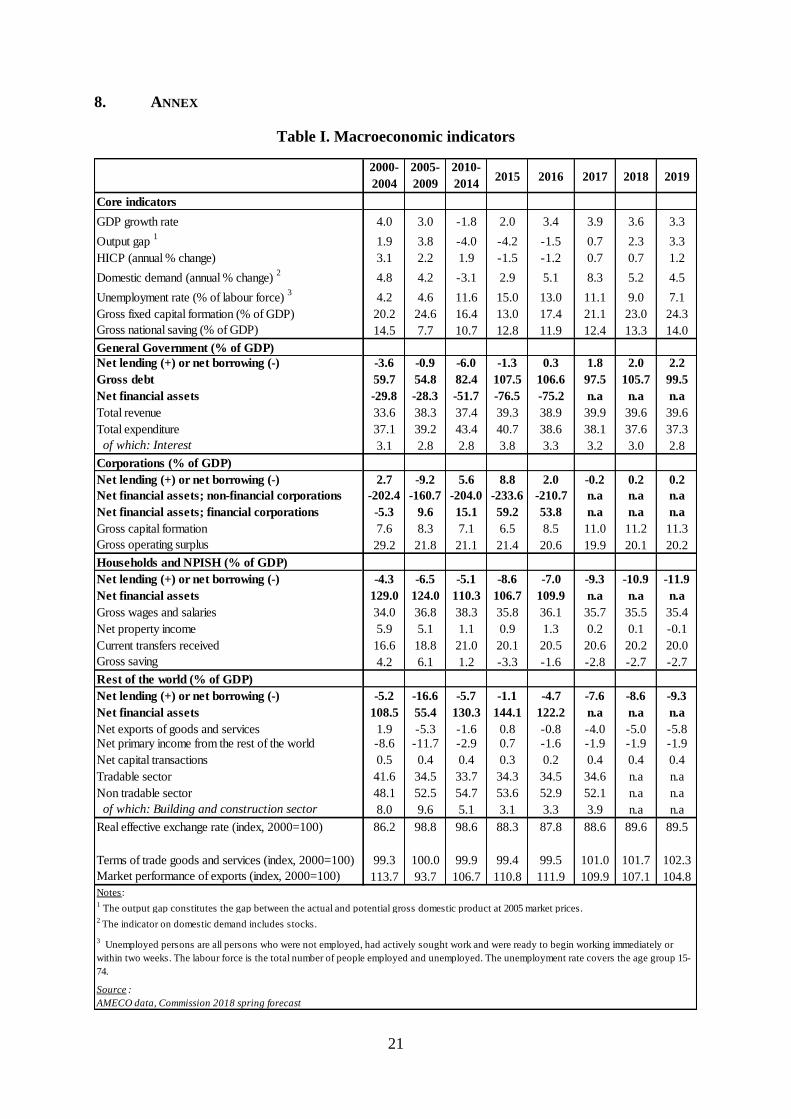
8. ANNEX
Table I. Macroeconomic indicators
2000-
2004
2005-
2009
2010-
20142015 2016 2017 2018 2019
Core indicators
GDP growth rate 4.0 3.0 -1.8 2.0 3.4 3.9 3.6 3.3
Output gap 1
1.9 3.8 -4.0 -4.2 -1.5 0.7 2.3 3.3
HICP (annual % change) 3.1 2.2 1.9 -1.5 -1.2 0.7 0.7 1.2
Domestic demand (annual % change) 2
4.8 4.2 -3.1 2.9 5.1 8.3 5.2 4.5
Unemployment rate (% of labour force) 3
4.2 4.6 11.6 15.0 13.0 11.1 9.0 7.1
Gross fixed capital formation (% of GDP) 20.2 24.6 16.4 13.0 17.4 21.1 23.0 24.3
Gross national saving (% of GDP) 14.5 7.7 10.7 12.8 11.9 12.4 13.3 14.0
General Government (% of GDP)
Net lending (+) or net borrowing (-) -3.6 -0.9 -6.0 -1.3 0.3 1.8 2.0 2.2
Gross debt 59.7 54.8 82.4 107.5 106.6 97.5 105.7 99.5
Net financial assets -29.8 -28.3 -51.7 -76.5 -75.2 n.a n.a n.a
Total revenue 33.6 38.3 37.4 39.3 38.9 39.9 39.6 39.6
Total expenditure 37.1 39.2 43.4 40.7 38.6 38.1 37.6 37.3
of which: Interest 3.1 2.8 2.8 3.8 3.3 3.2 3.0 2.8
Corporations (% of GDP)
Net lending (+) or net borrowing (-) 2.7 -9.2 5.6 8.8 2.0 -0.2 0.2 0.2
Net financial assets; non-financial corporations -202.4 -160.7 -204.0 -233.6 -210.7 n.a n.a n.a
Net financial assets; financial corporations -5.3 9.6 15.1 59.2 53.8 n.a n.a n.a
Gross capital formation 7.6 8.3 7.1 6.5 8.5 11.0 11.2 11.3
Gross operating surplus 29.2 21.8 21.1 21.4 20.6 19.9 20.1 20.2
Households and NPISH (% of GDP)
Net lending (+) or net borrowing (-) -4.3 -6.5 -5.1 -8.6 -7.0 -9.3 -10.9 -11.9
Net financial assets 129.0 124.0 110.3 106.7 109.9 n.a n.a n.a
Gross wages and salaries 34.0 36.8 38.3 35.8 36.1 35.7 35.5 35.4
Net property income 5.9 5.1 1.1 0.9 1.3 0.2 0.1 -0.1
Current transfers received 16.6 18.8 21.0 20.1 20.5 20.6 20.2 20.0
Gross saving 4.2 6.1 1.2 -3.3 -1.6 -2.8 -2.7 -2.7
Rest of the world (% of GDP)
Net lending (+) or net borrowing (-) -5.2 -16.6 -5.7 -1.1 -4.7 -7.6 -8.6 -9.3
Net financial assets 108.5 55.4 130.3 144.1 122.2 n.a n.a n.a
Net exports of goods and services 1.9 -5.3 -1.6 0.8 -0.8 -4.0 -5.0 -5.8Net primary income from the rest of the world -8.6 -11.7 -2.9 0.7 -1.6 -1.9 -1.9 -1.9
Net capital transactions 0.5 0.4 0.4 0.3 0.2 0.4 0.4 0.4
Tradable sector 41.6 34.5 33.7 34.3 34.5 34.6 n.a n.a
Non tradable sector 48.1 52.5 54.7 53.6 52.9 52.1 n.a n.a
of which: Building and construction sector 8.0 9.6 5.1 3.1 3.3 3.9 n.a n.a
Real effective exchange rate (index, 2000=100) 86.2 98.8 98.6 88.3 87.8 88.6 89.6 89.5
Terms of trade goods and services (index, 2000=100) 99.3 100.0 99.9 99.4 99.5 101.0 101.7 102.3
Market performance of exports (index, 2000=100) 113.7 93.7 106.7 110.8 111.9 109.9 107.1 104.8
AMECO data, Commission 2018 spring forecast
Notes:1 The output gap constitutes the gap between the actual and potential gross domestic product at 2005 market prices.
2 The indicator on domestic demand includes stocks.
3 Unemployed persons are all persons who were not employed, had actively sought work and were ready to begin working immediately or
within two weeks. The labour force is the total number of people employed and unemployed. The unemployment rate covers the age group 15-
74.
Source :