Embed Size (px)
Citation preview
Int. J. Chem. Sci.: 7(3), 2009, 1733-1745
STABILITY-INDICATING HPLC METHOD FOR
SIMULTANEOUS DETERMINATION OF METOPROLOL
SUCCINATE AND HYDROCHLOROTHIAZIDE IN
COMBINATION DRUG PRODUCTS
VIJAYA P. GODSE∗∗∗∗, ASHOK V. BHOSALE, YOGESH S. BAFANA
and DHANARAJ D. BORKAR
Pharmaceutical Analysis Department, Seth Govind Raghunath Sable College of Pharmacy,
SASWAD - 412 301 (Pune), Tal- Purandar, Dist- Pune (M. S.) INDIA
ABSTRACT
A stability-indicating HPLC method has been developed and subsequently validated for the
simultaneous determination of metoprolol succinate and hydrochlorothiazide in commercial tablets. The
proposed HPLC method utilizes Kya Tech corporation® HiQ sil C18 W (250 mm × 4.6 mm i. d., 10 µm)
and mobile phase consisting of acetonitrile-10 mM potassium dihydrogen phosphate pH 3.0 (17 : 83,
v/v) for 3 min, then changed to 55 : 45 (v/v) for next 20 min and finally equilibrated back to 17 : 83 (v/v)
from 20 to 25 min. at a flow rate of 1.0 mL min–1. Quantitation was achieved with UV detection at 270
nm and 224 nm for metoprolol succinate and hydrochlorothiazide, respectively, based on peak area with
linear calibration curves at concentration ranges 100-1000 µg mL–1 for metoprolol succinate and 50-500
µg mL–1 for hydrochlorothiazide (R
2 > 0.999 for both drugs). The method was validated in terms of
accuracy, precision, linearity and robustness. This method has been successively applied to
pharmaceutical formulation and no interference from the tablet excipients was found. Metoprolol
succinate, hydrochlorothiazide and their combination drug product were exposed to acid, base, neutral
hydrolysis; oxidation, dry heat, photolytic stress conditions and the stressed samples were analyzed by
the proposed method. As the proposed method could effectively separate the drug from its degradation
products, it can be employed as stability-indicating method for the determination of instability of these
drugs in bulk and commercial products.
Key words : Column liquid chromatography, Stability-indicating method, Degradation products,
Metoprolol succinate, Hydrochlorothiazide
INTRODUCTION
Safety and efficacy of pharmaceuticals are two fundamental issues of importance
∗ Author for correspondence
V. P. Godse et al.: Stability-Indicating…
1734
in drug therapy. Instability of pharmaceuticals can cause a change in physical, chemical,
pharmacological and toxicological properties of the active pharmaceutical ingredients
(API); thereby affecting its safety and efficacy. Hence, the pharmacists should take
cognizance of various factors such as drug stability, possible degradation products,
mechanisms and routes of degradation and potential interactions with excipients utilized in
the formulation to ensure the delivery of their therapeutic values to patients. In order to
assess the stability of a drug product, one needs an appropriate analytical methodology, so
called the stability – indicating methods, which allow accurate and precise quantitation of
the drug, its degradation products and interaction products, if any. In recent times, the
development of stability-indicating assays has increased enormously1–3, using the approach
of stress testing as outlined in the International Conference on Harmonization (ICH)
guideline Q1AR2 4 and even this approach is being extended to drug combinations5–7. This
ICH guideline requires that stress testing on API and drug products should be carried out to
establish their inherent stability characteristics, which should include the effect of
temperature, humidity, light, oxidizing agents as well as susceptibility across a wide range
of pH. However, there are no detailed regulatory guidelines that direct how stress testing is
to be done and hence, stress testing has evolved into an ‘‘artful science’’ that is highly
dependent on the experience of the pharmaceutical industries or the individuals directing
the studies8. The knowledge gained from stress testing can be useful for (i) The
development of stable formulation and appropriate packaging design, (ii) Controlling of
manufacturing and processing parameters, (iii) Identification and isolation of toxic
degradants during API synthesis, (iv) Recommendation of appropriate storage conditions
and shelf-life determination and (v) Designing and interpreting environmental studies, as
the degradation of the drug in the environment will often be similar to degradation
observed during stress-testing studies. It is also recommended that analysis of stability
samples should be done through the use of a validated stability-indicating testing method.
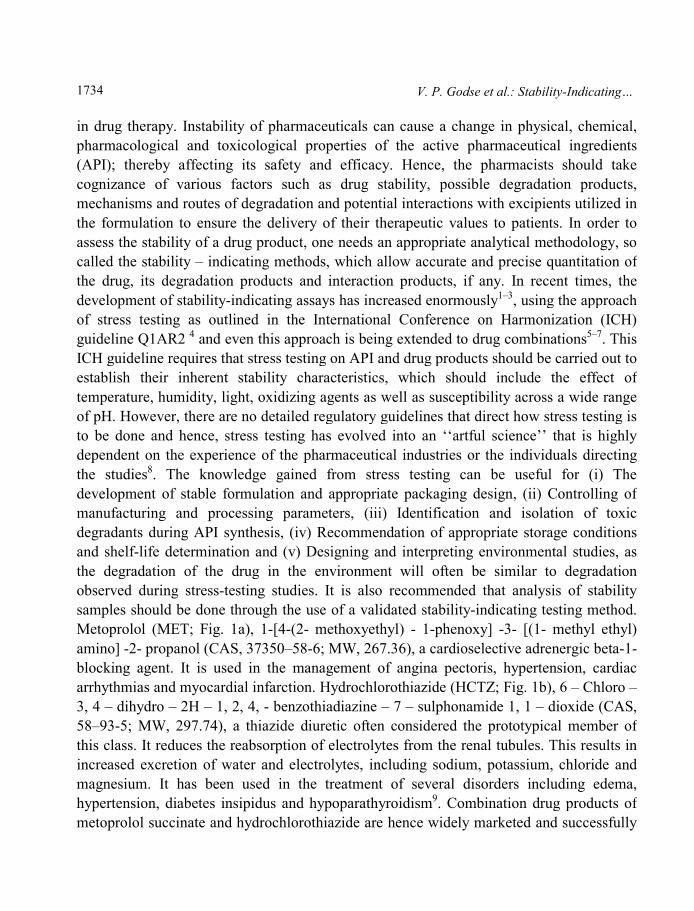
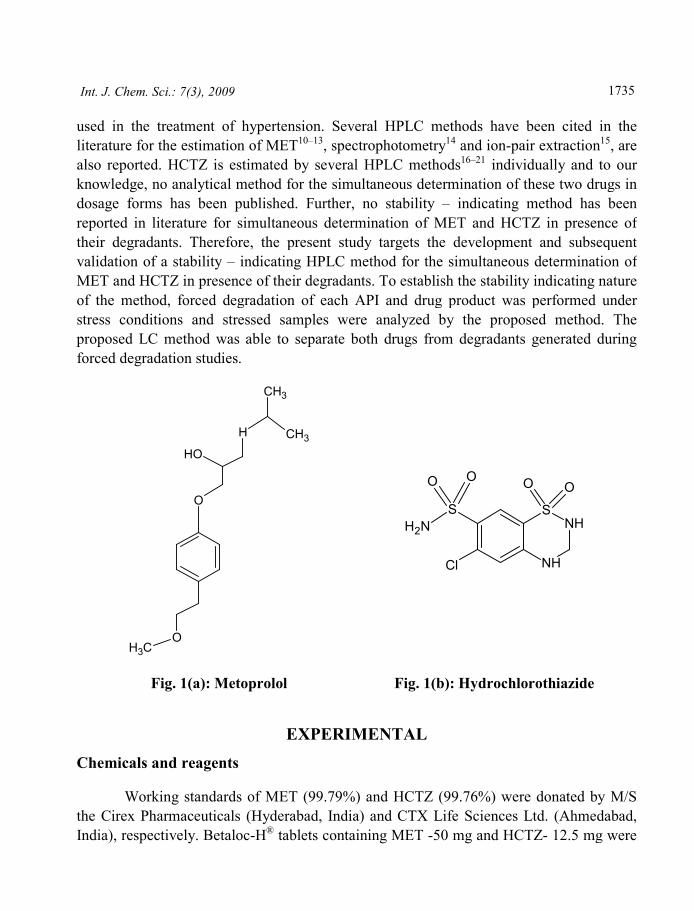
Metoprolol (MET; Fig. 1a), 1-[4-(2- methoxyethyl) - 1-phenoxy] -3- [(1- methyl ethyl)
amino] -2- propanol (CAS, 37350–58-6; MW, 267.36), a cardioselective adrenergic beta-1-
blocking agent. It is used in the management of angina pectoris, hypertension, cardiac
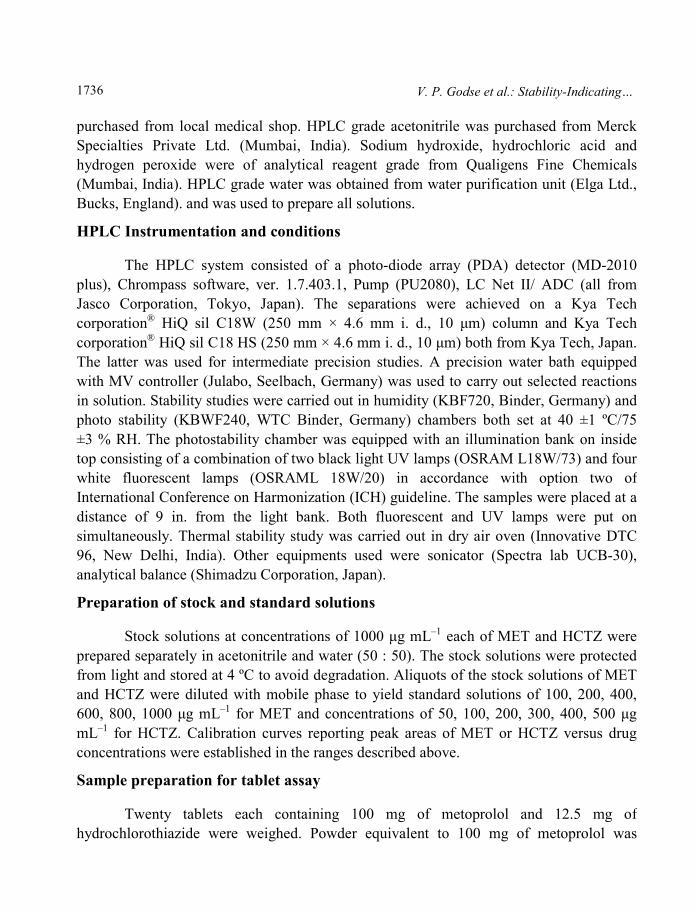
arrhythmias and myocardial infarction. Hydrochlorothiazide (HCTZ; Fig. 1b), 6 – Chloro –
3, 4 – dihydro – 2H – 1, 2, 4, - benzothiadiazine – 7 – sulphonamide 1, 1 – dioxide (CAS,
58–93-5; MW, 297.74), a thiazide diuretic often considered the prototypical member of
this class. It reduces the reabsorption of electrolytes from the renal tubules. This results in
increased excretion of water and electrolytes, including sodium, potassium, chloride and
magnesium. It has been used in the treatment of several disorders including edema,
hypertension, diabetes insipidus and hypoparathyroidism9. Combination drug products of
metoprolol succinate and hydrochlorothiazide are hence widely marketed and successfully
Int. J. Chem. Sci.: 7(3), 2009
1735
used in the treatment of hypertension. Several HPLC methods have been cited in the
literature for the estimation of MET10–13, spectrophotometry14 and ion-pair extraction15, are
also reported. HCTZ is estimated by several HPLC methods16–21 individually and to our
knowledge, no analytical method for the simultaneous determination of these two drugs in
dosage forms has been published. Further, no stability – indicating method has been
reported in literature for simultaneous determination of MET and HCTZ in presence of
their degradants. Therefore, the present study targets the development and subsequent
validation of a stability – indicating HPLC method for the simultaneous determination of
MET and HCTZ in presence of their degradants. To establish the stability indicating nature
of the method, forced degradation of each API and drug product was performed under
stress conditions and stressed samples were analyzed by the proposed method. The
proposed LC method was able to separate both drugs from degradants generated during
forced degradation studies.
O
HO
H CH3
CH3
OCH3
NH
S
NH
OO
Cl
S
H2N
OO
Fig. 1(a): Metoprolol Fig. 1(b): Hydrochlorothiazide
EXPERIMENTAL
Chemicals and reagents
Working standards of MET (99.79%) and HCTZ (99.76%) were donated by M/S
the Cirex Pharmaceuticals (Hyderabad, India) and CTX Life Sciences Ltd. (Ahmedabad,
India), respectively. Betaloc-H® tablets containing MET -50 mg and HCTZ- 12.5 mg were
V. P. Godse et al.: Stability-Indicating…
1736
purchased from local medical shop. HPLC grade acetonitrile was purchased from Merck
Specialties Private Ltd. (Mumbai, India). Sodium hydroxide, hydrochloric acid and
hydrogen peroxide were of analytical reagent grade from Qualigens Fine Chemicals
(Mumbai, India). HPLC grade water was obtained from water purification unit (Elga Ltd.,
Bucks, England). and was used to prepare all solutions.
HPLC Instrumentation and conditions
The HPLC system consisted of a photo-diode array (PDA) detector (MD-2010
plus), Chrompass software, ver. 1.7.403.1, Pump (PU2080), LC Net II/ ADC (all from
Jasco Corporation, Tokyo, Japan). The separations were achieved on a Kya Tech
corporation® HiQ sil C18W (250 mm × 4.6 mm i. d., 10 µm) column and Kya Tech
corporation® HiQ sil C18 HS (250 mm × 4.6 mm i. d., 10 µm) both from Kya Tech, Japan.
The latter was used for intermediate precision studies. A precision water bath equipped
with MV controller (Julabo, Seelbach, Germany) was used to carry out selected reactions
in solution. Stability studies were carried out in humidity (KBF720, Binder, Germany) and
photo stability (KBWF240, WTC Binder, Germany) chambers both set at 40 ±1 ºC/75
±3 % RH. The photostability chamber was equipped with an illumination bank on inside
top consisting of a combination of two black light UV lamps (OSRAM L18W/73) and four
white fluorescent lamps (OSRAML 18W/20) in accordance with option two of
International Conference on Harmonization (ICH) guideline. The samples were placed at a
distance of 9 in. from the light bank. Both fluorescent and UV lamps were put on
simultaneously. Thermal stability study was carried out in dry air oven (Innovative DTC
96, New Delhi, India). Other equipments used were sonicator (Spectra lab UCB-30),
analytical balance (Shimadzu Corporation, Japan).
Preparation of stock and standard solutions
Stock solutions at concentrations of 1000 µg mL–1 each of MET and HCTZ were
prepared separately in acetonitrile and water (50 : 50). The stock solutions were protected
from light and stored at 4 ºC to avoid degradation. Aliquots of the stock solutions of MET
and HCTZ were diluted with mobile phase to yield standard solutions of 100, 200, 400,
600, 800, 1000 µg mL–1 for MET and concentrations of 50, 100, 200, 300, 400, 500 µg
mL–1 for HCTZ. Calibration curves reporting peak areas of MET or HCTZ versus drug
concentrations were established in the ranges described above.
Sample preparation for tablet assay
Twenty tablets each containing 100 mg of metoprolol and 12.5 mg of
hydrochlorothiazide were weighed. Powder equivalent to 100 mg of metoprolol was
Int. J. Chem. Sci.: 7(3), 2009
1737
weighed accurately and taken into 100 mL volumetric flask and volume was adjusted with
acetonitrile : water (50 : 50 %v/v) to give the concentration of 1000 µg mL–1 of metoprolol
and 125 µg mL–1 of HCTZ. It was then filtered through 0.2 µm membrane filter (Gelman
Science, India) and 20 µL of this solution was injected into HPLC system to obtain
chromatogram.
Forced degradation studies of API and tablets
Betaloc-H® tablets containing MET and HCTZ were subjected to various forced
degradation conditions to effect partial degradation of the drug preferably in 20-80%
range22. The force degradation studies were performed not only for the drug product, but
also for API of both MET and HCTZ, to determine, whether any observed, because of drug
properties or due to drug-excipient interactions.
Moreover, the studies provide information about the conditions in, which the drug
is unstable so that measures can be taken during formulation to avoid potential instabilities.
The stability samples were prepared by dissolving each API or drug product in acetonitrile
: water (50 : 50, v/v) and later diluted with distilled water, aqueous hydrochloric acid,
aqueous sodium hydroxide or aqueous hydrogen peroxide solution at a concentration of
100 (MET) and 200 (HCTZ) µg mL–1, separately.
Acid hydrolysis
Solutions for acid degradation studies were prepared in solvent system (acetonitrile
: water 50 : 50, v/v) and 1 N hydrochloric acid (50 : 50) and were refluxed at temperature
(80ºC). It was observed that acid hydrolysis was almost completed within 1 hr of the
sample preparation and therefore, the samples were analyzed after this period of time.
Base hydrolysis
Solutions for base degradation studies were prepared in solvent system and 0.1 N
sodium hydroxide (50 : 50 v/v) refluxed at temperature (80ºC) and the resultant solutions
were analyzed 3 hr after preparation.
Neutral hydrolysis
Solutions for neutral degradation studies were prepared in solvent system and
water (50 : 50 v/v, ) and the resultant solutions were refluxed at 80 ºC for 1 hr. The mixture
was then allowed to cool at room temperature, filtered using syringe filters and analyzed.
V. P. Godse et al.: Stability-Indicating…
1738
Oxidation studies
Solutions for use in oxidation studies were prepared in solvent system and 30%
hydrogen peroxide (50 : 50, v/v) at room temperature (25 ºC) and the resultant solutions
were filtered using syringe filters and analyzed after 24 hr.
Photostability studies
Solutions for photostability studies were prepared in solvent system and the
resultant solutions placed in photostability chamber in accelerated conditions in dark and
light for five days. The degraded samples were then filtered using syringe filters and
analyzed.
Temperature stress studies
Tablets and API in powder forms were exposed to dry heat (50 ºC) in an oven for
20 days. The API and tablet powders were then removed from oven and an aliquot of tablet
powder equivalent to weight of one tablet were prepared for analysis as previously
described.
RESULTS AND DISCUSSION
HPLC method development
A gradient method was found necessary to optimize the separation of major
degradation products formed under various stress conditions. The best resolution was
achieved with initial run of acetonitrile–10 mM potassium dihydrogen phosphate of pH 3.0
(17 : 83, v/v) for 3 min, then changed to 55 : 45 (v/v) for next 20 min and finally
equilibrated back to 17 : 83 (v/v) from 20 to 25 min. This optimized method employs Kya
Tech corporation® HiQ sil C18 W (250 mm × 4.6 mm i. d., 10 µm) for the separation of
MET and HCTZ without affecting the stability of these analytes. Using this optimized
method, it was possible to separate MET and HCTZ from their degradation products
without any interference and thus, the assay can be considered stability-indicating.
Validation of the method
The developed stability-indicating method was validated according to ICH23, 24
guidelines. The validation parameters addressed were linearity, quantitation, accuracy,
precision and specificity.
Int. J. Chem. Sci.: 7(3), 2009
1739
Linearity
Linearity was established over the concentration range of 100–1000 µg mL–1 and
50–500 µg mL–1 for MET (n = 6) and HCTZ (n = 6), respectively. Peak areas (y) of MET
or HCTZ were plotted versus their respective concentrations (x) and linear regression
analysis performed on the resultant calibration curves. Correlation coefficients (R2) were
found to be more than 0.999 for both the analytes. Typically, the mean (± SD) of the
regression equations were : y = 0.096x (± 0.04512) + 0.1266 (± 0.05064) for MET and y =
0.179x (± 0.14678) – 3.4452(± 1.791504) for HCTZ, respectively.
Accuracy / recovery
Accuracy of the method was determined by adding standard drugs in 50, 100 and
150% levels to both the drug solutions having concentration 100 µg mL–1 and then
recovery of the added drug, obtained from the difference between peak areas of unfortified
samples and fortified samples, was satisfactory at all tested concentrations (Table 1). The
recoveries for MET and HCTZ were found to be 100.06 and 100.08 %, respectively, which
were within acceptable ranges of 100 ± 2%
Limit of detection and quantitation
The limit of detection (LOD) and quantitation (LOQ) for both; MET and HCTZ
were determined according to ICH guideline Q2B 25. LOD was defined as 3.3 σ/S and
LOQ was 10 σ /S based on ‘standard deviation of the response and slope’ of the calibration
curve specially constructed in a low region of 0.05 to 1.0% of the target analyte
concentration 26. The standard deviation of y-intercepts of the regression lines was used as
σ (the standard deviation of the response) and S is the slope of the calibration curve. The
LOD and LOQ were estimated as 1.74 and 5.27 µg mL–1 for MET and 33.02 and 100.08
µg mL–1 for HCTZ, respectively.
Table 1: Results of accuracy experiment using proposed method
Intra-day precision Inter-day precision
Drug Range
(µg/mL) Found ± S. D. (µg/mL), R.
S. D. (%)
Found ± S. D.
(µg/mL), R. S. D.
(%)
100 100.2 ± 0.26, 2.5 99.6 ± 0.17, 1.68 Metoprolol succinate
200 200.3 ± 0.36, 1.78 199.2 ± 0.15, 0.76
V. P. Godse et al.: Stability-Indicating…
1740
Intra-day precision Inter-day precision
Drug Range
(µg/mL) Found ± S. D. (µg/mL), R.
S. D. (%)
Found ± S. D.
(µg/mL), R. S. D.
(%)
400 399.8 ± 0.12, 0.30 399.5 ± 0.15, 0.39
600 600.3 ± 0.2, 0.39 600.6 ± 0.36, 0.69
800 801 ± 0.26, 0.32 799.6 ± 0.55, 0.69
1000 999.8 ± 0.2, 0.20 999.5 ± 0.26, 0.27
50 49.8 ± 0.21, 2.68 49.7 ± 0.1, 1.4
100 100.1 ± 0.21, 1.41 100.3 ± 0.38, 2.56
200 200.2 ± 0.32, 0.99 201.0 ± 0.2, 0.64
300 299.2 ± 0.12, 0.23 299.6 ± 1.02, 2.00
400 400.1 ± 0.26, 0.38 400.3 ± 0.40, 0.60
Hydrochlorothiazide
500 499.8 ± 0.23, 0.26 499.5 ± 0.60, 0.68
Table 2: Results of precision experiment using proposed method
Drug
Added
concentration
(µg/mL)
Measured
concentration
(µg/mL)
%
recovery
Mean %
recovery
Metoprolol
succinate
50
100
200
50.1
101.4
199.2
100.2
100.4
99.6
100.06 ±
0.88
Hydrochloroth
i-azide
50
100
200
50.2
101.0
200.0
100.4
101.0
100.0
100.80 ±
0.64
Precision
Six injections, of three different concentrations, were given on the same day (n = 3)
and the percent relative standard deviations (% RSD) were calculated to determine intra-
Int. J. Chem. Sci.: 7(3), 2009
1741
day precision. These studies were also repeated on six consecutive days (n = 3) to
determine inter-day precision. The data obtained from precision experiments are given in
Table 2. The % RSD values for the intra-day precision study were ≤ 2 and for the inter-day
study ≤ 3, confirming that the method was sufficiently precise 27.
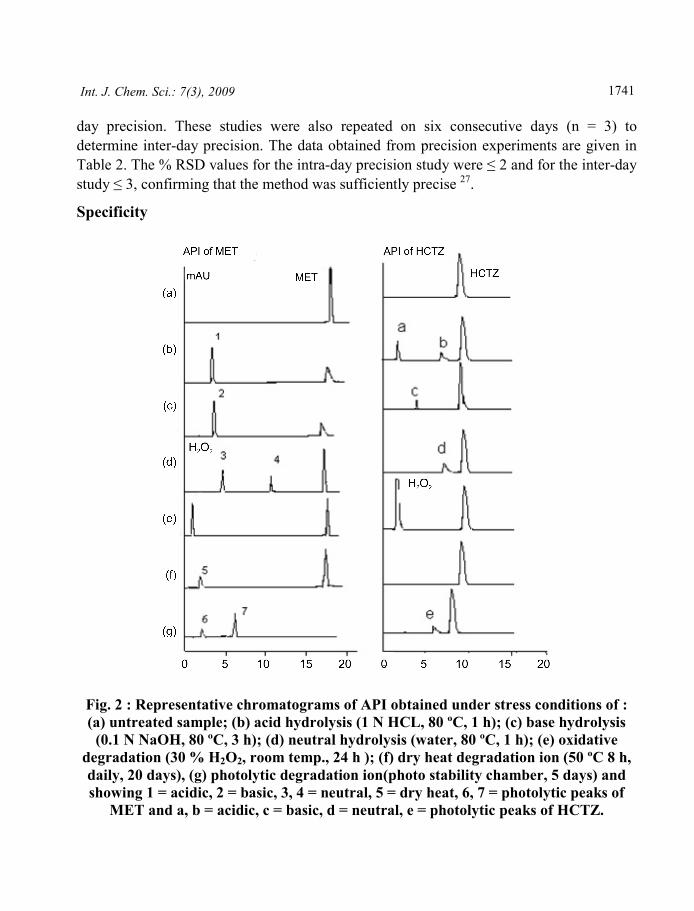
Specificity
Fig. 2 : Representative chromatograms of API obtained under stress conditions of :
(a) untreated sample; (b) acid hydrolysis (1 N HCL, 80 ºC, 1 h); (c) base hydrolysis
(0.1 N NaOH, 80 ºC, 3 h); (d) neutral hydrolysis (water, 80 ºC, 1 h); (e) oxidative
degradation (30 % H2O2, room temp., 24 h ); (f) dry heat degradation ion (50 ºC 8 h,
daily, 20 days), (g) photolytic degradation ion(photo stability chamber, 5 days) and
showing 1 = acidic, 2 = basic, 3, 4 = neutral, 5 = dry heat, 6, 7 = photolytic peaks of
MET and a, b = acidic, c = basic, d = neutral, e = photolytic peaks of HCTZ.
V. P. Godse et al.: Stability-Indicating…
1742
The results of forced degradation studies of each drug in the presence of their
degradation products indicated a high degree of specificity of this method for both; MET
and HCTZ. The degradation products) of each of the parent compound was found to be
similar for both the Betaloc-H® tablets and API powers assessed. Typical chromatograms
obtained following the assay of untreated and stressed samples of both API and tablets are
shown in Fig. 2.
Degradation studies
Forced degradation studies of both API were carried out under various stress
conditions and resultant chromatograms are depicted in Fig. 2. In general, degradation
studies were carried out at a concentration of 1 mg/mL of each drug in the solution. MET
undergoes 30% decomposition under acidic and basic stress conditions, forming a major
acid and base degradant peak at tR = 3.7 (Fig. 2 (b) and 2(c)). On other hand, this drug was
stable in oxidative condition (Fig. 2(e)) while it shows 20% decomposition in neutral
condition, showing major degradant peak at tR = 4.7 and 10.2 (Fig. 2(d)) Thermal
degradation shows 30% decomposition of drug, forming degradant peak at tR =3.7
(Fig. 2(f)) When MET was exposed to photolytic degradation, almost complete
degradation was observed (> 90%), with two major degradation products at tR = 3.7 and
6.2 (Fig. 2(g)) In contrast, HCTZ was relatively less stable at all hydrolytic conditions,
resulting 60, 40 and 35% degradation under acidic, basic and neutral stress conditions,
respectively (Fig. 2(b), 2(c) and 2(d)). In oxidation and thermal conditions, HCTZ was
observed stable (Fig. 2(e) and 2(f)), while showing 40% decomposition in photolytic
condition, with degradant peak at tR = 6.2 (Fig. 2(g))
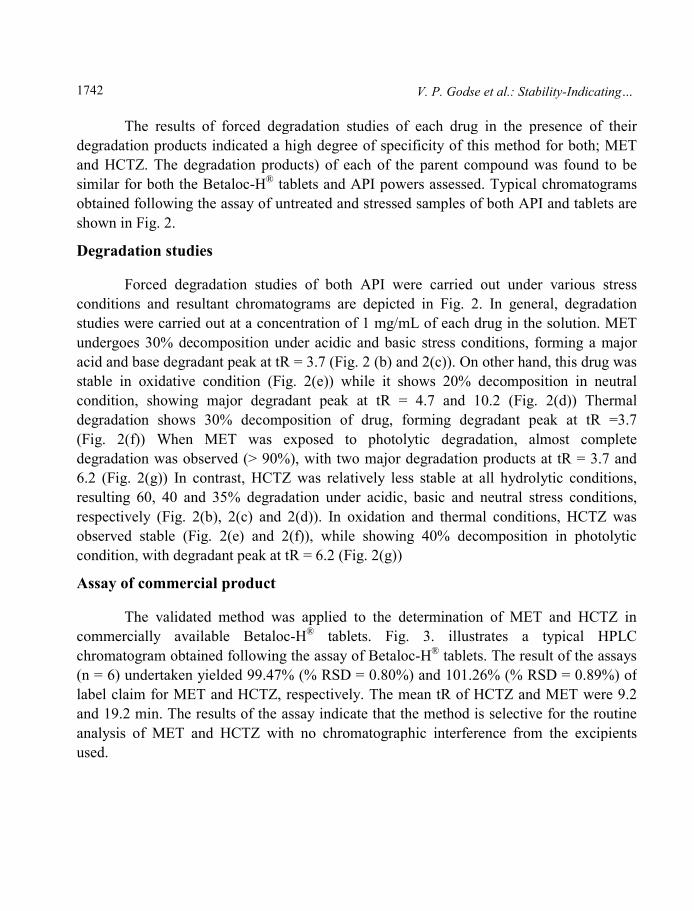
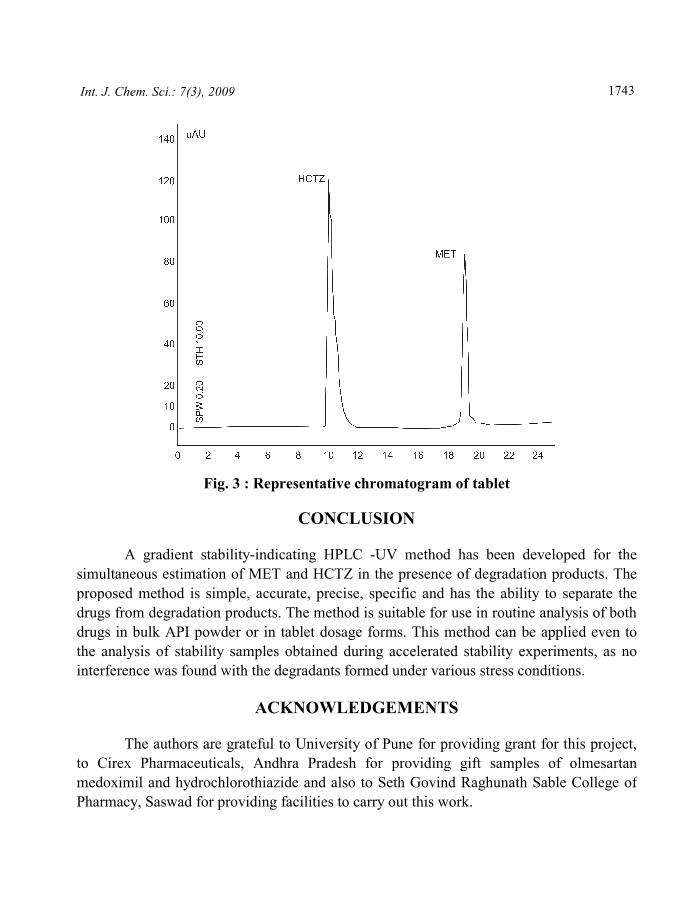
Assay of commercial product
The validated method was applied to the determination of MET and HCTZ in
commercially available Betaloc-H® tablets. Fig. 3. illustrates a typical HPLC
chromatogram obtained following the assay of Betaloc-H® tablets. The result of the assays
(n = 6) undertaken yielded 99.47% (% RSD = 0.80%) and 101.26% (% RSD = 0.89%) of
label claim for MET and HCTZ, respectively. The mean tR of HCTZ and MET were 9.2
and 19.2 min. The results of the assay indicate that the method is selective for the routine
analysis of MET and HCTZ with no chromatographic interference from the excipients
used.
Int. J. Chem. Sci.: 7(3), 2009
1743
Fig. 3 : Representative chromatogram of tablet
CONCLUSION
A gradient stability-indicating HPLC -UV method has been developed for the
simultaneous estimation of MET and HCTZ in the presence of degradation products. The
proposed method is simple, accurate, precise, specific and has the ability to separate the
drugs from degradation products. The method is suitable for use in routine analysis of both
drugs in bulk API powder or in tablet dosage forms. This method can be applied even to
the analysis of stability samples obtained during accelerated stability experiments, as no
interference was found with the degradants formed under various stress conditions.
ACKNOWLEDGEMENTS
The authors are grateful to University of Pune for providing grant for this project,
to Cirex Pharmaceuticals, Andhra Pradesh for providing gift samples of olmesartan
medoximil and hydrochlorothiazide and also to Seth Govind Raghunath Sable College of
Pharmacy, Saswad for providing facilities to carry out this work.
V. P. Godse et al.: Stability-Indicating…
1744
REFERENCES
1. D. V. Rao, I. E. Chakravarthy and S. R. Kumar, Chromatogr., 64, 261 (2006).
2. A. Mohammadi, I. Haririan, N. Rezanour, L. Ghiasi and R. B. Walker, J.
Chromatogr., 116, 153 (2006).
3. F. A. Chaibva and R. B. Walker, J. Pharm. Biomed. Anal., 43, 79 (2007).
4. International Conference on Harmonization (ICH), Q1AR2 : Stability Testing of New
Drug Substances, Products IFPMA, Geneva (2003).
5. K. R. Naidu, U. N. Kale and M. S. Shingare, J. Pharm. Biomed. Anal., 39, 147
(2005).
6. E. M. Donato, C. L. Dias, R. C. Rossi, R. S. Valente and A. M. Bergold,
Chromatogr., 63, 437 (2006).
7. Mohammadi, N. Rezanour, M. Ansari Dogaheh, F. Ghorbani Bidkorbeh, M. Hashem
and R. B. Walker, J. Chromatogr. B, 846, 215 (2007).
8. S. W. Baertschi and D. W. Reynolds, Taylor and Francis, 1 (2005).
9. Martindale, The Extra Pharmacopoeia, 31st (Ed) p. 908.
10. K. V. Rao, M. E. Konna, E. V. Nagoji and S. S. Rao, IJPS, 65, 204 (2003).
11. V. G. Dongre, S. B. Shah, P. P. Karmuse, M. Phadke and V. K. Jadhav, J. Pharm.
Biom. Anal., 46, 583 (2008).
12. Y. Horai, T. Ishizaki, M. Kusaka, G. Tsujimoto and K. Hashimoto, The Drug Monit.,
10, 428 (1988).
13. J. B. Lecaillon, C. Souppart and F. Abadie, Chromatogr., 16, 158 (1982).
14. N. Rahman, H. Rahman and S. N. Hejaz, Chem. Pharma. Bull., 53, 942 (2005).
15. L. Ersoy and S. Kocaman, Pharmazie, 324, 259 (2006).
16. G. N. Menon and L. B. White, J. Pharm. Sci., 70, 1083 (2006).
17. S. L. Daniels and A. J. Vanderwielen, J. Pharm. Sci., 70, 211 (1981).
18. N. Papadoyannis, V. F. Samanidou and K. A. Georga, J. Liq. Chromatogr. and
Related Techn., 21, 1671 (1998).
Int. J. Chem. Sci.: 7(3), 2009
1745
19. M. Kartal and N. Erk, J. Pharm. Biomed. Anal., 19, 477 (1999).
20. M. A. Obando, J. M. Estela and V. Cerdà, J. Anal. Bio. Chem., 391, 2349 (2008).
21. D. F. Tian, X. L. Tian and F. K. Wang, IJPS, 70, 372 (2008).
22. S. Singh and M. Bakshi, Pharm. Technol., 24, 1 (2000).
23. International Conference on Harmonization (ICH), Q2A : Text on Validation of
Analytical Procedures : Definitions, Terminology US FDA Federal Register (1995).
24. International Conference on Harmonization (ICH), Q2B : Validation of Analytical
Procedures : Methodology US FDA Federal Register (1997).
25. International Conference on Harmonization (ICH), Q2B : Validation of Analytical
Procedures : Methodology US FDA Federal Register (1997).
26. S. Ahuja and S. Scypinski, Handbook of Modern Pharmaceutical Analysis, Academic
Press, NY, (2001) p. 415.
27. G. Kleinschmidt Case Study: Method Validation in Pharmaceutical Analysis : A
Guide to Best Practice, Wiley, Weinheim, (2005) p. 195.
Accepted : 14.04.2009